Embed Size (px)
Citation preview
INFRARED SCAN OF CONCRETE ADMIXTURES AND
STRUCTURAL STEEL PAINTS
FINAL REPORT June 2011
Submitted by
Husam Najm Anthony Casale Associate Professor1 Graduate Research Assistant1
Nicole Scott Johanna Doukakis Tigist Shebeshi Undergrad Research Assistant1 Graduate Research Assistant1 Graduate Research Assistant2
NJDOT Research Project Manager Dr. Nazhat Aboobaker
1 Dept. of Civil & Environmental Engineering Center for Advanced Infrastructure & Transportation (CAIT) Rutgers, The State University of New Jersey Piscataway, NJ 08854-8014
In cooperation with
New Jersey
Department of Transportation
Bureau of Research
and
U.S. Department of Transportation
Federal Highway Administration
FHWA-NJ-2011-007
2 Dept. of Civil & Environmental Engineering University of Maryland College Park, MD 45014

Disclaimer Statement
“The contents of this report reflect the views of the author(s) who is (are) responsible for the facts and the
accuracy of the data presented herein. The contents do not necessarily reflect the official views or policies of the New Jersey Department of Transportation or the Federal Highway Administration. This report does not constitute
a standard, specification, or regulation."
The contents of this report reflect the views of the authors, who are responsible for the facts and the accuracy of the
information presented herein. This document is disseminated under the sponsorship of the Department of Transportation, University Transportation Centers Program, in the interest of
information exchange. The U.S. Government assumes no liability for the contents or use thereof.
1. Report No. 2. Government Accession No.
TECHNICAL REPORT STANDARD TITLE PAGE
3. Rec ip ient ’s Cata log No .
5 . Repor t Date
8. Performing Organization Report No.
6. Performing Organizat ion Code
4 . Tit le and Subt i t le
7 . Author(s)
9. Performing Organization Name and Address 10. Work Unit No .
11. Contract or Grant No.
13. Type of Report and Period Covered
14. Sponsoring Agency Code
12. Sponsoring Agency Name and Address
15. Supplementary Notes
16. Abstract
17. Key Words
19. Security Classif (of this report)
Form DOT F 1700.7 (8-69)
20. Security Classif. (of this page)
18. Distribution Statement
21. No of Pages 22. Price
FHWA-NJ-2011-007
June 2011
CAIT/Rutgers
Final Report 1/01/2010 - 06/30/2011
FHWA-NJ-2011-007
Center for Advanced Infrastructure and Transportation (CAIT) Rutgers, The State University of New Jersey Piscataway, NJ 08854-8014
New Jersey Department Federal Highway Administration of Transportation, P.O. Box 600 U.S. Department of Transportation Trenton, NJ 08625 Washington, D.C.
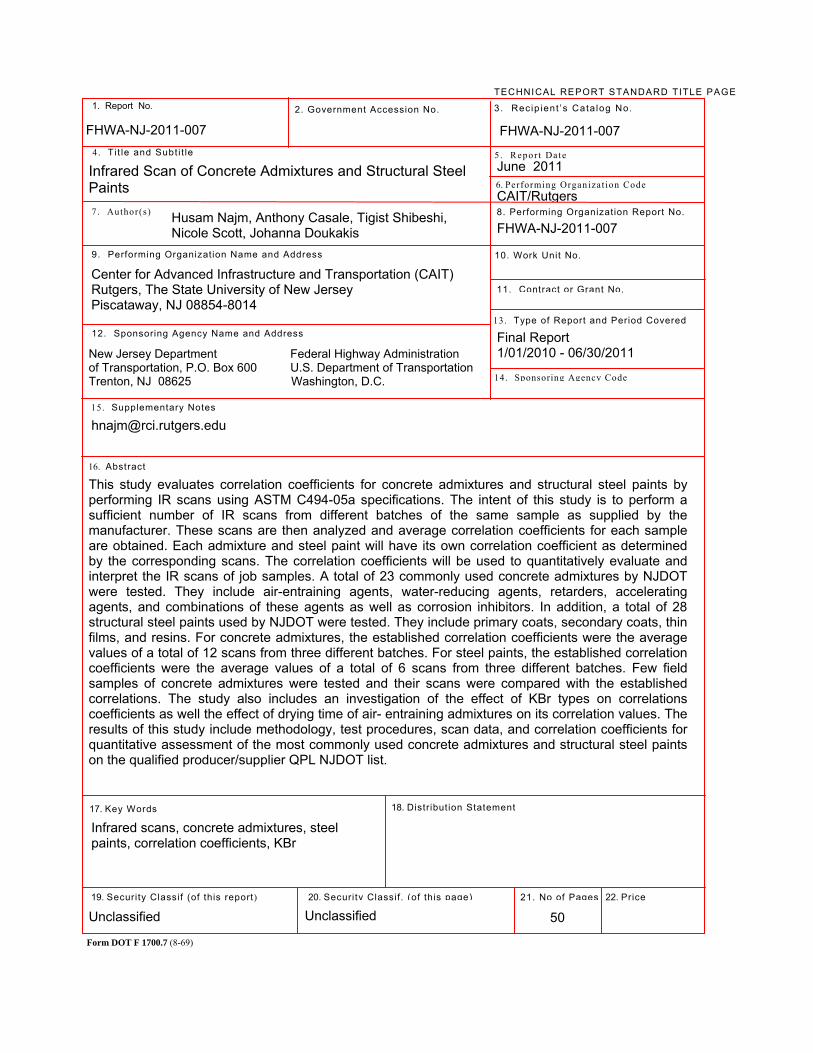
This study evaluates correlation coefficients for concrete admixtures and structural steel paints by performing IR scans using ASTM C494-05a specifications. The intent of this study is to perform a sufficient number of IR scans from different batches of the same sample as supplied by the manufacturer. These scans are then analyzed and average correlation coefficients for each sample are obtained. Each admixture and steel paint will have its own correlation coefficient as determined by the corresponding scans. The correlation coefficients will be used to quantitatively evaluate and interpret the IR scans of job samples. A total of 23 commonly used concrete admixtures by NJDOT were tested. They include air-entraining agents, water-reducing agents, retarders, accelerating agents, and combinations of these agents as well as corrosion inhibitors. In addition, a total of 28 structural steel paints used by NJDOT were tested. They include primary coats, secondary coats, thin films, and resins. For concrete admixtures, the established correlation coefficients were the average values of a total of 12 scans from three different batches. For steel paints, the established correlation coefficients were the average values of a total of 6 scans from three different batches. Few field samples of concrete admixtures were tested and their scans were compared with the established correlations. The study also includes an investigation of the effect of KBr types on correlations coefficients as well the effect of drying time of air- entraining admixtures on its correlation values. The results of this study include methodology, test procedures, scan data, and correlation coefficients for quantitative assessment of the most commonly used concrete admixtures and structural steel paints on the qualified producer/supplier QPL NJDOT list.
Infrared scans, concrete admixtures, steel paints, correlation coefficients, KBr
Unclassified Unclassified
50
FHWA-NJ-2011-007
Husam Najm, Anthony Casale, Tigist Shibeshi, Nicole Scott, Johanna Doukakis
Infrared Scan of Concrete Admixtures and Structural Steel Paints

Acknowledgements
The authors wish to acknowledge the support of the personnel from the New Jersey Department of Transportation (NJDOT). In particular the authors would like to thank Dr. Nazhat Aboobaker, Research Project Manager and Ms. Camille Crichton-Sumners, Manager of NJDOT Bureau of Research for their support and constructive comments. The authors also would like to thank Mr. Ron Espieg, Ms. Kimbrali LaShon Davis, Mr. David Simicevic, Mr. Alan Margerum and Mr. Jayant Patel of the NJDOT Bureau of Materials for their technical support and helpful suggestions, accommodations and comments throughout this research. The authors also would like to thank Dr. Giri Venkiteela who reviewed the final report and provided helpful comments. The financial support of this project was provided by the State of New Jersey Department of Transportation (NJDOT) and the Federal Highway Administration (FHWA). Dr. Nazhat Aboobaker was the NJDOT Research Project Manager. Dr. Husam Najm from Rutgers University was the project Principal Investigator.
ii
TABLE OF CONTENTS EXECUTIVE SUMMARY ............................................................................................... 1 INTRODUCTION ........................................................................................................... 1 BACKGROUND ............................................................................................................. 2
Objectives .................................................................................................................. 4 LITERATURE REVIEW ................................................................................................. 5 RESEARCH APPROACH .............................................................................................. 6 LIST OF CONCRETE ADMIXTURES AND STRUCTURAL STEEL PAINTS ................ 7 INFRARED SCAN METHODOLOGY OF CONCRETE ADMIXTURES ....................... 10
Experimental Program of Concrete Admixtures ....................................................... 12 Test Results and Discussions of IR Scans of Concrete Admixtures ........................ 15
INFRARED SCAN METHODOLOGY FOR STEEL PAINTS ........................................ 24 Test Results and Discussions of IR Scans of Steel Paints ...................................... 24
EVALUATION OF JOB SAMPLES OF CONCRETE ADMIXTURES VERSUS ACCEPTABLE CORRELATION COEEFICIENTS ..................................................... 27 EFFECT OF DRYING TIME ON MOISTURE CONTENT OF ADMIXTURES ............. 29 EFFECT OF DRYING TIME ON CORRELATION COEFFICIENTS ........................... 30
Results and Discussions of the Effects of Drying Time ........................................... 34 EFFECT OF KBR ON CORRELATION COEFFICIENTS ........................................... 36 CONCLUSIONS ........................................................................................................... 41 RECOMMENDATIONS ................................................................................................ 42 APPENDIX A- Methodology for Determining Correlation Coefficients of Concrete Admixtures and Structural Steel Paints ........................................................................ 42 REFERENCES ............................................................................................................ 43
iii
LIST OF FIGURES Page
Figure 1. The Perkin-Elmer Infrared Spectrometer ...................................................... 11 Figure 2. Typical absorbance versus wave number spectrum for MB-AE90 ................ 11 Figure 3. Pallets from various admixtures ready for IR scan ........................................ 12 Figure 4. IR scans for six samples of DARACEM 55 from three batches .................... 16 Figure 5. IR scans for twelve samples of DARACEM 55 from three batches ............... 17 Figure 6. IR scans for steel paint OEU Interzinc 315B Part A from three batches ....... 25 Figure 7. Effect of 8 hour drying time on moisture content compared to 17 hours ....... 30 Figure 8. Effect of 10 hour drying time on moisture content compared to 17 hours ..... 31 Figure 9. AIR MIX IR scans for KBr’s from different suppliers. .................................... 37 Figure 10. AXIM IR scans for KBr’s from different suppliers ........................................ 38
iv
LIST OF TABLES Page
Table 1. NJDOT QPL list of concrete admixtures .......................................................... 8 Table 2. Classification of NJDOT concrete admixtures based on type .......................... 9 Table 3. NJDOT list of structural steel paints ............................................................... 10 Table 4. Average correlation coefficients from all batches (total 6 scans) ................... 18 Table 5. Average correlation values and values with one std deviation (6 scans) ....... 19 Table 6. Average correlation coefficients from all batches (total 12 scans) ................. 21 Table 7. Average correlation values and values with one std deviation (12 scans) ..... 22 Table 8. Comparison of correlation values from twelve scans and from six scans ...... 23 Table 9. Average correlation values and values with one std deviation for paints ....... 26 Table 10. Evaluation of job samples using average correlation values of 12 scans .... 27 Table 11. Evaluation of job samples using avg correlation w/one std (12 scans) ........ 28 Table 12. Evaluation of job samples using average correlation values of 6 scans ...... 28 Table 13. Evaluation of job samples using avg correlation w/one std (6 cans) ........... 29 Table 14. List of air entraining admixtures evaluated for the effect of drying time ....... 32 Table 15. Percentage of solids for three samples for the 17 hour study ...................... 32 Table 16. IR scan specimen data for three admixtures for the 17 hour study .............. 33 Table 17. Correlation Coefficients for the 17 hour drying time ..................................... 34 Table 18. Correlation Coefficients for the 24 hour drying time ..................................... 34 Table 19. Average correlation coefficients from the 17 hours and 24 hours study ....... 35 Table 20. KBr products used in KBr investigation ........................................................ 36 Table 21. Concrete admixtures used in the KBr investigation ...................................... 36 Table 22. Average correlation coefficient when using KBr from one supplier only ....... 39 Table 23. Average correlation coefficient when using KBr from different suppliers ..... 40
v
1
EXECUTIVE SUMMARY This study evaluates correlation coefficients for concrete admixtures and structural steel paints by performing IR scan using ASTM specifications C494-05a. The intent of this study is to perform a sufficient number of scans from different batches of the same sample as supplied by the manufacturer to establish baseline correlation values of individual admixtures and steel paints. These scans are then analyzed using statistical methods and correlation coefficients for each concrete admixture and steel paint were established. These correlation values will be used as quantitative measures to interpret, accept or reject job samples. A total of 23 commonly used concrete admixtures by NJDOT were tested. They include air-entraining agents, water-reducing agents, retarders, accelerating agents, and combinations of these agents as well as corrosion inhibitors. In addition a total of 28 structural steel paint components used by NJDOT were tested. They include primary coats, secondary coats, thin films, and others. A few job (field) samples were tested and their scans were compared with the established correlation values. The study also includes an investigation of the effect of KBr types on correlation coefficients as well the effect of drying time of air-entraining admixtures on its correlation values. The results of this study include methodology, test procedures, scan data, and correlation coefficients needed for quantitative assessment of the most commonly used concrete admixtures and structural steel paints on the qualified producer/supplier QPL NJDOT list.
INTRODUCTION NJDOT Standard Specifications for Road and Bridge Construction Sections 903.02.01, 903.02.02 and 912.01.01 require the uniform quality assurance testing and approval of concrete admixtures and structural steel paints. Testing is performed to insure that contract materials are not adversely modified or altered. Infrared Spectrophotometry Scan (IR Scan) is one of the test methods used to verify that the material sampled and tested from a contract roadway construction or job site is identical to that material originally submitted, approved, and listed on the qualified producer/supplier list. There is a need to provide accurate and meaningful interpretations of the differences in IR spectra between various batches of concrete admixtures and structural steel paints delivered to the department and those originally submitted, approved, and listed on the qualified producer/supplier list. At this time, it is not well known what causes these differences, or what is the potential effect on the properties of concrete and steel when using admixtures and paints with non-conforming spectra. Potential reasons for the non-conforming spectra are numerous, e.g., change in formulation, presence of contaminants, improper storage, improper labeling, etc. It is important to ascertain the nature of the problem, understand and interpret the various spectra, and establish acceptability criteria.
2
The UV-VIS (ultraviolet-visible) spectroscopy and the Raman spectroscopy are two spectroscopic methods used to identify the nature and the concentration of substances causing the nonconformity of IR Scans of certain batches of materials. They are complementary in nature, and when combined with the incoming IR Scan analysis, it should be able to yield complete information regarding the qualitative and quantitative composition of NJDOT approved structural paints and concrete admixtures. The purpose of this research is to establish quantitative acceptability criteria and tolerances for job samples tested with respect to manufacturer acceptance samples on the qualified producer/supplier list (QPL) in order to minimize the non-conformity and performance deviation of those materials used in construction projects and on job sites in New Jersey. Developing a reference spectral library for the selected materials on the NJDOT QPL list will also be beneficial to identify the components in a spectrum of unknown materials using high resolution spectrometers. Such a library would include the spectra for selected materials specified by the NJDOT. The spectral library approach is useful for identifying material types, determining the ranges of spectra and associated optical properties and concentrations. It will be the start of a database of spectra, enabling generic algorithm development and testing. A well documented spectral library has permanent value and benefits. However, establishing such a library was not part of the scope of this research.
BACKGROUND
Infrared (IR) spectroscopy is one of the most common spectroscopic techniques used by organic and inorganic chemists. Simply, it is the absorption measurement of different IR frequencies by a sample positioned in the path of an IR beam. The main goal of IR spectroscopic analysis is to determine the chemical functional groups in the sample. Different functional groups absorb characteristic frequencies of IR radiation. Using various sampling accessories, IR spectrometers can accept a wide range of sample types such as gases, liquids, and solids. Thus, IR spectroscopy is an important and popular tool for structural elucidation and compound identification (Coates, 2000). Infrared radiation spans a section of the electromagnetic spectrum having wave numbers from roughly 13,000 to 10 cm–1, or wavelengths from 0.78 to 1000 μm. It is bound by the red end of the visible region at high frequencies and the microwave region at low frequencies. IR absorption positions are generally presented as either wave numbers (ν) or wavelengths (λ). Wave number defines the number of waves per unit length. Thus, wave numbers are directly proportional to frequency, as well as the energy of the IR absorption. The wave number unit (cm–1, reciprocal centimeter) is more commonly used in modern IR instruments that are linear in the cm–1 scale. In contrast, wavelengths are
3
inversely proportional to frequencies and their associated energy. At present, the recommended unit of wavelength is μm (micrometers), but μ (micron) is used in some older literature. Wave numbers and wavelengths can be interconverted using the following equation:
ν (cm–1) = 104 / λ (μm) IR absorption information is generally presented in the form of a spectrum with wavelength or wave number as the x-axis and absorption intensity or percent transmittance as the y-axis. In simple terms, IR spectra are obtained by detecting changes in transmittance (or absorption) intensity as a function of frequency. Most commercial instruments separate and measure IR radiation using dispersive spectrometers or Fourier transform spectrometers. The preferred format for presenting spectral data for qualitative analysis is in the percentage transmittance format, which has a logarithmic relationship (−log10) with respect to the linear concentration format (absorbance). This format, which is the natural output of most instruments (after background ratio), provides the best dynamic range for both weak and intense bands. In this case, the peak maximum is actually represented as a minimum, and is the point of lowest transmittance for a particular band. It is possible to obtain an IR spectrum from samples in many different forms, such as liquid, solid, and gas. However, many materials are opaque to IR radiation and must be dissolved or diluted in a transparent matrix in order to obtain spectra. Alternatively, it is possible to obtain reflectance or emission spectra directly from opaque samples. Some popular sampling techniques and accessories are discussed here. IR spectroscopy was generally considered to be able to provide only qualitative and semi-quantitative analyses of common samples, especially when the data were acquired using the conventional dispersive instruments. However, the development of reliable FTIR instrumentation and strong computerized data-processing capabilities has greatly improved the performance of quantitative IR work. Thus, modern infrared spectroscopy has gained acceptance as a reliable tool for quantitative analysis. The basis for quantitative analysis of absorption spectrometry is the Bouguer–Beer–Lambert Method. Qualitative interpretation of spectra requires a minimum of a college organic chemistry course while quantitative determinations require a minimum of an introductory analytical chemistry course. The final appearance of the infrared spectrum is very important in the interpretation process. Where possible, it always helps to be able to study the sample as it occurs naturally, without any form of physical modification. This
4
eliminates the possibility of any interactions, or even chemical modifications. A common method for handling solid samples is known as the compressed alkali metal halide pellet method (KBr pellet or disk method). This method of sample preparation is prone to difficulties, and it often requires a skilled operator to produce good quality spectra on a routine basis. A poor sampling technique with this method can lead to spectral artifacts and distortions, all of which can cause difficulties in the interpretation. Furthermore, some compounds may react with KBr, causing either a liberation of the halogen (oxidants) or halogen exchange (halide salts). The act of applying pressure can also change the appearance of the spectrum, especially when a material exists in more than one polymorphic form. The pressure may cause one polymorph to dominate, thereby changing the entire absorption band distribution of the spectrum. This is especially a problem with certain pharmaceutical products. For concrete admixtures, ASTM C494-05a uses the KBr pellet method for handling liquid and solid samples. The IR spectroscopy is typically used for the following cases: 1) the sample (or spectrum) is a ‘‘total unknown’’ and an identification is required – examples include forensic samples, environmental waste samples, or new discovery samples, where a new material has been synthesized or discovered, 2) the sample (or spectrum) is an unknown and it needs to be characterized or classified – examples include commercial applications where new additives or components are included in a material to provide a specific property; in such cases this could be considered the basis of competitive product analysis, 3) the sample generally is known but the existence of a specific chemical class needs to be determined –examples include contaminant analysis, analysis for toxicology or environmental reasons, material additives, etc., and 4) the sample is a complete known and the interpretation is required to confirm the material composition and/or quality – examples include product quality control and the confirmation of a structure or functionality of a newly synthesized material. The work in this project focused on scenario 4, where the samples are known and quantitative assessment and quality control are required. OBJECTIVES The objectives of this study are the following:
1. Provide meaningful interpretations of the IR Scans of concrete admixtures and structural steel paints and establish correlations for IR scans of manufacturer samples.
2. Establish acceptability criteria and determine acceptable tolerances for job samples compared to manufacturer acceptance samples on the NJDOT qualified producer/supplier (QPL) list.
5
LITERATURE REVIEW Phase I of the research focused on literature review of existing work in IR scan technology and other methods of spectroscopy. The research team surveyed similar work done by other state DOTs using the IR scan technology. The data collected showed that many states use the qualitative approach of IR scans as acceptance criteria. The literature search revealed that no state has implemented IR scan quantitative criteria for their quality control of concrete admixtures and steel paints. The following are some qualitative practices of IR scan of admixtures from three states: Louisiana DOT IR Scan Analysis Procedure The Louisiana DOT outlines test methods for infrared spectrophotometric analysis. The method is used for a variety of materials such as paint, epoxy resin systems, anti-strip additives, concrete admixtures, thermo-plastics, solvents and other materials that occur as a solid, low volatile liquid, or highly volatile liquid. DOTD TR 610M-94 (1994) outlines sample preparation procedures for solid samples and liquid samples. The interpretation of results is qualitative based on a favorable comparison of the infrared spectrum to that of the original sample. According to LADOT memo DOTD TR 610M-94, a sample is considered rejected if its IR spectrum exhibits significant nonconformity to the IR spectrum of the original sample, i.e. if there are different absorption valleys in the two spectra or if an absorption valley in one spectrum is significantly displaced from that in the other one. Caltrans IR Scan Procedure The California department of transportation (Caltrans) published tests methods for concrete admixtures (2007). In their CA Test 416, Caltrans outlines the testing procedure for IR scan of concrete admixtures. This procedure is somewhat different from ASTM 494. In their test, liquid samples should not be evaporated directly in the vacuum oven. Instead, they require 1 to 3 mL of the liquid sample be placed in an aluminum dish in a conventional oven at 50 to 60°C for an overnight period. This should remove most of the moisture in the sample. After that they place the aluminum dish containing the partially dried sample in a vacuum oven at 60ºC and gradually increase the vacuum to 30 inches of mercury. Some materials may froth or foam excessively at this point and it may be necessary to allow a small amount of air to bleed into the oven to control the frothing and to remove any last traces of moisture or volatile material. After the sample has stabilized, close the air-bleed valve on the oven and continue drying for 3 hr of drying in a vacuum oven. Then the sample is removed from the oven and carefully transferred to an agate mortar. There the sample is ground to pass a Standard No. 80 sieve, and then returned to the vacuum oven for approximately 1 hour. For solid sample preparation, Caltrans requires grinding the solid to pass a Standard No. 80 sieve
6
and drying overnight in an aluminum dish in the vacuum oven at 60ºC and 30 inches of mercury. To prepare the pellet, 2 mg of the sample is ground with 250 mg of KBr until it forms a uniform mixture to break up any lumps of KBr and to provide a preliminary mix to the specimen. The mix then is blended in an electronic mixer in accordance with the manufacturer’s recommendations. The powdered specimen is placed into the pellet die to prepare a suitable disk under vacuum and care should be taken to avoid damaging the polished die faces. The final step is to place the disk in an infrared spectrophotometer and collect the transmittance spectrum. According to the Caltrans criteria (2007), test results are used for comparison purposes only and each spectrum is compared with samples run previously. Two materials are considered similar if all of the absorption peaks match as to wavelength and relative magnitude. Illinois DOT IR Scan Procedure The Illinois Department of Transportation (IDOT) published a list of approved concrete admixtures and specifications that outlines the submittal process for the approval of new concrete admixtures (IDOT, 2011). Among these specifications are those for the submittal of ‘An infrared spectrophotometer trace (IR) of current production material, no more than five years old (the IR scan should be labeled with the date the scan was performed, the product name, and the manufacturer’s name)’. However, the IDOT specifications do not provide information on quantitative methods for acceptance of IR scans of concrete admixtures. The New Jersey Department of Transportation currently uses a quality standard correlation of 0.975 or higher for all admixtures. Although this may seem like a fairly high and relatively safe correlation to abide by, every admixture possesses their own unique chemical and physical properties, and may not have the same acceptable correlation values. The NJDOT is seeking a more accurate quality testing standard system. The purpose of this research is to interpret IR scans of concrete admixtures and structural steel paints and then establish a unique correlation for each admixture and paint based on a large sample of scans. The ultimate goal is to establish acceptability criteria and determine acceptable tolerances for job samples compared to manufacturer samples. RESEARCH APPROACH The New Jersey Department of Transportation requires all contract materials from any roadway construction or job site to be tested and approved according to their specifications. Testing is essential to insure that concrete admixtures and structural steel paints are not adversely modified or altered. The most efficient and timely method of testing such materials is by using an Infrared Spectrophotometry Scan (IR Scan). This method was adopted by NJDOT as well as many other state DOT’s for quality control of these admixtures and paints. This type of test provides verification that the material sampled and tested from a
7
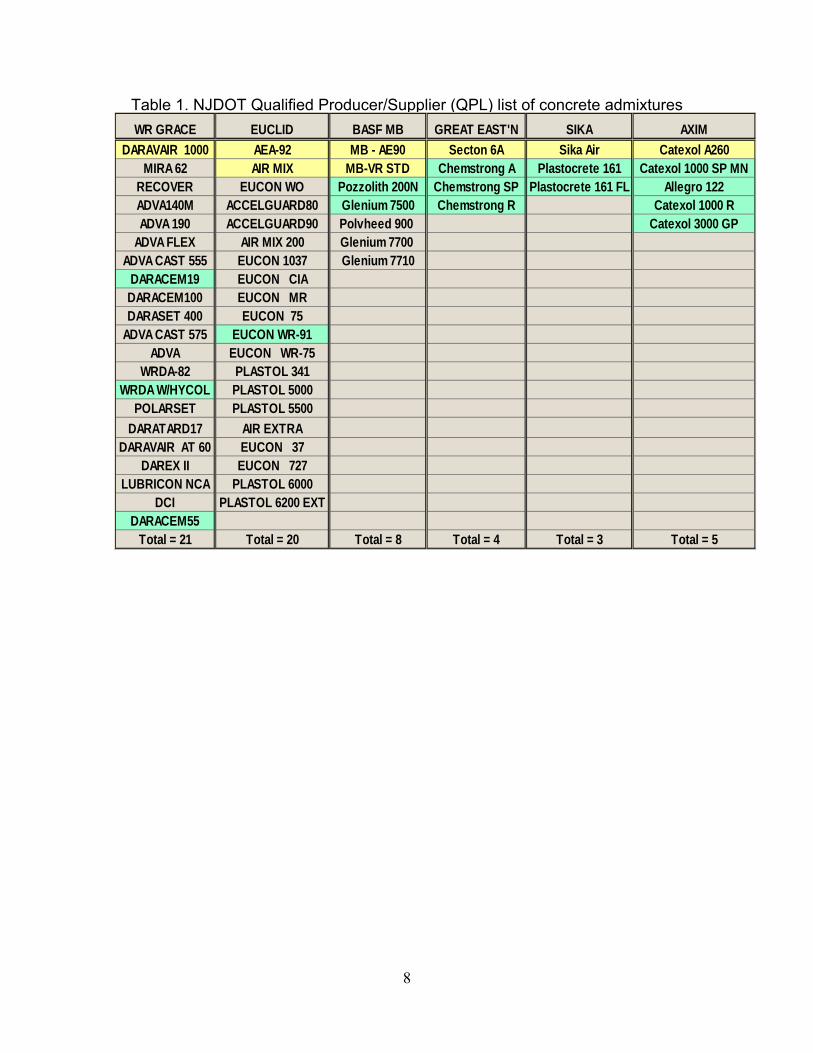
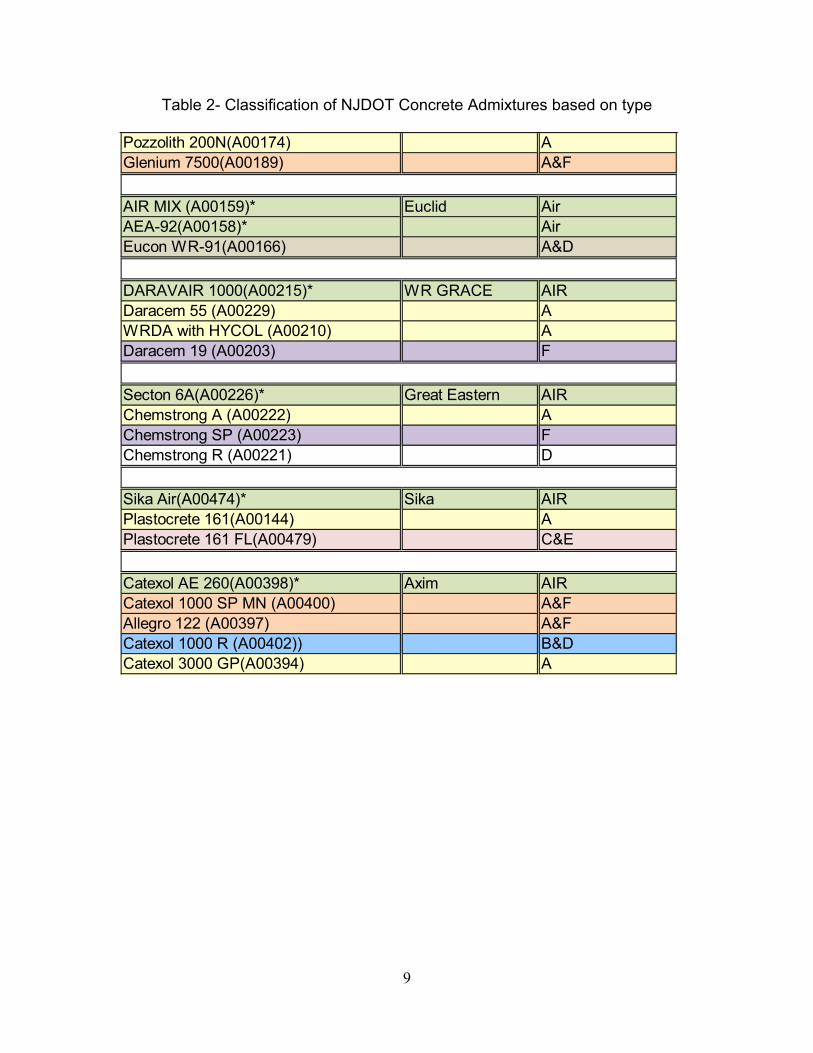
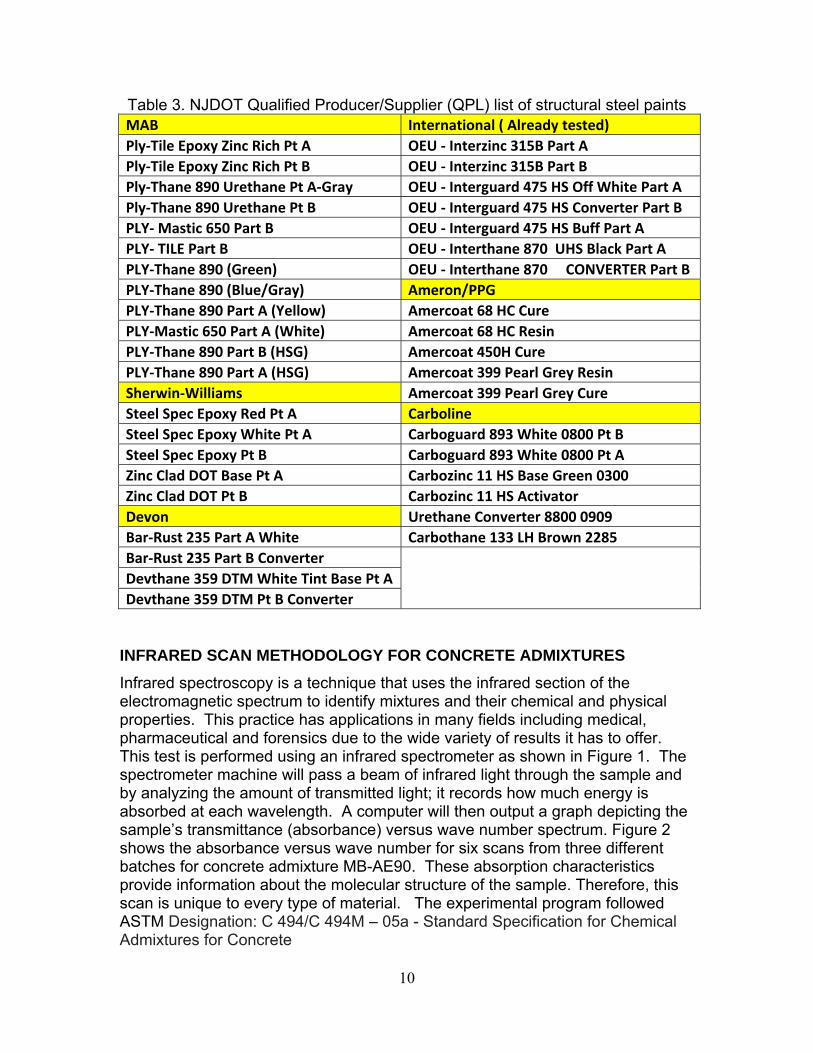
site is identical to the same material originally submitted, approved, and listed on the qualified producer/supplier list. Differences sometimes occur in IR spectra between various batches of concrete admixtures and structural steel paints delivered to the department from the site and the original approved materials. It is not certain what causes these differences or the effects on concrete and steel when using modified or altered admixtures and paints with non-conforming spectra. There are several potential reasons for the non-conforming spectra such as, change in formulation, presence of contaminants, improper storage, improper labeling, etc. It is therefore especially important to be certain all materials used in a project conform to the standard, avoiding potential performance deviation of a material on the job site. LIST OF CONCRETE ADMIXTURES AND STRUCTURAL STEEL PAINTS The first task of research activities was to identify Admixtures and Paints on the NJDOT Qualifier Producer/Supplier (QPL) List. The research team worked closely with NJDOT to accurately identify the admixtures and structural steel paints on the NJDOT qualified producer/supplier (QPL) list. Table 1 shows all approved concrete admixtures on the NJDOT QPL list. The table shows a total of 61 approved concrete admixtures. Those shaded admixtures in yellow and green are the 23 most commonly used concrete admixtures on the NJDOT qualified producer/supplier (QPL) list and were chosen to be evaluated in this study. The admixtures in Table 1 include seven types of admixtures as follows: Type A Water-reducing admixtures, Type B Retarding admixtures, Type C Accelerating admixtures, Type D Water-reducing and retarding admixtures, Type E Water-reducing and accelerating admixtures, Type F Water-reducing, high range admixtures, and Type G Water-reducing, high range, and retarding admixtures. Air Air-Entraining Admixture VMA Viscosity modifying agent CI Corrosion inhibitor Table 2 shows the 23 most commonly used concrete admixtures and their classifications according to type, use and their supplier. Table 3 shows the most commonly used structural steel paints on the NJDOT qualified producer/supplier (QPL) list.
8
Table 1. NJDOT Qualified Producer/Supplier (QPL) list of concrete admixtures
WR GRACE EUCLID BASF MB GREAT EAST'N SIKA AXIMDARAVAIR 1000 AEA-92 MB - AE90 Secton 6A Sika Air Catexol A260
MIRA 62 AIR MIX MB-VR STD Chemstrong A Plastocrete 161 Catexol 1000 SP MNRECOVER EUCON WO Pozzolith 200N Chemstrong SP Plastocrete 161 FL Allegro 122ADVA140M ACCELGUARD80 Glenium 7500 Chemstrong R Catexol 1000 RADVA 190 ACCELGUARD90 Polvheed 900 Catexol 3000 GP
ADVA FLEX AIR MIX 200 Glenium 7700 ADVA CAST 555 EUCON 1037 Glenium 7710
DARACEM19 EUCON CIADARACEM100 EUCON MRDARASET 400 EUCON 75
ADVA CAST 575 EUCON WR-91ADVA EUCON WR-75
WRDA-82 PLASTOL 341WRDA W/HYCOL PLASTOL 5000
POLARSET PLASTOL 5500DARATARD17 AIR EXTRA
DARAVAIR AT 60 EUCON 37DAREX II EUCON 727
LUBRICON NCA PLASTOL 6000DCI PLASTOL 6200 EXT
DARACEM55Total = 21 Total = 20 Total = 8 Total = 4 Total = 3 Total = 5
9
Table 2- Classification of NJDOT Concrete Admixtures based on type Pozzolith 200N(A00174) AGlenium 7500(A00189) A&F
AIR MIX (A00159)* Euclid AirAEA-92(A00158)* AirEucon WR-91(A00166) A&D
DARAVAIR 1000(A00215)* WR GRACE AIRDaracem 55 (A00229) AWRDA with HYCOL (A00210) ADaracem 19 (A00203) F
Secton 6A(A00226)* Great Eastern AIRChemstrong A (A00222) AChemstrong SP (A00223) FChemstrong R (A00221) D
Sika Air(A00474)* Sika AIRPlastocrete 161(A00144) APlastocrete 161 FL(A00479) C&E
Catexol AE 260(A00398)* Axim AIRCatexol 1000 SP MN (A00400) A&FAllegro 122 (A00397) A&FCatexol 1000 R (A00402)) B&DCatexol 3000 GP(A00394) A
10
Table 3. NJDOT Qualified Producer/Supplier (QPL) list of structural steel paints MAB International ( Already tested) Ply‐Tile Epoxy Zinc Rich Pt A OEU ‐ Interzinc 315B Part A Ply‐Tile Epoxy Zinc Rich Pt B OEU ‐ Interzinc 315B Part B Ply‐Thane 890 Urethane Pt A‐Gray OEU ‐ Interguard 475 HS Off White Part A Ply‐Thane 890 Urethane Pt B OEU ‐ Interguard 475 HS Converter Part B PLY‐ Mastic 650 Part B OEU ‐ Interguard 475 HS Buff Part A PLY‐ TILE Part B OEU ‐ Interthane 870 UHS Black Part A PLY‐Thane 890 (Green) OEU ‐ Interthane 870 CONVERTER Part B PLY‐Thane 890 (Blue/Gray) Ameron/PPG PLY‐Thane 890 Part A (Yellow) Amercoat 68 HC Cure PLY‐Mastic 650 Part A (White) Amercoat 68 HC Resin PLY‐Thane 890 Part B (HSG) Amercoat 450H Cure PLY‐Thane 890 Part A (HSG) Amercoat 399 Pearl Grey Resin Sherwin‐Williams Amercoat 399 Pearl Grey Cure Steel Spec Epoxy Red Pt A Carboline Steel Spec Epoxy White Pt A Carboguard 893 White 0800 Pt B Steel Spec Epoxy Pt B Carboguard 893 White 0800 Pt A Zinc Clad DOT Base Pt A Carbozinc 11 HS Base Green 0300 Zinc Clad DOT Pt B Carbozinc 11 HS Activator Devon Urethane Converter 8800 0909 Bar‐Rust 235 Part A White Carbothane 133 LH Brown 2285 Bar‐Rust 235 Part B Converter Devthane 359 DTM White Tint Base Pt ADevthane 359 DTM Pt B Converter
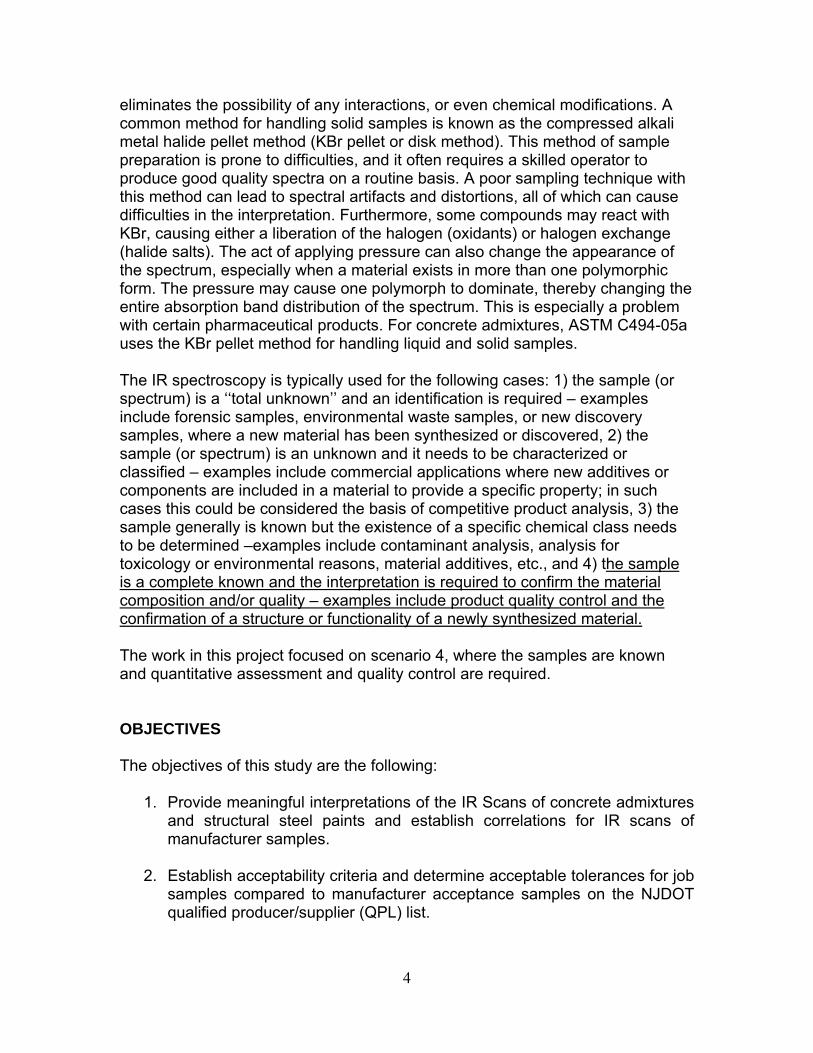
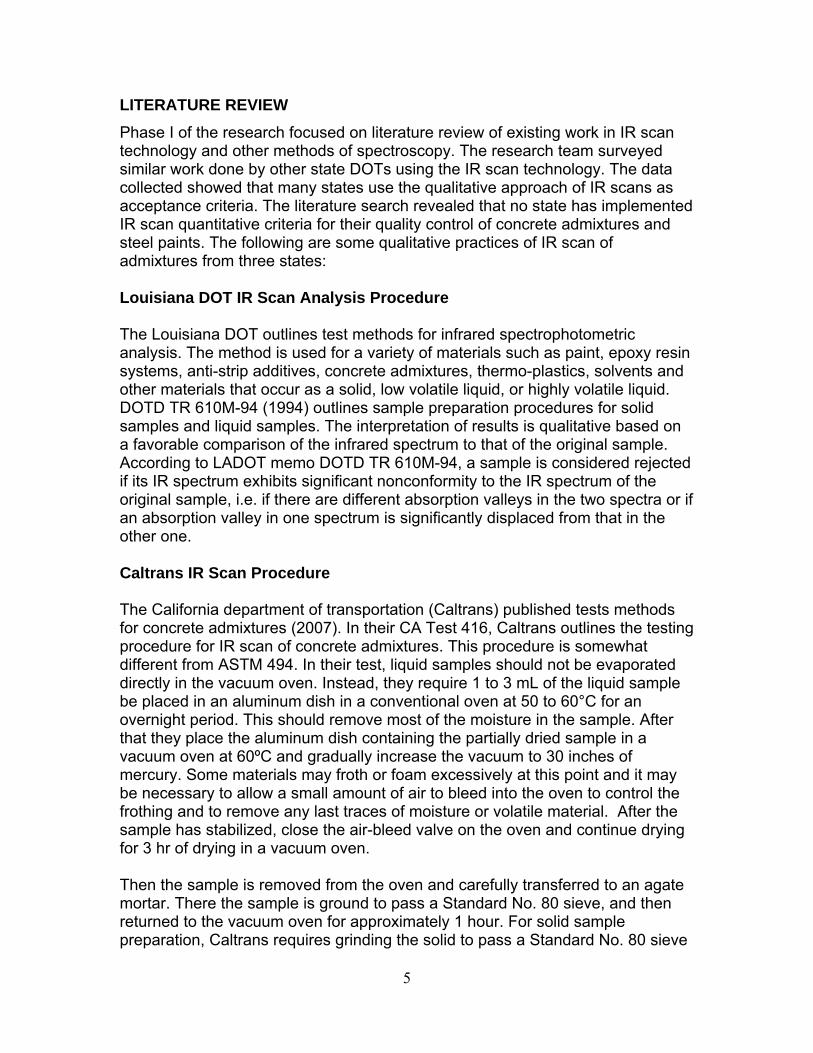
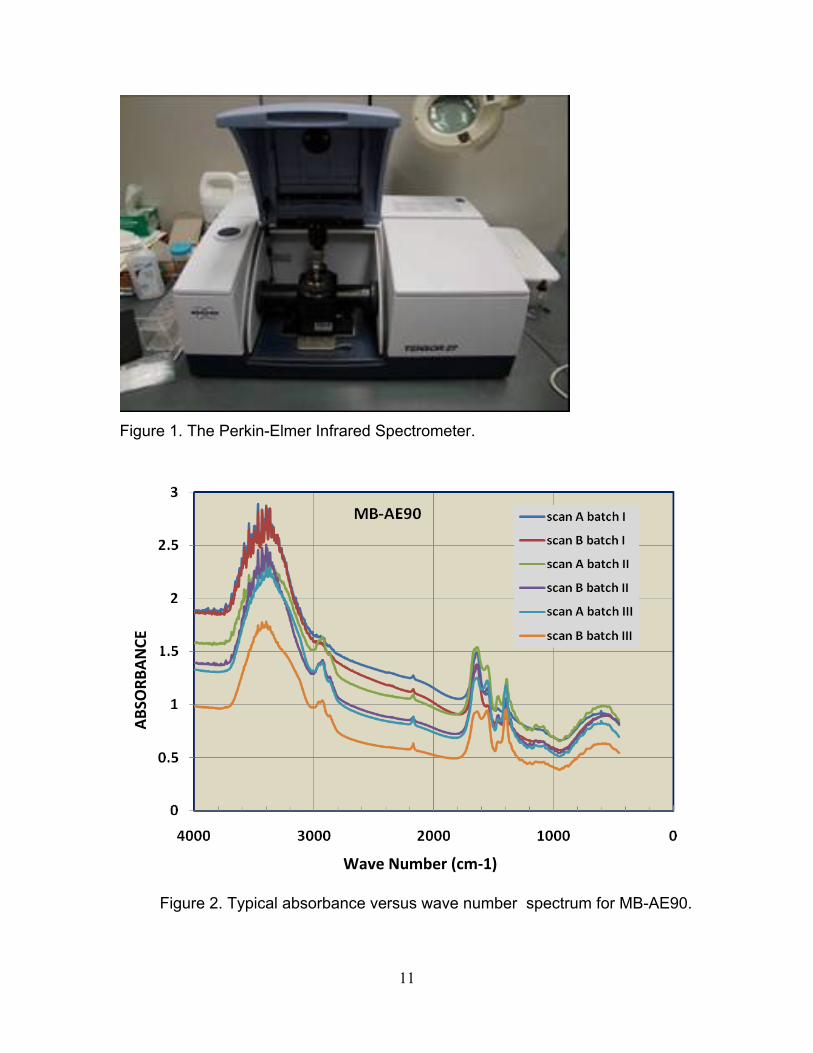
INFRARED SCAN METHODOLOGY FOR CONCRETE ADMIXTURES Infrared spectroscopy is a technique that uses the infrared section of the electromagnetic spectrum to identify mixtures and their chemical and physical properties. This practice has applications in many fields including medical, pharmaceutical and forensics due to the wide variety of results it has to offer. This test is performed using an infrared spectrometer as shown in Figure 1. The spectrometer machine will pass a beam of infrared light through the sample and by analyzing the amount of transmitted light; it records how much energy is absorbed at each wavelength. A computer will then output a graph depicting the sample’s transmittance (absorbance) versus wave number spectrum. Figure 2 shows the absorbance versus wave number for six scans from three different batches for concrete admixture MB-AE90. These absorption characteristics provide information about the molecular structure of the sample. Therefore, this scan is unique to every type of material. The experimental program followed ASTM Designation: C 494/C 494M – 05a - Standard Specification for Chemical Admixtures for Concrete
11
Figure 1. The Perkin-Elmer Infrared Spectrometer.
Figure 2. Typical absorbance versus wave number spectrum for MB-AE90.
Wave Number (cm‐1)
ABS
ORB
ANCE
12
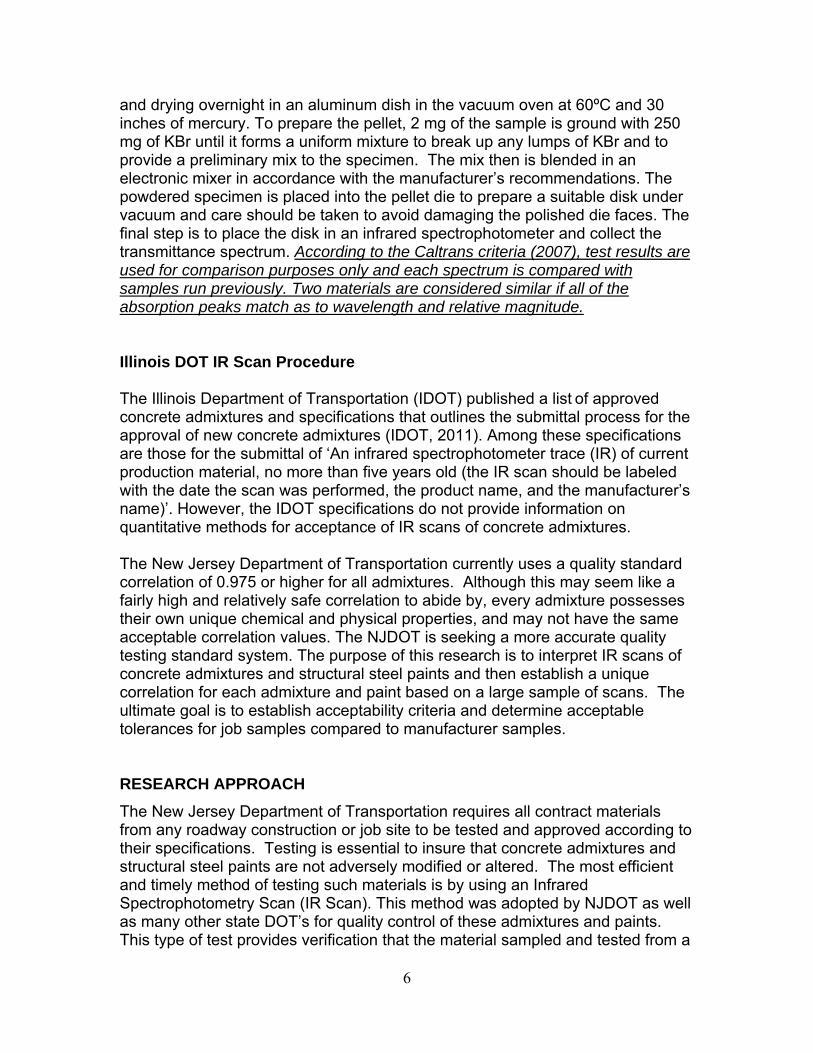
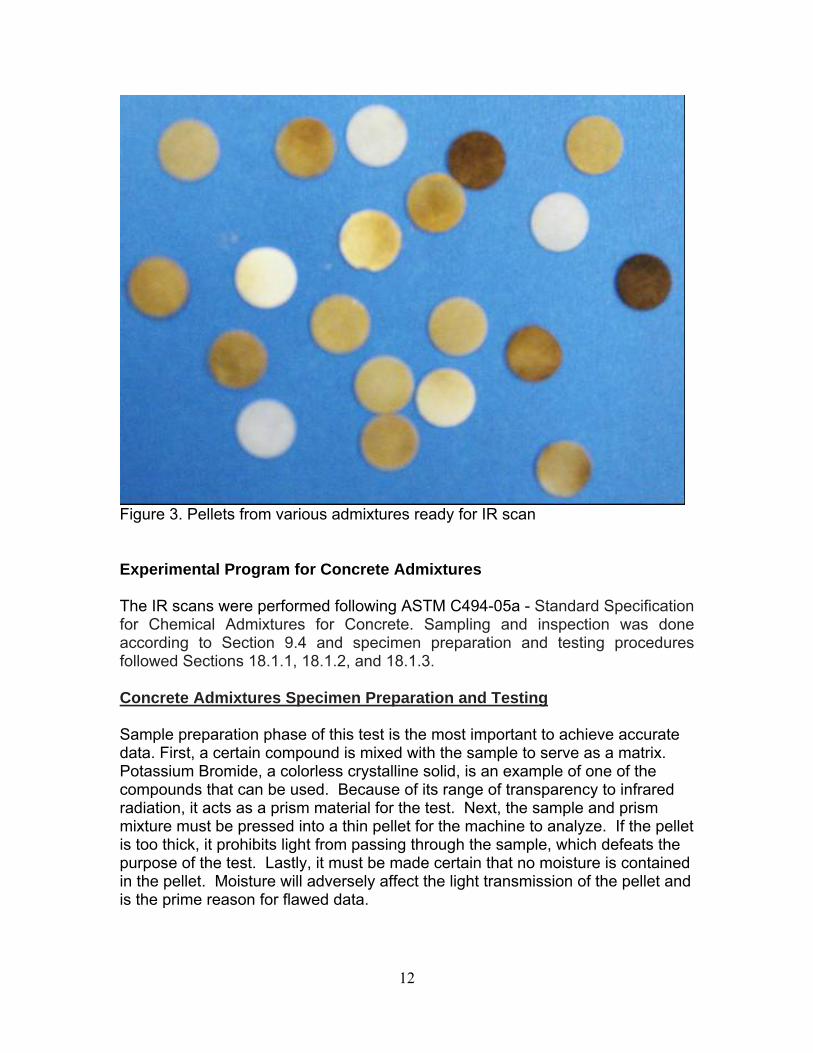
Figure 3. Pellets from various admixtures ready for IR scan Experimental Program for Concrete Admixtures The IR scans were performed following ASTM C494-05a - Standard Specification for Chemical Admixtures for Concrete. Sampling and inspection was done according to Section 9.4 and specimen preparation and testing procedures followed Sections 18.1.1, 18.1.2, and 18.1.3. Concrete Admixtures Specimen Preparation and Testing Sample preparation phase of this test is the most important to achieve accurate data. First, a certain compound is mixed with the sample to serve as a matrix. Potassium Bromide, a colorless crystalline solid, is an example of one of the compounds that can be used. Because of its range of transparency to infrared radiation, it acts as a prism material for the test. Next, the sample and prism mixture must be pressed into a thin pellet for the machine to analyze. If the pellet is too thick, it prohibits light from passing through the sample, which defeats the purpose of the test. Lastly, it must be made certain that no moisture is contained in the pellet. Moisture will adversely affect the light transmission of the pellet and is the prime reason for flawed data.
13
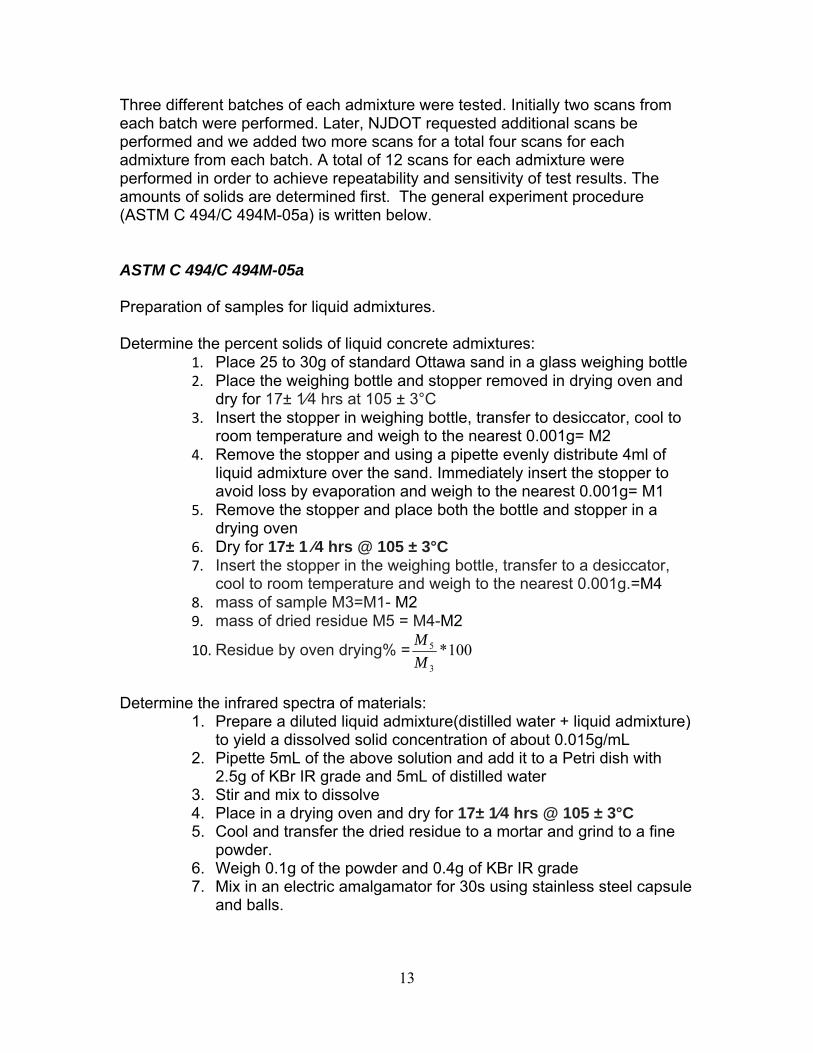
Three different batches of each admixture were tested. Initially two scans from each batch were performed. Later, NJDOT requested additional scans be performed and we added two more scans for a total four scans for each admixture from each batch. A total of 12 scans for each admixture were performed in order to achieve repeatability and sensitivity of test results. The amounts of solids are determined first. The general experiment procedure (ASTM C 494/C 494M-05a) is written below. ASTM C 494/C 494M-05a Preparation of samples for liquid admixtures. Determine the percent solids of liquid concrete admixtures:
1. Place 25 to 30g of standard Ottawa sand in a glass weighing bottle 2. Place the weighing bottle and stopper removed in drying oven and
dry for 17± 1⁄4 hrs at 105 ± 3°C 3. Insert the stopper in weighing bottle, transfer to desiccator, cool to
room temperature and weigh to the nearest 0.001g= M2 4. Remove the stopper and using a pipette evenly distribute 4ml of
liquid admixture over the sand. Immediately insert the stopper to avoid loss by evaporation and weigh to the nearest 0.001g= M1
5. Remove the stopper and place both the bottle and stopper in a drying oven
6. Dry for 17± 1 ⁄4 hrs @ 105 ± 3°C 7. Insert the stopper in the weighing bottle, transfer to a desiccator,
cool to room temperature and weigh to the nearest 0.001g.=M4 8. mass of sample M3=M1- M2 9. mass of dried residue M5 = M4-M2
10. Residue by oven drying% = 100*3
5
MM
Determine the infrared spectra of materials:
1. Prepare a diluted liquid admixture(distilled water + liquid admixture) to yield a dissolved solid concentration of about 0.015g/mL
2. Pipette 5mL of the above solution and add it to a Petri dish with 2.5g of KBr IR grade and 5mL of distilled water
3. Stir and mix to dissolve 4. Place in a drying oven and dry for 17± 1⁄4 hrs @ 105 ± 3°C 5. Cool and transfer the dried residue to a mortar and grind to a fine
powder. 6. Weigh 0.1g of the powder and 0.4g of KBr IR grade 7. Mix in an electric amalgamator for 30s using stainless steel capsule
and balls.
14
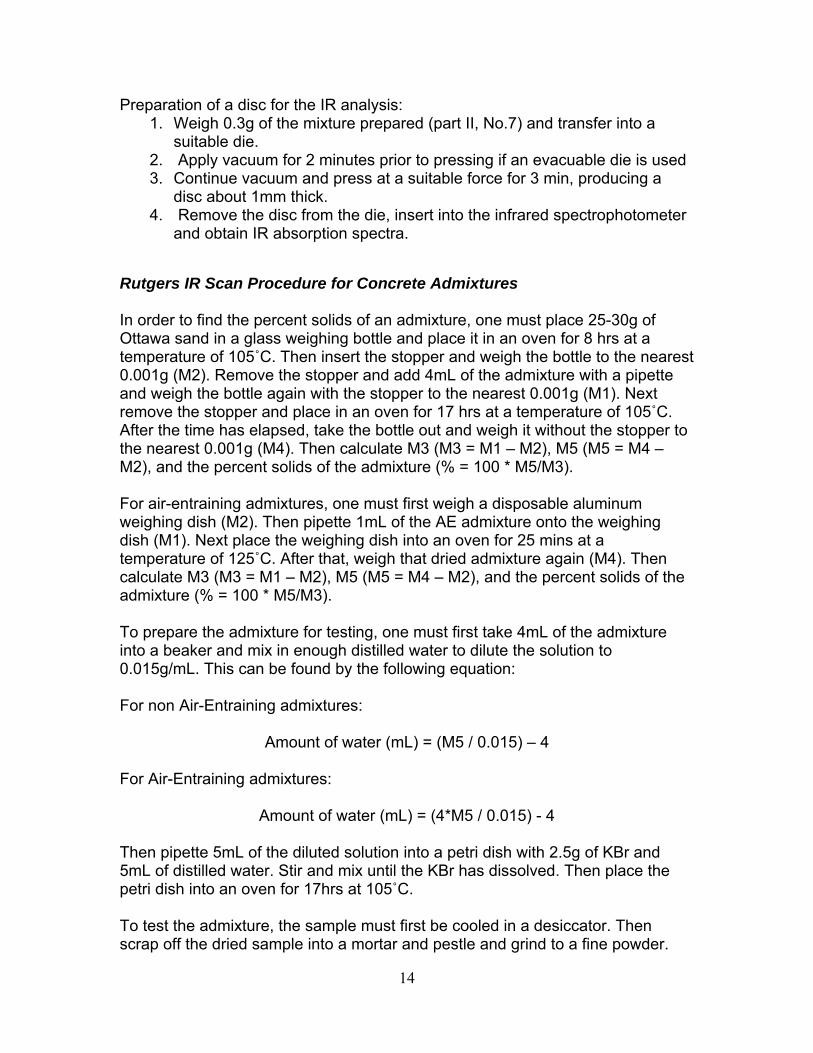
Preparation of a disc for the IR analysis: 1. Weigh 0.3g of the mixture prepared (part II, No.7) and transfer into a
suitable die. 2. Apply vacuum for 2 minutes prior to pressing if an evacuable die is used 3. Continue vacuum and press at a suitable force for 3 min, producing a
disc about 1mm thick. 4. Remove the disc from the die, insert into the infrared spectrophotometer
and obtain IR absorption spectra.
Rutgers IR Scan Procedure for Concrete Admixtures In order to find the percent solids of an admixture, one must place 25-30g of Ottawa sand in a glass weighing bottle and place it in an oven for 8 hrs at a temperature of 105˚C. Then insert the stopper and weigh the bottle to the nearest 0.001g (M2). Remove the stopper and add 4mL of the admixture with a pipette and weigh the bottle again with the stopper to the nearest 0.001g (M1). Next remove the stopper and place in an oven for 17 hrs at a temperature of 105˚C. After the time has elapsed, take the bottle out and weigh it without the stopper to the nearest 0.001g (M4). Then calculate M3 (M3 = M1 – M2), M5 (M5 = M4 – M2), and the percent solids of the admixture (% = 100 * M5/M3). For air-entraining admixtures, one must first weigh a disposable aluminum weighing dish (M2). Then pipette 1mL of the AE admixture onto the weighing dish (M1). Next place the weighing dish into an oven for 25 mins at a temperature of 125˚C. After that, weigh that dried admixture again (M4). Then calculate M3 (M3 = M1 – M2), M5 (M5 = M4 – M2), and the percent solids of the admixture (% = 100 * M5/M3). To prepare the admixture for testing, one must first take 4mL of the admixture into a beaker and mix in enough distilled water to dilute the solution to 0.015g/mL. This can be found by the following equation: For non Air-Entraining admixtures:
Amount of water (mL) = (M5 / 0.015) – 4
For Air-Entraining admixtures:
Amount of water (mL) = (4*M5 / 0.015) - 4 Then pipette 5mL of the diluted solution into a petri dish with 2.5g of KBr and 5mL of distilled water. Stir and mix until the KBr has dissolved. Then place the petri dish into an oven for 17hrs at 105˚C. To test the admixture, the sample must first be cooled in a desiccator. Then scrap off the dried sample into a mortar and pestle and grind to a fine powder.
15
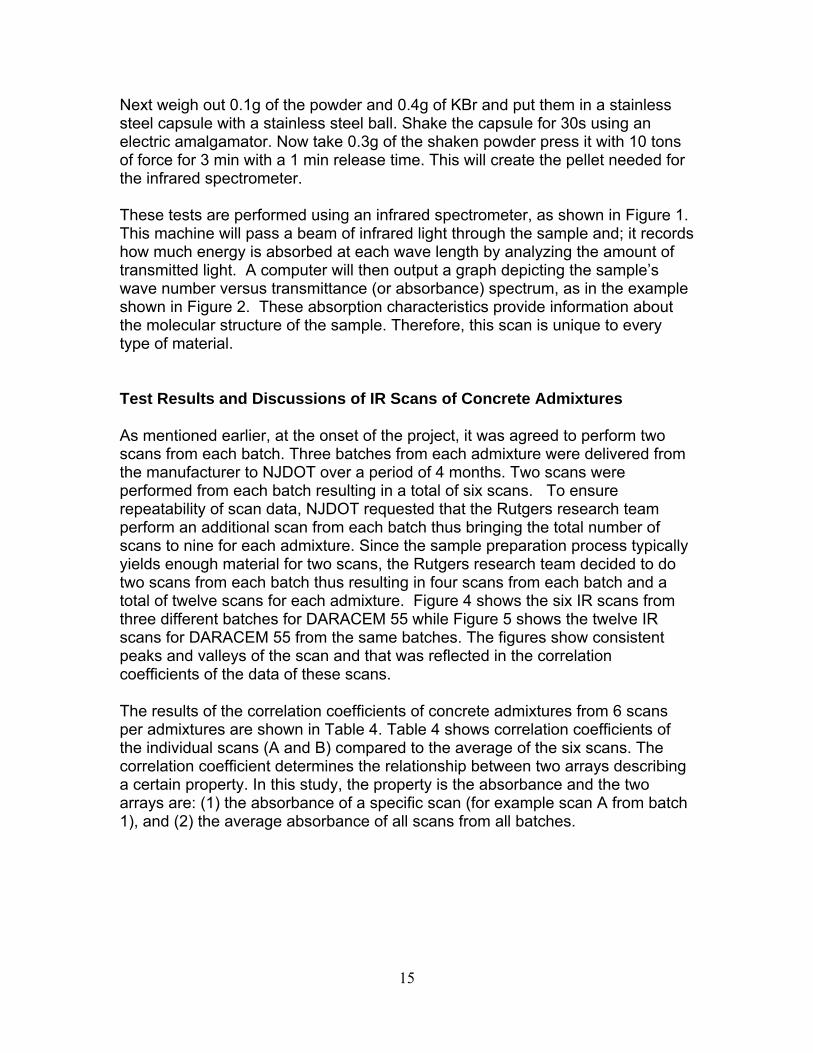
Next weigh out 0.1g of the powder and 0.4g of KBr and put them in a stainless steel capsule with a stainless steel ball. Shake the capsule for 30s using an electric amalgamator. Now take 0.3g of the shaken powder press it with 10 tons of force for 3 min with a 1 min release time. This will create the pellet needed for the infrared spectrometer. These tests are performed using an infrared spectrometer, as shown in Figure 1. This machine will pass a beam of infrared light through the sample and; it records how much energy is absorbed at each wave length by analyzing the amount of transmitted light. A computer will then output a graph depicting the sample’s wave number versus transmittance (or absorbance) spectrum, as in the example shown in Figure 2. These absorption characteristics provide information about the molecular structure of the sample. Therefore, this scan is unique to every type of material. Test Results and Discussions of IR Scans of Concrete Admixtures
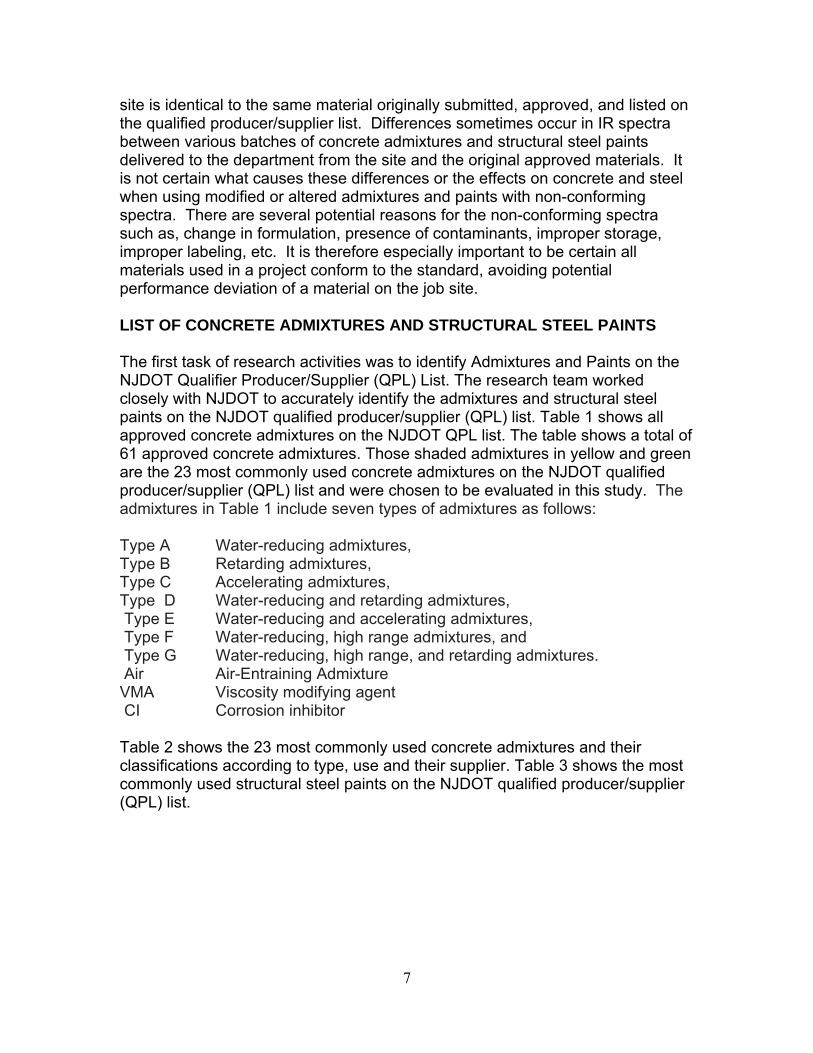
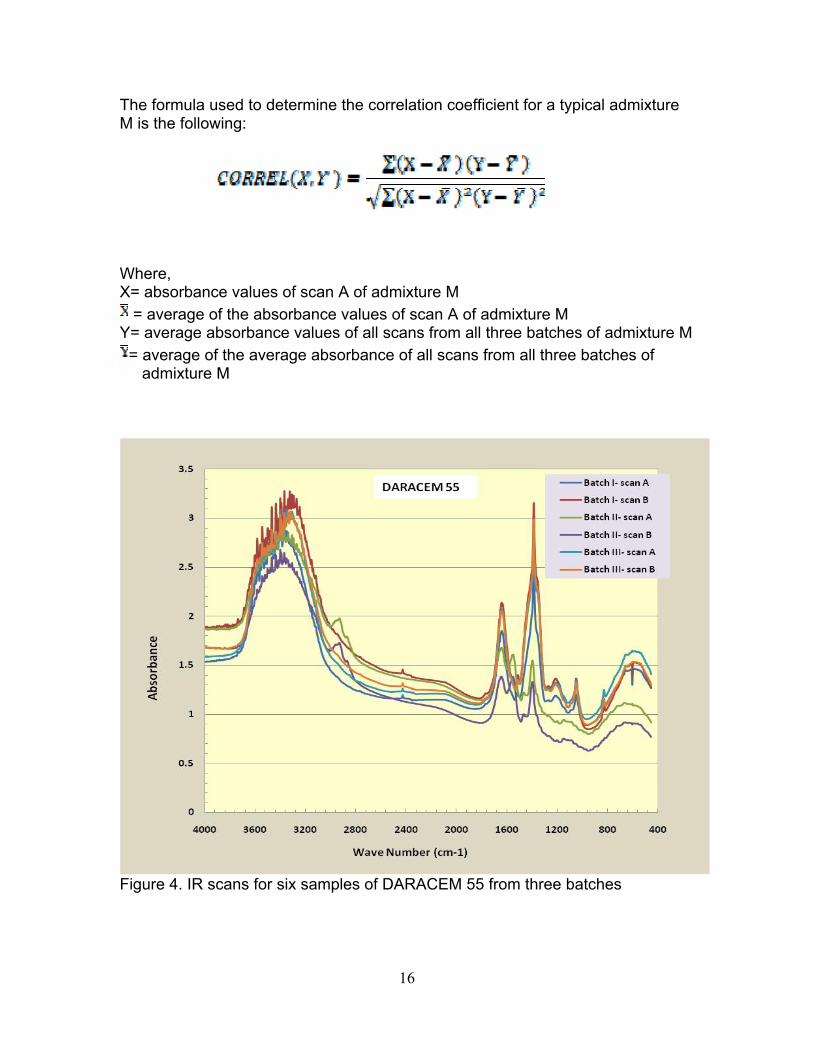
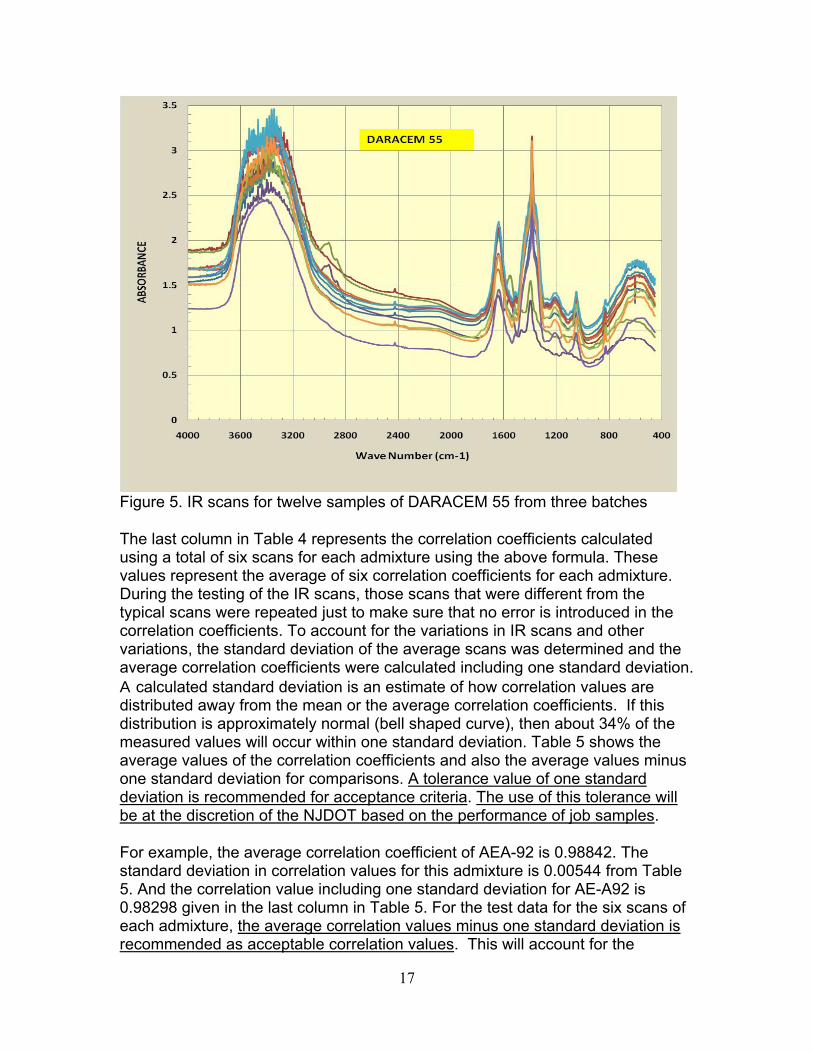
As mentioned earlier, at the onset of the project, it was agreed to perform two scans from each batch. Three batches from each admixture were delivered from the manufacturer to NJDOT over a period of 4 months. Two scans were performed from each batch resulting in a total of six scans. To ensure repeatability of scan data, NJDOT requested that the Rutgers research team perform an additional scan from each batch thus bringing the total number of scans to nine for each admixture. Since the sample preparation process typically yields enough material for two scans, the Rutgers research team decided to do two scans from each batch thus resulting in four scans from each batch and a total of twelve scans for each admixture. Figure 4 shows the six IR scans from three different batches for DARACEM 55 while Figure 5 shows the twelve IR scans for DARACEM 55 from the same batches. The figures show consistent peaks and valleys of the scan and that was reflected in the correlation coefficients of the data of these scans.
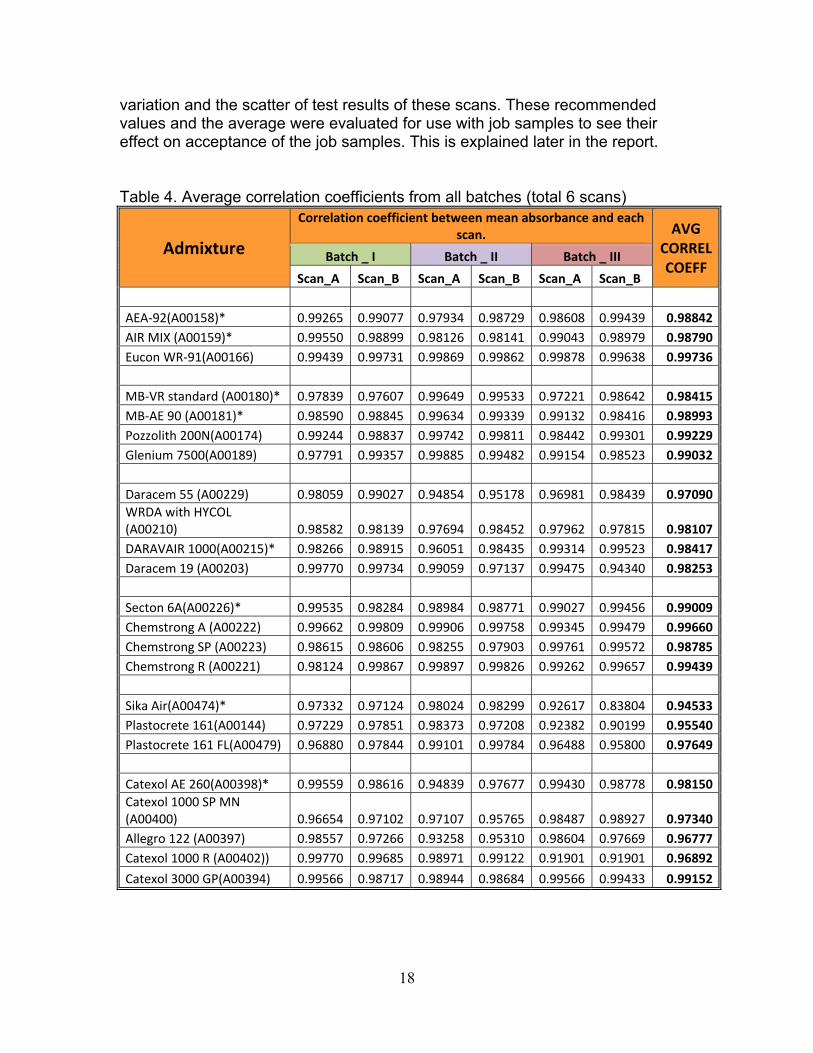
The results of the correlation coefficients of concrete admixtures from 6 scans per admixtures are shown in Table 4. Table 4 shows correlation coefficients of the individual scans (A and B) compared to the average of the six scans. The correlation coefficient determines the relationship between two arrays describing a certain property. In this study, the property is the absorbance and the two arrays are: (1) the absorbance of a specific scan (for example scan A from batch 1), and (2) the average absorbance of all scans from all batches.
16
The formula used to determine the correlation coefficient for a typical admixture M is the following:
Where, X= absorbance values of scan A of admixture M
= average of the absorbance values of scan A of admixture M Y= average absorbance values of all scans from all three batches of admixture M
= average of the average absorbance of all scans from all three batches of admixture M
Figure 4. IR scans for six samples of DARACEM 55 from three batches
17
Figure 5. IR scans for twelve samples of DARACEM 55 from three batches
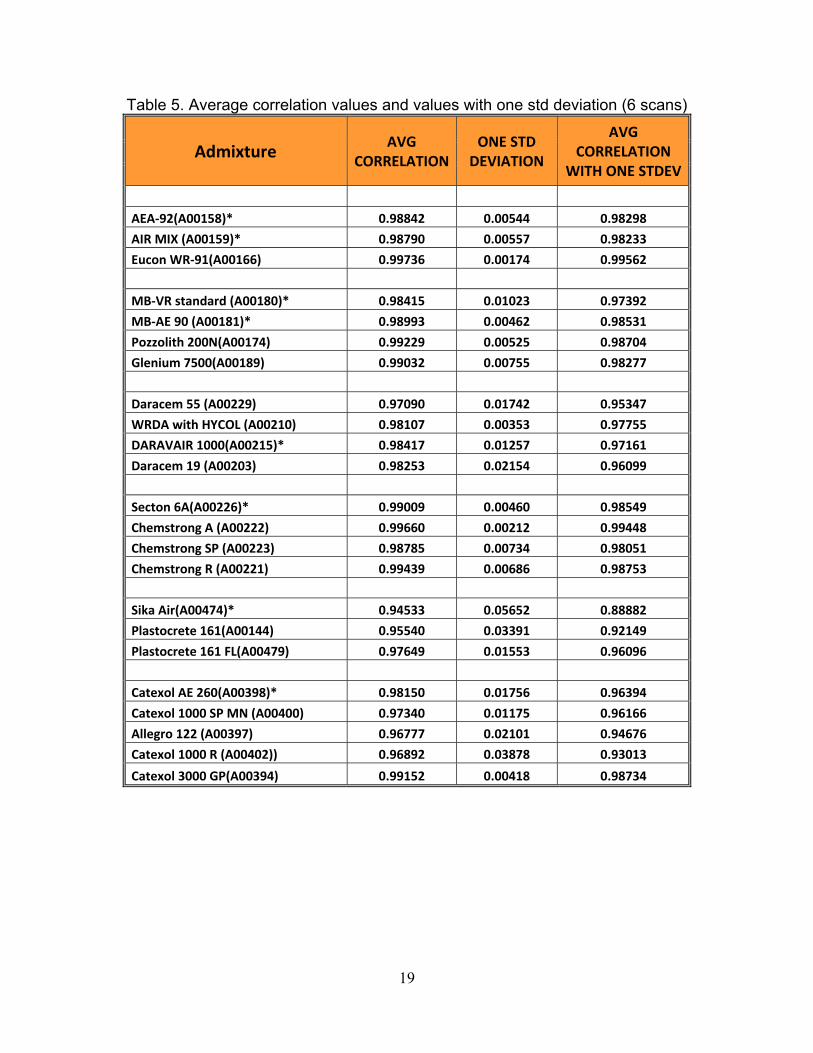
The last column in Table 4 represents the correlation coefficients calculated using a total of six scans for each admixture using the above formula. These values represent the average of six correlation coefficients for each admixture. During the testing of the IR scans, those scans that were different from the typical scans were repeated just to make sure that no error is introduced in the correlation coefficients. To account for the variations in IR scans and other variations, the standard deviation of the average scans was determined and the average correlation coefficients were calculated including one standard deviation. A calculated standard deviation is an estimate of how correlation values are distributed away from the mean or the average correlation coefficients. If this distribution is approximately normal (bell shaped curve), then about 34% of the measured values will occur within one standard deviation. Table 5 shows the average values of the correlation coefficients and also the average values minus one standard deviation for comparisons. A tolerance value of one standard deviation is recommended for acceptance criteria. The use of this tolerance will be at the discretion of the NJDOT based on the performance of job samples.
For example, the average correlation coefficient of AEA-92 is 0.98842. The standard deviation in correlation values for this admixture is 0.00544 from Table 5. And the correlation value including one standard deviation for AE-A92 is 0.98298 given in the last column in Table 5. For the test data for the six scans of each admixture, the average correlation values minus one standard deviation is recommended as acceptable correlation values. This will account for the
18
variation and the scatter of test results of these scans. These recommended values and the average were evaluated for use with job samples to see their effect on acceptance of the job samples. This is explained later in the report.
Table 4. Average correlation coefficients from all batches (total 6 scans)
Admixture
Correlation coefficient between mean absorbance and each scan. AVG
CORREL COEFF
Batch _ I Batch _ II Batch _ III
Scan_A Scan_B Scan_A Scan_B Scan_A Scan_B AEA‐92(A00158)* 0.99265 0.99077 0.97934 0.98729 0.98608 0.99439 0.98842AIR MIX (A00159)* 0.99550 0.98899 0.98126 0.98141 0.99043 0.98979 0.98790Eucon WR‐91(A00166) 0.99439 0.99731 0.99869 0.99862 0.99878 0.99638 0.99736 MB‐VR standard (A00180)* 0.97839 0.97607 0.99649 0.99533 0.97221 0.98642 0.98415MB‐AE 90 (A00181)* 0.98590 0.98845 0.99634 0.99339 0.99132 0.98416 0.98993Pozzolith 200N(A00174) 0.99244 0.98837 0.99742 0.99811 0.98442 0.99301 0.99229Glenium 7500(A00189) 0.97791 0.99357 0.99885 0.99482 0.99154 0.98523 0.99032 Daracem 55 (A00229) 0.98059 0.99027 0.94854 0.95178 0.96981 0.98439 0.97090WRDA with HYCOL (A00210) 0.98582 0.98139 0.97694 0.98452 0.97962 0.97815 0.98107DARAVAIR 1000(A00215)* 0.98266 0.98915 0.96051 0.98435 0.99314 0.99523 0.98417Daracem 19 (A00203) 0.99770 0.99734 0.99059 0.97137 0.99475 0.94340 0.98253 Secton 6A(A00226)* 0.99535 0.98284 0.98984 0.98771 0.99027 0.99456 0.99009Chemstrong A (A00222) 0.99662 0.99809 0.99906 0.99758 0.99345 0.99479 0.99660Chemstrong SP (A00223) 0.98615 0.98606 0.98255 0.97903 0.99761 0.99572 0.98785Chemstrong R (A00221) 0.98124 0.99867 0.99897 0.99826 0.99262 0.99657 0.99439 Sika Air(A00474)* 0.97332 0.97124 0.98024 0.98299 0.92617 0.83804 0.94533Plastocrete 161(A00144) 0.97229 0.97851 0.98373 0.97208 0.92382 0.90199 0.95540Plastocrete 161 FL(A00479) 0.96880 0.97844 0.99101 0.99784 0.96488 0.95800 0.97649 Catexol AE 260(A00398)* 0.99559 0.98616 0.94839 0.97677 0.99430 0.98778 0.98150Catexol 1000 SP MN (A00400) 0.96654 0.97102 0.97107 0.95765 0.98487 0.98927 0.97340Allegro 122 (A00397) 0.98557 0.97266 0.93258 0.95310 0.98604 0.97669 0.96777Catexol 1000 R (A00402)) 0.99770 0.99685 0.98971 0.99122 0.91901 0.91901 0.96892
Catexol 3000 GP(A00394) 0.99566 0.98717 0.98944 0.98684 0.99566 0.99433 0.99152
19
Table 5. Average correlation values and values with one std deviation (6 scans)
Admixture AVG CORRELATION
ONE STD DEVIATION
AVG CORRELATION
WITH ONE STDEV
AEA‐92(A00158)* 0.98842 0.00544 0.98298
AIR MIX (A00159)* 0.98790 0.00557 0.98233
Eucon WR‐91(A00166) 0.99736 0.00174 0.99562
MB‐VR standard (A00180)* 0.98415 0.01023 0.97392
MB‐AE 90 (A00181)* 0.98993 0.00462 0.98531
Pozzolith 200N(A00174) 0.99229 0.00525 0.98704
Glenium 7500(A00189) 0.99032 0.00755 0.98277
Daracem 55 (A00229) 0.97090 0.01742 0.95347
WRDA with HYCOL (A00210) 0.98107 0.00353 0.97755
DARAVAIR 1000(A00215)* 0.98417 0.01257 0.97161
Daracem 19 (A00203) 0.98253 0.02154 0.96099
Secton 6A(A00226)* 0.99009 0.00460 0.98549
Chemstrong A (A00222) 0.99660 0.00212 0.99448
Chemstrong SP (A00223) 0.98785 0.00734 0.98051
Chemstrong R (A00221) 0.99439 0.00686 0.98753
Sika Air(A00474)* 0.94533 0.05652 0.88882
Plastocrete 161(A00144) 0.95540 0.03391 0.92149
Plastocrete 161 FL(A00479) 0.97649 0.01553 0.96096
Catexol AE 260(A00398)* 0.98150 0.01756 0.96394
Catexol 1000 SP MN (A00400) 0.97340 0.01175 0.96166
Allegro 122 (A00397) 0.96777 0.02101 0.94676
Catexol 1000 R (A00402)) 0.96892 0.03878 0.93013
Catexol 3000 GP(A00394) 0.99152 0.00418 0.98734

20
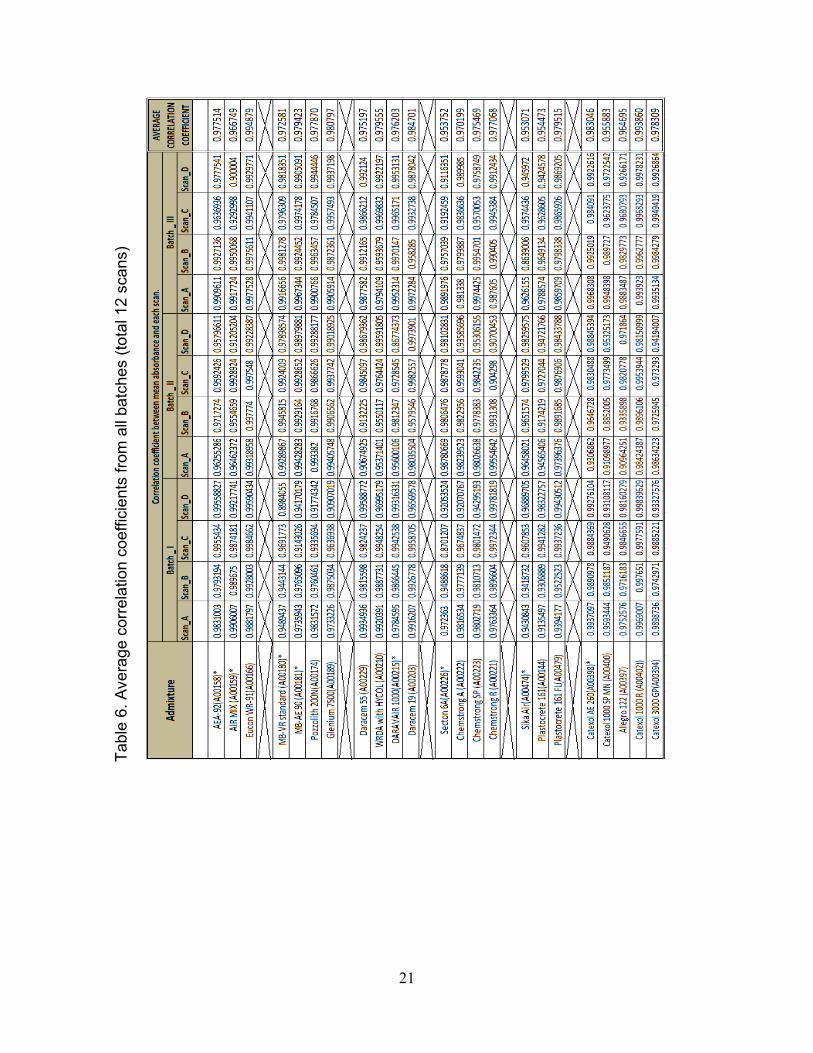
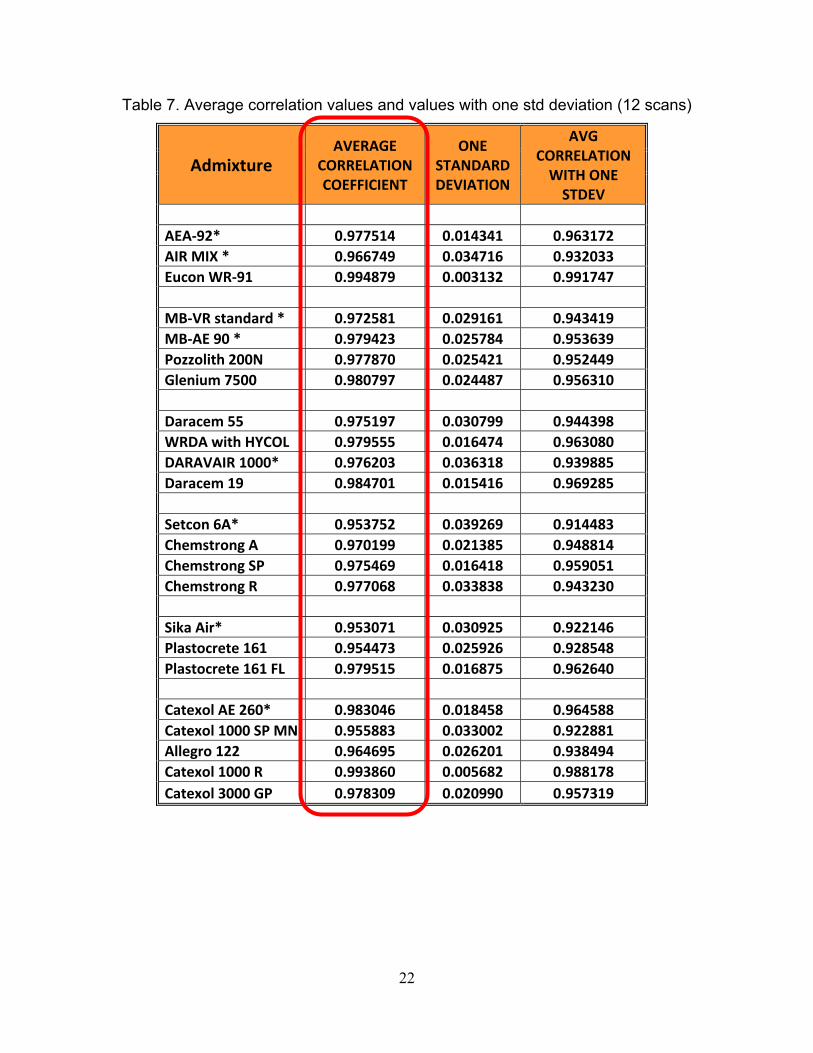
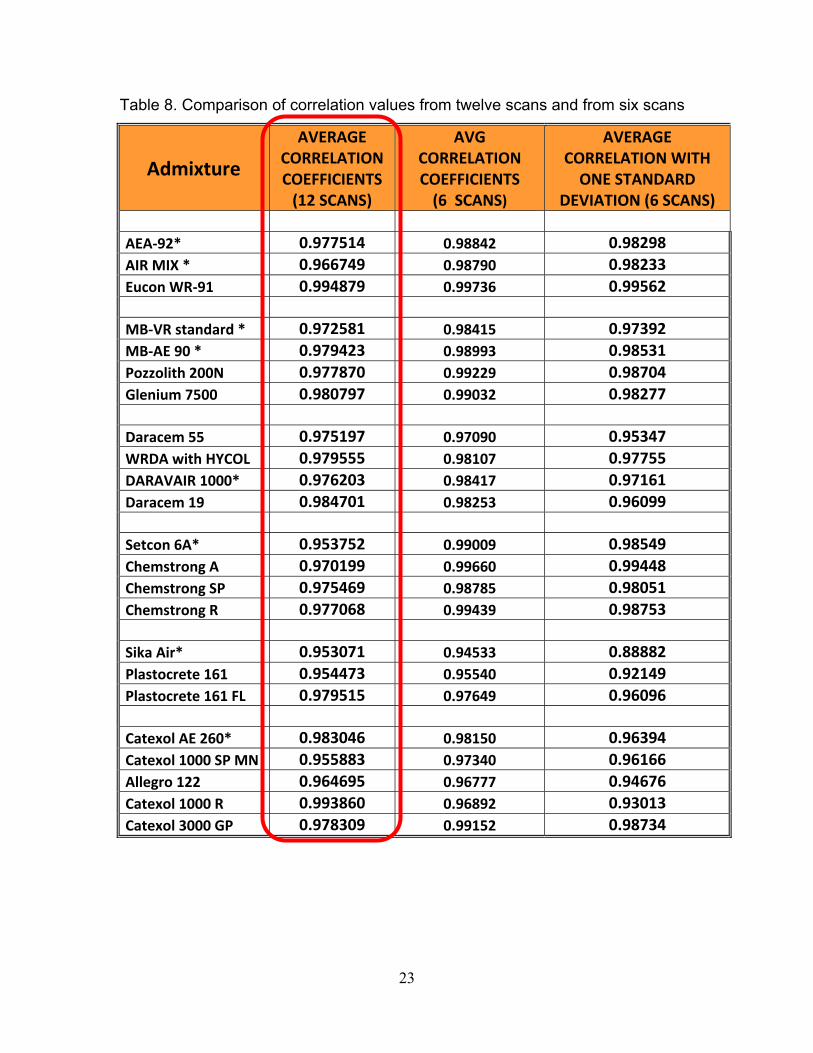
Tables 6 and 7 are similar to Tables 4 and 5 but for twelve scans instead of six. The same method was used to determine the correlation values for the concrete admixtures in Tables 6 and 7 as the ones used for Tables 4 and 5. For example, the average correlation coefficient of AEA92 from twelve scans in Table 6 is 0.977514. The standard deviation in correlation values for this admixture is 0.014341 from Table 7. The correlation value including one standard deviation for AEA92 is 0.963172 given in the last column in Table 7. For the test data for twelve scans for each admixture, the average correlation values are recommended as acceptable correlation values rather than the one with one standard deviation because of the larger number of samples used to determine the correlation coefficients. These values are highlighted in yellow in Table 7. A tolerance value of one standard deviation is recommended for acceptance criteria. The use of this tolerance will be at the discretion of the NJDOT based on the performance of job samples Comparisons of the correlation coefficients from the twelve scans and from the six scans are shown on Table 8. The second column in this table is the last column in Table 6 which shows the average correlation coefficients from the twelve scans. The third column in this table is the second column in Table 5 which shows the average correlation coefficients from the six scans. The third column in this table is the last column in Table 5 which shows the average correlation coefficients with one standard deviation from the six scans. Table 8 shows the difference in correlation coefficients between the average correlation values of the twelve scans, the average correlation values of the six scans, and the average correlation values with one standard deviation of the six scans. The variation in these values can be attributed to several factors, in addition to the inclusion of standard deviation in column three. These factors include storage time of admixtures, KBr, lab operator, variations in drying time, pellet composition and others. Because the twelve scans include a large data sample, we recommend using the average correlation values from the twelve scan study as baseline values for evaluating job samples. These values are in the second column of Tables 7 and 8 and are boxed red rectangles. One standard deviation can be used as a tolerance for limits of acceptance or rejection of job samples at the discretion of the NJDOT and based on the performance of job samples.
21
Tabl
e 6.
Ave
rage
cor
rela
tion
coef
ficie
nts
from
all
batc
hes
(tota
l 12
scan
s)
22
Table 7. Average correlation values and values with one std deviation (12 scans)
Admixture AVERAGE
CORRELATION COEFFICIENT
ONE STANDARD DEVIATION
AVG CORRELATION WITH ONE STDEV
AEA‐92* 0.977514 0.014341 0.963172 AIR MIX * 0.966749 0.034716 0.932033 Eucon WR‐91 0.994879 0.003132 0.991747 MB‐VR standard * 0.972581 0.029161 0.943419 MB‐AE 90 * 0.979423 0.025784 0.953639 Pozzolith 200N 0.977870 0.025421 0.952449 Glenium 7500 0.980797 0.024487 0.956310 Daracem 55 0.975197 0.030799 0.944398 WRDA with HYCOL 0.979555 0.016474 0.963080 DARAVAIR 1000* 0.976203 0.036318 0.939885 Daracem 19 0.984701 0.015416 0.969285 Setcon 6A* 0.953752 0.039269 0.914483 Chemstrong A 0.970199 0.021385 0.948814 Chemstrong SP 0.975469 0.016418 0.959051 Chemstrong R 0.977068 0.033838 0.943230 Sika Air* 0.953071 0.030925 0.922146 Plastocrete 161 0.954473 0.025926 0.928548 Plastocrete 161 FL 0.979515 0.016875 0.962640 Catexol AE 260* 0.983046 0.018458 0.964588 Catexol 1000 SP MN 0.955883 0.033002 0.922881 Allegro 122 0.964695 0.026201 0.938494 Catexol 1000 R 0.993860 0.005682 0.988178 Catexol 3000 GP 0.978309 0.020990 0.957319
23
Table 8. Comparison of correlation values from twelve scans and from six scans
Admixture
AVERAGE CORRELATION COEFFICIENTS (12 SCANS)
AVG CORRELATION COEFFICIENTS (6 SCANS)
AVERAGE CORRELATION WITH ONE STANDARD
DEVIATION (6 SCANS)
AEA‐92* 0.977514 0.98842 0.98298AIR MIX * 0.966749 0.98790 0.98233Eucon WR‐91 0.994879 0.99736 0.99562 MB‐VR standard * 0.972581 0.98415 0.97392MB‐AE 90 * 0.979423 0.98993 0.98531Pozzolith 200N 0.977870 0.99229 0.98704Glenium 7500 0.980797 0.99032 0.98277 Daracem 55 0.975197 0.97090 0.95347WRDA with HYCOL 0.979555 0.98107 0.97755DARAVAIR 1000* 0.976203 0.98417 0.97161Daracem 19 0.984701 0.98253 0.96099 Setcon 6A* 0.953752 0.99009 0.98549Chemstrong A 0.970199 0.99660 0.99448Chemstrong SP 0.975469 0.98785 0.98051Chemstrong R 0.977068 0.99439 0.98753 Sika Air* 0.953071 0.94533 0.88882Plastocrete 161 0.954473 0.95540 0.92149Plastocrete 161 FL 0.979515 0.97649 0.96096 Catexol AE 260* 0.983046 0.98150 0.96394Catexol 1000 SP MN 0.955883 0.97340 0.96166Allegro 122 0.964695 0.96777 0.94676Catexol 1000 R 0.993860 0.96892 0.93013Catexol 3000 GP 0.978309 0.99152 0.98734

24
INFRARED SCAN METHODOLOGY FOR STRUCTURAL STEEL PAINTS Infrared spectroscopy for structural steel paints was performed on samples obtained from the manufacturer for various types of paints given in Table 3. Procedure for IR scan of structural steel paints The IR scan of structural steel paints followed the following steps:
1. Identify structural steel paint to be scanned. 2. Place a small paint sample in a can and insert the paint can into an
automatic paint shaker for a duration of 3 minutes. 3. Open the can and briefly hand mix the paint with a mixing stick to ensure a
uniform sample distribution. 4. Set up the infrared spectrometer and run a background scan of the clean
lens. 5. Using a pipette, evenly coat the lens in a layer of paint. It is especially
important to be certain the entire lens is covered to prevent light from affecting the scan.
6. Run the machine to obtain the infrared absorption spectra. 7. Two scans are performed for every sample.
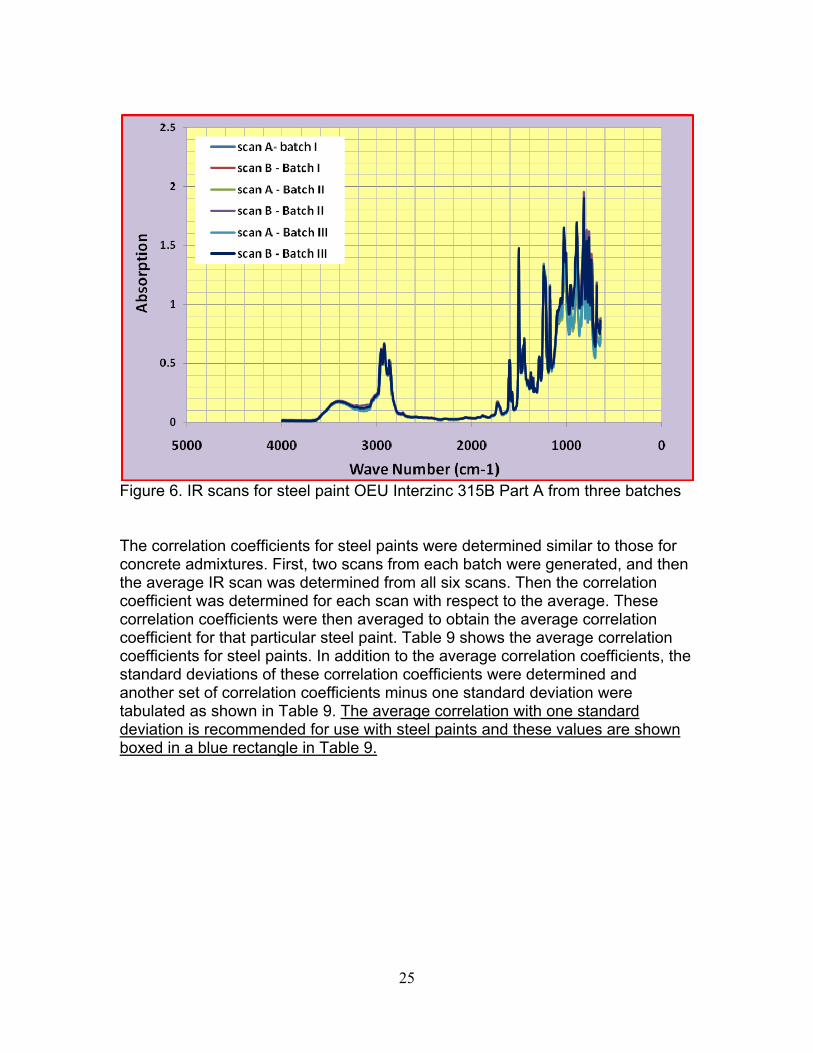
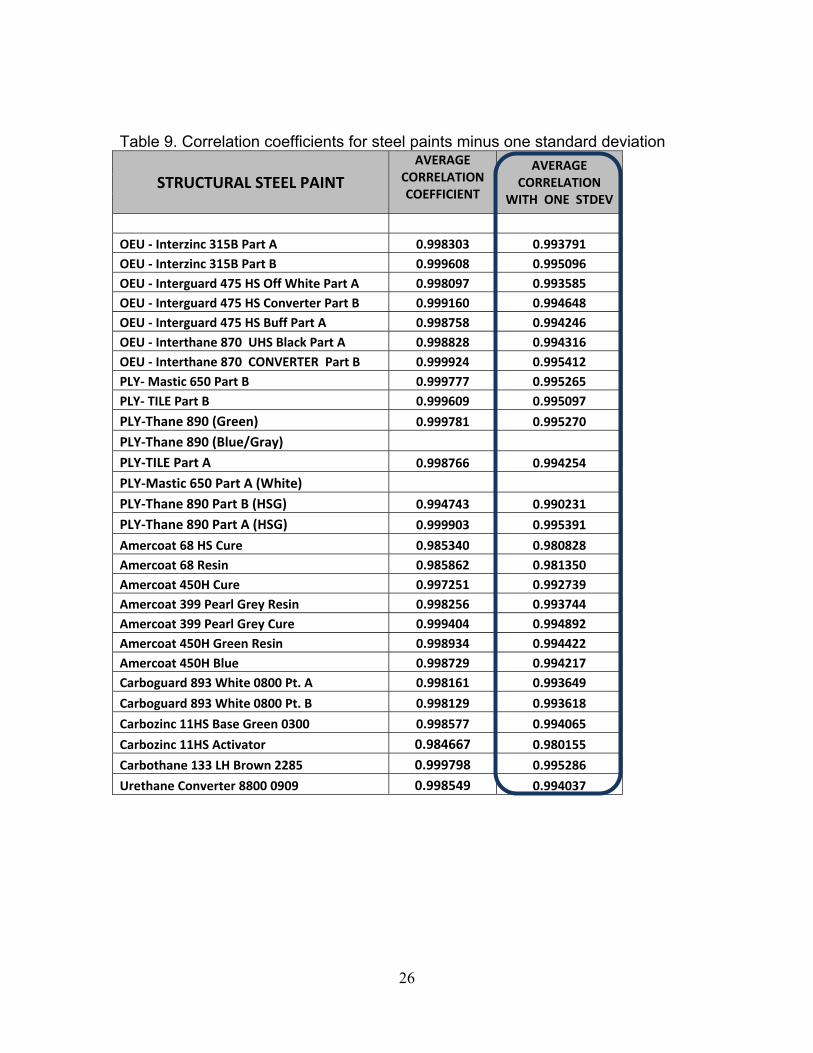
Data files then were processed to obtain correlation coefficients similar to the concrete admixtures as explained in the Appendix. Test Results and Discussions of IR Scans of Steel Paints The IR scan of structural steels was relatively simple. The procedure included several simple steps as explained earlier that resulted in two scans from each batch. Two IR scans from each batch of steel paints were performed (scan A and scan B). This resulted in a total of six scans from the three batches. For each scan the absorption versus the wave number was recorded and tabulated in an Excel spreadsheet. Typical IR scans for steel paints for OEU – Interzinc 315B Part A are shown in Figure 6. The figure shows consistent peaks and valleys of the IR scan from all three batches. Similar IR scans were observed for structural steel paints. The correlation factor of the six scans was determined and is shown in Table 9. With the exception of Ply-Thane 890 Part B, Americoat 68 HS Cure and Resin, and Carbozinc 11HS Activator, steel paint correlation factors were not less than 0.998.
25
Figure 6. IR scans for steel paint OEU Interzinc 315B Part A from three batches The correlation coefficients for steel paints were determined similar to those for concrete admixtures. First, two scans from each batch were generated, and then the average IR scan was determined from all six scans. Then the correlation coefficient was determined for each scan with respect to the average. These correlation coefficients were then averaged to obtain the average correlation coefficient for that particular steel paint. Table 9 shows the average correlation coefficients for steel paints. In addition to the average correlation coefficients, the standard deviations of these correlation coefficients were determined and another set of correlation coefficients minus one standard deviation were tabulated as shown in Table 9. The average correlation with one standard deviation is recommended for use with steel paints and these values are shown boxed in a blue rectangle in Table 9.
26
Table 9. Correlation coefficients for steel paints minus one standard deviation
STRUCTURAL STEEL PAINT AVERAGE
CORRELATION COEFFICIENT
AVERAGE CORRELATION
WITH ONE STDEV
OEU ‐ Interzinc 315B Part A 0.998303 0.993791 OEU ‐ Interzinc 315B Part B 0.999608 0.995096 OEU ‐ Interguard 475 HS Off White Part A 0.998097 0.993585 OEU ‐ Interguard 475 HS Converter Part B 0.999160 0.994648 OEU ‐ Interguard 475 HS Buff Part A 0.998758 0.994246 OEU ‐ Interthane 870 UHS Black Part A 0.998828 0.994316 OEU ‐ Interthane 870 CONVERTER Part B 0.999924 0.995412 PLY‐ Mastic 650 Part B 0.999777 0.995265 PLY‐ TILE Part B 0.999609 0.995097
PLY‐Thane 890 (Green) 0.999781 0.995270
PLY‐Thane 890 (Blue/Gray) PLY‐TILE Part A 0.998766 0.994254
PLY‐Mastic 650 Part A (White) PLY‐Thane 890 Part B (HSG) 0.994743 0.990231
PLY‐Thane 890 Part A (HSG) 0.999903 0.995391
Amercoat 68 HS Cure 0.985340 0.980828 Amercoat 68 Resin 0.985862 0.981350 Amercoat 450H Cure 0.997251 0.992739 Amercoat 399 Pearl Grey Resin 0.998256 0.993744 Amercoat 399 Pearl Grey Cure 0.999404 0.994892 Amercoat 450H Green Resin 0.998934 0.994422 Amercoat 450H Blue 0.998729 0.994217 Carboguard 893 White 0800 Pt. A 0.998161 0.993649
Carboguard 893 White 0800 Pt. B 0.998129 0.993618
Carbozinc 11HS Base Green 0300 0.998577 0.994065
Carbozinc 11HS Activator 0.984667 0.980155
Carbothane 133 LH Brown 2285 0.999798 0.995286
Urethane Converter 8800 0909 0.998549 0.994037
27
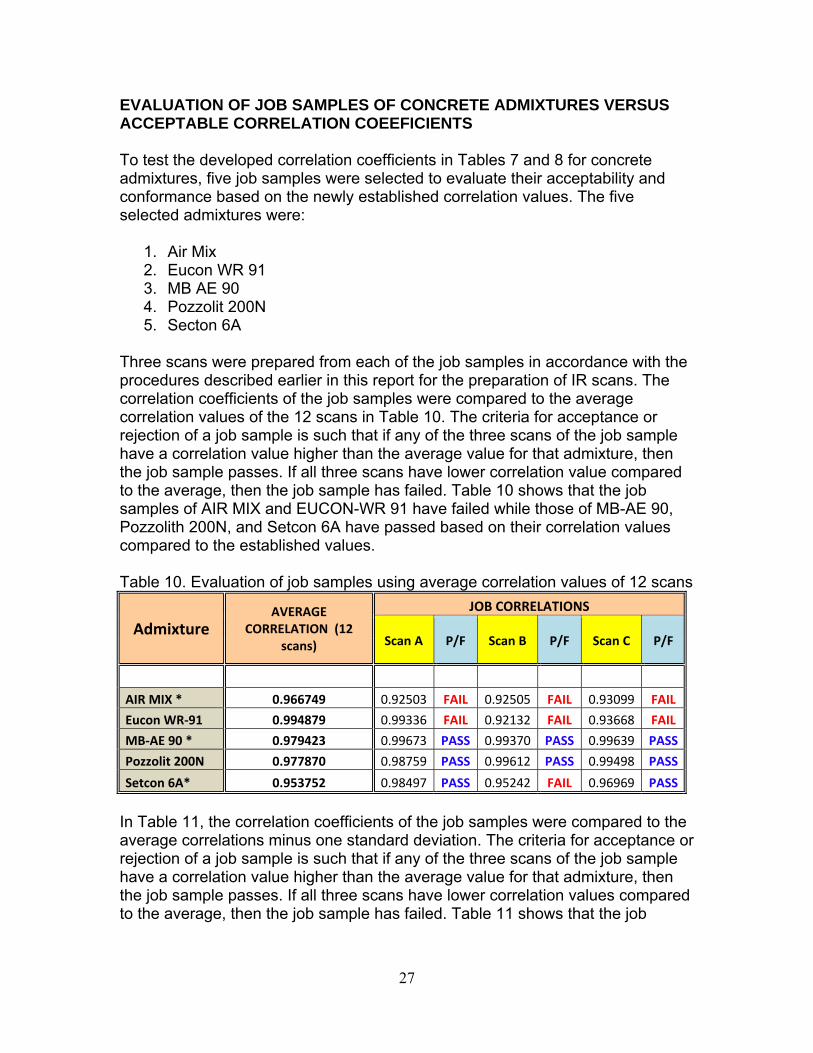
EVALUATION OF JOB SAMPLES OF CONCRETE ADMIXTURES VERSUS ACCEPTABLE CORRELATION COEEFICIENTS To test the developed correlation coefficients in Tables 7 and 8 for concrete admixtures, five job samples were selected to evaluate their acceptability and conformance based on the newly established correlation values. The five selected admixtures were:
1. Air Mix 2. Eucon WR 91 3. MB AE 90 4. Pozzolit 200N 5. Secton 6A
Three scans were prepared from each of the job samples in accordance with the procedures described earlier in this report for the preparation of IR scans. The correlation coefficients of the job samples were compared to the average correlation values of the 12 scans in Table 10. The criteria for acceptance or rejection of a job sample is such that if any of the three scans of the job sample have a correlation value higher than the average value for that admixture, then the job sample passes. If all three scans have lower correlation value compared to the average, then the job sample has failed. Table 10 shows that the job samples of AIR MIX and EUCON-WR 91 have failed while those of MB-AE 90, Pozzolith 200N, and Setcon 6A have passed based on their correlation values compared to the established values. Table 10. Evaluation of job samples using average correlation values of 12 scans
Admixture AVERAGE
CORRELATION (12 scans)
JOB CORRELATIONS
Scan A P/F Scan B P/F Scan C P/F
AIR MIX * 0.966749 0.92503 FAIL 0.92505 FAIL 0.93099 FAIL
Eucon WR‐91 0.994879 0.99336 FAIL 0.92132 FAIL 0.93668 FAIL
MB‐AE 90 * 0.979423 0.99673 PASS 0.99370 PASS 0.99639 PASS
Pozzolit 200N 0.977870 0.98759 PASS 0.99612 PASS 0.99498 PASS
Setcon 6A* 0.953752 0.98497 PASS 0.95242 FAIL 0.96969 PASS
In Table 11, the correlation coefficients of the job samples were compared to the average correlations minus one standard deviation. The criteria for acceptance or rejection of a job sample is such that if any of the three scans of the job sample have a correlation value higher than the average value for that admixture, then the job sample passes. If all three scans have lower correlation values compared to the average, then the job sample has failed. Table 11 shows that the job
28
sample of AIR MIX has failed while those of Eucon-WR 91, MB-AE 90, Pozzolith 200N, and Setcon 6A have passed. Table 11.Evaluation of job samples using avg correlation w/one stdev (12 scans)
Admixture
AVERAGE CORRELATION WITH ONE STDEV (12
scans)
JOB CORRELATIONS
Scan A P/F Scan B P/F Scan C P/F
AIR MIX * 0.932033 0.92503 FAIL 0.92505 FAIL 0.93099 FAIL
Eucon WR‐91 0.991747 0.99336 PASS 0.92132 FAIL 0.93668 FAIL
MB‐AE 90 * 0.953639 0.99673 PASS 0.99370 PASS 0.99639 PASS
Pozzolith 200N 0.952449 0.98759 PASS 0.99612 PASS 0.99498 PASS
Setcon 6A* 0.914483 0.98497 PASS 0.95242 PASS 0.96969 PASS
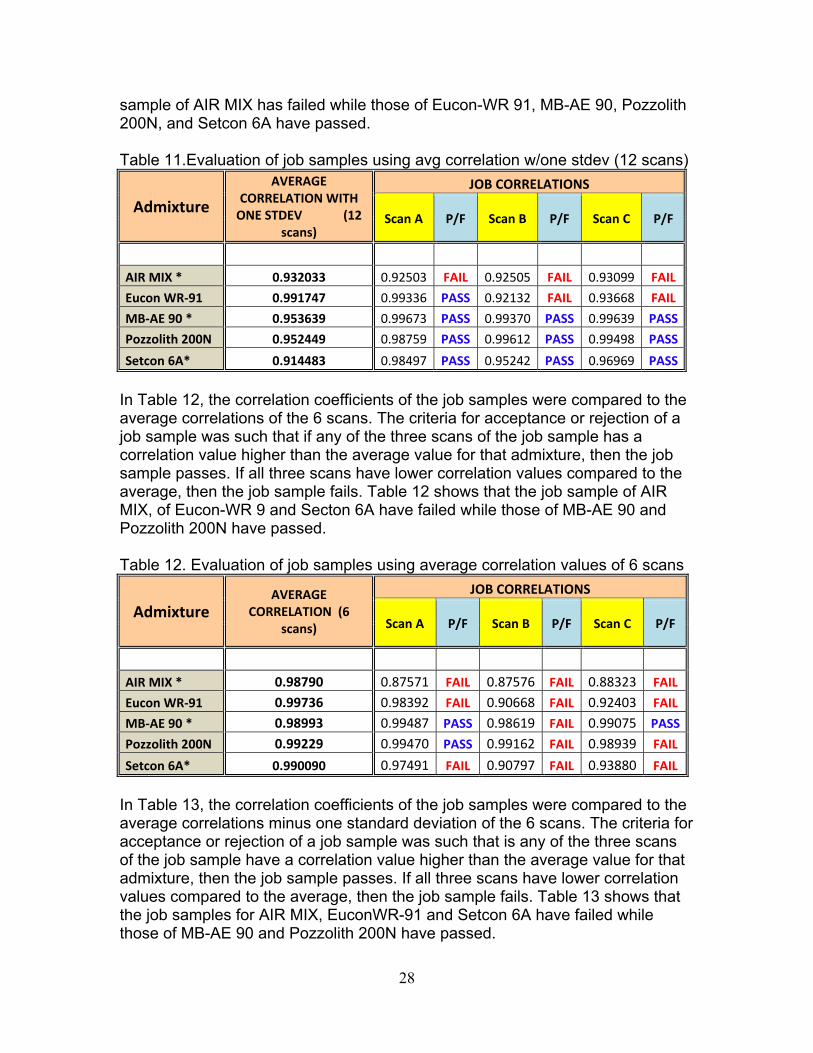
In Table 12, the correlation coefficients of the job samples were compared to the average correlations of the 6 scans. The criteria for acceptance or rejection of a job sample was such that if any of the three scans of the job sample has a correlation value higher than the average value for that admixture, then the job sample passes. If all three scans have lower correlation values compared to the average, then the job sample fails. Table 12 shows that the job sample of AIR MIX, of Eucon-WR 9 and Secton 6A have failed while those of MB-AE 90 and Pozzolith 200N have passed. Table 12. Evaluation of job samples using average correlation values of 6 scans
Admixture AVERAGE
CORRELATION (6 scans)
JOB CORRELATIONS
Scan A P/F Scan B P/F Scan C P/F
AIR MIX * 0.98790 0.87571 FAIL 0.87576 FAIL 0.88323 FAIL
Eucon WR‐91 0.99736 0.98392 FAIL 0.90668 FAIL 0.92403 FAIL
MB‐AE 90 * 0.98993 0.99487 PASS 0.98619 FAIL 0.99075 PASS
Pozzolith 200N 0.99229 0.99470 PASS 0.99162 FAIL 0.98939 FAIL
Setcon 6A* 0.990090 0.97491 FAIL 0.90797 FAIL 0.93880 FAIL
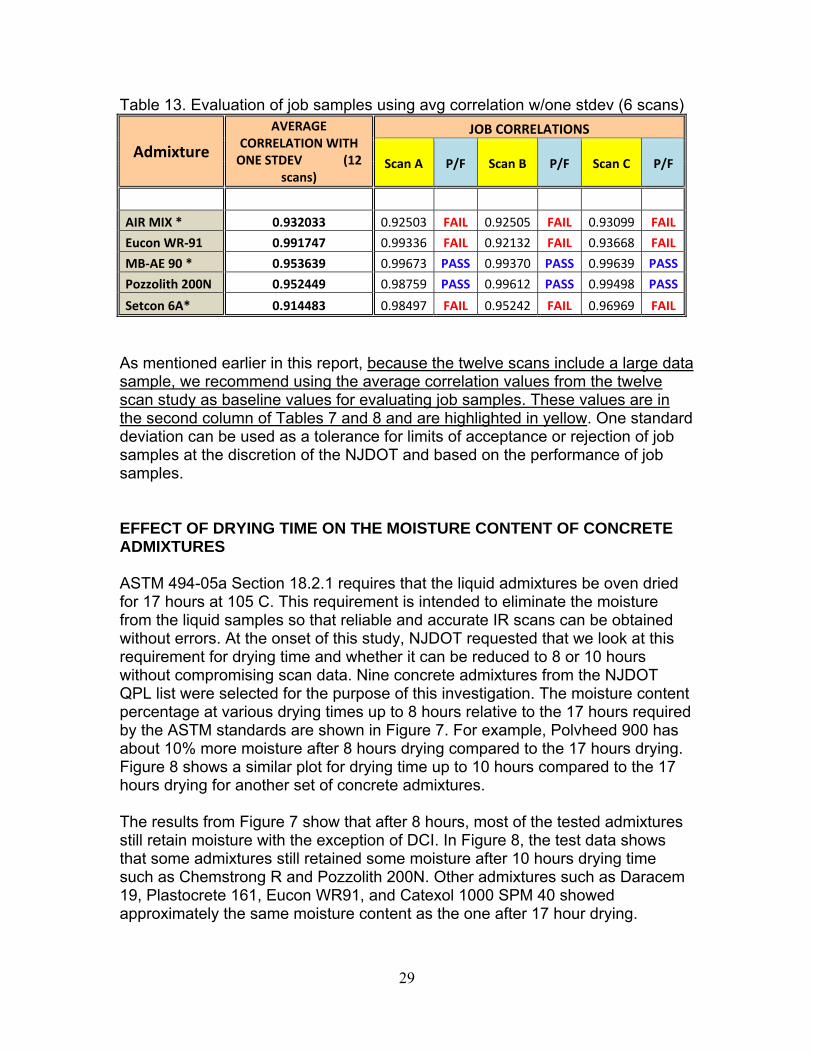
In Table 13, the correlation coefficients of the job samples were compared to the average correlations minus one standard deviation of the 6 scans. The criteria for acceptance or rejection of a job sample was such that is any of the three scans of the job sample have a correlation value higher than the average value for that admixture, then the job sample passes. If all three scans have lower correlation values compared to the average, then the job sample fails. Table 13 shows that the job samples for AIR MIX, EuconWR-91 and Setcon 6A have failed while those of MB-AE 90 and Pozzolith 200N have passed.
29
Table 13. Evaluation of job samples using avg correlation w/one stdev (6 scans)
Admixture
AVERAGE CORRELATION WITH ONE STDEV (12
scans)
JOB CORRELATIONS
Scan A P/F Scan B P/F Scan C P/F
AIR MIX * 0.932033 0.92503 FAIL 0.92505 FAIL 0.93099 FAIL
Eucon WR‐91 0.991747 0.99336 FAIL 0.92132 FAIL 0.93668 FAIL
MB‐AE 90 * 0.953639 0.99673 PASS 0.99370 PASS 0.99639 PASS
Pozzolith 200N 0.952449 0.98759 PASS 0.99612 PASS 0.99498 PASS
Setcon 6A* 0.914483 0.98497 FAIL 0.95242 FAIL 0.96969 FAIL
As mentioned earlier in this report, because the twelve scans include a large data sample, we recommend using the average correlation values from the twelve scan study as baseline values for evaluating job samples. These values are in the second column of Tables 7 and 8 and are highlighted in yellow. One standard deviation can be used as a tolerance for limits of acceptance or rejection of job samples at the discretion of the NJDOT and based on the performance of job samples. EFFECT OF DRYING TIME ON THE MOISTURE CONTENT OF CONCRETE ADMIXTURES ASTM 494-05a Section 18.2.1 requires that the liquid admixtures be oven dried for 17 hours at 105 C. This requirement is intended to eliminate the moisture from the liquid samples so that reliable and accurate IR scans can be obtained without errors. At the onset of this study, NJDOT requested that we look at this requirement for drying time and whether it can be reduced to 8 or 10 hours without compromising scan data. Nine concrete admixtures from the NJDOT QPL list were selected for the purpose of this investigation. The moisture content percentage at various drying times up to 8 hours relative to the 17 hours required by the ASTM standards are shown in Figure 7. For example, Polvheed 900 has about 10% more moisture after 8 hours drying compared to the 17 hours drying. Figure 8 shows a similar plot for drying time up to 10 hours compared to the 17 hours drying for another set of concrete admixtures. The results from Figure 7 show that after 8 hours, most of the tested admixtures still retain moisture with the exception of DCI. In Figure 8, the test data shows that some admixtures still retained some moisture after 10 hours drying time such as Chemstrong R and Pozzolith 200N. Other admixtures such as Daracem 19, Plastocrete 161, Eucon WR91, and Catexol 1000 SPM 40 showed approximately the same moisture content as the one after 17 hour drying.
30
Based on the results of this limited study in which fifteen admixtures were evaluated for the effect of drying time, it was not possible to specify a 10 hour drying time for all admixtures. Four of the six admixtures showed that they need 10 hours to achieve the 17 hour moisture content while two admixtures still require 17 hour drying time. Based on these results, it is recommended to follow the 17 hours ASTM specifies for drying time for all admixtures evaluated in this study.
Figure 7. Effect of 8 hour drying time on moisture content compared to 17 hours.
EVALUATION OF DRYING TIME ON CORRELATION COEFFIENTS The ASTM specification calls for a 17 hour drying time for the test samples. In the beginning of the project, a study on the effect of drying time concluded that the 17 hour drying time requirement in ASTM should be followed and that the 17 hours would suffice to remove all moisture from the samples. Through the summer and fall of 2010, IR scans were collected from 23 of the most commonly used admixtures (out of a total 61 admixtures on the qualified producer/supplier list) using a 17 hour oven drying time. Two scans were taken from three different batches from the manufacturer, for a total of 6 scans per admixture. The correlation coefficients from each scan were found using the IR data. From the six scans, the correlations were averaged together for a baseline recommended correlation coefficient. These values are given in Table 5.
31
0
5
10
15
20
25
30
2 4 6 8 10
Percent Moisture Content Relative to 17 hrs
Drying Time (hours)
Effect of Drying Time on Moisture Content
Eucon WR‐91
Pozzolith 200N
Catexol 1000 SP M40
Chemstrong R
Plastocrete 161
Dracem 19
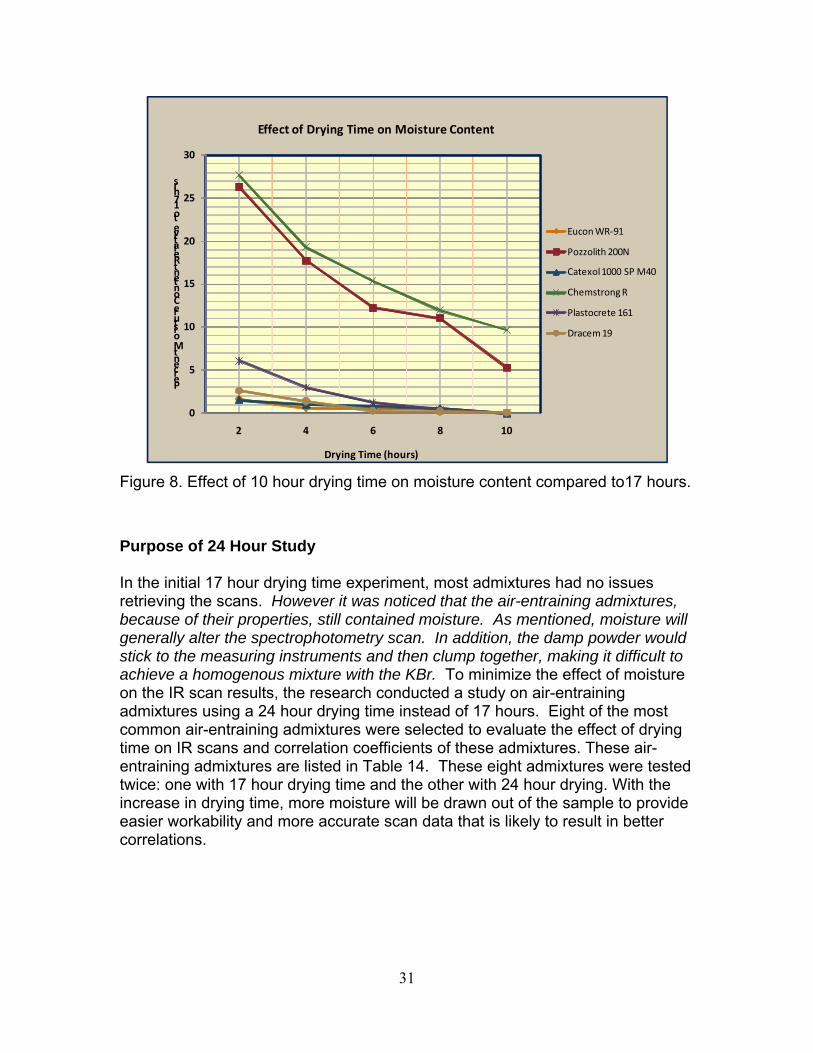
Figure 8. Effect of 10 hour drying time on moisture content compared to17 hours.
Purpose of 24 Hour Study In the initial 17 hour drying time experiment, most admixtures had no issues retrieving the scans. However it was noticed that the air-entraining admixtures, because of their properties, still contained moisture. As mentioned, moisture will generally alter the spectrophotometry scan. In addition, the damp powder would stick to the measuring instruments and then clump together, making it difficult to achieve a homogenous mixture with the KBr. To minimize the effect of moisture on the IR scan results, the research conducted a study on air-entraining admixtures using a 24 hour drying time instead of 17 hours. Eight of the most common air-entraining admixtures were selected to evaluate the effect of drying time on IR scans and correlation coefficients of these admixtures. These air-entraining admixtures are listed in Table 14. These eight admixtures were tested twice: one with 17 hour drying time and the other with 24 hour drying. With the increase in drying time, more moisture will be drawn out of the sample to provide easier workability and more accurate scan data that is likely to result in better correlations.
32
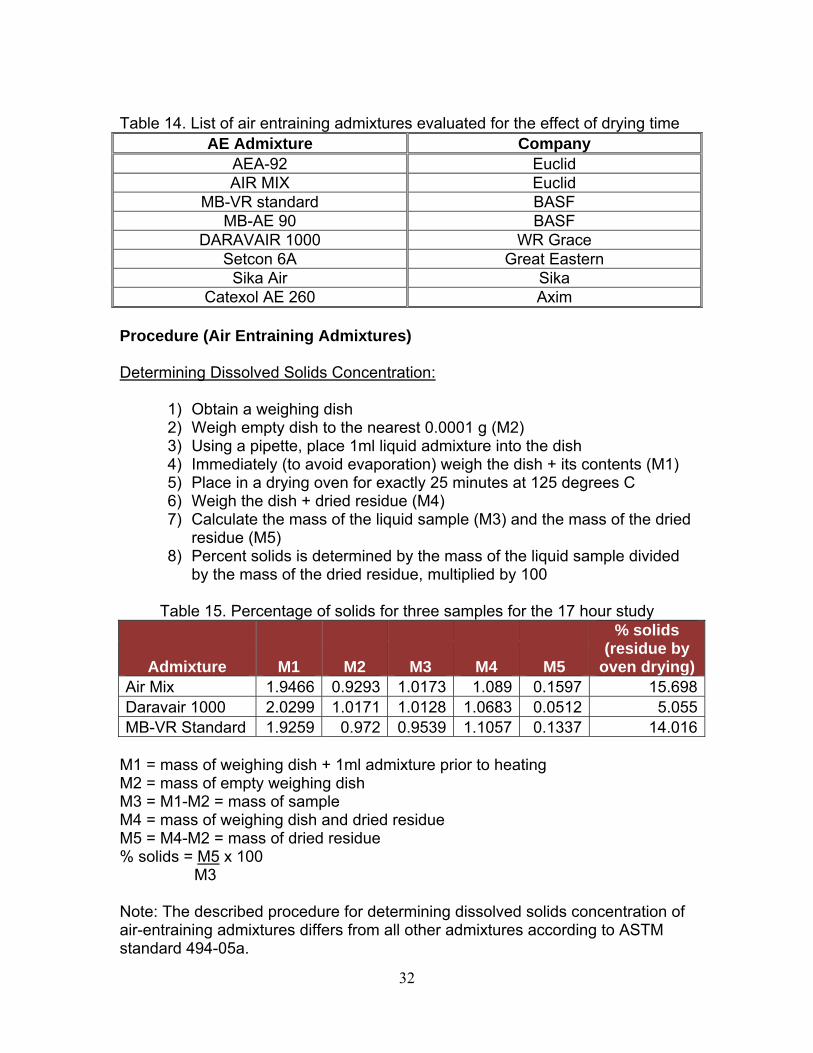
Table 14. List of air entraining admixtures evaluated for the effect of drying time
AE Admixture Company AEA-92 Euclid AIR MIX Euclid
MB-VR standard BASF MB-AE 90 BASF
DARAVAIR 1000 WR Grace Setcon 6A Great Eastern
Sika Air Sika Catexol AE 260 Axim
Procedure (Air Entraining Admixtures) Determining Dissolved Solids Concentration:
1) Obtain a weighing dish 2) Weigh empty dish to the nearest 0.0001 g (M2) 3) Using a pipette, place 1ml liquid admixture into the dish 4) Immediately (to avoid evaporation) weigh the dish + its contents (M1) 5) Place in a drying oven for exactly 25 minutes at 125 degrees C 6) Weigh the dish + dried residue (M4) 7) Calculate the mass of the liquid sample (M3) and the mass of the dried
residue (M5) 8) Percent solids is determined by the mass of the liquid sample divided
by the mass of the dried residue, multiplied by 100
Table 15. Percentage of solids for three samples for the 17 hour study
Admixture M1 M2 M3 M4 M5
% solids (residue by
oven drying) Air Mix 1.9466 0.9293 1.0173 1.089 0.1597 15.698Daravair 1000 2.0299 1.0171 1.0128 1.0683 0.0512 5.055MB-VR Standard 1.9259 0.972 0.9539 1.1057 0.1337 14.016
M1 = mass of weighing dish + 1ml admixture prior to heating M2 = mass of empty weighing dish M3 = M1-M2 = mass of sample M4 = mass of weighing dish and dried residue M5 = M4-M2 = mass of dried residue % solids = M5 x 100
M3 Note: The described procedure for determining dissolved solids concentration of air-entraining admixtures differs from all other admixtures according to ASTM standard 494-05a.
33
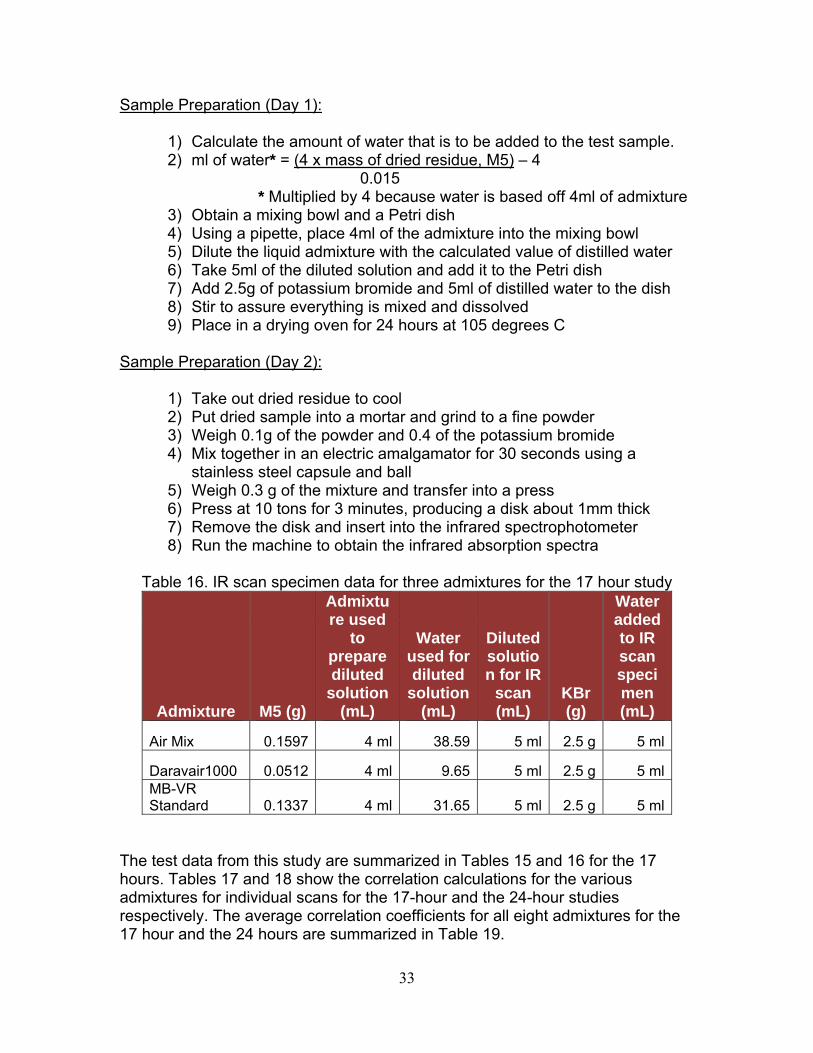
Sample Preparation (Day 1):
1) Calculate the amount of water that is to be added to the test sample. 2) ml of water* = (4 x mass of dried residue, M5) – 4
0.015 * Multiplied by 4 because water is based off 4ml of admixture
3) Obtain a mixing bowl and a Petri dish 4) Using a pipette, place 4ml of the admixture into the mixing bowl 5) Dilute the liquid admixture with the calculated value of distilled water 6) Take 5ml of the diluted solution and add it to the Petri dish 7) Add 2.5g of potassium bromide and 5ml of distilled water to the dish 8) Stir to assure everything is mixed and dissolved 9) Place in a drying oven for 24 hours at 105 degrees C
Sample Preparation (Day 2):
1) Take out dried residue to cool 2) Put dried sample into a mortar and grind to a fine powder 3) Weigh 0.1g of the powder and 0.4 of the potassium bromide 4) Mix together in an electric amalgamator for 30 seconds using a
stainless steel capsule and ball 5) Weigh 0.3 g of the mixture and transfer into a press 6) Press at 10 tons for 3 minutes, producing a disk about 1mm thick 7) Remove the disk and insert into the infrared spectrophotometer 8) Run the machine to obtain the infrared absorption spectra
Table 16. IR scan specimen data for three admixtures for the 17 hour study
Admixture M5 (g)
Admixture used
to prepare diluted
solution (mL)
Water used for diluted
solution (mL)
Diluted solution for IR
scan (mL)
KBr (g)
Water added to IR scan specimen (mL)
Air Mix 0.1597 4 ml 38.59 5 ml 2.5 g 5 ml
Daravair1000 0.0512 4 ml 9.65 5 ml 2.5 g 5 mlMB-VR Standard 0.1337 4 ml 31.65 5 ml 2.5 g 5 ml
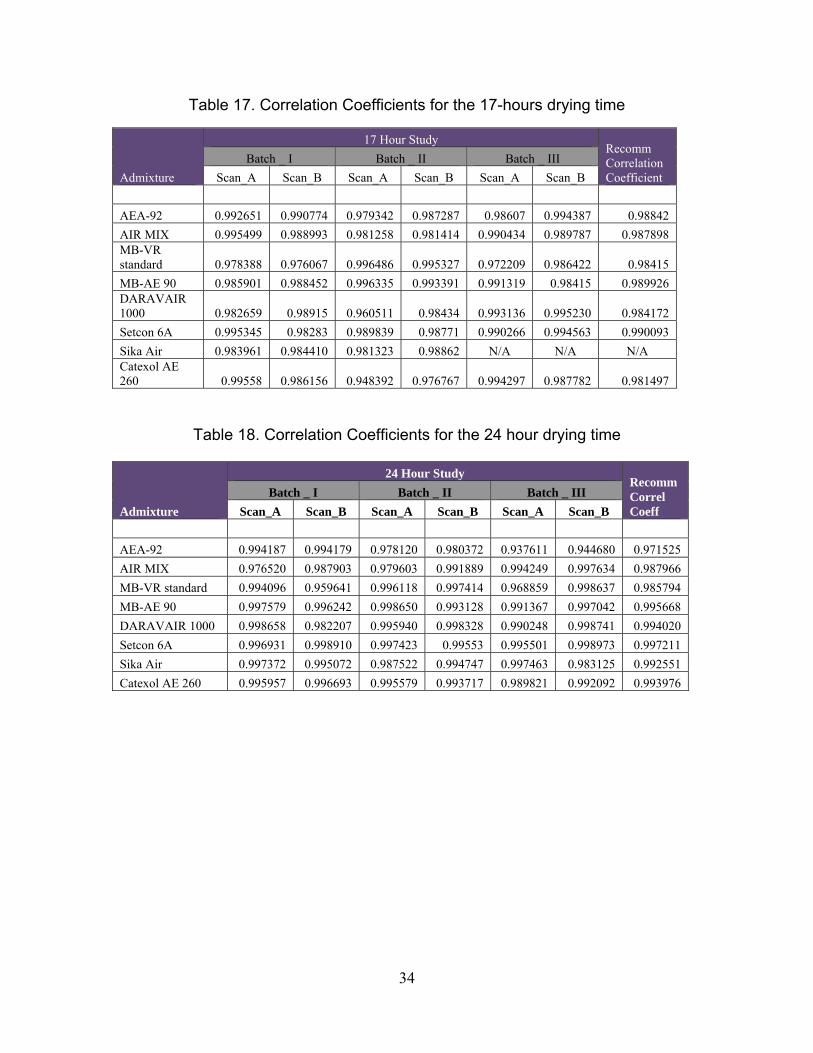
The test data from this study are summarized in Tables 15 and 16 for the 17 hours. Tables 17 and 18 show the correlation calculations for the various admixtures for individual scans for the 17-hour and the 24-hour studies respectively. The average correlation coefficients for all eight admixtures for the 17 hour and the 24 hours are summarized in Table 19.
34
Table 17. Correlation Coefficients for the 17-hours drying time
Table 18. Correlation Coefficients for the 24 hour drying time
Admixture
17 Hour Study Recomm Correlation Coefficient
Batch _ I Batch _ II Batch _ III Scan_A Scan_B Scan_A Scan_B Scan_A Scan_B
AEA-92 0.992651 0.990774 0.979342 0.987287 0.98607 0.994387 0.98842 AIR MIX 0.995499 0.988993 0.981258 0.981414 0.990434 0.989787 0.987898 MB-VR standard 0.978388 0.976067 0.996486 0.995327 0.972209 0.986422 0.98415 MB-AE 90 0.985901 0.988452 0.996335 0.993391 0.991319 0.98415 0.989926 DARAVAIR 1000 0.982659 0.98915 0.960511 0.98434 0.993136 0.995230 0.984172 Setcon 6A 0.995345 0.98283 0.989839 0.98771 0.990266 0.994563 0.990093 Sika Air 0.983961 0.984410 0.981323 0.98862 N/A N/A N/A Catexol AE 260 0.99558 0.986156 0.948392 0.976767 0.994297 0.987782 0.981497
Admixture
24 Hour Study Recomm Correl Coeff
Batch _ I Batch _ II Batch _ III Scan_A Scan_B Scan_A Scan_B Scan_A Scan_B
AEA-92 0.994187 0.994179 0.978120 0.980372 0.937611 0.944680 0.971525 AIR MIX 0.976520 0.987903 0.979603 0.991889 0.994249 0.997634 0.987966 MB-VR standard 0.994096 0.959641 0.996118 0.997414 0.968859 0.998637 0.985794 MB-AE 90 0.997579 0.996242 0.998650 0.993128 0.991367 0.997042 0.995668 DARAVAIR 1000 0.998658 0.982207 0.995940 0.998328 0.990248 0.998741 0.994020 Setcon 6A 0.996931 0.998910 0.997423 0.99553 0.995501 0.998973 0.997211 Sika Air 0.997372 0.995072 0.987522 0.994747 0.997463 0.983125 0.992551 Catexol AE 260 0.995957 0.996693 0.995579 0.993717 0.989821 0.992092 0.993976
35
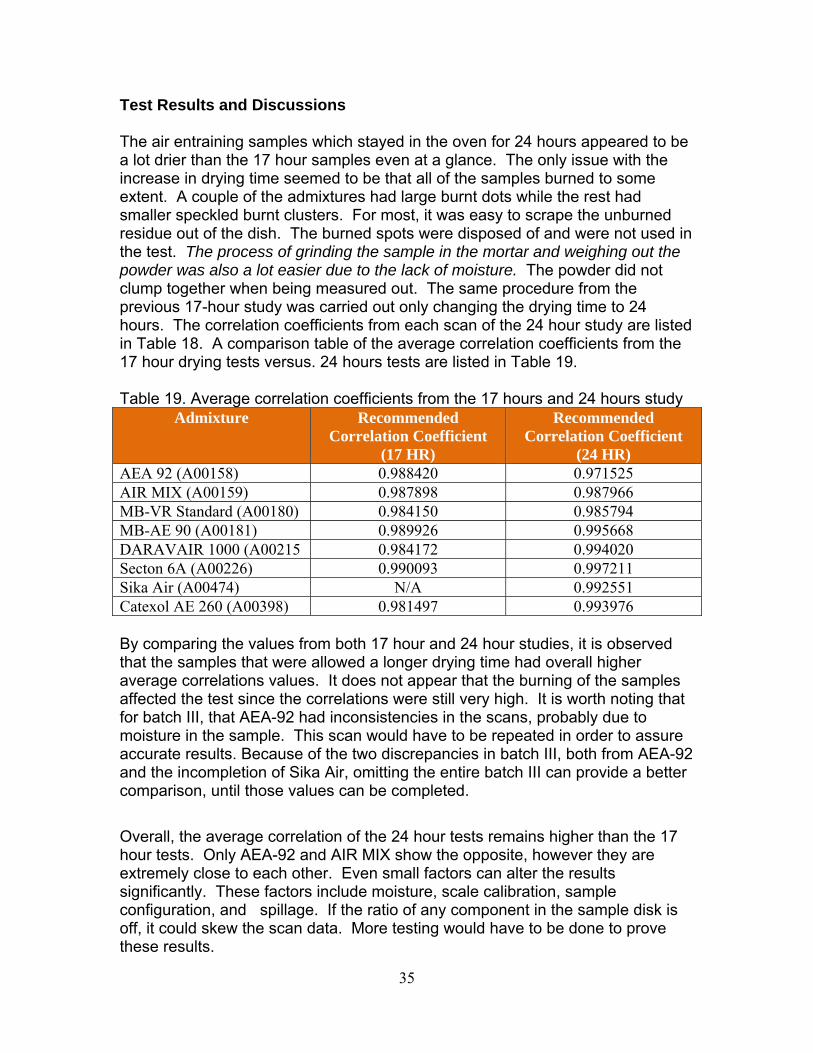
Test Results and Discussions The air entraining samples which stayed in the oven for 24 hours appeared to be a lot drier than the 17 hour samples even at a glance. The only issue with the increase in drying time seemed to be that all of the samples burned to some extent. A couple of the admixtures had large burnt dots while the rest had smaller speckled burnt clusters. For most, it was easy to scrape the unburned residue out of the dish. The burned spots were disposed of and were not used in the test. The process of grinding the sample in the mortar and weighing out the powder was also a lot easier due to the lack of moisture. The powder did not clump together when being measured out. The same procedure from the previous 17-hour study was carried out only changing the drying time to 24 hours. The correlation coefficients from each scan of the 24 hour study are listed in Table 18. A comparison table of the average correlation coefficients from the 17 hour drying tests versus. 24 hours tests are listed in Table 19. Table 19. Average correlation coefficients from the 17 hours and 24 hours study
Admixture Recommended Correlation Coefficient
(17 HR)
Recommended Correlation Coefficient
(24 HR) AEA 92 (A00158) 0.988420 0.971525 AIR MIX (A00159) 0.987898 0.987966 MB-VR Standard (A00180) 0.984150 0.985794 MB-AE 90 (A00181) 0.989926 0.995668 DARAVAIR 1000 (A00215 0.984172 0.994020 Secton 6A (A00226) 0.990093 0.997211 Sika Air (A00474) N/A 0.992551 Catexol AE 260 (A00398) 0.981497 0.993976 By comparing the values from both 17 hour and 24 hour studies, it is observed that the samples that were allowed a longer drying time had overall higher average correlations values. It does not appear that the burning of the samples affected the test since the correlations were still very high. It is worth noting that for batch III, that AEA-92 had inconsistencies in the scans, probably due to moisture in the sample. This scan would have to be repeated in order to assure accurate results. Because of the two discrepancies in batch III, both from AEA-92 and the incompletion of Sika Air, omitting the entire batch III can provide a better comparison, until those values can be completed.
Overall, the average correlation of the 24 hour tests remains higher than the 17 hour tests. Only AEA-92 and AIR MIX show the opposite, however they are extremely close to each other. Even small factors can alter the results significantly. These factors include moisture, scale calibration, sample configuration, and spillage. If the ratio of any component in the sample disk is off, it could skew the scan data. More testing would have to be done to prove these results.
36
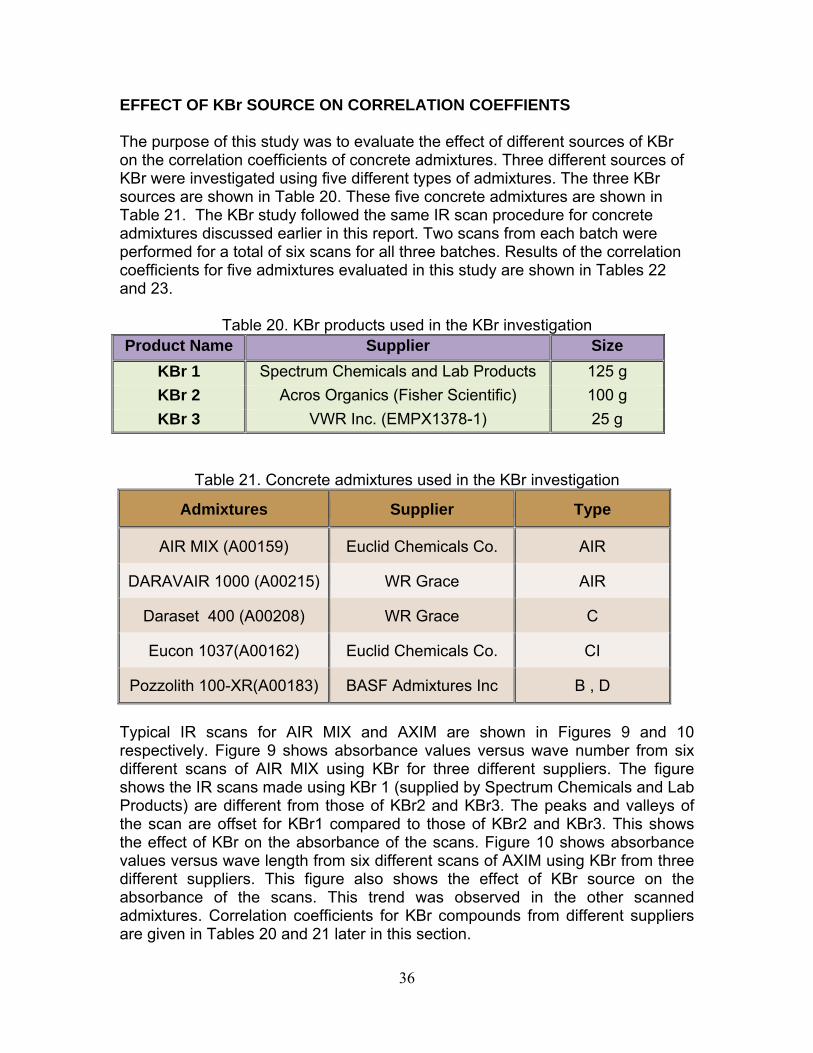
EFFECT OF KBr SOURCE ON CORRELATION COEFFIENTS The purpose of this study was to evaluate the effect of different sources of KBr on the correlation coefficients of concrete admixtures. Three different sources of KBr were investigated using five different types of admixtures. The three KBr sources are shown in Table 20. These five concrete admixtures are shown in Table 21. The KBr study followed the same IR scan procedure for concrete admixtures discussed earlier in this report. Two scans from each batch were performed for a total of six scans for all three batches. Results of the correlation coefficients for five admixtures evaluated in this study are shown in Tables 22 and 23.
Table 20. KBr products used in the KBr investigation Product Name Supplier Size
KBr 1 Spectrum Chemicals and Lab Products 125 g KBr 2 Acros Organics (Fisher Scientific) 100 g KBr 3 VWR Inc. (EMPX1378-1) 25 g
Table 21. Concrete admixtures used in the KBr investigation
Admixtures Supplier Type
AIR MIX (A00159) Euclid Chemicals Co. AIR
DARAVAIR 1000 (A00215) WR Grace AIR
Daraset 400 (A00208) WR Grace C
Eucon 1037(A00162) Euclid Chemicals Co. CI
Pozzolith 100-XR(A00183) BASF Admixtures Inc B , D
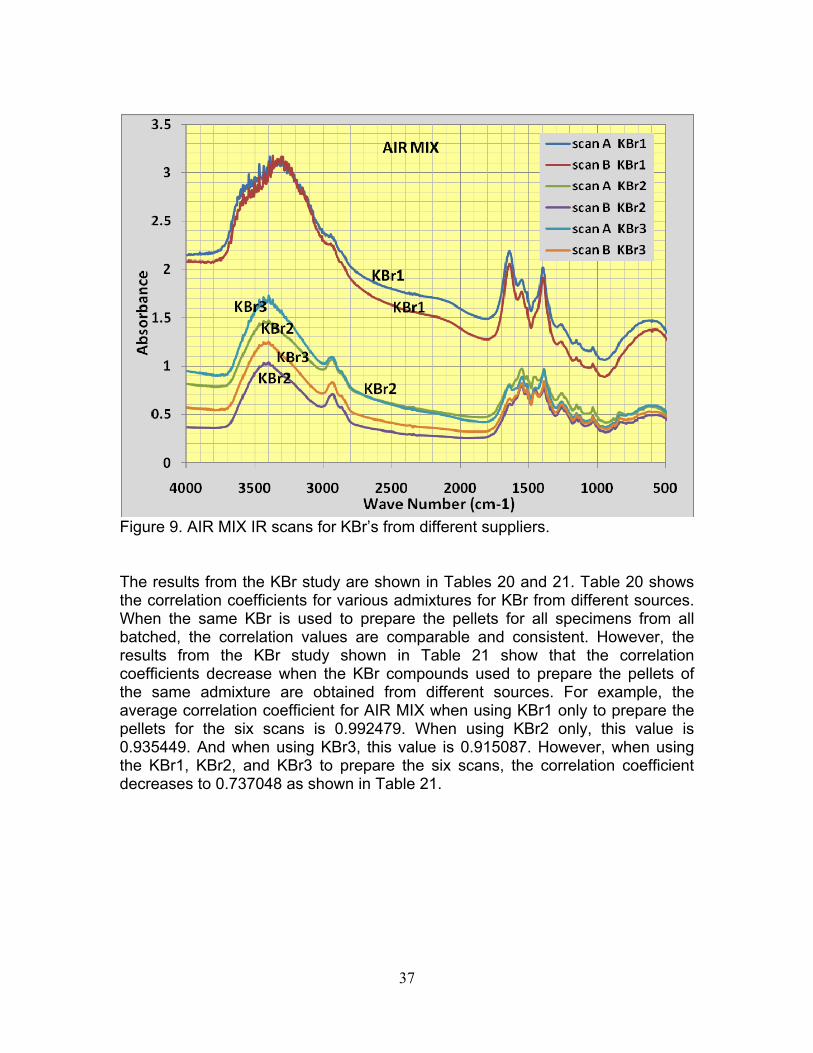
Typical IR scans for AIR MIX and AXIM are shown in Figures 9 and 10 respectively. Figure 9 shows absorbance values versus wave number from six different scans of AIR MIX using KBr for three different suppliers. The figure shows the IR scans made using KBr 1 (supplied by Spectrum Chemicals and Lab Products) are different from those of KBr2 and KBr3. The peaks and valleys of the scan are offset for KBr1 compared to those of KBr2 and KBr3. This shows the effect of KBr on the absorbance of the scans. Figure 10 shows absorbance values versus wave length from six different scans of AXIM using KBr from three different suppliers. This figure also shows the effect of KBr source on the absorbance of the scans. This trend was observed in the other scanned admixtures. Correlation coefficients for KBr compounds from different suppliers are given in Tables 20 and 21 later in this section.
37
Figure 9. AIR MIX IR scans for KBr’s from different suppliers. The results from the KBr study are shown in Tables 20 and 21. Table 20 shows the correlation coefficients for various admixtures for KBr from different sources. When the same KBr is used to prepare the pellets for all specimens from all batched, the correlation values are comparable and consistent. However, the results from the KBr study shown in Table 21 show that the correlation coefficients decrease when the KBr compounds used to prepare the pellets of the same admixture are obtained from different sources. For example, the average correlation coefficient for AIR MIX when using KBr1 only to prepare the pellets for the six scans is 0.992479. When using KBr2 only, this value is 0.935449. And when using KBr3, this value is 0.915087. However, when using the KBr1, KBr2, and KBr3 to prepare the six scans, the correlation coefficient decreases to 0.737048 as shown in Table 21.
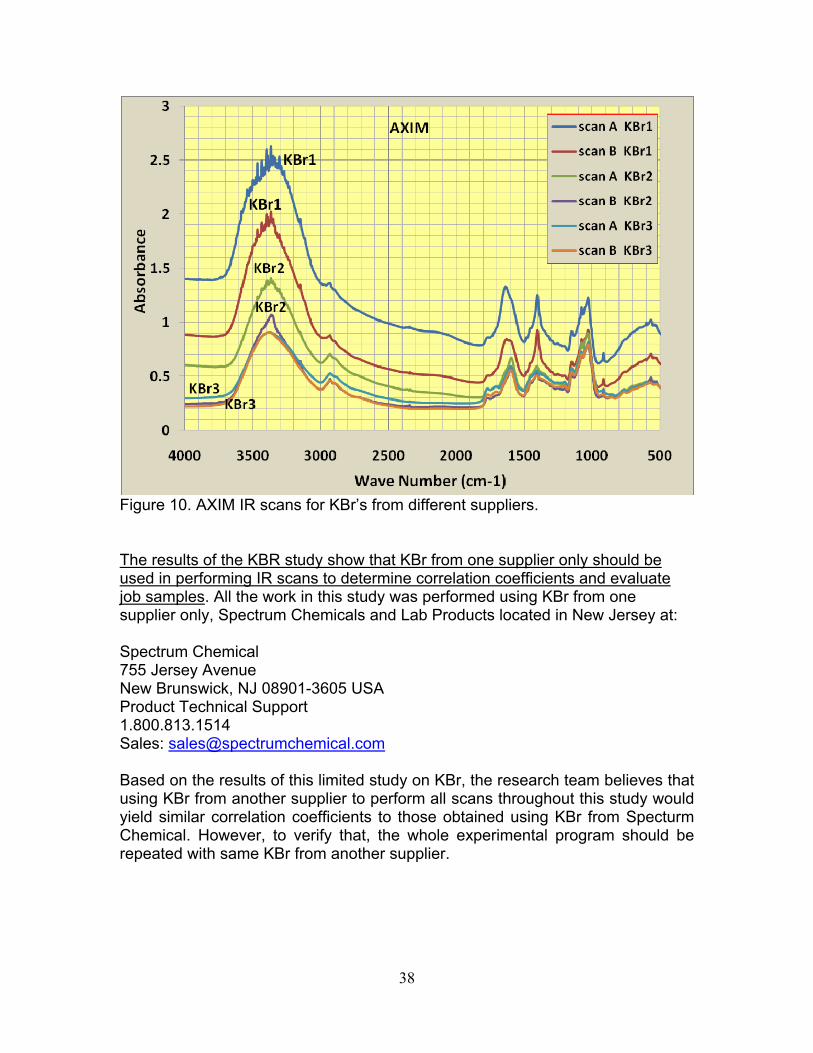
38
Figure 10. AXIM IR scans for KBr’s from different suppliers. The results of the KBR study show that KBr from one supplier only should be used in performing IR scans to determine correlation coefficients and evaluate job samples. All the work in this study was performed using KBr from one supplier only, Spectrum Chemicals and Lab Products located in New Jersey at: Spectrum Chemical 755 Jersey Avenue New Brunswick, NJ 08901-3605 USA Product Technical Support 1.800.813.1514 Sales: [email protected] Based on the results of this limited study on KBr, the research team believes that using KBr from another supplier to perform all scans throughout this study would yield similar correlation coefficients to those obtained using KBr from Specturm Chemical. However, to verify that, the whole experimental program should be repeated with same KBr from another supplier.
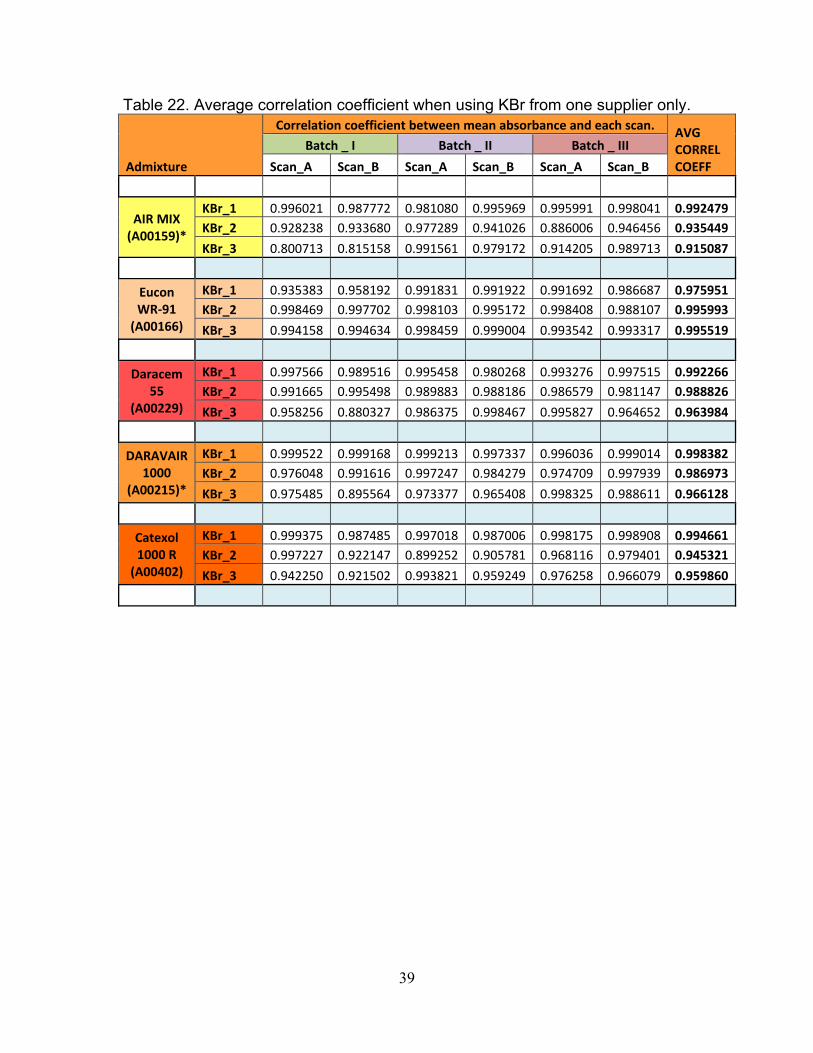
39
Table 22. Average correlation coefficient when using KBr from one supplier only.
Admixture
Correlation coefficient between mean absorbance and each scan. AVG CORREL COEFF
Batch _ I Batch _ II Batch _ III
Scan_A Scan_B Scan_A Scan_B Scan_A Scan_B
AIR MIX (A00159)*
KBr_1 0.996021 0.987772 0.981080 0.995969 0.995991 0.998041 0.992479 KBr_2 0.928238 0.933680 0.977289 0.941026 0.886006 0.946456 0.935449
KBr_3 0.800713 0.815158 0.991561 0.979172 0.914205 0.989713 0.915087
Eucon WR‐91 (A00166)
KBr_1 0.935383 0.958192 0.991831 0.991922 0.991692 0.986687 0.975951 KBr_2 0.998469 0.997702 0.998103 0.995172 0.998408 0.988107 0.995993
KBr_3 0.994158 0.994634 0.998459 0.999004 0.993542 0.993317 0.995519
Daracem 55
(A00229)
KBr_1 0.997566 0.989516 0.995458 0.980268 0.993276 0.997515 0.992266 KBr_2 0.991665 0.995498 0.989883 0.988186 0.986579 0.981147 0.988826
KBr_3 0.958256 0.880327 0.986375 0.998467 0.995827 0.964652 0.963984
DARAVAIR 1000
(A00215)*
KBr_1 0.999522 0.999168 0.999213 0.997337 0.996036 0.999014 0.998382 KBr_2 0.976048 0.991616 0.997247 0.984279 0.974709 0.997939 0.986973
KBr_3 0.975485 0.895564 0.973377 0.965408 0.998325 0.988611 0.966128
Catexol 1000 R (A00402)
KBr_1 0.999375 0.987485 0.997018 0.987006 0.998175 0.998908 0.994661 KBr_2 0.997227 0.922147 0.899252 0.905781 0.968116 0.979401 0.945321
KBr_3 0.942250 0.921502 0.993821 0.959249 0.976258 0.966079 0.959860
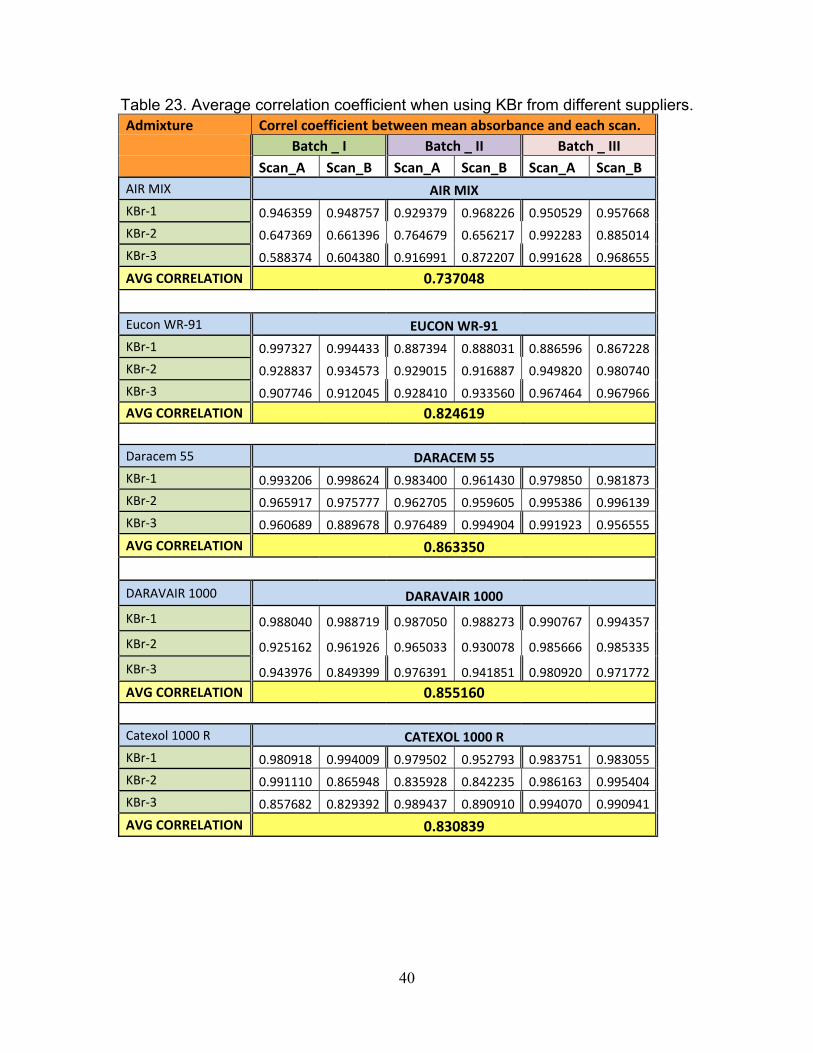
40
Table 23. Average correlation coefficient when using KBr from different suppliers. Admixture Correl coefficient between mean absorbance and each scan. Batch _ I Batch _ II Batch _ III Scan_A Scan_B Scan_A Scan_B Scan_A Scan_B AIR MIX AIR MIX KBr‐1 0.946359 0.948757 0.929379 0.968226 0.950529 0.957668
KBr‐2 0.647369 0.661396 0.764679 0.656217 0.992283 0.885014
KBr‐3 0.588374 0.604380 0.916991 0.872207 0.991628 0.968655
AVG CORRELATION 0.737048 Eucon WR‐91 EUCON WR‐91 KBr‐1 0.997327 0.994433 0.887394 0.888031 0.886596 0.867228
KBr‐2 0.928837 0.934573 0.929015 0.916887 0.949820 0.980740
KBr‐3 0.907746 0.912045 0.928410 0.933560 0.967464 0.967966
AVG CORRELATION 0.824619 Daracem 55 DARACEM 55 KBr‐1 0.993206 0.998624 0.983400 0.961430 0.979850 0.981873
KBr‐2 0.965917 0.975777 0.962705 0.959605 0.995386 0.996139
KBr‐3 0.960689 0.889678 0.976489 0.994904 0.991923 0.956555
AVG CORRELATION 0.863350
DARAVAIR 1000 DARAVAIR 1000
KBr‐1 0.988040 0.988719 0.987050 0.988273 0.990767 0.994357
KBr‐2 0.925162 0.961926 0.965033 0.930078 0.985666 0.985335
KBr‐3 0.943976 0.849399 0.976391 0.941851 0.980920 0.971772
AVG CORRELATION 0.855160 Catexol 1000 R CATEXOL 1000 R KBr‐1 0.980918 0.994009 0.979502 0.952793 0.983751 0.983055
KBr‐2 0.991110 0.865948 0.835928 0.842235 0.986163 0.995404
KBr‐3 0.857682 0.829392 0.989437 0.890910 0.994070 0.990941
AVG CORRELATION 0.830839
41
CONCLUSIONS Based on the results of this study, the following conclusions can be drawn:
1. Acceptable correlation coefficients were established based on 12 scans from several batches for each concrete admixture.
2. The recommended correlation coefficients for concrete admixtures are the average correlation coefficients using 12 scans of each.
3. The use of 12 scans per admixture compared to 6 scans showed that the
correlation coefficients increased slightly. Although using 6 scans per admixture seems to be sufficient, having more scans will give more confidence and reliability to the established correlation coefficients.
4. The recommended correlation coefficients for structural steel paints are
the average correlation coefficients using 6 scans of each.
5. The correlation coefficients for structural steel paints were more consistent and had less variation compared to those of concrete admixtures.
6. The drying time to achieve acceptable moisture content not adverse to IR
scans varied for different admixtures. For some admixtures, 10 hour drying was sufficient while others required 17 hours. The ASTM required 17 hour drying time was maintained throughout this study.
7. Air-entraining admixtures needed more drying time than other admixtures.
Results of this study showed that 24 hour drying time for air-entraining admixtures may be beneficial to achieve reliable correlation coefficients. When increasing the drying period to 24 hours for non air-entraining admixtures, they could possibly be subjected to overdrying and this could affect the material’s consistency and alter scan results
8. The KBr used in sample preparation has a significant effect on the IR
scans. It is very important to use the same KBr material for IR scan analysis and comparisons. Results from this study showed that using KBr from different sources has reduced the correlation coefficients and will lead to erroneous interpretations and acceptability limits.
42
RECOMMENDATIONS Based on the results of this study and the conclusions presented above, the following recommendations are made:
1. The same KBr should be used throughout the IR scan analysis and correlation evaluation process.
2. The percentage of KBr material used in sample preparation compared to the admixture is significant and could skew the interpretation of the IR scan results. Using less KBr may improve the quality of the scans but this need to be investigated.
3. Established correlation coefficients need to be updated whenever there is
a change in the manufacturer production or chemical composition of the concrete admixtures or the steel paints.
Appendix A How to check job samples First, follow the Rutgers IR Scan Procedure for Concrete Admixtures and one for Steel Paints explained earlier in this report. Once the pellet has been scanned, complete the following steps:
1. In the spectrometer computer, change the graph so that it records absorbance versus wave number.
2. Save the scan as an ascii file 3. Open the .asc file in notepad and save only the absorbance numbers into
the Rutgers Excel spreadsheet under the Job Scans tab in the appropriate column.
4. In the Excel spreadsheet, check the Correlation ceoff._all batch tab to see if the job sample has passed.
5. Repeat these steps for each of the three scans of the job sample. 6. Only one out of the three scans needs to pass in order for the admixture to
be accepted. How to add/update admixtures library In order to add an admixture to the library or update an existing admixture in the library, the following steps must be followed:
43
1. Contact manufacturer/supplier to obtain three separate batches over a period of two to three months between batches
2. Perform four IR scans from each batch of the admixture following the Rutgers IR Scan Procedure for Concrete Admixtures
3. All scans must be saved as absorbance versus wave number in .asc file format
4. Open the asc file in notepad and save only the absorbance values into the Rutgers excel spreadsheet in the appropriate tab and the correct column
5. When adding an admixture to the library, one will have to add extra four columns to the first, second, and third batch tabs for the new admixture.
6. Also, another column must be added into the average_ALL BATCH tab so that all the numbers from the first, second, and third batches are averaged in the column N
7. Then add one more row to the Correlation ceoff._all batch tab and make sure all of the cells in the row are programmed correctly
REFERENCES
1. Coates, John, “Interpretation of Infrared Spectra, A Practical Approach, Encyclopedia of Analytical Chemistry.10815-10837, 2000.
2. Smith, Brian C., “Fundamentals of Fourier Transform Infrared Spectroscopy.” PP. 1-11, 1996.
3. Illinois DOT Bureau of Materials and Physical Research, Standard Specifications for Road and Bridge Construction, Section 1021, May 2011.
4. J. D. J. Ingle and S. R. Crouch, Spectrochemical Analysis, Prentice Hall, New Jersey (1988)
5. California Department of Transportation, Test Methods for Concrete Admixtures, Division of Engineering Services, January 2007.
6. Louisiana DOT, Method for Test for Infrared Spectrophotometric Analysis, Memo DOTD TR610M-94, 1994.