Embed Size (px)
Citation preview
Infrared near-field spectroscopy of trace explosives using an external cavity quantum
cascade laser
Ian M. Craig,1,2 Matthew S. Taubman,2 A. Scott Lea,1 Mark C. Phillips,2,* Erik E. Josberger,3,4 and Markus B. Raschke3
1Environmental Molecular Sciences Laboratory, Pacific Northwest National Laboratory, 902 Battelle Boulevard, Richland, WA 99354, USA
2Pacific Northwest National Laboratory, 902 Battelle Boulevard, Richland, WA 99354, USA 3 Department of Physics, Department of Chemistry, and JILA, University of Colorado, Boulder, CO 80303, USA
4Currently with the Department of Electrical Engineering, University of Washington, Seattle, WA 98195, USA *[email protected]
Abstract: Utilizing a broadly-tunable external cavity quantum cascade laser for scattering-type scanning near-field optical microscopy (s-SNOM), we measure infrared spectra of particles of explosives by probing characteristic nitro-group resonances in the 7.1–7.9 µm wavelength range. Measurements are presented with spectral resolution of 0.25 cm−1, spatial resolution of 25 nm, sensitivity better than 100 attomoles, and at a rapid acquisition time of 90 s per spectrum. We demonstrate high reproducibility of the acquired s-SNOM spectra with very high signal-to-noise ratios and relative noise of <0.02 in self-homodyne detection.
©2013 Optical Society of America
OCIS codes: (180.4243) Near-field microscopy; (140.5965) Semiconductor lasers, quantum cascade; (160.4890) Organic materials; (310.6628) Subwavelength structures, nanostructures; (240.6490) Spectroscopy, surface; (300.6340) Spectroscopy, infrared.
References and links
1. R. N. Clark and T. L. Roush, “Reflectance spectroscopy: Quantitative analysis techniques for remote sensing applications,” J. Geophys. Res. 89(B7), 6329–6340 (1984).
2. J. D. Suter, B. Bernacki, and M. C. Phillips, “Spectral and angular dependence of mid-infrared diffuse scattering from explosives residues for standoff detection using external cavity quantum cascade lasers,” Appl. Phys. B 108(4), 965–974 (2012).
3. M. C. Phillips, J. D. Suter, B. E. Bernacki, and T. J. Johnson, “Challenges of infrared reflective spectroscopy of solid-phase explosives and chemicals on surfaces,” Proc. SPIE 8358, 83580T (2012).
4. F. Keilmann and R. Hillenbrand, “Near-field microscopy by elastic light scattering from a tip,” Philos Trans A Math Phys Eng Sci 362(1817), 787–805 (2004).
5. S. Amarie and F. Keilmann, “Broadband-infrared assessment of phonon resonance in scattering-type near-field microscopy,” Phys. Rev. B 83(4), 045404 (2011).
6. S. Amarie and F. Keilmann, “Erratum: Broadband-infrared assessment of phonon resonance in scattering-type near-field microscopy,” Phys. Rev. B 84, 199904(E) (2011).
7. Z. Fei, G. O. Andreev, W. Z. Bao, L. M. Zhang, A. S McLeod, C. Wang, M. K. Stewart, Z. Zhao, G. Dominguez, M. Thiemens, M. M. Fogler, M. J. Tauber, A. H. Castro-Neto, C. N. Lau, F. Keilmann, and D. N. Basov, “Infrared nanoscopy of Dirac plasmons at the graphene-SiO₂ interface,” Nano Lett. 11(11), 4701–4705 (2011).
8. M. Zhang, G. O. Andreev, Z. Fei, A. S. McLeod, G. Dominguez, M. Thiemens, A. H. Castro-Neto, D. N. Basov, and M. M. Fogler, “Near-field spectroscopy of silicon dioxide thin films,” Phys. Rev. B 85(7), 075419 (2012).
9. A. Cvitkovic, N. Ocelic, and R. Hillenbrand, “Analytical model for quantitative prediction of material contrasts in scattering-type near-field optical microscopy,” Opt. Express 15(14), 8550–8565 (2007).
10. X. G. Xu and M. B. Raschke, “Near-field infrared vibrational dynamics and tip-enhanced decoherence,” Nano Lett. 13(4), 1588–1595 (2013).
11. M. B. Raschke, L. Molina, T. Elsaesser, D. H. Kim, W. Knoll, and K. Hinrichs, “Apertureless near-field vibrational imaging of block-copolymer nanostructures with ultrahigh spatial resolution,” ChemPhysChem 6(10), 2197–2203 (2005).
12. J. Aizpurua, T. Taubner, F. J. García de Abajo, M. Brehm, and R. Hillenbrand, “Substrate-enhanced infrared near-field spectroscopy,” Opt. Express 16(3), 1529–1545 (2008).
#195904 - $15.00 USD Received 5 Sep 2013; revised 1 Nov 2013; accepted 11 Nov 2013; published 4 Dec 2013(C) 2013 OSA 16 December 2013 | Vol. 21, No. 25 | DOI:10.1364/OE.21.030401 | OPTICS EXPRESS 30401
13. B. Hauer, A. P. Engelhardt, and T. Taubner, “Quasi-analytical model for scattering infrared near-field microscopy on layered systems,” Opt. Express 20(12), 13173–13188 (2012).
14. A. A. Govyadinov, I. Amenabar, F. Huth, P. S. Carney, and R. Hillenbrand, “Quantitative measurement of local infrared absorption and dielectric function with tip-enhanced near-field microscopy,” J. Phys. Chem. Lett. 4(9), 1526–1531 (2013).
15. F. Huth, A. Govyadinov, S. Amarie, W. Nuansing, F. Keilmann, and R. Hillenbrand, “Nano-FTIR absorption spectroscopy of molecular fingerprints at 20 nm spatial resolution,” Nano Lett. 12(8), 3973–3978 (2012).
16. X. J. G. Xu, M. Rang, I. M. Craig, and M. B. Raschke, “Pushing the sample-size limit of infrared vibrational nanospectroscopy: from monolayer toward single molecule sensitivity,” J. Phys. Chem. Lett. 3(13), 1836–1841 (2012).
17. H. A. Bechtel, R. L. Olmon, E. A. Muller, B. Pollard, M. C. Martin, and M. B. Raschke, “Ultra-broadband infrared nano-spectroscopy with a synchrotron source,” In preparation.
18. P. Hermann, A. Hoehl, P. Patoka, F. Huth, E. Rühl, and G. Ulm, “Near-field imaging and nano-Fourier-transform infrared spectroscopy using broadband synchrotron radiation,” Opt. Express 21(3), 2913–2919 (2013).
19. L. Gomez, R. Bachelot, A. Bouhelier, G. P. Widerrecht, S. Hui Chang, S. K. Gray, F. Hua, S. Jeon, J. A. Rogers,
M. E. Castro, S. Blaize, I. Stefanon, G. Lerondel, and P. Royer, “Apertureless scanning near-eld optical
microscopy: a comparison between homodyne and heterodyne approaches,” J. Opt. Soc. Am. B 23(5), 823–833 (2006).
20. A. Hugi, R. Maulini, and J. Faist, “External cavity quantum cascade laser,” Semicond. Sci. Technol. 25(8), 083001 (2010).
21. F. Lu and M. A. Belkin, “Infrared absorption nano-spectroscopy using sample photoexpansion induced by tunable quantum cascade lasers,” Opt. Express 19(21), 19942–19947 (2011).
22. I. M. Craig, M. C. Phillips, M. S. Taubman, E. E. Josberger, and M. B. Raschke, “Infrared scattering scanning near-field optical microscopy using an external cavity quantum cascade laser for nanoscale chemical imaging and spectroscopy of explosive residues,” Proc. SPIE 8631, 863110 (2013).
23. A. Lewis, M. Isaacson, A. Harootunian, and A. Muray, “Development of a 500 Å spatial resolution light microscope: I. light is efficiently transmitted through λ/16 diameter apertures,” Ultramicroscopy 13(3), 227–231 (1984).
24. D. W. Pohl, W. Denk, and M. Lanz, “Optical stethoscopy: Image recording with resolution λ/20,” Appl. Phys. Lett. 44(7), 651–653 (1984).
25. A. Dazzi, C. B. Prater, Q. Hu, D. B. Chase, J. F. Rabolt, and C. Marcott, “AFM-IR: combining atomic force microscopy and infrared spectroscopy for nanoscale chemical characterization,” Appl. Spectrosc. 66(12), 1365–1384 (2012).
26. D. A. Schmidt, I. Kopf, and E. Brundermann, “A matter of scale: from far-field microscopy to near-field nanoscopy,” Laser Photonics Rev. 6(3), 296–332 (2012).
27. J. N. Walford, J. A. Porto, R. Carminati, J. J. Greffet, P. M. Adam, S. Hudlet, J. L. Bijeon, A. Stashkevich, and P. Royer, “Influence of tip modulation on image formation in scanning near-field optical microscopy,” J. Appl. Phys. 89(9), 5159–5169 (2001).
28. R. Fikri, T. Grosges, and D. Barchiesi, “Apertureless scanning near-field optical microscopy: numerical modeling of the lock-in detection,” Opt. Commun. 232(1-6), 15–23 (2004).
29. S. Diziain, D. Barchiesi, T. Grosges, and P. M. Adam, “Recovering of the apertureless scanning near-field optical microscopy signal through a lock-in detection,” Appl. Phys. B 84(1-2), 233–238 (2006).
30. N. Ocelic, A. Huber, and R. Hillenbrand, “Pseudoheterodyne detection for background-free near-field spectroscopy,” Appl. Phys. Lett. 89(10), 101124 (2006).
31. S. Aubert, A. Bruyant, S. Blaize, R. Bachelot, G. Lerondel, S. Hudlet, and P. Royer, “Analysis of the interferometric effect of the background light in apertureless scanning near-field optical microscopy,” J. Opt. Soc. Am. B 20(10), 2117–2124 (2003).
32. R. Esteban, R. Vogelgesang, and K. Kern, “Apertureless near-field optical microscopy: Differences between heterodyne interferometric and non-interferometric images,” Ultramicroscopy 111(9-10), 1469–1474 (2011).
33. M. C. Phillips, T. L. Myers, M. D. Wojcik, and B. D. Cannon, “External cavity quantum cascade laser for quartz tuning fork photoacoustic spectroscopy of broad absorption features,” Opt. Lett. 32(9), 1177–1179 (2007).
34. M. C. Phillips and M. S. Taubman, “Intracavity sensing via compliance voltage in an external cavity quantum cascade laser,” Opt. Lett. 37(13), 2664–2666 (2012).
35. M. C. Phillips and B. E. Bernacki, “Hyperspectral microscopy of explosives particles using an external cavity quantum cascade laser,” Opt. Eng. 52(6), 061302 (2013).
36. S. W. Sharpe, T. J. Johnson, R. L. Sams, P. M. Chu, G. C. Rhoderick, and P. A. Johnson, “Gas-phase databases for quantitative infrared spectroscopy,” Appl. Spectrosc. 58(12), 1452–1461 (2004).
37. H. U. Yang, E. Hebestreit, E. E. Josberger, and M. B. Raschke, “A cryogenic scattering-type scanning near-field optical microscope,” Rev. Sci. Instrum. 84(2), 023701 (2013).
38. M. B. Raschke and C. Lienau, “Apertureless near-field optical microscopy: Tip-sample coupling in elastic light scattering,” Appl. Phys. Lett. 83(24), 5089–5091 (2003).
39. M. C. Phillips, I. M. Craig, and T. A. Blake, “Reflection-absorption infrared spectroscopy of thin films using an external cavity quantum cascade laser,” Proc. SPIE 8631, 86310C (2013).
#195904 - $15.00 USD Received 5 Sep 2013; revised 1 Nov 2013; accepted 11 Nov 2013; published 4 Dec 2013(C) 2013 OSA 16 December 2013 | Vol. 21, No. 25 | DOI:10.1364/OE.21.030401 | OPTICS EXPRESS 30402
40. N. Yu, L. Diehl, E. Cubukcu, D. Bour, S. Corzine, G. Höfler, A. K. Wojcik, K. B. Crozier, A. Belyanin, and F. Capasso, “Coherent coupling of multiple transverse modes in quantum cascade lasers,” Phys. Rev. Lett. 102(1), 013901 (2009).
41. B. Knoll and F. Keilmann, “Enhanced dielectric contrast in scattering-type scanning near-field optical microscopy,” Opt. Commun. 182(4-6), 321–328 (2000).
42. M. A. Ordal, R. J. Bell, R. W. Alexander, Jr., L. L. Long, and M. R. Querry, “Optical properties of fourteen metals in the infrared and far infrared: Al, Co, Cu, Au, Fe, Pb, Mo, Ni, Pd, Pt, Ag, Ti, V, and W,” Appl. Opt. 24(24), 4493–4499 (1985).
43. F. Pristera, M. Halik, A. Castelli, and W. Fredericks, “Analysis of explosives using infrared spectroscopy,” Anal. Chem. 32(4), 495–508 (1960).
44. R. A. Cendejas, M. C. Phillips, T. L. Myers, and M. S. Taubman, “Single-mode, narrow-linewidth external cavity quantum cascade laser through optical feedback from a partial-reflector,” Opt. Express 18(25), 26037–26045 (2010).
45. A. Röseler, “Spectroscopic Infrared Ellipsometry,” in Handbook of Ellipsometry (Materials Science and Process Technology), H. Tompkins and E. A. Irene, eds. (William Andrew, 2006).</edb>
46. E. H. Korte and A. Röseler, “Infrared reststrahlen revisited: commonly disregarded optical details related to n<1,” Anal. Bioanal. Chem. 382(8), 1987–1992 (2005).</jrn>
47. A. E. Miroshnichenko, S. Flach, and Y. S. Kivshar, “Fano resonances in nanoscale structures,” Rev. Mod. Phys. 82(3), 2257–2298 (2010).</jrn>
48. R. J. Karpowicz and T. B. Brill, “Comparison of the molecular-structure of hexahydro-1,3,5-trinitro-s-triazine in the vapor, solution, and solid-phases,” J. Phys. Chem. 88(3), 348–352 (1984).</jrn>
49. P. Torres, L. Mercado, I. Cotte, S. P. Hernández, N. Mina, A. Santana, R. T. Chamberlain, R. Lareau, and M. E. Castro, “Vibrational spectroscopy study of β and α RDX deposits,” J. Phys. Chem. B 108(26), 8799–8805 (2004).</jrn>
50. I. G. Goldberg and J. A. Swift, “New insights into the metastable beta form of RDX,” Cryst. Growth Des. 12(2), 1040–1045 (2012).</jrn>
1. Introduction
Mid-infrared (MIR) spectroscopy in the 3-25 µm spectral region provides valuable information about chemical composition and structure of both gas-phase and condensed-phase materials. For condensed-phase materials, characterization of the optical properties via the complex refractive index or dielectric function is necessary for interpreting and modeling far-field spectral properties such as transmittance and reflectance. In applications such as optical detection of small particles or residues of explosives, variability in the measured spectra must be characterized to design robust detection algorithms [1–3]. Far-field spectral measurements such as infrared ellipsometry are limited by diffraction to a spatial resolution on the order of the wavelength of the illumination light, and measure the spatially-averaged optical properties of materials that can be prepared as uniform thin-films or bulk materials. However, many materials of interest contain sub-micron spatial structure, or exist as small particles or non-uniform residues, making infrared ellipsometry of limited practical use. In addition, the spatial structure also affects the local spectral response, such as through variations in crystal structure and orientation.
Apertureless scattering-type scanning near-field optical microscopy (s-SNOM or alternatively s-SNIM in the case of IR light) provides a technique to measure spectral properties at sub-wavelength spatial scales. s-SNOM utilizes the antenna properties of a metallic atomic force microscope (AFM) tip to create a localized optical field enhancement, shrinking the spatial limits of the interaction from the wavelength of light to the radius of the end of the tip [4]. In the MIR spectral region, s-SNOM imaging and spectroscopy has been applied to a wide range of systems such as silicon dioxide [5–8], silicon carbide [5, 6, 9], polytetrafluoroethylene (PTFE) [10], polystyrene (PS) [11] and polymethylmethacrylate (PMMA) [12, 13]. These materials served as model systems due to their characteristic vibrational resonances. Furthermore, they can be made into high-quality, uniform macroscopic films and measured using spectroscopic ellipsometry to independently determine the complex index of refraction. A key goal of s-SNOM spectroscopy is the quantitative determination of the complex index of refraction and dielectric function of the material under investigation, which can be performed for structurally well characterized materials, weak tip-sample coupling, and with weakly dispersive vibrational resonances [14]. However, accurate
#195904 - $15.00 USD Received 5 Sep 2013; revised 1 Nov 2013; accepted 11 Nov 2013; published 4 Dec 2013(C) 2013 OSA 16 December 2013 | Vol. 21, No. 25 | DOI:10.1364/OE.21.030401 | OPTICS EXPRESS 30403
determination of refractive index from measured s-SNOM spectra remains a challenge in general for many materials of interest, especially those in the form of nonuniform thin films or particles, or materials with strongly dispersive infrared absorption resonances. Explosive residues are one such class of materials.
To achieve high sensitivity, s-SNOM imaging and spectroscopy instruments require a MIR source with high spectral irradiance and broad spectral coverage. This source can be provided by, e.g., a femtosecond pulsed laser using difference frequency generation (DFG) [15, 16], or coherent synchrotron IR radiation [17, 18]. In these cases, the s-SNOM spectrum is measured interferometrically with a Michelson [15, 16] or Mach-Zehnder [19] interferometer, similar to traditional FTIR spectroscopy. These IR sources provide broad wavelength coverage and the capability for time-resolved studies; however, these systems have a large footprint, high cost, and comparatively low output power. The limited spectral radiance provided by these broadband sources often results in long s-SNOM spectral acquisition times, with limited signal-to-noise ratio (SNR), especially for measurements at high spectral resolution. In addition, single wavelength rapid spatial scanning, as desirable for qualitative s-SNOM vibrational contrast sample surveying, is not readily possible with these sources.
Broadly tunable external cavity quantum cascade lasers (ECQCLs) provide an alternative laser source for MIR near-field imaging and nano-spectroscopy, with high output power, narrow linewidth, wide spectral coverage, low laser noise, compact footprint, and simple operation [20]. ECQCLs have previously been used to acquire s-SNOM images at discrete wavelengths, thereby forming a multi-spectral image [8]. In this manuscript, we demonstrate an approach in which s-SNOM spectra are acquired using a tunable ECQCL at fixed sample spatial locations, probing a region of the sample with dimensions on the order of the AFM tip radius (25 nm). Using this technique, we measure spectra at a high density of wavelengths, resolving fine spectral details and variations. This method allows high spectral resolution, essentially continuous s-SNOM spectra to be measured in a few minutes, with very low spectral noise and correspondingly high SNR. We note that ECQCLs have been used similarly in near-field photo-thermal expansion spectroscopy and imaging to measure infrared absorption spectra [21].
We present results from using an ECQCL to measure s-SNOM spectra over the range of 1260-1400 cm−1 (encompassing the NO2 symmetric stretch fingerprint region), with 0.25 cm−1 spectral resolution and 25 nm spatial resolution, of micro-particles of the explosives N-methyl-N,2,4,6-tetranitroaniline (tetryl), 1,3,5-trinitroperhydro-1,3,5-triazine (RDX), and pentaerythritol tetranitrate (PETN) deposited onto gold substrates [22]. Spectra with high SNR are obtained for high-resolution scans acquired in times as low as 90 seconds. We demonstrate that for these samples of small and disperse particles on a metal substrate, the self-homodyne measurement configuration reproducibly measures the real part of the s-SNOM near-field response, through normalization of the spectral response of the sample to that of gold. We observe enhanced scattering near spectral regions corresponding to strong oscillators with highly dispersive dielectric constants, which results in highly asymmetric line shapes in the s-SNOM spectra, but which nonetheless show good correspondence with far-field reflectivity measurements.
2. Self-homodyne s-SNOM measurement principles
The basic principles of s-SNOM have been described previously [23–26]; however, due to the measurement configuration used in our experiments, it is useful to review some aspects of the technique. s-SNOM is inherently an interferometric measurement technique, and can in principle probe both the real and imaginary parts of a sample’s complex dielectric function [14]. The electric field scattered from the tip-sample interaction region contains both the near-field signal of interest Esig and a larger background field Ebg that interferes coherently with the near-field signal at the detector, leading to a self-homodyne effect. If we define a relative
#195904 - $15.00 USD Received 5 Sep 2013; revised 1 Nov 2013; accepted 11 Nov 2013; published 4 Dec 2013(C) 2013 OSA 16 December 2013 | Vol. 21, No. 25 | DOI:10.1364/OE.21.030401 | OPTICS EXPRESS 30404
scattering coefficient σ = E/Einc, where E is the scattered field and Einc is the incident field, then at the detector, the signal is proportional to [19]:
2 2
det bg sig bg sig bg sig,ω | σ ω | | σ ,ω | 2 | σ ω || σ ,ω) | cos[( ) ( ) ( ) ( ) ( ( ) ( )].φ ω φ ,ωI Ω ∝ + Ω + Ω − Ω (1)
In this expression, φbg and φsig are the optical phase of the background and signal scattering coefficient, respectively, and in general, all quantities are functions of the optical frequency ω. The first term in this expression contains no near-field spectral information, and is removed using lock-in detection at harmonics of the tip oscillation frequency Ω, exploiting the nonlinear near-field interaction potential between the tip and the sample [27–29]. The second term, arising solely from the near-field scattering, is much smaller than the third term, and can be neglected. The third term results from the homodyne interference between the near-field signal and the background field scattered from the tip, and is sensitive to the relative phase between these two fields. Note that because both σbg and σsig are normalized to the incident field, the optical phase of the input field cancels in the homodyne interference term.
Measurement of the s-SNOM signal in this self-homodyne configuration is sensitive to the relative phase between the near-field signal and background field [19, 30], and in many cases the unknown phase of the background field leads to difficulties interpreting s-SNOM signals, which is especially problematic in imaging applications at fixed wavelengths [31]. In addition, the signal phase cannot be uniquely determined from a single self-homodyne measurement. Therefore, many s-SNOM experiments are performed using interferometric homodyne or heterodyne configurations, in which the scattered light from the tip is interfered with a reference field of controlled/modulated phase in an interferometer [19, 30, 32]. The interferometric methods allow measurement of both the magnitude and phase of the near-field signal, and can enhance the SNR in the case of weak signals scattered from the tip. However, the interferometric techniques increase the complexity of the experimental setup, are sensitive to mechanical instabilities, mechanical noise, and in particular to phase and amplitude noise of the laser. In addition, the interferometric techniques increase acquisition times because the phase of the reference field must be varied in addition to the spatial and spectral parameters. For s-SNOM based on broad-band IR sources, the interferometric measurement is intrinsically necessary to recover the spectrum. However, for a tunable CW source such as an ECQCL, the wavelength is controlled to high precision by the source and the s-SNOM spectrum can be recovered without an interferometer.
In this work, we show that for s-SNOM measurements of small particles on a gold substrate, the background phase φbg can be adjusted to a known value near zero. This is accomplished experimentally by maximizing the s-SNOM signal obtained from the gold surface, which has a spectrally flat response and near-zero phase shift. When the self-homodyne s-SNOM spectrum from a sample region is divided by the reference spectrum obtained from gold, the resulting spectrum corresponds to the real part of the complex s-SNOM spectrum that would be obtained in a heterodyne measurement. Furthermore, we demonstrate that for dispersed particles or dense but homogeneous distributions, φbg remains nearly constant over the spatial regions of interest and across the spectral range scanned by the ECQCL, enabling high reproducibility of the self-homodyne spectra and s-SNOM images acquired at fixed wavelength. The results show the advantages of using a self-homodyne configuration with a high-stability ECQCL for rapid, high spectral resolution measurements with low noise.
#195904 - $15.00 USD Received 5 Sep 2013; revised 1 Nov 2013; accepted 11 Nov 2013; published 4 Dec 2013(C) 2013 OSA 16 December 2013 | Vol. 21, No. 25 | DOI:10.1364/OE.21.030401 | OPTICS EXPRESS 30405
3. Experimental
3.1. s-SNOM apparatus
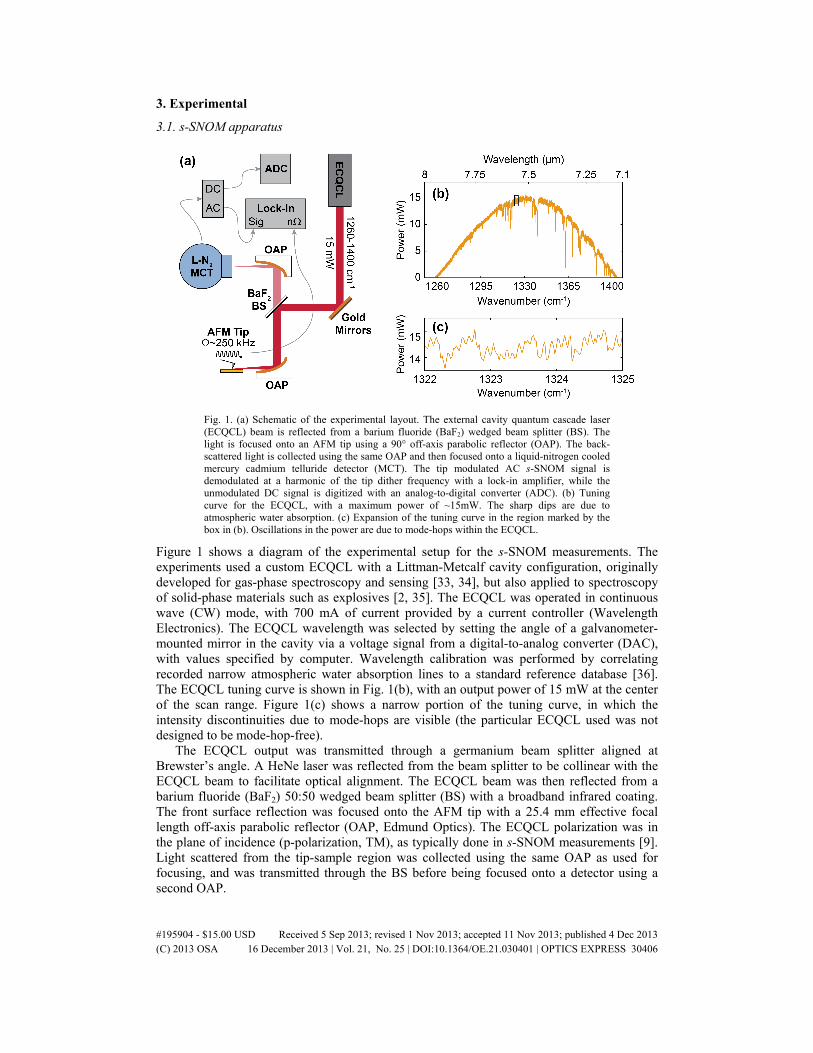
Fig. 1. (a) Schematic of the experimental layout. The external cavity quantum cascade laser (ECQCL) beam is reflected from a barium fluoride (BaF2) wedged beam splitter (BS). The light is focused onto an AFM tip using a 90° off-axis parabolic reflector (OAP). The back-scattered light is collected using the same OAP and then focused onto a liquid-nitrogen cooled mercury cadmium telluride detector (MCT). The tip modulated AC s-SNOM signal is demodulated at a harmonic of the tip dither frequency with a lock-in amplifier, while the unmodulated DC signal is digitized with an analog-to-digital converter (ADC). (b) Tuning curve for the ECQCL, with a maximum power of ~15mW. The sharp dips are due to atmospheric water absorption. (c) Expansion of the tuning curve in the region marked by the box in (b). Oscillations in the power are due to mode-hops within the ECQCL.
Figure 1 shows a diagram of the experimental setup for the s-SNOM measurements. The experiments used a custom ECQCL with a Littman-Metcalf cavity configuration, originally developed for gas-phase spectroscopy and sensing [33, 34], but also applied to spectroscopy of solid-phase materials such as explosives [2, 35]. The ECQCL was operated in continuous wave (CW) mode, with 700 mA of current provided by a current controller (Wavelength Electronics). The ECQCL wavelength was selected by setting the angle of a galvanometer-mounted mirror in the cavity via a voltage signal from a digital-to-analog converter (DAC), with values specified by computer. Wavelength calibration was performed by correlating recorded narrow atmospheric water absorption lines to a standard reference database [36]. The ECQCL tuning curve is shown in Fig. 1(b), with an output power of 15 mW at the center of the scan range. Figure 1(c) shows a narrow portion of the tuning curve, in which the intensity discontinuities due to mode-hops are visible (the particular ECQCL used was not designed to be mode-hop-free).
The ECQCL output was transmitted through a germanium beam splitter aligned at Brewster’s angle. A HeNe laser was reflected from the beam splitter to be collinear with the ECQCL beam to facilitate optical alignment. The ECQCL beam was then reflected from a barium fluoride (BaF2) 50:50 wedged beam splitter (BS) with a broadband infrared coating. The front surface reflection was focused onto the AFM tip with a 25.4 mm effective focal length off-axis parabolic reflector (OAP, Edmund Optics). The ECQCL polarization was in the plane of incidence (p-polarization, TM), as typically done in s-SNOM measurements [9]. Light scattered from the tip-sample region was collected using the same OAP as used for focusing, and was transmitted through the BS before being focused onto a detector using a second OAP.
#195904 - $15.00 USD Received 5 Sep 2013; revised 1 Nov 2013; accepted 11 Nov 2013; published 4 Dec 2013(C) 2013 OSA 16 December 2013 | Vol. 21, No. 25 | DOI:10.1364/OE.21.030401 | OPTICS EXPRESS 30406
The AFM was a custom modified AFM (attoAFM II, Attocube GmbH) [37] designed such that the AFM tip is stationary and always located at the laser focus. The AFM was run in intermittent contact mode with commercially available platinum/iridium coated tips (ATEC-NCPt or Arrow-NCPt) driven at their resonance frequency, typically in the range of 200-300 kHz. The apex of the tips have a radius of curvature of ~25 nm according to the manufacturer specifications and as deduced from approach curves on gold [38]. The tip oscillation amplitude was optimized to maximize the s-SNOM signal from gold, and for our experiments was approximately equal to the tip radius.
The detector was a liquid nitrogen cooled photovoltaic (PV) mercury cadmium telluride (MCT) detector with 250 µm diameter detector element (Fermionics PV12-250). A low-noise preamplifier built in-house with both high- and low-pass filters separated the direct current (DC) and tip-modulated (AC) signals to an ADC and lock-in amplifier (Zurich Instruments HF2LI-MF), respectively. The photovoltaic detector allowed for simultaneous monitoring of the total signal level to confirm detector linearity and to record concurrently the modulated near-field signal and the much larger far-field scattered signal, in which the incident laser intensity dominates. In this way, we could correct for laser intensity fluctuations and atmospheric water absorption in real time using a single detector.
3.2. Sample preparation
The substrates used in the experiments were gold-coated silicon wafers obtained from Sigma-Aldrich. The substrates were diced, cleaned with stabilized piranha solution (Nano-Strip 2X) for 30 minutes at 90 °C, rinsed with deionized water followed by 200 proof ethanol, and finally blown dry with nitrogen. Explosive residue samples were made from solutions of explosives dissolved in 1:1 acetonitrile:methanol (AccuStandard). RDX and PETN were prepared from 1 mg/mL solutions by depositing ~2.5 µL onto a substrate and allowing the solvent to evaporate under ambient conditions. Tetryl samples were prepared from 1 mg/mL solutions by spin-coating at 2000 rpm for 2 minutes. Samples were characterized using optical microscopy and reflection-absorption infrared spectroscopy (RAIRS) [39].
4. Results and discussion
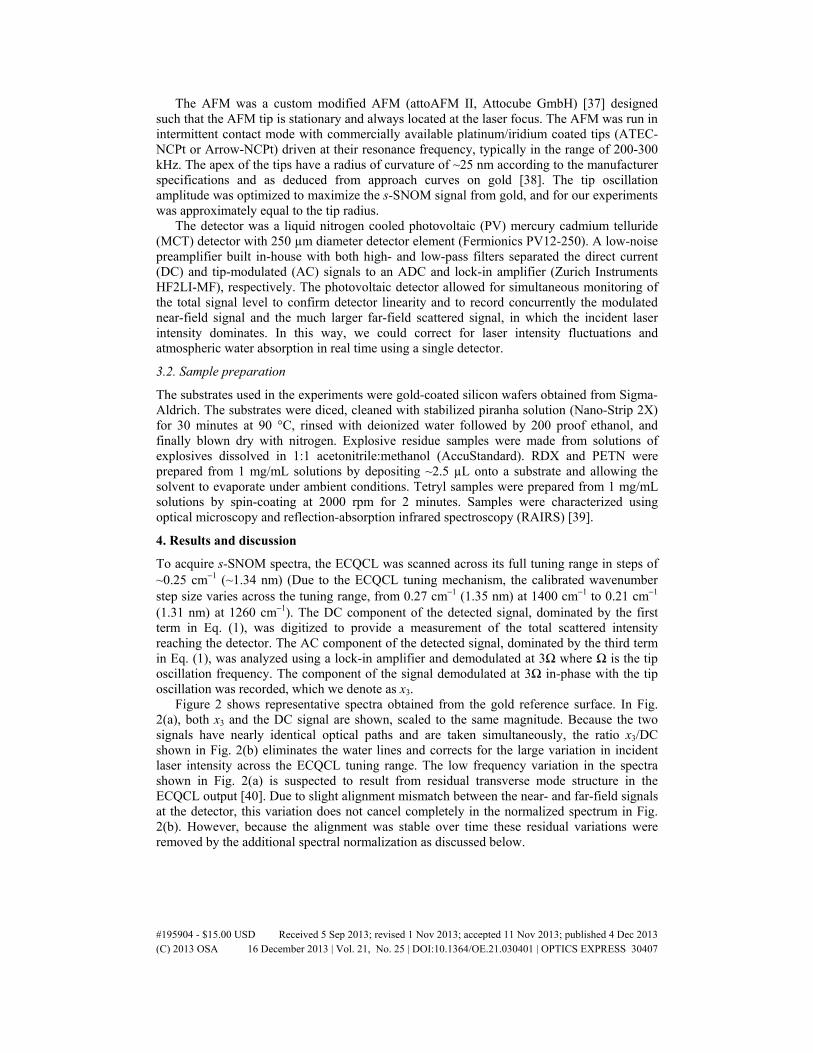
To acquire s-SNOM spectra, the ECQCL was scanned across its full tuning range in steps of ~0.25 cm−1 (~1.34 nm) (Due to the ECQCL tuning mechanism, the calibrated wavenumber step size varies across the tuning range, from 0.27 cm−1 (1.35 nm) at 1400 cm−1 to 0.21 cm−1 (1.31 nm) at 1260 cm−1). The DC component of the detected signal, dominated by the first term in Eq. (1), was digitized to provide a measurement of the total scattered intensity reaching the detector. The AC component of the detected signal, dominated by the third term in Eq. (1), was analyzed using a lock-in amplifier and demodulated at 3Ω where Ω is the tip oscillation frequency. The component of the signal demodulated at 3Ω in-phase with the tip oscillation was recorded, which we denote as x3.
Figure 2 shows representative spectra obtained from the gold reference surface. In Fig. 2(a), both x3 and the DC signal are shown, scaled to the same magnitude. Because the two signals have nearly identical optical paths and are taken simultaneously, the ratio x3/DC shown in Fig. 2(b) eliminates the water lines and corrects for the large variation in incident laser intensity across the ECQCL tuning range. The low frequency variation in the spectra shown in Fig. 2(a) is suspected to result from residual transverse mode structure in the ECQCL output [40]. Due to slight alignment mismatch between the near- and far-field signals at the detector, this variation does not cancel completely in the normalized spectrum in Fig. 2(b). However, because the alignment was stable over time these residual variations were removed by the additional spectral normalization as discussed below.
#195904 - $15.00 USD Received 5 Sep 2013; revised 1 Nov 2013; accepted 11 Nov 2013; published 4 Dec 2013(C) 2013 OSA 16 December 2013 | Vol. 21, No. 25 | DOI:10.1364/OE.21.030401 | OPTICS EXPRESS 30407
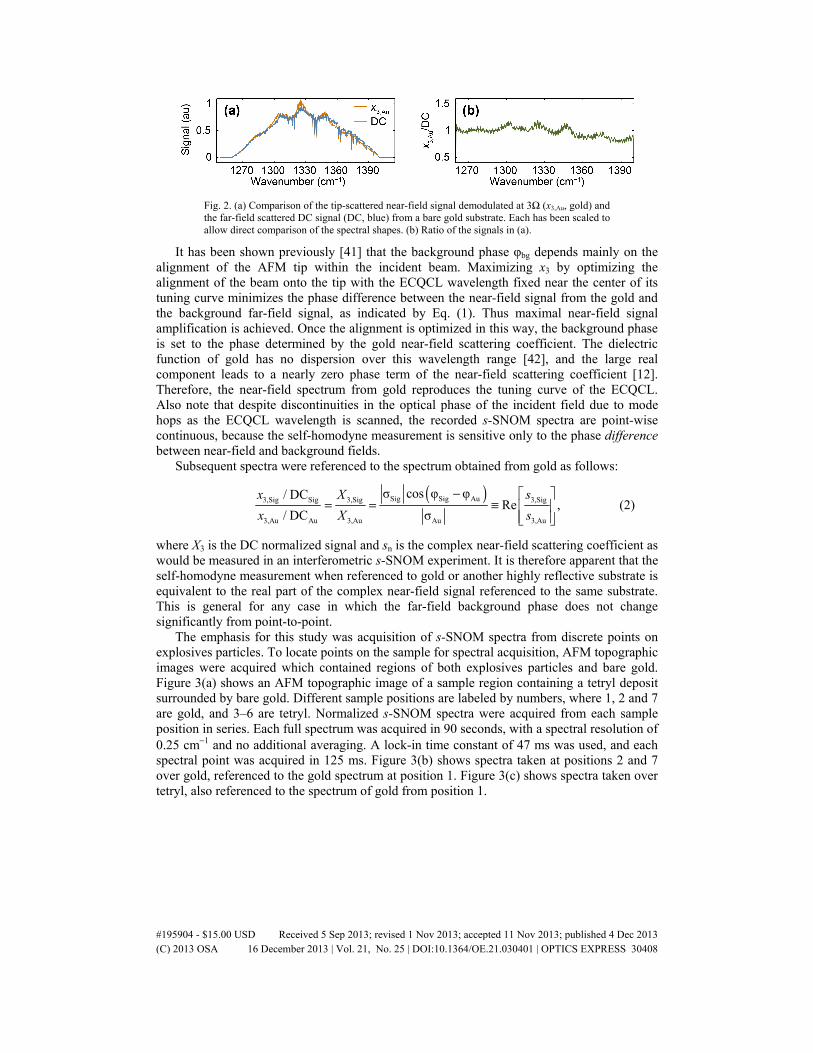
Fig. 2. (a) Comparison of the tip-scattered near-field signal demodulated at 3Ω (x3,Au, gold) and the far-field scattered DC signal (DC, blue) from a bare gold substrate. Each has been scaled to allow direct comparison of the spectral shapes. (b) Ratio of the signals in (a).
It has been shown previously [41] that the background phase φbg depends mainly on the alignment of the AFM tip within the incident beam. Maximizing x3 by optimizing the alignment of the beam onto the tip with the ECQCL wavelength fixed near the center of its tuning curve minimizes the phase difference between the near-field signal from the gold and the background far-field signal, as indicated by Eq. (1). Thus maximal near-field signal amplification is achieved. Once the alignment is optimized in this way, the background phase is set to the phase determined by the gold near-field scattering coefficient. The dielectric function of gold has no dispersion over this wavelength range [42], and the large real component leads to a nearly zero phase term of the near-field scattering coefficient [12]. Therefore, the near-field spectrum from gold reproduces the tuning curve of the ECQCL. Also note that despite discontinuities in the optical phase of the incident field due to mode hops as the ECQCL wavelength is scanned, the recorded s-SNOM spectra are point-wise continuous, because the self-homodyne measurement is sensitive only to the phase difference between near-field and background fields.
Subsequent spectra were referenced to the spectrum obtained from gold as follows:
( )Sig Sig Au3,Sig Sig 3,Sig 3,Sig
3,Au Au 3,Au Au 3,Au
cos/ DCRe ,
/ DC
σ φ φ
σ
xXX s
x s−
= = ≡
(2)
where X3 is the DC normalized signal and sn is the complex near-field scattering coefficient as would be measured in an interferometric s-SNOM experiment. It is therefore apparent that the self-homodyne measurement when referenced to gold or another highly reflective substrate is equivalent to the real part of the complex near-field signal referenced to the same substrate. This is general for any case in which the far-field background phase does not change significantly from point-to-point.
The emphasis for this study was acquisition of s-SNOM spectra from discrete points on explosives particles. To locate points on the sample for spectral acquisition, AFM topographic images were acquired which contained regions of both explosives particles and bare gold. Figure 3(a) shows an AFM topographic image of a sample region containing a tetryl deposit surrounded by bare gold. Different sample positions are labeled by numbers, where 1, 2 and 7 are gold, and 3–6 are tetryl. Normalized s-SNOM spectra were acquired from each sample position in series. Each full spectrum was acquired in 90 seconds, with a spectral resolution of 0.25 cm−1 and no additional averaging. A lock-in time constant of 47 ms was used, and each spectral point was acquired in 125 ms. Figure 3(b) shows spectra taken at positions 2 and 7 over gold, referenced to the gold spectrum at position 1. Figure 3(c) shows spectra taken over tetryl, also referenced to the spectrum of gold from position 1.
#195904 - $15.00 USD Received 5 Sep 2013; revised 1 Nov 2013; accepted 11 Nov 2013; published 4 Dec 2013(C) 2013 OSA 16 December 2013 | Vol. 21, No. 25 | DOI:10.1364/OE.21.030401 | OPTICS EXPRESS 30408
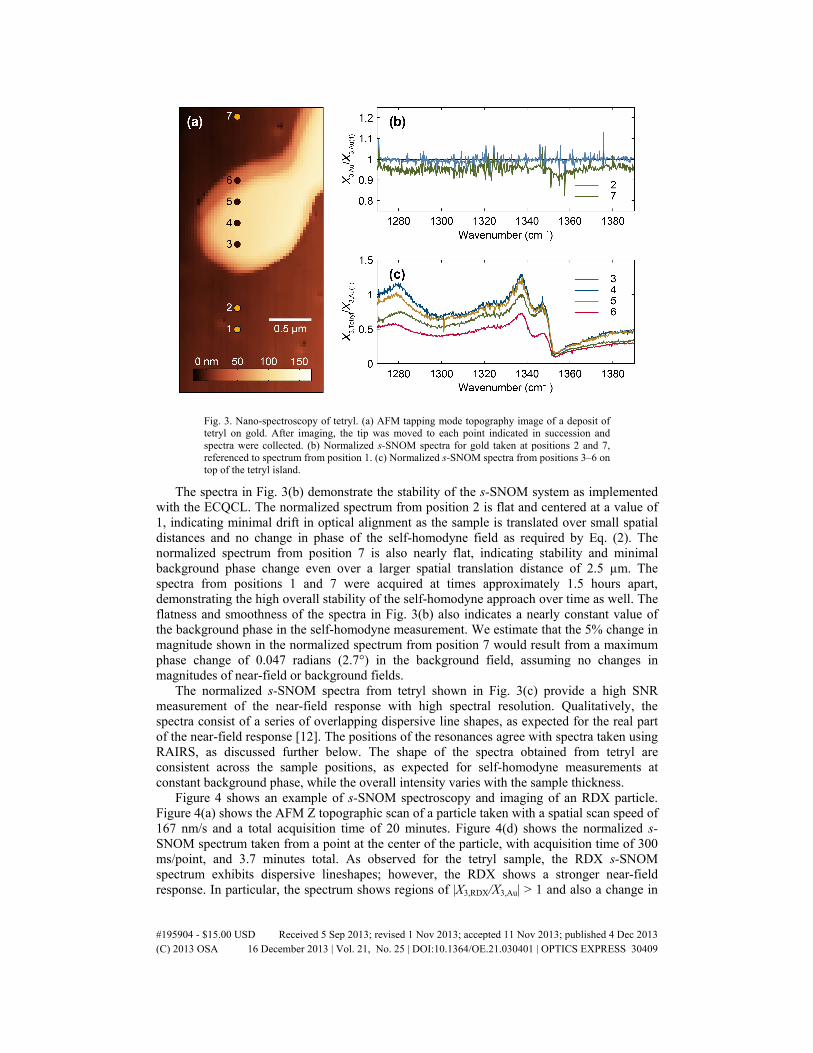
Fig. 3. Nano-spectroscopy of tetryl. (a) AFM tapping mode topography image of a deposit of tetryl on gold. After imaging, the tip was moved to each point indicated in succession and spectra were collected. (b) Normalized s-SNOM spectra for gold taken at positions 2 and 7, referenced to spectrum from position 1. (c) Normalized s-SNOM spectra from positions 3–6 on top of the tetryl island.
The spectra in Fig. 3(b) demonstrate the stability of the s-SNOM system as implemented with the ECQCL. The normalized spectrum from position 2 is flat and centered at a value of 1, indicating minimal drift in optical alignment as the sample is translated over small spatial distances and no change in phase of the self-homodyne field as required by Eq. (2). The normalized spectrum from position 7 is also nearly flat, indicating stability and minimal background phase change even over a larger spatial translation distance of 2.5 µm. The spectra from positions 1 and 7 were acquired at times approximately 1.5 hours apart, demonstrating the high overall stability of the self-homodyne approach over time as well. The flatness and smoothness of the spectra in Fig. 3(b) also indicates a nearly constant value of the background phase in the self-homodyne measurement. We estimate that the 5% change in magnitude shown in the normalized spectrum from position 7 would result from a maximum phase change of 0.047 radians (2.7°) in the background field, assuming no changes in magnitudes of near-field or background fields.
The normalized s-SNOM spectra from tetryl shown in Fig. 3(c) provide a high SNR measurement of the near-field response with high spectral resolution. Qualitatively, the spectra consist of a series of overlapping dispersive line shapes, as expected for the real part of the near-field response [12]. The positions of the resonances agree with spectra taken using RAIRS, as discussed further below. The shape of the spectra obtained from tetryl are consistent across the sample positions, as expected for self-homodyne measurements at constant background phase, while the overall intensity varies with the sample thickness.
Figure 4 shows an example of s-SNOM spectroscopy and imaging of an RDX particle. Figure 4(a) shows the AFM Z topographic scan of a particle taken with a spatial scan speed of 167 nm/s and a total acquisition time of 20 minutes. Figure 4(d) shows the normalized s-SNOM spectrum taken from a point at the center of the particle, with acquisition time of 300 ms/point, and 3.7 minutes total. As observed for the tetryl sample, the RDX s-SNOM spectrum exhibits dispersive lineshapes; however, the RDX shows a stronger near-field response. In particular, the spectrum shows regions of |X3,RDX/X3,Au| > 1 and also a change in
#195904 - $15.00 USD Received 5 Sep 2013; revised 1 Nov 2013; accepted 11 Nov 2013; published 4 Dec 2013(C) 2013 OSA 16 December 2013 | Vol. 21, No. 25 | DOI:10.1364/OE.21.030401 | OPTICS EXPRESS 30409
sign near the strongest resonance. The sign change indicates a large change in phase of the near-field scattering coefficient across the resonance, arising from the large changes in dielectric function observed near a strong absorption resonance [7].
Fig. 4. Near-field chemical imaging of RDX. (a) AFM Z topography map of a particle of RDX on gold. (b)–(c) s-SNOM contrast images taken at two different frequencies as indicated in the spectrum in (d), plotted as C3,RDX = 1 - (X3,RDX/X3,Au) (unitless). The color bar in (b) applies to both optical images, and the scale bar in (c) applies to all three images. (d) Normalized spectrum taken at center of the RDX. Both the optical images and the spectrum have been normalized to the incident laser intensity and the spectrum from gold. (e) Line scans across the diagonal of each image (indicated by dashed lines with a dot at the 0 position).
Figures 4(b) and 4(c) show images acquired by recording the s-SNOM signal concurrent with the topographic scan, for fixed wavelengths as indicated in Fig. 4(d). Both s-SNOM images were normalized to the incident laser power and are displayed as a contrast relative to the nominal expected signal from gold: C3,RDX = 1 - (X3,RDX/X3,Au). The measured images are free of discontinuities and the s-SNOM signals from the gold substrate are constant across the images. The s-SNOM signal from the RDX reproduces the shape as measured in the sample topography, and reveals additional structure within the particle. The largest contrast in the s-SNOM image is observed in Fig. 4(b), for a wavelength corresponding to the peak s-SNOM response in the spectrum. Figure 4(e) plots signal levels along the diagonal lines shown on the images in Figs. 4(a)–4(c). The maximum contrast observed for the on-resonant wavelength is 2.5. The on-resonant signal correlates well with the topography up until the thickness of the film approaches 2 times the tip radius, at which point it starts to deviate [12].
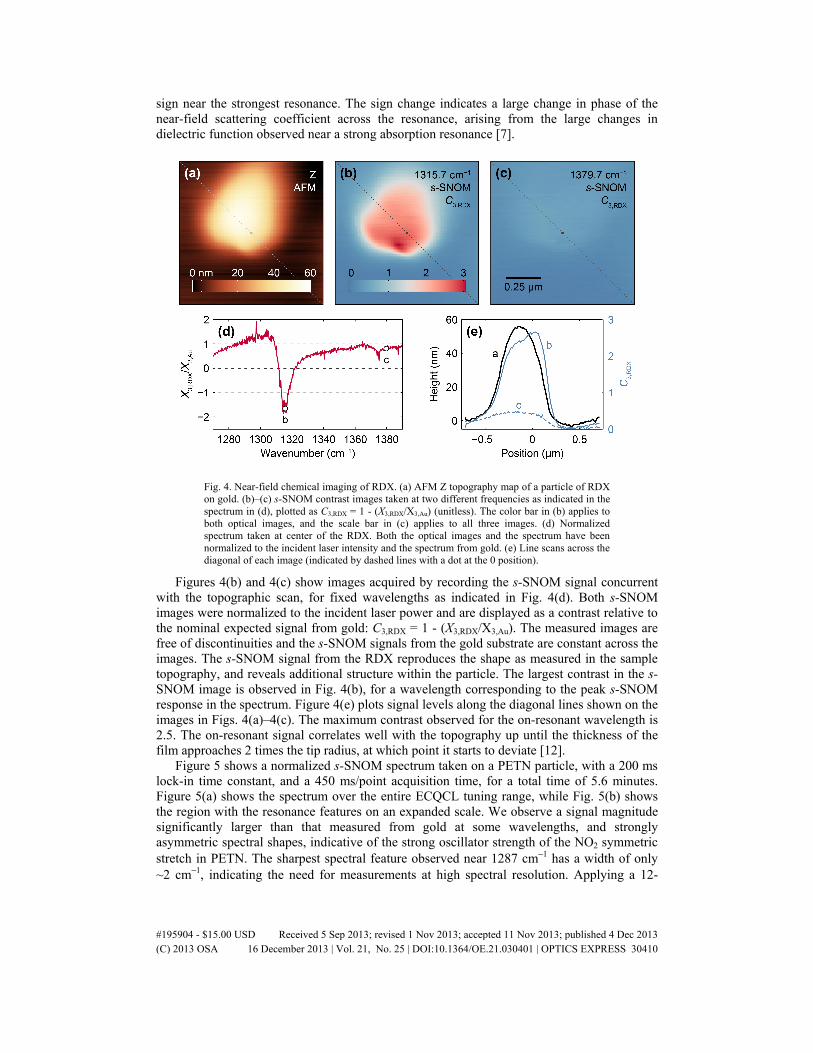
Figure 5 shows a normalized s-SNOM spectrum taken on a PETN particle, with a 200 ms lock-in time constant, and a 450 ms/point acquisition time, for a total time of 5.6 minutes. Figure 5(a) shows the spectrum over the entire ECQCL tuning range, while Fig. 5(b) shows the region with the resonance features on an expanded scale. We observe a signal magnitude significantly larger than that measured from gold at some wavelengths, and strongly asymmetric spectral shapes, indicative of the strong oscillator strength of the NO2 symmetric stretch in PETN. The sharpest spectral feature observed near 1287 cm−1 has a width of only ~2 cm−1, indicating the need for measurements at high spectral resolution. Applying a 12-
#195904 - $15.00 USD Received 5 Sep 2013; revised 1 Nov 2013; accepted 11 Nov 2013; published 4 Dec 2013(C) 2013 OSA 16 December 2013 | Vol. 21, No. 25 | DOI:10.1364/OE.21.030401 | OPTICS EXPRESS 30410
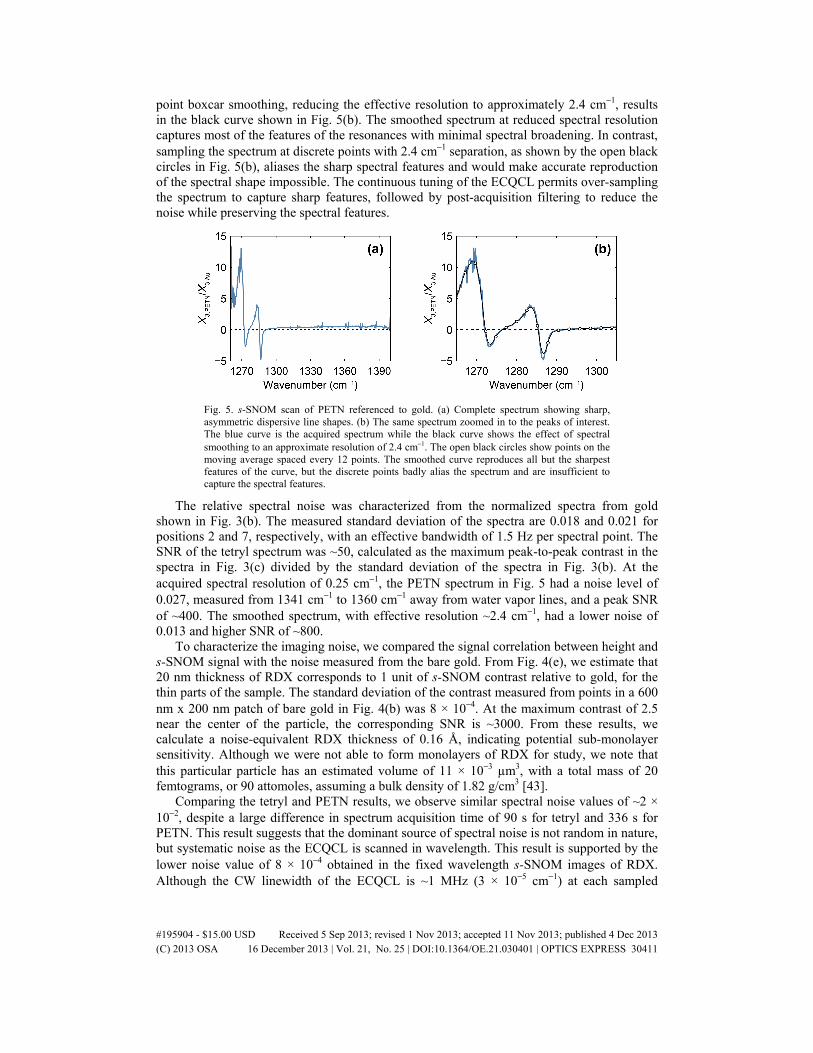
point boxcar smoothing, reducing the effective resolution to approximately 2.4 cm−1, results in the black curve shown in Fig. 5(b). The smoothed spectrum at reduced spectral resolution captures most of the features of the resonances with minimal spectral broadening. In contrast, sampling the spectrum at discrete points with 2.4 cm−1 separation, as shown by the open black circles in Fig. 5(b), aliases the sharp spectral features and would make accurate reproduction of the spectral shape impossible. The continuous tuning of the ECQCL permits over-sampling the spectrum to capture sharp features, followed by post-acquisition filtering to reduce the noise while preserving the spectral features.
Fig. 5. s-SNOM scan of PETN referenced to gold. (a) Complete spectrum showing sharp, asymmetric dispersive line shapes. (b) The same spectrum zoomed in to the peaks of interest. The blue curve is the acquired spectrum while the black curve shows the effect of spectral smoothing to an approximate resolution of 2.4 cm−1. The open black circles show points on the moving average spaced every 12 points. The smoothed curve reproduces all but the sharpest features of the curve, but the discrete points badly alias the spectrum and are insufficient to capture the spectral features.
The relative spectral noise was characterized from the normalized spectra from gold shown in Fig. 3(b). The measured standard deviation of the spectra are 0.018 and 0.021 for positions 2 and 7, respectively, with an effective bandwidth of 1.5 Hz per spectral point. The SNR of the tetryl spectrum was ~50, calculated as the maximum peak-to-peak contrast in the spectra in Fig. 3(c) divided by the standard deviation of the spectra in Fig. 3(b). At the acquired spectral resolution of 0.25 cm−1, the PETN spectrum in Fig. 5 had a noise level of 0.027, measured from 1341 cm−1 to 1360 cm−1 away from water vapor lines, and a peak SNR of ~400. The smoothed spectrum, with effective resolution ~2.4 cm−1, had a lower noise of 0.013 and higher SNR of ~800.
To characterize the imaging noise, we compared the signal correlation between height and s-SNOM signal with the noise measured from the bare gold. From Fig. 4(e), we estimate that 20 nm thickness of RDX corresponds to 1 unit of s-SNOM contrast relative to gold, for the thin parts of the sample. The standard deviation of the contrast measured from points in a 600 nm x 200 nm patch of bare gold in Fig. 4(b) was 8 × 10⁻⁴. At the maximum contrast of 2.5 near the center of the particle, the corresponding SNR is ~3000. From these results, we calculate a noise-equivalent RDX thickness of 0.16 Å, indicating potential sub-monolayer sensitivity. Although we were not able to form monolayers of RDX for study, we note that this particular particle has an estimated volume of 11 × 10−3 µm3, with a total mass of 20 femtograms, or 90 attomoles, assuming a bulk density of 1.82 g/cm3 [43].
Comparing the tetryl and PETN results, we observe similar spectral noise values of ~2 × 10⁻², despite a large difference in spectrum acquisition time of 90 s for tetryl and 336 s for PETN. This result suggests that the dominant source of spectral noise is not random in nature, but systematic noise as the ECQCL is scanned in wavelength. This result is supported by the lower noise value of 8 × 10⁻⁴ obtained in the fixed wavelength s-SNOM images of RDX. Although the CW linewidth of the ECQCL is ~1 MHz (3 × 10⁻⁵ cm−1) at each sampled
#195904 - $15.00 USD Received 5 Sep 2013; revised 1 Nov 2013; accepted 11 Nov 2013; published 4 Dec 2013(C) 2013 OSA 16 December 2013 | Vol. 21, No. 25 | DOI:10.1364/OE.21.030401 | OPTICS EXPRESS 30411
wavelength [44], the effective scan resolution, scan repeatability, and intensity noise in the recorded spectrum is ultimately limited by the external cavity mode-hops of the ECQCL. Nevertheless, the high SNR observed in the spectra, coupled with the fast acquisition speed and high spectral resolution, clearly demonstrates the high performance of this ECQCL source for nano-spectroscopy applications in s-SNOM.
The spectral acquisition parameters were selected as a compromise between SNR, spectral resolution, and acquisition speed; however, other selections could be made. For example, a spectrum could be acquired at comparable SNR but lower spectral resolution of 2.5 cm−1 in 9 seconds. For the particular ECQCL used in the experiments, the entire tuning range can be scanned in <100 ms if desired [2], so that the ECQCL scan rate is not currently a limiting factor in these measurements. Alternatively, the 0.25 cm−1 wavenumber step size could be reduced to measure even narrower spectral features, or to provide additional spectral averaging, reducing scan noise and increasing SNR further.
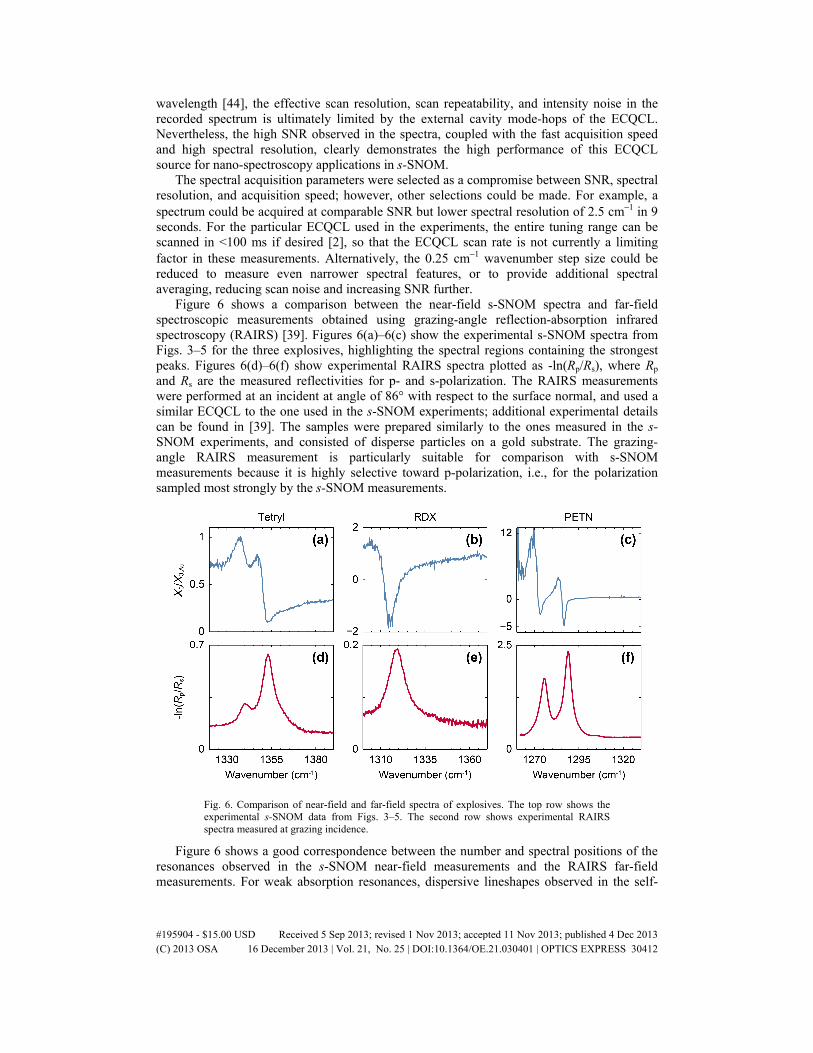
Figure 6 shows a comparison between the near-field s-SNOM spectra and far-field spectroscopic measurements obtained using grazing-angle reflection-absorption infrared spectroscopy (RAIRS) [39]. Figures 6(a)–6(c) show the experimental s-SNOM spectra from Figs. 3–5 for the three explosives, highlighting the spectral regions containing the strongest peaks. Figures 6(d)–6(f) show experimental RAIRS spectra plotted as -ln(Rp/Rs), where Rp and Rs are the measured reflectivities for p- and s-polarization. The RAIRS measurements were performed at an incident at angle of 86° with respect to the surface normal, and used a similar ECQCL to the one used in the s-SNOM experiments; additional experimental details can be found in [39]. The samples were prepared similarly to the ones measured in the s-SNOM experiments, and consisted of disperse particles on a gold substrate. The grazing-angle RAIRS measurement is particularly suitable for comparison with s-SNOM measurements because it is highly selective toward p-polarization, i.e., for the polarization sampled most strongly by the s-SNOM measurements.
Fig. 6. Comparison of near-field and far-field spectra of explosives. The top row shows the experimental s-SNOM data from Figs. 3–5. The second row shows experimental RAIRS spectra measured at grazing incidence.
Figure 6 shows a good correspondence between the number and spectral positions of the resonances observed in the s-SNOM near-field measurements and the RAIRS far-field measurements. For weak absorption resonances, dispersive lineshapes observed in the self-
#195904 - $15.00 USD Received 5 Sep 2013; revised 1 Nov 2013; accepted 11 Nov 2013; published 4 Dec 2013(C) 2013 OSA 16 December 2013 | Vol. 21, No. 25 | DOI:10.1364/OE.21.030401 | OPTICS EXPRESS 30412
homodyne s-SNOM result from measurement of Re[s3(ω)], which is determined primarily by Re[ñ(ω)] [14], where ñ(ω) is the complex refractive index. The s-SNOM spectra of the explosives exhibit strong and asymmetric spectral features near the absorption resonances. In particular, the peak s-SNOM signals for RDX and PETN can be as large as or even larger than the signal for the gold reference, and exhibit phase shifts relative to gold greater than 180°, leading to sign reversals in X3,sig/X3,Au. These behaviors likely result from the strong oscillator strengths of the nitro-group vibrational resonances in these molecular crystals, corresponding to strong absorption resonances. Dramatic effects are often observed for reflection spectra in regions of strong anomalous dispersion on the high frequency side of a strong resonance where Re[ñ(ω)] < 1 [45]. Such behavior is related to a range of observed effects, such as infrared Restrahlen bands [46], phonon modes in solid state materials [46], and Fano resonances [47]. However, regardless of the particular shapes of the self-homodyne s-SNOM spectra, the results in Fig. 6 show a 1:1 correspondence between the absorption resonances observed in the near-field and far-field measurements, allowing unambiguous chemical identification and differentiation with nano-scale spatial resolution.
5. Conclusions
We have demonstrated high-speed acquisition of s-SNOM spectra at high spectral resolution of 0.25 cm−1 using a tunable ECQCL operating in the 1260–1400 cm−1 spectral region. The high spectral resolution and irradiance of the ECQCL allows for accurate measurements of the sharp spectral nitro-group features of particles of the explosives tetryl, RDX, and PETN. The s-SNOM spectra exhibit high s-SNOM magnitudes and large phase shifts near the strong absorption resonances of these compounds. We measured spectral noise values of ~2 × 10⁻², at acquisition times as fast as 90 s, demonstrating the high-performance of ECQCL sources for s-SNOM measurements.
The large oscillator strengths of molecular crystals such as RDX and PETN pose a particular challenge for s-SNOM spectral modeling in general, for both self-homodyne and phase-resolved s-SNOM measurements alike. For weak vibrational resonances, it has been shown that s-SNOM spectra can be inverted to determine the complex refractive index to good approximation, for weak tip-sample coupling and homogeneous sample material [14], in which case n ω)] ImIm[ ( [ (ω)]s n∝ [15]. However, for strong absorption resonances this
relationship does not hold, as has been observed in s-SNOM spectra of SiO2 [5–8], SiC [5, 6, 9], and Teflon [10], i.e., systems with strong phonon or vibrational oscillator strengths. Even though numerical simulations of s-SNOM spectra using finite element method (FEM) techniques [8] may provide additional insight into details of the spectral near-field response of materials with strong and narrow resonances, such as the nitro-group resonances of the explosives we have studied here, the spectral features still depend on geometric details of the tip.
Attempts at modeling the s-SNOM spectra for these samples using the finite dipole model (FDM) [9] for layered materials [13] were unsuccessful in reproducing the observed spectra, as expected. The unknown dielectric functions for the materials prevented quantitative comparison between the experimental and modeled s-SNOM spectra. Effects of local crystal morphology, orientation, and anisotropy may also be important; for example, RDX exhibits both α- and β-crystalline forms when deposited on surfaces (based on surface coverages for the samples and comparison to literature spectra, we measured primarily the β-form of RDX [48–50]). However, as shown in this work for systems with a small number of distinct chemical constituents, the measured s-SNOM spectra provide unambiguous nano-scale chemical identification for many practical applications. Additional research into methods for inverting the s-SNOM spectra to determine complex refractive indices will expand its utility further.
#195904 - $15.00 USD Received 5 Sep 2013; revised 1 Nov 2013; accepted 11 Nov 2013; published 4 Dec 2013(C) 2013 OSA 16 December 2013 | Vol. 21, No. 25 | DOI:10.1364/OE.21.030401 | OPTICS EXPRESS 30413
Self-homodyne s-SNOM, despite its limitations, produces meaningful and reproducible spectra for particles dispersed on a gold surface. By maximizing the s-SNOM signal from the bare gold substrate, the phase of the background field is set to a value near zero, and remains nearly constant as both the wavelength and the spatial position are changed. The self-homodyne measurement related to the real part of the complex s-SNOM scattering coefficient thus provides a useful and consistent spectroscopic signature. The simplicity, speed, and low-noise of the self-homodyne measurements have clear advantages for s-SNOM based on laser sources such as ECQCLs.
Acknowledgments
The research is part of the Chemical Imaging Initiative at Pacific Northwest National Laboratory (PNNL). It was conducted under the Laboratory Directed Research and Development Program at PNNL, a multi-program national laboratory operated by Battelle for the U.S. Department of Energy under Contract DE-AC05-76RL01830. The work was performed at EMSL, a national scientific user facility sponsored by the Department of Energy's Office of Biological and Environmental Research and located at PNNL. A portion of this research was made possible through the “Development of capability for Scanning-Probe Infrared-Spectroscopic Imaging with Nanometer Spatial Resolution” Scientific Partner Proposal at EMSL.
#195904 - $15.00 USD Received 5 Sep 2013; revised 1 Nov 2013; accepted 11 Nov 2013; published 4 Dec 2013(C) 2013 OSA 16 December 2013 | Vol. 21, No. 25 | DOI:10.1364/OE.21.030401 | OPTICS EXPRESS 30414