Embed Size (px)
Citation preview
INFRA-RED ABSORPTION SPECTRA OF STEROIDS
I. AKDROGESS AKD RELATED STEROIDS*
BY ROBERT F. FURCHGOTT, HARR.IS ROSENKRASTZ, .%NL) EPHRAIM SHORR
(Prom the Russell Sage Institute oj Z’atholoyy, the Department of Medicine, Cornell U&emit!/ Medical College, and l’he A’ew York Hospitul, Xew York)
(Received for publication, December 11, 1945)
This is the first of a series of papers on the infra-red absorption spectra of steroids, with particular reference to the naturally occurring steroidal horm0nes.l These studies have shown that such spectra can be of consid- erable aid in the chemical identification of this group of compounds. The present paper contains a description of the methods used in this laboratory for qualitative infra-ied spectroscopic analysis of crystalline steroids. The spectra of a number of naturally occurring androgens and related com- pounds are presented and are discussed in relation to chemical structure.
Methods
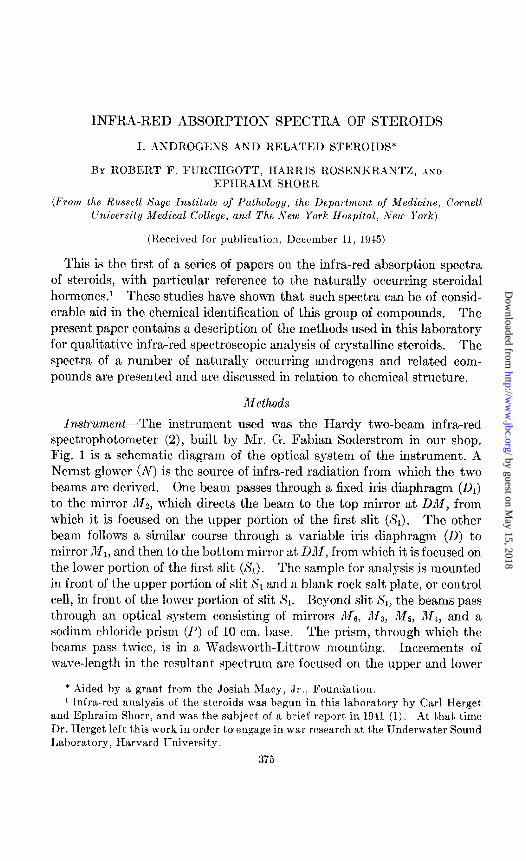
Instrument-The instrument used was the Hardy two-beam infra-red spectrophotometer (2), built by Mr. G. Fabian Soderstrom in our shop. Fig. 1 is a schematic diagram of the optical system of the instrument. A Nernst glower (N) is the source of infra-red radiation from which the two beams are derived. One beam passes through a fixed iris diaphragm (01) to the mirror Mz, which directs the beam to the top mirror at DM, from which it is focused on the upper portion of the first slit (Xl). The other beam follows a similar course through a variable iris diaphragm (D) to mirror M1, and t,hen to the bottom mirror at DM, from which it is focused on the lower portion of the first slit (&). The sample for analysis is mounted in front of t,he upper portion of slit & and a blank rock salt plate, or control cell, in front of the lower portion of slit 81. Beyond slit, 81, the beams pass t,hrough an optical system consisting of mirrors JJ6, dfa, ME, All, and a sodium chloride prism (I’) of 10 cm. base. The prism, through which the beams pass twice, is in a Wadsworth-Littrow mounting. Increments of wave-lengt,h in the resultant spectrum are focused on the upper and lower
* Aided by a grant from the Josiah Macy, Jr., Foundation. I Infra-red analysis of the steroids was begun in t,his laboratory by Carl Herget
and Ephraim Shorr, and was the subject of a brief report in 1941 (1). At that time Dr. Herget left t,his work in order t,o engage in war research at, the Underwat,er Sound I1aboratjory, Harvard IJniversity.
375
by guest on May 15, 2018
http://ww
w.jbc.org/
Dow
nloaded from
376 ABSORPTIOh’ SPECTRA OF STEROIDS
portion of a second slit (8,) through which they pass to a mirror (MT), which focuses them on two matched thermocouple junctions (J).
The thermocouple junctions are connected in opposition in a circuit, containing a Zernike (model Zc) galvanometer. As t,he prism is rotated, different wave-lengths of infra-red radiation are continuously brought into focus on the thermocouple junctions. When there is no absorption by the sample, there is no difference in t.he intensity of radiation on t’he two junc- tions. HOWWT~, at \vave-lengths at which absorption occurs, the ditierence of intensity of radiation on the t’wo junct,ions causes a deflection of the galvanometer. These deflections are amplified on a ground glass scale by a beam of light rcflccted from the glavanomet,er mirror.
P’IG. I. Schematic diagram of the optiral system of the Hardy infra-reti spec- t rophotomrter. .V is a Sernst glower; I) and 11, iris diaphragms; M,, Mu, IIM, M:], Jr,, I%/,, M,. and .$I, mirrors; AS, and ,S’;, slits; I’ sodium cshloridc prism; J a pair of matched thermocouple junrtions.
The absorption spectrum is recorded by keeping the galvanometer beam at the null point,. This is accomplished with a manually operated wheel which cont,rols thp opening of t)he variable iris diaphragm (1)) so as to balances the intensities of rxdiation on t.he t,wo thermocouple junctions. ‘I’ht \vhc4 also c+ontrols a pen which \vrites on adrum rotated through a gear system by t,he same mot.or which rotates the prism. In this manner, as the prism is ro&ted, t*he operator obt,ains a continuous tracing which repre- sents the absorption spectrum of the sample. On each tracing a scale is fixed by means of a vernier attachment on the gear mechanism controlling the prism rotation. This scale, which gives the position of the prism at any point on the tracing, is then converted into a wave-length scale by use of a calibration curve based on absorption spectra obtained with chemical com- pounds \vit,h well defined absorption bands at specific wave-lengths in the infra-red region,
by guest on May 15, 2018
http://ww
w.jbc.org/
Dow
nloaded from
FT-R(‘HGOTT, ROHISSKlt.\S’1’%, ;I?,-D SHOltIl 377
The spectra presented in this paper extend from 2 to 12.l p, although the spectrophotometer is capable of analysis out to about 15 p. From 2 to 4.5 p, thewidth of the first slit (Xl) wasset atO.lmm., from4.5 to 9pat0.3mm.,and from 9 to 12.4 p at 0.6 mm. The width of the second slit (8,) was always set, 0.5 mm. greater t,han the widt.h of the first.
Preparation of Xamples-Samples may be investigated either ax solid films on rock salt plates or in solution, in suitable cells. In the present paper, only t,he results obt’ained with solid films are reported. The films were generally prepared by dissolving the sample in an organic solvent, and then placing the resulting solution dropwise on a salt plat,e, heated to a tempera- t,ure s&able for the rapid evaporation of the solvent. When pyridine was used as a solvent, as in most of the preparations reported on in this paper, t,he salt plate was kept at about 100” during the application of the solution. With heat-stable compounds, crystals were sometimes melted directly on a salt plate and allowed to solidify on cooling.
The most satisfactory films for analysis are either glassy or composed of crystals with little scattering power. When a film tends to deposit in fine, powdery crystals, the scattering effect of the film on the infra-red radiation results in lesssatisfactory spectra. This difficulty can be partly overcome by grinding the salt plate through which the control beam passes so as to simulate as closely as possible the scattering effect of the film. Usually 4 to G mg. of material were used on a salt plate about 2 cm. square and 3 mm. t,hick; but if material was limited, satisfactory results could be obtained with as little as 1 to 2 mg.
EXPERIMENTAL
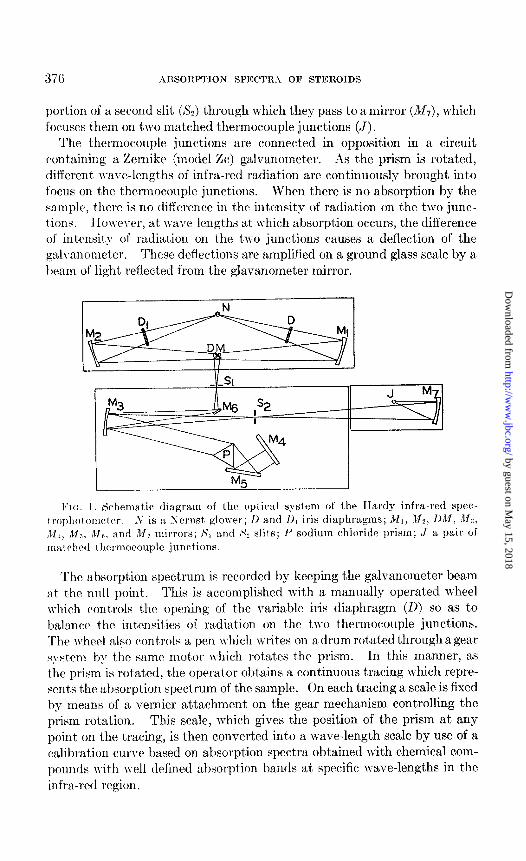
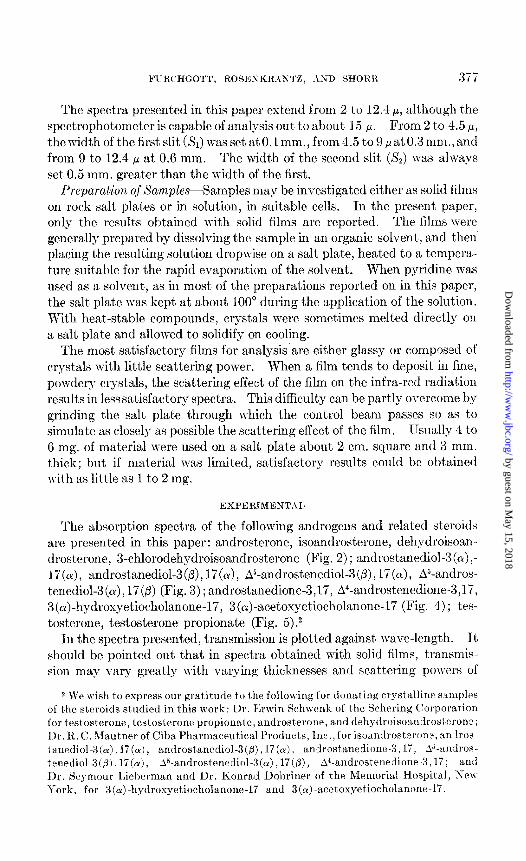
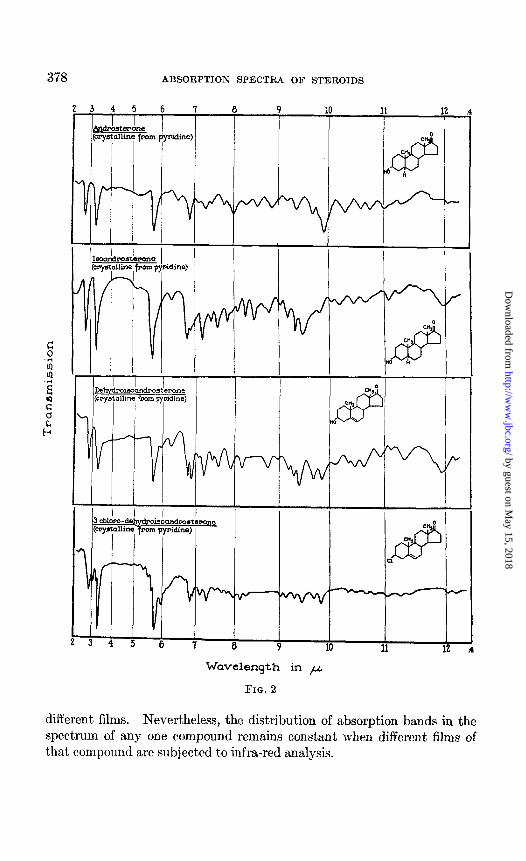
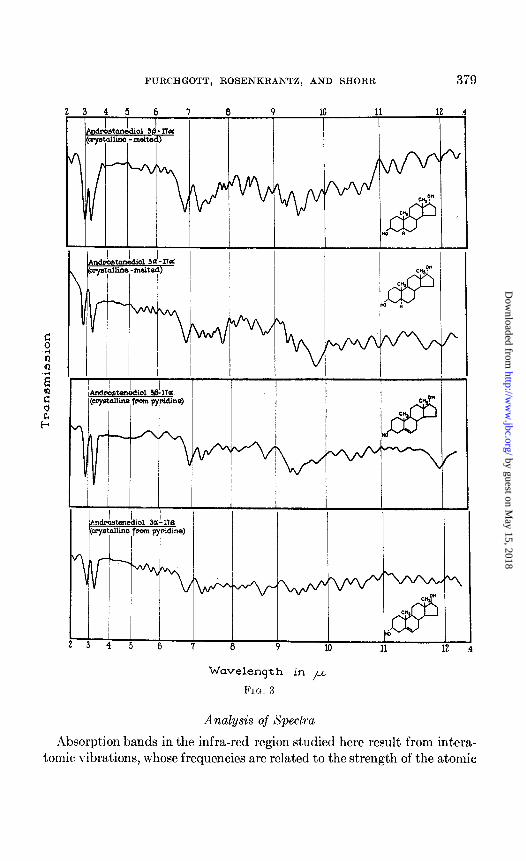
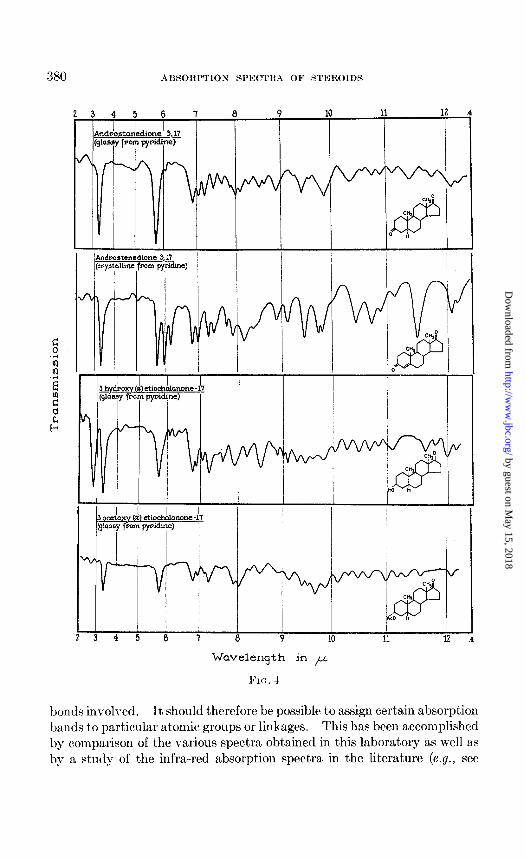
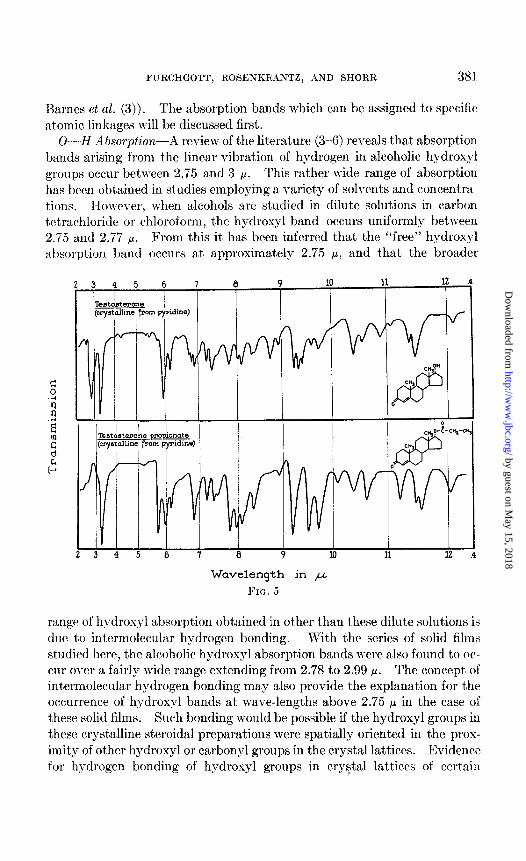
The absorption spectra of the following androgens and related stjeroids are presented in this paper: androsterone, isoandrosterone, dehydroisoan- drosterone, 3-chlorodehydroisoandrosterone (Fig. 2) ; androetanediol-3(a) ,- 17 (a), androstanediol-3 (p), 17(a), A5-androstenediol-3 (p), 17 (a), A5-andros- tenediol3(cu), 17(B) (Fig. 3) ; androstanedione-3,17, A4-androstenedione-3,17, 3(a)-hydroxyetiocholanone-17, 3(a)-acetoxyetiocholanone-17 (Fig. 4); tes- tost’erone, testosterone propionate (Fig. 5) .2
111 the spectra presented, transmission is plotted against wave-length. J t should be pointed out that in spectra obtained with solid films, transmis- sion may vary great,ly wihh varying thicknesses and scattering powers of
2 We wish to express our gratitude to the following for donating crystalline ssmples of the steroids studied in this work: Dr. Erwin Schwcnk of the Schering Corporation for testosterone, t,estosterone propionatje, androsterone, and de~lytlroisosulrosteron:~; Dr. It. C. Mautner of Ciha Pharmaceutical Products, Inc., forisoan~llosteron-, an Iros- ta.nrdiol-3(a) ,17(a), androstanediol-3(b), 17(a), androst,anedione-3,17, A5-nndros- t~nediol-3(8).17(ol), As-androstenedioL3(a), 17(p), Ad-androstenedione-3,17; and Dr. Seymour Lieberman and Dr. Konrad Dobriner of the Nfemorial Hospit’al, Neiv \Torlq for 3(a)-hydroayetiocholanone-17 and 3(a)-acct,oxyetiocholanone-17.
by guest on May 15, 2018
http://ww
w.jbc.org/
Dow
nloaded from
378 ABSORPTION SPECTRA OF STEROIDS
Wavelength in ,u.
FIG. 2
different films. Nevertheless, the distribution of absorption bands in the spectrum of any one compound remains constant when different films of that compound are subjected to infra-red analysis.
by guest on May 15, 2018
http://ww
w.jbc.org/
Dow
nloaded from
FURCHGOTT, ROSENKRANTZ, AND SHORR 379
345 6 ‘7 I? 10 11 12
Wavelength in p
FIG. 3
Analysis of Spectra
Absorption bands in the infra-red region studied here result from intera- tomic vibrations, whose frequencies are related to the strength of the atomic
by guest on May 15, 2018
http://ww
w.jbc.org/
Dow
nloaded from
ARSOItPTION SPIXTHA OF ,STlCROIDS
345 6 7 8 9 10 11 12 .4
Wavelength in p
1’10. 1
bonds involved. It should therefore be possible to assign certain absorption bands to particular atomic groups or linkages. This has been accomplished by comparison of the various spectra obtained in this laboratory as well as by a st,udy of the infra-red absorption spectra in the literature (e.g., see
by guest on May 15, 2018
http://ww
w.jbc.org/
Dow
nloaded from
FURCHGOTT, ROSENKRANTZ, AiVD SHORR 381
Barnes et al. (3)). The absorption bands which can be assigned to specific at,omic linkages will be discussed first.
O-H Absorption-A review of the literature (3-G) reveals that absorption bands arising from t,he linear vibration of hydrogen in alcoholic hydroxyl groups occur between 2.75 and 3 p. This rather wide range of absorption has been obtained in studies employing a variety of solvents and concent,ra- tions. However, when alcohols are studied in dilute solutions in carbon letrachloride or chloroform, the hydrosyl band occurs uniformly between 2.75 and 2.77 /.L. From this it has been inferred that the “free” hydroxyl absorpt,ion band occurs at approximately 2.75 p, and tfhat the broader
345 6 I 9 10 11 12
Wavelength in + FIG. 5
range of hydroxyl absorption obtained in other t,han these dilute solutions is due to intermolecular hydrogen bonding. With the series of solid films studied here, the alcoholic hydroxyl absorption bands were also found to oc- cur over a fairly wide range extending from 2.78 to 2.99 p. The concept of int,ermolecular hydrogen bonding may also provide the explanation for the occurrence of hydroxyl bands at wave-lengths above 2.75 p in the case of these solid films. Such bonding would be possible if the hydroxyl groups in these crystalline steroidal preparations were spatially oriented in the prox- imity of other hydroxyl or carbonyl groups in the crystal lattices. Evidence for hydrogen bonding of hydroxyl groups in cry$al lattices of certain
by guest on May 15, 2018
http://ww
w.jbc.org/
Dow
nloaded from
382 SBSORPTION SPECTRA OF STEROIDS
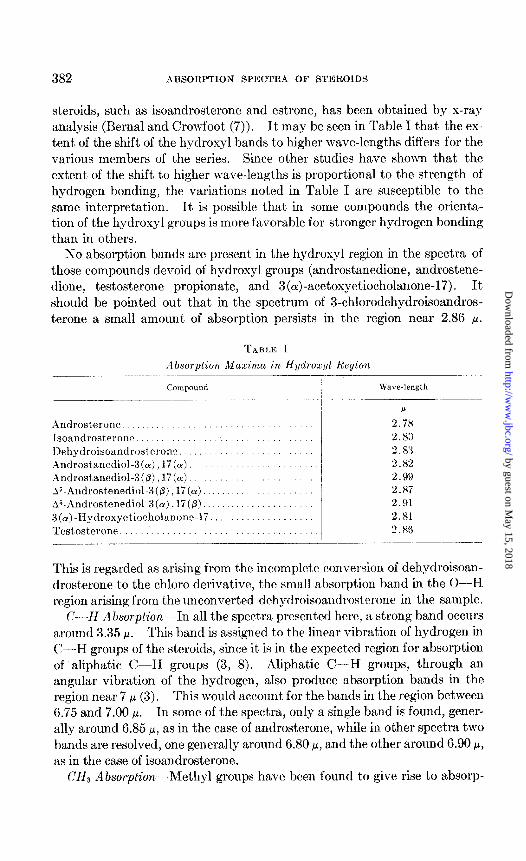
steroids, such as isoandrosterone and estrone, has been obtained by x-ray analysis (Bernal and Crowfoot (7)). It may be seen in Table I that the ex- tent of the shift of the hydroxyl bands to higher wave-lengths differs for the various members of the series. Since other studies have shown that the extent of the shift to higher wave-lengths is proportional to the strength of hydrogen bonding, the variations noted in Table I are susceptible to the same interpretation. It is possible that in some compounds the orienta- tion of the hydroxyl groups is more favorable for stronger hydrogen bonding than in others.
No absorption bands are present, in the hydroxyl region in the spectra of those compounds devoid of hydroxyl groups (androstanedione, androstene- dione, testosterone propionate, and 3(a)-acetoxyetiocholanone-17). It should be pointed out that in the spectrum of 3-chlorodehydroisoandros- terone a small amount of absorption persists in the region near 2.86 /.L.
Compound I Wave-length
--I-- P
Androsterone 2.78 rsoandrosterow 2.23;; lIehydroisoandrost,erone. 2.87 Androstanediol-3(a),l7(a). / 2.82 Androsbmediol-3(B), 17(a). ~5-AIldrostenediol-3(P),17(cu). 1. : /
2.99 2.X?
As-Androstenedio-3(a), IS(p), _. 1 2.91 3(a)-Hydrosyetiocholanorx-Ii.. 2.81 Testosterone...... . .._....._........... 2.86
__-.----.-~.
This is regarded as arising from the incomplete conversion of dehydroisoan- drost,erone to t,he chloro derivative, the small absorption band in the 0-H region arising from the unconverted dehydroisoandrosterone in the sample.
C-H .4 bsorption-In all the spectra presented here, a strong band occurs around 3.35 p. This band is assigned to the linear vibration of hydrogen in C-H groups of the steroids, since it is in the expected region for absorption of aliphatic C:-H groups (3, 8). Aliphatic C-H groups, through an angular vibration of the hydrogen, also produce absorption bands in the region near 7 p (3). This would account for the bands in the region between 6.75 and 7.00 p. In some of the spectra, only a single band is found, gener- ally around 6.85 CL, as in the case of androsterone, while in other spectra two bands are resolved, one generally around 6.80 p, and the other around 6.90 CL, as in the case of isoandrosterone.
C’H, ilbsorption--Methyl groups have been found to give rise to absorp-
by guest on May 15, 2018
http://ww
w.jbc.org/
Dow
nloaded from
FURCHGOTT, ROSE?iKRANTZ, Ah-D SHORR 383
tion bands in the region between 7.20 and 7.30 p (3). In all the spectra presented here, a band occurs between 7.20 and 7.25 p. These bands are interpreted as arising from vibration of the angular methyl groups at Cl0 and G3. In 3 (or)-acetoxyetiocholanone-I 7 and in testosterone propionate, the CHa of the acetyl and propionyl groups would contribute to the absorp- tion in this region.
C=O Absorplion-Carbonyl groups, whether present in ketones, alde- hydes, acids, esters, or anhydrides, absorb in the region bet,ween 5.45 and 6.05 p (3). In the compounds under consideration, the following carbonyl groups are encountered: unconjugated ketones at Ca and Cl,, conjugated ketones at C&, and unconjugated ester carbonyl groups. In compounds in which an unconjugat,ed C17 ketone is the only carbonyl group present, (androsterone, isoandrosterone, dehydroisoandrosterone, I-hydroxyetio- cholanonc-17, and chlorodehydroisoandrosterone), the carbonyl absorption band occurs at about 5.75 p. In androstanedione-3,17 the carbonyl band also occurs at about 5.75 II; apparently the absorption frequencies of the unconjugated C, and Cl7 ketones are so close as to result in only a single large absorption band.
Double bond conjugation of a carbonyl group shifts the absorption to a higher wave-length (3). This is evident in the case of testosterone in which the conjugated Cla ketone absorption occurs at 5.97 P. Ad band at the same position is produced by the same grouping in A4-androstenedione-3, 17. Tn addition, the spectrum of the latter shows a band at 5.75 p, resulting from the unconjugatcd C& ketone. Unconjugated ester carbonyls, as found in 3(a)-acetoxyetiocholanone-17 and testosterone propionate, absorb at about 5.75 /.A In the former compound, the ester absorption band is unresolved from the C1, ketone band, but in the latter, it is clearly resolved from the conjugated Cs ketone band at 5.97 p.
C=C Absorption-h unconjugated C=C group has been found to give rise to an absorption band near 6.0 I-L (3). Conjugation of the double bond in such a group results in a shift of the band to about 6.20 ~1, and generall) to an increase in the intensity of absorption (3). Of the steroids under study, dehydroisoandrosterone, 3-chlorodehydroisoandrosterone, A5-andros- tenediol-3 (a) ,17 (p), and A5-androstenediol-3 (fl) ,17(a) have an unconjugated double bond between C5 and Cs. All of these compounds give a weak ab- sorption band between 5.95 and 6.00 P. In testosterone, testosterone pro- pionate, and A*-androstenedione-3,17, the double bond between Cd and (‘(5 is conjugated with the Ca ketone double bond. To this conjugated C=(J linkage can be assigned the band which occurs at about 6.19 p in the spec- trum of each of these steroids.
C-0 Absorption-Vibration of a C-O linkage when the carbon also has a double bond linkage has been shown to produce an absorption band around 8.0 p (3). This t,ype of grouping occurs in esters. In S(a)-acetoxyetio-
by guest on May 15, 2018
http://ww
w.jbc.org/
Dow
nloaded from
31;4 ~\T3SOIWTIOS SI’EC’TR.\ OF STICROIDS
cholanone-17, it probably accounts for t.he band at 8.02 p and in testosterone propionat*e, for the band at 7.95 p.
If the carbon in a C-O linkage has only single bond linkages, the absorp- tion for the C-O vibration occurs between 9.0 and 10.0 P (3). This type of linkage occurs in all steroids containing hydroxyl groups, and therefore in the spectra of such steroids one might expect to be able to asgign bands in that region to the C-O vibrations. However, in any one spectrum there are generally several bands in that region, not only in the case of steroids containing C-O groups, but frequently. in the case of steroids having no (‘---0 group (e.g. A4-androstenedione-3, 17). This situat,ion necessitated careful cross-comparisons of the spectra of many steroids in the attempt to assign certain wave-lengths of absorption to the C-O linkages of hydroxyl groups. Such cross-comparisons of the spectra in this paper, and also of those spectra to be presented in subsequent papers, have brought out certain relationships between bands occurring in the 9.0 to 10.0 p region and the presence of different t,ypes of hydroxyls in st,eroids. With respect to wrtain types of hydroxyls found in the steroids investigated in the present study, the following findings have been made.
C:j-(p)-Hydroxyl tram to a Cb-hydrogerh-Steroids with this type of hy- droxyl have all given a major band between 9.45 and 9.55 P (e.g., isoandros- terone, 9.47 P ).
C8-(a)-Hydroxyl trans. to a C&ydrogen-Steroids with this type of hy- droxyl have all given a band between 9.45 and 9.55 p. In the case of the 3(a)-hydroxyetiocholanone-17, this band (9.47 P) is not large, but in cert,ain pregnane and cholic acid derivatives having this type of hydroxyl, t,he band in this region is a major one.
(;13-(a)-I3ydroxyl cis to a C&ydrogen-The only steroids so far examined with this type of hydroxyl are androsterone and androstanediol-3 (CL), 17 (a). 130th of t.hrse compounds give a band of medium intensity near 9.4 p and a band of strong inten& near 9.9 cc. Rowever, spectra of additional steroids cont,aining t’his type of hydroxpl are required before bands at either of t.hese wave-lengths can be said with certainty to be related to the (J---O group of the type of hydroxyl in question.
(I;-(B)-Hydroryl accompanied by a (I&‘~ double bond-Steroids with this type of hydroxyl have all given a major band b&n-een 9.40 and 9.45 ,U (E.g., clchydroisandrosterone, !>.-I-1 p).
Cli-IfydTon’yl iram to a (I,,-mcil~yl-St,eroids with this type of hydroxyl have all given a major band between 9.35 and 9.45 Jo (e.g., testosterone, 9.35 and 9.43 p (split band)).
If a steroid has two hydroxyl groups included in the types listed above, the absorption resulting from the presence of the two groups is not always resolved into two bands. For example, in the 9.35 to 9.50 p region, andros-
by guest on May 15, 2018
http://ww
w.jbc.org/
Dow
nloaded from
FURCHGOTT, ROSESKRAXTZ, ASD SHORR 385
t)anediol-3(P), 17(a) gives only one band at 9.47 I.C, and Aj-androstenediol- 3(p), 17(a) gives only one band at 9.43 P.
It is likely that the absorption bands discussed above in relation to dif- ferent types of hydroxyls in steroid molecules result from the vibration of the C-O linkages of the hydroxyl groups. Even if conclusive proof of this is lackmg at t,he present time, it does not detract from the possible useful- ness of these relationships in aiding in the determination of the chemical structure of newly isolat)ed steroids. Finally, it should be reemphasized that major bands sometimes occur nea.r 9.4 and 9.5 p in the spectra of steroids having no hydroxyl groups. Because of this, it is well to bear in mind that major bands in this region should not by themselves be considered conclusive evidence of the presence of any hydroxyl groups in a steroid.
Other Absorption Bands-It is impossible at present to assign the majorit) of the absorption bands in the infra-red spectra of steroids to specific inter- atomic vibrations. Most of these “unassigned” bands occur beyond 10 p. Some of them between 10 and 11 p probably arise from C-C vibrations (3). Many of them undoubtedly result from complex vibrateions involving the steroid nucleus itself. For this reason, it might be expected that steroids with a similar structural configuration in one psrt of the molecule would show certain absorption bands in common. With this possibility in view, cross-comparisons were made of the absorption spect,ra in the region beyond 10 /.l. Several apparent relationships between chemical structure and wave- lengths of major absorption bands were found. Two of these relationships appear to be well enough established to be reported at the present time.
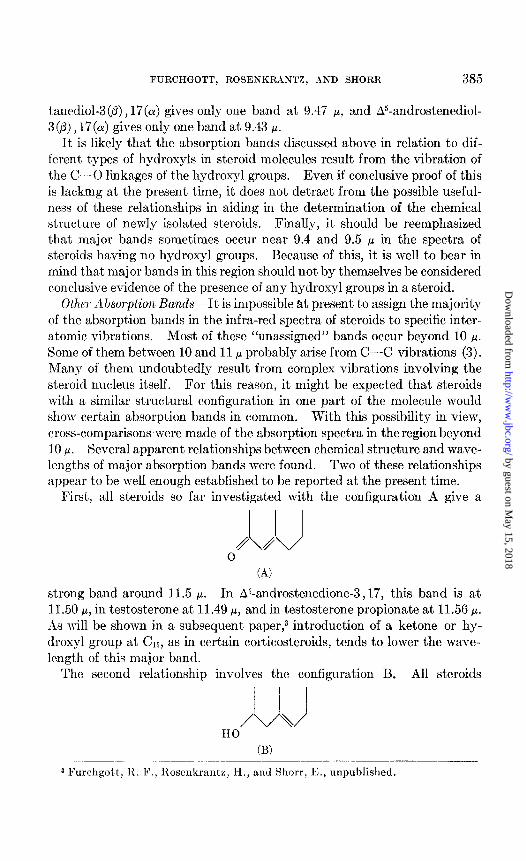
First, all steroids so far investigated with the configuration A give a
(A)
strong band around 11.5 p. In A*-androstenedione-3,17, this band is at 11.50 CL, in testosterone at 11.49 P, and in testosterone propionate at 11.56 cc. As will be shown in a subsequent paper,3 introduction of a ketone or hy- droxyl group at C,,, as in certain corticosteroids, tends to lower the wave- length of this major band.
The second relationship involves the configuration B. All st’eroids
3 Furchgott, I<. E’., llosenkrante. II., and Hhorr, E., unpublished.
by guest on May 15, 2018
http://ww
w.jbc.org/
Dow
nloaded from
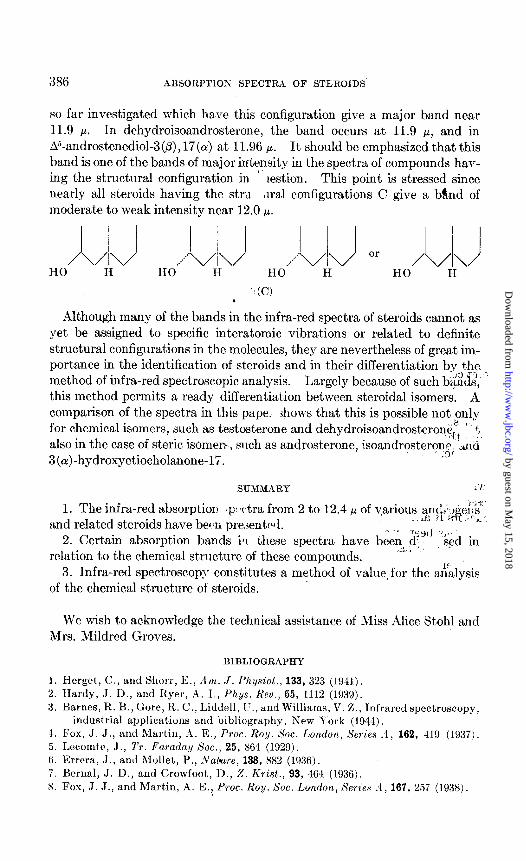
386 ABSORPTIOX SPECTRA OF STEROlDS
so far investigated which have this configuration give a major band near 11.9 /.l. In dehydroisoandrosterone, the band occurs at 11.9 P, and in A5-androstenediol-3(P), 17(0() at 11.96 p. It should be emphasized that this band is one of the bands of major intensity in the spectra of compounds hav- ing the structural configuration in ’ iestion. This point is stressed since nearly all steroids having the stru dral configurations C give a b%nd of moderate to weak intensity near 12.9 ,J.
)“!J Ii HO”
. . . ..G.~ HO/
,....(j J or /(,I,~ HO H H HO H
Although many of the bands in the infra-red spectra of steroids cannot as yet be assigned to specific interatomic vibrations or related to definite structural configurations in the molecules, they are nevertheless of great im- portance in the identification of steroids and in their differentiation by the method of infra-red spectroscopic analysis.
*it, ‘3, Largely because of such bands,
this method permits a ready differentia.tion between steroidal isomers. A comparison of the spectra in this pape: jhows that this is possible not:+y for chemical isomers, such as testosterone and dehydroisoandrosterone ’ ’ +. also in the case of steric isomer
J,j s, such as androsterone, isoandrosterone, &nu
3(a)-hydroxyetiocholanone-17.
SUMMARY ,7 ., 3,
1. The infra-red absorption ,p: ,ctra from 2 to 12.4 p of various ~n$;;~e~$“ and related steroids have bersn preientc~~l.
_. * ‘cgtl j,‘,
2. Certain absorption bands in these spectra have been d’ sed in relation to the chemical structure of these compounds.
..:., .
3. Infra-red spectroscopy constitutes a method of value. for the a&lysis of the chemical structure of steroids.
We wish to acknowledge the technical assistance of Miss Alice Stahl and Mrs. Mildred Groves.
DIBLIOGRAPHY
1. Herget, C., and S~OIT, 13 ., Am. J. Physiol., 133, 323 (1941).
2. Hardy, J. I>., and Ityer, .\. I., Phys. Reu., 66, 1112 (1939).
3. Barnes, K. B., Gore, R. C., Liddell, I,:., and Williams, V. Z., Infrared spectroscopy industrial applications and bibliography, Yew York (1944).
1. Fox, J. J., and Martin, -1. E., hoc. Roy. S’soc. London, A’eries .I, 162, 419 (1937) 5. Lecomte, J., 2'r. Paradoy Sot., 25, 864 (1929). 6. lh-era, J., and Mallet, P., :Vahve, 138, 883 (1936). 7. Bernal, J. D., and Crowfoot, I)., %. Krist., 93, 464 (1936). 8. Fox, ,J. J., and Martin, A. E., hoc. ROT/. Sot. London, Series ‘4, 167, 257 (1938).
by guest on May 15, 2018
http://ww
w.jbc.org/
Dow
nloaded from
Ephraim ShorrRobert F. Furchgott, Harris Rosenkrantz and
RELATED STEROIDSOF STEROIDS: I. ANDROGENS AND INFRA-RED ABSORPTION SPECTRA
1946, 163:375-386.J. Biol. Chem.
http://www.jbc.org/content/163/2/375.citation
Access the most updated version of this article at
Alerts:
When a correction for this article is posted•
When this article is cited•
alerts to choose from all of JBC's e-mailClick here
tml#ref-list-1
http://www.jbc.org/content/163/2/375.citation.full.haccessed free atThis article cites 0 references, 0 of which can be by guest on M
ay 15, 2018http://w
ww
.jbc.org/D
ownloaded from