Embed Size (px)
Citation preview
INFOSYS LIMITED AND SUBSIDIARIES(In ` crore )
Consolidated Balance Sheet as atNote
No.December 31, 2017 March 31, 2017
ASSETS
Non-current assets
Property, plant and equipment 2.2 9,703 9,751
Capital work-in-progress 1,647 1,365
Goodwill 2.3 3,727 3,652
Other intangible assets 2.3 599 776
Investment in associate 2.23 - 71
Financial assets:
Investments 2.4 6,111 6,382
Loans 2.5 39 29
Other financial assets 2.6 315 309
Deferred tax assets (net) 2.15 1,177 540
Income tax assets (net) 2.15 5,514 5,716
Other non-current assets 2.9 910 1,059
Total non-current assets 29,742 29,650
Current assets
Financial assets:
Investments 2.4 2,481 9,970
Trade receivables 2.7 13,143 12,322
Cash and cash equivalents 2.8 20,611 22,625
Loans 2.5 237 272
Other financial assets 2.6 6,235 5,980
Income tax assets (net) 537 -
Other Current assets 2.9 2,969 2,536
Total current assets 46,213 53,705
Total assets 75,955 83,355
EQUITY AND LIABILITIES
Equity
2.11 1,088 1,144
Other equity 59,886 67,838
Total equity attributable to equity holders of the Company 60,974 68,982
Non-controlling interests - -
Total equity 60,974 68,982
Liabilities
Non-current liabilities
Financial Liabilities
Other financial liabilities 2.12 63 70
Deferred tax liabilities (net) 2.15 638 207
Other non-current liabilities 2.13 220 83
Total non-current liabilities 921 360
Current liabilities
Financial Liabilities
Trade payables 502 367
Other financial liabilities 2.12 7,017 6,349
Provisions 2.14 452 405
Income tax liabilities (net) 2.15 2,536 3,885
Other current liabilities 2.13 3,553 3,007
Total current liabilities 14,060 14,013
Total equity and liabilities 75,955 83,355
The accompanying notes form an integral part of the interim consolidated financial statements
As per our report of even date attached
for Deloitte Haskins & Sells LLP for and on behalf of the Board of Directors of Infosys Limited
Chartered Accountants
Firm’s Registration No :
117366W/ W-100018
P. R. Ramesh Nandan M. Nilekani Salil Parekh U. B. Pravin Rao
Partner Chairman Chief Executive officer Chief Operating Officer Membership No. 70928 and Managing Director and Whole-time Director
Bengaluru D. Sundaram M. D. Ranganath A. G. S. Manikantha
January 12, 2018 Director Chief Financial Officer Company Secretary
Equity share capital
INFOSYS LIMITED AND SUBSIDIARIES
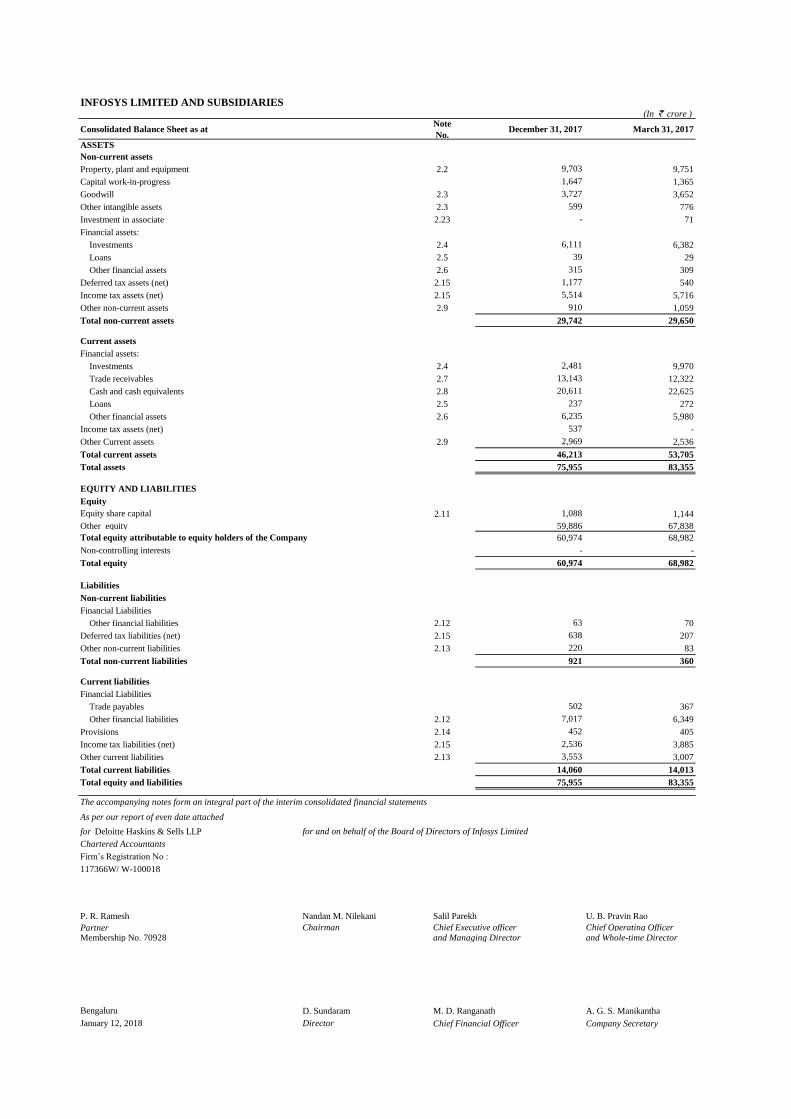
(in ` crore, except equity share and per equity share data)
Note No. 2017 2016 2017 2016
Revenue from operations 2.16 17,794 17,273 52,439 51,364
Other income, net 2.17 962 820 2,659 2,333
Total income 18,756 18,093 55,098 53,697
Expenses
Employee benefit expenses 2.18 9,869 9,420 28,839 28,349
Cost of technical sub-contractors 1,041 975 3,191 2,833
Travel expenses 496 502 1,503 1,762
Cost of software packages and others 2.18 472 461 1,404 1,119
Communication expenses 120 145 376 400
Consultancy and professional charges 238 165 753 505
Depreciation and amortisation expenses 2.2 and 2.3 498 433 1,404 1,257
Other expenses 2.18 741 838 2,293 2,450
Total expenses 13,475 12,939 39,763 38,675
Profit before non-controlling interests/share in net profit/(loss) of associate 5,281 5,154 15,335 15,022
Share in net profit/(loss) of associate - - - (5)
Write-down of investment in associate 2.23 - - (71) -
Profit before tax 5,281 5,154 15,264 15,017
Tax expense:
Current tax 2.15 144 1,468 3,115 4,404
Deferred tax 2.15 8 (22) (190) (136)
Profit for the period 5,129 3,708 12,339 10,749
Other comprehensive income
Items that will not be reclassified subsequently to profit or loss
Remeasurement of the net defined benefit liability/asset 18 (8) 21 (65)
Equity instruments through other comprehensive income, net (2) - (2) -
16 (8) 19 (65)
Items that will be reclassified subsequently to profit or loss
Fair value changes on derivatives designated as cash flow hedge, net 2.10 5 26 (41) 28
(86) (47) 121 (60)
Fair value changes on investments, net (25) - 14 -
(106) (21) 94 (32)
Total other comprehensive income/ (loss), net of tax (90) (29) 113 (97)
Total comprehensive income for the period 5,039 3,679 12,452 10,652
Profit attributable to:
Owners of the Company 5,129 3,708 12,339 10,749
Non-controlling interests - - - -
5,129 3,708 12,339 10,749
Total comprehensive income attributable to:
Owners of the Company 5,039 3,679 12,452 10,652
Non-controlling interests - - - -
5,039 3,679 12,452 10,652
Earnings per Equity share
Equity shares of par value `5/- each
Basic (`) 22.55 16.22 54.06 47.03
Diluted (`) 22.53 16.22 54.02 47.02
Weighted average equity shares used in computing earnings per equity share 2.21
Basic 2,275,074,804 2,285,651,730 2,282,186,771 2,285,638,678
Diluted 2,276,381,570 2,286,229,042 2,284,287,492 2,286,076,462
The accompanying notes form an integral part of the interim consolidated financial statements
As per our report of even date attached
for Deloitte Haskins & Sells LLP for and on behalf of the Board of Directors of Infosys Limited
Chartered Accountants
Firm’s Registration No :
117366W/ W-100018
P. R. Ramesh Nandan M. Nilekani Salil Parekh U. B. Pravin Rao
Partner Chairman Chief Executive officer Chief Operating Officer
Membership No. 70928 and Managing Director and Whole-time Director
Bengaluru D. Sundaram M. D. Ranganath A. G. S. Manikantha
January 12, 2018 Director Chief Financial Officer Company Secretary
Nine months ended December 31,Three months ended December 31,Consolidated Statement of Profit and Loss
Exchange differences on translation of foreign operations
INFOSYS LIMITED AND SUBSIDIARIES
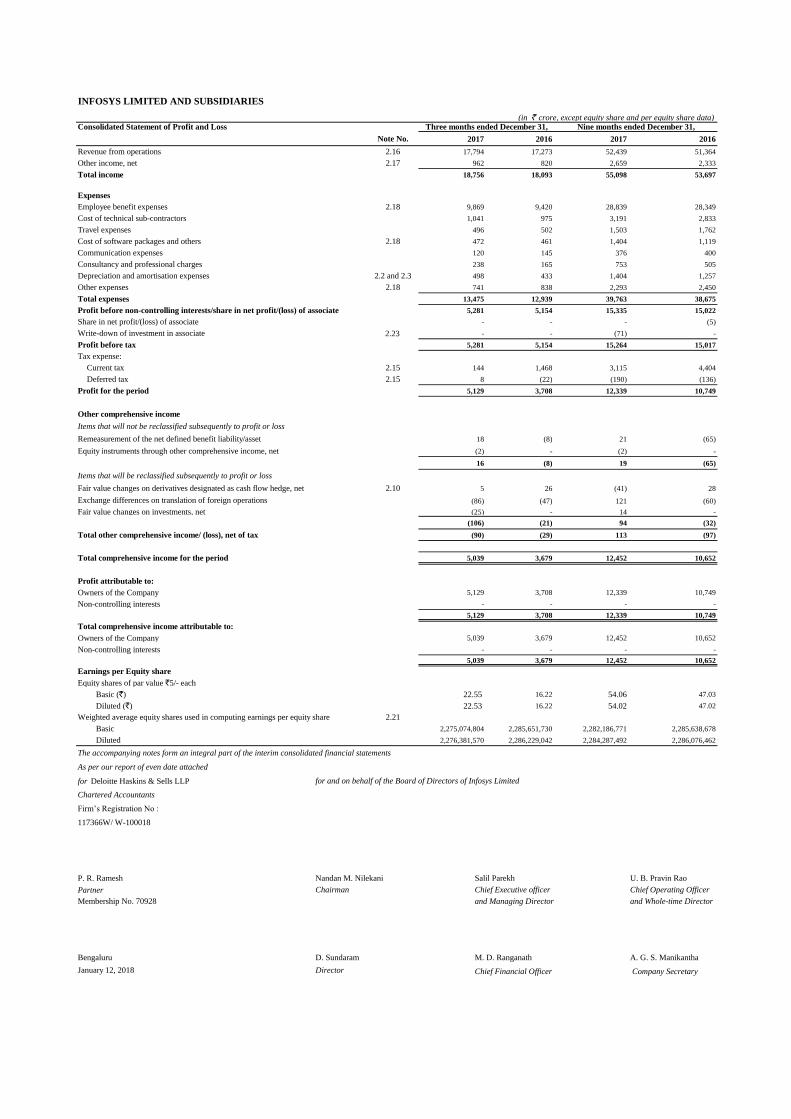
Consolidated Statement of Changes in Equity
(In ` crore )
Particulars
Securities
Premium
Account
Retained
earnings
Capital
reserve
General reserve Share
Options
Outstanding
Account
Special
Economic
Zone Re-
investment
reserve (2)
Other
reserves(3)
Capital
redemption
reserve
Equity
instruments
through
other
comprehens
ive income
Exchange
differences on
translating the
financial
statements of a
foreign
operation
Effective
portion of
Cash Flow
Hedges
Other items of
other
comprehensive
income / (loss)
Balance as at April 1, 2016 1,144 2,213 47,063 54 10,553 8 - 5 - - 715 - (11) 61,744
Changes in equity for the nine months ended December 31, 2016
Income tax benefit arising on exercise of stock options - - - - - 1 - - - - - - - 1
Excersice of stock options (refer note no. 2.11) - 3 - - - (3) - - - - - - - -
Dividends (including corporate dividend tax) - - (6,952) - - - - - - - - - - (6,952)
Transfer to general reserve - - (1,582) - 1,582 - - - - - - - - -
Transferred to Special Economic Zone Re-investment reserve - - (821) - - - 821 - - - - - - -
Transferred from Special Economic Zone Re-investment reserve
on utilization - - 821 - - - (821) - - - - - - -
Share based payments to employees (refer note no. 2.11) - - - - - 71 - - - - - - - 71
Remeasurement of the net defined benefit liability/asset, net of tax
(refer note no. 2.20.1 and 2.15) - - - - - - - - - - - - (65) (65)
Fair value changes on derivatives designated as cash flow hedge,
net of tax (refer note no. 2.10) - - - - - - - - - - - 28 - 28
Profit for the period - - 10,749 - - - - - - - - - - 10,749
Exchange differences on translation of foreign operations - - - - - - - - - - (60) - - (60)
Balance as at December 31, 2016 1,144 2,216 49,278 54 12,135 77 - 5 - - 655 28 (76) 65,516
Equity
Share
capital (1)
Total equity
attributable to
equity holders of
the Company
OTHER EQUITY
Other comprehensive incomeRESERVES & SURPLUS
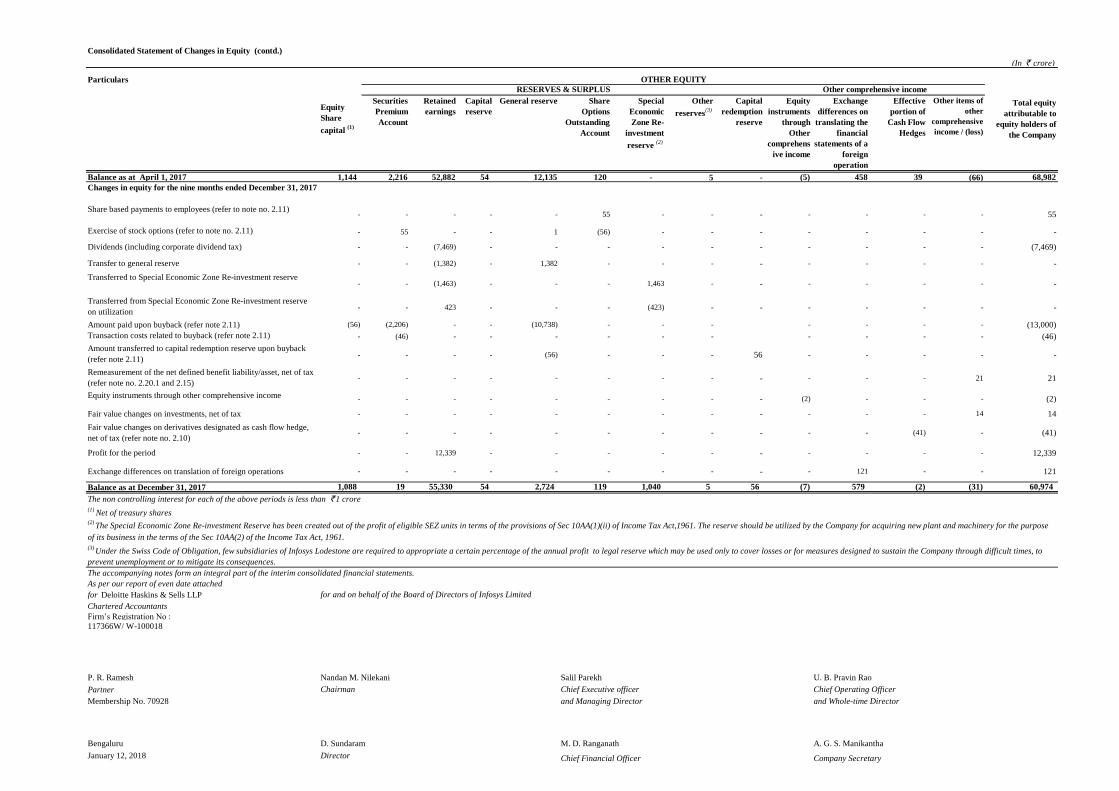
Consolidated Statement of Changes in Equity (contd.)
(In ` crore)
Particulars
Securities
Premium
Account
Retained
earnings
Capital
reserve
General reserve Share
Options
Outstanding
Account
Special
Economic
Zone Re-
investment
reserve (2)
Other
reserves(3)
Capital
redemption
reserve
Equity
instruments
through
Other
comprehens
ive income
Exchange
differences on
translating the
financial
statements of a
foreign
operation
Effective
portion of
Cash Flow
Hedges
Other items of
other
comprehensive
income / (loss)
- Balance as at April 1, 2017 1,144 2,216 52,882 54 12,135 120 - 5 - (5) 458 39 (66) 68,982
Changes in equity for the nine months ended December 31, 2017
Share based payments to employees (refer to note no. 2.11) - - - - - 55 - - - - - - - 55
Exercise of stock options (refer to note no. 2.11) - 55 - - 1 (56) - - - - - - - -
Dividends (including corporate dividend tax) - - (7,469) - - - - - - - - - - (7,469)
Transfer to general reserve - - (1,382) - 1,382 - - - - - - - - -
Transferred to Special Economic Zone Re-investment reserve - - (1,463) - - - 1,463 - - - - - - -
Transferred from Special Economic Zone Re-investment reserve
on utilization - - 423 - - - (423) - - - - - - -
Amount paid upon buyback (refer note 2.11) (56) (2,206) - - (10,738) - - - - - - - (13,000)
Transaction costs related to buyback (refer note 2.11) - (46) - - - - - - - - - - (46)
Amount transferred to capital redemption reserve upon buyback
(refer note 2.11) - - - - (56) - - - 56 - - - - -
Remeasurement of the net defined benefit liability/asset, net of tax
(refer note no. 2.20.1 and 2.15) - - - - - - - - - - - - 21 21
Equity instruments through other comprehensive income - - - - - - - - - (2) - - - (2)
Fair value changes on investments, net of tax - - - - - - - - - - - - 14 14
Fair value changes on derivatives designated as cash flow hedge,
net of tax (refer note no. 2.10) - - - - - - - - - - - (41) - (41)
Profit for the period - - 12,339 - - - - - - - - - - 12,339
Exchange differences on translation of foreign operations - - - - - - - - - - 121 - - 121
Balance as at December 31, 2017 1,088 19 55,330 54 2,724 119 1,040 5 56 (7) 579 (2) (31) 60,974
The non controlling interest for each of the above periods is less than ` 1 crore(1)
Net of treasury shares
The accompanying notes form an integral part of the interim consolidated financial statements.
As per our report of even date attached
for Deloitte Haskins & Sells LLP for and on behalf of the Board of Directors of Infosys Limited
Chartered Accountants
Firm’s Registration No : 117366W/ W-100018
P. R. Ramesh Nandan M. Nilekani Salil Parekh U. B. Pravin Rao
Partner Chairman Chief Executive officer Chief Operating Officer
Membership No. 70928 and Managing Director and Whole-time Director
Bengaluru D. Sundaram M. D. Ranganath A. G. S. Manikantha
January 12, 2018 Director Chief Financial Officer Company Secretary
(2)The Special Economic Zone Re-investment Reserve has been created out of the profit of eligible SEZ units in terms of the provisions of Sec 10AA(1)(ii) of Income Tax Act,1961. The reserve should be utilized by the Company for acquiring new plant and machinery for the purpose
of its business in the terms of the Sec 10AA(2) of the Income Tax Act, 1961. (3)
Under the Swiss Code of Obligation, few subsidiaries of Infosys Lodestone are required to appropriate a certain percentage of the annual profit to legal reserve which may be used only to cover losses or for measures designed to sustain the Company through difficult times, to
prevent unemployment or to mitigate its consequences.
Equity
Share
capital (1)
OTHER EQUITY
Total equity
attributable to
equity holders of
the Company
Other comprehensive incomeRESERVES & SURPLUS
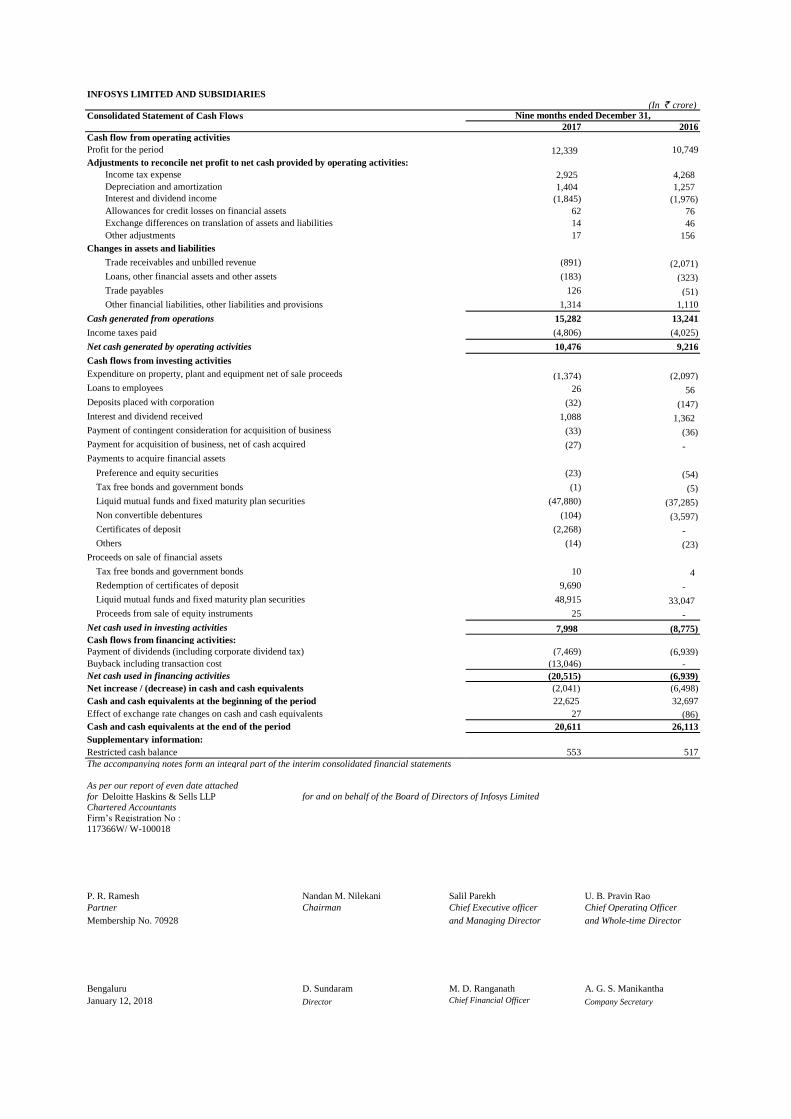
INFOSYS LIMITED AND SUBSIDIARIES
(In ` crore)Consolidated Statement of Cash Flows
2017 2016
Cash flow from operating activities
Profit for the period 12,339 10,749
Income tax expense 2,925 4,268
Depreciation and amortization 1,404 1,257
(1,845) (1,976)
Allowances for credit losses on financial assets 62 76
Exchange differences on translation of assets and liabilities 14 46
Other adjustments 17 156
Changes in assets and liabilities
Trade receivables and unbilled revenue (891) (2,071)
Loans, other financial assets and other assets (183) (323)
Trade payables 126 (51)
Other financial liabilities, other liabilities and provisions 1,314 1,110
Cash generated from operations 15,282 13,241
Income taxes paid (4,806) (4,025)
Net cash generated by operating activities 10,476 9,216
Cash flows from investing activities
(1,374) (2,097)
Loans to employees 26 56
Deposits placed with corporation (32) (147)
1,088 1,362
Payment of contingent consideration for acquisition of business (33) (36)
Payment for acquisition of business, net of cash acquired (27) -
Payments to acquire financial assets
Preference and equity securities (23) (54)
Tax free bonds and government bonds (1) (5)
Liquid mutual funds and fixed maturity plan securities (47,880) (37,285)
Non convertible debentures (104) (3,597)
Certificates of deposit (2,268) -
Others (14) (23)
Proceeds on sale of financial assets
Tax free bonds and government bonds 10 4
Redemption of certificates of deposit 9,690 -
Liquid mutual funds and fixed maturity plan securities 48,915 33,047
Proceeds from sale of equity instruments 25 -
Net cash used in investing activities 7,998 (8,775)
Cash flows from financing activities:
Payment of dividends (including corporate dividend tax) (7,469) (6,939)
Buyback including transaction cost (13,046) -
Net cash used in financing activities (20,515) (6,939)
Net increase / (decrease) in cash and cash equivalents (2,041) (6,498)
Cash and cash equivalents at the beginning of the period 22,625 32,697
Effect of exchange rate changes on cash and cash equivalents 27 (86)
Cash and cash equivalents at the end of the period 20,611 26,113
Supplementary information:
Restricted cash balance 553 517
The accompanying notes form an integral part of the interim consolidated financial statements
As per our report of even date attached
for Deloitte Haskins & Sells LLP for and on behalf of the Board of Directors of Infosys LimitedChartered AccountantsFirm’s Registration No : 117366W/ W-100018
P. R. Ramesh Nandan M. Nilekani Salil Parekh U. B. Pravin Rao
Partner Chairman Chief Executive officer Chief Operating Officer
Membership No. 70928 and Managing Director and Whole-time Director
Bengaluru D. Sundaram M. D. Ranganath A. G. S. Manikantha
January 12, 2018 Director Chief Financial Officer Company Secretary
Interest and dividend received
Nine months ended December 31,
Expenditure on property, plant and equipment net of sale proceeds
Adjustments to reconcile net profit to net cash provided by operating activities:
Interest and dividend income
INFOSYS LIMITED AND SUBSIDIARIES
Notes to the interim consolidated financial statements
1. Company overview and significant accounting policies
1.1 Company overview
Infosys Limited ('the Company' or Infosys) is a leading provider of consulting, technology, outsourcing and next-generation services and software. Along with its subsidiaries, Infosys
provides Business IT services (comprising application development and maintenance, independent validation, infrastructure management, engineering services comprising product
engineering and life cycle solutions and business process management); Consulting and systems integration services (comprising consulting, enterprise solutions, systems integration and
advanced technologies); Products, business platforms and solutions to accelerate intellectual property-led innovation. Its new offerings span areas like digital, big data and analytics, cloud,
data and mainframe modernization, cyber security, IoT engineering Services and API & micro services.
Infosys together with its subsidiaries and controlled trusts is herein after referred to as 'the Group'.
The Company is a public limited company incorporated and domiciled in India and has its registered office at Bengaluru, Karnataka, India. The Company has its primary listings on the
BSE Limited and National Stock Exchange of India Limited in India. The Company’s American Depositary Shares (ADSs) representing equity shares are also listed on the New York Stock
Exchange (NYSE), Euronext London and Euronext Paris.
The Group's interim consolidated financial statements are approved for issue by the Company's Board of Directors on January 12, 2018.
1.2 Basis of preparation of financial statements
These interim consolidated financial statements are prepared in accordance with Indian Accounting Standards (Ind AS), 'Interim Financial Reporting', under the historical cost convention
on the accrual basis except for certain financial instruments which are measured at fair values, the provisions of the Companies Act, 2013 ('the Act') (to the extent notified) and guidelines
issued by the Securities and Exchange Board of India (SEBI). The Ind AS are prescribed under Section 133 of the Act read with Rule 3 of the Companies (Indian Accounting Standards)
Rules, 2015 and Companies (Indian Accounting Standards) Amendment Rules, 2016.
Effective April 1, 2016, the Group has adopted all the Ind AS standards and the adoption was carried out in accordance with Ind AS 101 - First time adoption of Indian Accounting
Standards, with April 1, 2015 as the transition date. The transition was carried out from Indian Accounting Principles generally accepted in India as prescribed under Sec 133 of the Act,
read with Rule 7 of the Companies (Accounts) Rules, 2014 (IGAAP), which was the previous GAAP.
Accounting policies have been consistently applied except where a newly issued accounting standard is initially adopted or a revision to an existing accounting standard requires a change
in the accounting policy hitherto in use.
Amounts for the three months and nine months ended December 31, 2016 and year ended March 31, 2017 were audited by previous auditors - B S R & Co LLP.
As the quarter and period-to-date figures are taken from the source and rounded to the nearest digits, the quarter figures in this statement added up to the figures reported for the previous
quarters might not always add up to the year-to-date figures reported in this statement
1.3 Basis of consolidation
Infosys consolidates entities which it owns or controls. The consolidated financial statements comprise the financial statements of the Company, its controlled trusts, its subsidiaries and
associate, as disclosed in Note no. 2.23. Control exists when the parent has power over the entity, is exposed, or has rights, to variable returns from its involvement with the entity and has
the ability to affect those returns by using its power over the entity. Power is demonstrated through existing rights that give the ability to direct relevant activities, those which significantly
affect the entity's returns. Subsidiaries are consolidated from the date control commences until the date control ceases.
The financial statements of the Group Companies are consolidated on a line-by-line basis and intra-group balances and transactions including unrealized gain / loss from such transactions
are eliminated upon consolidation. These financial statements are prepared by applying uniform accounting policies in use at the Group. Non-controlling interests which represent part of
the net profit or loss and net assets of subsidiaries that are not, directly or indirectly, owned or controlled by the Company, are excluded.
Associates are entities over which the Group has significant influence but not control. Investments in associates are accounted for using the equity method of accounting. The investment is
initially recognized at cost, and the carrying amount is increased or decreased to recognize the investor’s share of the profit or loss of the investee after the acquisition date. The Group’s
investment in associates includes goodwill identified on acquisition.
1.4 Use of estimates
The preparation of the financial statements in conformity with Ind AS requires the management to make estimates, judgements and assumptions. These estimates, judgements and
assumptions affect the application of accounting policies and the reported amounts of assets and liabilities, the disclosures of contingent assets and liabilities at the date of the financial
statements and reported amounts of revenues and expenses during the period. Application of accounting policies that require critical accounting estimates involving complex and subjective
judgements and the use of assumptions in these financial statements have been disclosed in Note no. 1.5. Accounting estimates could change from period to period. Actual results could
differ from those estimates. Appropriate changes in estimates are made as management becomes aware of changes in circumstances surrounding the estimates. Changes in estimates are
reflected in the financial statements in the period in which changes are made and, if material, their effects are disclosed in the notes to the interim consolidated financial statements.
1.5 Critical accounting estimates
a. Revenue recognition
The Group uses the percentage-of-completion method in accounting for its fixed-price contracts. Use of the percentage-of-completion method requires the Group to estimate the efforts or
costs expended to date as a proportion of the total efforts or costs to be expended. Efforts or costs expended have been used to measure progress towards completion as there is a direct
relationship between input and productivity. Provisions for estimated losses, if any, on uncompleted contracts are recorded in the period in which such losses become probable based on the
expected contract estimates at the reporting date.
b. Income taxes
The Company's two major tax jurisdictions are India and the U.S., though the Company also files tax returns in other overseas jurisdictions. Significant judgements are involved in
determining the provision for income taxes, including amount expected to be paid/recovered for uncertain tax positions. Also refer to Note no. 2.15 and 2.22
c. Business combinations and intangible assets
Business combinations are accounted for using Ind AS 103, Business Combinations. Ind AS 103 requires the identifiable intangible assets and contingent consideration to be fair valued in
order to ascertain the net fair value of identifiable assets, liabilities and contingent liabilities of the acquiree. Significant estimates are required to be made in determining the value of
contingent consideration and intangible assets. These valuations are conducted by independent valuation experts.
d. Property, plant and equipment
Property, plant and equipment represent a significant proportion of the asset base of the Group. The charge in respect of periodic depreciation is derived after determining an estimate of an
asset’s expected useful life and the expected residual value at the end of its life. The useful lives and residual values of Group's assets are determined by management at the time the asset is
acquired and reviewed periodically, including at each financial year end. The lives are based on historical experience with similar assets as well as anticipation of future events, which may
impact their life, such as changes in technology.
e. Impairment of Goodwill
Goodwill is tested for impairment on an annual basis and whenever there is an indication that the recoverable amount of a cash generating unit (CGUs) is less than its carrying amount
based on a number of factors including operating results, business plans, future cash flows and economic conditions. The recoverable amount of CGUs is determined based on higher of
value-in-use and fair value less cost to sell. The goodwill impairment test is performed at the level of the CGU or groups of cash-generating units which are benefiting from the synergies of
the acquisition and which represents the lowest level at which goodwill is monitored for internal management purposes.
Market related information and estimates are used to determine the recoverable amount. Key assumptions on which management has based its determination of recoverable amount include
estimated long term growth rates, weighted average cost of capital and estimated operating margins. Cash flow projections take into account past experience and represent management’s
best estimate about future developments.
1.6 Revenue recognition
The Company derives revenues primarily from software development and related services and from the licensing of software products. Arrangements with customers for software related
services are either on a fixed-price, fixed-timeframe or on a time-and-material basis.
Revenue on time-and-material contracts are recognized as the related services are performed and revenue from the end of the last billing to the Balance Sheet date is recognized as unbilled
revenues. Revenue from fixed-price, fixed-timeframe contracts, where there is no uncertainty as to measurement or collectability of consideration, is recognized as per the percentage-of-
completion method. When there is uncertainty as to measurement or ultimate collectability, revenue recognition is postponed until such uncertainty is resolved. Efforts or costs expended
have been used to measure progress towards completion as there is a direct relationship between input and productivity. Provisions for estimated losses, if any, on uncompleted contracts
are recorded in the period in which such losses become probable based on the current contract estimates. Costs and earnings in excess of billings are classified as unbilled revenue, while
billings in excess of costs and earnings are classified as unearned revenue. Deferred contract costs are amortized over the term of the contract. Maintenance revenue is recognized rateably
over the term of the underlying maintenance arrangement.
In arrangements for software development and related services and maintenance services, the Company has applied the guidance in Ind AS 18, Revenue, by applying the revenue
recognition criteria for each separately identifiable component of a single transaction. The arrangements generally meet the criteria for considering software development and related
services as separately identifiable components. For allocating the consideration, the Company has measured the revenue in respect of each separable component of a transaction at its fair
value, in accordance with principles given in Ind AS 18. The price that is regularly charged for an item when sold separately is the best evidence of its fair value. In cases where the
Company is unable to establish objective and reliable evidence of fair value for the software development and related services, the Company has used a residual method to allocate the
arrangement consideration. In these cases the balance of the consideration, after allocating the fair values of undelivered components of a transaction has been allocated to the delivered
components for which specific fair values do not exist.
License fee revenues are recognized when the general revenue recognition criteria given in Ind AS 18 are met. Arrangements to deliver software products generally have three elements:
license, implementation and Annual Technical Services (ATS). The Company has applied the principles given in Ind AS 18 to account for revenues from these multiple element
arrangements. Objective and reliable evidence of fair value has been established for ATS. Objective and reliable evidence of fair value is the price charged when the element is sold
separately. When other services are provided in conjunction with the licensing arrangement and objective and reliable evidence of their fair values have been established, the revenue from
such contracts are allocated to each component of the contract in a manner, whereby revenue is deferred for the undelivered services and the residual amounts are recognized as revenue for
delivered elements. In the absence of objective and reliable evidence of fair value for implementation, the entire arrangement fee for license and implementation is recognized using the
percentage-of-completion method as the implementation is performed. Revenue from client training, support and other services arising due to the sale of software products is recognized as
the services are performed. ATS revenue is recognized rateably over the period in which the services are rendered.
Advances received for services and products are reported as client deposits until all conditions for revenue recognition are met.
The Group accounts for volume discounts and pricing incentives to customers as a reduction of revenue based on the rateable allocation of the discounts/ incentives amount to each of the
underlying revenue transaction that results in progress by the customer towards earning the discount/ incentive. Also, when the level of discount varies with increase in levels of revenue
transactions, the Company recognizes the liability based on its estimate of the customer's future purchases. If it is probable that the criteria for the discount will not be met, or if the amount
thereof cannot be estimated reliably, then discount is not recognized until the payment is probable and the amount can be estimated reliably. The Company recognizes changes in the
estimated amount of obligations for discounts in the period in which the change occurs. The discounts are passed on to the customer either as direct payments or as a reduction of payments
due from the customer.
The Group presents revenues net of indirect taxes in its Statement of Profit and Loss.
1.7 Property, plant and equipment
Property, plant and equipment are stated at cost, less accumulated depreciation and impairment, if any. Costs directly attributable to acquisition are capitalized until the property, plant and
equipment are ready for use, as intended by management. The Group depreciates property, plant and equipment over their estimated useful lives using the straight-line method. The
estimated useful lives of assets are as follows:
Buildings (1)
22-25 years
Plant and machinery (1)
5 years
Office equipment 5 years
Computer equipment (1)
3-5 years
Furniture and fixtures (1)
5 years
Vehicles(1)
5 years
Leasehold improvements Over lease term
(1)Based on technical evaluation, the management believes that the useful lives as given above best represent the period over which management expects to use these assets. Hence, the
useful lives for these assets is different from the useful lives as prescribed under Part C of Schedule II of the Companies Act 2013.
Depreciation methods, useful lives and residual values are reviewed periodically, including at each financial year end.
Advances paid towards the acquisition of property, plant and equipment outstanding at each Balance Sheet date is classified as capital advances under other non-current assets and the cost
of assets not put to use before such date are disclosed under ‘Capital work-in-progress’. Subsequent expenditures relating to property, plant and equipment is capitalized only when it is
probable that future economic benefits associated with these will flow to the Group and the cost of the item can be measured reliably. Repairs and maintenance costs are recognized in net
profit in the Statement of Profit and Loss when incurred. The cost and related accumulated depreciation are eliminated from the financial statements upon sale or retirement of the asset and
the resultant gains or losses are recognized in the Statement of Profit and Loss. Assets to be disposed off are reported at the lower of the carrying value or the fair value less cost to sell.
1.8 Business combinations
Business combinations have been accounted for using the acquisition method under the provisions of Ind AS 103, Business Combinations.
The cost of an acquisition is measured at the fair value of the assets transferred, equity instruments issued and liabilities incurred or assumed at the date of acquisition, which is the date on
which control is transferred to the Group. The cost of acquisition also includes the fair value of any contingent consideration. Identifiable assets acquired and liabilities and contingent
liabilities assumed in a business combination are measured initially at their fair value on the date of acquisition.
Business combinations between entities under common control is accounted for at carrying value.
Transaction costs that the Group incurs in connection with a business combination such as finder’s fees, legal fees, due diligence fees, and other professional and consulting fees are
expensed as incurred.
1.9 Goodwill
Goodwill represents the cost of business acquisition in excess of the Group's interest in the net fair value of identifiable assets, liabilities and contingent liabilities of the acquiree. When the
net fair value of the identifiable assets, liabilities and contingent liabilities acquired exceeds the cost of business acquisition, a gain is recognized immediately in net profit in the Statement
of Profit and Loss. Goodwill is measured at cost less accumulated impairment losses.
1.10 Intangible assets
Intangible assets are stated at cost less accumulated amortization and impairment. Intangible assets are amortized over their respective individual estimated useful lives on a straight-line
basis, from the date that they are available for use. The estimated useful life of an identifiable intangible asset is based on a number of factors including the effects of obsolescence,
demand, competition, and other economic factors (such as the stability of the industry, and known technological advances), and the level of maintenance expenditures required to obtain the
expected future cash flows from the asset. Amortization methods and useful lives are reviewed periodically including at each financial year end.
Research costs are expensed as incurred. Software product development costs are expensed as incurred unless technical and commercial feasibility of the project is demonstrated, future
economic benefits are probable, the Company has an intention and ability to complete and use or sell the software and the costs can be measured reliably. The costs which can be
capitalized include the cost of material, direct labour, overhead costs that are directly attributable to preparing the asset for its intended use. Research and development costs and software
development costs incurred under contractual arrangements with customers are accounted in the Statement of Profit and Loss.
1.11 Financial instruments
1.11.1 Initial recognition
The Group recognizes financial assets and financial liabilities when it becomes a party to the contractual provisions of the instrument. All financial assets and liabilities are recognized at
fair value on initial recognition, except for trade receivables which are initially measured at transaction price. Transaction costs that are directly attributable to the acquisition or issue of
financial assets and financial liabilities, that are not at fair value through profit or loss, are added to the fair value on initial recognition. Regular way purchase and sale of financial assets
are accounted for at trade date.
1.11.2 Subsequent measurement
a. Non-derivative financial instruments
(i) Financial assets carried at amortized cost
A financial asset is subsequently measured at amortized cost if it is held within a business model whose objective is to hold the asset in order to collect contractual cash flows and the
contractual terms of the financial asset give rise on specified dates to cash flows that are solely payments of principal and interest on the principal amount outstanding.
(ii) Financial assets at fair value through other comprehensive income(FVOCI)
A financial asset is subsequently measured at fair value through other comprehensive income if it is held within a business model whose objective is achieved by both collecting contractual
cash flows and selling financial assets and the contractual terms of the financial asset give rise on specified dates to cash flows that are solely payments of principal and interest on the
principal amount outstanding. The Company has made an irrevocable election for its investments which are classified as equity instruments to present the subsequent changes in fair value
in other comprehensive income based on its business model. Further, in cases where the Group has made an irrevocable election based on its business model, for its investments which are
classified as equity instruments, the subsequent changes in fair value are recognized in other comprehensive income(OCI).
(iii) Financial assets at fair value through profit or loss
A financial asset which is not classified in any of the above categories is subsequently fair valued through profit or loss.
(iv) Financial liabilities
Financial liabilities are subsequently carried at amortized cost using the effective interest method, except for contingent consideration recognized in a business combination which is
subsequently measured at fair value through profit and loss. For trade and other payables maturing within one year from the Balance Sheet date, the carrying amounts approximate the fair
value due to the short maturity of these instruments.
b. Derivative financial instruments
The Group holds derivative financial instruments such as foreign exchange forward and option contracts to mitigate the risk of changes in exchange rates on foreign currency exposures.
The counterparty for these contracts is generally a bank.
(i) Financial assets or financial liabilities, at fair value through profit or loss.
This category has derivative financial assets or liabilities which are not designated as hedges.
Although the Group believes that these derivatives constitute hedges from an economic perspective, they may not qualify for hedge accounting under Ind AS 109, Financial Instruments.
Any derivative that is either not designated as hedge, or is so designated but is ineffective as per Ind AS 109, is categorized as a financial asset or financial liability, at fair value through
profit or loss.
Derivatives not designated as hedges are recognized initially at fair value and attributable transaction costs are recognized in net profit in the Statement of Profit and Loss when incurred.
Subsequent to initial recognition, these derivatives are measured at fair value through profit or loss and the resulting exchange gains or losses are included in other income. Assets/
liabilities in this category are presented as current assets/current liabilities if they are either held for trading or are expected to be realized within 12 months after the Balance Sheet date.
(ii) Cash flow hedge
The Group designates certain foreign exchange forward and options contracts as cash flow hedges to mitigate the risk of foreign exchange exposure on highly probable forecast cash
transactions.
When a derivative is designated as a cash flow hedging instrument, the effective portion of changes in the fair value of the derivative is recognized in other comprehensive income and
accumulated in the cash flow hedging reserve. Any ineffective portion of changes in the fair value of the derivative is recognized immediately in the net profit in the Statement of Profit and
Loss. If the hedging instrument no longer meets the criteria for hedge accounting, then hedge accounting is discontinued prospectively. If the hedging instrument expires or is sold,
terminated or exercised, the cumulative gain or loss on the hedging instrument recognized in cash flow hedging reserve till the period the hedge was effective remains in cash flow hedging
reserve until the forecasted transaction occurs. The cumulative gain or loss previously recognized in the cash flow hedging reserve is transferred to the net profit in the Statement of Profit
and Loss upon the occurrence of the related forecasted transaction. If the forecasted transaction is no longer expected to occur, then the amount accumulated in cash flow hedging reserve
is reclassified to net profit in the Statement of Profit and Loss.
c. Share capital and treasury shares
(i) Ordinary Shares
Ordinary shares are classified as equity. Incremental costs directly attributable to the issuance of new ordinary shares and share options are recognized as a deduction from equity, net of
any tax effects.
(ii) Treasury Shares
When any entity within the Group purchases the Company's ordinary shares, the consideration paid including any directly attributable incremental cost, is presented as a deduction from
total equity, until they are cancelled, sold or reissued. When treasury shares are sold or reissued subsequently, the amount received is recognized as an increase in equity, and the resulting
surplus or deficit on the transaction is transferred to/ from share premium.
1.11.3 Derecognition of financial instruments
The Group derecognizes a financial asset when the contractual rights to the cash flows from the financial asset expire or it transfers the financial asset and the transfer qualifies for
derecognition under Ind AS 109. A financial liability (or a part of a financial liability) is derecognized from the Group's Balance Sheet when the obligation specified in the contract is
discharged or cancelled or expires.
1.12 Fair value of financial instruments
In determining the fair value of its financial instruments, the Group uses a variety of methods and assumptions that are based on market conditions and risks existing at each reporting date.
The methods used to determine fair value include discounted cash flow analysis, available quoted market prices and dealer quotes. All methods of assessing fair value result in general
approximation of value, and such value may never actually be realized.
Refer to Note no. 2.10 for the disclosure on carrying value and fair value of financial assets and liabilities. For financial assets and liabilities maturing within one year from the Balance
Sheet date and which are not carried at fair value, the carrying amounts approximates fair value due to the short maturity of those instruments.
1.13 Impairment
a. Financial assets
The Group recognizes loss allowances using the expected credit loss (ECL) model for the financial assets which are not fair valued through profit or loss. Loss allowance for trade
receivables with no significant financing component is measured at an amount equal to lifetime ECL. For all other financial assets, ECLs are measured at an amount equal to the 12-month
ECL, unless there has been a significant increase in credit risk from initial recognition in which case those are measured at lifetime ECL. The amount of ECLs (or reversal) that is required
to adjust the loss allowance at the reporting date to the amount that is required to be recognised is recognized as an impairment gain or loss in Statement of Profit or Loss.
b. Non-financial assets
(i) Goodwill
Goodwill is tested for impairment on an annual basis and whenever there is an indication that goodwill may be impaired, relying on a number of factors including operating results,
business plans and future cash flows. For the purpose of impairment testing, goodwill acquired in a business combination is allocated to the Group's cash generating units (CGU) or groups
of CGU’s expected to benefit from the synergies arising from the business combination. A CGU is the smallest identifiable group of assets that generates cash inflows that are largely
independent of the cash inflows from other assets or group of assets. Impairment occurs when the carrying amount of a CGU including the goodwill, exceeds the estimated recoverable
amount of the CGU. The recoverable amount of a CGU is the higher of its fair value less cost to sell and its value-in-use. Value-in-use is the present value of future cash flows expected to
be derived from the CGU.
Total impairment loss of a CGU is allocated first to reduce the carrying amount of goodwill allocated to the CGU and then to the other assets of the CGU pro-rata on the basis of the
carrying amount of each asset in the CGU. An impairment loss on goodwill is recognized in net profit in the Statement of Profit and Loss and is not reversed in the subsequent period.
(ii) Intangible assets and property, plant and equipment
Intangible assets and property, plant and equipment are evaluated for recoverability whenever events or changes in circumstances indicate that their carrying amounts may not be
recoverable. For the purpose of impairment testing, the recoverable amount (i.e. the higher of the fair value less cost to sell and the value-in-use) is determined on an individual asset basis
unless the asset does not generate cash flows that are largely independent of those from other assets. In such cases, the recoverable amount is determined for the CGU to which the asset
belongs.
If such assets are considered to be impaired, the impairment to be recognized in the Statement of Profit and Loss is measured by the amount by which the carrying value of the assets
exceeds the estimated recoverable amount of the asset. An impairment loss is reversed in the Statement of Profit and Loss if there has been a change in the estimates used to determine the
recoverable amount. The carrying amount of the asset is increased to its revised recoverable amount, provided that this amount does not exceed the carrying amount that would have been
determined (net of any accumulated amortization or depreciation) had no impairment loss been recognized for the asset in prior years.
1.14 Provisions
A provision is recognized if, as a result of a past event, the Group has a present legal or constructive obligation that is reasonably estimable, and it is probable that an outflow of economic
benefits will be required to settle the obligation. Provisions are determined by discounting the expected future cash flows at a pre-tax rate that reflects current market assessments of the
time value of money and the risks specific to the liability.
a. Post sales client support
The Group provides its clients with a fixed-period post sales support for corrections of errors and support on all its fixed-price, fixed-timeframe contracts. Costs associated with such
support services are accrued at the time related revenues are recorded and included in cost of sales. The Group estimates such costs based on historical experience and estimates are
reviewed on a periodic basis for any material changes in assumptions and likelihood of occurrence.
b. Onerous contracts
Provisions for onerous contracts are recognized when the expected benefits to be derived by the Group from a contract are lower than the unavoidable costs of meeting the future
obligations under the contract. The provision is measured at the present value of the lower of the expected cost of terminating the contract and the expected net cost of continuing with the
contract. Before a provision is established the Group recognizes any impairment loss on the assets associated with that contract.
1.15 Foreign currency
Functional currency
The functional currency of Infosys, Infosys BPM (formerly Infosys BPO), controlled trusts, EdgeVerve and Skava is the Indian rupee. The functional currencies for Infosys Australia,
Infosys China, Infosys Mexico, Infosys Sweden, Infosys Brasil, Infosys Public Services, Infosys Shanghai, Infosys Lodestone, Infosys Americas, Infosys Nova, Infosys Consulting Pte Ltd.,
Panaya, Kallidus and Noah are the respective local currencies. These financial statements are presented in Indian rupees (rounded off to crore; one crore equals ten million).
Transactions and translations
Foreign-currency denominated monetary assets and liabilities are translated into the relevant functional currency at exchange rates in effect at the Balance Sheet date. The gains or losses
resulting from such translations are included in net profit in the Statement of Profit and Loss. Non-monetary assets and non-monetary liabilities denominated in a foreign currency and
measured at fair value are translated at the exchange rate prevalent at the date when the fair value was determined. Non-monetary assets and non-monetary liabilities denominated in a
foreign currency and measured at historical cost are translated at the exchange rate prevalent at the date of transaction.
Transaction gains or losses realized upon settlement of foreign currency transactions are included in determining net profit for the period in which the transaction is settled. Revenue,
expense and cash-flow items denominated in foreign currencies are translated into the relevant functional currencies using the exchange rate in effect on the date of the transaction.
The translation of financial statements of the foreign subsidiaries to the presentation currency is performed for assets and liabilities using the exchange rate in effect at the Balance Sheet
date and for revenue, expense and cash-flow items using the average exchange rate for the respective periods. The gains or losses resulting from such translation are included in currency
translation reserves under other components of equity. When a subsidiary is disposed off, in full, the relevant amount is transferred to net profit in the Statement of Profit and Loss.
However when a change in the parent's ownership does not result in loss of control of a subsidiary, such changes are recorded through equity.
Goodwill and fair value adjustments arising on the acquisition of a foreign entity are treated as assets and liabilities of the foreign entity and translated at the exchange rate in effect at the
Balance Sheet date.
1.16 Earnings per equity share
Basic earnings per equity share is computed by dividing the net profit attributable to the equity holders of the Company by the weighted average number of equity shares outstanding during
the period. Diluted earnings per equity share is computed by dividing the net profit attributable to the equity holders of the Company by the weighted average number of equity shares
considered for deriving basic earnings per equity share and also the weighted average number of equity shares that could have been issued upon conversion of all dilutive potential equity
shares. The dilutive potential equity shares are adjusted for the proceeds receivable had the equity shares been actually issued at fair value (i.e. the average market value of the outstanding
equity shares). Dilutive potential equity shares are deemed converted as of the beginning of the period, unless issued at a later date. Dilutive potential equity shares are determined
independently for each period presented.
The number of equity shares and potentially dilutive equity shares are adjusted retrospectively for all periods presented for any share splits and bonus shares issues including for changes
effected prior to the approval of the financial statements by the Board of Directors.
1.17 Income taxes
Income tax expense comprises current and deferred income tax. Income tax expense is recognized in net profit in the Statement of Profit and Loss except to the extent that it relates to items
recognized directly in equity, in which case it is recognized in other comprehensive income. Current income tax for current and prior periods is recognized at the amount expected to be
paid to or recovered from the tax authorities, using the tax rates and tax laws that have been enacted or substantively enacted by the Balance Sheet date. Deferred income tax assets and
liabilities are recognized for all temporary differences arising between the tax bases of assets and liabilities and their carrying amounts in the financial statements except when the deferred
income tax arises from the initial recognition of goodwill or an asset or liability in a transaction that is not a business combination and affects neither accounting nor taxable profit or loss at
the time of the transaction. Deferred tax assets are reviewed at each reporting date and are reduced to the extent that it is no longer probable that the related tax benefit will be realized.
Deferred income tax assets and liabilities are measured using tax rates and tax laws that have been enacted or substantively enacted by the Balance Sheet date and are expected to apply to
taxable income in the years in which those temporary differences are expected to be recovered or settled. The effect of changes in tax rates on deferred income tax assets and liabilities is
recognized as income or expense in the period that includes the enactment or the substantive enactment date. A deferred income tax asset is recognized to the extent that it is probable that
future taxable profit will be available against which the deductible temporary differences and tax losses can be utilized. Deferred income taxes are not provided on the undistributed
earnings of subsidiaries and branches where it is expected that the earnings of the subsidiary or branch will not be distributed in the foreseeable future. The Group offsets current tax assets
and current tax liabilities, where it has a legally enforceable right to set off the recognized amounts and where it intends either to settle on a net basis, or to realize the asset and settle the
liability simultaneously. The income tax provision for the interim period is made based on the best estimate of the annual average tax rate expected to be applicable for the full financial
year. Tax benefits of deductions earned on exercise of employee share options in excess of compensation charged to income are credited to share premium.
1.18 Employee benefits
1.18.1 Gratuity
The Group provides for gratuity, a defined benefit retirement plan ('the Gratuity Plan') covering eligible employees of Infosys and its Indian subsidiaries. The Gratuity Plan provides a lump-
sum payment to vested employees at retirement, death, incapacitation or termination of employment, of an amount based on the respective employee's salary and the tenure of employment
with the Group.
Liabilities with regard to the Gratuity Plan are determined by actuarial valuation, performed by an independent actuary, at each Balance Sheet date using the projected unit credit method.
The Company fully contributes all ascertained liabilities to the Infosys Limited Employees' Gratuity Fund Trust (the Trust). In case of Infosys BPM (formerly Infosys BPO) and EdgeVerve,
contributions are made to the Infosys BPO's Employees' Gratuity Fund Trust and EdgeVerve Systems Limited Employees' Gratuity Fund Trust, respectively. Trustees administer
contributions made to the Trusts and contributions are invested in a scheme with the Life Insurance Corporation of India as permitted by Indian law.
The Group recognizes the net obligation of a defined benefit plan in its Balance Sheet as an asset or liability. Gains and losses through re-measurements of the net defined benefit
liability/(asset) are recognized in other comprehensive income and are not reclassified to profit or loss in subsequent periods. The actual return of the portfolio of plan assets, in excess of
the yields computed by applying the discount rate used to measure the defined benefit obligation is recognized in other comprehensive income. The effect of any plan amendments is
recognized in net profits in the Statement of Profit and Loss.
1.18.2 Superannuation
Certain employees of Infosys, Infosys BPM (formerly Infosys BPO) and EdgeVerve are participants in a defined contribution plan. The Group has no further obligations to the plan beyond
its monthly contributions which are periodically contributed to a trust fund, the corpus of which is invested with the Life Insurance Corporation of India.
1.18.3 Provident fund
Eligible employees of Infosys receive benefits from a provident fund, which is a defined benefit plan. Both the eligible employee and the Company make monthly contributions to the
provident fund plan equal to a specified percentage of the covered employee's salary. The Company contributes a portion to the Infosys Limited Employees' Provident Fund Trust. The trust
invests in specific designated instruments as permitted by Indian law. The remaining portion is contributed to the government administered pension fund. The rate at which the annual
interest is payable to the beneficiaries by the trust is being administered by the government. The Company has an obligation to make good the shortfall, if any, between the return from the
investments of the trust and the notified interest rate.
In respect of Indian subsidiaries, eligible employees receive benefits from a provident fund, which is a defined contribution plan. Both the eligible employee and the respective companies
make monthly contributions to this provident fund plan equal to a specified percentage of the covered employee's salary. Amounts collected under the provident fund plan are deposited in
a government administered provident fund. The Companies have no further obligation to the plan beyond its monthly contributions.
1.18.4 Compensated absences
The Group has a policy on compensated absences which are both accumulating and non-accumulating in nature. The expected cost of accumulating compensated absences is determined
by actuarial valuation performed by an independent actuary at each Balance Sheet date using projected unit credit method on the additional amount expected to be paid/availed as a result
of the unused entitlement that has accumulated at the Balance Sheet date. Expense on non-accumulating compensated absences is recognized in the period in which the absences occur.
1.19 Share-based compensation
The Group recognizes compensation expense relating to share-based payments in net profit using fair value in accordance with Ind AS 102, Share-Based Payment. The estimated fair value
of awards is charged to income on a straight-line basis over the requisite service period for each separately vesting portion of the award as if the award was in-substance, multiple awards
with a corresponding increase to share options outstanding account.
Amendment to Ind AS 102:
Effective April 1, 2017, the Group adopted amendment to Ind AS 102 which provides specific guidance to measurement of cash-settled awards, modification of cash-settled awards and
awards that include a net settlement feature in respect of withholding taxes. The adoption of amendment did not have any material effect on the interim consolidated financial statements.
1.20 Cash Flow Statement
Cash flows are reported using the indirect method, whereby profit for the period is adjusted for the effects of transactions of a non-cash nature, any deferrals or accruals of past or future
operating cash receipts or payments and item of income or expenses associated with investing or financing cash flows. The cash flows from operating, investing and financing activities of
the Company are segregated.
Amendment to Ind AS 7:
Effective April 1, 2017, the Group adopted the amendment to Ind AS 7, which require the entities to provide disclosures that enable users of financial statements to evaluate changes in
liabilities arising from financing activities, including both changes arising from cash flows and non-cash changes, suggesting inclusion of a reconciliation between the opening and closing
balances in the Balance Sheet for liabilities arising from financing activities, to meet the disclosure requirement. The adoption of amendment did not have any material effect on the interim
consolidated financial statements.
1.21 Dividends
The final dividend on shares is recorded as a liability on the date of approval by the shareholders and interim dividends are recorded as a liability on the date of declaration by the
Company's Board of Directors.
1.22 Other income
Other income is comprised primarily of interest income, dividend income, gain/loss on investment and exchange gain/loss on forward and options contracts and on translation of other
assets and liabilities. Interest income is recognized using the effective interest method. Dividend income is recognized when the right to receive payment is established.
1.23 Leases
Leases under which the group assumes substantially all the risks and rewards of ownership are classified as finance leases. When acquired, such assets are capitalized at fair value or
present value of the minimum lease payments at the inception of the lease, whichever is lower. Lease payments under operating leases are recognized as an expense on a straight line basis
in net profit in the Statement of Profit and Loss over the lease term.
1.24 Government grants
The Group recognizes government grants only when there is reasonable assurance that the conditions attached to them shall be complied with, and the grants will be received. Government
grants related to assets are treated as deferred income and are recognized in net profit in the Statement of Profit and Loss on a systematic and rational basis over the useful life of the asset.
Government grants related to revenue are recognized on a systematic basis in net profit in the Statement of Profit and Loss over the periods necessary to match them with the related costs
which they are intended to compensate.
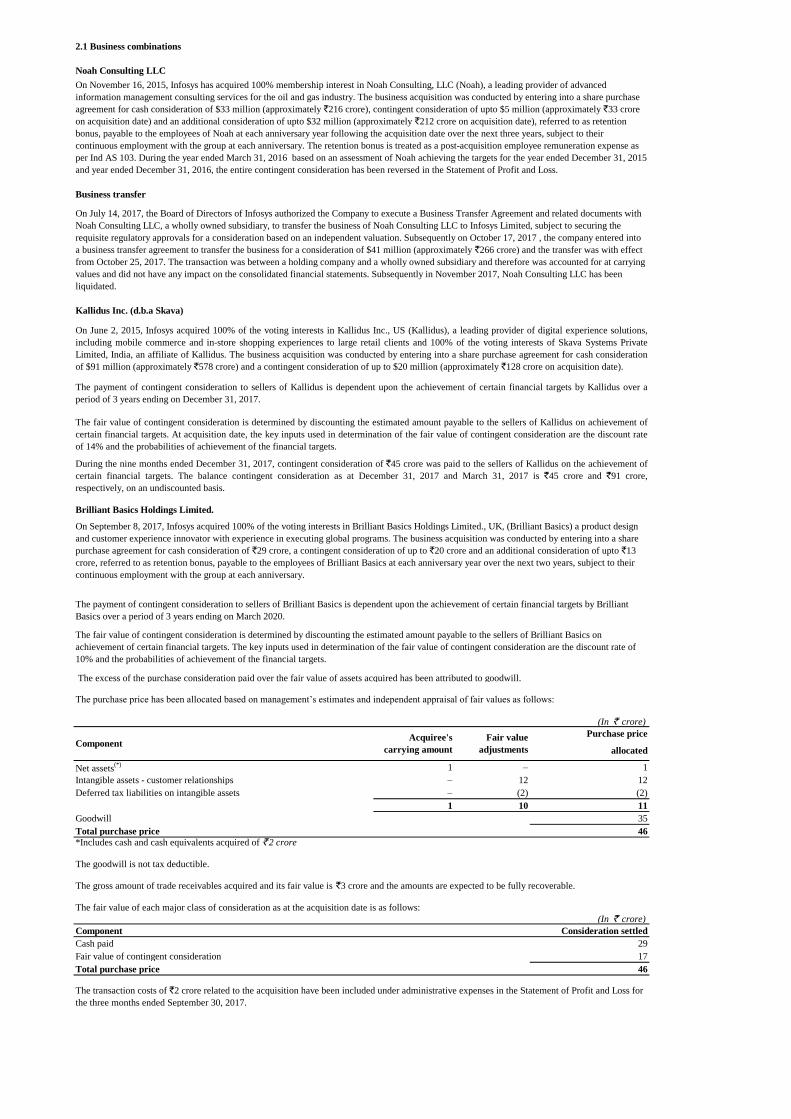
2.1 Business combinations
Noah Consulting LLC
Business transfer
Kallidus Inc. (d.b.a Skava)
The excess of the purchase consideration paid over the fair value of assets acquired has been attributed to goodwill.
(In ` crore)
Purchase price
allocated
Net assets(*) 1 – 1
Intangible assets - customer relationships – 12 12
Deferred tax liabilities on intangible assets – (2) (2)
1 10 11
Goodwill 35
Total purchase price 46
(In ` crore)
Component Consideration settled
Cash paid 29
Fair value of contingent consideration 17
Total purchase price 46
On November 16, 2015, Infosys has acquired 100% membership interest in Noah Consulting, LLC (Noah), a leading provider of advanced
information management consulting services for the oil and gas industry. The business acquisition was conducted by entering into a share purchase
agreement for cash consideration of $33 million (approximately `216 crore), contingent consideration of upto $5 million (approximately `33 crore
on acquisition date) and an additional consideration of upto $32 million (approximately `212 crore on acquisition date), referred to as retention
bonus, payable to the employees of Noah at each anniversary year following the acquisition date over the next three years, subject to their
continuous employment with the group at each anniversary. The retention bonus is treated as a post-acquisition employee remuneration expense as
per Ind AS 103. During the year ended March 31, 2016 based on an assessment of Noah achieving the targets for the year ended December 31, 2015
and year ended December 31, 2016, the entire contingent consideration has been reversed in the Statement of Profit and Loss.
The fair value of contingent consideration is determined by discounting the estimated amount payable to the sellers of Kallidus on achievement of
certain financial targets. At acquisition date, the key inputs used in determination of the fair value of contingent consideration are the discount rate
of 14% and the probabilities of achievement of the financial targets.
On June 2, 2015, Infosys acquired 100% of the voting interests in Kallidus Inc., US (Kallidus), a leading provider of digital experience solutions,
including mobile commerce and in-store shopping experiences to large retail clients and 100% of the voting interests of Skava Systems Private
Limited, India, an affiliate of Kallidus. The business acquisition was conducted by entering into a share purchase agreement for cash consideration
of $91 million (approximately `578 crore) and a contingent consideration of up to $20 million (approximately `128 crore on acquisition date).
The payment of contingent consideration to sellers of Kallidus is dependent upon the achievement of certain financial targets by Kallidus over a
period of 3 years ending on December 31, 2017.
On July 14, 2017, the Board of Directors of Infosys authorized the Company to execute a Business Transfer Agreement and related documents with
Noah Consulting LLC, a wholly owned subsidiary, to transfer the business of Noah Consulting LLC to Infosys Limited, subject to securing the
requisite regulatory approvals for a consideration based on an independent valuation. Subsequently on October 17, 2017 , the company entered into
a business transfer agreement to transfer the business for a consideration of $41 million (approximately `266 crore) and the transfer was with effect
from October 25, 2017. The transaction was between a holding company and a wholly owned subsidiary and therefore was accounted for at carrying
values and did not have any impact on the consolidated financial statements. Subsequently in November 2017, Noah Consulting LLC has been
liquidated.
Brilliant Basics Holdings Limited.
During the nine months ended December 31, 2017, contingent consideration of `45 crore was paid to the sellers of Kallidus on the achievement of
certain financial targets. The balance contingent consideration as at December 31, 2017 and March 31, 2017 is `45 crore and `91 crore,
respectively, on an undiscounted basis.
On September 8, 2017, Infosys acquired 100% of the voting interests in Brilliant Basics Holdings Limited., UK, (Brilliant Basics) a product design
and customer experience innovator with experience in executing global programs. The business acquisition was conducted by entering into a share
purchase agreement for cash consideration of `29 crore, a contingent consideration of up to `20 crore and an additional consideration of upto `13
crore, referred to as retention bonus, payable to the employees of Brilliant Basics at each anniversary year over the next two years, subject to their
continuous employment with the group at each anniversary.
The transaction costs of `2 crore related to the acquisition have been included under administrative expenses in the Statement of Profit and Loss for
the three months ended September 30, 2017.
*Includes cash and cash equivalents acquired of ` 2 crore
The goodwill is not tax deductible.
The fair value of each major class of consideration as at the acquisition date is as follows:
The fair value of contingent consideration is determined by discounting the estimated amount payable to the sellers of Brilliant Basics on
achievement of certain financial targets. The key inputs used in determination of the fair value of contingent consideration are the discount rate of
10% and the probabilities of achievement of the financial targets.
The gross amount of trade receivables acquired and its fair value is `3 crore and the amounts are expected to be fully recoverable.
The payment of contingent consideration to sellers of Brilliant Basics is dependent upon the achievement of certain financial targets by Brilliant
Basics over a period of 3 years ending on March 2020.
The purchase price has been allocated based on management’s estimates and independent appraisal of fair values as follows:
ComponentAcquiree's
carrying amount
Fair value
adjustments
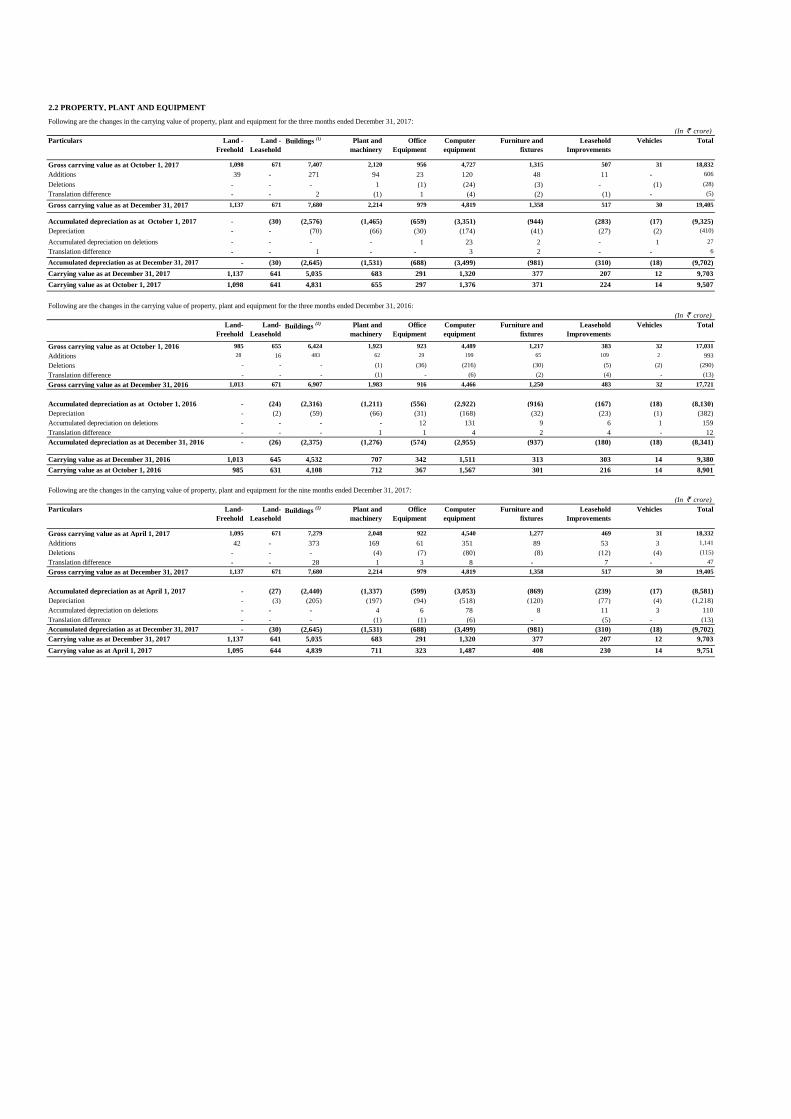
2.2 PROPERTY, PLANT AND EQUIPMENT
Following are the changes in the carrying value of property, plant and equipment for the three months ended December 31, 2017:
(In ` crore)
Particulars Land -
Freehold
Land -
Leasehold
Buildings (1) Plant and
machinery
Office
Equipment
Computer
equipment
Furniture and
fixtures
Leasehold
Improvements
Vehicles Total
Gross carrying value as at October 1, 2017 1,098 671 7,407 2,120 956 4,727 1,315 507 31 18,832
Additions 39 - 271 94 23 120 48 11 - 606
Deletions - - - 1 (1) (24) (3) - (1) (28)
Translation difference - - 2 (1) 1 (4) (2) (1) - (5)
Gross carrying value as at December 31, 2017 1,137 671 7,680 2,214 979 4,819 1,358 517 30 19,405
Accumulated depreciation as at October 1, 2017 - (30) (2,576) (1,465) (659) (3,351) (944) (283) (17) (9,325)
Depreciation - - (70) (66) (30) (174) (41) (27) (2) (410)
Accumulated depreciation on deletions - - - - 1 23 2 - 1 27
Translation difference - - 1 - - 3 2 - - 6
Accumulated depreciation as at December 31, 2017 - (30) (2,645) (1,531) (688) (3,499) (981) (310) (18) (9,702)
Carrying value as at December 31, 2017 1,137 641 5,035 683 291 1,320 377 207 12 9,703
Carrying value as at October 1, 2017 1,098 641 4,831 655 297 1,376 371 224 14 9,507
Following are the changes in the carrying value of property, plant and equipment for the three months ended December 31, 2016:
(In ` crore)
Land-
Freehold
Land-
LeaseholdBuildings
(1) Plant and
machinery
Office
Equipment
Computer
equipment
Furniture and
fixtures
Leasehold
Improvements
Vehicles Total
Gross carrying value as at October 1, 2016 985 655 6,424 1,923 923 4,489 1,217 383 32 17,031
Additions 28 16 483 62 29 199 65 109 2 993
Deletions - - - (1) (36) (216) (30) (5) (2) (290)
Translation difference - - - (1) - (6) (2) (4) - (13)
Gross carrying value as at December 31, 2016 1,013 671 6,907 1,983 916 4,466 1,250 483 32 17,721
Accumulated depreciation as at October 1, 2016 - (24) (2,316) (1,211) (556) (2,922) (916) (167) (18) (8,130)
Depreciation - (2) (59) (66) (31) (168) (32) (23) (1) (382)
Accumulated depreciation on deletions - - - - 12 131 9 6 1 159
Translation difference - - - 1 1 4 2 4 - 12
Accumulated depreciation as at December 31, 2016 - (26) (2,375) (1,276) (574) (2,955) (937) (180) (18) (8,341)
Carrying value as at December 31, 2016 1,013 645 4,532 707 342 1,511 313 303 14 9,380
Carrying value as at October 1, 2016 985 631 4,108 712 367 1,567 301 216 14 8,901
Following are the changes in the carrying value of property, plant and equipment for the nine months ended December 31, 2017:
(In ` crore)
Particulars Land-
Freehold
Land-
LeaseholdBuildings
(1) Plant and
machinery
Office
Equipment
Computer
equipment
Furniture and
fixtures
Leasehold
Improvements
Vehicles Total
Gross carrying value as at April 1, 2017 1,095 671 7,279 2,048 922 4,540 1,277 469 31 18,332
Additions 42 - 373 169 61 351 89 53 3 1,141
Deletions - - - (4) (7) (80) (8) (12) (4) (115)
Translation difference - - 28 1 3 8 - 7 - 47
Gross carrying value as at December 31, 2017 1,137 671 7,680 2,214 979 4,819 1,358 517 30 19,405
Accumulated depreciation as at April 1, 2017 - (27) (2,440) (1,337) (599) (3,053) (869) (239) (17) (8,581)
Depreciation - (3) (205) (197) (94) (518) (120) (77) (4) (1,218)
Accumulated depreciation on deletions - - - 4 6 78 8 11 3 110
Translation difference - - - (1) (1) (6) - (5) - (13)
Accumulated depreciation as at December 31, 2017 - (30) (2,645) (1,531) (688) (3,499) (981) (310) (18) (9,702)
Carrying value as at December 31, 2017 1,137 641 5,035 683 291 1,320 377 207 12 9,703
Carrying value as at April 1, 2017 1,095 644 4,839 711 323 1,487 408 230 14 9,751
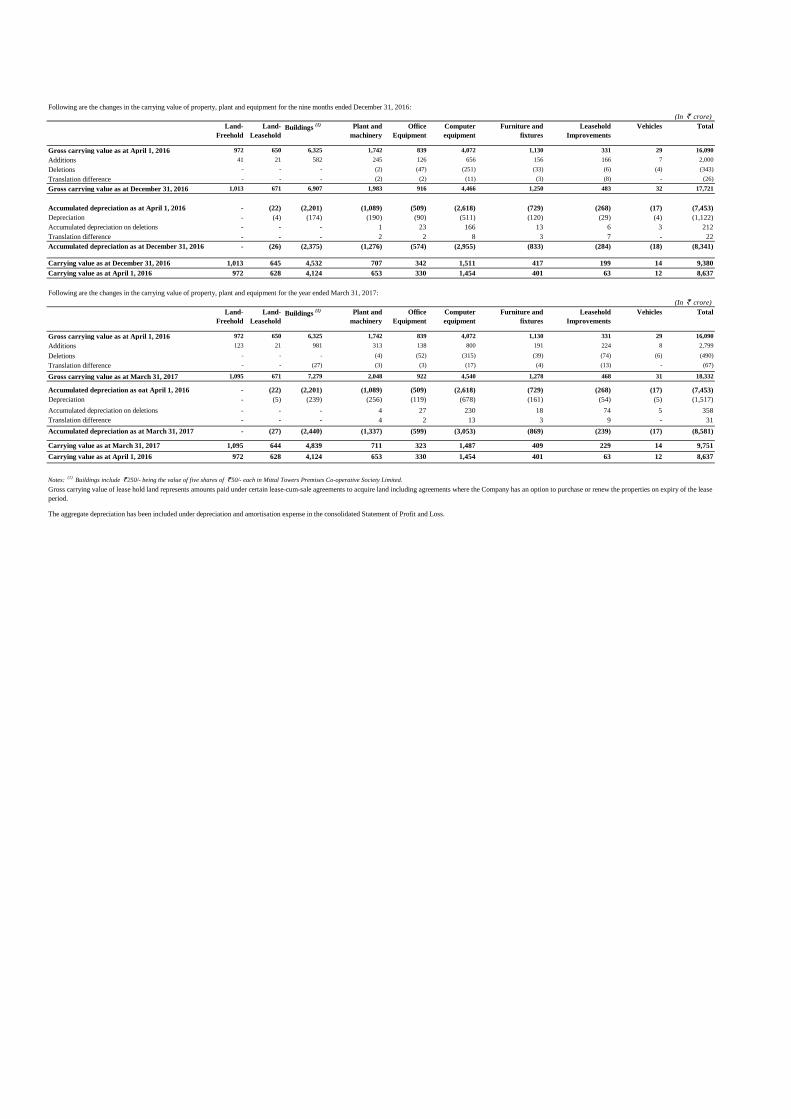
Following are the changes in the carrying value of property, plant and equipment for the nine months ended December 31, 2016:
(In ` crore)
Land-
Freehold
Land-
LeaseholdBuildings
(1) Plant and
machinery
Office
Equipment
Computer
equipment
Furniture and
fixtures
Leasehold
Improvements
Vehicles Total
Gross carrying value as at April 1, 2016 972 650 6,325 1,742 839 4,072 1,130 331 29 16,090
Additions 41 21 582 245 126 656 156 166 7 2,000
Deletions - - - (2) (47) (251) (33) (6) (4) (343)
Translation difference - - - (2) (2) (11) (3) (8) - (26)
Gross carrying value as at December 31, 2016 1,013 671 6,907 1,983 916 4,466 1,250 483 32 17,721
Accumulated depreciation as at April 1, 2016 - (22) (2,201) (1,089) (509) (2,618) (729) (268) (17) (7,453)
Depreciation - (4) (174) (190) (90) (511) (120) (29) (4) (1,122)
Accumulated depreciation on deletions - - - 1 23 166 13 6 3 212
Translation difference - - - 2 2 8 3 7 - 22
Accumulated depreciation as at December 31, 2016 - (26) (2,375) (1,276) (574) (2,955) (833) (284) (18) (8,341)
Carrying value as at December 31, 2016 1,013 645 4,532 707 342 1,511 417 199 14 9,380
Carrying value as at April 1, 2016 972 628 4,124 653 330 1,454 401 63 12 8,637
Following are the changes in the carrying value of property, plant and equipment for the year ended March 31, 2017:
(In ` crore)
Land-
Freehold
Land-
LeaseholdBuildings
(1) Plant and
machinery
Office
Equipment
Computer
equipment
Furniture and
fixtures
Leasehold
Improvements
Vehicles Total
Gross carrying value as at April 1, 2016 972 650 6,325 1,742 839 4,072 1,130 331 29 16,090
Additions 123 21 981 313 138 800 191 224 8 2,799
Deletions - - - (4) (52) (315) (39) (74) (6) (490)
Translation difference - - (27) (3) (3) (17) (4) (13) - (67)
Gross carrying value as at March 31, 2017 1,095 671 7,279 2,048 922 4,540 1,278 468 31 18,332
Accumulated depreciation as oat April 1, 2016 - (22) (2,201) (1,089) (509) (2,618) (729) (268) (17) (7,453)
Depreciation - (5) (239) (256) (119) (678) (161) (54) (5) (1,517)
Accumulated depreciation on deletions - - - 4 27 230 18 74 5 358
Translation difference - - - 4 2 13 3 9 - 31
Accumulated depreciation as at March 31, 2017 - (27) (2,440) (1,337) (599) (3,053) (869) (239) (17) (8,581)
Carrying value as at March 31, 2017 1,095 644 4,839 711 323 1,487 409 229 14 9,751
Carrying value as at April 1, 2016 972 628 4,124 653 330 1,454 401 63 12 8,637
Notes: (1)
Buildings include ` 250/- being the value of five shares of ` 50/- each in Mittal Towers Premises Co-operative Society Limited.
Gross carrying value of lease hold land represents amounts paid under certain lease-cum-sale agreements to acquire land including agreements where the Company has an option to purchase or renew the properties on expiry of the lease
period.
The aggregate depreciation has been included under depreciation and amortisation expense in the consolidated Statement of Profit and Loss.
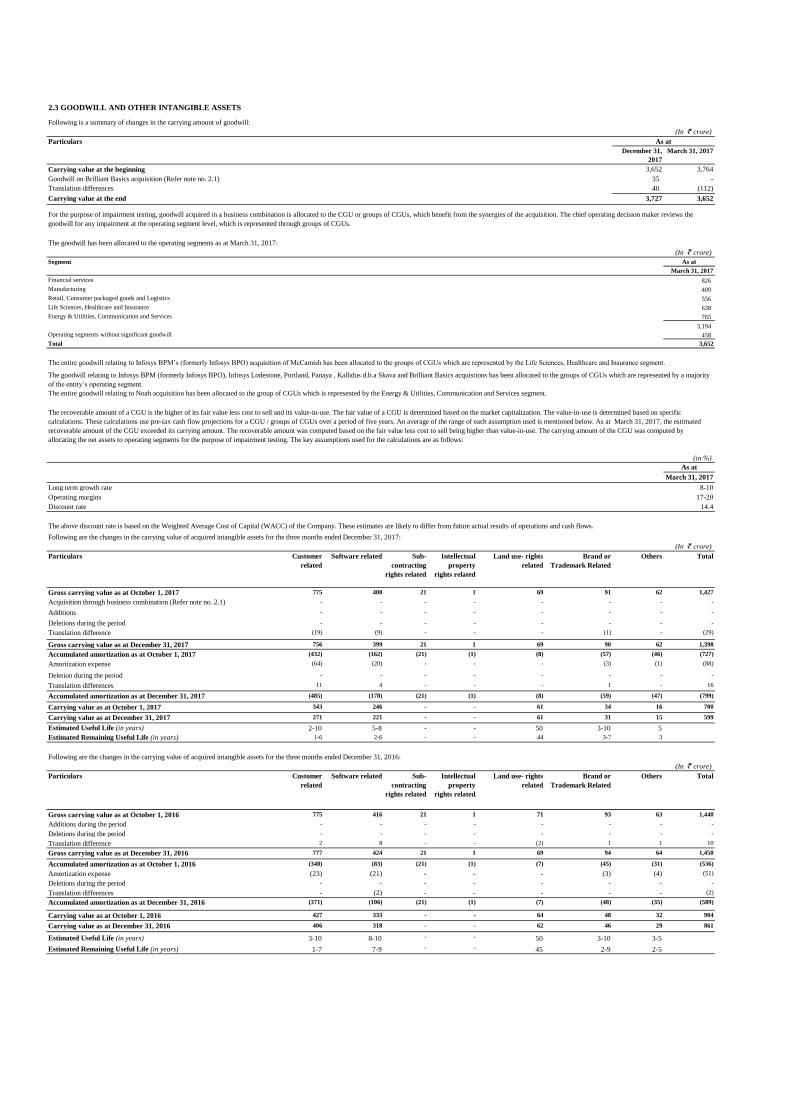
2.3 GOODWILL AND OTHER INTANGIBLE ASSETS
Following is a summary of changes in the carrying amount of goodwill:
(In ` crore)
Particulars
December 31,
2017
March 31, 2017
Carrying value at the beginning 3,652 3,764
35 -
Translation differences 40 (112)
Carrying value at the end 3,727 3,652
(In ` crore)
Segment As at
March 31, 2017
Financial services 826
Manufacturing 409
Retail, Consumer packaged goods and Logistics 556
Life Sciences, Healthcare and Insurance 638
Energy & Utilities, Communication and Services 765
3,194
Operating segments without significant goodwill 458
Total 3,652
(in %)
As at
March 31, 2017
Long term growth rate 8-10
Operating margins 17-20
Discount rate 14.4
Following are the changes in the carrying value of acquired intangible assets for the three months ended December 31, 2017:
(In ` crore)
Particulars Customer
related
Software related Sub-
contracting
rights related
Intellectual
property
rights related
Land use- rights
related
Brand or
Trademark Related
Others Total
Gross carrying value as at October 1, 2017 775 408 21 1 69 91 62 1,427
- - - - - - - -
Additions - - - - - - - -
Deletions during the period - - - - - - - -
Translation difference (19) (9) - - - (1) - (29)
Gross carrying value as at December 31, 2017 756 399 21 1 69 90 62 1,398
Accumulated amortization as at October 1, 2017 (432) (162) (21) (1) (8) (57) (46) (727)
Amortization expense (64) (20) - - - (3) (1) (88)
Deletion during the period - - - - - - - -
Translation differences 11 4 - - - 1 - 16
(485) (178) (21) (1) (8) (59) (47) (799)
Carrying value as at October 1, 2017 343 246 - - 61 34 16 700
Carrying value as at December 31, 2017 271 221 - - 61 31 15 599
Estimated Useful Life (in years) 2-10 5-8 - - 50 3-10 5
Estimated Remaining Useful Life (in years) 1-6 2-6 - - 44 3-7 3
Following are the changes in the carrying value of acquired intangible assets for the three months ended December 31, 2016:
(In ` crore)
Particulars Customer
related
Software related Sub-
contracting
rights related
Intellectual
property
rights related
Land use- rights
related
Brand or
Trademark Related
Others Total
Gross carrying value as at October 1, 2016 775 416 21 1 71 93 63 1,440
Additions during the period - - - - - - - -
Deletions during the period - - - - - - - -
Translation difference 2 8 - - (2) 1 1 10
Gross carrying value as at December 31, 2016 777 424 21 1 69 94 64 1,450
Accumulated amortization as at October 1, 2016 (348) (83) (21) (1) (7) (45) (31) (536)
Amortization expense (23) (21) - - - (3) (4) (51)
Deletions during the period - - - - - - - -
Translation differences - (2) - - - - - (2)
(371) (106) (21) (1) (7) (48) (35) (589)
Carrying value as at October 1, 2016 427 333 - - 64 48 32 904
Carrying value as at December 31, 2016 406 318 - - 62 46 29 861
Estimated Useful Life (in years) 3-10 8-10 - - 50 3-10 3-5
Estimated Remaining Useful Life (in years) 1-7 7-9 - - 45 2-9 2-5
Accumulated amortization as at December 31, 2017
Accumulated amortization as at December 31, 2016
Goodwill on Brilliant Basics acquisition (Refer note no. 2.1)
Acquisition through business combination (Refer note no. 2.1)
The recoverable amount of a CGU is the higher of its fair value less cost to sell and its value-in-use. The fair value of a CGU is determined based on the market capitalization. The value-in-use is determined based on specific
calculations. These calculations use pre-tax cash flow projections for a CGU / groups of CGUs over a period of five years. An average of the range of each assumption used is mentioned below. As at March 31, 2017, the estimated
recoverable amount of the CGU exceeded its carrying amount. The recoverable amount was computed based on the fair value less cost to sell being higher than value-in-use. The carrying amount of the CGU was computed by
allocating the net assets to operating segments for the purpose of impairment testing. The key assumptions used for the calculations are as follows:
The above discount rate is based on the Weighted Average Cost of Capital (WACC) of the Company. These estimates are likely to differ from future actual results of operations and cash flows.
For the purpose of impairment testing, goodwill acquired in a business combination is allocated to the CGU or groups of CGUs, which benefit from the synergies of the acquisition. The chief operating decision maker reviews the
goodwill for any impairment at the operating segment level, which is represented through groups of CGUs.
The entire goodwill relating to Infosys BPM’s (formerly Infosys BPO) acquisition of McCamish has been allocated to the groups of CGUs which are represented by the Life Sciences, Healthcare and Insurance segment.
The goodwill relating to Infosys BPM (formerly Infosys BPO), Infosys Lodestone, Portland, Panaya , Kallidus d.b.a Skava and Brilliant Basics acquistions has been allocated to the groups of CGUs which are represented by a majority
of the entity’s operating segment.
The entire goodwill relating to Noah acquisition has been allocated to the group of CGUs which is represented by the Energy & Utilities, Communication and Services segment.
The goodwill has been allocated to the operating segments as at March 31, 2017:
As at
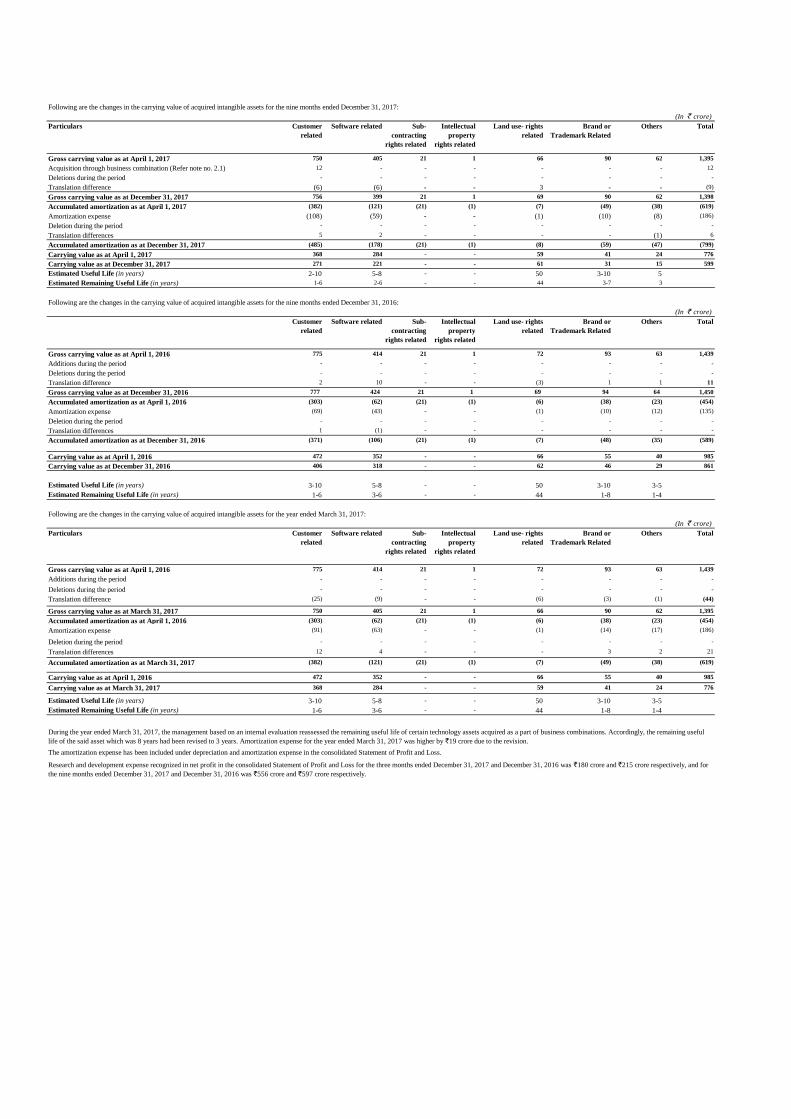
Following are the changes in the carrying value of acquired intangible assets for the nine months ended December 31, 2017:
(In ` crore)
Particulars Customer
related
Software related Sub-
contracting
rights related
Intellectual
property
rights related
Land use- rights
related
Brand or
Trademark Related
Others Total
Gross carrying value as at April 1, 2017 750 405 21 1 66 90 62 1,395
12 - - - - - - 12
Deletions during the period - - - - - - - -
Translation difference (6) (6) - - 3 - - (9)
Gross carrying value as at December 31, 2017 756 399 21 1 69 90 62 1,398
Accumulated amortization as at April 1, 2017 (382) (121) (21) (1) (7) (49) (38) (619)
Amortization expense (108) (59) - - (1) (10) (8) (186)
Deletion during the period - - - - - - - -
Translation differences 5 2 - - - - (1) 6
(485) (178) (21) (1) (8) (59) (47) (799)
Carrying value as at April 1, 2017 368 284 - - 59 41 24 776
Carrying value as at December 31, 2017 271 221 - - 61 31 15 599
Estimated Useful Life (in years) 2-10 5-8 - - 50 3-10 5
Estimated Remaining Useful Life (in years) 1-6 2-6 - - 44 3-7 3
Following are the changes in the carrying value of acquired intangible assets for the nine months ended December 31, 2016:
(In ` crore)
Customer
related
Software related Sub-
contracting
rights related
Intellectual
property
rights related
Land use- rights
related
Brand or
Trademark Related
Others Total
Gross carrying value as at April 1, 2016 775 414 21 1 72 93 63 1,439
Additions during the period - - - - - - - -
Deletions during the period - - - - - - - -
Translation difference 2 10 - - (3) 1 1 11
Gross carrying value as at December 31, 2016 777 424 21 1 69 94 64 1,450
Accumulated amortization as at April 1, 2016 (303) (62) (21) (1) (6) (38) (23) (454)
Amortization expense (69) (43) - - (1) (10) (12) (135)
Deletion during the period - - - - - - - -
Translation differences 1 (1) - - - - - -
Accumulated amortization as at December 31, 2016 (371) (106) (21) (1) (7) (48) (35) (589)
Carrying value as at April 1, 2016 472 352 - - 66 55 40 985
Carrying value as at December 31, 2016 406 318 - - 62 46 29 861
Estimated Useful Life (in years) 3-10 5-8 - - 50 3-10 3-5
Estimated Remaining Useful Life (in years) 1-6 3-6 - - 44 1-8 1-4
Following are the changes in the carrying value of acquired intangible assets for the year ended March 31, 2017:
(In ` crore)
Particulars Customer
related
Software related Sub-
contracting
rights related
Intellectual
property
rights related
Land use- rights
related
Brand or
Trademark Related
Others Total
Gross carrying value as at April 1, 2016 775 414 21 1 72 93 63 1,439
Additions during the period - - - - - - - -
Deletions during the period - - - - - - - -
Translation difference (25) (9) - - (6) (3) (1) (44)
Gross carrying value as at March 31, 2017 750 405 21 1 66 90 62 1,395
Accumulated amortization as at April 1, 2016 (303) (62) (21) (1) (6) (38) (23) (454)
Amortization expense (91) (63) - - (1) (14) (17) (186)
Deletion during the period - - - - - - - -
Translation differences 12 4 - - - 3 2 21
Accumulated amortization as at March 31, 2017 (382) (121) (21) (1) (7) (49) (38) (619)
Carrying value as at April 1, 2016 472 352 - - 66 55 40 985
Carrying value as at March 31, 2017 368 284 - - 59 41 24 776
Estimated Useful Life (in years) 3-10 5-8 - - 50 3-10 3-5
Estimated Remaining Useful Life (in years) 1-6 3-6 - - 44 1-8 1-4
Acquisition through business combination (Refer note no. 2.1)
Research and development expense recognized in net profit in the consolidated Statement of Profit and Loss for the three months ended December 31, 2017 and December 31, 2016 was `180 crore and `215 crore respectively, and for
the nine months ended December 31, 2017 and December 31, 2016 was `556 crore and `597 crore respectively.
The amortization expense has been included under depreciation and amortization expense in the consolidated Statement of Profit and Loss.
During the year ended March 31, 2017, the management based on an internal evaluation reassessed the remaining useful life of certain technology assets acquired as a part of business combinations. Accordingly, the remaining useful
life of the said asset which was 8 years had been revised to 3 years. Amortization expense for the year ended March 31, 2017 was higher by `19 crore due to the revision.
Accumulated amortization as at December 31, 2017
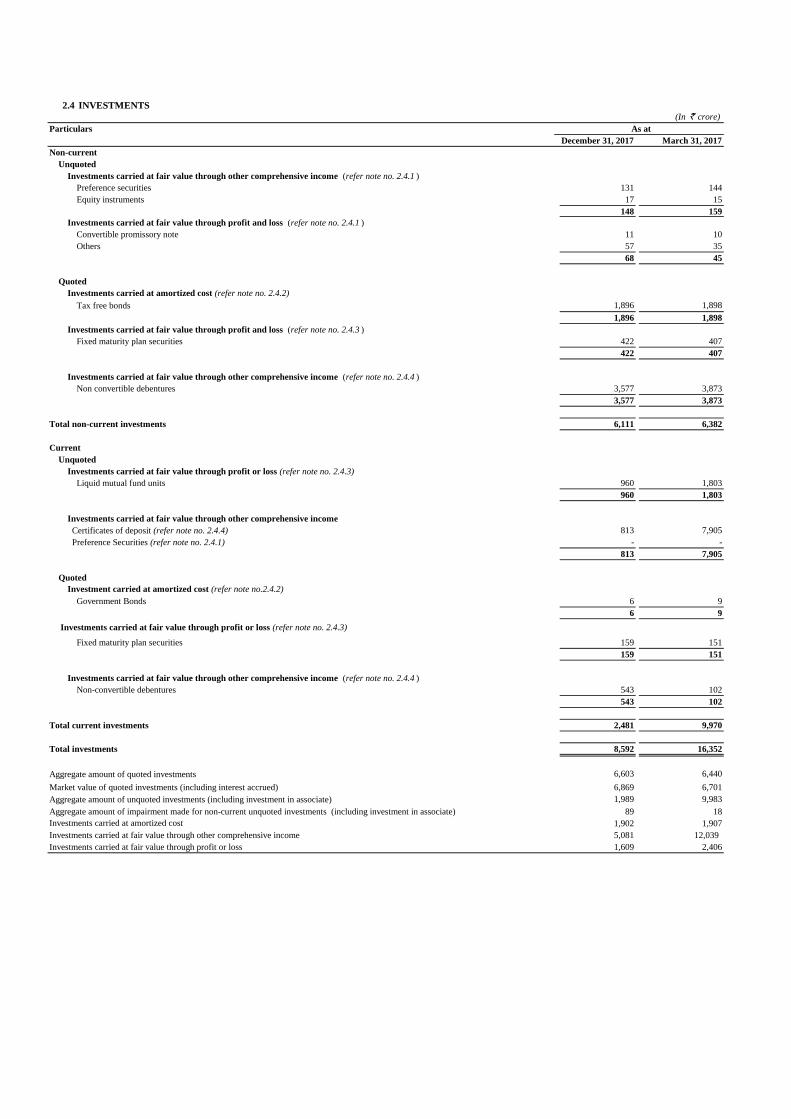
2.4 INVESTMENTS
(In ` crore)
Particulars
December 31, 2017 March 31, 2017
Non-current
Unquoted
Investments carried at fair value through other comprehensive income (refer note no. 2.4.1 )
Preference securities 131 144
Equity instruments 17 15
148 159
Investments carried at fair value through profit and loss (refer note no. 2.4.1 )
Convertible promissory note 11 10
Others 57 35
68 45
Tax free bonds 1,896 1,898
1,896 1,898
Investments carried at fair value through profit and loss (refer note no. 2.4.3 )
Fixed maturity plan securities 422 407
422 407
Investments carried at fair value through other comprehensive income (refer note no. 2.4.4 )
Non convertible debentures 3,577 3,873
3,577 3,873
Total non-current investments 6,111 6,382
Current
Unquoted
Investments carried at fair value through profit or loss (refer note no. 2.4.3)
Liquid mutual fund units 960 1,803
960 1,803
Investments carried at fair value through other comprehensive income
Certificates of deposit (refer note no. 2.4.4) 813 7,905
Preference Securities (refer note no. 2.4.1) - -
813 7,905
Quoted
Government Bonds 6 9
6 9
Fixed maturity plan securities 159 151
159 151
Investments carried at fair value through other comprehensive income (refer note no. 2.4.4 )
Non-convertible debentures 543 102
543 102
Total current investments 2,481 9,970
Total investments 8,592 16,352
6,603 6,440
Market value of quoted investments (including interest accrued) 6,869 6,701
Aggregate amount of unquoted investments (including investment in associate) 1,989 9,983
Aggregate amount of impairment made for non-current unquoted investments (including investment in associate) 89 18
1,902 1,907
Investments carried at fair value through other comprehensive income 5,081 12,039
Investments carried at fair value through profit or loss 1,609 2,406
As at
Investment carried at amortized cost (refer note no.2.4.2)
Investments carried at amortized cost
Quoted
Investments carried at amortized cost (refer note no. 2.4.2)
Aggregate amount of quoted investments
Investments carried at fair value through profit or loss (refer note no. 2.4.3)
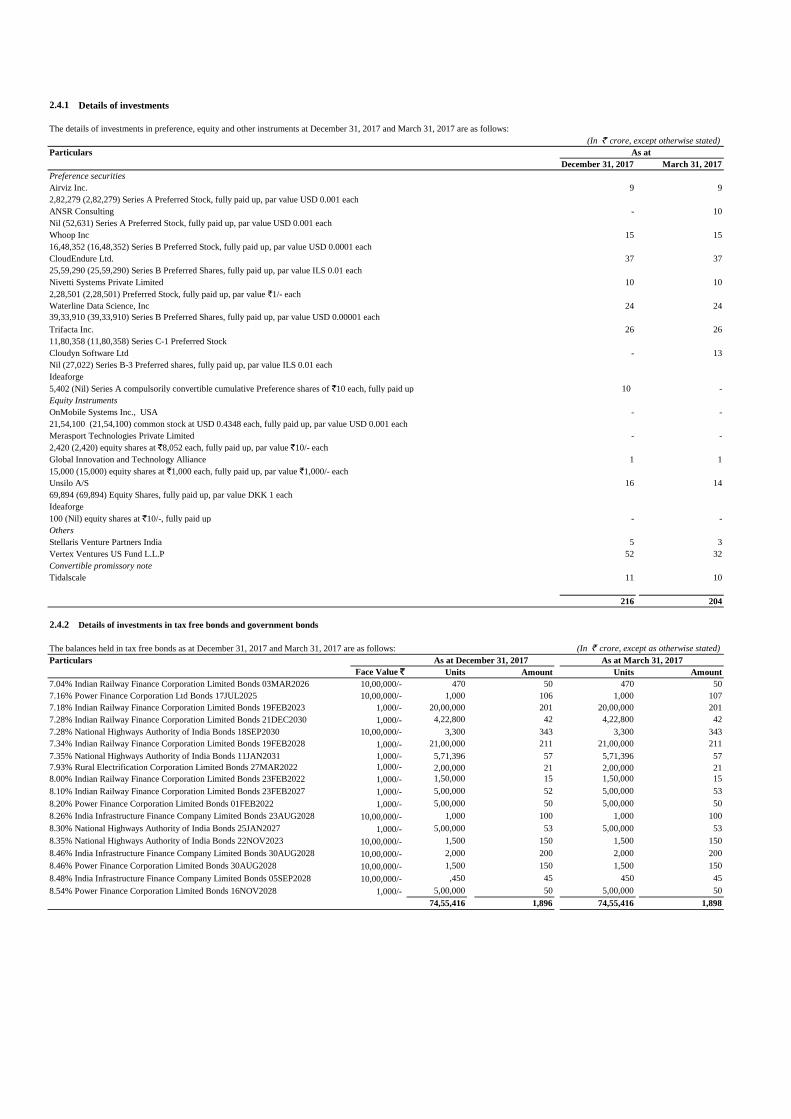
2.4.1 Details of investments
The details of investments in preference, equity and other instruments at December 31, 2017 and March 31, 2017 are as follows:
(In ` crore, except otherwise stated)
Particulars
December 31, 2017 March 31, 2017
Preference securities
Airviz Inc. 9 9
2,82,279 (2,82,279) Series A Preferred Stock, fully paid up, par value USD 0.001 each
ANSR Consulting - 10
Nil (52,631) Series A Preferred Stock, fully paid up, par value USD 0.001 each
Whoop Inc 15 15
16,48,352 (16,48,352) Series B Preferred Stock, fully paid up, par value USD 0.0001 each
CloudEndure Ltd. 37 37
25,59,290 (25,59,290) Series B Preferred Shares, fully paid up, par value ILS 0.01 each
Nivetti Systems Private Limited 10 10
2,28,501 (2,28,501) Preferred Stock, fully paid up, par value `1/- each
Waterline Data Science, Inc 24 24
Trifacta Inc. 26 26
11,80,358 (11,80,358) Series C-1 Preferred Stock
Cloudyn Software Ltd - 13
Nil (27,022) Series B-3 Preferred shares, fully paid up, par value ILS 0.01 each
Ideaforge
5,402 (Nil) Series A compulsorily convertible cumulative Preference shares of `10 each, fully paid up 10 -
Equity Instruments
OnMobile Systems Inc., USA - -
21,54,100 (21,54,100) common stock at USD 0.4348 each, fully paid up, par value USD 0.001 each
Merasport Technologies Private Limited - -
2,420 (2,420) equity shares at `8,052 each, fully paid up, par value `10/- each
Global Innovation and Technology Alliance 1 1
15,000 (15,000) equity shares at `1,000 each, fully paid up, par value `1,000/- each
Unsilo A/S 16 14
69,894 (69,894) Equity Shares, fully paid up, par value DKK 1 each
Ideaforge
100 (Nil) equity shares at `10/-, fully paid up - -
Others
Stellaris Venture Partners India 5 3
Vertex Ventures US Fund L.L.P 52 32
Convertible promissory note
Tidalscale 11 10
216 204
2.4.2 Details of investments in tax free bonds and government bonds
The balances held in tax free bonds as at December 31, 2017 and March 31, 2017 are as follows: (In ` crore, except as otherwise stated)
Particulars
Face Value ` Units Amount Units Amount
7.04% Indian Railway Finance Corporation Limited Bonds 03MAR2026 10,00,000/- 470 50 470 50
7.16% Power Finance Corporation Ltd Bonds 17JUL2025 10,00,000/- 1,000 106 1,000 107
7.18% Indian Railway Finance Corporation Limited Bonds 19FEB2023 1,000/- 20,00,000 201 20,00,000 201
7.28% Indian Railway Finance Corporation Limited Bonds 21DEC2030 1,000/- 4,22,800 42 4,22,800 42
7.28% National Highways Authority of India Bonds 18SEP2030 10,00,000/- 3,300 343 3,300 343
7.34% Indian Railway Finance Corporation Limited Bonds 19FEB2028 1,000/- 21,00,000 211 21,00,000 211
7.35% National Highways Authority of India Bonds 11JAN2031 1,000/- 5,71,396 57 5,71,396 57
7.93% Rural Electrification Corporation Limited Bonds 27MAR2022 1,000/- 2,00,000 21 2,00,000 21
8.00% Indian Railway Finance Corporation Limited Bonds 23FEB2022 1,000/- 1,50,000 15 1,50,000 15
8.10% Indian Railway Finance Corporation Limited Bonds 23FEB2027 1,000/- 5,00,000 52 5,00,000 53
8.20% Power Finance Corporation Limited Bonds 01FEB2022 1,000/- 5,00,000 50 5,00,000 50
8.26% India Infrastructure Finance Company Limited Bonds 23AUG2028 10,00,000/- 1,000 100 1,000 100
8.30% National Highways Authority of India Bonds 25JAN2027 1,000/- 5,00,000 53 5,00,000 53
8.35% National Highways Authority of India Bonds 22NOV2023 10,00,000/- 1,500 150 1,500 150
8.46% India Infrastructure Finance Company Limited Bonds 30AUG2028 10,00,000/- 2,000 200 2,000 200
8.46% Power Finance Corporation Limited Bonds 30AUG2028 10,00,000/- 1,500 150 1,500 150
8.48% India Infrastructure Finance Company Limited Bonds 05SEP2028 10,00,000/- ,450 45 450 45
8.54% Power Finance Corporation Limited Bonds 16NOV2028 1,000/- 5,00,000 50 5,00,000 50
74,55,416 1,896 74,55,416 1,898
As at
39,33,910 (39,33,910) Series B Preferred Shares, fully paid up, par value USD 0.00001 each
As at December 31, 2017 As at March 31, 2017
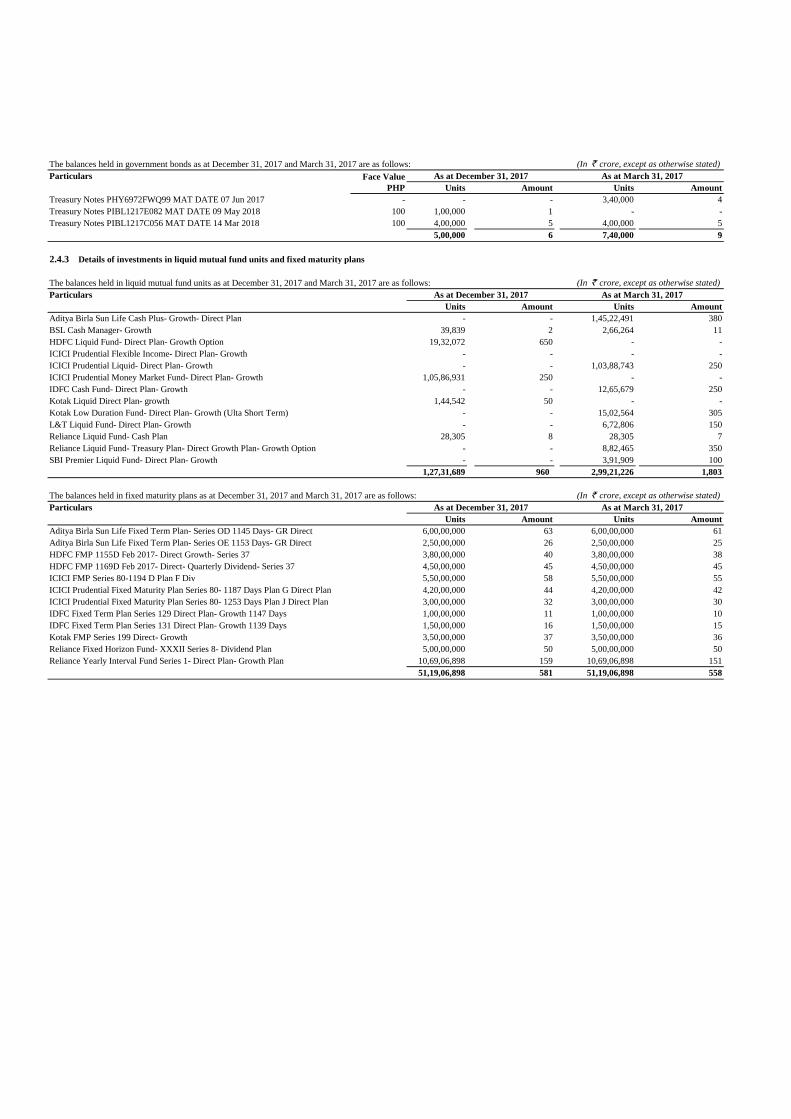
The balances held in government bonds as at December 31, 2017 and March 31, 2017 are as follows: (In ` crore, except as otherwise stated)
Particulars
Units Amount Units Amount
Treasury Notes PHY6972FWQ99 MAT DATE 07 Jun 2017 - - - 3,40,000 4
Treasury Notes PIBL1217E082 MAT DATE 09 May 2018 100 1,00,000 1 - -
Treasury Notes PIBL1217C056 MAT DATE 14 Mar 2018 100 4,00,000 5 4,00,000 5
5,00,000 6 7,40,000 9
2.4.3 Details of investments in liquid mutual fund units and fixed maturity plans
The balances held in liquid mutual fund units as at December 31, 2017 and March 31, 2017 are as follows: (In ` crore, except as otherwise stated)
Particulars
Units Amount Units Amount
Aditya Birla Sun Life Cash Plus- Growth- Direct Plan - - 1,45,22,491 380
BSL Cash Manager- Growth 39,839 2 2,66,264 11
HDFC Liquid Fund- Direct Plan- Growth Option 19,32,072 650 - -
ICICI Prudential Flexible Income- Direct Plan- Growth - - - -
ICICI Prudential Liquid- Direct Plan- Growth - - 1,03,88,743 250
ICICI Prudential Money Market Fund- Direct Plan- Growth 1,05,86,931 250 - -
IDFC Cash Fund- Direct Plan- Growth - - 12,65,679 250
Kotak Liquid Direct Plan- growth 1,44,542 50 - -
Kotak Low Duration Fund- Direct Plan- Growth (Ulta Short Term) - - 15,02,564 305
L&T Liquid Fund- Direct Plan- Growth - - 6,72,806 150
Reliance Liquid Fund- Cash Plan 28,305 8 28,305 7
Reliance Liquid Fund- Treasury Plan- Direct Growth Plan- Growth Option - - 8,82,465 350
SBI Premier Liquid Fund- Direct Plan- Growth - - 3,91,909 100
1,27,31,689 960 2,99,21,226 1,803
The balances held in fixed maturity plans as at December 31, 2017 and March 31, 2017 are as follows: (In ` crore, except as otherwise stated)
Particulars
Units Amount Units Amount
Aditya Birla Sun Life Fixed Term Plan- Series OD 1145 Days- GR Direct 6,00,00,000 63 6,00,00,000 61
Aditya Birla Sun Life Fixed Term Plan- Series OE 1153 Days- GR Direct 2,50,00,000 26 2,50,00,000 25
HDFC FMP 1155D Feb 2017- Direct Growth- Series 37 3,80,00,000 40 3,80,00,000 38
HDFC FMP 1169D Feb 2017- Direct- Quarterly Dividend- Series 37 4,50,00,000 45 4,50,00,000 45
ICICI FMP Series 80-1194 D Plan F Div 5,50,00,000 58 5,50,00,000 55
ICICI Prudential Fixed Maturity Plan Series 80- 1187 Days Plan G Direct Plan 4,20,00,000 44 4,20,00,000 42
ICICI Prudential Fixed Maturity Plan Series 80- 1253 Days Plan J Direct Plan 3,00,00,000 32 3,00,00,000 30
IDFC Fixed Term Plan Series 129 Direct Plan- Growth 1147 Days 1,00,00,000 11 1,00,00,000 10
IDFC Fixed Term Plan Series 131 Direct Plan- Growth 1139 Days 1,50,00,000 16 1,50,00,000 15
Kotak FMP Series 199 Direct- Growth 3,50,00,000 37 3,50,00,000 36
Reliance Fixed Horizon Fund- XXXII Series 8- Dividend Plan 5,00,00,000 50 5,00,00,000 50
Reliance Yearly Interval Fund Series 1- Direct Plan- Growth Plan 10,69,06,898 159 10,69,06,898 151
51,19,06,898 581 51,19,06,898 558
As at December 31, 2017 As at March 31, 2017
Face Value
PHP
As at December 31, 2017 As at March 31, 2017
As at December 31, 2017 As at March 31, 2017
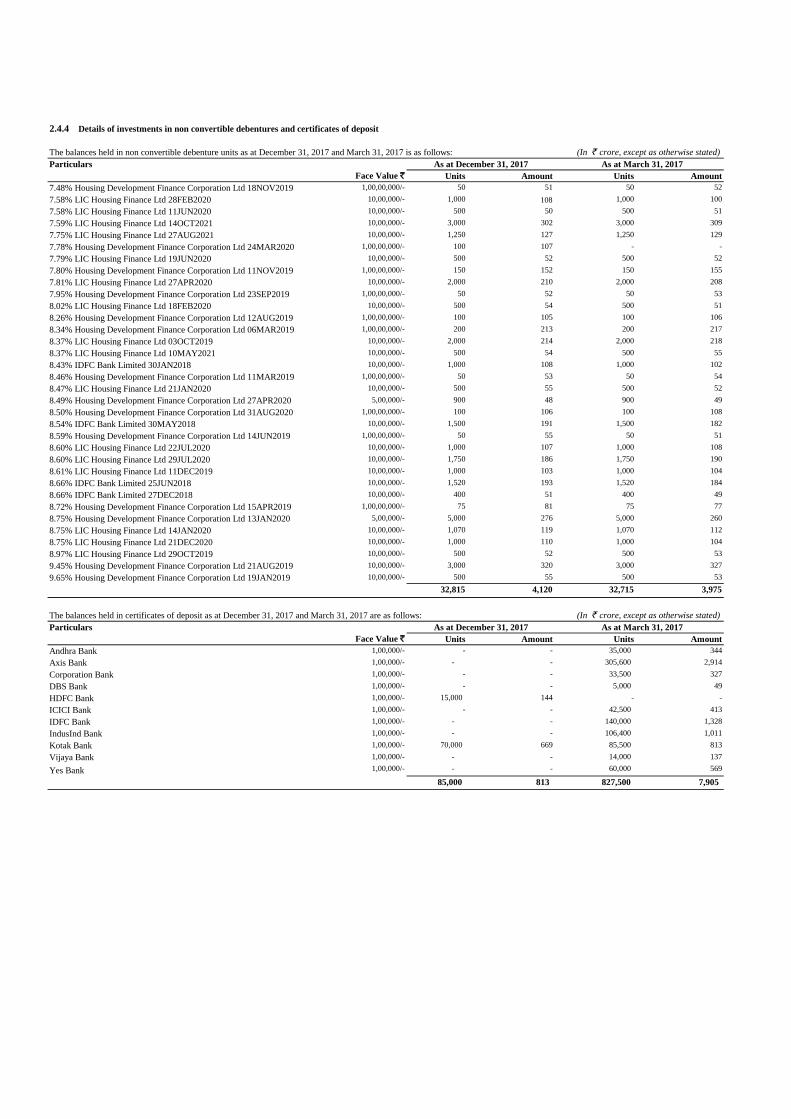
2.4.4 Details of investments in non convertible debentures and certificates of deposit
The balances held in non convertible debenture units as at December 31, 2017 and March 31, 2017 is as follows: (In ` crore, except as otherwise stated)
Particulars
Face Value ` Units Amount Units Amount
7.48% Housing Development Finance Corporation Ltd 18NOV2019 1,00,00,000/- 50 51 50 52
7.58% LIC Housing Finance Ltd 28FEB2020 10,00,000/- 1,000 108 1,000 100
7.58% LIC Housing Finance Ltd 11JUN2020 10,00,000/- 500 50 500 51
7.59% LIC Housing Finance Ltd 14OCT2021 10,00,000/- 3,000 302 3,000 309
7.75% LIC Housing Finance Ltd 27AUG2021 10,00,000/- 1,250 127 1,250 129
7.78% Housing Development Finance Corporation Ltd 24MAR2020 1,00,00,000/- 100 107 - -
7.79% LIC Housing Finance Ltd 19JUN2020 10,00,000/- 500 52 500 52
7.80% Housing Development Finance Corporation Ltd 11NOV2019 1,00,00,000/- 150 152 150 155
7.81% LIC Housing Finance Ltd 27APR2020 10,00,000/- 2,000 210 2,000 208
7.95% Housing Development Finance Corporation Ltd 23SEP2019 1,00,00,000/- 50 52 50 53
8.02% LIC Housing Finance Ltd 18FEB2020 10,00,000/- 500 54 500 51
8.26% Housing Development Finance Corporation Ltd 12AUG2019 1,00,00,000/- 100 105 100 106
8.34% Housing Development Finance Corporation Ltd 06MAR2019 1,00,00,000/- 200 213 200 217
8.37% LIC Housing Finance Ltd 03OCT2019 10,00,000/- 2,000 214 2,000 218
8.37% LIC Housing Finance Ltd 10MAY2021 10,00,000/- 500 54 500 55
8.43% IDFC Bank Limited 30JAN2018 10,00,000/- 1,000 108 1,000 102
8.46% Housing Development Finance Corporation Ltd 11MAR2019 1,00,00,000/- 50 53 50 54
8.47% LIC Housing Finance Ltd 21JAN2020 10,00,000/- 500 55 500 52
8.49% Housing Development Finance Corporation Ltd 27APR2020 5,00,000/- 900 48 900 49
8.50% Housing Development Finance Corporation Ltd 31AUG2020 1,00,00,000/- 100 106 100 108
8.54% IDFC Bank Limited 30MAY2018 10,00,000/- 1,500 191 1,500 182
8.59% Housing Development Finance Corporation Ltd 14JUN2019 1,00,00,000/- 50 55 50 51
8.60% LIC Housing Finance Ltd 22JUL2020 10,00,000/- 1,000 107 1,000 108
8.60% LIC Housing Finance Ltd 29JUL2020 10,00,000/- 1,750 186 1,750 190
8.61% LIC Housing Finance Ltd 11DEC2019 10,00,000/- 1,000 103 1,000 104
8.66% IDFC Bank Limited 25JUN2018 10,00,000/- 1,520 193 1,520 184
8.66% IDFC Bank Limited 27DEC2018 10,00,000/- 400 51 400 49
8.72% Housing Development Finance Corporation Ltd 15APR2019 1,00,00,000/- 75 81 75 77
8.75% Housing Development Finance Corporation Ltd 13JAN2020 5,00,000/- 5,000 276 5,000 260
8.75% LIC Housing Finance Ltd 14JAN2020 10,00,000/- 1,070 119 1,070 112
8.75% LIC Housing Finance Ltd 21DEC2020 10,00,000/- 1,000 110 1,000 104
8.97% LIC Housing Finance Ltd 29OCT2019 10,00,000/- 500 52 500 53
9.45% Housing Development Finance Corporation Ltd 21AUG2019 10,00,000/- 3,000 320 3,000 327
9.65% Housing Development Finance Corporation Ltd 19JAN2019 10,00,000/- 500 55 500 53
32,815 4,120 32,715 3,975
The balances held in certificates of deposit as at December 31, 2017 and March 31, 2017 are as follows: (In ` crore, except as otherwise stated)
Particulars
Face Value ` Units Amount Units Amount
Andhra Bank 1,00,000/- - - 35,000 344
Axis Bank 1,00,000/- - - 305,600 2,914
Corporation Bank 1,00,000/- - - 33,500 327
DBS Bank 1,00,000/- - - 5,000 49
HDFC Bank 1,00,000/- 15,000 144 - -
ICICI Bank 1,00,000/- - - 42,500 413
IDFC Bank 1,00,000/- - - 140,000 1,328
IndusInd Bank 1,00,000/- - - 106,400 1,011
Kotak Bank 1,00,000/- 70,000 669 85,500 813
Vijaya Bank 1,00,000/- - - 14,000 137
Yes Bank 1,00,000/- - - 60,000 569
85,000 813 827,500 7,905
As at March 31, 2017As at December 31, 2017
As at March 31, 2017As at December 31, 2017
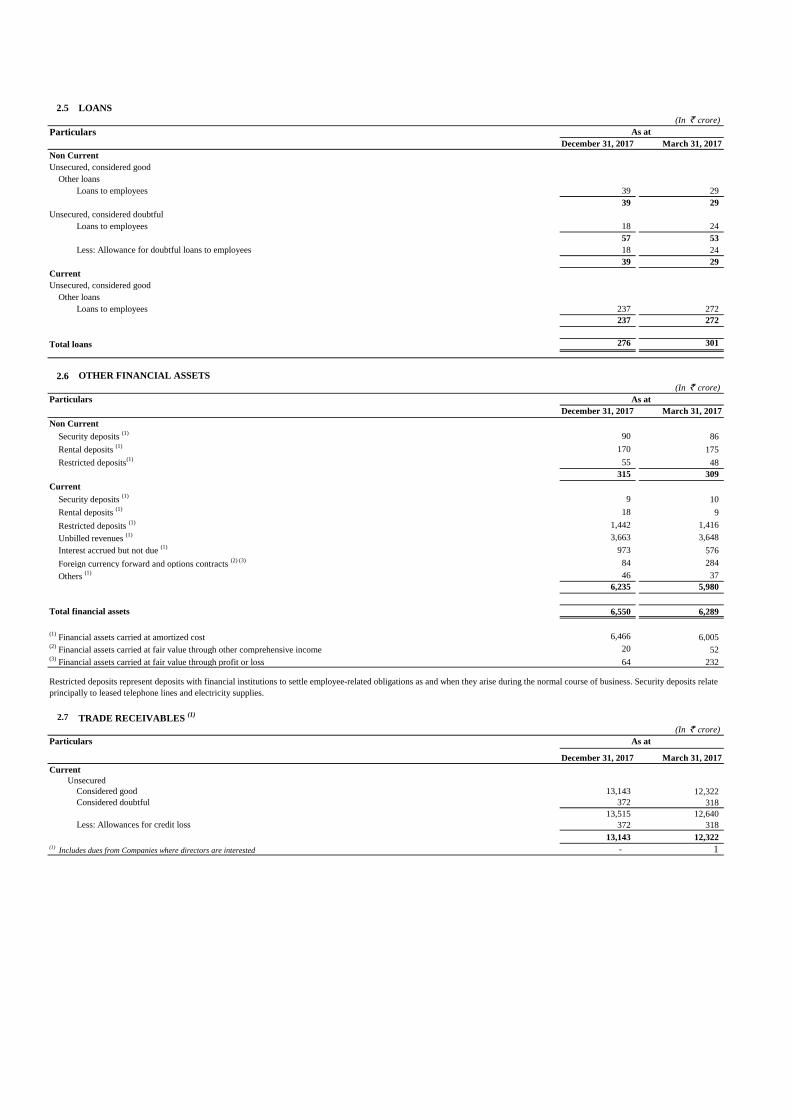
2.5 LOANS
(In ` crore)
Particulars
December 31, 2017 March 31, 2017
Non Current
Unsecured, considered good
Other loans
Loans to employees 39 29
39 29
Unsecured, considered doubtful
Loans to employees 18 24
57 53
Less: Allowance for doubtful loans to employees 18 24
39 29
Current
Unsecured, considered good
Other loans
Loans to employees 237 272
237 272
Total loans 276 301
2.6 OTHER FINANCIAL ASSETS
(In ` crore)
Particulars
December 31, 2017 March 31, 2017
Non Current
Security deposits (1)
90 86
Rental deposits (1)
170 175
Restricted deposits(1)
55 48
315 309
Current
Security deposits (1)
9 10
Rental deposits (1)
18 9
Restricted deposits (1) 1,442 1,416
Unbilled revenues (1) 3,663 3,648
Interest accrued but not due (1)
973 576
Foreign currency forward and options contracts (2) (3) 84 284
Others (1) 46 37
6,235 5,980
Total financial assets 6,550 6,289
(1) Financial assets carried at amortized cost 6,466 6,005
(2) Financial assets carried at fair value through other comprehensive income 20 52
(3) Financial assets carried at fair value through profit or loss 64 232
2.7 TRADE RECEIVABLES (1)
(In ` crore)
December 31, 2017 March 31, 2017
Current
Unsecured
Considered good 13,143 12,322
Considered doubtful 372 318
13,515 12,640
Less: Allowances for credit loss 372 318
13,143 12,322 (1)
Includes dues from Companies where directors are interested - 1
Particulars
Restricted deposits represent deposits with financial institutions to settle employee-related obligations as and when they arise during the normal course of business. Security deposits relate
principally to leased telephone lines and electricity supplies.
As at
As at
As at
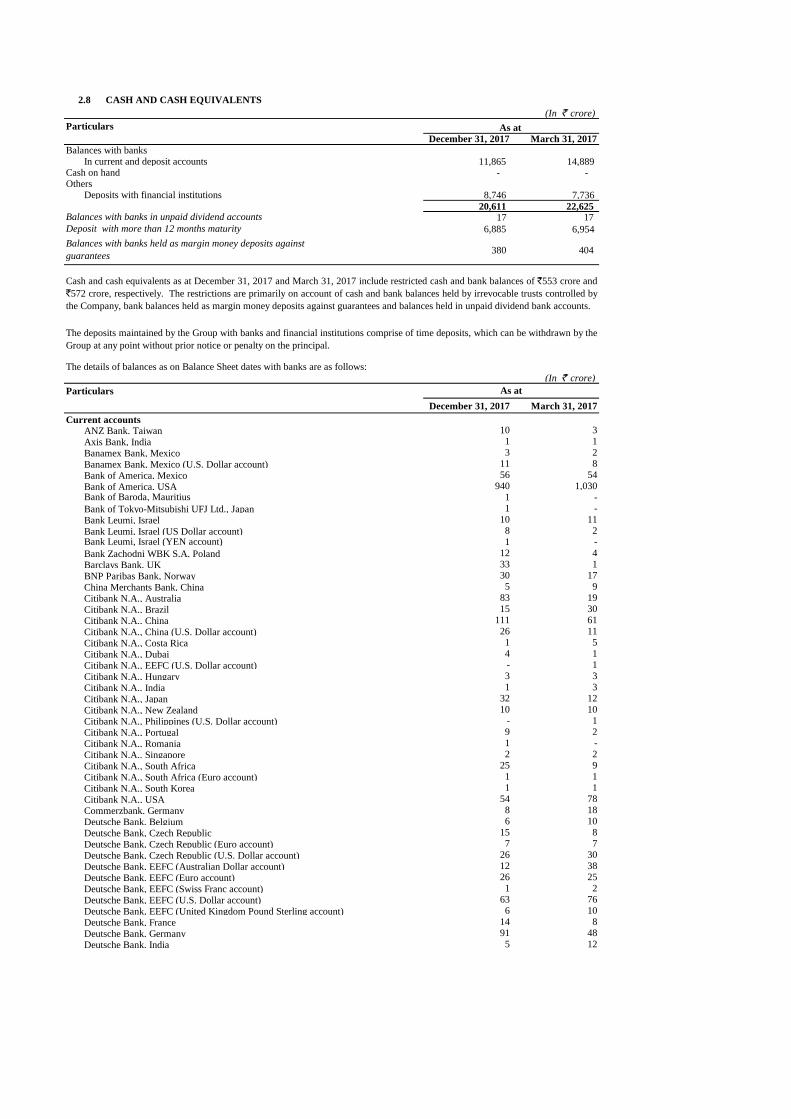
2.8 CASH AND CASH EQUIVALENTS
(In ` crore)
Particulars
December 31, 2017 March 31, 2017
Balances with banksIn current and deposit accounts 11,865 14,889
Cash on hand - - Others
Deposits with financial institutions 8,746 7,736
20,611 22,625 17 17
6,885 6,954
380 404
The details of balances as on Balance Sheet dates with banks are as follows:
(In ` crore)
Particulars
December 31, 2017 March 31, 2017
Current accountsANZ Bank, Taiwan 10 3
Axis Bank, India 1 1
Banamex Bank, Mexico 3 2
Banamex Bank, Mexico (U.S. Dollar account) 11 8
Bank of America, Mexico 56 54
Bank of America, USA 940 1,030 Bank of Baroda, Mauritius 1 -
Bank of Tokyo-Mitsubishi UFJ Ltd., Japan 1 -
Bank Leumi, Israel 10 11
Bank Leumi, Israel (US Dollar account) 8 2 Bank Leumi, Israel (YEN account) 1 -
Bank Zachodni WBK S.A, Poland 12 4
Barclays Bank, UK 33 1
BNP Paribas Bank, Norway 30 17
China Merchants Bank, China 5 9
Citibank N.A., Australia 83 19
Citibank N.A., Brazil 15 30
Citibank N.A., China 111 61
Citibank N.A., China (U.S. Dollar account) 26 11
Citibank N.A., Costa Rica 1 5
Citibank N.A., Dubai 4 1
Citibank N.A., EEFC (U.S. Dollar account) - 1
Citibank N.A., Hungary 3 3
Citibank N.A., India 1 3
Citibank N.A., Japan 32 12
Citibank N.A., New Zealand 10 10
Citibank N.A., Philippines (U.S. Dollar account) - 1
Citibank N.A., Portugal 9 2
Citibank N.A., Romania 1 -
Citibank N.A., Singapore 2 2
Citibank N.A., South Africa 25 9
Citibank N.A., South Africa (Euro account) 1 1
Citibank N.A., South Korea 1 1
Citibank N.A., USA 54 78
Commerzbank, Germany 8 18
Deutsche Bank, Belgium 6 10
Deutsche Bank, Czech Republic 15 8
Deutsche Bank, Czech Republic (Euro account) 7 7
Deutsche Bank, Czech Republic (U.S. Dollar account) 26 30
Deutsche Bank, EEFC (Australian Dollar account) 12 38
Deutsche Bank, EEFC (Euro account) 26 25
Deutsche Bank, EEFC (Swiss Franc account) 1 2
Deutsche Bank, EEFC (U.S. Dollar account) 63 76
Deutsche Bank, EEFC (United Kingdom Pound Sterling account) 6 10
Deutsche Bank, France 14 8
Deutsche Bank, Germany 91 48
Deutsche Bank, India 5 12
Cash and cash equivalents as at December 31, 2017 and March 31, 2017 include restricted cash and bank balances of `553 crore and
`572 crore, respectively. The restrictions are primarily on account of cash and bank balances held by irrevocable trusts controlled by
the Company, bank balances held as margin money deposits against guarantees and balances held in unpaid dividend bank accounts.
The deposits maintained by the Group with banks and financial institutions comprise of time deposits, which can be withdrawn by the
Group at any point without prior notice or penalty on the principal.
As at
As at
Balances with banks in unpaid dividend accounts
Balances with banks held as margin money deposits against
guarantees
Deposit with more than 12 months maturity
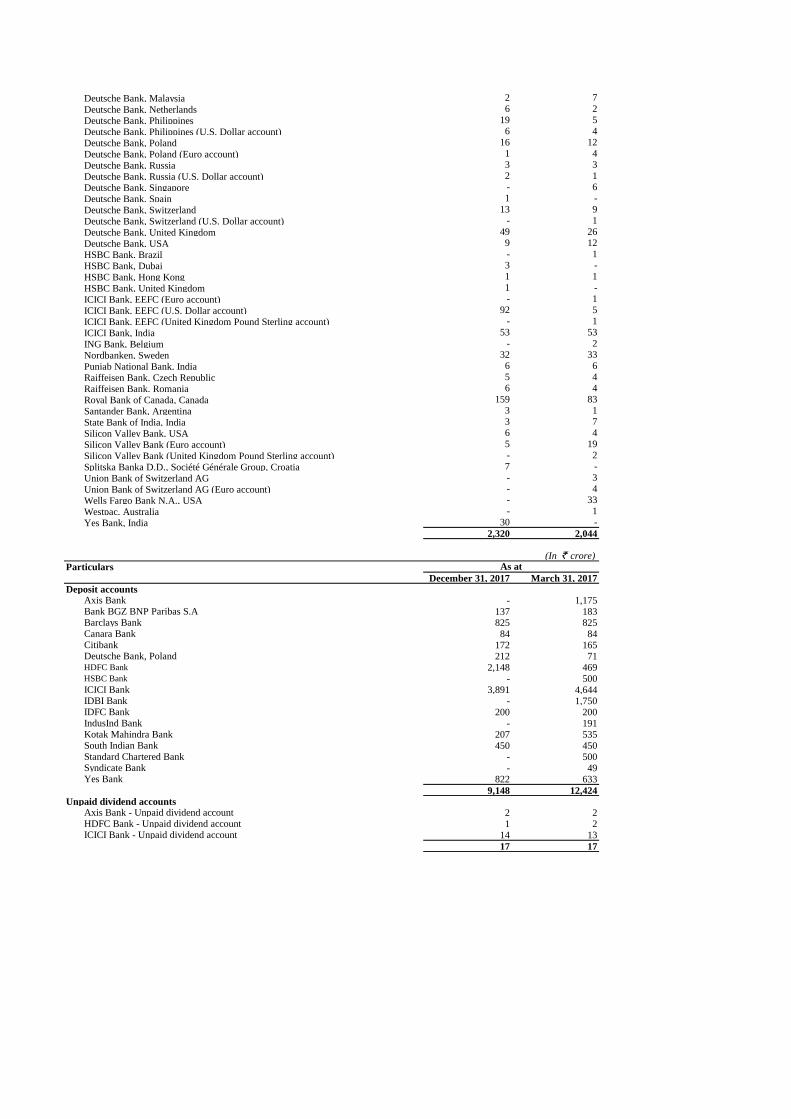
Deutsche Bank, Malaysia 2 7
Deutsche Bank, Netherlands 6 2
Deutsche Bank, Philippines 19 5
Deutsche Bank, Philippines (U.S. Dollar account) 6 4
Deutsche Bank, Poland 16 12
Deutsche Bank, Poland (Euro account) 1 4
Deutsche Bank, Russia 3 3
Deutsche Bank, Russia (U.S. Dollar account) 2 1
Deutsche Bank, Singapore - 6
Deutsche Bank, Spain 1 -
Deutsche Bank, Switzerland 13 9
Deutsche Bank, Switzerland (U.S. Dollar account) - 1
Deutsche Bank, United Kingdom 49 26
Deutsche Bank, USA 9 12
HSBC Bank, Brazil - 1
HSBC Bank, Dubai 3 -
HSBC Bank, Hong Kong 1 1
HSBC Bank, United Kingdom 1 -
ICICI Bank, EEFC (Euro account) - 1
ICICI Bank, EEFC (U.S. Dollar account) 92 5
ICICI Bank, EEFC (United Kingdom Pound Sterling account) - 1
ICICI Bank, India 53 53
ING Bank, Belgium - 2
Nordbanken, Sweden 32 33
Punjab National Bank, India 6 6
Raiffeisen Bank, Czech Republic 5 4
Raiffeisen Bank, Romania 6 4
Royal Bank of Canada, Canada 159 83
Santander Bank, Argentina 3 1
State Bank of India, India 3 7
Silicon Valley Bank, USA 6 4
Silicon Valley Bank (Euro account) 5 19
Silicon Valley Bank (United Kingdom Pound Sterling account) - 2
Splitska Banka D.D., Société Générale Group, Croatia 7 -
Union Bank of Switzerland AG - 3
Union Bank of Switzerland AG (Euro account) - 4
Wells Fargo Bank N.A., USA - 33
Westpac, Australia - 1
Yes Bank, India 30 -
2,320 2,044
(In ` crore)
Particulars
December 31, 2017 March 31, 2017Deposit accounts
Axis Bank - 1,175 Bank BGZ BNP Paribas S.A 137 183 Barclays Bank 825 825 Canara Bank 84 84 Citibank 172 165 Deutsche Bank, Poland 212 71 HDFC Bank 2,148 469 HSBC Bank - 500 ICICI Bank 3,891 4,644 IDBI Bank - 1,750 IDFC Bank 200 200 IndusInd Bank - 191 Kotak Mahindra Bank 207 535 South Indian Bank 450 450 Standard Chartered Bank - 500 Syndicate Bank - 49 Yes Bank 822 633
9,148 12,424 Unpaid dividend accounts
Axis Bank - Unpaid dividend account 2 2 HDFC Bank - Unpaid dividend account 1 2 ICICI Bank - Unpaid dividend account 14 13
17 17
As at
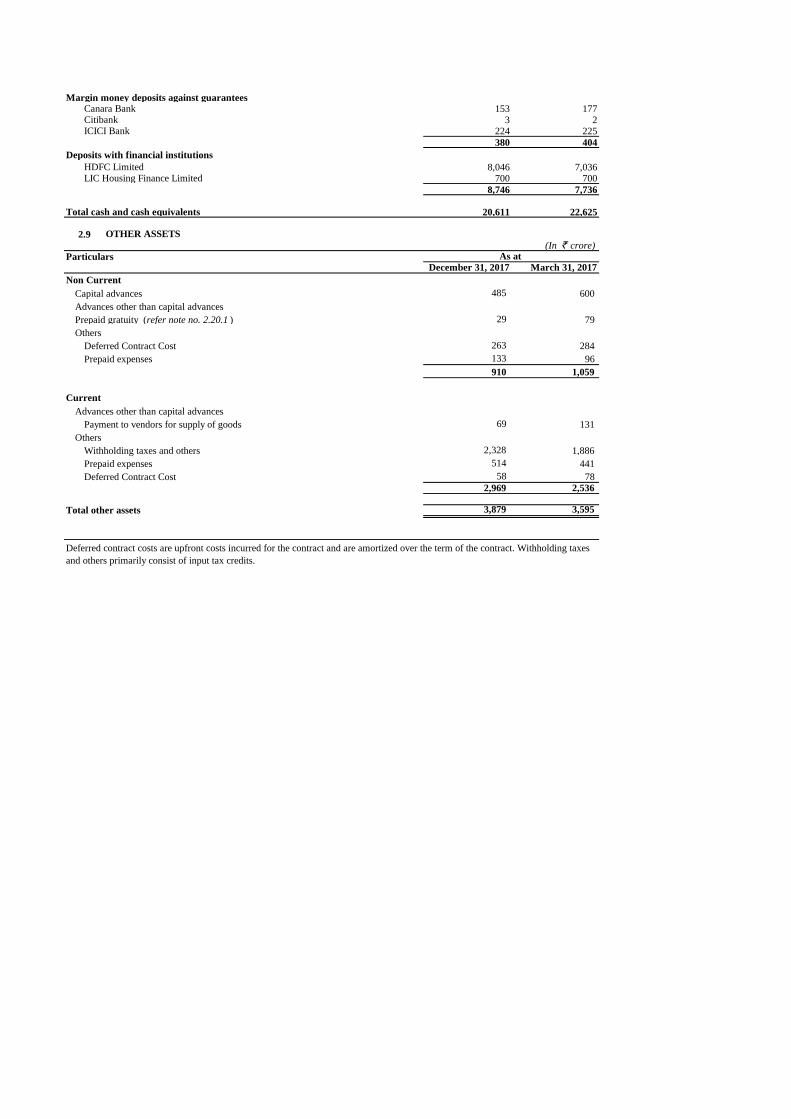
Margin money deposits against guaranteesCanara Bank 153 177 Citibank 3 2 ICICI Bank 224 225
380 404
Deposits with financial institutions
HDFC Limited 8,046 7,036 LIC Housing Finance Limited 700 700
8,746 7,736
Total cash and cash equivalents 20,611 22,625
2.9 OTHER ASSETS
(In ` crore)
ParticularsDecember 31, 2017 March 31, 2017
Non Current
Capital advances 485 600
Advances other than capital advances
Prepaid gratuity (refer note no. 2.20.1 ) 29 79
Others
Deferred Contract Cost 263 284
Prepaid expenses 133 96
910 1,059
Current
Advances other than capital advances
Payment to vendors for supply of goods 69 131
Others
Withholding taxes and others 2,328 1,886
Prepaid expenses 514 441
Deferred Contract Cost 58 78 2,969 2,536
Total other assets 3,879 3,595
Deferred contract costs are upfront costs incurred for the contract and are amortized over the term of the contract. Withholding taxes
and others primarily consist of input tax credits.
As at
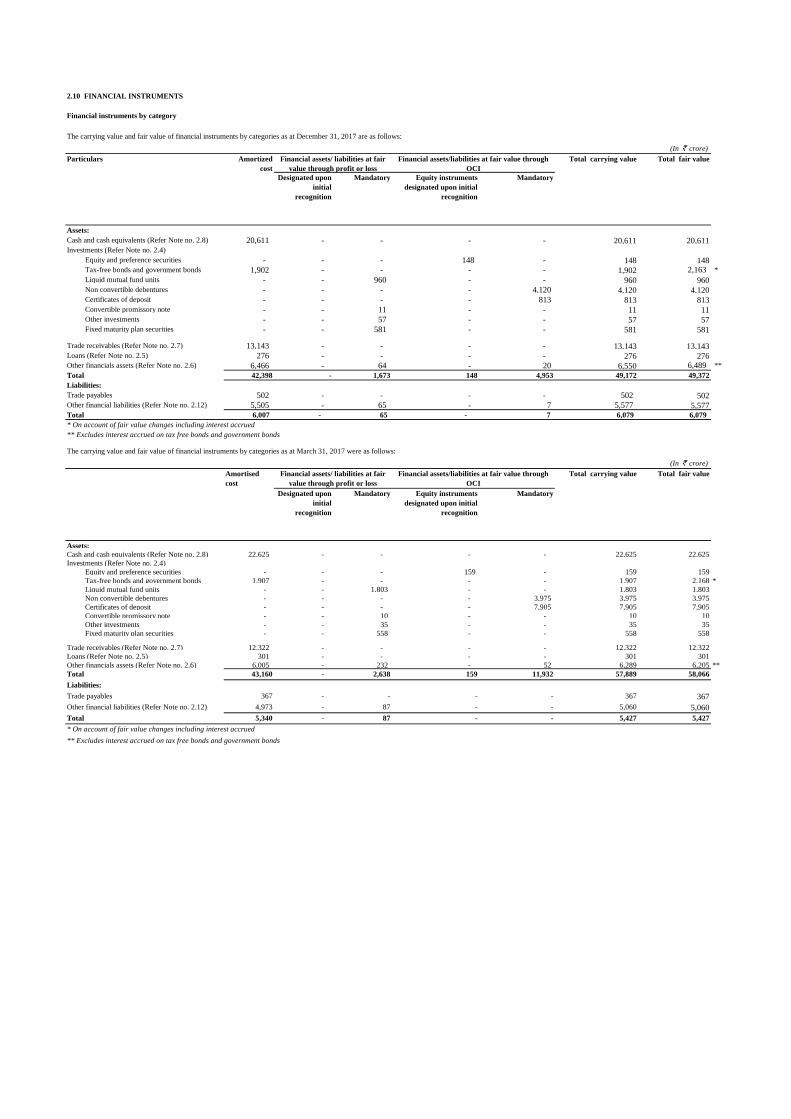
2.10 FINANCIAL INSTRUMENTS
Financial instruments by category
The carrying value and fair value of financial instruments by categories as at December 31, 2017 are as follows:
(In ` crore)
Particulars Amortized
cost
Total carrying value Total fair value
Designated upon
initial
recognition
Mandatory Equity instruments
designated upon initial
recognition
Mandatory
Assets:
Cash and cash equivalents (Refer Note no. 2.8) 20,611 - - - - 20,611 20,611 Investments (Refer Note no. 2.4)
Equity and preference securities - - - 148 - 148 148 Tax-free bonds and government bonds 1,902 - - - - 1,902 2,163 *
Liquid mutual fund units - - 960 - - 960 960 Non convertible debentures - - - - 4,120 4,120 4,120 Certificates of deposit - - - - 813 813 813 Convertible promissory note - - 11 - - 11 11 Other investments - - 57 - - 57 57 Fixed maturity plan securities - - 581 - - 581 581
Trade receivables (Refer Note no. 2.7) 13,143 - - - - 13,143 13,143 Loans (Refer Note no. 2.5) 276 - - - - 276 276 Other financials assets (Refer Note no. 2.6) 6,466 - 64 - 20 6,550 6,489 **
Total 42,398 - 1,673 148 4,953 49,172 49,372
Liabilities:
Trade payables 502 - - - - 502 502 Other financial liabilities (Refer Note no. 2.12) 5,505 - 65 - 7 5,577 5,577 Total 6,007 - 65 - 7 6,079 6,079
* On account of fair value changes including interest accrued
** Excludes interest accrued on tax free bonds and government bonds
The carrying value and fair value of financial instruments by categories as at March 31, 2017 were as follows:
(In ` crore)
Amortised
cost
Total carrying value Total fair value
Designated upon
initial
recognition
Mandatory Equity instruments
designated upon initial
recognition
Mandatory
Assets:
Cash and cash equivalents (Refer Note no. 2.8) 22,625 - - - - 22,625 22,625
Investments (Refer Note no. 2.4)
Equity and preference securities - - - 159 - 159 159
Tax-free bonds and government bonds 1,907 - - - - 1,907 2,168 *
Liquid mutual fund units - - 1,803 - - 1,803 1,803
Non convertible debentures - - - - 3,975 3,975 3,975
Certificates of deposit - - - - 7,905 7,905 7,905
Convertible promissory note - - 10 - - 10 10
Other investments - - 35 - - 35 35
Fixed maturity plan securities - - 558 - - 558 558
Trade receivables (Refer Note no. 2.7) 12,322 - - - - 12,322 12,322
Loans (Refer Note no. 2.5) 301 - - - - 301 301
Other financials assets (Refer Note no. 2.6) 6,005 - 232 - 52 6,289 6,205 **
Total 43,160 - 2,638 159 11,932 57,889 58,066
Liabilities:
Trade payables 367 - - - - 367 367
Other financial liabilities (Refer Note no. 2.12) 4,973 - 87 - - 5,060 5,060
Total 5,340 - 87 - - 5,427 5,427
* On account of fair value changes including interest accrued
** Excludes interest accrued on tax free bonds and government bonds
Financial assets/liabilities at fair value through
OCI
Financial assets/ liabilities at fair
value through profit or loss
Financial assets/liabilities at fair value through
OCI
Financial assets/ liabilities at fair
value through profit or loss
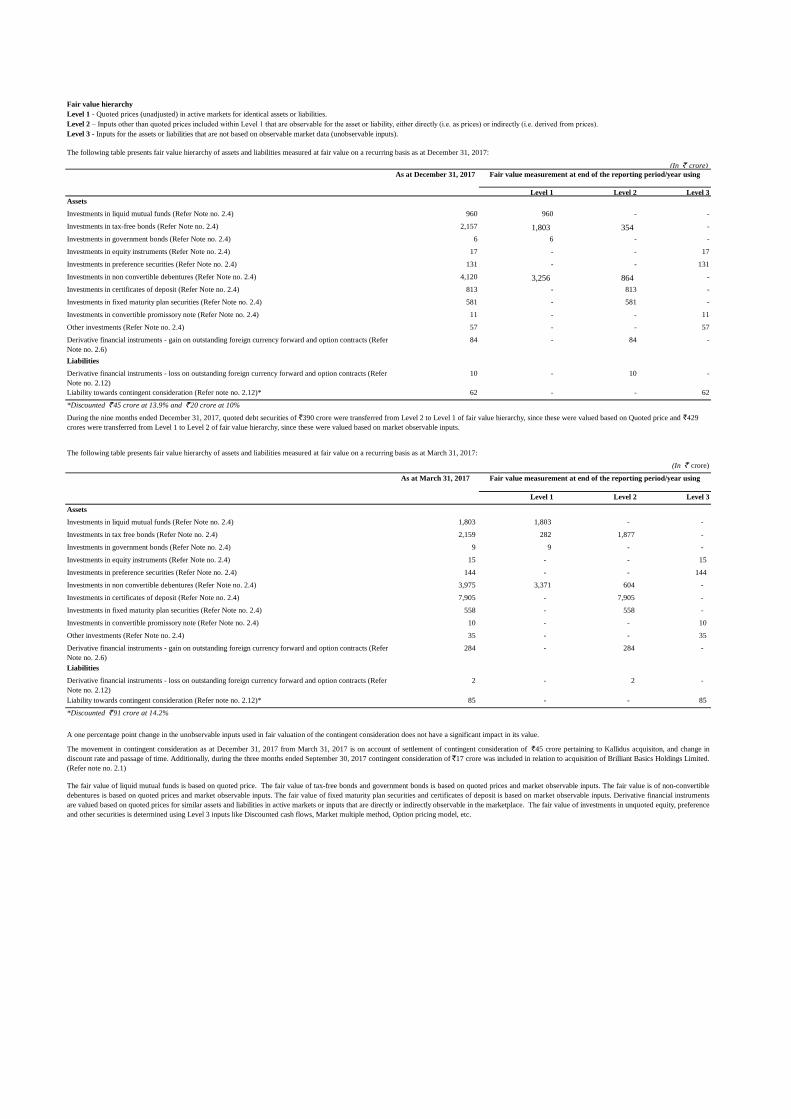
Fair value hierarchy
Level 1 - Quoted prices (unadjusted) in active markets for identical assets or liabilities.
Level 3 - Inputs for the assets or liabilities that are not based on observable market data (unobservable inputs).
(In ` crore)
Level 1 Level 2 Level 3
Assets
Investments in liquid mutual funds (Refer Note no. 2.4) 960 960 - -
Investments in tax-free bonds (Refer Note no. 2.4) 2,157 1,803 354 -
Investments in government bonds (Refer Note no. 2.4) 6 6 - -
Investments in equity instruments (Refer Note no. 2.4) 17 - - 17
Investments in preference securities (Refer Note no. 2.4) 131 - - 131
Investments in non convertible debentures (Refer Note no. 2.4) 4,120 3,256 864 -
Investments in certificates of deposit (Refer Note no. 2.4) 813 - 813 -
Investments in fixed maturity plan securities (Refer Note no. 2.4) 581 - 581 -
Investments in convertible promissory note (Refer Note no. 2.4) 11 - - 11
Other investments (Refer Note no. 2.4) 57 - - 57
84 - 84 -
Liabilities
10 - 10 -
Liability towards contingent consideration (Refer note no. 2.12)* 62 - - 62
*Discounted ` 45 crore at 13.9% and ` 20 crore at 10%
The following table presents fair value hierarchy of assets and liabilities measured at fair value on a recurring basis as at March 31, 2017:
(In ` crore)
Level 1 Level 2 Level 3
Assets
Investments in liquid mutual funds (Refer Note no. 2.4) 1,803 1,803 - -
Investments in tax free bonds (Refer Note no. 2.4) 2,159 282 1,877 -
Investments in government bonds (Refer Note no. 2.4) 9 9 - -
Investments in equity instruments (Refer Note no. 2.4) 15 - - 15
Investments in preference securities (Refer Note no. 2.4) 144 - - 144
Investments in non convertible debentures (Refer Note no. 2.4) 3,975 3,371 604 -
Investments in certificates of deposit (Refer Note no. 2.4) 7,905 - 7,905 -
Investments in fixed maturity plan securities (Refer Note no. 2.4) 558 - 558 -
Investments in convertible promissory note (Refer Note no. 2.4) 10 - - 10
Other investments (Refer Note no. 2.4) 35 - - 35
284 - 284 -
Liabilities
2 - 2 -
Liability towards contingent consideration (Refer note no. 2.12)* 85 - - 85
*Discounted ` 91 crore at 14.2%
During the nine months ended December 31, 2017, quoted debt securities of `390 crore were transferred from Level 2 to Level 1 of fair value hierarchy, since these were valued based on Quoted price and `429
crores were transferred from Level 1 to Level 2 of fair value hierarchy, since these were valued based on market observable inputs.
Derivative financial instruments - loss on outstanding foreign currency forward and option contracts (Refer
Note no. 2.12)
Level 2 – Inputs other than quoted prices included within Level 1 that are observable for the asset or liability, either directly (i.e. as prices) or indirectly (i.e. derived from prices).
Derivative financial instruments - gain on outstanding foreign currency forward and option contracts (Refer
Note no. 2.6)
Derivative financial instruments - gain on outstanding foreign currency forward and option contracts (Refer
Note no. 2.6)
Derivative financial instruments - loss on outstanding foreign currency forward and option contracts (Refer
Note no. 2.12)
The following table presents fair value hierarchy of assets and liabilities measured at fair value on a recurring basis as at December 31, 2017:
As at December 31, 2017
As at March 31, 2017 Fair value measurement at end of the reporting period/year using
Fair value measurement at end of the reporting period/year using
The movement in contingent consideration as at December 31, 2017 from March 31, 2017 is on account of settlement of contingent consideration of `45 crore pertaining to Kallidus acquisiton, and change in
discount rate and passage of time. Additionally, during the three months ended September 30, 2017 contingent consideration of `17 crore was included in relation to acquisition of Brilliant Basics Holdings Limited.
(Refer note no. 2.1)
The fair value of liquid mutual funds is based on quoted price. The fair value of tax-free bonds and government bonds is based on quoted prices and market observable inputs. The fair value is of non-convertible
debentures is based on quoted prices and market observable inputs. The fair value of fixed maturity plan securities and certificates of deposit is based on market observable inputs. Derivative financial instruments
are valued based on quoted prices for similar assets and liabilities in active markets or inputs that are directly or indirectly observable in the marketplace. The fair value of investments in unquoted equity, preference
and other securities is determined using Level 3 inputs like Discounted cash flows, Market multiple method, Option pricing model, etc.
A one percentage point change in the unobservable inputs used in fair valuation of the contingent consideration does not have a significant impact in its value.
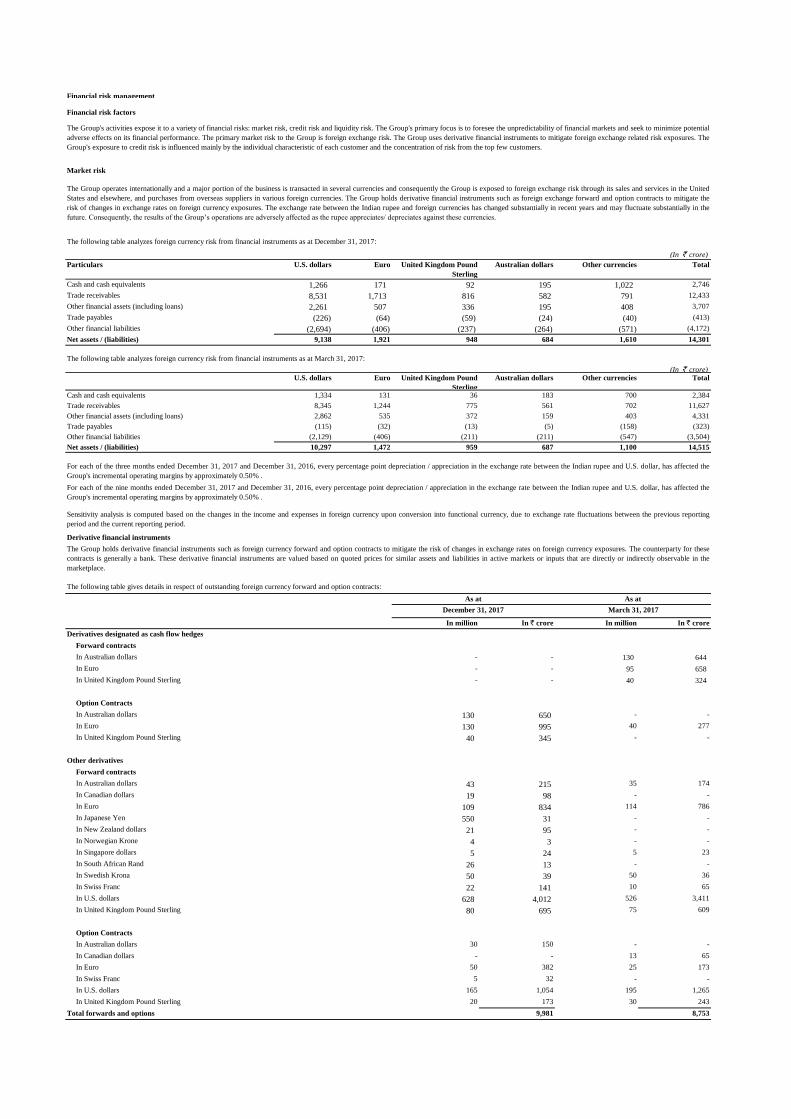
Financial risk management
Financial risk factors
Market risk
The following table analyzes foreign currency risk from financial instruments as at December 31, 2017:
(In ` crore)
Particulars U.S. dollars Euro United Kingdom Pound
Sterling
Australian dollars Other currencies Total
Cash and cash equivalents 1,266 171 92 195 1,022 2,746
Trade receivables 8,531 1,713 816 582 791 12,433
Other financial assets (including loans) 2,261 507 336 195 408 3,707
Trade payables (226) (64) (59) (24) (40) (413)
Other financial liabilities (2,694) (406) (237) (264) (571) (4,172)
Net assets / (liabilities) 9,138 1,921 948 684 1,610 14,301
The following table analyzes foreign currency risk from financial instruments as at March 31, 2017:
(In ` crore) U.S. dollars Euro United Kingdom Pound
Sterling
Australian dollars Other currencies Total
Cash and cash equivalents 1,334 131 36 183 700 2,384
Trade receivables 8,345 1,244 775 561 702 11,627
Other financial assets (including loans) 2,862 535 372 159 403 4,331
Trade payables (115) (32) (13) (5) (158) (323)
Other financial liabilities (2,129) (406) (211) (211) (547) (3,504)
Net assets / (liabilities) 10,297 1,472 959 687 1,100 14,515
Derivative financial instruments
The following table gives details in respect of outstanding foreign currency forward and option contracts:
In million In ` crore In million In ` crore
Derivatives designated as cash flow hedges
Forward contracts
In Australian dollars - - 130 644
In Euro - - 95 658
In United Kingdom Pound Sterling - - 40 324
Option Contracts
In Australian dollars 130 650 - -
In Euro 130 995 40 277
In United Kingdom Pound Sterling 40 345 - -
Other derivatives
Forward contracts
In Australian dollars 43 215 35 174
In Canadian dollars 19 98 - -
In Euro 109 834 114 786
In Japanese Yen 550 31 - -
In New Zealand dollars 21 95 - -
In Norwegian Krone 4 3 - -
In Singapore dollars 5 24 5 23
In South African Rand 26 13 - -
In Swedish Krona 50 39 50 36
In Swiss Franc 22 141 10 65
In U.S. dollars 628 4,012 526 3,411
In United Kingdom Pound Sterling 80 695 75 609
Option Contracts
In Australian dollars 30 150 - -
In Canadian dollars - - 13 65
In Euro 50 382 25 173
In Swiss Franc 5 32 - -
In U.S. dollars 165 1,054 195 1,265
In United Kingdom Pound Sterling 20 173 30 243
Total forwards and options 9,981 8,753
For each of the nine months ended December 31, 2017 and December 31, 2016, every percentage point depreciation / appreciation in the exchange rate between the Indian rupee and U.S. dollar, has affected the
Group's incremental operating margins by approximately 0.50% .
Sensitivity analysis is computed based on the changes in the income and expenses in foreign currency upon conversion into functional currency, due to exchange rate fluctuations between the previous reporting
period and the current reporting period.
For each of the three months ended December 31, 2017 and December 31, 2016, every percentage point depreciation / appreciation in the exchange rate between the Indian rupee and U.S. dollar, has affected the
Group's incremental operating margins by approximately 0.50% .
The Group's activities expose it to a variety of financial risks: market risk, credit risk and liquidity risk. The Group's primary focus is to foresee the unpredictability of financial markets and seek to minimize potential
adverse effects on its financial performance. The primary market risk to the Group is foreign exchange risk. The Group uses derivative financial instruments to mitigate foreign exchange related risk exposures. The
Group's exposure to credit risk is influenced mainly by the individual characteristic of each customer and the concentration of risk from the top few customers.
The Group operates internationally and a major portion of the business is transacted in several currencies and consequently the Group is exposed to foreign exchange risk through its sales and services in the United
States and elsewhere, and purchases from overseas suppliers in various foreign currencies. The Group holds derivative financial instruments such as foreign exchange forward and option contracts to mitigate the
risk of changes in exchange rates on foreign currency exposures. The exchange rate between the Indian rupee and foreign currencies has changed substantially in recent years and may fluctuate substantially in the
future. Consequently, the results of the Group’s operations are adversely affected as the rupee appreciates/ depreciates against these currencies.
As at
December 31, 2017 March 31, 2017
As at
The Group holds derivative financial instruments such as foreign currency forward and option contracts to mitigate the risk of changes in exchange rates on foreign currency exposures. The counterparty for these
contracts is generally a bank. These derivative financial instruments are valued based on quoted prices for similar assets and liabilities in active markets or inputs that are directly or indirectly observable in the
marketplace.
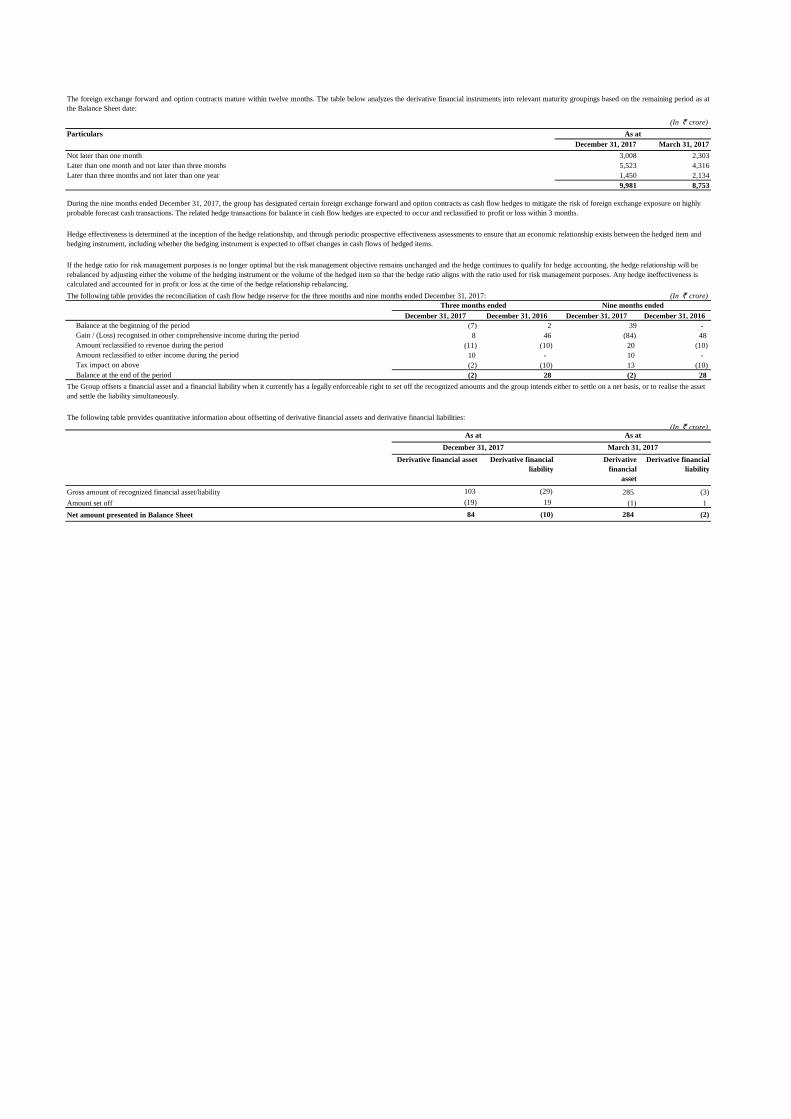
(In ` crore)
Particulars
December 31, 2017 March 31, 2017
Not later than one month 3,008 2,303
Later than one month and not later than three months 5,523 4,316
Later than three months and not later than one year 1,450 2,134
9,981 8,753
The following table provides the reconciliation of cash flow hedge reserve for the three months and nine months ended December 31, 2017: (In ` crore)
December 31, 2017 December 31, 2016 December 31, 2017 December 31, 2016
Balance at the beginning of the period (7) 2 39 -
Gain / (Loss) recognised in other comprehensive income during the period 8 46 (84) 48
Amount reclassified to revenue during the period (11) (10) 20 (10)
Amount reclassified to other income during the period 10 - 10 -
Tax impact on above (2) (10) 13 (10)
Balance at the end of the period (2) 28 (2) 28
(In ` crore)
Derivative financial asset Derivative financial
liability
Derivative
financial
asset
Derivative financial
liability
Gross amount of recognized financial asset/liability 103 (29) 285 (3)
Amount set off (19) 19 (1) 1
Net amount presented in Balance Sheet 84 (10) 284 (2)
The foreign exchange forward and option contracts mature within twelve months. The table below analyzes the derivative financial instruments into relevant maturity groupings based on the remaining period as at
the Balance Sheet date:
Three months ended
As at
As at
As at
The Group offsets a financial asset and a financial liability when it currently has a legally enforceable right to set off the recognized amounts and the group intends either to settle on a net basis, or to realise the asset
and settle the liability simultaneously.
The following table provides quantitative information about offsetting of derivative financial assets and derivative financial liabilities:
December 31, 2017
If the hedge ratio for risk management purposes is no longer optimal but the risk management objective remains unchanged and the hedge continues to qualify for hedge accounting, the hedge relationship will be
rebalanced by adjusting either the volume of the hedging instrument or the volume of the hedged item so that the hedge ratio aligns with the ratio used for risk management purposes. Any hedge ineffectiveness is
calculated and accounted for in profit or loss at the time of the hedge relationship rebalancing.
Hedge effectiveness is determined at the inception of the hedge relationship, and through periodic prospective effectiveness assessments to ensure that an economic relationship exists between the hedged item and
hedging instrument, including whether the hedging instrument is expected to offset changes in cash flows of hedged items.
During the nine months ended December 31, 2017, the group has designated certain foreign exchange forward and option contracts as cash flow hedges to mitigate the risk of foreign exchange exposure on highly
probable forecast cash transactions. The related hedge transactions for balance in cash flow hedges are expected to occur and reclassified to profit or loss within 3 months.
Nine months ended
March 31, 2017
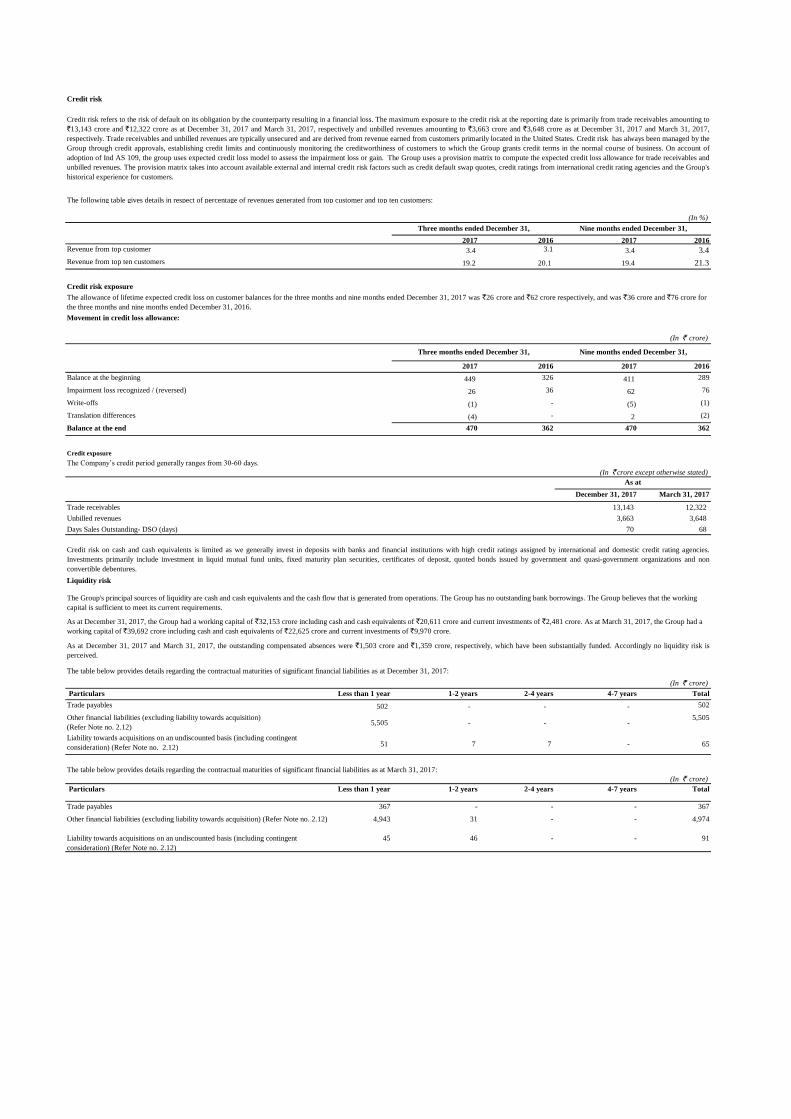
Credit risk
The following table gives details in respect of percentage of revenues generated from top customer and top ten customers:
(In %)
2017 2016 2017 2016
Revenue from top customer 3.4 3.1 3.4 3.4
Revenue from top ten customers 19.2 20.1 19.4 21.3
Movement in credit loss allowance:
(In ` crore)
2017 2016 2017 2016
Balance at the beginning 449 326 411 289
26 36 62 76
Write-offs (1) - (5) (1)
Translation differences (4) - 2 (2)
Balance at the end 470 362 470 362
Credit exposure
(In ` crore except otherwise stated)
December 31, 2017 March 31, 2017
Trade receivables 13,143 12,322
Unbilled revenues 3,663 3,648
Days Sales Outstanding- DSO (days) 70 68
Liquidity risk
The table below provides details regarding the contractual maturities of significant financial liabilities as at December 31, 2017:
(In ` crore)
Particulars Less than 1 year 1-2 years 2-4 years 4-7 years Total
Trade payables 502 - - - 502
5,505 - - - 5,505
51 7 7 - 65
The table below provides details regarding the contractual maturities of significant financial liabilities as at March 31, 2017:
(In ` crore)
Particulars Less than 1 year 1-2 years 2-4 years 4-7 years Total
Trade payables 367 - - - 367
4,943 31 - - 4,974
45 46 - - 91
Nine months ended December 31,
The allowance of lifetime expected credit loss on customer balances for the three months and nine months ended December 31, 2017 was `26 crore and `62 crore respectively, and was `36 crore and `76 crore for
the three months and nine months ended December 31, 2016.
Nine months ended December 31,Three months ended December 31,
Three months ended December 31,
Liability towards acquisitions on an undiscounted basis (including contingent
consideration) (Refer Note no. 2.12)
As at December 31, 2017, the Group had a working capital of `32,153 crore including cash and cash equivalents of `20,611 crore and current investments of `2,481 crore. As at March 31, 2017, the Group had a
working capital of `39,692 crore including cash and cash equivalents of `22,625 crore and current investments of `9,970 crore.
As at
Credit risk refers to the risk of default on its obligation by the counterparty resulting in a financial loss. The maximum exposure to the credit risk at the reporting date is primarily from trade receivables amounting to
`13,143 crore and `12,322 crore as at December 31, 2017 and March 31, 2017, respectively and unbilled revenues amounting to `3,663 crore and `3,648 crore as at December 31, 2017 and March 31, 2017,
respectively. Trade receivables and unbilled revenues are typically unsecured and are derived from revenue earned from customers primarily located in the United States. Credit risk has always been managed by the
Group through credit approvals, establishing credit limits and continuously monitoring the creditworthiness of customers to which the Group grants credit terms in the normal course of business. On account of
adoption of Ind AS 109, the group uses expected credit loss model to assess the impairment loss or gain. The Group uses a provision matrix to compute the expected credit loss allowance for trade receivables and
unbilled revenues. The provision matrix takes into account available external and internal credit risk factors such as credit default swap quotes, credit ratings from international credit rating agencies and the Group's
historical experience for customers.
Impairment loss recognized / (reversed)
Other financial liabilities (excluding liability towards acquisition) (Refer Note no. 2.12)
Other financial liabilities (excluding liability towards acquisition)
(Refer Note no. 2.12)
Liability towards acquisitions on an undiscounted basis (including contingent
consideration) (Refer Note no. 2.12)
Credit risk on cash and cash equivalents is limited as we generally invest in deposits with banks and financial institutions with high credit ratings assigned by international and domestic credit rating agencies.
Investments primarily include investment in liquid mutual fund units, fixed maturity plan securities, certificates of deposit, quoted bonds issued by government and quasi-government organizations and non
convertible debentures.
As at December 31, 2017 and March 31, 2017, the outstanding compensated absences were `1,503 crore and `1,359 crore, respectively, which have been substantially funded. Accordingly no liquidity risk is
perceived.
Credit risk exposure
The Company’s credit period generally ranges from 30-60 days.
The Group's principal sources of liquidity are cash and cash equivalents and the cash flow that is generated from operations. The Group has no outstanding bank borrowings. The Group believes that the working
capital is sufficient to meet its current requirements.
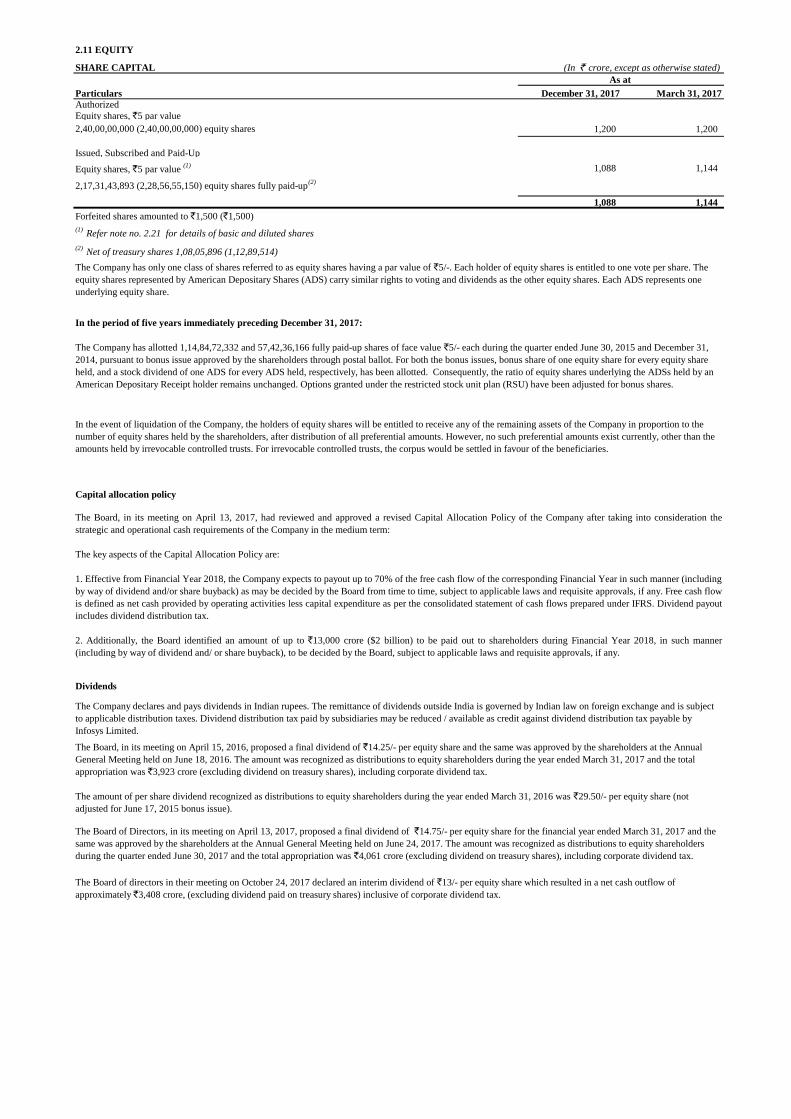
2.11 EQUITY
SHARE CAPITAL (In ` crore, except as otherwise stated)
Particulars December 31, 2017 March 31, 2017
Authorized
Equity shares, `5 par value
2,40,00,00,000 (2,40,00,00,000) equity shares 1,200 1,200
Issued, Subscribed and Paid-Up
Equity shares, `5 par value (1) 1,088 1,144
2,17,31,43,893 (2,28,56,55,150) equity shares fully paid-up(2)
1,088 1,144
Forfeited shares amounted to `1,500 (`1,500)
Capital allocation policy
Dividends
(1) Refer note no. 2.21 for details of basic and diluted shares
In the period of five years immediately preceding December 31, 2017:
The Company has allotted 1,14,84,72,332 and 57,42,36,166 fully paid-up shares of face value `5/- each during the quarter ended June 30, 2015 and December 31,
2014, pursuant to bonus issue approved by the shareholders through postal ballot. For both the bonus issues, bonus share of one equity share for every equity share
held, and a stock dividend of one ADS for every ADS held, respectively, has been allotted. Consequently, the ratio of equity shares underlying the ADSs held by an
American Depositary Receipt holder remains unchanged. Options granted under the restricted stock unit plan (RSU) have been adjusted for bonus shares.
(2) Net of treasury shares 1,08,05,896 (1,12,89,514)
The Board of Directors, in its meeting on April 13, 2017, proposed a final dividend of `14.75/- per equity share for the financial year ended March 31, 2017 and the
same was approved by the shareholders at the Annual General Meeting held on June 24, 2017. The amount was recognized as distributions to equity shareholders
during the quarter ended June 30, 2017 and the total appropriation was `4,061 crore (excluding dividend on treasury shares), including corporate dividend tax.
The Board, in its meeting on April 13, 2017, had reviewed and approved a revised Capital Allocation Policy of the Company after taking into consideration the
strategic and operational cash requirements of the Company in the medium term:
The key aspects of the Capital Allocation Policy are:
1. Effective from Financial Year 2018, the Company expects to payout up to 70% of the free cash flow of the corresponding Financial Year in such manner (including
by way of dividend and/or share buyback) as may be decided by the Board from time to time, subject to applicable laws and requisite approvals, if any. Free cash flow
is defined as net cash provided by operating activities less capital expenditure as per the consolidated statement of cash flows prepared under IFRS. Dividend payout
includes dividend distribution tax.
2. Additionally, the Board identified an amount of up to `13,000 crore ($2 billion) to be paid out to shareholders during Financial Year 2018, in such manner
(including by way of dividend and/ or share buyback), to be decided by the Board, subject to applicable laws and requisite approvals, if any.
The Company has only one class of shares referred to as equity shares having a par value of `5/-. Each holder of equity shares is entitled to one vote per share. The
equity shares represented by American Depositary Shares (ADS) carry similar rights to voting and dividends as the other equity shares. Each ADS represents one
underlying equity share.
As at
The Board, in its meeting on April 15, 2016, proposed a final dividend of `14.25/- per equity share and the same was approved by the shareholders at the Annual
General Meeting held on June 18, 2016. The amount was recognized as distributions to equity shareholders during the year ended March 31, 2017 and the total
appropriation was `3,923 crore (excluding dividend on treasury shares), including corporate dividend tax.
The amount of per share dividend recognized as distributions to equity shareholders during the year ended March 31, 2016 was `29.50/- per equity share (not
adjusted for June 17, 2015 bonus issue).
In the event of liquidation of the Company, the holders of equity shares will be entitled to receive any of the remaining assets of the Company in proportion to the
number of equity shares held by the shareholders, after distribution of all preferential amounts. However, no such preferential amounts exist currently, other than the
amounts held by irrevocable controlled trusts. For irrevocable controlled trusts, the corpus would be settled in favour of the beneficiaries.
The Company declares and pays dividends in Indian rupees. The remittance of dividends outside India is governed by Indian law on foreign exchange and is subject
to applicable distribution taxes. Dividend distribution tax paid by subsidiaries may be reduced / available as credit against dividend distribution tax payable by
Infosys Limited.
The Board of directors in their meeting on October 24, 2017 declared an interim dividend of `13/- per equity share which resulted in a net cash outflow of
approximately `3,408 crore, (excluding dividend paid on treasury shares) inclusive of corporate dividend tax.
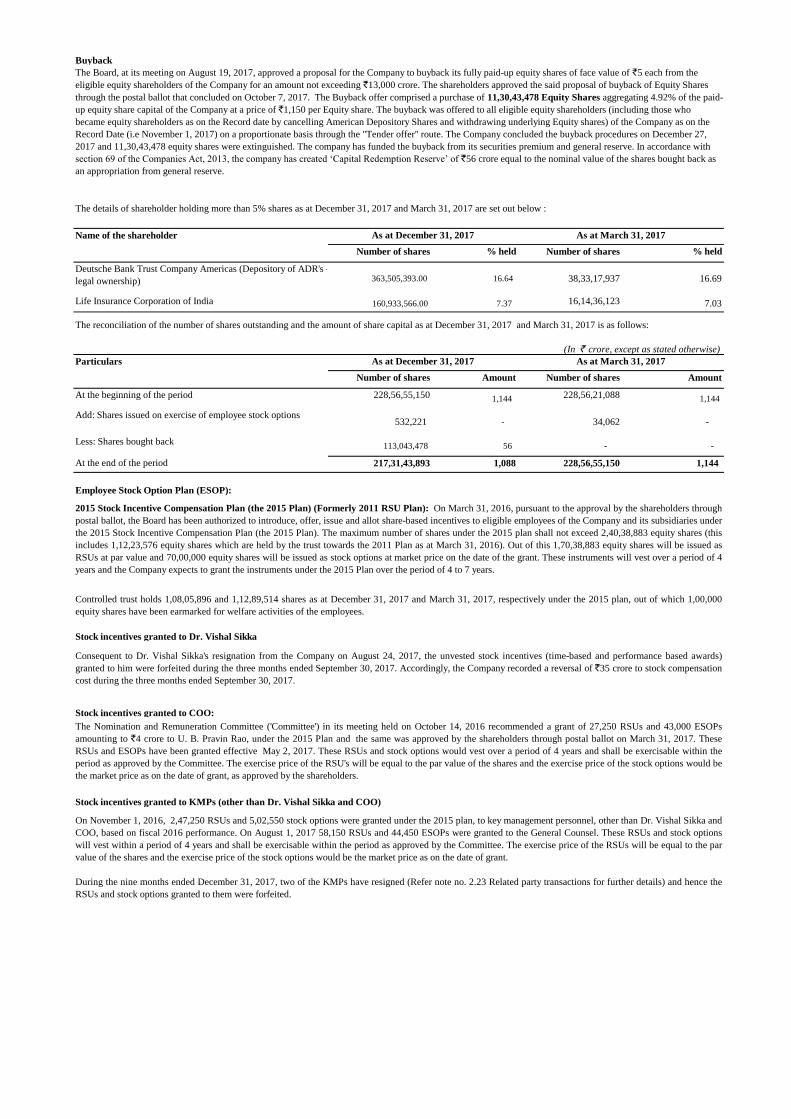
Buyback
Name of the shareholder
Number of shares % held Number of shares % held
Deutsche Bank Trust Company Americas (Depository of ADR's -
legal ownership) 363,505,393.00 16.64 38,33,17,937 16.69
Life Insurance Corporation of India 160,933,566.00 7.37 16,14,36,123 7.03
(In ` crore, except as stated otherwise)
Particulars
Number of shares Amount Number of shares Amount
At the beginning of the period 228,56,55,150 1,144 228,56,21,088 1,144
Add: Shares issued on exercise of employee stock options532,221 - 34,062 -
Less: Shares bought back 113,043,478 56 - -
At the end of the period 217,31,43,893 1,088 228,56,55,150 1,144
Employee Stock Option Plan (ESOP):
Stock incentives granted to Dr. Vishal Sikka
Stock incentives granted to COO:
Stock incentives granted to KMPs (other than Dr. Vishal Sikka and COO)
The reconciliation of the number of shares outstanding and the amount of share capital as at December 31, 2017 and March 31, 2017 is as follows:
The details of shareholder holding more than 5% shares as at December 31, 2017 and March 31, 2017 are set out below :
As at December 31, 2017
Consequent to Dr. Vishal Sikka's resignation from the Company on August 24, 2017, the unvested stock incentives (time-based and performance based awards)
granted to him were forfeited during the three months ended September 30, 2017. Accordingly, the Company recorded a reversal of `35 crore to stock compensation
cost during the three months ended September 30, 2017.
The Board, at its meeting on August 19, 2017, approved a proposal for the Company to buyback its fully paid-up equity shares of face value of `5 each from the
eligible equity shareholders of the Company for an amount not exceeding `13,000 crore. The shareholders approved the said proposal of buyback of Equity Shares
through the postal ballot that concluded on October 7, 2017. The Buyback offer comprised a purchase of 11,30,43,478 Equity Shares aggregating 4.92% of the paid-
up equity share capital of the Company at a price of `1,150 per Equity share. The buyback was offered to all eligible equity shareholders (including those who
became equity shareholders as on the Record date by cancelling American Depository Shares and withdrawing underlying Equity shares) of the Company as on the
Record Date (i.e November 1, 2017) on a proportionate basis through the "Tender offer" route. The Company concluded the buyback procedures on December 27,
2017 and 11,30,43,478 equity shares were extinguished. The company has funded the buyback from its securities premium and general reserve. In accordance with
section 69 of the Companies Act, 2013, the company has created ‘Capital Redemption Reserve’ of `56 crore equal to the nominal value of the shares bought back as
an appropriation from general reserve.
As at December 31, 2017 As at March 31, 2017
As at March 31, 2017
2015 Stock Incentive Compensation Plan (the 2015 Plan) (Formerly 2011 RSU Plan): On March 31, 2016, pursuant to the approval by the shareholders through
postal ballot, the Board has been authorized to introduce, offer, issue and allot share-based incentives to eligible employees of the Company and its subsidiaries under
the 2015 Stock Incentive Compensation Plan (the 2015 Plan). The maximum number of shares under the 2015 plan shall not exceed 2,40,38,883 equity shares (this
includes 1,12,23,576 equity shares which are held by the trust towards the 2011 Plan as at March 31, 2016). Out of this 1,70,38,883 equity shares will be issued as
RSUs at par value and 70,00,000 equity shares will be issued as stock options at market price on the date of the grant. These instruments will vest over a period of 4
years and the Company expects to grant the instruments under the 2015 Plan over the period of 4 to 7 years.
Controlled trust holds 1,08,05,896 and 1,12,89,514 shares as at December 31, 2017 and March 31, 2017, respectively under the 2015 plan, out of which 1,00,000
equity shares have been earmarked for welfare activities of the employees.
The Nomination and Remuneration Committee ('Committee') in its meeting held on October 14, 2016 recommended a grant of 27,250 RSUs and 43,000 ESOPs
amounting to `4 crore to U. B. Pravin Rao, under the 2015 Plan and the same was approved by the shareholders through postal ballot on March 31, 2017. These
RSUs and ESOPs have been granted effective May 2, 2017. These RSUs and stock options would vest over a period of 4 years and shall be exercisable within the
period as approved by the Committee. The exercise price of the RSU's will be equal to the par value of the shares and the exercise price of the stock options would be
the market price as on the date of grant, as approved by the shareholders.
On November 1, 2016, 2,47,250 RSUs and 5,02,550 stock options were granted under the 2015 plan, to key management personnel, other than Dr. Vishal Sikka and
COO, based on fiscal 2016 performance. On August 1, 2017 58,150 RSUs and 44,450 ESOPs were granted to the General Counsel. These RSUs and stock options
will vest within a period of 4 years and shall be exercisable within the period as approved by the Committee. The exercise price of the RSUs will be equal to the par
value of the shares and the exercise price of the stock options would be the market price as on the date of grant.
During the nine months ended December 31, 2017, two of the KMPs have resigned (Refer note no. 2.23 Related party transactions for further details) and hence the
RSUs and stock options granted to them were forfeited.
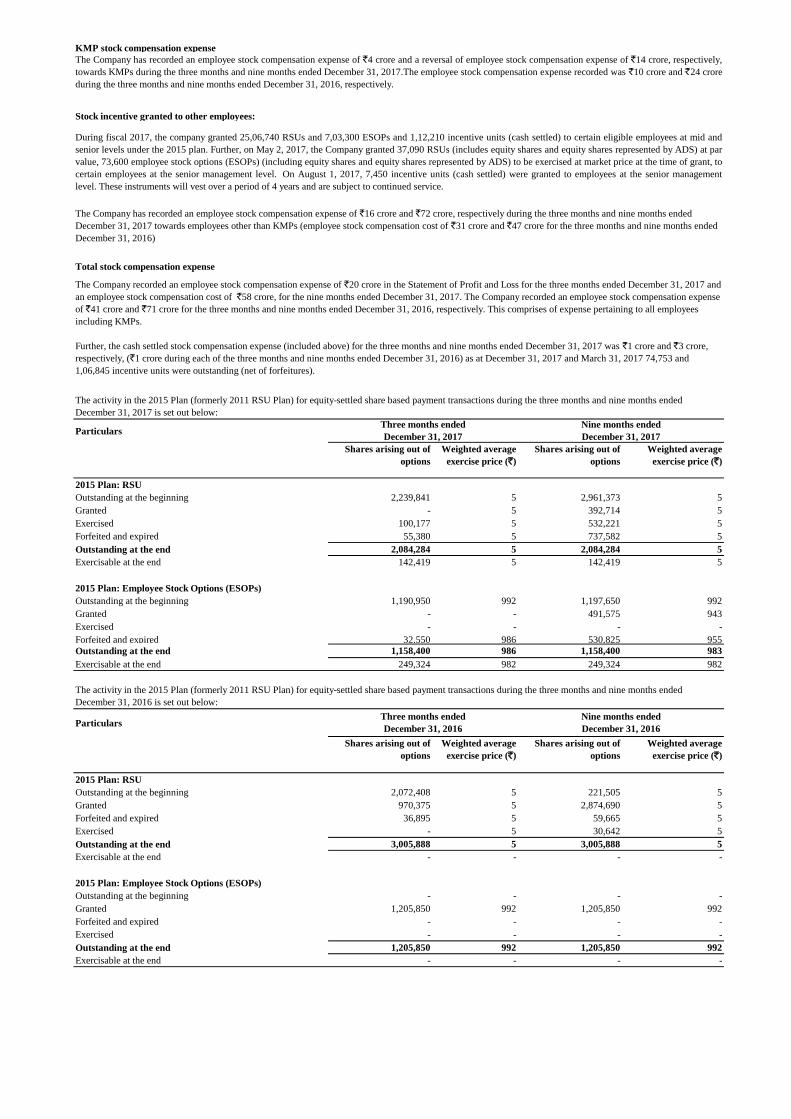
KMP stock compensation expense
Stock incentive granted to other employees:
Total stock compensation expense
Particulars
Shares arising out of
options
Weighted average
exercise price (`)
Shares arising out of
options
Weighted average
exercise price (`)
2015 Plan: RSU
Outstanding at the beginning 2,239,841 5 2,961,373 5
Granted - 5 392,714 5
Exercised 100,177 5 532,221 5
Forfeited and expired 55,380 5 737,582 5
Outstanding at the end 2,084,284 5 2,084,284 5
Exercisable at the end 142,419 5 142,419 5
2015 Plan: Employee Stock Options (ESOPs)
Outstanding at the beginning 1,190,950 992 1,197,650 992
Granted - - 491,575 943
Exercised - - - -
Forfeited and expired 32,550 986 530,825 955
Outstanding at the end 1,158,400 986 1,158,400 983
Exercisable at the end 249,324 982 249,324 982
Particulars
Shares arising out of
options
Weighted average
exercise price (`)
Shares arising out of
options
Weighted average
exercise price (`)
2015 Plan: RSU
Outstanding at the beginning 2,072,408 5 221,505 5
Granted 970,375 5 2,874,690 5
Forfeited and expired 36,895 5 59,665 5
Exercised - 5 30,642 5
Outstanding at the end 3,005,888 5 3,005,888 5
Exercisable at the end - - - -
2015 Plan: Employee Stock Options (ESOPs)
Outstanding at the beginning - - - -
Granted 1,205,850 992 1,205,850 992
Forfeited and expired - - - -
Exercised - - - -
Outstanding at the end 1,205,850 992 1,205,850 992
Exercisable at the end - - - -
Three months ended
December 31, 2016
Nine months ended
December 31, 2016
Nine months ended
December 31, 2017
The Company has recorded an employee stock compensation expense of `16 crore and `72 crore, respectively during the three months and nine months ended
December 31, 2017 towards employees other than KMPs (employee stock compensation cost of `31 crore and `47 crore for the three months and nine months ended
December 31, 2016)
The activity in the 2015 Plan (formerly 2011 RSU Plan) for equity-settled share based payment transactions during the three months and nine months ended
December 31, 2017 is set out below:
Three months ended
December 31, 2017
During fiscal 2017, the company granted 25,06,740 RSUs and 7,03,300 ESOPs and 1,12,210 incentive units (cash settled) to certain eligible employees at mid and
senior levels under the 2015 plan. Further, on May 2, 2017, the Company granted 37,090 RSUs (includes equity shares and equity shares represented by ADS) at par
value, 73,600 employee stock options (ESOPs) (including equity shares and equity shares represented by ADS) to be exercised at market price at the time of grant, to
certain employees at the senior management level. On August 1, 2017, 7,450 incentive units (cash settled) were granted to employees at the senior management
level. These instruments will vest over a period of 4 years and are subject to continued service.
The Company recorded an employee stock compensation expense of `20 crore in the Statement of Profit and Loss for the three months ended December 31, 2017 and
an employee stock compensation cost of `58 crore, for the nine months ended December 31, 2017. The Company recorded an employee stock compensation expense
of `41 crore and `71 crore for the three months and nine months ended December 31, 2016, respectively. This comprises of expense pertaining to all employees
including KMPs.
Further, the cash settled stock compensation expense (included above) for the three months and nine months ended December 31, 2017 was `1 crore and `3 crore,
respectively, (`1 crore during each of the three months and nine months ended December 31, 2016) as at December 31, 2017 and March 31, 2017 74,753 and
1,06,845 incentive units were outstanding (net of forfeitures).
The activity in the 2015 Plan (formerly 2011 RSU Plan) for equity-settled share based payment transactions during the three months and nine months ended
December 31, 2016 is set out below:
The Company has recorded an employee stock compensation expense of `4 crore and a reversal of employee stock compensation expense of `14 crore, respectively,
towards KMPs during the three months and nine months ended December 31, 2017.The employee stock compensation expense recorded was `10 crore and `24 crore
during the three months and nine months ended December 31, 2016, respectively.
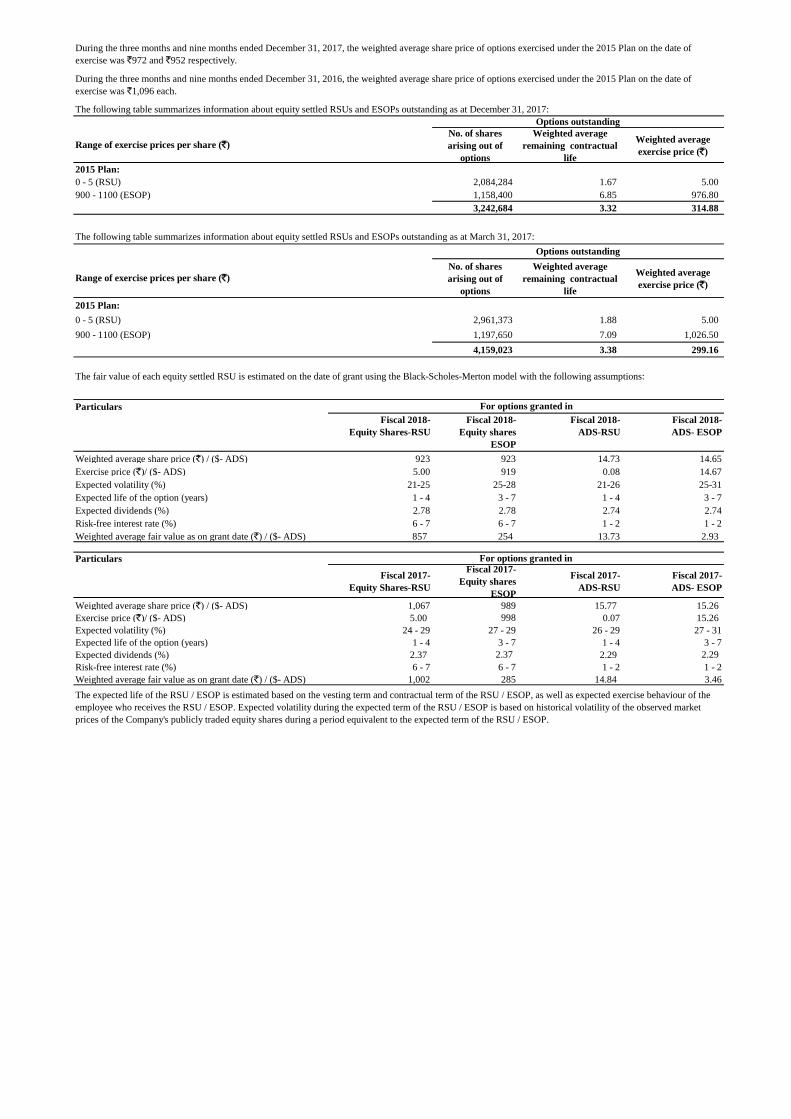
The following table summarizes information about equity settled RSUs and ESOPs outstanding as at December 31, 2017:
No. of shares
arising out of
options
Weighted average
remaining contractual
life
Weighted average
exercise price (`)
2015 Plan:
0 - 5 (RSU) 2,084,284 1.67 5.00
900 - 1100 (ESOP) 1,158,400 6.85 976.80
3,242,684 3.32 314.88
The following table summarizes information about equity settled RSUs and ESOPs outstanding as at March 31, 2017:
No. of shares
arising out of
options
Weighted average
remaining contractual
life
Weighted average
exercise price (`)
2015 Plan:
0 - 5 (RSU) 2,961,373 1.88 5.00
900 - 1100 (ESOP) 1,197,650 7.09 1,026.50
4,159,023 3.38 299.16
Particulars
Fiscal 2018-
Equity Shares-RSU
Fiscal 2018-
Equity shares
ESOP
Fiscal 2018-
ADS-RSU
Fiscal 2018-
ADS- ESOP
Weighted average share price (`) / ($- ADS) 923 923 14.73 14.65
Exercise price (`)/ ($- ADS) 5.00 919 0.08 14.67
Expected volatility (%) 21-25 25-28 21-26 25-31
Expected life of the option (years) 1 - 4 3 - 7 1 - 4 3 - 7
Expected dividends (%) 2.78 2.78 2.74 2.74
Risk-free interest rate (%) 6 - 7 6 - 7 1 - 2 1 - 2
Weighted average fair value as on grant date (`) / ($- ADS) 857 254 13.73 2.93
Particulars
Fiscal 2017-
Equity Shares-RSU
Fiscal 2017-
Equity shares
ESOP
Fiscal 2017-
ADS-RSU
Fiscal 2017-
ADS- ESOP
Weighted average share price (`) / ($- ADS) 1,067 989 15.77 15.26
Exercise price (`)/ ($- ADS) 5.00 998 0.07 15.26
Expected volatility (%) 24 - 29 27 - 29 26 - 29 27 - 31
Expected life of the option (years) 1 - 4 3 - 7 1 - 4 3 - 7
Expected dividends (%) 2.37 2.37 2.29 2.29
Risk-free interest rate (%) 6 - 7 6 - 7 1 - 2 1 - 2
Weighted average fair value as on grant date (`) / ($- ADS) 1,002 285 14.84 3.46
Range of exercise prices per share (`)
The expected life of the RSU / ESOP is estimated based on the vesting term and contractual term of the RSU / ESOP, as well as expected exercise behaviour of the
employee who receives the RSU / ESOP. Expected volatility during the expected term of the RSU / ESOP is based on historical volatility of the observed market
prices of the Company's publicly traded equity shares during a period equivalent to the expected term of the RSU / ESOP.
The fair value of each equity settled RSU is estimated on the date of grant using the Black-Scholes-Merton model with the following assumptions:
For options granted in
For options granted in
Options outstanding
Range of exercise prices per share (`)
Options outstanding
During the three months and nine months ended December 31, 2016, the weighted average share price of options exercised under the 2015 Plan on the date of
exercise was `1,096 each.
During the three months and nine months ended December 31, 2017, the weighted average share price of options exercised under the 2015 Plan on the date of
exercise was `972 and `952 respectively.
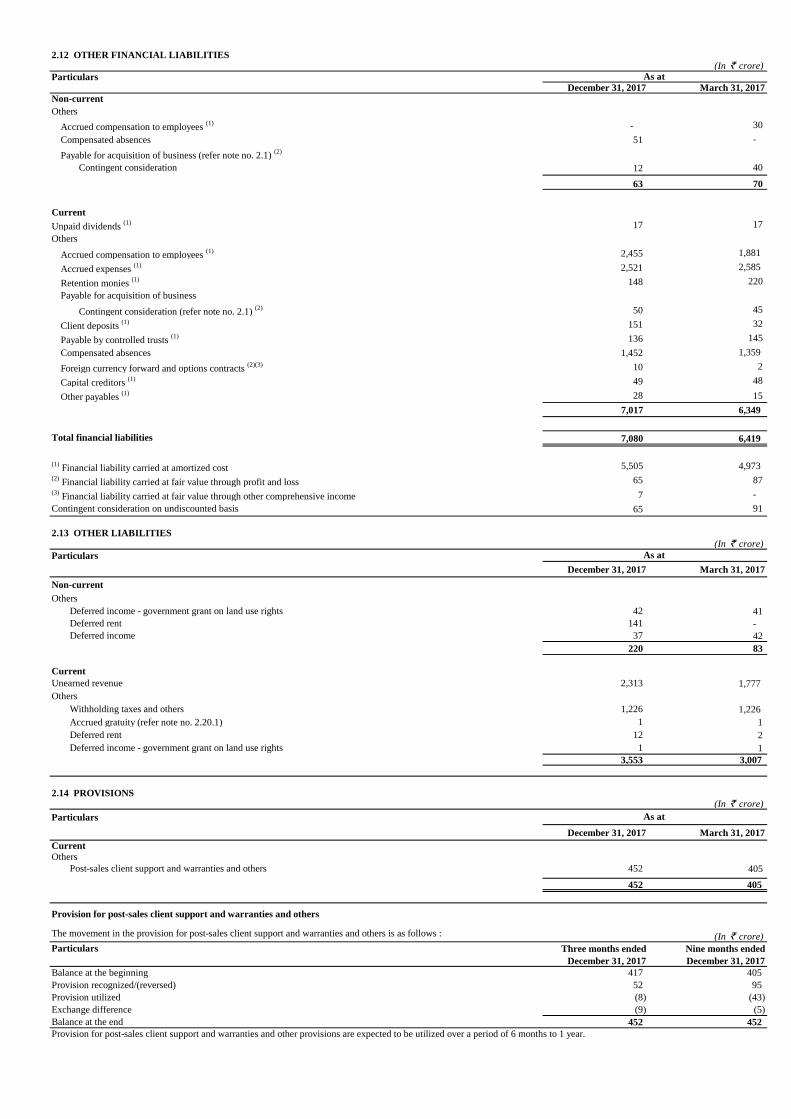
2.12 OTHER FINANCIAL LIABILITIES(In ` crore)
ParticularsDecember 31, 2017 March 31, 2017
Non-current
Others
Accrued compensation to employees (1) - 30
Compensated absences 51 -
Payable for acquisition of business (refer note no. 2.1) (2)
Contingent consideration 12 40
63 70
Current
Unpaid dividends (1) 17 17
Others
Accrued compensation to employees (1) 2,455 1,881
Accrued expenses (1) 2,521 2,585
Retention monies (1) 148 220
Payable for acquisition of business
Contingent consideration (refer note no. 2.1) (2) 50 45
Client deposits (1) 151 32
Payable by controlled trusts (1) 136 145
Compensated absences 1,452 1,359
Foreign currency forward and options contracts (2)(3) 10 2
Capital creditors (1) 49 48
Other payables (1) 28 15
7,017 6,349
Total financial liabilities 7,080 6,419
(1) Financial liability carried at amortized cost 5,505 4,973
(2) Financial liability carried at fair value through profit and loss 65 87
(3) Financial liability carried at fair value through other comprehensive income 7 -
Contingent consideration on undiscounted basis 65 91
2.13 OTHER LIABILITIES(In ` crore)
Particulars
December 31, 2017 March 31, 2017
Non-current
Others
Deferred income - government grant on land use rights 42 41
Deferred rent 141 -
Deferred income 37 42
220 83
Current
Unearned revenue 2,313 1,777
Others
Withholding taxes and others 1,226 1,226
Accrued gratuity (refer note no. 2.20.1) 1 1
Deferred rent 12 2
Deferred income - government grant on land use rights 1 1
3,553 3,007
2.14 PROVISIONS(In ` crore)
Particulars
December 31, 2017 March 31, 2017
Current
Others
Post-sales client support and warranties and others 452 405
452 405
Provision for post-sales client support and warranties and others
The movement in the provision for post-sales client support and warranties and others is as follows : (In ` crore)
Particulars Three months ended Nine months ended
December 31, 2017 December 31, 2017
Balance at the beginning 417 405
Provision recognized/(reversed) 52 95
Provision utilized (8) (43)
Exchange difference (9) (5)
Balance at the end 452 452
Provision for post-sales client support and warranties and other provisions are expected to be utilized over a period of 6 months to 1 year.
As at
As at
As at
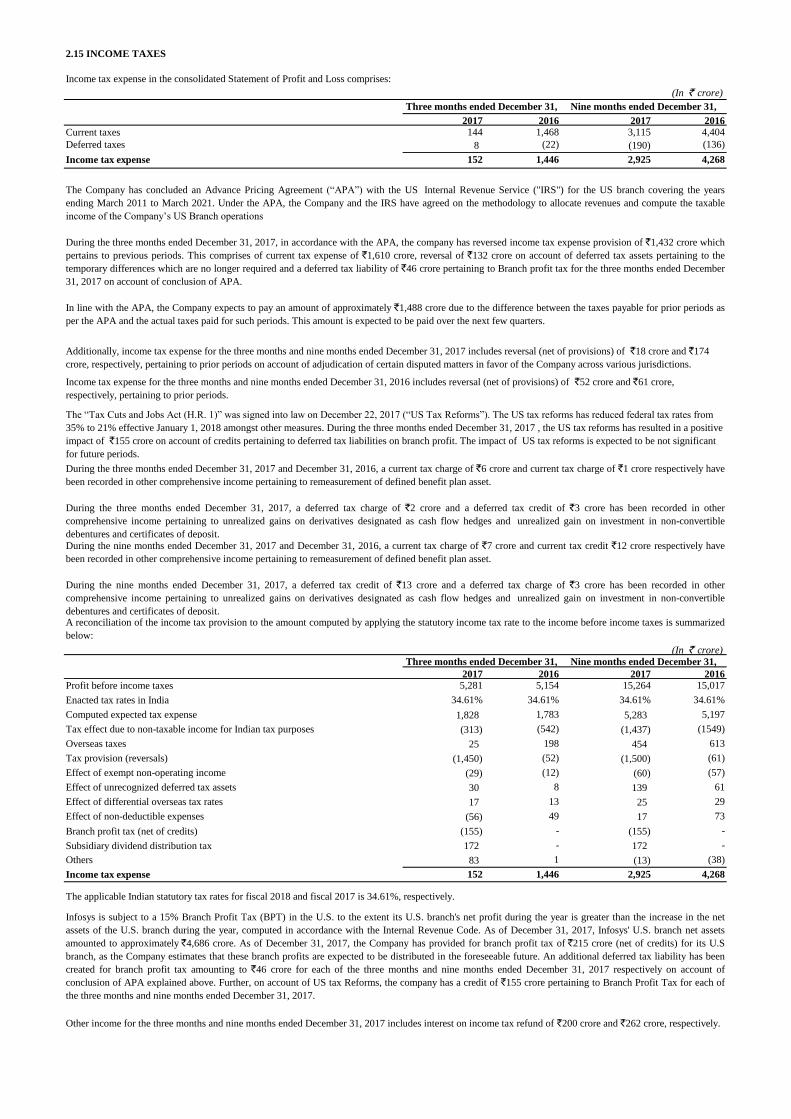
2.15 INCOME TAXES
Income tax expense in the consolidated Statement of Profit and Loss comprises:
(In ` crore)
2017 2016 2017 2016
Current taxes 144 1,468 3,115 4,404
Deferred taxes 8 (22) (190) (136)
Income tax expense 152 1,446 2,925 4,268
(In ` crore)
2017 2016 2017 2016
Profit before income taxes 5,281 5,154 15,264 15,017
Enacted tax rates in India 34.61% 34.61% 34.61% 34.61%
Computed expected tax expense 1,828 1,783 5,283 5,197
Tax effect due to non-taxable income for Indian tax purposes (313) (542) (1,437) (1549)
Overseas taxes 25 198 454 613
Tax provision (reversals) (1,450) (52) (1,500) (61)
Effect of exempt non-operating income (29) (12) (60) (57)
Effect of unrecognized deferred tax assets 30 8 139 61
Effect of differential overseas tax rates 17 13 25 29
Effect of non-deductible expenses (56) 49 17 73
Branch profit tax (net of credits) (155) - (155) -
Subsidiary dividend distribution tax 172 - 172 -
Others 83 1 (13) (38)
Income tax expense 152 1,446 2,925 4,268
The applicable Indian statutory tax rates for fiscal 2018 and fiscal 2017 is 34.61%, respectively.
The “Tax Cuts and Jobs Act (H.R. 1)” was signed into law on December 22, 2017 (“US Tax Reforms”). The US tax reforms has reduced federal tax rates from
35% to 21% effective January 1, 2018 amongst other measures. During the three months ended December 31, 2017 , the US tax reforms has resulted in a positive
impact of `155 crore on account of credits pertaining to deferred tax liabilities on branch profit. The impact of US tax reforms is expected to be not significant
for future periods.
Other income for the three months and nine months ended December 31, 2017 includes interest on income tax refund of `200 crore and `262 crore, respectively.
Nine months ended December 31,
Additionally, income tax expense for the three months and nine months ended December 31, 2017 includes reversal (net of provisions) of `18 crore and `174
crore, respectively, pertaining to prior periods on account of adjudication of certain disputed matters in favor of the Company across various jurisdictions.
Three months ended December 31,
The Company has concluded an Advance Pricing Agreement (“APA”) with the US Internal Revenue Service ("IRS") for the US branch covering the years
ending March 2011 to March 2021. Under the APA, the Company and the IRS have agreed on the methodology to allocate revenues and compute the taxable
income of the Company’s US Branch operations
During the three months ended December 31, 2017, in accordance with the APA, the company has reversed income tax expense provision of `1,432 crore which
pertains to previous periods. This comprises of current tax expense of `1,610 crore, reversal of `132 crore on account of deferred tax assets pertaining to the
temporary differences which are no longer required and a deferred tax liability of `46 crore pertaining to Branch profit tax for the three months ended December
31, 2017 on account of conclusion of APA.
In line with the APA, the Company expects to pay an amount of approximately `1,488 crore due to the difference between the taxes payable for prior periods as
per the APA and the actual taxes paid for such periods. This amount is expected to be paid over the next few quarters.
A reconciliation of the income tax provision to the amount computed by applying the statutory income tax rate to the income before income taxes is summarized
below:
Infosys is subject to a 15% Branch Profit Tax (BPT) in the U.S. to the extent its U.S. branch's net profit during the year is greater than the increase in the net
assets of the U.S. branch during the year, computed in accordance with the Internal Revenue Code. As of December 31, 2017, Infosys' U.S. branch net assets
amounted to approximately `4,686 crore. As of December 31, 2017, the Company has provided for branch profit tax of `215 crore (net of credits) for its U.S
branch, as the Company estimates that these branch profits are expected to be distributed in the foreseeable future. An additional deferred tax liability has been
created for branch profit tax amounting to `46 crore for each of the three months and nine months ended December 31, 2017 respectively on account of
conclusion of APA explained above. Further, on account of US tax Reforms, the company has a credit of `155 crore pertaining to Branch Profit Tax for each of
the three months and nine months ended December 31, 2017.
Three months ended December 31,
During the nine months ended December 31, 2017 and December 31, 2016, a current tax charge of `7 crore and current tax credit `12 crore respectively have
been recorded in other comprehensive income pertaining to remeasurement of defined benefit plan asset.
During the nine months ended December 31, 2017, a deferred tax credit of `13 crore and a deferred tax charge of `3 crore has been recorded in other
comprehensive income pertaining to unrealized gains on derivatives designated as cash flow hedges and unrealized gain on investment in non-convertible
debentures and certificates of deposit.
Nine months ended December 31,
During the three months ended December 31, 2017 and December 31, 2016, a current tax charge of `6 crore and current tax charge of `1 crore respectively have
been recorded in other comprehensive income pertaining to remeasurement of defined benefit plan asset.
During the three months ended December 31, 2017, a deferred tax charge of `2 crore and a deferred tax credit of `3 crore has been recorded in other
comprehensive income pertaining to unrealized gains on derivatives designated as cash flow hedges and unrealized gain on investment in non-convertible
debentures and certificates of deposit.
Income tax expense for the three months and nine months ended December 31, 2016 includes reversal (net of provisions) of `52 crore and `61 crore,
respectively, pertaining to prior periods.
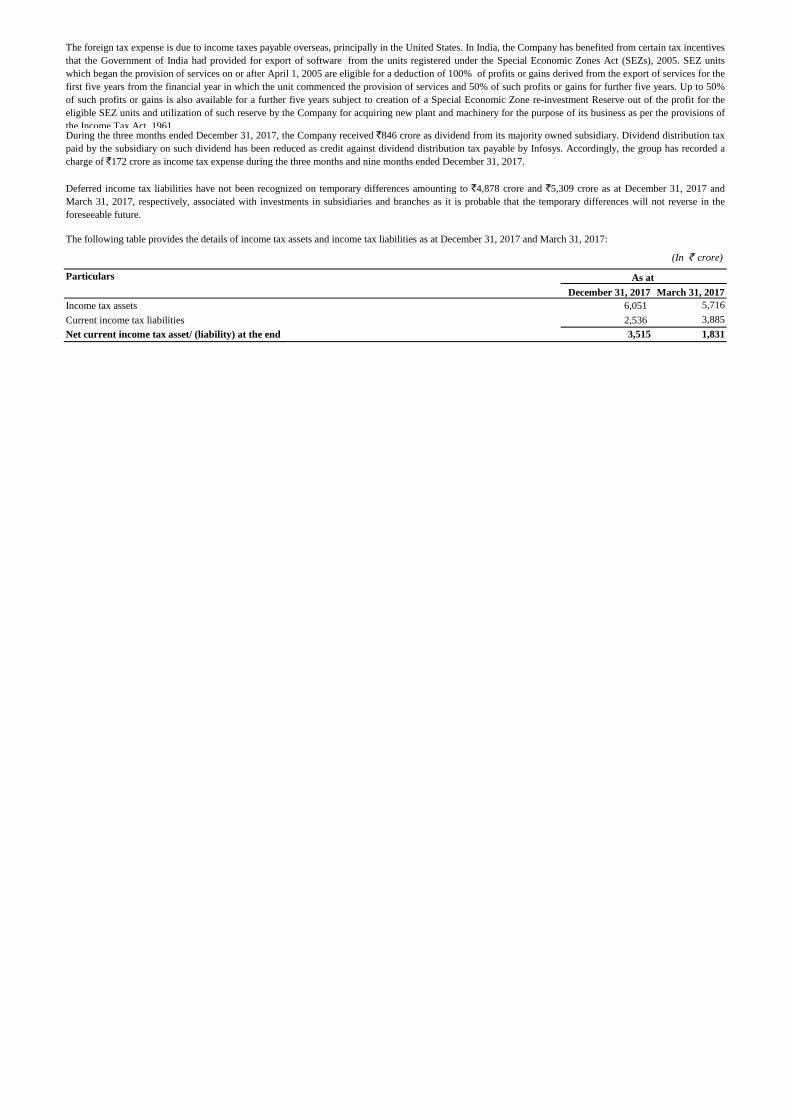
The following table provides the details of income tax assets and income tax liabilities as at December 31, 2017 and March 31, 2017:
(In ` crore)
Particulars
December 31, 2017 March 31, 2017
Income tax assets 6,051 5,716
Current income tax liabilities 2,536 3,885
Net current income tax asset/ (liability) at the end 3,515 1,831
The foreign tax expense is due to income taxes payable overseas, principally in the United States. In India, the Company has benefited from certain tax incentives
that the Government of India had provided for export of software from the units registered under the Special Economic Zones Act (SEZs), 2005. SEZ units
which began the provision of services on or after April 1, 2005 are eligible for a deduction of 100% of profits or gains derived from the export of services for the
first five years from the financial year in which the unit commenced the provision of services and 50% of such profits or gains for further five years. Up to 50%
of such profits or gains is also available for a further five years subject to creation of a Special Economic Zone re-investment Reserve out of the profit for the
eligible SEZ units and utilization of such reserve by the Company for acquiring new plant and machinery for the purpose of its business as per the provisions of
the Income Tax Act, 1961. During the three months ended December 31, 2017, the Company received `846 crore as dividend from its majority owned subsidiary. Dividend distribution tax
paid by the subsidiary on such dividend has been reduced as credit against dividend distribution tax payable by Infosys. Accordingly, the group has recorded a
charge of `172 crore as income tax expense during the three months and nine months ended December 31, 2017.
Deferred income tax liabilities have not been recognized on temporary differences amounting to `4,878 crore and `5,309 crore as at December 31, 2017 and
March 31, 2017, respectively, associated with investments in subsidiaries and branches as it is probable that the temporary differences will not reverse in the
foreseeable future.
As at
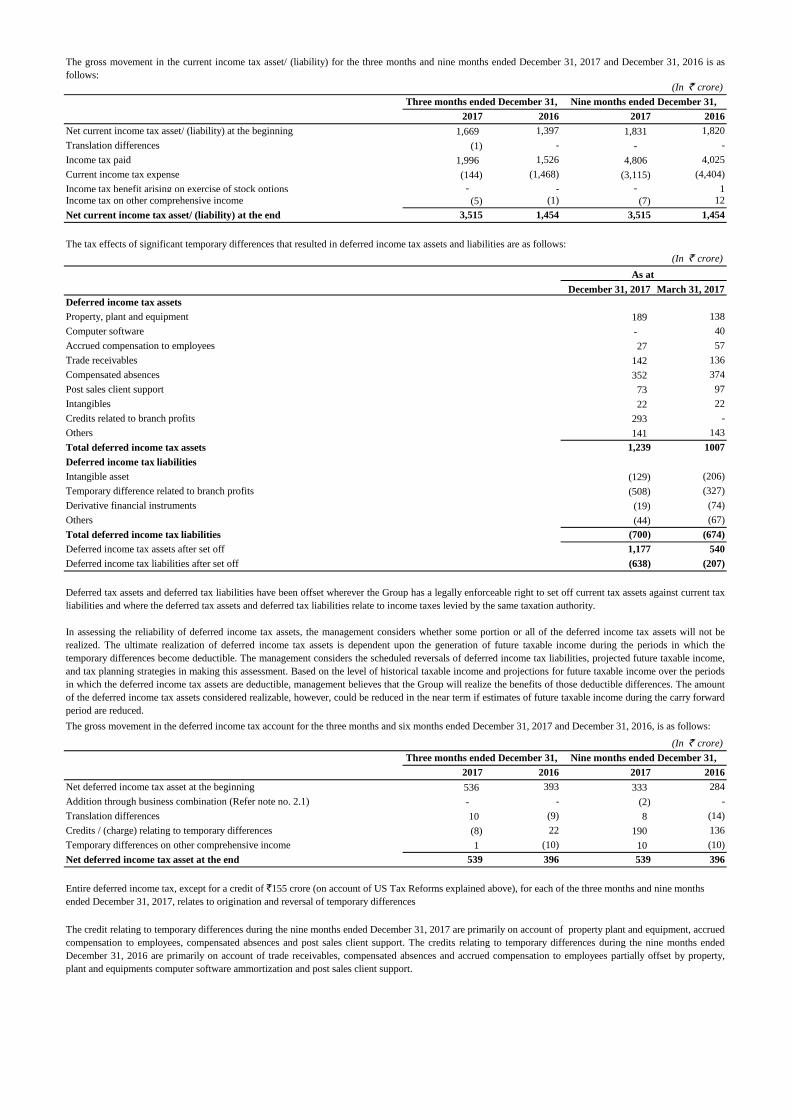
(In ` crore)
2017 2016 2017 2016
Net current income tax asset/ (liability) at the beginning 1,669 1,397 1,831 1,820
Translation differences (1) - - -
Income tax paid 1,996 1,526 4,806 4,025
Current income tax expense (144) (1,468) (3,115) (4,404)
Income tax benefit arising on exercise of stock options - - - 1
Income tax on other comprehensive income (5) (1) (7) 12
Net current income tax asset/ (liability) at the end 3,515 1,454 3,515 1,454
The tax effects of significant temporary differences that resulted in deferred income tax assets and liabilities are as follows:
(In ` crore)
December 31, 2017 March 31, 2017
Deferred income tax assets
Property, plant and equipment 189 138
Computer software - 40
Accrued compensation to employees 27 57
Trade receivables 142 136
Compensated absences 352 374
Post sales client support 73 97
Intangibles 22 22
Credits related to branch profits 293 -
Others 141 143
Total deferred income tax assets 1,239 1007
Deferred income tax liabilities
Intangible asset (129) (206)
Temporary difference related to branch profits (508) (327)
Derivative financial instruments (19) (74)
Others (44) (67)
Total deferred income tax liabilities (700) (674)
Deferred income tax assets after set off 1,177 540
Deferred income tax liabilities after set off (638) (207)
(In ` crore)
2017 2016 2017 2016
Net deferred income tax asset at the beginning 536 393 333 284
Addition through business combination (Refer note no. 2.1) - - (2) -
Translation differences 10 (9) 8 (14)
Credits / (charge) relating to temporary differences (8) 22 190 136
Temporary differences on other comprehensive income 1 (10) 10 (10)
Net deferred income tax asset at the end 539 396 539 396
Entire deferred income tax, except for a credit of `155 crore (on account of US Tax Reforms explained above), for each of the three months and nine months
ended December 31, 2017, relates to origination and reversal of temporary differences
Three months ended December 31, Nine months ended December 31,
Deferred tax assets and deferred tax liabilities have been offset wherever the Group has a legally enforceable right to set off current tax assets against current tax
liabilities and where the deferred tax assets and deferred tax liabilities relate to income taxes levied by the same taxation authority.
As at
In assessing the reliability of deferred income tax assets, the management considers whether some portion or all of the deferred income tax assets will not be
realized. The ultimate realization of deferred income tax assets is dependent upon the generation of future taxable income during the periods in which the
temporary differences become deductible. The management considers the scheduled reversals of deferred income tax liabilities, projected future taxable income,
and tax planning strategies in making this assessment. Based on the level of historical taxable income and projections for future taxable income over the periods
in which the deferred income tax assets are deductible, management believes that the Group will realize the benefits of those deductible differences. The amount
of the deferred income tax assets considered realizable, however, could be reduced in the near term if estimates of future taxable income during the carry forward
period are reduced.
The credit relating to temporary differences during the nine months ended December 31, 2017 are primarily on account of property plant and equipment, accrued
compensation to employees, compensated absences and post sales client support. The credits relating to temporary differences during the nine months ended
December 31, 2016 are primarily on account of trade receivables, compensated absences and accrued compensation to employees partially offset by property,
plant and equipments computer software ammortization and post sales client support.
The gross movement in the deferred income tax account for the three months and six months ended December 31, 2017 and December 31, 2016, is as follows:
Three months ended December 31, Nine months ended December 31,
The gross movement in the current income tax asset/ (liability) for the three months and nine months ended December 31, 2017 and December 31, 2016 is as
follows:
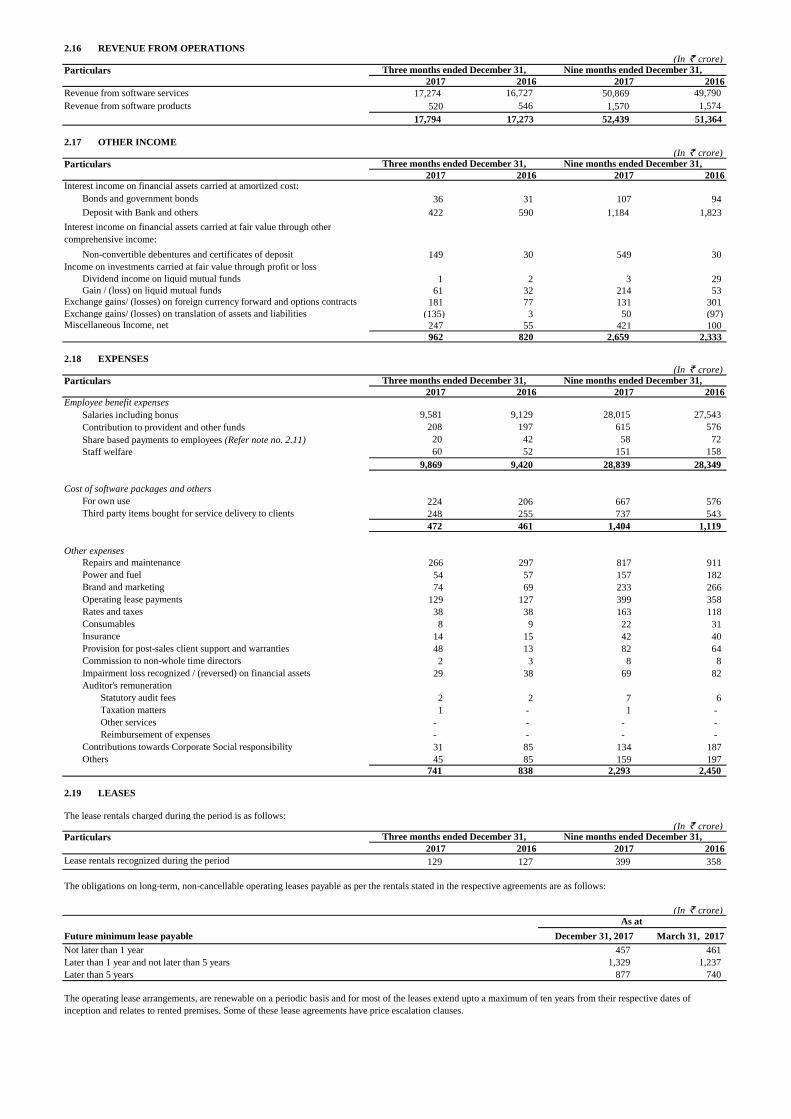
2.16 REVENUE FROM OPERATIONS(In ` crore)
Particulars
2017 2016 2017 2016
Revenue from software services 17,274 16,727 50,869 49,790
Revenue from software products 520 546 1,570 1,574
17,794 17,273 52,439 51,364
2.17 OTHER INCOME(In ` crore)
Particulars
2017 2016 2017 2016
36 31 107 94
Deposit with Bank and others 422 590 1,184 1,823
Non-convertible debentures and certificates of deposit 149 30 549 30
Dividend income on liquid mutual funds 1 2 3 29
Gain / (loss) on liquid mutual funds 61 32 214 53
181 77 131 301
Exchange gains/ (losses) on translation of assets and liabilities (135) 3 50 (97)
247 55 421 100
962 820 2,659 2,333
2.18 EXPENSES(In ` crore)
Particulars
2017 2016 2017 2016 Employee benefit expenses
Salaries including bonus 9,581 9,129 28,015 27,543
Contribution to provident and other funds 208 197 615 576
Share based payments to employees (Refer note no. 2.11) 20 42 58 72
Staff welfare 60 52 151 158
9,869 9,420 28,839 28,349
Cost of software packages and others
For own use 224 206 667 576
Third party items bought for service delivery to clients 248 255 737 543
472 461 1,404 1,119
Other expenses
Repairs and maintenance 266 297 817 911
Power and fuel 54 57 157 182
Brand and marketing 74 69 233 266
Operating lease payments 129 127 399 358
Rates and taxes 38 38 163 118
Consumables 8 9 22 31
Insurance 14 15 42 40
Provision for post-sales client support and warranties 48 13 82 64
Commission to non-whole time directors 2 3 8 8
Impairment loss recognized / (reversed) on financial assets 29 38 69 82
Auditor's remuneration
Statutory audit fees 2 2 7 6
Taxation matters 1 - 1 -
Other services - - - -
Reimbursement of expenses - - - -
Contributions towards Corporate Social responsibility 31 85 134 187
Others 45 85 159 197
741 838 2,293 2,450
2.19 LEASES
(In ` crore)Particulars
2017 2016 2017 2016
Lease rentals recognized during the period 129 127 399 358
(In ` crore)
Future minimum lease payable December 31, 2017 March 31, 2017
Not later than 1 year 457 461
Later than 1 year and not later than 5 years 1,329 1,237
Later than 5 years 877 740
Nine months ended December 31,
Nine months ended December 31,
Nine months ended December 31,
Three months ended December 31,
Interest income on financial assets carried at amortized cost:
Miscellaneous Income, net
Interest income on financial assets carried at fair value through other
comprehensive income:
Three months ended December 31,
Bonds and government bonds
Income on investments carried at fair value through profit or loss
Exchange gains/ (losses) on foreign currency forward and options contracts
Nine months ended December 31,
The operating lease arrangements, are renewable on a periodic basis and for most of the leases extend upto a maximum of ten years from their respective dates of
inception and relates to rented premises. Some of these lease agreements have price escalation clauses.
The obligations on long-term, non-cancellable operating leases payable as per the rentals stated in the respective agreements are as follows:
The lease rentals charged during the period is as follows:
Three months ended December 31,
Three months ended December 31,
As at
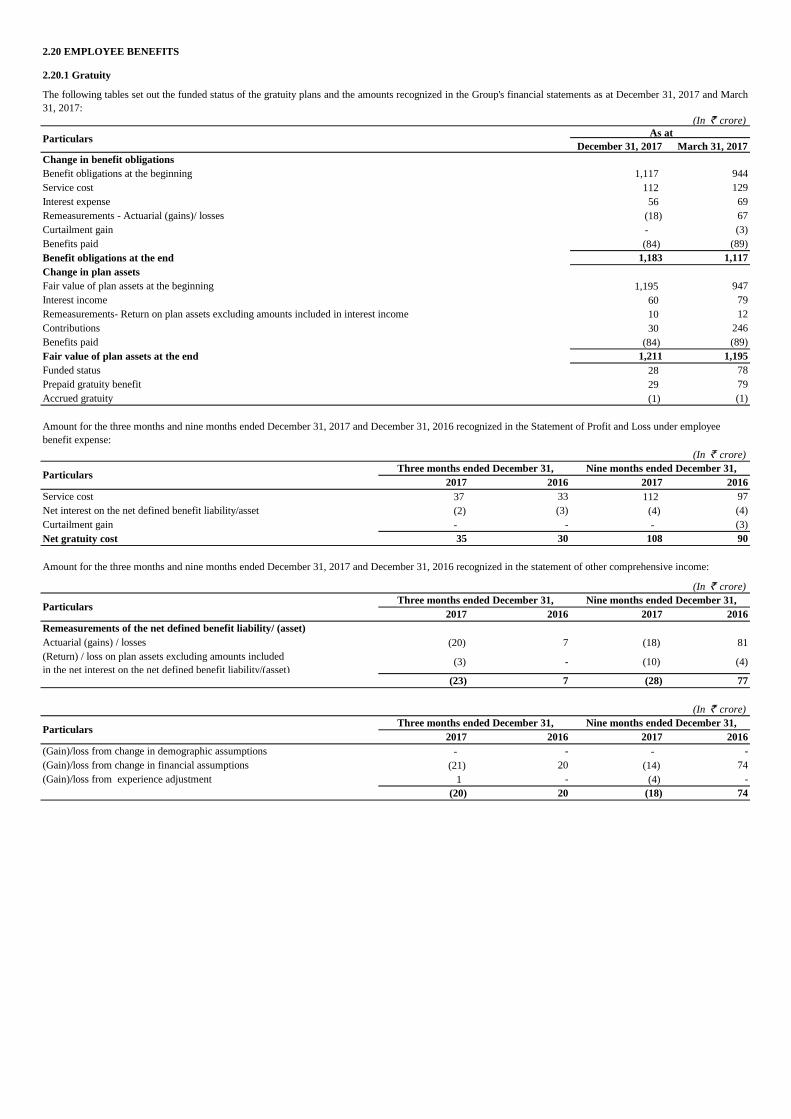
2.20 EMPLOYEE BENEFITS
2.20.1 Gratuity
(In ` crore)
December 31, 2017 March 31, 2017
Change in benefit obligations
Benefit obligations at the beginning 1,117 944
Service cost 112 129
Interest expense 56 69
Remeasurements - Actuarial (gains)/ losses (18) 67
Curtailment gain - (3)
Benefits paid (84) (89)
Benefit obligations at the end 1,183 1,117
Change in plan assets
Fair value of plan assets at the beginning 1,195 947
Interest income 60 79
Remeasurements- Return on plan assets excluding amounts included in interest income 10 12
Contributions 30 246
Benefits paid (84) (89)
Fair value of plan assets at the end 1,211 1,195
Funded status 28 78
Prepaid gratuity benefit 29 79
Accrued gratuity (1) (1)
(In ` crore)
2017 2016 2017 2016
Service cost 37 33 112 97
(2) (3) (4) (4)
Curtailment gain - - - (3)
Net gratuity cost 35 30 108 90
Amount for the three months and nine months ended December 31, 2017 and December 31, 2016 recognized in the statement of other comprehensive income:
(In ` crore)
2017 2016 2017 2016
Actuarial (gains) / losses (20) 7 (18) 81
(3) - (10) (4)
(23) 7 (28) 77
(In ` crore)
2017 2016 2017 2016
(Gain)/loss from change in demographic assumptions - - - -
(Gain)/loss from change in financial assumptions (21) 20 (14) 74
(Gain)/loss from experience adjustment 1 - (4) -
(20) 20 (18) 74
Three months ended December 31,
Three months ended December 31,
Three months ended December 31,
(Return) / loss on plan assets excluding amounts included
in the net interest on the net defined benefit liability/(asset)
Nine months ended December 31,
The following tables set out the funded status of the gratuity plans and the amounts recognized in the Group's financial statements as at December 31, 2017 and March
31, 2017:
As at
Remeasurements of the net defined benefit liability/ (asset)
Particulars
Nine months ended December 31,
Nine months ended December 31,
Amount for the three months and nine months ended December 31, 2017 and December 31, 2016 recognized in the Statement of Profit and Loss under employee
benefit expense:
Net interest on the net defined benefit liability/asset
Particulars
Particulars
Particulars
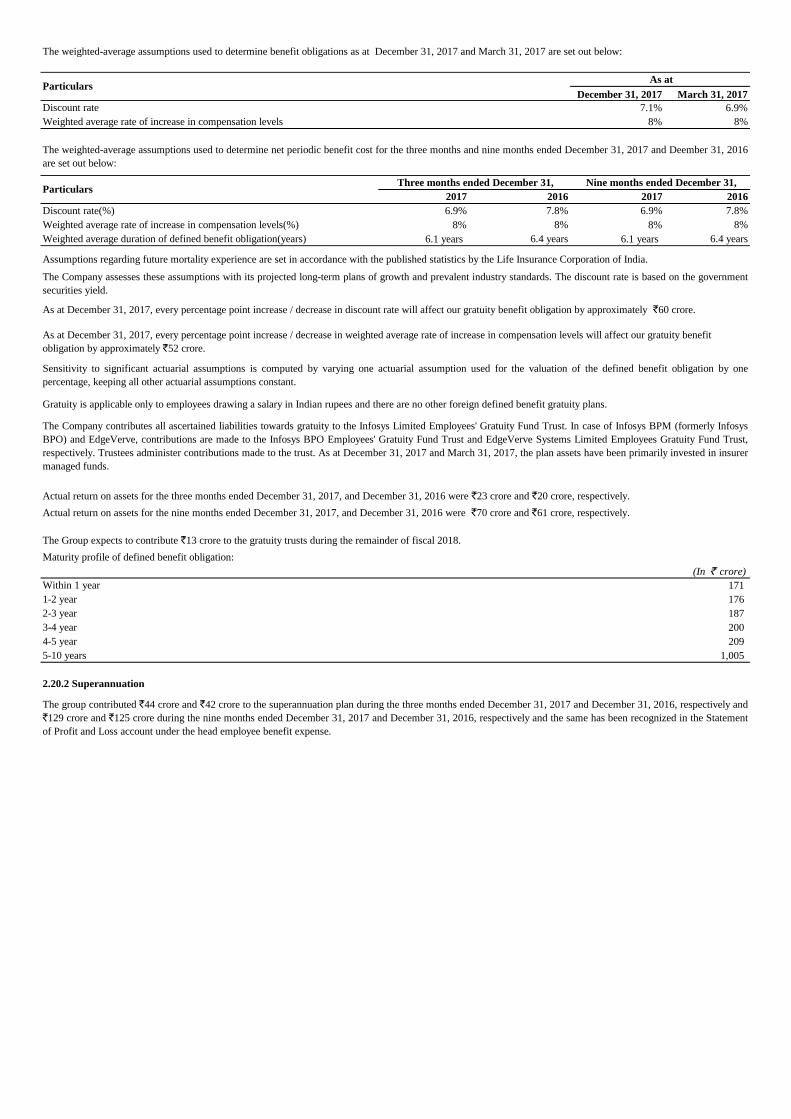
December 31, 2017 March 31, 2017
Discount rate 7.1% 6.9%
Weighted average rate of increase in compensation levels 8% 8%
2017 2016 2017 2016
Discount rate(%) 6.9% 7.8% 6.9% 7.8%
Weighted average rate of increase in compensation levels(%) 8% 8% 8% 8%
Weighted average duration of defined benefit obligation(years) 6.1 years 6.4 years 6.1 years 6.4 years
Gratuity is applicable only to employees drawing a salary in Indian rupees and there are no other foreign defined benefit gratuity plans.
(In ` crore)
Within 1 year 171
1-2 year 176
2-3 year 187
3-4 year 200
4-5 year 209
5-10 years 1,005
2.20.2 Superannuation
The group contributed `44 crore and `42 crore to the superannuation plan during the three months ended December 31, 2017 and December 31, 2016, respectively and
`129 crore and `125 crore during the nine months ended December 31, 2017 and December 31, 2016, respectively and the same has been recognized in the Statement
of Profit and Loss account under the head employee benefit expense.
Actual return on assets for the three months ended December 31, 2017, and December 31, 2016 were `23 crore and `20 crore, respectively.
Particulars Nine months ended December 31,
Assumptions regarding future mortality experience are set in accordance with the published statistics by the Life Insurance Corporation of India.
The Company contributes all ascertained liabilities towards gratuity to the Infosys Limited Employees' Gratuity Fund Trust. In case of Infosys BPM (formerly Infosys
BPO) and EdgeVerve, contributions are made to the Infosys BPO Employees' Gratuity Fund Trust and EdgeVerve Systems Limited Employees Gratuity Fund Trust,
respectively. Trustees administer contributions made to the trust. As at December 31, 2017 and March 31, 2017, the plan assets have been primarily invested in insurer
managed funds.
The Company assesses these assumptions with its projected long-term plans of growth and prevalent industry standards. The discount rate is based on the government
securities yield.
As at December 31, 2017, every percentage point increase / decrease in discount rate will affect our gratuity benefit obligation by approximately `60 crore.
As at December 31, 2017, every percentage point increase / decrease in weighted average rate of increase in compensation levels will affect our gratuity benefit
obligation by approximately `52 crore.
The Group expects to contribute `13 crore to the gratuity trusts during the remainder of fiscal 2018.
Maturity profile of defined benefit obligation:
Sensitivity to significant actuarial assumptions is computed by varying one actuarial assumption used for the valuation of the defined benefit obligation by one
percentage, keeping all other actuarial assumptions constant.
The weighted-average assumptions used to determine benefit obligations as at December 31, 2017 and March 31, 2017 are set out below:
As at
The weighted-average assumptions used to determine net periodic benefit cost for the three months and nine months ended December 31, 2017 and Deember 31, 2016
are set out below:
Three months ended December 31,
Actual return on assets for the nine months ended December 31, 2017, and December 31, 2016 were `70 crore and `61 crore, respectively.
Particulars
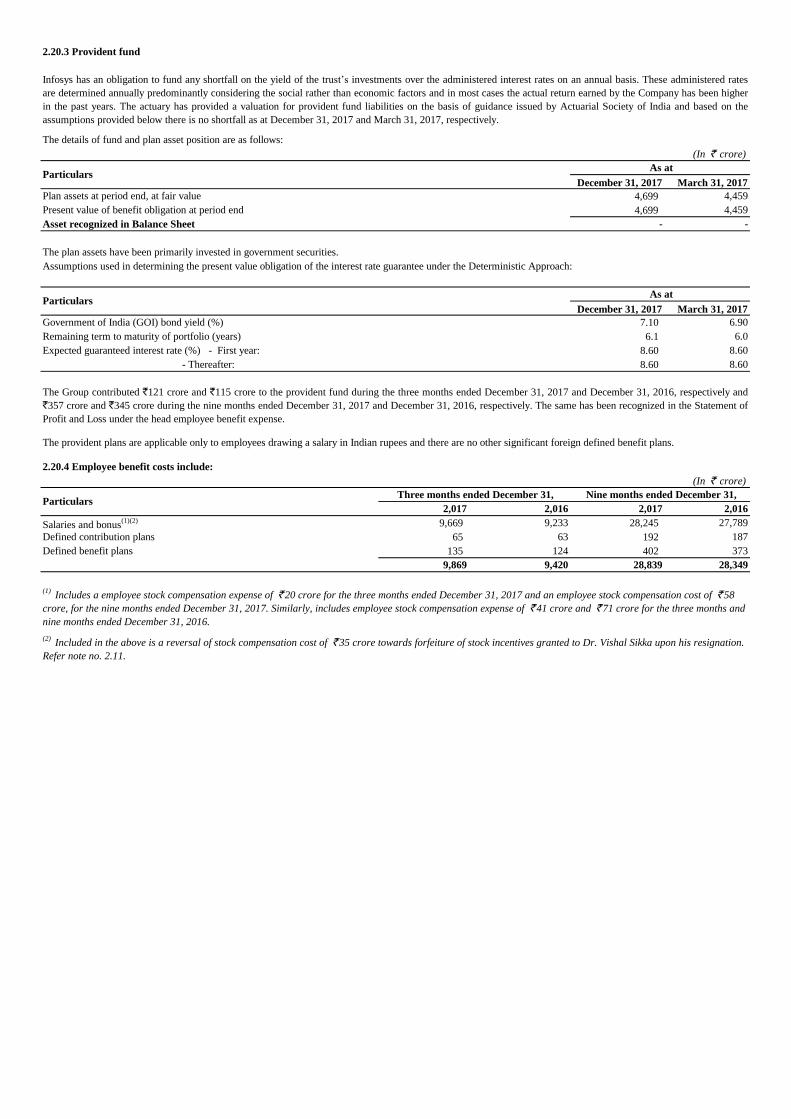
2.20.3 Provident fund
The details of fund and plan asset position are as follows:
(In ` crore)
December 31, 2017 March 31, 2017
Plan assets at period end, at fair value 4,699 4,459
Present value of benefit obligation at period end 4,699 4,459
Asset recognized in Balance Sheet - -
The plan assets have been primarily invested in government securities.
Assumptions used in determining the present value obligation of the interest rate guarantee under the Deterministic Approach:
December 31, 2017 March 31, 2017
Government of India (GOI) bond yield (%) 7.10 6.90
Remaining term to maturity of portfolio (years) 6.1 6.0
Expected guaranteed interest rate (%) - First year: 8.60 8.60
- Thereafter: 8.60 8.60
2.20.4 Employee benefit costs include:
(In ` crore)
2,017 2,016 2,017 2,016
Salaries and bonus(1)(2) 9,669 9,233 28,245 27,789
Defined contribution plans 65 63 192 187
Defined benefit plans 135 124 402 373
9,869 9,420 28,839 28,349
As at
The Group contributed `121 crore and `115 crore to the provident fund during the three months ended December 31, 2017 and December 31, 2016, respectively and
`357 crore and `345 crore during the nine months ended December 31, 2017 and December 31, 2016, respectively. The same has been recognized in the Statement of
Profit and Loss under the head employee benefit expense.
Infosys has an obligation to fund any shortfall on the yield of the trust’s investments over the administered interest rates on an annual basis. These administered rates
are determined annually predominantly considering the social rather than economic factors and in most cases the actual return earned by the Company has been higher
in the past years. The actuary has provided a valuation for provident fund liabilities on the basis of guidance issued by Actuarial Society of India and based on the
assumptions provided below there is no shortfall as at December 31, 2017 and March 31, 2017, respectively.
Particulars As at
(1) Includes a employee stock compensation expense of ` 20 crore for the three months ended December 31, 2017 and an employee stock compensation cost of ` 58
crore, for the nine months ended December 31, 2017. Similarly, includes employee stock compensation expense of ` 41 crore and ` 71 crore for the three months and
nine months ended December 31, 2016.
The provident plans are applicable only to employees drawing a salary in Indian rupees and there are no other significant foreign defined benefit plans.
Particulars
Particulars Three months ended December 31, Nine months ended December 31,
(2) Included in the above is a reversal of stock compensation cost of ` 35 crore towards forfeiture of stock incentives granted to Dr. Vishal Sikka upon his resignation.
Refer note no. 2.11.
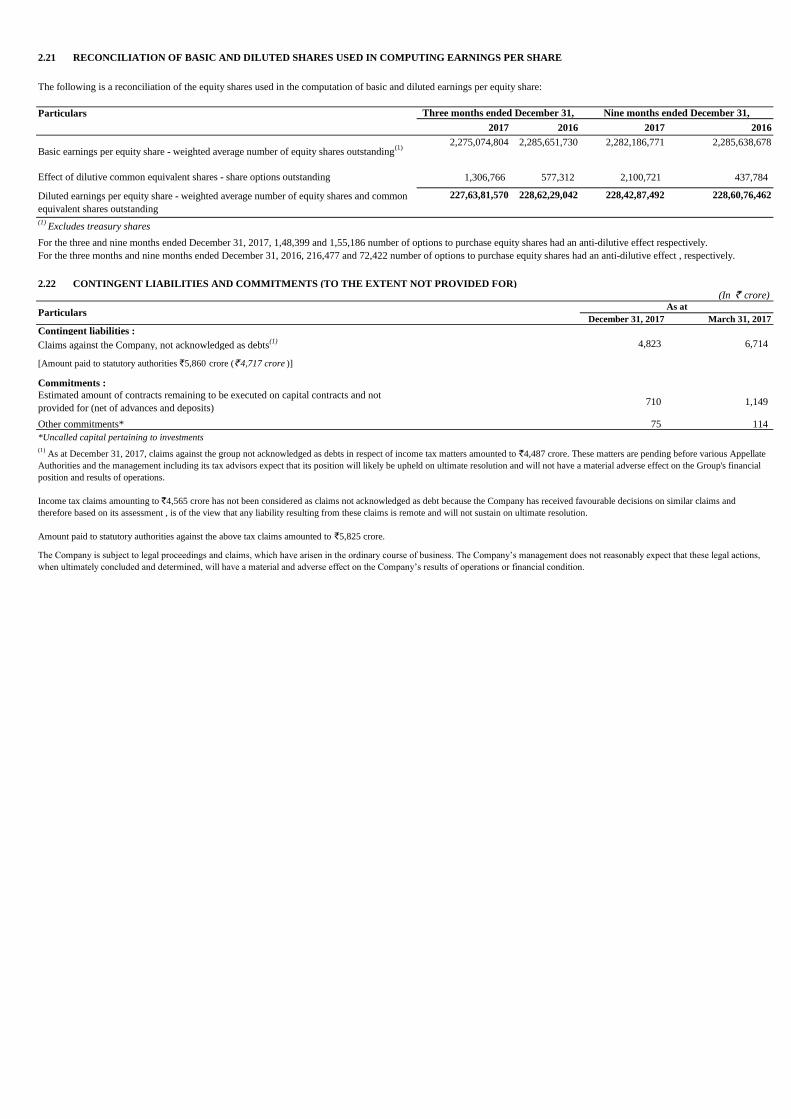
2.21 RECONCILIATION OF BASIC AND DILUTED SHARES USED IN COMPUTING EARNINGS PER SHARE
The following is a reconciliation of the equity shares used in the computation of basic and diluted earnings per equity share:
Particulars
2017 2016 2017 2016
2,275,074,804 2,285,651,730 2,282,186,771 2,285,638,678
1,306,766 577,312 2,100,721 437,784
227,63,81,570 228,62,29,042 228,42,87,492 228,60,76,462
(1)Excludes treasury shares
2.22 CONTINGENT LIABILITIES AND COMMITMENTS (TO THE EXTENT NOT PROVIDED FOR)(In ` crore)
December 31, 2017 March 31, 2017
Contingent liabilities :
Claims against the Company, not acknowledged as debts(1) 4,823 6,714
Commitments :
710 1,149
Other commitments* 75 114
Estimated amount of contracts remaining to be executed on capital contracts and not
provided for (net of advances and deposits)
(1) As at December 31, 2017, claims against the group not acknowledged as debts in respect of income tax matters amounted to `4,487 crore. These matters are pending before various Appellate
Authorities and the management including its tax advisors expect that its position will likely be upheld on ultimate resolution and will not have a material adverse effect on the Group's financial
position and results of operations.
Income tax claims amounting to `4,565 crore has not been considered as claims not acknowledged as debt because the Company has received favourable decisions on similar claims and
therefore based on its assessment , is of the view that any liability resulting from these claims is remote and will not sustain on ultimate resolution.
Amount paid to statutory authorities against the above tax claims amounted to `5,825 crore.
*Uncalled capital pertaining to investments
The Company is subject to legal proceedings and claims, which have arisen in the ordinary course of business. The Company’s management does not reasonably expect that these legal actions,
when ultimately concluded and determined, will have a material and adverse effect on the Company’s results of operations or financial condition.
[Amount paid to statutory authorities `5,860 crore (` 4,717 crore )]
Nine months ended December 31,
Particulars
For the three and nine months ended December 31, 2017, 1,48,399 and 1,55,186 number of options to purchase equity shares had an anti-dilutive effect respectively.
For the three months and nine months ended December 31, 2016, 216,477 and 72,422 number of options to purchase equity shares had an anti-dilutive effect , respectively.
As at
Diluted earnings per equity share - weighted average number of equity shares and common
equivalent shares outstanding
Effect of dilutive common equivalent shares - share options outstanding
Basic earnings per equity share - weighted average number of equity shares outstanding(1)
Three months ended December 31,
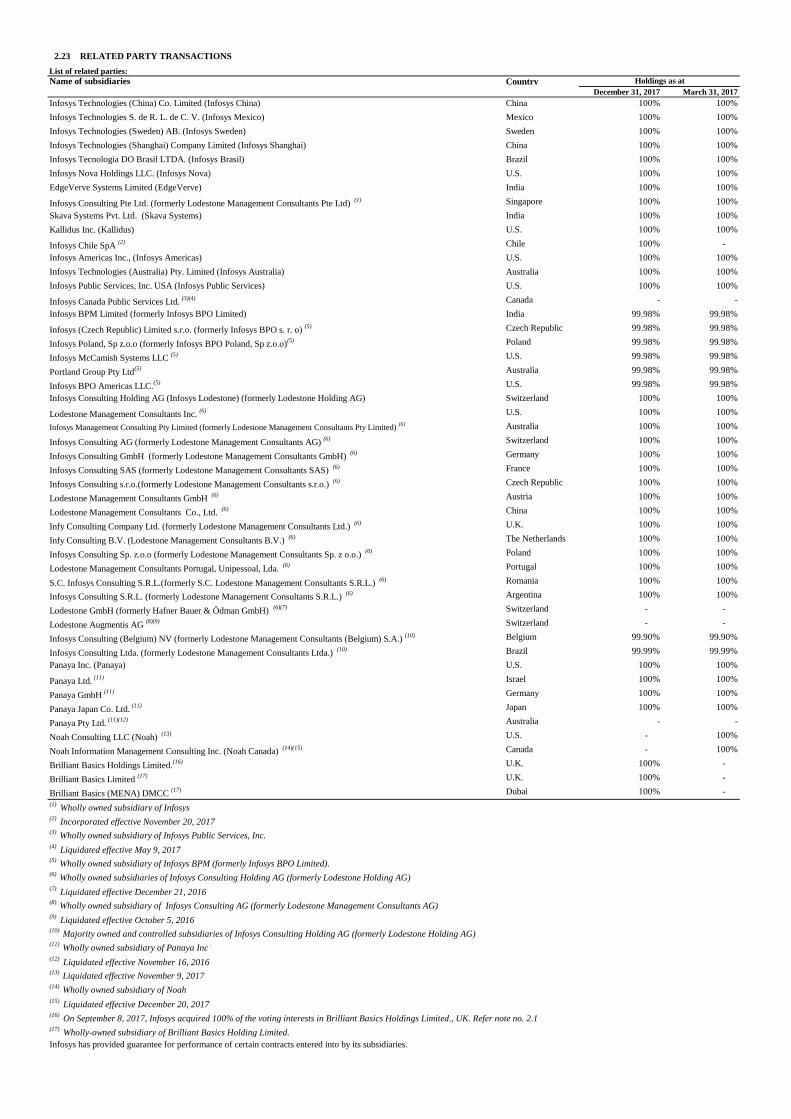
2.23 RELATED PARTY TRANSACTIONS
List of related parties:
Country
December 31, 2017 March 31, 2017
Infosys Technologies (China) Co. Limited (Infosys China) China 100% 100%
Infosys Technologies S. de R. L. de C. V. (Infosys Mexico) Mexico 100% 100%
Infosys Technologies (Sweden) AB. (Infosys Sweden) Sweden 100% 100%
Infosys Technologies (Shanghai) Company Limited (Infosys Shanghai) China 100% 100%
Infosys Tecnologia DO Brasil LTDA. (Infosys Brasil) Brazil 100% 100%
Infosys Nova Holdings LLC. (Infosys Nova) U.S. 100% 100%
EdgeVerve Systems Limited (EdgeVerve) India 100% 100%
Infosys Consulting Pte Ltd. (formerly Lodestone Management Consultants Pte Ltd) (1) Singapore 100% 100%
Skava Systems Pvt. Ltd. (Skava Systems) India 100% 100%
Kallidus Inc. (Kallidus) U.S. 100% 100%
Infosys Chile SpA (2) Chile 100% -
Infosys Americas Inc., (Infosys Americas) U.S. 100% 100%
Infosys Technologies (Australia) Pty. Limited (Infosys Australia) Australia 100% 100%
Infosys Public Services, Inc. USA (Infosys Public Services) U.S. 100% 100%
Infosys Canada Public Services Ltd.(3)(4) Canada - -
Infosys BPM Limited (formerly Infosys BPO Limited) India 99.98% 99.98%
Infosys (Czech Republic) Limited s.r.o. (formerly Infosys BPO s. r. o) (5) Czech Republic 99.98% 99.98%
Infosys Poland, Sp z.o.o (formerly Infosys BPO Poland, Sp z.o.o)(5) Poland 99.98% 99.98%
Infosys McCamish Systems LLC (5) U.S. 99.98% 99.98%
Portland Group Pty Ltd(5) Australia 99.98% 99.98%
Infosys BPO Americas LLC.(5) U.S. 99.98% 99.98%
Infosys Consulting Holding AG (Infosys Lodestone) (formerly Lodestone Holding AG) Switzerland 100% 100%
Lodestone Management Consultants Inc. (6) U.S. 100% 100%
Australia 100% 100%
Infosys Consulting AG (formerly Lodestone Management Consultants AG) (6) Switzerland 100% 100%
Infosys Consulting GmbH (formerly Lodestone Management Consultants GmbH) (6) Germany 100% 100%
Infosys Consulting SAS (formerly Lodestone Management Consultants SAS) (6) France 100% 100%
Infosys Consulting s.r.o.(formerly Lodestone Management Consultants s.r.o.) (6) Czech Republic 100% 100%
Lodestone Management Consultants GmbH (6) Austria 100% 100%
Lodestone Management Consultants Co., Ltd. (6) China 100% 100%
Infy Consulting Company Ltd. (formerly Lodestone Management Consultants Ltd.) (6) U.K. 100% 100%
Infy Consulting B.V. (Lodestone Management Consultants B.V.) (6) The Netherlands 100% 100%
Infosys Consulting Sp. z.o.o (formerly Lodestone Management Consultants Sp. z o.o.) (6) Poland 100% 100%
Lodestone Management Consultants Portugal, Unipessoal, Lda. (6) Portugal 100% 100%
S.C. Infosys Consulting S.R.L.(formerly S.C. Lodestone Management Consultants S.R.L.) (6) Romania 100% 100%
Infosys Consulting S.R.L. (formerly Lodestone Management Consultants S.R.L.) (6) Argentina 100% 100%
Lodestone GmbH (formerly Hafner Bauer & Ödman GmbH) (6)(7) Switzerland - -
Lodestone Augmentis AG (8)(9) Switzerland - -
Infosys Consulting (Belgium) NV (formerly Lodestone Management Consultants (Belgium) S.A.) (10) Belgium 99.90% 99.90%
Infosys Consulting Ltda. (formerly Lodestone Management Consultants Ltda.) (10) Brazil 99.99% 99.99%
Panaya Inc. (Panaya) U.S. 100% 100%
Panaya Ltd.(11) Israel 100% 100%
Panaya GmbH (11) Germany 100% 100%
Panaya Japan Co. Ltd.(11) Japan 100% 100%
Panaya Pty Ltd.(11)(12) Australia - -
Noah Consulting LLC (Noah) (13) U.S. - 100%
Noah Information Management Consulting Inc. (Noah Canada) (14)(15) Canada - 100%
Brilliant Basics Holdings Limited.(16) U.K. 100% -
Brilliant Basics Limited (17) U.K. 100% -
Brilliant Basics (MENA) DMCC (17) Dubai 100% -
(1) Wholly owned subsidiary of Infosys
(2) Incorporated effective November 20, 2017
(4) Liquidated effective May 9, 2017
(7) Liquidated effective December 21, 2016
(9) Liquidated effective October 5, 2016
(12) Liquidated effective November 16, 2016
(15) Liquidated effective December 20, 2017
(16) On September 8, 2017, Infosys acquired 100% of the voting interests in Brilliant Basics Holdings Limited., UK. Refer note no. 2.1
(17) Wholly-owned subsidiary of Brilliant Basics Holding Limited.
Name of subsidiaries Holdings as at
(5) Wholly owned subsidiary of Infosys BPM (formerly Infosys BPO Limited).
Infosys Management Consulting Pty Limited (formerly Lodestone Management Consultants Pty Limited) (6)
(13) Liquidated effective November 9, 2017
(14) Wholly owned subsidiary of Noah
Infosys has provided guarantee for performance of certain contracts entered into by its subsidiaries.
(6) Wholly owned subsidiaries of Infosys Consulting Holding AG (formerly Lodestone Holding AG)
(3) Wholly owned subsidiary of Infosys Public Services, Inc.
(11) Wholly owned subsidiary of Panaya Inc
.
(10) Majority owned and controlled subsidiaries of Infosys Consulting Holding AG (formerly Lodestone Holding AG)
(8) Wholly owned subsidiary of Infosys Consulting AG (formerly Lodestone Management Consultants AG)
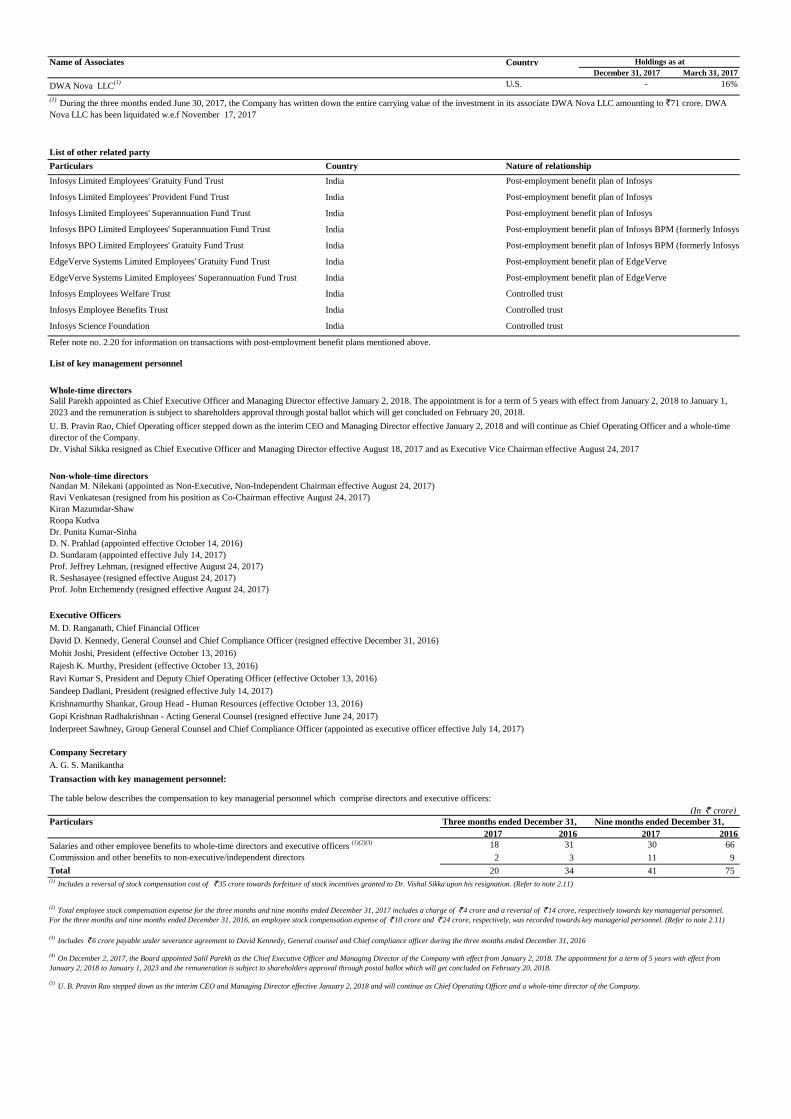
Country
December 31, 2017 March 31, 2017
DWA Nova LLC(1) U.S. - 16%
Particulars Country
Infosys Limited Employees' Gratuity Fund Trust India Post-employment benefit plan of Infosys
Infosys Limited Employees' Provident Fund Trust India Post-employment benefit plan of Infosys
Infosys Limited Employees' Superannuation Fund Trust India Post-employment benefit plan of Infosys
Infosys BPO Limited Employees' Superannuation Fund Trust India Post-employment benefit plan of Infosys BPM (formerly Infosys BPO)
Infosys BPO Limited Employees' Gratuity Fund Trust India Post-employment benefit plan of Infosys BPM (formerly Infosys BPO)
EdgeVerve Systems Limited Employees' Gratuity Fund Trust India Post-employment benefit plan of EdgeVerve
India Post-employment benefit plan of EdgeVerve
Infosys Employees Welfare Trust India Controlled trust
Infosys Employee Benefits Trust India Controlled trust
Infosys Science Foundation India Controlled trust
List of key management personnel
Whole-time directors
Dr. Vishal Sikka resigned as Chief Executive Officer and Managing Director effective August 18, 2017 and as Executive Vice Chairman effective August 24, 2017
Non-whole-time directorsNandan M. Nilekani (appointed as Non-Executive, Non-Independent Chairman effective August 24, 2017)
Ravi Venkatesan (resigned from his position as Co-Chairman effective August 24, 2017)
Kiran Mazumdar-Shaw
Roopa Kudva
Dr. Punita Kumar-Sinha
D. N. Prahlad (appointed effective October 14, 2016)
D. Sundaram (appointed effective July 14, 2017)
Prof. Jeffrey Lehman, (resigned effective August 24, 2017)
R. Seshasayee (resigned effective August 24, 2017)
Prof. John Etchemendy (resigned effective August 24, 2017)
Executive Officers
M. D. Ranganath, Chief Financial Officer
David D. Kennedy, General Counsel and Chief Compliance Officer (resigned effective December 31, 2016)
Mohit Joshi, President (effective October 13, 2016)
Rajesh K. Murthy, President (effective October 13, 2016)
Ravi Kumar S, President and Deputy Chief Operating Officer (effective October 13, 2016)
Sandeep Dadlani, President (resigned effective July 14, 2017)
Krishnamurthy Shankar, Group Head - Human Resources (effective October 13, 2016)
Gopi Krishnan Radhakrishnan - Acting General Counsel (resigned effective June 24, 2017)
Inderpreet Sawhney, Group General Counsel and Chief Compliance Officer (appointed as executive officer effective July 14, 2017)
Company Secretary
A. G. S. Manikantha
Transaction with key management personnel:
The table below describes the compensation to key managerial personnel which comprise directors and executive officers:
(In ` crore)
Particulars
2017 2016 2017 2016
Salaries and other employee benefits to whole-time directors and executive officers (1)(2)(3) 18 31 30 66
2 3 11 9
Total 20 34 41 75
Name of Associates Holdings as at
(1) During the three months ended June 30, 2017, the Company has written down the entire carrying value of the investment in its associate DWA Nova LLC amounting to `71 crore. DWA
Nova LLC has been liquidated w.e.f November 17, 2017
(4) On December 2, 2017, the Board appointed Salil Parekh as the Chief Executive Officer and Managing Director of the Company with effect from January 2, 2018. The appointment for a term of 5 years with effect from
January 2, 2018 to January 1, 2023 and the remuneration is subject to shareholders approval through postal ballot which will get concluded on February 20, 2018.
(5) U. B. Pravin Rao stepped down as the interim CEO and Managing Director effective January 2, 2018 and will continue as Chief Operating Officer and a whole-time director of the Company.
List of other related party
Nature of relationship
(3) Includes ` 6 crore payable under severance agreement to David Kennedy, General counsel and Chief compliance officer during the three months ended December 31, 2016
EdgeVerve Systems Limited Employees' Superannuation Fund Trust
Commission and other benefits to non-executive/independent directors
Nine months ended December 31,
(1) Includes a reversal of stock compensation cost of ` 35 crore towards forfeiture of stock incentives granted to Dr. Vishal Sikka upon his resignation. (Refer to note 2.11)
Refer note no. 2.20 for information on transactions with post-employment benefit plans mentioned above.
Three months ended December 31,
U. B. Pravin Rao, Chief Operating officer stepped down as the interim CEO and Managing Director effective January 2, 2018 and will continue as Chief Operating Officer and a whole-time
director of the Company.
Salil Parekh appointed as Chief Executive Officer and Managing Director effective January 2, 2018. The appointment is for a term of 5 years with effect from January 2, 2018 to January 1,
2023 and the remuneration is subject to shareholders approval through postal ballot which will get concluded on February 20, 2018.
(2) Total employee stock compensation expense for the three months and nine months ended December 31, 2017 includes a charge of ` 4 crore and a reversal of ` 14 crore, respectively towards key managerial personnel.
For the three months and nine months ended December 31, 2016, an employee stock compensation expense of ` 10 crore and ` 24 crore, respectively, was recorded towards key managerial personnel. (Refer to note 2.11)
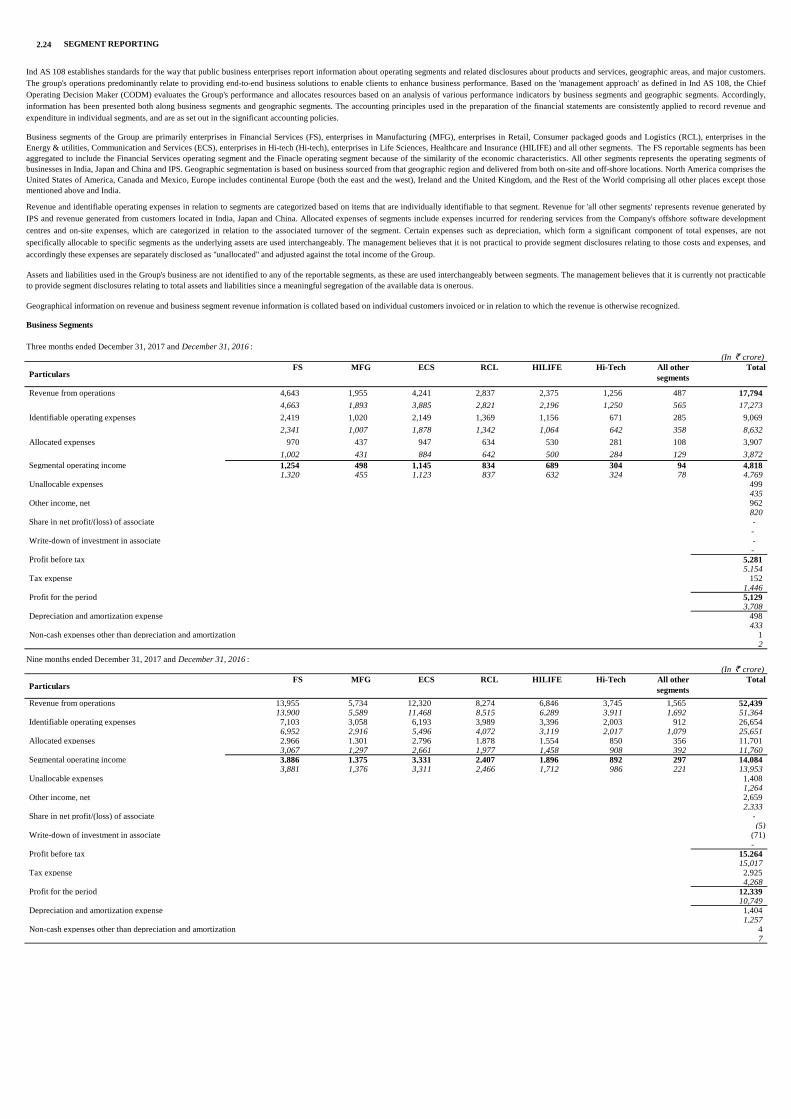
2.24
Business Segments
(In ` crore)
ParticularsFS MFG ECS RCL HILIFE Hi-Tech All other
segments
Total
Revenue from operations 4,643 1,955 4,241 2,837 2,375 1,256 487 17,794
4,663 1,893 3,885 2,821 2,196 1,250 565 17,273
Identifiable operating expenses 2,419 1,020 2,149 1,369 1,156 671 285 9,069
2,341 1,007 1,878 1,342 1,064 642 358 8,632
Allocated expenses 970 437 947 634 530 281 108 3,907
1,002 431 884 642 500 284 129 3,872
Segmental operating income 1,254 498 1,145 834 689 304 94 4,818 1,320 455 1,123 837 632 324 78 4,769
Unallocable expenses 499 435
Other income, net 962 820
Share in net profit/(loss) of associate -
- Write-down of investment in associate -
- Profit before tax 5,281
5,154 Tax expense 152
1,446 Profit for the period 5,129
3,708 Depreciation and amortization expense 498
433 Non-cash expenses other than depreciation and amortization 1
2
(In ` crore)
ParticularsFS MFG ECS RCL HILIFE Hi-Tech All other
segments
Total
Revenue from operations 13,955 5,734 12,320 8,274 6,846 3,745 1,565 52,439 13,900 5,589 11,468 8,515 6,289 3,911 1,692 51,364
Identifiable operating expenses 7,103 3,058 6,193 3,989 3,396 2,003 912 26,654 6,952 2,916 5,496 4,072 3,119 2,017 1,079 25,651
Allocated expenses 2,966 1,301 2,796 1,878 1,554 850 356 11,701 3,067 1,297 2,661 1,977 1,458 908 392 11,760
Segmental operating income 3,886 1,375 3,331 2,407 1,896 892 297 14,084 3,881 1,376 3,311 2,466 1,712 986 221 13,953
Unallocable expenses 1,408 1,264
Other income, net 2,659 2,333
Share in net profit/(loss) of associate -
(5) Write-down of investment in associate (71)
- Profit before tax 15,264
15,017 Tax expense 2,925
4,268 Profit for the period 12,339
10,749 Depreciation and amortization expense 1,404
1,257 Non-cash expenses other than depreciation and amortization 4
7
SEGMENT REPORTING
Ind AS 108 establishes standards for the way that public business enterprises report information about operating segments and related disclosures about products and services, geographic areas, and major customers.
The group's operations predominantly relate to providing end-to-end business solutions to enable clients to enhance business performance. Based on the 'management approach' as defined in Ind AS 108, the Chief
Operating Decision Maker (CODM) evaluates the Group's performance and allocates resources based on an analysis of various performance indicators by business segments and geographic segments. Accordingly,
information has been presented both along business segments and geographic segments. The accounting principles used in the preparation of the financial statements are consistently applied to record revenue and
expenditure in individual segments, and are as set out in the significant accounting policies.
Revenue and identifiable operating expenses in relation to segments are categorized based on items that are individually identifiable to that segment. Revenue for 'all other segments' represents revenue generated by
IPS and revenue generated from customers located in India, Japan and China. Allocated expenses of segments include expenses incurred for rendering services from the Company's offshore software development
centres and on-site expenses, which are categorized in relation to the associated turnover of the segment. Certain expenses such as depreciation, which form a significant component of total expenses, are not
specifically allocable to specific segments as the underlying assets are used interchangeably. The management believes that it is not practical to provide segment disclosures relating to those costs and expenses, and
accordingly these expenses are separately disclosed as "unallocated" and adjusted against the total income of the Group.
Assets and liabilities used in the Group's business are not identified to any of the reportable segments, as these are used interchangeably between segments. The management believes that it is currently not practicable
to provide segment disclosures relating to total assets and liabilities since a meaningful segregation of the available data is onerous.
Three months ended December 31, 2017 and December 31, 2016 :
Business segments of the Group are primarily enterprises in Financial Services (FS), enterprises in Manufacturing (MFG), enterprises in Retail, Consumer packaged goods and Logistics (RCL), enterprises in the
Energy & utilities, Communication and Services (ECS), enterprises in Hi-tech (Hi-tech), enterprises in Life Sciences, Healthcare and Insurance (HILIFE) and all other segments. The FS reportable segments has been
aggregated to include the Financial Services operating segment and the Finacle operating segment because of the similarity of the economic characteristics. All other segments represents the operating segments of
businesses in India, Japan and China and IPS. Geographic segmentation is based on business sourced from that geographic region and delivered from both on-site and off-shore locations. North America comprises the
United States of America, Canada and Mexico, Europe includes continental Europe (both the east and the west), Ireland and the United Kingdom, and the Rest of the World comprising all other places except those
mentioned above and India.
Geographical information on revenue and business segment revenue information is collated based on individual customers invoiced or in relation to which the revenue is otherwise recognized.
Nine months ended December 31, 2017 and December 31, 2016 :
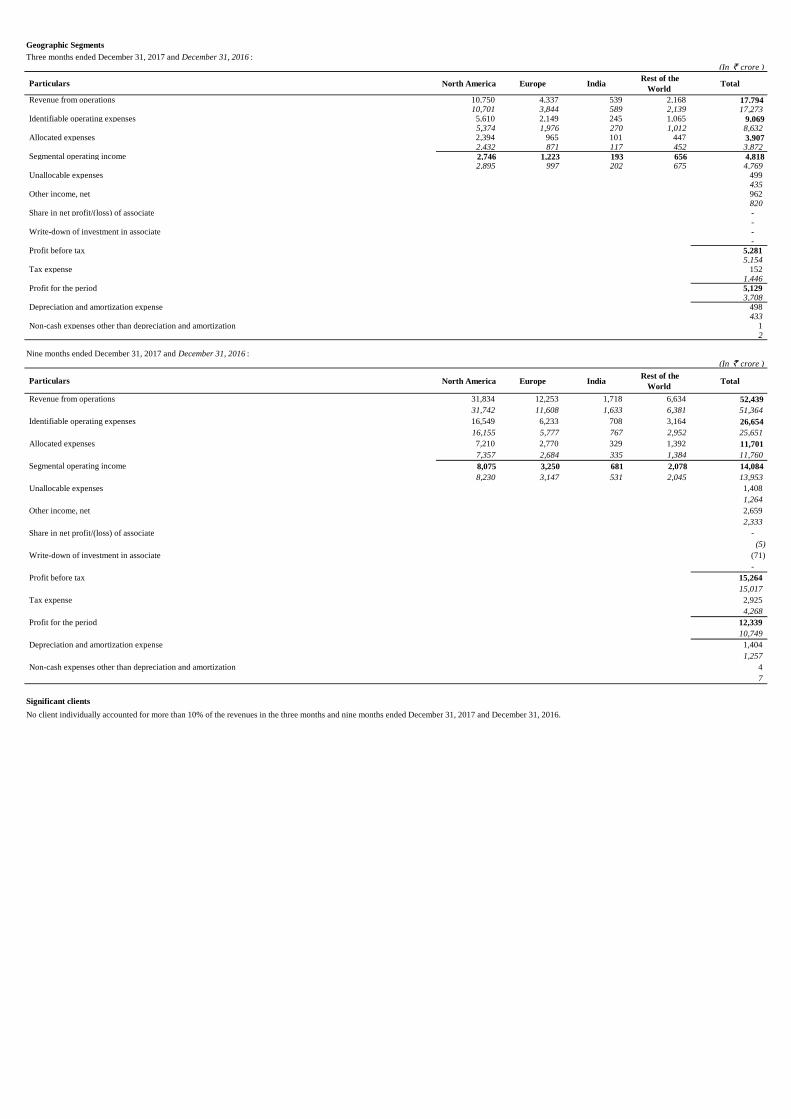
Geographic Segments
(In ` crore )
Particulars North America Europe India Rest of the
World Total
Revenue from operations 10,750 4,337 539 2,168 17,794 10,701 3,844 589 2,139 17,273
Identifiable operating expenses 5,610 2,149 245 1,065 9,069 5,374 1,976 270 1,012 8,632
Allocated expenses 2,394 965 101 447 3,907 2,432 871 117 452 3,872
Segmental operating income 2,746 1,223 193 656 4,818 2,895 997 202 675 4,769
Unallocable expenses 499 435
Other income, net 962 820
Share in net profit/(loss) of associate - -
Write-down of investment in associate - -
Profit before tax 5,281 5,154
Tax expense 152 1,446
Profit for the period 5,129 3,708
Depreciation and amortization expense 498 433
Non-cash expenses other than depreciation and amortization 1 2
(In ` crore )
Particulars North America Europe India Rest of the
World Total
Revenue from operations 31,834 12,253 1,718 6,634 52,439
31,742 11,608 1,633 6,381 51,364
Identifiable operating expenses 16,549 6,233 708 3,164 26,654
16,155 5,777 767 2,952 25,651
Allocated expenses 7,210 2,770 329 1,392 11,701
7,357 2,684 335 1,384 11,760
Segmental operating income 8,075 3,250 681 2,078 14,084
8,230 3,147 531 2,045 13,953
Unallocable expenses 1,408
1,264
Other income, net 2,659
2,333
Share in net profit/(loss) of associate -
(5)
Write-down of investment in associate (71)
-
Profit before tax 15,264
15,017
Tax expense 2,925
4,268
Profit for the period 12,339
10,749
Depreciation and amortization expense 1,404
1,257
Non-cash expenses other than depreciation and amortization 4
7
Significant clients
No client individually accounted for more than 10% of the revenues in the three months and nine months ended December 31, 2017 and December 31, 2016.
Nine months ended December 31, 2017 and December 31, 2016 :
Three months ended December 31, 2017 and December 31, 2016 :
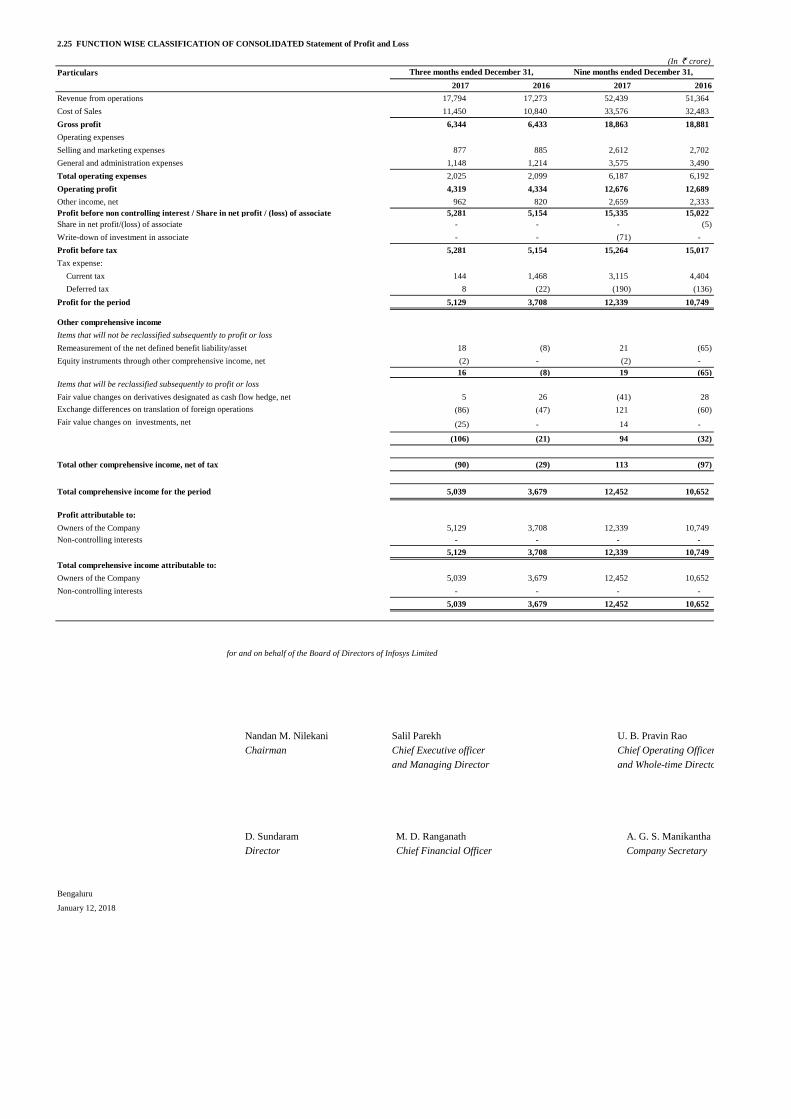
2.25 FUNCTION WISE CLASSIFICATION OF CONSOLIDATED Statement of Profit and Loss
(In ` crore)
Particulars
2017 2016 2017 2016
Revenue from operations 17,794 17,273 52,439 51,364
Cost of Sales 11,450 10,840 33,576 32,483
Gross profit 6,344 6,433 18,863 18,881
Operating expenses
Selling and marketing expenses 877 885 2,612 2,702
General and administration expenses 1,148 1,214 3,575 3,490
Total operating expenses 2,025 2,099 6,187 6,192
Operating profit 4,319 4,334 12,676 12,689
Other income, net 962 820 2,659 2,333
Profit before non controlling interest / Share in net profit / (loss) of associate 5,281 5,154 15,335 15,022
Share in net profit/(loss) of associate - - - (5)
Write-down of investment in associate - - (71) -
Profit before tax 5,281 5,154 15,264 15,017
Tax expense:
Current tax 144 1,468 3,115 4,404
Deferred tax 8 (22) (190) (136)
Profit for the period 5,129 3,708 12,339 10,749
Other comprehensive income
Items that will not be reclassified subsequently to profit or loss
Remeasurement of the net defined benefit liability/asset 18 (8) 21 (65)
Equity instruments through other comprehensive income, net (2) - (2) -
16 (8) 19 (65)
Items that will be reclassified subsequently to profit or loss
Fair value changes on derivatives designated as cash flow hedge, net 5 26 (41) 28
Exchange differences on translation of foreign operations (86) (47) 121 (60)
Fair value changes on investments, net (25) - 14 -
(106) (21) 94 (32)
Total other comprehensive income, net of tax (90) (29) 113 (97)
Total comprehensive income for the period 5,039 3,679 12,452 10,652
Profit attributable to:
Owners of the Company 5,129 3,708 12,339 10,749
Non-controlling interests - - - -
5,129 3,708 12,339 10,749
Total comprehensive income attributable to:
Owners of the Company 5,039 3,679 12,452 10,652
Non-controlling interests - - - -
5,039 3,679 12,452 10,652
for and on behalf of the Board of Directors of Infosys Limited
Nandan M. Nilekani Salil Parekh U. B. Pravin Rao
Chairman Chief Executive officer Chief Operating Officer
and Managing Director and Whole-time Director
D. Sundaram M. D. Ranganath A. G. S. Manikantha
Director Chief Financial Officer Company Secretary
Bengaluru
January 12, 2018
Three months ended December 31, Nine months ended December 31,