Embed Size (px)
Citation preview
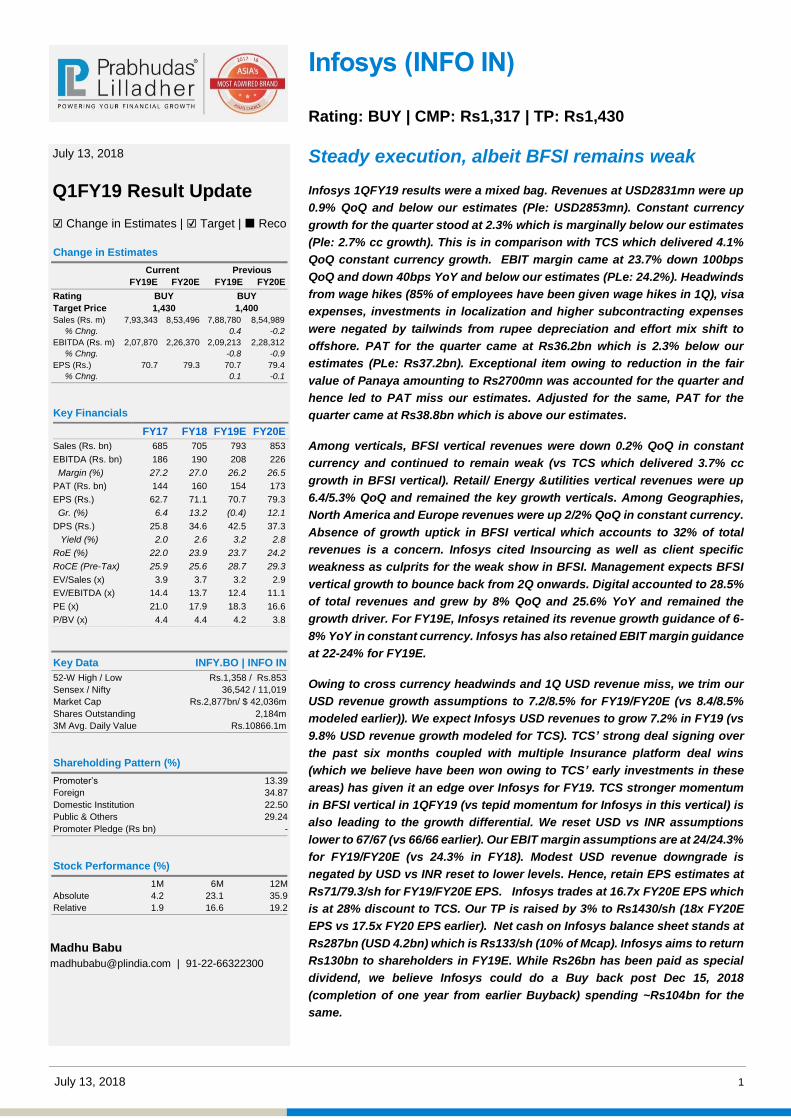
July 13, 2018 1
Rating: BUY | CMP: Rs1,317 | TP: Rs1,430
Steady execution, albeit BFSI remains weak
Infosys 1QFY19 results were a mixed bag. Revenues at USD2831mn were up
0.9% QoQ and below our estimates (Ple: USD2853mn). Constant currency
growth for the quarter stood at 2.3% which is marginally below our estimates
(Ple: 2.7% cc growth). This is in comparison with TCS which delivered 4.1%
QoQ constant currency growth. EBIT margin came at 23.7% down 100bps
QoQ and down 40bps YoY and below our estimates (PLe: 24.2%). Headwinds
from wage hikes (85% of employees have been given wage hikes in 1Q), visa
expenses, investments in localization and higher subcontracting expenses
were negated by tailwinds from rupee depreciation and effort mix shift to
offshore. PAT for the quarter came at Rs36.2bn which is 2.3% below our
estimates (PLe: Rs37.2bn). Exceptional item owing to reduction in the fair
value of Panaya amounting to Rs2700mn was accounted for the quarter and
hence led to PAT miss our estimates. Adjusted for the same, PAT for the
quarter came at Rs38.8bn which is above our estimates.
Among verticals, BFSI vertical revenues were down 0.2% QoQ in constant
currency and continued to remain weak (vs TCS which delivered 3.7% cc
growth in BFSI vertical). Retail/ Energy &utilities vertical revenues were up
6.4/5.3% QoQ and remained the key growth verticals. Among Geographies,
North America and Europe revenues were up 2/2% QoQ in constant currency.
Absence of growth uptick in BFSI vertical which accounts to 32% of total
revenues is a concern. Infosys cited Insourcing as well as client specific
weakness as culprits for the weak show in BFSI. Management expects BFSI
vertical growth to bounce back from 2Q onwards. Digital accounted to 28.5%
of total revenues and grew by 8% QoQ and 25.6% YoY and remained the
growth driver. For FY19E, Infosys retained its revenue growth guidance of 6-
8% YoY in constant currency. Infosys has also retained EBIT margin guidance
at 22-24% for FY19E.
Owing to cross currency headwinds and 1Q USD revenue miss, we trim our
USD revenue growth assumptions to 7.2/8.5% for FY19/FY20E (vs 8.4/8.5%
modeled earlier)). We expect Infosys USD revenues to grow 7.2% in FY19 (vs
9.8% USD revenue growth modeled for TCS). TCS’ strong deal signing over
the past six months coupled with multiple Insurance platform deal wins
(which we believe have been won owing to TCS’ early investments in these
areas) has given it an edge over Infosys for FY19. TCS stronger momentum
in BFSI vertical in 1QFY19 (vs tepid momentum for Infosys in this vertical) is
also leading to the growth differential. We reset USD vs INR assumptions
lower to 67/67 (vs 66/66 earlier). Our EBIT margin assumptions are at 24/24.3%
for FY19/FY20E (vs 24.3% in FY18). Modest USD revenue downgrade is
negated by USD vs INR reset to lower levels. Hence, retain EPS estimates at
Rs71/79.3/sh for FY19/FY20E EPS. Infosys trades at 16.7x FY20E EPS which
is at 28% discount to TCS. Our TP is raised by 3% to Rs1430/sh (18x FY20E
EPS vs 17.5x FY20 EPS earlier). Net cash on Infosys balance sheet stands at
Rs287bn (USD 4.2bn) which is Rs133/sh (10% of Mcap). Infosys aims to return
Rs130bn to shareholders in FY19E. While Rs26bn has been paid as special
dividend, we believe Infosys could do a Buy back post Dec 15, 2018
(completion of one year from earlier Buyback) spending ~Rs104bn for the
same.
Infosys (INFO IN)
July 13, 2018
Q1FY19 Result Update
☑ Change in Estimates | ☑ Target | Reco
Change in Estimates
Current Previous
FY19E FY20E FY19E FY20E
Rating BUY BUY
Target Price 1,430 1,400
Sales (Rs. m) 7,93,343 8,53,496 7,88,780 8,54,989
% Chng. 0.4 -0.2
EBITDA (Rs. m) 2,07,870 2,26,370 2,09,213 2,28,312
% Chng. -0.8 -0.9
EPS (Rs.) 70.7 79.3 70.7 79.4
% Chng. 0.1 -0.1
Key Financials
FY17 FY18 FY19E FY20E
Sales (Rs. bn) 685 705 793 853
EBITDA (Rs. bn) 186 190 208 226
Margin (%) 27.2 27.0 26.2 26.5
PAT (Rs. bn) 144 160 154 173
EPS (Rs.) 62.7 71.1 70.7 79.3
Gr. (%) 6.4 13.2 (0.4) 12.1
DPS (Rs.) 25.8 34.6 42.5 37.3
Yield (%) 2.0 2.6 3.2 2.8
RoE (%) 22.0 23.9 23.7 24.2
RoCE (Pre-Tax) 25.9 25.6 28.7 29.3
EV/Sales (x) 3.9 3.7 3.2 2.9
EV/EBITDA (x) 14.4 13.7 12.4 11.1
PE (x) 21.0 17.9 18.3 16.6
P/BV (x) 4.4 4.4 4.2 3.8
Key Data INFY.BO | INFO IN
52-W High / Low Rs.1,358 / Rs.853
Sensex / Nifty 36,542 / 11,019
Market Cap Rs.2,877bn/ $ 42,036m
Shares Outstanding 2,184m
3M Avg. Daily Value Rs.10866.1m
Shareholding Pattern (%)
Promoter’s 13.39
Foreign 34.87
Domestic Institution 22.50
Public & Others 29.24
Promoter Pledge (Rs bn) -
Stock Performance (%)
1M 6M 12M
Absolute 4.2 23.1 35.9
Relative 1.9 16.6 19.2
Madhu Babu
[email protected] | 91-22-66322300

Infosys
July 13, 2018 2
Q1FY19: Revenues remain tepid while margins beat
Rs mn Q1FY19 Q4FY18 QoQ Q3FY18 YoY Q1FY19(PLe) Var (PL VS
ACTUAL)
Total Operating Income (US$) 2,831 2,805 0.9% 2,569 10.2% 2,853 -0.8%
Total Operating Income 191,280 180,830 5.8% 171,200 11.7% 192,842 -0.8%
EBIT 45,370 44,720 1.5% 42,120 7.7% 46,571 -2.6%
EBIT Margin 23.7% 24.7% -101 bps 24.6% -88 bps 24.2% -43 bps
Pre Tax Income 52,630 50,060 5.1% 49,580 6.2% 52,071 1.1%
Tax 13,810 13,160 13,300 14,840
Tax Rate 26.2% 26.3% 26.8% 28.5%
RPAT 36,120 36,900 -2.1% 36,030 0.2% 37,231 -3.0%
APAT 38,820 36,900 5.2% 35,540 9.2% 37,231 4.3%
AEPS (Rs) 16.6 17.0 -2.2% 15.2 8.9% 17.1 -3.0%
Source: Company, PL
Revenues below estimates: Revenues stood at US$2831m for Q1FY19, up
0.9% QoQ and below our estimates (US$2853m). Revenue growth was 2.3%
QoQ in constant currency and marginally below our expectations (PLe: 2.7%
cc growth). Blend pricing remain unchanged in cc (Onsite up 1.1% QoQ and
offshore down 1.2% QoQ in constant currency).
Infosys Constant Currency QoQ Growth (%)
Source: Company, PL
Infosys Constant Currency YoY growth (%)
Source: Company, PL
3.4%
4.2%
1.2%
-0.4%
1.5%
3.9%
2.6%
-0.4%
4.4%
6.9%
0.6%
1.9%1.7%
3.9%
-0.3%
0.0%
2.7%2.2%
0.80%0.60%
2.30%
-1.0%
0.0%
1.0%
2.0%
3.0%
4.0%
5.0%
6.0%
7.0%
8.0%
1Q
FY
14
2Q
FY
14
3Q
FY
14
4Q
FY
14
1Q
FY
15
2Q
FY
15
3Q
FY
15
4Q
FY
15
1Q
FY
16
2Q
FY
16
3Q
FY
16
4Q
FY
16
1Q
FY
17
2Q
FY
17
3Q
FY
17
4Q
FY
17
1Q
FY
18
2Q
FY
18
3Q
FY
18
4Q
FY
18
1Q
FY
19
6.6%6.3%
7.9%7.8%
10.9%
14.2%
12.5%
15.0%
12.1%
8.9%
7.3%
5.3%6.3%
4.6%
5.8%6.4%6.0%
2.0%
4.0%
6.0%
8.0%
10.0%
12.0%
14.0%
16.0%
1Q
FY
15
2Q
FY
15
3Q
FY
15
4Q
FY
15
1Q
FY
16
2Q
FY
16
3Q
FY
16
4Q
FY
16
1Q
FY
17
2Q
FY
17
3Q
FY
17
4Q
FY
17
1Q
FY
18
2Q
FY
18
3Q
FY
18
4Q
FY
18
1Q
FY
19
CC revenue growth was 2.3% for the
quarter. BFS and Retail continued to
show tepid performance. Developed
markets (North America and Europe)
remained strong for the quarter

Infosys
July 13, 2018 3
Margins below estimates: EBIT margin came in at 23.7% down 100bps QoQ
and down 40bps YoY and marginally below our estimates (PLe: 24.2%).
Headwinds from wage hikes, higher subcontracting expenses (6.7% of
revenues for 1QFY19 vs 6.1% of revenues as on 4QFY18), investments in
local hiring were negated by tailwinds from INR depreciation.
EBIT Margin Vs Average Exchange Rate
Source: Company, PL
Company has shown a steady reduction in effort from onsite over the past three
quarters. This has been acting as tailwind for margins.
Effort Mix from Onsite and EBIT Margin (%)
Source: Company, PL
25.1
%
26.1
% 26.8
%
25.7
%
24.0
%
25.5
%
24.9
% 25.5
%
24.1
% 24.9
%
25.1
%
24.6
%
24.1
%
24.2
%
24.3
%
24.7
%
23.7
%
54
56
58
60
62
64
66
68
70
23.0%
23.5%
24.0%
24.5%
25.0%
25.5%
26.0%
26.5%
27.0%
1Q
FY
15
2Q
FY
15
3Q
FY
15
4Q
FY
15
1Q
FY
16
2Q
FY
16
3Q
FY
16
4Q
FY
16
1Q
FY
17
2Q
FY
17
3Q
FY
17
4Q
FY
17
1Q
FY
18
2Q
FY
18
3Q
FY
18
4Q
FY
18
1Q
FY
19
EBIT margin Average Exchange Rate
25.1
% 26.1
% 26.8
%
25.7
%
24.0
%
25.5
%
24.9
% 25.5
%
24.1
% 24.9
%
25.1
%
24.6
%
24.1
%
24.2
%
24.3
%
24.7
%
23.7
%
27.5%
28.0%
28.5%
29.0%
29.5%
30.0%
30.5%
22.0%
22.5%
23.0%
23.5%
24.0%
24.5%
25.0%
25.5%
26.0%
26.5%
27.0%
1Q
FY
15
2Q
FY
15
3Q
FY
15
4Q
FY
15
1Q
FY
16
2Q
FY
16
3Q
FY
16
4Q
FY
16
1Q
FY
17
2Q
FY
17
3Q
FY
17
4Q
FY
17
1Q
FY
18
2Q
FY
18
3Q
FY
18
4Q
FY
18
1Q
FY
19
EBIT margin(%) Onsite effort

Infosys
July 13, 2018 4
Focus on Automation to drive revenue per reported employee
Infosys revenue per reported employee (Quarterly annualized) stood at USD
54,704 per employee as on 1QFY19. This represents a 3% YoY growth. Strong
focus on improving utilisation rates has aided revenue productivity of Infosys.
Revenue per Reported Employee Quarterly Annualized (USD) and
Growth (YoY)
Source: Company, PL
Utilisation remain strong
IT services utilisation (excluding trainees) came in at 85.7% for Q1FY19 up
100bps QoQ. Infosys has been maintaining utilisation rates above 80% for the
past few consecutive quarters.
IT Services Utilization (excluding trainees)
Source: Company, PL
53,3
87
52,9
59
49,9
44
50,7
38
52,0
71
50,4
14
50,4
30
51,1
59
52,1
56
51,0
72
51,3
64
53,1
64
54,9
73
55,0
82
55,2
98
54,7
04
-8.0%
-6.0%
-4.0%
-2.0%
0.0%
2.0%
4.0%
47,000
48,000
49,000
50,000
51,000
52,000
53,000
54,000
55,000
56,000
Q2F
Y15
Q3F
Y15
Q4F
Y15
Q1F
Y16
Q2F
Y16
Q3F
Y16
Q4F
Y16
Q1F
Y17
Q2F
Y17
Q3F
Y17
Q4F
Y17
Q1F
Y18
2Q
FY
18
3Q
FY
18
4Q
FY
18
1Q
FY
19
Revenue / Reported Employee (USD) QoQ growth (Decline)
74.3
%
77.5
%
76.9
%
76.7
%
80.1
% 82.3
%
82.7
%
78.6
% 80.2
%
81.3
%
80.6
%
80.1
%
80.5
% 82.5
%
81.9
%
82.0
% 84.0
%
84.7
%
84.9
%
84.7
%
85.7
%
72.0%
74.0%
76.0%
78.0%
80.0%
82.0%
84.0%
86.0%
88.0%
1Q
FY
14
2Q
FY
14
3Q
FY
14
4Q
FY
14
1Q
FY
15
2Q
FY
15
3Q
FY
15
4Q
FY
15
1Q
FY
16
2Q
FY
16
3Q
FY
16
4Q
FY
16
1Q
FY
17
2Q
FY
17
3Q
FY
17
4Q
FY
17
1Q
FY
18
2Q
FY
18
3Q
FY
18
4Q
FY
18
1Q
FY
19

Infosys
July 13, 2018 5
Steady TCV wins: TCV wins for the quarter stood at USD1116mn, which is
highest over last 7 quarters and remained strong.
TCV Wins
USD mn 1QFY16 2QFY16 3QFY16 4QFY16 1QFY17 2QFY17 3QFY17 4QFY17 1QFY18 2QFY18 3QFY18 4QFY18 1QFY19
TCV 688 983 360 757 809 1209 664 806 657 731 779 905 1116
Source: Company, PL

Infosys
July 13, 2018 6
Operating Metrics
Geography Mix of Revenues (%)
Geography Mix (%) 1QFY16 3QFY16 4QFY16 1QFY17 2QFY17 3QFY17 4QFY17 1QFY18 2QFY18 3QFY18 4QFY18 1QFY19
North America 63.2 62.5 61.9 62 61.5 62.0 62.3 61.1 60.6 60.4 59.4 60.0
Europe 22.4 23.2 23.4 23 22.5 22.2 22.1 22.4 23.2 24.4 24.8 24.3
India 2.2 2.8 3 2.7 3.4 3.4 3.2 3.6 3.3 3 2.8 2.6
Rest of the world 12.2 11.5 11.7 12.3 12.6 12.4 12.4 12.9 12.9 12.2 13 13.1
Source: Company, PL
Geography wise Revenues and Growth in geographies (%)
Growth by Geography (USD mn) 1QFY19 4QFY18 QoQ 1QFY18 YoY
North America 1699 1666 1.9% 1620 4.9%
Europe 688 696 -1.1% 594 15.8%
India 74 79 -6.3% 95 -22.9%
Rest of the World 371 365 1.7% 342 8.4%
Total Revenues 2831 2805 0.9% 2651 6.8%
Source: Company, PL
Growth in Constant Currency in geographies (%) for 1QFY19
Source: Company, PL
Vertical wise Revenues and Growth in Verticals (%)
Growth by Vertical (USD mn) 1QFY19 4QFY18 QoQ 1QFY18 YoY
Financial Services 900 914 -1.5% 875 2.9%
Retail 470 446 5.4% 429 9.4%
Communication 360 362 -0.6% 334 7.6%
Energy, Utilities, Resources & services 351 337 4.3% 300 17.2%
Manufacturing 272 269 0.9% 247 10.2%
Hi tech 209 208 0.9% 194 8.3%
Life Sciences 187 188 -0.6% 175 6.8%
Others 82 81 0.9% 98 -16.3%
Total Revenues 2831 2805 0.9% 2651 6.8%
Source: Company, PL
2 2.1
-4.1
5.3
-6
-4
-2
0
2
4
6
North America Europe India Rest of the World
Infosys
July 13, 2018 7
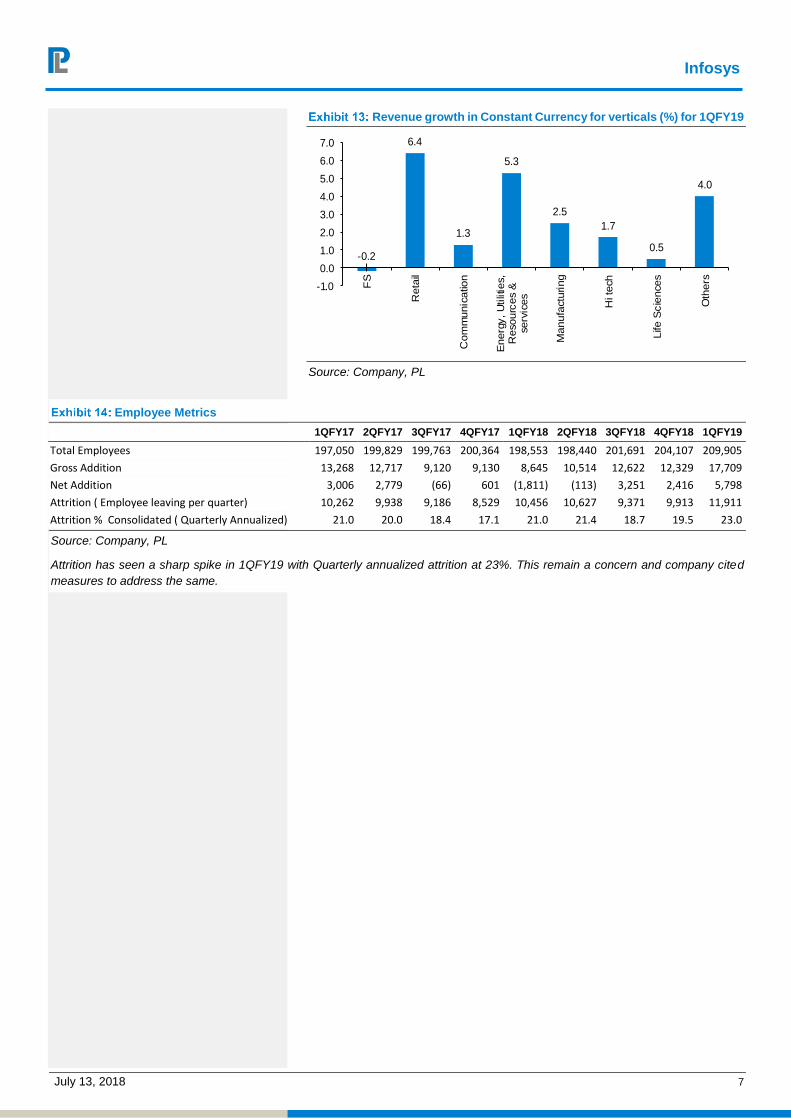
Revenue growth in Constant Currency for verticals (%) for 1QFY19
Source: Company, PL
Employee Metrics
1QFY17 2QFY17 3QFY17 4QFY17 1QFY18 2QFY18 3QFY18 4QFY18 1QFY19
Total Employees 197,050 199,829 199,763 200,364 198,553 198,440 201,691 204,107 209,905
Gross Addition 13,268 12,717 9,120 9,130 8,645 10,514 12,622 12,329 17,709
Net Addition 3,006 2,779 (66) 601 (1,811) (113) 3,251 2,416 5,798
Attrition ( Employee leaving per quarter) 10,262 9,938 9,186 8,529 10,456 10,627 9,371 9,913 11,911
Attrition % Consolidated ( Quarterly Annualized) 21.0 20.0 18.4 17.1 21.0 21.4 18.7 19.5 23.0
Source: Company, PL
Attrition has seen a sharp spike in 1QFY19 with Quarterly annualized attrition at 23%. This remain a concern and company cited
measures to address the same.
-0.2
6.4
1.3
5.3
2.5
1.7
0.5
4.0
-1.0
0.0
1.0
2.0
3.0
4.0
5.0
6.0
7.0
FS
Reta
il
Com
munic
ation
Energ
y, U
tilities,
Resourc
es &
serv
ices
Manufa
ctu
ring
Hi te
ch
Life S
cie
nces
Oth
ers

Infosys
July 13, 2018 8
Consolidated Model sheet of Infosys
FY14 FY15 FY16 FY17 FY18 FY19E FY20E
Total revenues USD mn 8,249 8,711 9,501 10,208 10,939 11,729 12,739
Growth (%) 11.5% 5.6% 9.1% 7.4% 7.2% 7.2% 8.6%
Average exchange rate 60.7 61.2 65.7 67.1 64.5 67.65 67.00
% Change 11.3% 0.8% 7.3% 2.1% -3.9% 4.9% -1.0%
Total Revenues (Rs mn) 501,330 533,190 624,410 684,850 705,220 793,343 853,496
Growth (%) 24.2% 6.4% 17.1% 9.7% 3.0% 12.5% 7.6%
EBIDTA 136,340 149,028 170,780 186,050 190,100 207,870 226,370
EBIT 122,600 138,338 156,190 169,020 171,480 190,264 208,874
PAT 106,480 123,328 134,900 143,530 160,280 154,020 172,583
Margins
EBIDTA Margins(%) 27.2% 28.0% 27.4% 27.2% 27.0% 26.2% 26.5%
EBIT Margin (%) 24.5% 25.9% 25.0% 24.7% 24.3% 24.0% 24.5%
PBT(%) 29.8% 32.4% 30.0% 29.2% 28.8% 27.4% 28.3%
NPM 21.2% 23.1% 21.6% 21.0% 22.7% 19.4% 20.2%
Tax Rate 27.2% 28.6% 28.0% 28.0% 20.9% 28.0% 28.5%
Diluted EPS 47 54 59 63 71.1 70.8 79.3
EPS Growth (%) 13.0% 15.8% 9.4% 6.4% 13.2% -0.4% 12.1%
P/E 28.4 24.5 22.4 21.1 18.6 18.7 16.7
P/S 6.1 5.7 4.8 4.4 4.1 3.6 3.4
EV/EBIDTA 20.1 18.2 15.7 14.2 13.5 12.2 10.9
ROE(%) 23.9% 24.1% 23.2% 22.0% 23.9% 23.3% 24.2%
ROCE(%) (Post Tax) 23.9% 24.1% 23.2% 22.0% 23.9% 23.3% 24.2%
ROIC(%) 52.3% 48.8% 45.5% 42.5% 43.1% 42.0% 45.0%
DPS 15.8 22.4 24.4 25.9 33.4 42.5 37.3
Dividend Payout ratio (Including tax) 39.8% 49.8% 49.7% 49.6% 56.8% 72.5% 56.8%
Dividend Yield(%) 1.2% 1.7% 1.8% 2.0% 2.5% 3.2% 2.8%
Consolidated Balance sheet (Rs mn)
Net Cash on Balance Sheet 292,260 325,860 345,830 389,770 319,810 351,528 410,025
Net Cash Per Share 128 143 151 171 147 162 188
Net Cash per share as a % of stock price 9.7% 10.8% 11.4% 12.9% 11.1% 12.2% 14.2%
Consolidated Cash flow (Rs mn)
Cash flow from Operations 121,870 107,520 122,430 140,630 145,590 164,484 178,564
Capex+ acquisitions 27,450 35,290 34,700 27,600 22,000 22,000 22,000
Free cash flow from operations 94,420 72,230 87,730 113,030 123,590 142,484 156,564
FCF /EBIDTA 69.3% 48.5% 51.4% 60.8% 65.0% 68.5% 69.2%
FCF Yield(%) 3.1% 2.4% 2.9% 3.7% 4.3% 4.9% 5.4%
Source: Company, PL

Infosys
July 13, 2018 9
Financials
Income Statement (Rs m)
Y/e Mar FY17 FY18 FY19E FY20E
Net Revenues 6,84,850 7,05,220 7,93,343 8,53,496
YoY gr. (%) 9.7 3.0 12.5 7.6
Employee Cost 4,15,500 4,32,690 4,91,799 5,25,984
Gross Profit 2,69,350 2,72,530 3,01,544 3,27,512
Margin (%) 39.3 38.6 38.0 38.4
SG&A Expenses 47,390 46,850 51,512 55,477
Other Expenses - - - -
EBITDA 1,86,050 1,90,100 2,07,870 2,26,370
YoY gr. (%) 8.9 2.2 9.3 8.9
Margin (%) 27.2 27.0 26.2 26.5
Depreciation and Amortization 17,030 18,620 17,605 17,495
EBIT 1,69,020 1,71,480 1,90,264 2,08,874
Margin (%) 24.7 24.3 24.0 24.5
Net Interest - - - -
Other Income 30,790 31,930 27,260 32,500
Profit Before Tax 1,99,810 2,03,410 2,17,524 2,41,374
Margin (%) 29.2 28.8 27.4 28.3
Total Tax 55,980 42,420 60,805 68,792
Effective tax rate (%) 28.0 20.9 28.0 28.5
Profit after tax 1,43,830 1,60,990 1,56,720 1,72,583
Minority interest - - - -
Share Profit from Associate (300) (710) - -
Adjusted PAT 1,43,530 1,60,280 1,56,720 1,72,583
YoY gr. (%) 6.4 11.7 (2.2) 10.1
Margin (%) 21.0 22.7 19.8 20.2
Extra Ord. Income / (Exp) - - 2700 -
Reported PAT 1,43,530 1,60,280 1,54,020 1,72,583
YoY gr. (%) 6.4 11.7 (2.2) 10.1
Margin (%) 21.0 22.7 19.8 20.2
Other Comprehensive Income - - - -
Total Comprehensive Income 1,43,530 1,60,280 1,56,720 1,72,583
Equity Shares O/s (m) 2,288 2,176 2,176 2,176
EPS (Rs) 62.7 71.7 70.7 79.3
Source: Company Data, PL Research
Balance Sheet Abstract (Rs m)
Y/e Mar FY17 FY18 FY19E FY20E
Non-Current Assets
Gross Block 1,83,320 2,01,790 2,23,790 2,45,790
Tangibles 1,83,320 2,01,790 2,23,790 2,45,790
Intangibles - - - -
Acc: Dep / Amortization 85,810 1,00,630 1,18,235 1,35,731
Tangibles 85,810 1,00,630 1,18,235 1,35,731
Intangibles - - - -
Net fixed assets 97,510 1,01,160 1,05,555 1,10,059
Tangibles 97,510 1,01,160 1,05,555 1,10,059
Intangibles - - - -
Capital Work In Progress 27,410 22,740 22,740 22,740
Goodwill 36,520 22,110 22,110 22,110
Non-Current Investments 64,530 57,560 57,560 57,560
Net Deferred tax assets 3,330 7,410 7,410 7,410
Other Non-Current Assets 65,130 82,340 84,340 86,340
Current Assets
Investments 99,700 64,070 64,070 64,070
Inventories 36,480 42,610 39,667 42,675
Trade receivables 1,23,220 1,31,420 1,43,454 1,51,993
Cash & Bank Balance 2,26,250 1,98,180 2,29,898 2,88,395
Other Current Assets 51,400 43,290 46,290 49,290
Total Assets 8,33,550 7,98,900 8,28,503 9,08,051
Equity
Equity Share Capital 11,440 10,880 10,880 10,880
Other Equity 6,78,380 6,38,350 6,64,254 7,38,770
Total Networth 6,89,820 6,49,230 6,75,134 7,49,650
Non-Current Liabilities
Long Term borrowings - - - -
Provisions - 480 - -
Other non current liabilities 1,530 2,720 2,720 2,720
Current Liabilities
ST Debt / Current of LT Debt - - - -
Trade payables 21,440 29,890 22,807 24,010
Other current liabilities 1,18,690 1,11,160 1,22,433 1,26,262
Total Equity & Liabilities 8,33,550 7,98,900 8,28,503 9,08,051
Source: Company Data, PL Research

Infosys
July 13, 2018 10
Cash Flow (Rs m)
Y/e Mar FY17 FY18 FY19E FY20E Year
PBT 1,99,510 2,02,700 2,14,824 2,41,374
Add. Depreciation 17,030 18,630 17,605 17,495
Add. Interest - - - -
Less Financial Other Income 30,790 31,930 27,260 32,500
Add. Other 60 (6,390) - -
Op. profit before WC changes 2,16,600 2,14,940 2,32,430 2,58,870
Net Changes-WC (19,440) (1,060) (7,141) (11,514)
Direct tax (56,530) (68,290) (60,805) (68,792)
Net cash from Op. activities 1,40,630 1,45,590 1,64,484 1,78,564
Capital expenditures (26,690) (16,420) (22,000) (22,000)
Interest / Dividend Income - - - -
Others (1,44,050) 47,530 - -
Net Cash from Invt. activities (1,70,740) 31,110 (22,000) (22,000)
Issue of share cap. / premium - (1,30,410) - -
Debt changes - - - -
Dividend paid (69,390) (74,640) (1,11,726) (98,067)
Interest paid - - - -
Others - - - -
Net cash from Fin. activities (69,390) (2,05,050) (1,11,726) (98,067)
Net change in cash (99,500) (28,350) 30,758 58,497
Free Cash Flow 1,13,030 1,25,610 1,42,484 1,56,564
Source: Company Data, PL Research
Quarterly Financials (Rs m)
Y/e Mar Q2FY18 Q3FY18 Q4FY18 Q1FY19
Net Revenue 1,75,670 1,77,940 1,80,830 1,91,280
YoY gr. (%) 1.5 3.0 5.6 12.0
Employee l Expenses 1,07,710 1,09,520 1,10,960 1,18,520
Gross Profit 67,960 68,420 69,870 72,760
Margin (%) 38.7 38.5 38.6 38.0
SG&A expenses 20,940 20,250 20,570 23,030
EBITDA 47,020 48,170 49,300 49,730
YoY gr. (%) 3.1 2.4 2.3 0.9
Margin (%) 26.8 27.1 27.3 26.0
Depreciation / Depletion 4,560 4,980 4,580 4,360
EBIT 42,460 43,190 44,720 45,370
Margin (%) 24.2 24.3 24.7 23.7
Other Income 8,830 9,620 5,340 7,260
Profit before Tax 51,290 52,810 50,060 52,630
Margin (%) 29.2 29.7 27.7 27.5
Total Tax 14,030 1,520 13,160 13,810
Effective tax rate (%) 27.4 2.9 26.3 26.2
Profit after Tax 37,260 51,290 36,900 38,820
Minority interest - - - -
Share Profit from Associates - - - -
Adjusted PAT 37,260 51,290 36,900 38,820
YoY gr. (%) 3.3 38.3 2.4 11.5
Margin (%) 21.2 28.8 20.4 20.3
Extra Ord. Income / (Exp) - - - 2700
Reported PAT 37,260 51,290 36,900 36,120
YoY gr. (%) 3.3 38.3 2.4 3.7
Margin (%) 21.2 28.8 20.4 18.9
Total Comprehensive Income 37,260 51,290 36,900 38,820
Avg. Shares O/s (m) 2,286 2,277 2,176 2,176
EPS (Rs) 16.3 22.5 17.0 16.6
Source: Company Data, PL Research
Key Financial Metrics
Y/e Mar FY17 FY18 FY19E FY20E
Per Share(Rs)
EPS 62.7 73.7 72.0 79.3
CEPS 70.2 82.2 80.1 87.4
BVPS 301.5 298.4 310.3 344.5
FCF 49.4 57.7 65.5 72.0
DPS 26 35 42 37
Return Ratio(%)
RoCE 25.9 25.6 28.7 29.3
ROIC 33.4 35.1 36.0 37.6
RoE 22.0 23.9 23.7 24.2
Balance Sheet
Net Debt : Equity (x) (0.5) (0.4) (0.4) (0.5)
Debtor (Days) 66 68 66 65
Valuation(x)
PER 21.0 17.9 18.3 16.6
P/B 4.4 4.4 4.2 3.8
P/CEPS 70.7 82.9 80.7 88.0
EV/EBITDA 14.4 13.7 12.4 11.1
EV/Sales 3.9 3.7 3.2 2.9
Dividend Yield (%) 2.0 2.6 3.2 2.8
Source: Company Data, PL Research ROCE is pretax

Infosys
July 13, 2018 11
Price Chart
PL’s Recommendation Nomenclature (Absolute Performance)
Buy : > 15%
Accumulate : 5% to 15%
Hold : +5% to -5%
Reduce : -5% to -15%
Sell : < -15%
Not Rated (NR) : No specific call on the stock
Under Review (UR) : Rating likely to change shortly
873
999
1124
1250
1375
Jul-
15
Jan
-16
Jul-
16
Jan
-17
Jul-
17
Jan
-18
Jul-
18
(Rs)

Infosys
July 13, 2018 12
ANALYST CERTIFICATION
(Indian Clients)
We/I, Mr. Madhu Babu- BTech & PG MBA Research Analysts, authors and the names subscribed to this report, hereby certify that all of the views expressed in this research report accurately reflect our views about the subject issuer(s) or securities. We also certify that no part of our compensation was, is, or will be directly or indirectly related to the specific recommendation(s) or view(s) in this report.
(US Clients)
The research analysts, with respect to each issuer and its securities covered by them in this research report, certify that: All of the views expressed in this research report accurately reflect his or her or their personal views about all of the issuers and their securities; and No part of his or her or their compensation was, is or will be directly related to the specific recommendation or views expressed in this research report.
DISCLAIMER
Indian Clients
Prabhudas Lilladher Pvt. Ltd, Mumbai, India (hereinafter referred to as “PL”) is engaged in the business of Stock Broking, Portfolio Manager, Depository Participant and distribution for third party financial products. PL is a subsidiary of Prabhudas Lilladher Advisory Services Pvt Ltd. which has its various subsidiaries engaged in business of commodity broking, investment banking, financial services (margin funding) and distribution of third party financial/other products, details in respect of which are available at www.plindia.com.
This document has been prepared by the Research Division of PL and is meant for use by the recipient only as information and is not for circulation. This document is not to be reported or copied or made available to others without prior permission of PL. It should not be considered or taken as an offer to sell or a solicitation to buy or sell any security.
The information contained in this report has been obtained from sources that are considered to be reliable. However, PL has not independently verified the accuracy or completeness of the same. Neither PL nor any of its affiliates, its directors or its employees accepts any responsibility of whatsoever nature for the information, statements and opinion given, made available or expressed herein or for any omission therein.
Recipients of this report should be aware that past performance is not necessarily a guide to future performance and value of investments can go down as well. The suitability or otherwise of any investments will depend upon the recipient's particular circumstances and, in case of doubt, advice should be sought from an independent expert/advisor.
Either PL or its affiliates or its directors or its employees or its representatives or its clients or their relatives may have position(s), make market, act as principal or engage in transactions of securities of companies referred to in this report and they may have used the research material prior to publication.
PL may from time to time solicit or perform investment banking or other services for any company mentioned in this document.
PL is in the process of applying for certificate of registration as Research Analyst under Securities and Exchange Board of India (Research Analysts) Regulations, 2014
PL submits that no material disciplinary action has been taken on us by any Regulatory Authority impacting Equity Research Analysis activities.
PL or its research analysts or its associates or his relatives do not have any financial interest in the subject company.
PL or its research analysts or its associates or his relatives do not have actual/beneficial ownership of one per cent or more securities of the subject company at the end of the month immediately preceding the date of publication of the research report.
PL or its research analysts or its associates or his relatives do not have any material conflict of interest at the time of publication of the research report.
PL or its associates might have received compensation from the subject company in the past twelve months.
PL or its associates might have managed or co-managed public offering of securities for the subject company in the past twelve months or mandated by the subject company for any other assignment in the past twelve months.
PL or its associates might have received any compensation for investment banking or merchant banking or brokerage services from the subject company in the past twelve months.
PL or its associates might have received any compensation for products or services other than investment banking or merchant banking or brokerage services from the subject company in the past twelve months
PL or its associates might have received any compensation or other benefits from the subject company or third party in connection with the research report.
PL encourages independence in research report preparation and strives to minimize conflict in preparation of research report. PL or its analysts did not receive any compensation or other benefits from the subject Company or third party in connection with the preparation of the research report. PL or its Research Analysts do not have any material conflict of interest at the time of publication of this report.
It is confirmed that Mr. Madhu Babu- BTech & PG MBA Research Analysts of this report have not received any compensation from the companies mentioned in the report in the preceding twelve months
Compensation of our Research Analysts is not based on any specific merchant banking, investment banking or brokerage service transactions.
The Research analysts for this report certifies that all of the views expressed in this report accurately reflect his or her personal views about the subject company or companies and its or their securities, and no part of his or her compensation was, is or will be, directly or indirectly related to specific recommendations or views expressed in this report.
The research analysts for this report has not served as an officer, director or employee of the subject company PL or its research analysts have not engaged in market making activity for the subject company
Our sales people, traders, and other professionals or affiliates may provide oral or written market commentary or trading strategies to our clients that reflect opinions that are contrary to the opinions expressed herein, and our proprietary trading and investing businesses may make investment decisions that are inconsistent with the recommendations expressed herein. In reviewing these materials, you should be aware that any or all o the foregoing, among other things, may give rise to real or potential conflicts of interest.
PL and its associates, their directors and employees may (a) from time to time, have a long or short position in, and buy or sell the securities of the subject company or (b) be engaged in any other transaction involving such securities and earn brokerage or other compensation or act as a market maker in the financial instruments of the subject company or act as an advisor or lender/borrower to the subject company or may have any other potential conflict of interests with respect to any recommendation and other related information and opinions.
US Clients
This research report is a product of Prabhudas Lilladher Pvt. Ltd., which is the employer of the research analyst(s) who has prepared the research report. The research analyst(s) preparing the research report is/are resident outside the United States (U.S.) and are not associated persons of any U.S. regulated broker-dealer and therefore the analyst(s) is/are not subject to supervision by a U.S. broker-dealer, and is/are not required to satisfy the regulatory licensing requirements of FINRA or required to otherwise comply with U.S. rules or regulations regarding, among other things, communications with a subject company, public appearances and trading securities held by a research analyst account.
This report is intended for distribution by Prabhudas Lilladher Pvt. Ltd. only to "Major Institutional Investors" as defined by Rule 15a-6(b)(4) of the U.S. Securities and Exchange Act, 1934 (the Exchange Act) and interpretations thereof by U.S. Securities and Exchange Commission (SEC) in reliance on Rule 15a 6(a)(2). If the recipient of this report is not a Major Institutional Investor as specified above, then it should not act upon this report and return the same to the sender. Further, this report may not be copied, duplicated and/or transmitted onward to any U.S. person, which is not the Major Institutional Investor.
In reliance on the exemption from registration provided by Rule 15a-6 of the Exchange Act and interpretations thereof by the SEC in order to conduct certain business with Major Institutional Investors, Prabhudas Lilladher Pvt. Ltd. has entered into an agreement with a U.S. registered broker-dealer, Marco Polo Securities Inc. ("Marco Polo").
Transactions in securities discussed in this research report should be effected through Marco Polo or another U.S. registered broker dealer.
Prabhudas Lilladher Pvt. Ltd. 3rd Floor, Sadhana House, 570, P. B. Marg, Worli, Mumbai-400 018, India | Tel: (91 22) 6632 2222 Fax: (91 22) 6632 2209
www.plindia.com | Bloomberg Research Page: PRLD <GO>