Embed Size (px)
DESCRIPTION
3 Rationale A rapid, large decline in use of health care services could be indicative of access problems. As an agency charged with helping to assure Medicare beneficiaries’ access to care, we sought to understand the “missing million” phenomenon.
Citation preview
Informing Medicare Policy on Post-acute Care: The “Missing Million”
AcademyHealth 2004 Annual Research Meeting
Sharon Bee Cheng, MSChristopher Hogan, Ph.D.
www.medpac.gov
2
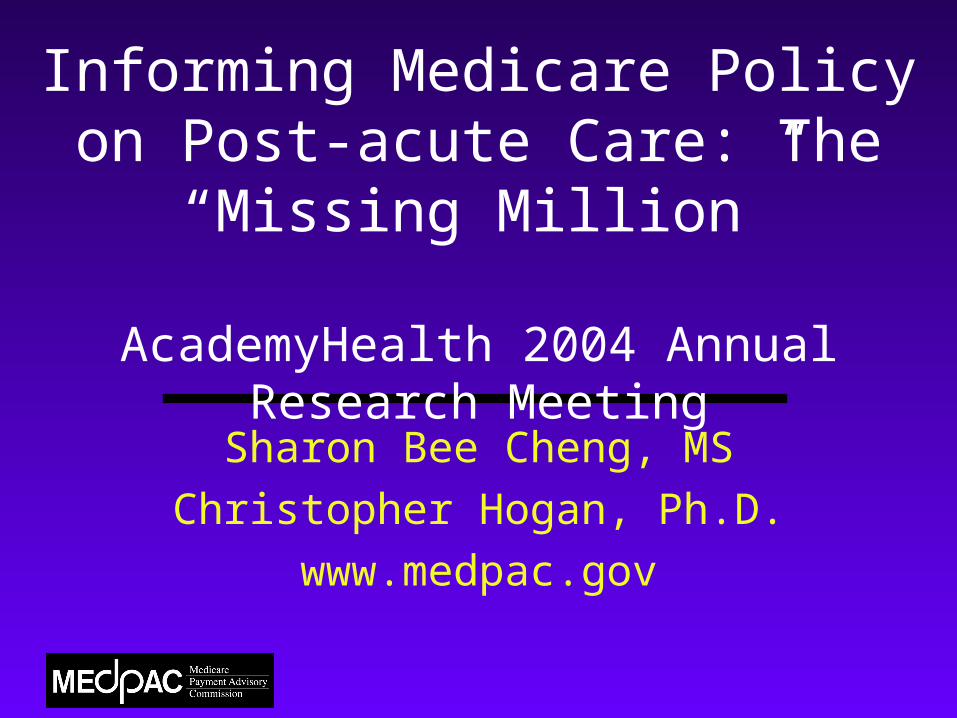
Key points
• Between 1996 and 2000, the number of beneficiaries who used home health fell by one million
• Across post-acute care, payment systems were changing. Fraud and abuse was reduced; eligibility changed.
• The greatest reductions in home health occurred among those with the lowest likelihood of use.
3
Rationale
A rapid, large decline in use of health care services could be indicative of access problems. As an agency charged with helping to assure Medicare beneficiaries’ access to care, we sought to understand the “missing million” phenomenon.
4
Study questions
What changes took place in the use of all post-acute care services from 1996 to 2001?
Were certain types of vulnerable beneficiaries excluded from the home health benefit?
5
Study Sample
Used the 5 percent Standard Analytic File of Medicare fee-for-service claims for calendar year 1996 and 2001 for- Home health agencies- Skilled nursing facilities- Long-term hospitals- Rehab hospitals and units- Psychiatric hospitals and units
6
Episodes of care
All post-acute provider claims following the discharge date were part of the episode until the episode ended. Episodes end:
• With a break of at least 31 days,or• Readmission to hospital, death, or
hospice.

7
Study design
Identified all episodes by diagnosis related groups and then grouped them by their rate of use of any post-acute care in 1996.
We then compared the rate of use for the groups in 1996 and in 2001.
8
Conclusions
• Use of other settings increased or stayed the same as home health use declined.
• Those with more clearly-defined needs experienced less decline.
9
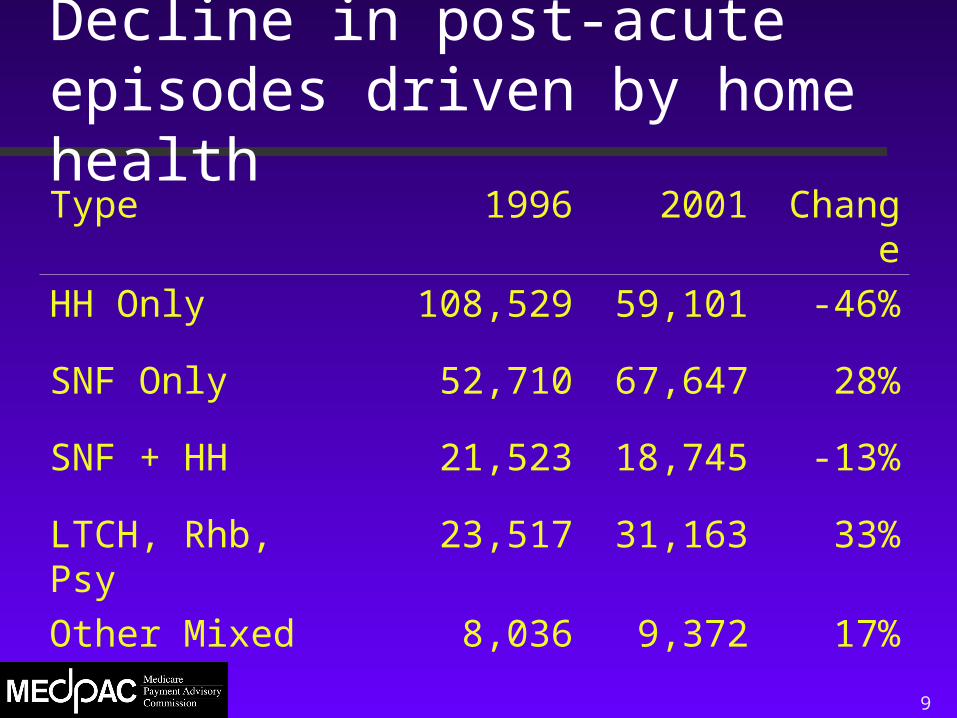
Decline in post-acute episodes driven by home healthType 1996 2001 ChangeHH Only 108,529 59,101 -46%
SNF Only 52,710 67,647 28%
SNF + HH 21,523 18,745 -13%
LTCH, Rhb, Psy 23,517 31,163 33%
Other Mixed 8,036 9,372 17%
10
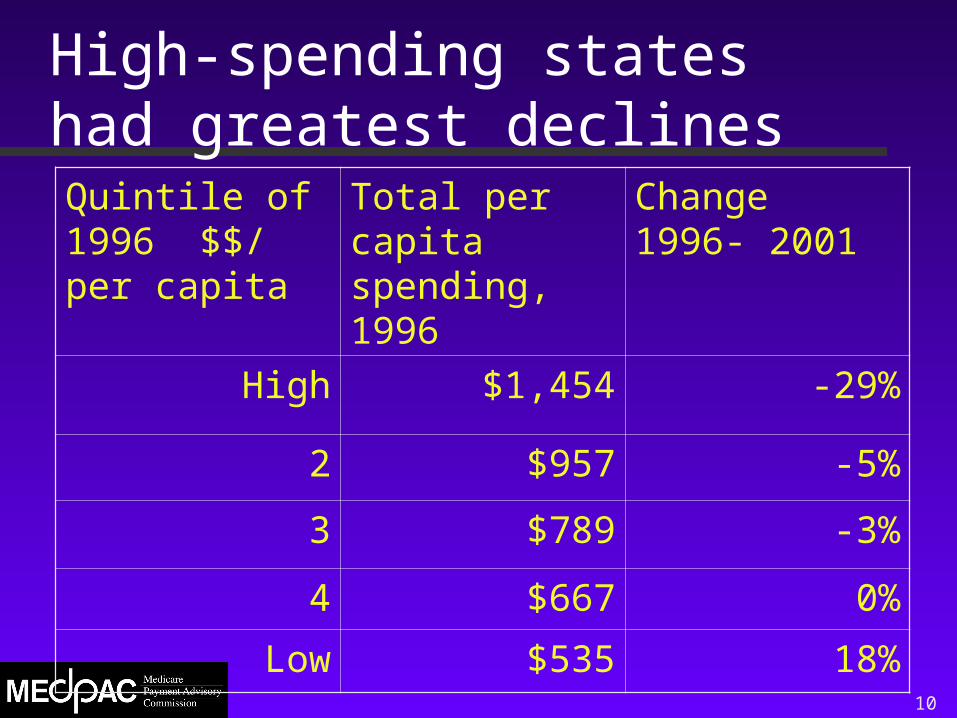
High-spending states had greatest declinesQuintile of 1996 $$/ per capita
Total per capita spending, 1996
Change 1996- 2001
High $1,454 -29%
2 $957 -5%
3 $789 -3%
4 $667 0%
Low $535 18%

11
Other demographics
• Mid-Atlantic states had the greatest increase in total post-acute spending; West South Central had the greatest decline
•Differences in the average number of days of post-acute care across urban and rural settings in 1996 narrowed in 2001.
12
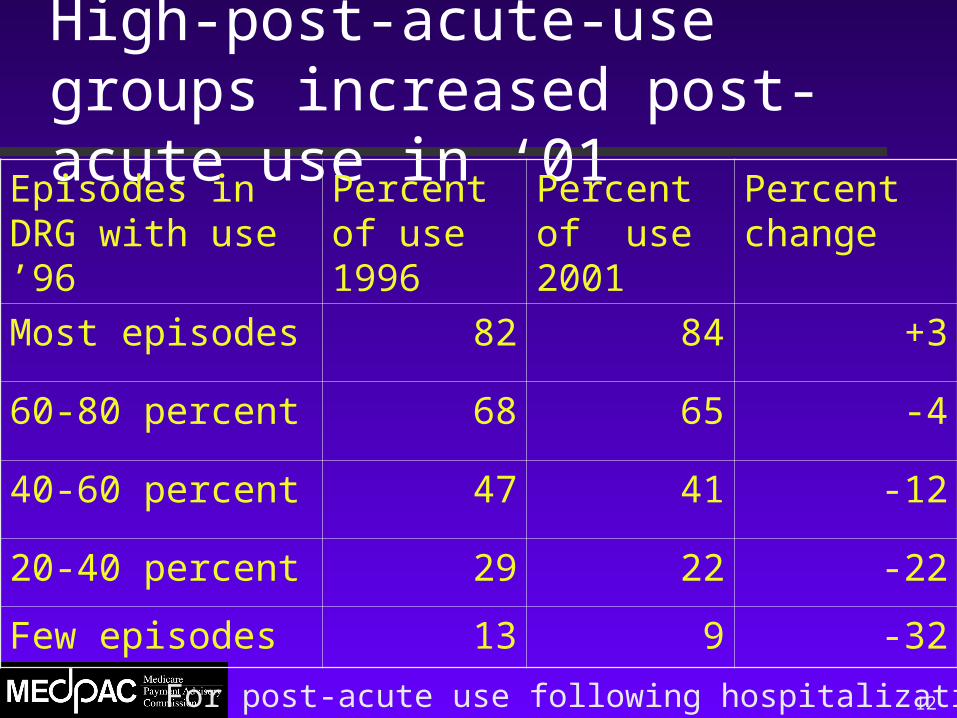
High-post-acute-use groups increased post-acute use in ‘01
Episodes in DRG with use ’96
Percent of use 1996
Percent of use 2001
Percent change
Most episodes 82 84 +3
60-80 percent 68 65 -4
40-60 percent 47 41 -12
20-40 percent 29 22 -22
Few episodes 13 9 -32
For post-acute use following hospitalization
13
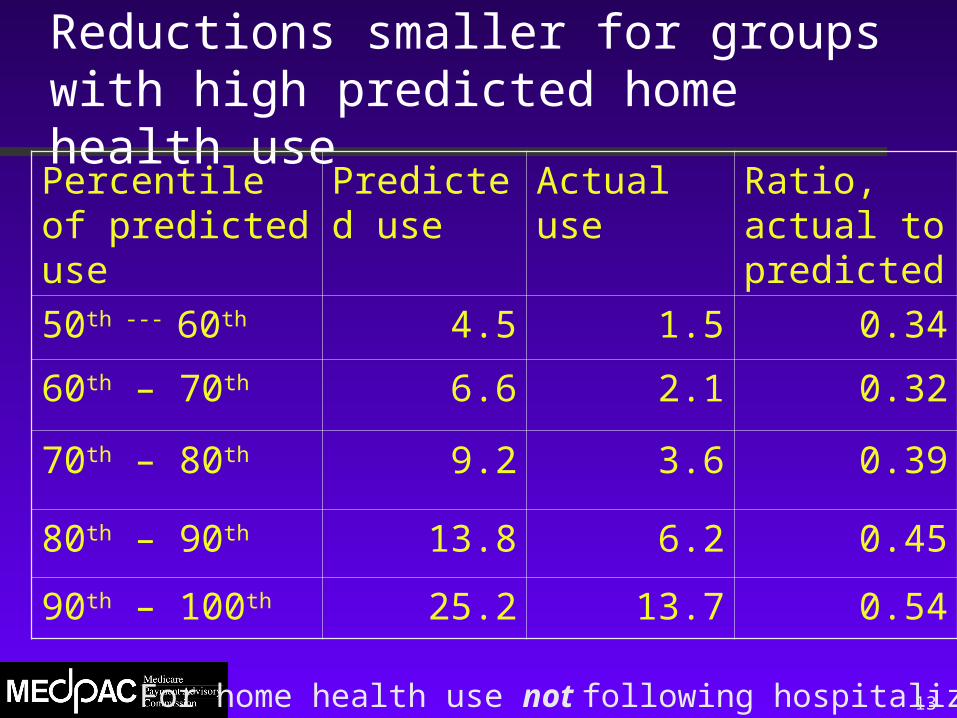
Reductions smaller for groups with high predicted home health usePercentile of predicted use
Predicted use
Actual use Ratio, actual to predicted
50th --- 60th 4.5 1.5 0.34
60th – 70th 6.6 2.1 0.32
70th – 80th 9.2 3.6 0.39
80th – 90th 13.8 6.2 0.45
90th – 100th 25.2 13.7 0.54
For home health use not following hospitalization
14
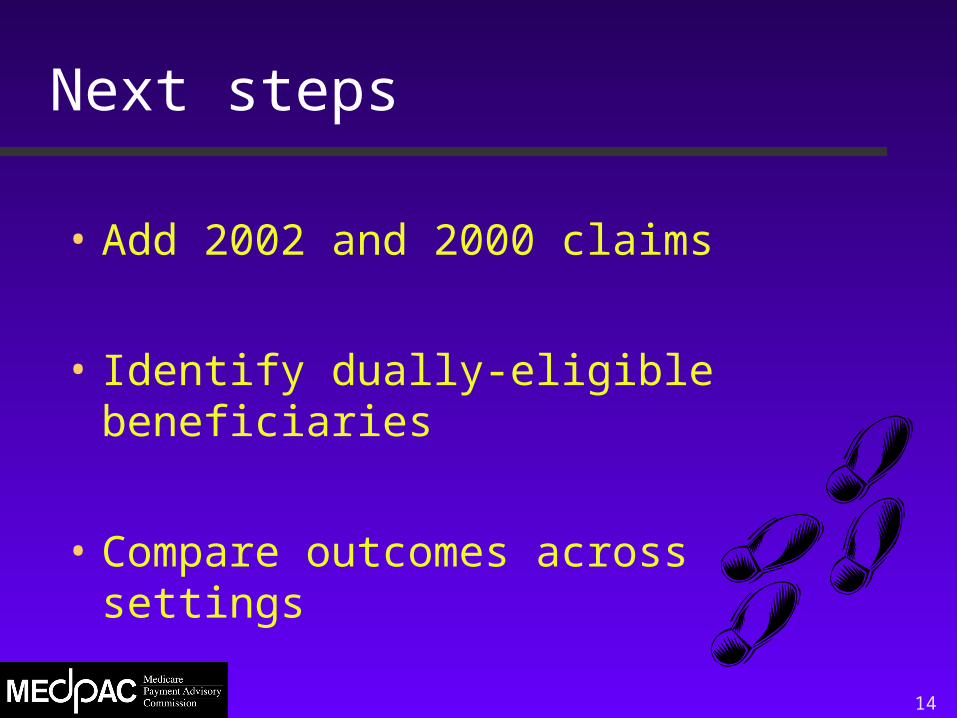
Next steps
• Add 2002 and 2000 claims
• Identify dually-eligible beneficiaries
• Compare outcomes across settings


![Shatto slides from AcademyHealth 2013 ARM [PDF, 614KB]](https://img.pdfslide.us/doc/110x75/61fb29632e268c58cd5ae184/shatto-slides-from-academyhealth-2013-arm-pdf-614kb.jpg)