Embed Size (px)
Citation preview

Frederick County Public Schools FY 2018 Operating Budget135
Informational
INFORMATIONAL SECTION
Frederick County Public Schools FY 2018 Operating Budget 136
Informational
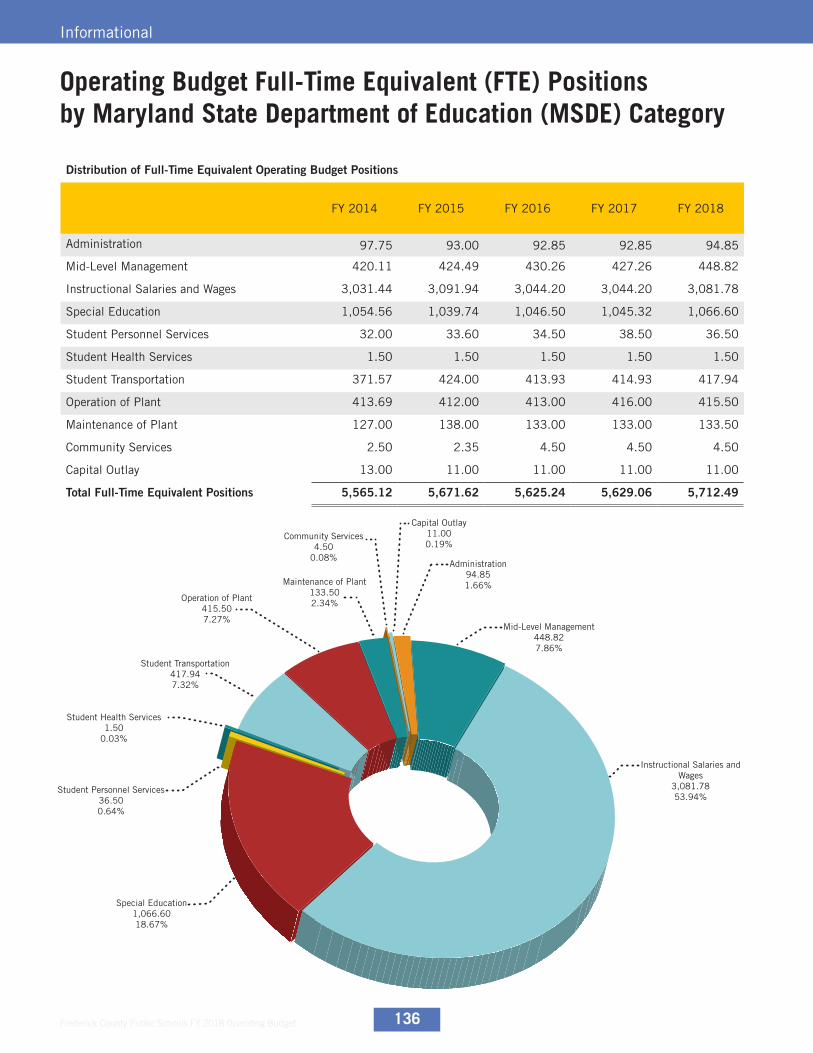
Distribution of Full-Time Equivalent Operating Budget Positions
FY 2014 FY 2015 FY 2016 FY 2017 FY 2018
Administration 97.75 93.00 92.85 92.85 94.85
Mid-Level Management 420.11 424.49 430.26 427.26 448.82
Instructional Salaries and Wages 3,031.44 3,091.94 3,044.20 3,044.20 3,081.78
Special Education 1,054.56 1,039.74 1,046.50 1,045.32 1,066.60
Student Personnel Services 32.00 33.60 34.50 38.50 36.50
Student Health Services 1.50 1.50 1.50 1.50 1.50
Student Transportation 371.57 424.00 413.93 414.93 417.94
Operation of Plant 413.69 412.00 413.00 416.00 415.50
Maintenance of Plant 127.00 138.00 133.00 133.00 133.50
Community Services 2.50 2.35 4.50 4.50 4.50
Capital Outlay 13.00 11.00 11.00 11.00 11.00
Total Full-Time Equivalent Positions 5,565.12 5,671.62 5,625.24 5,629.06 5,712.49
Operating Budget Full-Time Equivalent (FTE) Positionsby Maryland State Department of Education (MSDE) Category
Instructional Salaries and Wages
3,081.7853.94%
Mid-Level Management448.827.86%
Special Education1,066.6018.67%
Student Personnel Services36.500.64%
Student Health Services1.50
0.03%
Student Transportation417.947.32%
Operation of Plant415.507.27%
Maintenance of Plant133.502.34%
Community Services4.50
0.08%
Capital Outlay11.000.19%
Administration94.851.66%
Frederick County Public Schools FY 2018 Operating Budget137
Informational
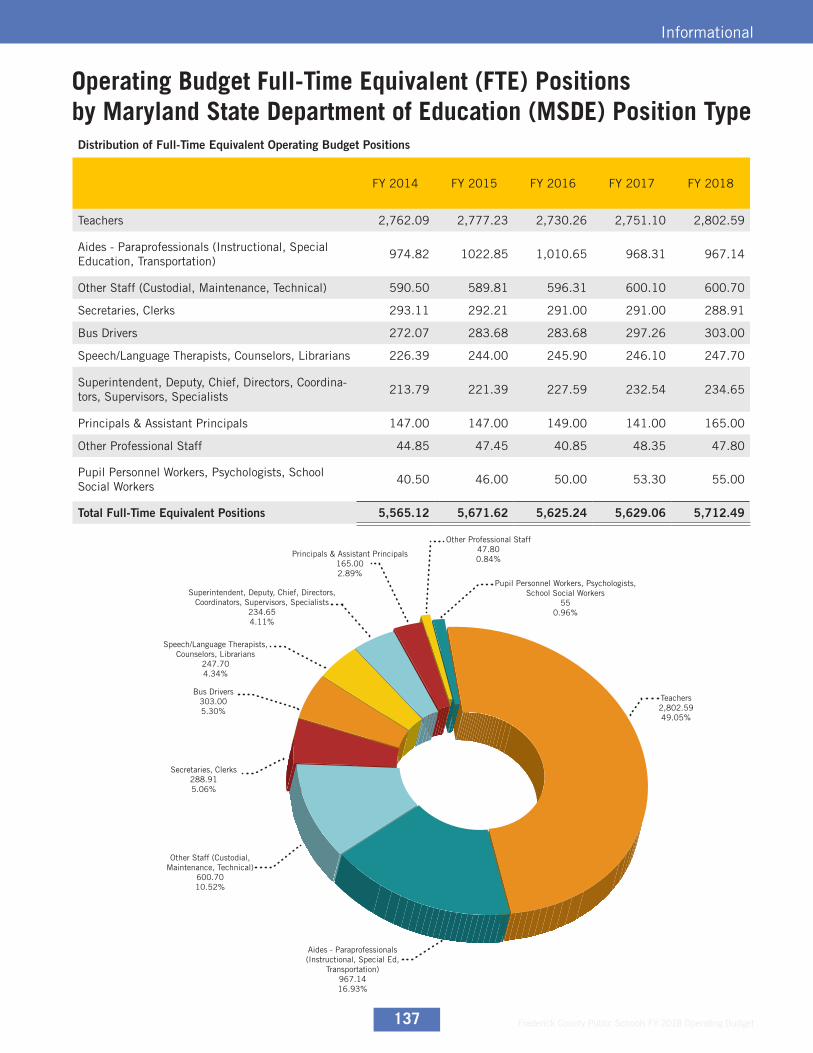
Distribution of Full-Time Equivalent Operating Budget Positions
FY 2014 FY 2015 FY 2016 FY 2017 FY 2018
Teachers 2,762.09 2,777.23 2,730.26 2,751.10 2,802.59
Aides - Paraprofessionals (Instructional, Special Education, Transportation)
974.82 1022.85 1,010.65 968.31 967.14
Other Staff (Custodial, Maintenance, Technical) 590.50 589.81 596.31 600.10 600.70
Secretaries, Clerks 293.11 292.21 291.00 291.00 288.91
Bus Drivers 272.07 283.68 283.68 297.26 303.00
Speech/Language Therapists, Counselors, Librarians 226.39 244.00 245.90 246.10 247.70
Superintendent, Deputy, Chief, Directors, Coordina-tors, Supervisors, Specialists
213.79 221.39 227.59 232.54 234.65
Principals & Assistant Principals 147.00 147.00 149.00 141.00 165.00
Other Professional Staff 44.85 47.45 40.85 48.35 47.80
Pupil Personnel Workers, Psychologists, School Social Workers
40.50 46.00 50.00 53.30 55.00
Total Full-Time Equivalent Positions 5,565.12 5,671.62 5,625.24 5,629.06 5,712.49
Operating Budget Full-Time Equivalent (FTE) Positionsby Maryland State Department of Education (MSDE) Position Type
Other Professional Staff47.800.84%
Secretaries, Clerks288.915.06%
Bus Drivers303.005.30%
Principals & Assistant Principals165.002.89%
Other Staff (Custodial, Maintenance, Technical)
600.7010.52%
Superintendent, Deputy, Chief, Directors, Coordinators, Supervisors, Specialists
234.654.11%
Pupil Personnel Workers, Psychologists, School Social Workers
550.96%
Teachers2,802.5949.05%
Aides - Paraprofessionals (Instructional, Special Ed,
Transportation)967.1416.93%
Speech/Language Therapists, Counselors, Librarians
247.704.34%
Frederick County Public Schools FY 2018 Operating Budget 138
Informational
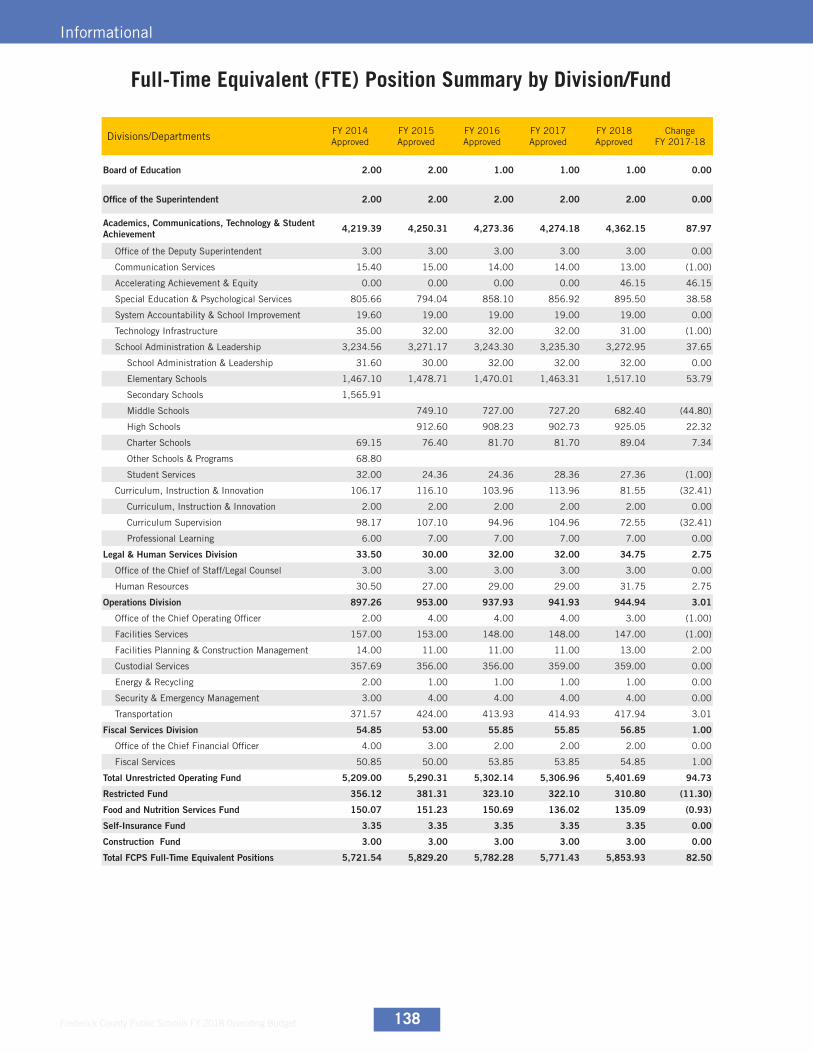
Divisions/Departments FY 2014 Approved
FY 2015 Approved
FY 2016 Approved
FY 2017 Approved
FY 2018 Approved
Change FY 2017-18
Board of Education 2.00 2.00 1.00 1.00 1.00 0.00
Office of the Superintendent 2.00 2.00 2.00 2.00 2.00 0.00
Academics, Communications, Technology & Student Achievement 4,219.39 4,250.31 4,273.36 4,274.18 4,362.15 87.97
Office of the Deputy Superintendent 3.00 3.00 3.00 3.00 3.00 0.00
Communication Services 15.40 15.00 14.00 14.00 13.00 (1.00)
Accelerating Achievement & Equity 0.00 0.00 0.00 0.00 46.15 46.15
Special Education & Psychological Services 805.66 794.04 858.10 856.92 895.50 38.58
System Accountability & School Improvement 19.60 19.00 19.00 19.00 19.00 0.00
Technology Infrastructure 35.00 32.00 32.00 32.00 31.00 (1.00)
School Administration & Leadership 3,234.56 3,271.17 3,243.30 3,235.30 3,272.95 37.65
School Administration & Leadership 31.60 30.00 32.00 32.00 32.00 0.00
Elementary Schools 1,467.10 1,478.71 1,470.01 1,463.31 1,517.10 53.79
Secondary Schools 1,565.91
Middle Schools 749.10 727.00 727.20 682.40 (44.80)
High Schools 912.60 908.23 902.73 925.05 22.32
Charter Schools 69.15 76.40 81.70 81.70 89.04 7.34
Other Schools & Programs 68.80
Student Services 32.00 24.36 24.36 28.36 27.36 (1.00)
Curriculum, Instruction & Innovation 106.17 116.10 103.96 113.96 81.55 (32.41)
Curriculum, Instruction & Innovation 2.00 2.00 2.00 2.00 2.00 0.00
Curriculum Supervision 98.17 107.10 94.96 104.96 72.55 (32.41)
Professional Learning 6.00 7.00 7.00 7.00 7.00 0.00
Legal & Human Services Division 33.50 30.00 32.00 32.00 34.75 2.75
Office of the Chief of Staff/Legal Counsel 3.00 3.00 3.00 3.00 3.00 0.00
Human Resources 30.50 27.00 29.00 29.00 31.75 2.75
Operations Division 897.26 953.00 937.93 941.93 944.94 3.01
Office of the Chief Operating Officer 2.00 4.00 4.00 4.00 3.00 (1.00)
Facilities Services 157.00 153.00 148.00 148.00 147.00 (1.00)
Facilities Planning & Construction Management 14.00 11.00 11.00 11.00 13.00 2.00
Custodial Services 357.69 356.00 356.00 359.00 359.00 0.00
Energy & Recycling 2.00 1.00 1.00 1.00 1.00 0.00
Security & Emergency Management 3.00 4.00 4.00 4.00 4.00 0.00
Transportation 371.57 424.00 413.93 414.93 417.94 3.01
Fiscal Services Division 54.85 53.00 55.85 55.85 56.85 1.00
Office of the Chief Financial Officer 4.00 3.00 2.00 2.00 2.00 0.00
Fiscal Services 50.85 50.00 53.85 53.85 54.85 1.00
Total Unrestricted Operating Fund 5,209.00 5,290.31 5,302.14 5,306.96 5,401.69 94.73
Restricted Fund 356.12 381.31 323.10 322.10 310.80 (11.30)
Food and Nutrition Services Fund 150.07 151.23 150.69 136.02 135.09 (0.93)
Self-Insurance Fund 3.35 3.35 3.35 3.35 3.35 0.00
Construction Fund 3.00 3.00 3.00 3.00 3.00 0.00
Total FCPS Full-Time Equivalent Positions 5,721.54 5,829.20 5,782.28 5,771.43 5,853.93 82.50
Full-Time Equivalent (FTE) Position Summary by Division/Fund
Frederick County Public Schools FY 2018 Operating Budget139
Informational
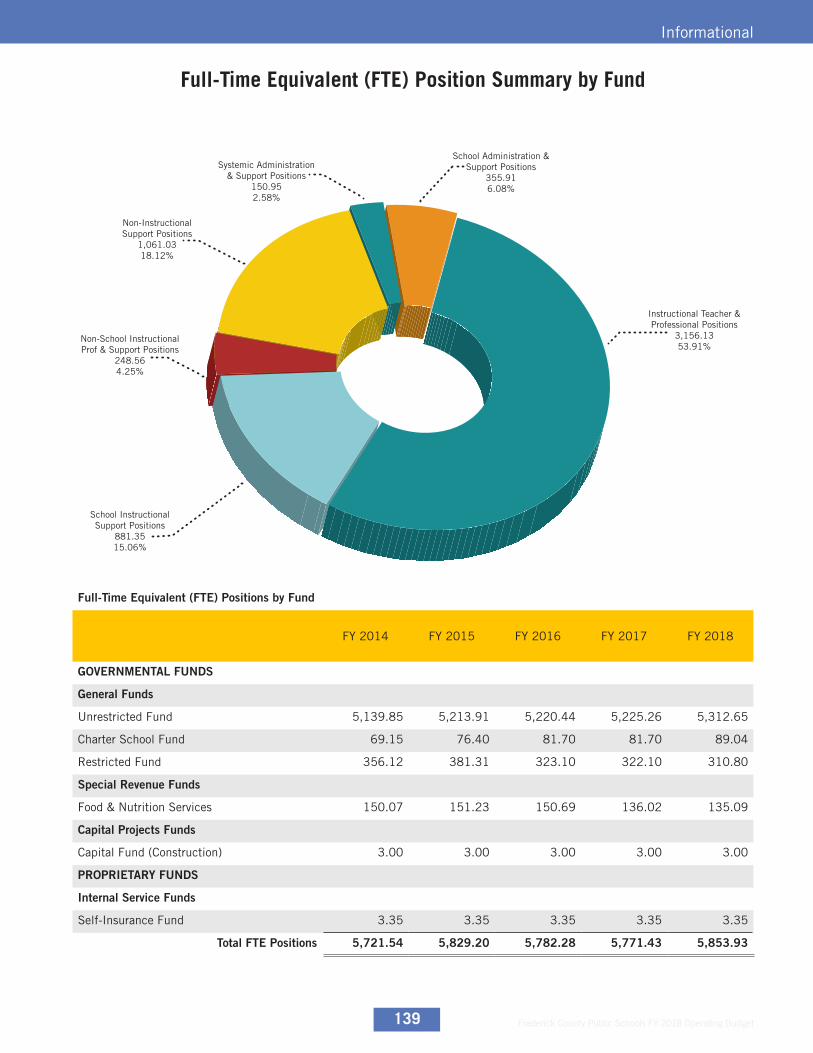
Full-Time Equivalent (FTE) Position Summary by Fund
Full-Time Equivalent (FTE) Positions by Fund
FY 2014 FY 2015 FY 2016 FY 2017 FY 2018
GOVERNMENTAL FUNDS
General Funds
Unrestricted Fund 5,139.85 5,213.91 5,220.44 5,225.26 5,312.65
Charter School Fund 69.15 76.40 81.70 81.70 89.04
Restricted Fund 356.12 381.31 323.10 322.10 310.80
Special Revenue Funds
Food & Nutrition Services 150.07 151.23 150.69 136.02 135.09
Capital Projects Funds
Capital Fund (Construction) 3.00 3.00 3.00 3.00 3.00
PROPRIETARY FUNDS
Internal Service Funds
Self-Insurance Fund 3.35 3.35 3.35 3.35 3.35
Total FTE Positions 5,721.54 5,829.20 5,782.28 5,771.43 5,853.93
Instructional Teacher & Professional Positions
3,156.1353.91%
School Administration & Support Positions
355.916.08%
School Instructional Support Positions
881.3515.06%
Non-School Instructional Prof & Support Positions
248.564.25%
Non-Instructional Support Positions
1,061.0318.12%
Systemic Administration & Support Positions
150.952.58%

Frederick County Public Schools FY 2018 Operating Budget 140
Informational
Teacher Staffing ModelFCPS allocates classroom teacher staffing for schools, programs, and grade levels according to the following models. Actual teacher-student ratios may vary from these averages.
Non-Formula PositionsIn prior years, there have been approximately 140 non-formula positions created through additional state funding (Thornton Funding) and other strategic initiatives. In FY2018, these positions have been allocated to:• Reduce class size,• Address complexity factors in our schools such as poverty, ELL populations, total enrollment and mobility,• Support student social and emotional needs,• Support specialized programs and initiatives.
ELEMENTARY SCHOOLSClassroom Teacher: 1.0 teacher position per 24.8 full-time equivalent students
Kindergarten Teacher: 1.0 teacher position per 23.0 full-time equivalent students
Art/Music/PE Teacher: 3.0 specials teachers for every 15 classroom teachers in grades K-5
Instrumental Music: For each school opening after FY 2004, a 0.2 teacher position is added.
Learning/Language Support Teacher:
1.0 teacher position per 665 students
English Language Learner Teacher1.0 teacher position per 30 students based on the English Langauage projection for June 30 of the prior year.
Special Education: 1.0 teacher for every 200 elementary school students
MIDDLE SCHOOLS
Classroom Teacher:Calculation uses a value of 25.8 full-time equivalent students adjusted by a factor of 0.746 to allow for teacher planning time. This results in a student-teacher ratio of 18.5 full-time equivalent students per teacher.
Learning/Language Support Teacher:
0.5 teacher per middle school
English LanguageLearner Teacher:
1.0 teacher position per 30 identified students
Special Education: 1.0 teacher for every 200 middle school students
HIGH SCHOOLS
Classroom Teacher:Calculation uses a value of 23.51 full-time equivalent students adjusted by a factor of 0.90 to allow for teacher planning time. This results in a student-teacher ratio of 20.25 full-time equivalent students per teacher.
English LanguageLearner Teacher:
1.0 teacher position per 30 identified students
Special Education: 1.0 teacher for every 250 high school students
Frederick County Public Schools FY 2018 Operating Budget141
Informational
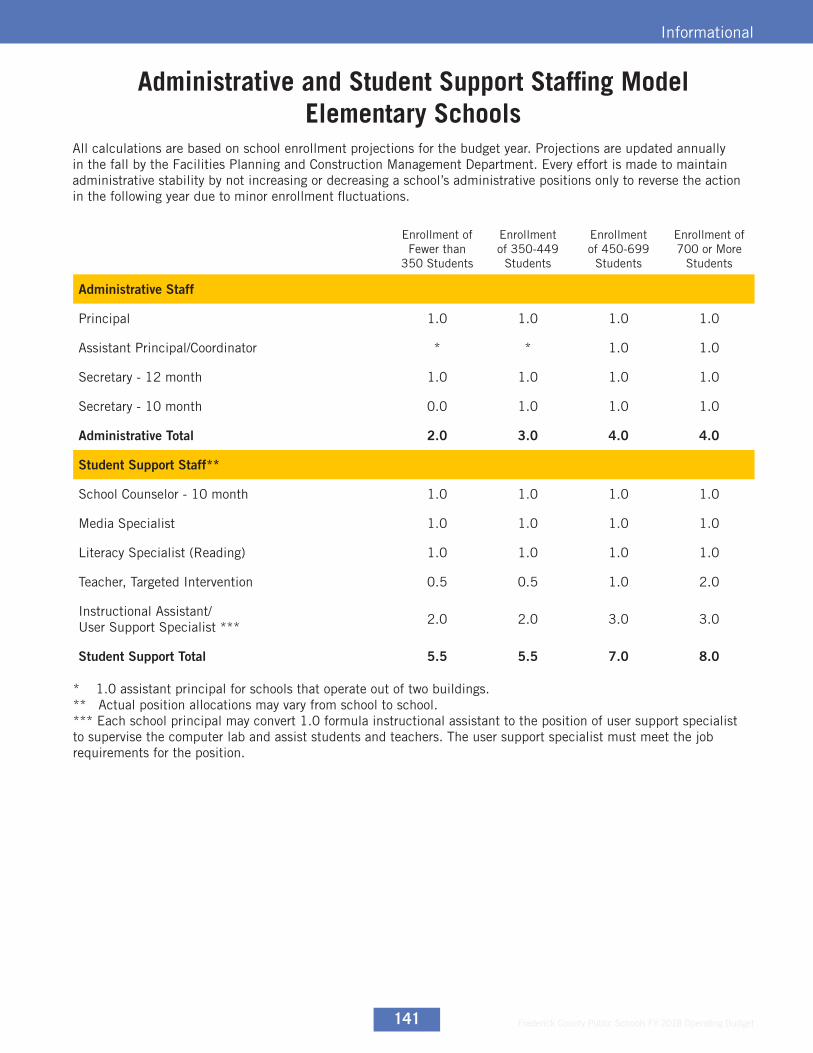
Administrative and Student Support Staffing ModelElementary Schools
All calculations are based on school enrollment projections for the budget year. Projections are updated annually in the fall by the Facilities Planning and Construction Management Department. Every effort is made to maintain administrative stability by not increasing or decreasing a school’s administrative positions only to reverse the action in the following year due to minor enrollment fluctuations.
* 1.0 assistant principal for schools that operate out of two buildings.** Actual position allocations may vary from school to school.*** Each school principal may convert 1.0 formula instructional assistant to the position of user support specialist to supervise the computer lab and assist students and teachers. The user support specialist must meet the job requirements for the position.
Enrollment of Fewer than
350 Students
Enrollment of 350-449
Students
Enrollment of 450-699
Students
Enrollment of 700 or More
Students
Administrative Staff
Principal 1.0 1.0 1.0 1.0
Assistant Principal/Coordinator * * 1.0 1.0
Secretary - 12 month 1.0 1.0 1.0 1.0
Secretary - 10 month 0.0 1.0 1.0 1.0
Administrative Total 2.0 3.0 4.0 4.0
Student Support Staff**
School Counselor - 10 month 1.0 1.0 1.0 1.0
Media Specialist 1.0 1.0 1.0 1.0
Literacy Specialist (Reading) 1.0 1.0 1.0 1.0
Teacher, Targeted Intervention 0.5 0.5 1.0 2.0
Instructional Assistant/User Support Specialist ***
2.0 2.0 3.0 3.0
Student Support Total 5.5 5.5 7.0 8.0
Frederick County Public Schools FY 2018 Operating Budget 142
Informational
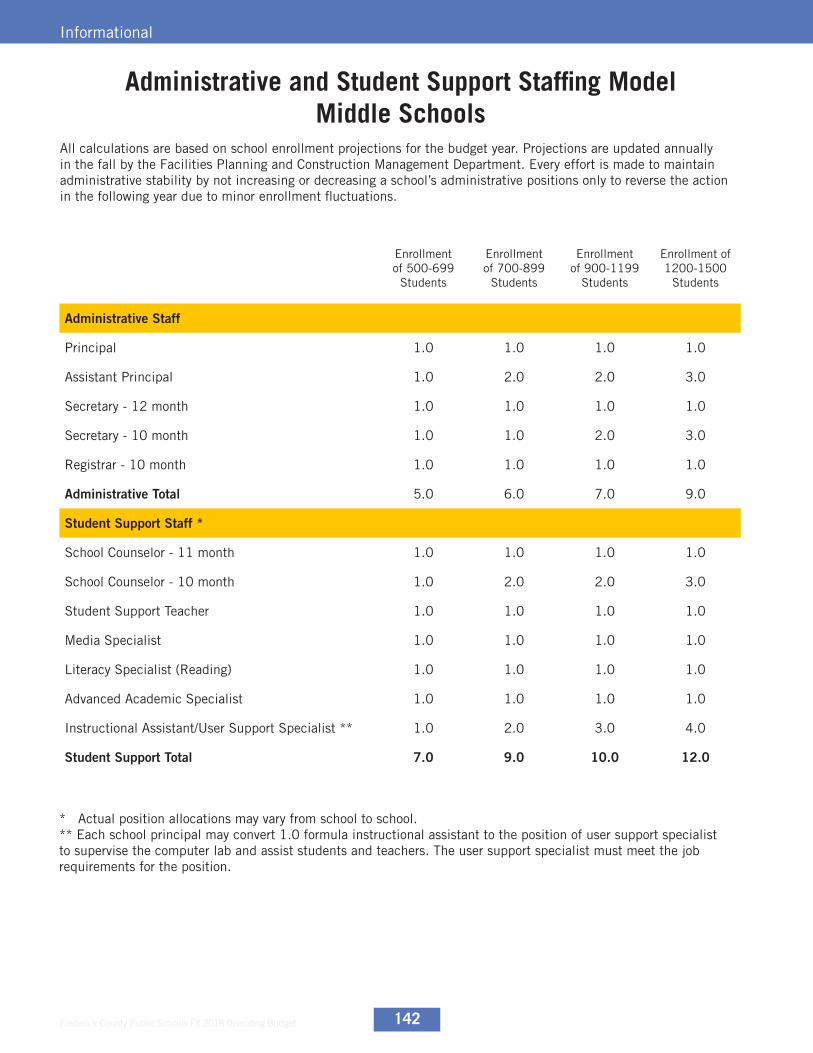
Administrative and Student Support Staffing ModelMiddle Schools
All calculations are based on school enrollment projections for the budget year. Projections are updated annually in the fall by the Facilities Planning and Construction Management Department. Every effort is made to maintain administrative stability by not increasing or decreasing a school’s administrative positions only to reverse the action in the following year due to minor enrollment fluctuations.
Enrollment of 500-699
Students
Enrollment of 700-899
Students
Enrollment of 900-1199
Students
Enrollment of 1200-1500
Students
Administrative Staff
Principal 1.0 1.0 1.0 1.0
Assistant Principal 1.0 2.0 2.0 3.0
Secretary - 12 month 1.0 1.0 1.0 1.0
Secretary - 10 month 1.0 1.0 2.0 3.0
Registrar - 10 month 1.0 1.0 1.0 1.0
Administrative Total 5.0 6.0 7.0 9.0
Student Support Staff *
School Counselor - 11 month 1.0 1.0 1.0 1.0
School Counselor - 10 month 1.0 2.0 2.0 3.0
Student Support Teacher 1.0 1.0 1.0 1.0
Media Specialist 1.0 1.0 1.0 1.0
Literacy Specialist (Reading) 1.0 1.0 1.0 1.0
Advanced Academic Specialist 1.0 1.0 1.0 1.0
Instructional Assistant/User Support Specialist ** 1.0 2.0 3.0 4.0
Student Support Total 7.0 9.0 10.0 12.0
* Actual position allocations may vary from school to school.** Each school principal may convert 1.0 formula instructional assistant to the position of user support specialist to supervise the computer lab and assist students and teachers. The user support specialist must meet the job requirements for the position.
Frederick County Public Schools FY 2018 Operating Budget143
Informational
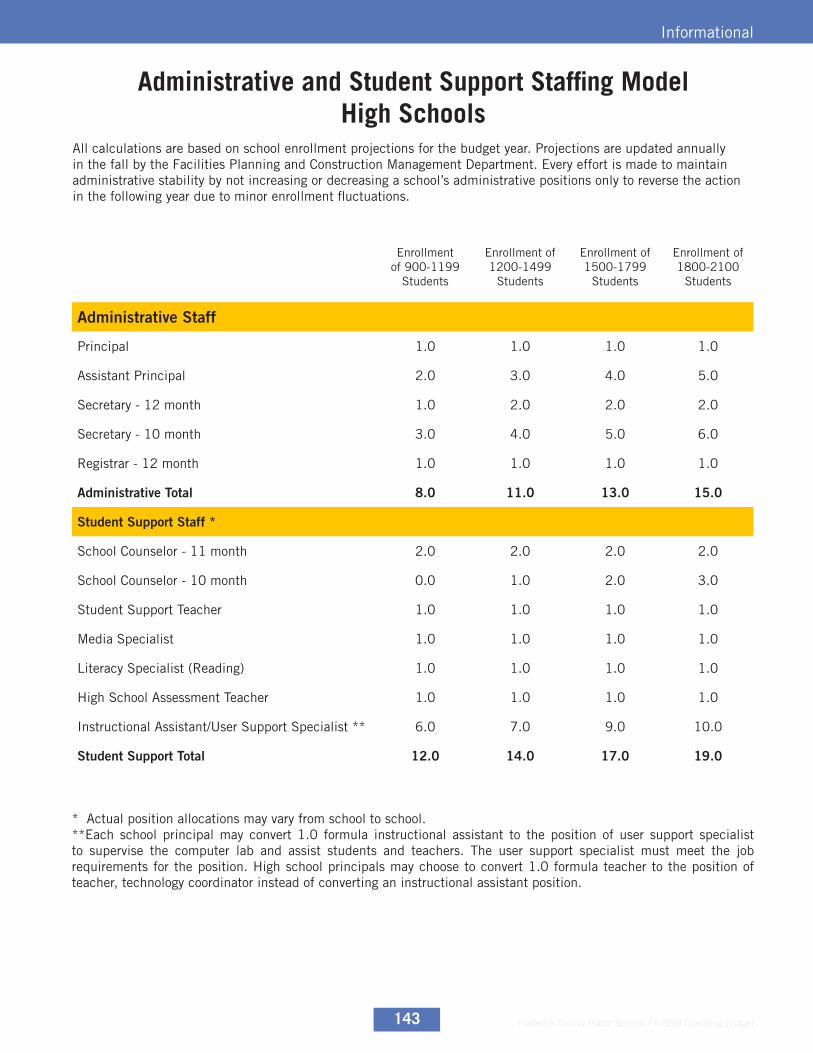
Administrative and Student Support Staffing ModelHigh Schools
All calculations are based on school enrollment projections for the budget year. Projections are updated annually in the fall by the Facilities Planning and Construction Management Department. Every effort is made to maintain administrative stability by not increasing or decreasing a school’s administrative positions only to reverse the action in the following year due to minor enrollment fluctuations.
Enrollment of 900-1199
Students
Enrollment of 1200-1499
Students
Enrollment of 1500-1799
Students
Enrollment of 1800-2100
Students
Administrative Staff
Principal 1.0 1.0 1.0 1.0
Assistant Principal 2.0 3.0 4.0 5.0
Secretary - 12 month 1.0 2.0 2.0 2.0
Secretary - 10 month 3.0 4.0 5.0 6.0
Registrar - 12 month 1.0 1.0 1.0 1.0
Administrative Total 8.0 11.0 13.0 15.0
Student Support Staff *
School Counselor - 11 month 2.0 2.0 2.0 2.0
School Counselor - 10 month 0.0 1.0 2.0 3.0
Student Support Teacher 1.0 1.0 1.0 1.0
Media Specialist 1.0 1.0 1.0 1.0
Literacy Specialist (Reading) 1.0 1.0 1.0 1.0
High School Assessment Teacher 1.0 1.0 1.0 1.0
Instructional Assistant/User Support Specialist ** 6.0 7.0 9.0 10.0
Student Support Total 12.0 14.0 17.0 19.0
* Actual position allocations may vary from school to school.**Each school principal may convert 1.0 formula instructional assistant to the position of user support specialist to supervise the computer lab and assist students and teachers. The user support specialist must meet the job requirements for the position. High school principals may choose to convert 1.0 formula teacher to the position of teacher, technology coordinator instead of converting an instructional assistant position.

Frederick County Public Schools FY 2018 Operating Budget 144
Informational
Staffing for Charter SchoolsCharter schools are funded via a per-pupil allocation calculated annually based on the approved operating budget. Although charter schools function as semi-independent schools with their own governance and instructional design, educational achievement is measured against the same performance standards used by the local and state boards of education. All school administrators and staff are FCPS employees. Actual staffing for charter schools is determined by their governing boards with consideration given to enrollment, curricular needs, and their operating budget. The chart below reflects staffing for fiscal year 2018.
Carroll Creek Montessori
Frederick Classical
Monocacy Valley Montessori
Administrative Staff
Principal 1.0 1.0 1.0
Assistant Principal 0.0 1.0 1.0
Secretary - 12 month 1.0 1.0 1.0
Administrative Total 2.0 3.0 3.0
Student Support Staff
School Counselor -10 month 0.6 0.8 0.6
Teacher Specialist 1.0 0.0 1.0
Classroom Teacher 11.6 26.1 14.5
Instructional Assistant/User Support Specialist 7.5 0.0 13.3
Student Support Total 20.7 26.9 29.4
FY 2017 staffing as reported by the FCPS Position Control Report as of 8/15/2016.

Frederick County Public Schools FY 2018 Operating Budget145
Informational
Staffing for Other Schools and ProgramsStaffing for these schools is not driven by formula. Positions are allocated to each school based on the unique educational programs, student enrollment, curriculum, and support requirements of the school. A school’s building configuration also impacts staffing at these schools.
Career and Technology
Center
Frederick County Virtual
School*
Heather Ridge School
Rock Creek School
(Special Ed)
Administrative Staff
Principal 1.0 1.0 1.0 1.0
Assistant Principal/Coordinator 1.0 1.0 1.0 1.0
Secretary - 12 month 2.0 2.0 1.0 1.0
Secretary - 10 month 1.0 0.0 1.0 1.0
Administrative Total 5.0 4.0 4.0 4.0
Student Support Staff
School Counselor - 10 month 1.0 1.0 1.0 0.0
Media Specialist 0.0 0.0 0.5 0.5
Teacher Specialist 0.0 2.0 5.0 0.0
Teacher 32.0 0.0 19.5 17.0
Speech Pathologist 0.0 0.0 0.0 2.0
Teacher, Targeted Intervention 0.0 0.0 0.0 0.5
School Therapist 0.0 0.0 4.0 1.0
Instructional Assistant/User Support Specialist 0.0 0.0 1.0 0.0
Special Education Instructional Assistant 3.5 0.0 7.0 1.0
Student Support Total 5.0 0.0 2.0 29.0
* Frederick County Virtual School is operated at Governor Thomas Johnson Middle School
Frederick County Public Schools FY 2018 Operating Budget 146
Informational
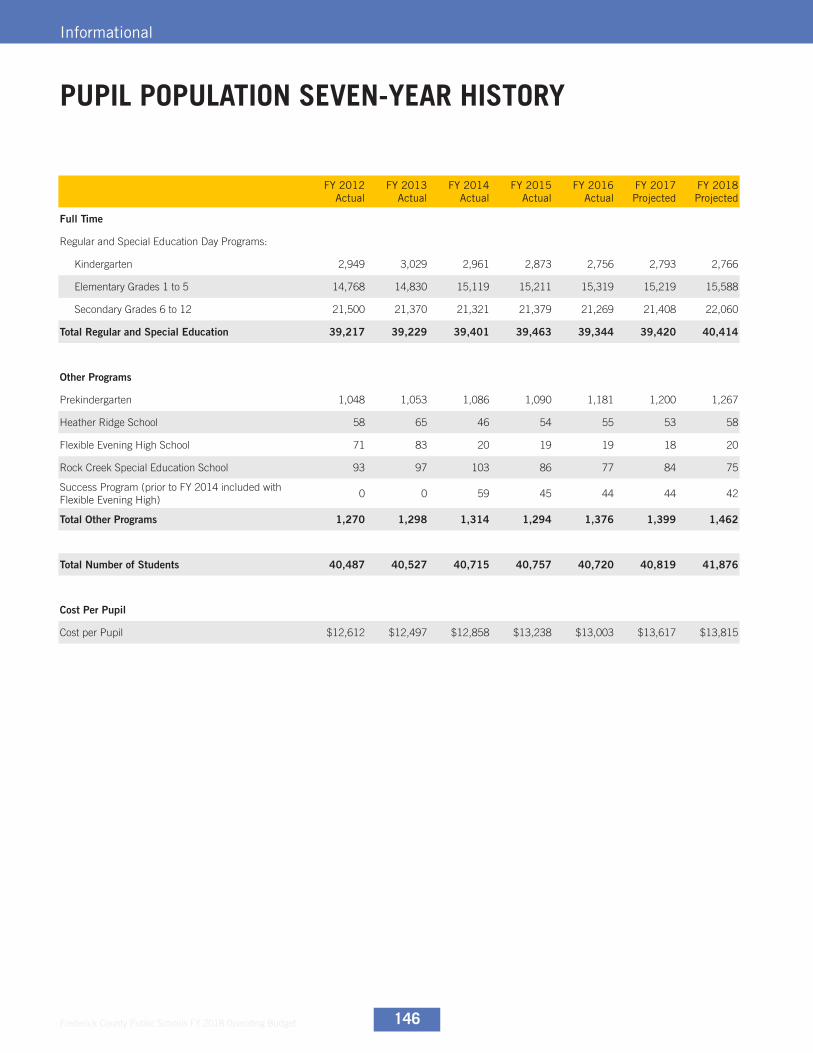
FY 2012 Actual
FY 2013 Actual
FY 2014 Actual
FY 2015 Actual
FY 2016 Actual
FY 2017 Projected
FY 2018 Projected
Full Time
Regular and Special Education Day Programs:
Kindergarten 2,949 3,029 2,961 2,873 2,756 2,793 2,766
Elementary Grades 1 to 5 14,768 14,830 15,119 15,211 15,319 15,219 15,588
Secondary Grades 6 to 12 21,500 21,370 21,321 21,379 21,269 21,408 22,060
Total Regular and Special Education 39,217 39,229 39,401 39,463 39,344 39,420 40,414
Other Programs
Prekindergarten 1,048 1,053 1,086 1,090 1,181 1,200 1,267
Heather Ridge School 58 65 46 54 55 53 58
Flexible Evening High School 71 83 20 19 19 18 20
Rock Creek Special Education School 93 97 103 86 77 84 75
Success Program (prior to FY 2014 included with Flexible Evening High)
0 0 59 45 44 44 42
Total Other Programs 1,270 1,298 1,314 1,294 1,376 1,399 1,462
Total Number of Students 40,487 40,527 40,715 40,757 40,720 40,819 41,876
Cost Per Pupil
Cost per Pupil $12,612 $12,497 $12,858 $13,238 $13,003 $13,617 $13,815
PUPIL POPULATION SEVEN-YEAR HISTORY

Frederick County Public Schools FY 2018 Operating Budget147
Informational
STUDENT ENROLLMENTFCPS enrollments are expected to increase as the county’s general population increases. The projection for FY 2018 anticipates a net increase of 1057 students (including prekindergarten students). These system wide enrollment projections for FY 2018 were approved in December 2016. FCPS projections utilize a “cohort survival method” (a cohort is the total number of students in a particular grade level). This method has three components:
1. Analyze the historical cohort progression from grade to grade. Future cohort progression is then determined based upon historical trends, land development/housing patterns, and pupil-yield trends.
2. Base kindergarten projections on ratios of kindergarten to births five years prior based on data supplied by the Maryland Department of Planning.
3. Determine the countywide total projected enrollment in prekindergarten through grade 12 for any year by totaling each grade’s projected enrollment for all schools.
Frederick County Public Schools FY 2018 Operating Budget 148
Informational
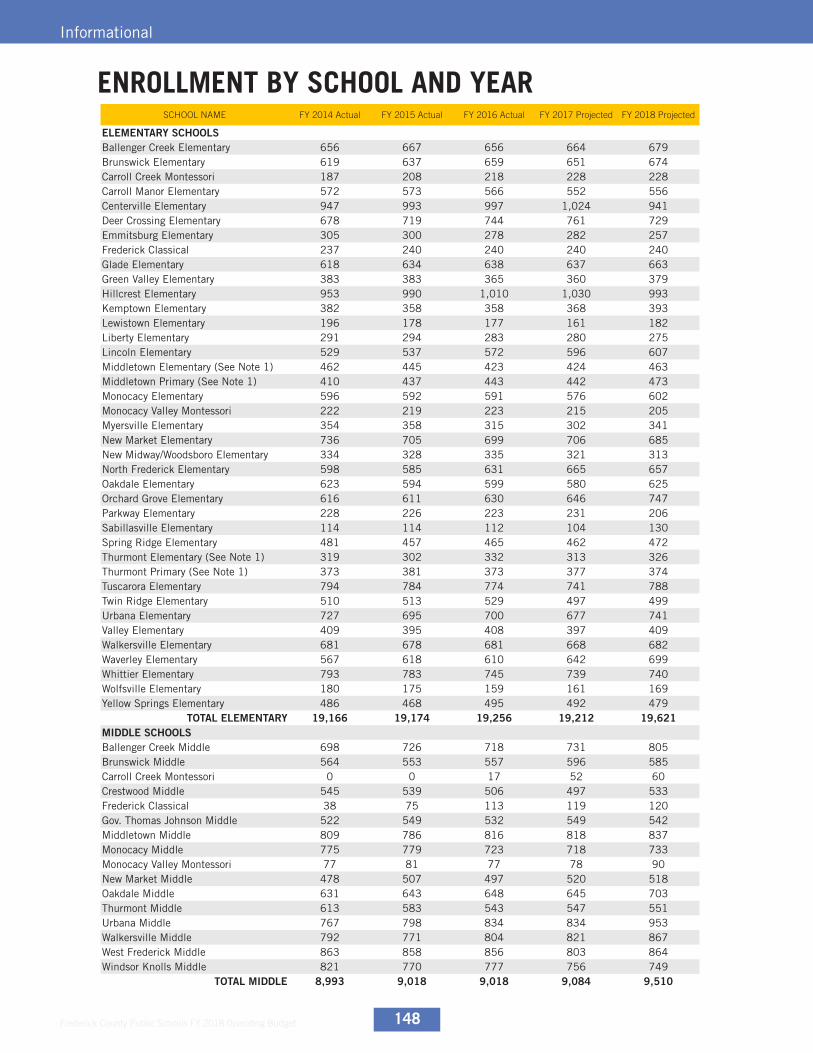
SCHOOL NAME FY 2014 Actual FY 2015 Actual FY 2016 Actual FY 2017 Projected FY 2018 Projected
ELEMENTARY SCHOOLSBallenger Creek Elementary 656 667 656 664 679Brunswick Elementary 619 637 659 651 674Carroll Creek Montessori 187 208 218 228 228Carroll Manor Elementary 572 573 566 552 556Centerville Elementary 947 993 997 1,024 941Deer Crossing Elementary 678 719 744 761 729Emmitsburg Elementary 305 300 278 282 257Frederick Classical 237 240 240 240 240Glade Elementary 618 634 638 637 663Green Valley Elementary 383 383 365 360 379Hillcrest Elementary 953 990 1,010 1,030 993Kemptown Elementary 382 358 358 368 393Lewistown Elementary 196 178 177 161 182Liberty Elementary 291 294 283 280 275Lincoln Elementary 529 537 572 596 607Middletown Elementary (See Note 1) 462 445 423 424 463Middletown Primary (See Note 1) 410 437 443 442 473Monocacy Elementary 596 592 591 576 602Monocacy Valley Montessori 222 219 223 215 205Myersville Elementary 354 358 315 302 341New Market Elementary 736 705 699 706 685New Midway/Woodsboro Elementary 334 328 335 321 313North Frederick Elementary 598 585 631 665 657Oakdale Elementary 623 594 599 580 625Orchard Grove Elementary 616 611 630 646 747Parkway Elementary 228 226 223 231 206Sabillasville Elementary 114 114 112 104 130Spring Ridge Elementary 481 457 465 462 472Thurmont Elementary (See Note 1) 319 302 332 313 326Thurmont Primary (See Note 1) 373 381 373 377 374Tuscarora Elementary 794 784 774 741 788Twin Ridge Elementary 510 513 529 497 499Urbana Elementary 727 695 700 677 741Valley Elementary 409 395 408 397 409Walkersville Elementary 681 678 681 668 682Waverley Elementary 567 618 610 642 699Whittier Elementary 793 783 745 739 740Wolfsville Elementary 180 175 159 161 169Yellow Springs Elementary 486 468 495 492 479
TOTAL ELEMENTARY 19,166 19,174 19,256 19,212 19,621MIDDLE SCHOOLSBallenger Creek Middle 698 726 718 731 805Brunswick Middle 564 553 557 596 585Carroll Creek Montessori 0 0 17 52 60Crestwood Middle 545 539 506 497 533Frederick Classical 38 75 113 119 120Gov. Thomas Johnson Middle 522 549 532 549 542Middletown Middle 809 786 816 818 837Monocacy Middle 775 779 723 718 733Monocacy Valley Montessori 77 81 77 78 90New Market Middle 478 507 497 520 518Oakdale Middle 631 643 648 645 703Thurmont Middle 613 583 543 547 551Urbana Middle 767 798 834 834 953Walkersville Middle 792 771 804 821 867West Frederick Middle 863 858 856 803 864Windsor Knolls Middle 821 770 777 756 749
TOTAL MIDDLE 8,993 9,018 9,018 9,084 9,510
ENROLLMENT BY SCHOOL AND YEAR
Frederick County Public Schools FY 2018 Operating Budget149
Informational
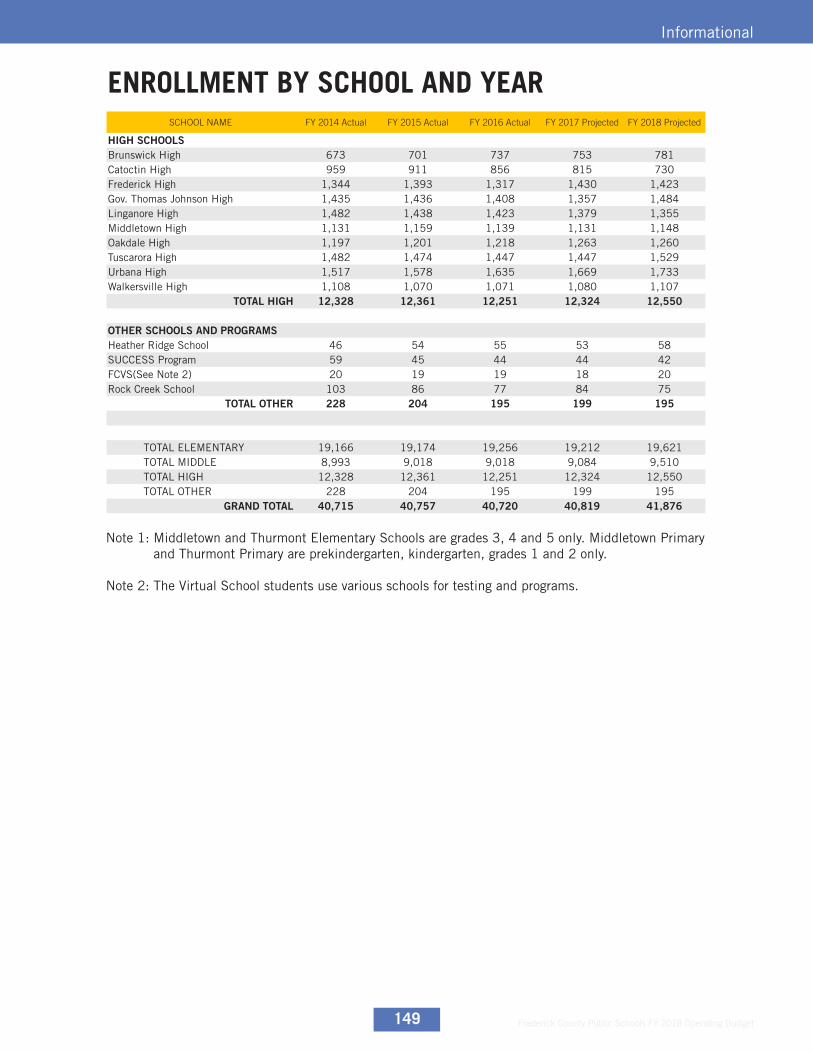
SCHOOL NAME FY 2014 Actual FY 2015 Actual FY 2016 Actual FY 2017 Projected FY 2018 Projected
HIGH SCHOOLSBrunswick High 673 701 737 753 781Catoctin High 959 911 856 815 730Frederick High 1,344 1,393 1,317 1,430 1,423Gov. Thomas Johnson High 1,435 1,436 1,408 1,357 1,484Linganore High 1,482 1,438 1,423 1,379 1,355Middletown High 1,131 1,159 1,139 1,131 1,148Oakdale High 1,197 1,201 1,218 1,263 1,260Tuscarora High 1,482 1,474 1,447 1,447 1,529Urbana High 1,517 1,578 1,635 1,669 1,733Walkersville High 1,108 1,070 1,071 1,080 1,107
TOTAL HIGH 12,328 12,361 12,251 12,324 12,550
OTHER SCHOOLS AND PROGRAMSHeather Ridge School 46 54 55 53 58SUCCESS Program 59 45 44 44 42FCVS(See Note 2) 20 19 19 18 20Rock Creek School 103 86 77 84 75
TOTAL OTHER 228 204 195 199 195
TOTAL ELEMENTARY 19,166 19,174 19,256 19,212 19,621 TOTAL MIDDLE 8,993 9,018 9,018 9,084 9,510 TOTAL HIGH 12,328 12,361 12,251 12,324 12,550 TOTAL OTHER 228 204 195 199 195
GRAND TOTAL 40,715 40,757 40,720 40,819 41,876
Note 1: Middletown and Thurmont Elementary Schools are grades 3, 4 and 5 only. Middletown Primary and Thurmont Primary are prekindergarten, kindergarten, grades 1 and 2 only.
Note 2: The Virtual School students use various schools for testing and programs.
ENROLLMENT BY SCHOOL AND YEAR

Frederick County Public Schools FY 2018 Operating Budget 150
Informational
Frederick County Public Schools FY 2018 Operating Budget151
Informational
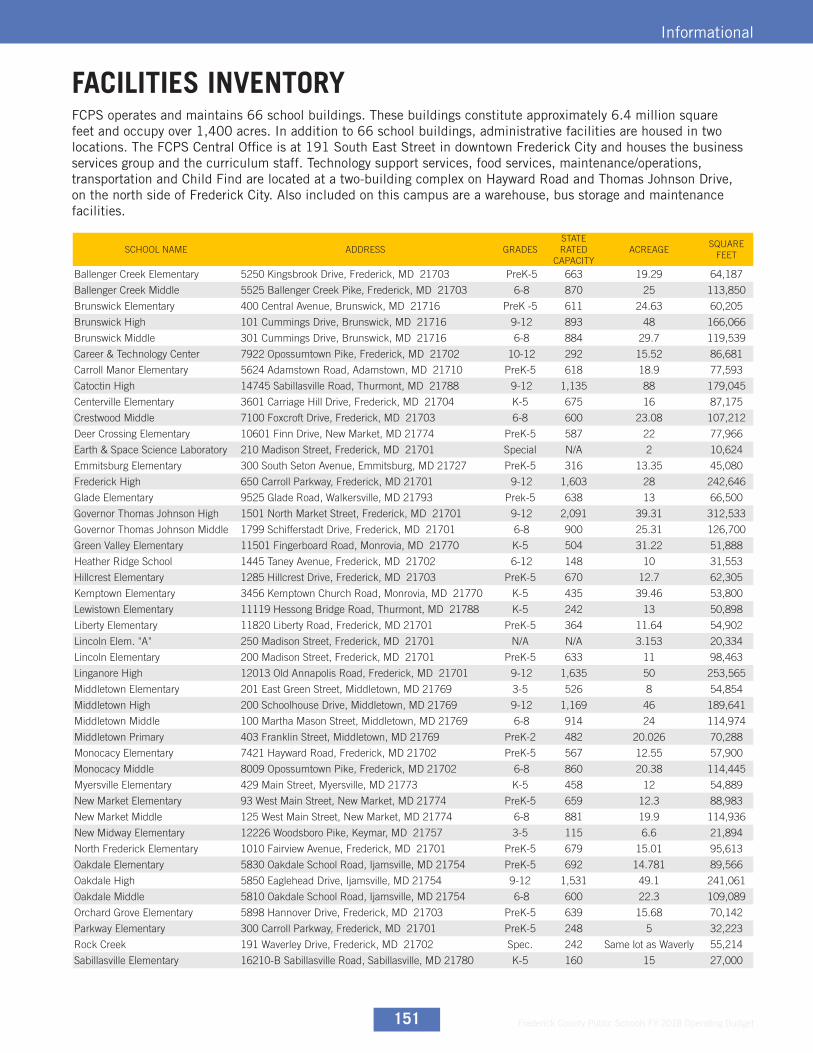
SCHOOL NAME ADDRESS GRADESSTATE RATED
CAPACITYACREAGE
SQUARE FEET
Ballenger Creek Elementary 5250 Kingsbrook Drive, Frederick, MD 21703 PreK-5 663 19.29 64,187
Ballenger Creek Middle 5525 Ballenger Creek Pike, Frederick, MD 21703 6-8 870 25 113,850
Brunswick Elementary 400 Central Avenue, Brunswick, MD 21716 PreK -5 611 24.63 60,205
Brunswick High 101 Cummings Drive, Brunswick, MD 21716 9-12 893 48 166,066
Brunswick Middle 301 Cummings Drive, Brunswick, MD 21716 6-8 884 29.7 119,539
Career & Technology Center 7922 Opossumtown Pike, Frederick, MD 21702 10-12 292 15.52 86,681
Carroll Manor Elementary 5624 Adamstown Road, Adamstown, MD 21710 PreK-5 618 18.9 77,593
Catoctin High 14745 Sabillasville Road, Thurmont, MD 21788 9-12 1,135 88 179,045
Centerville Elementary 3601 Carriage Hill Drive, Frederick, MD 21704 K-5 675 16 87,175
Crestwood Middle 7100 Foxcroft Drive, Frederick, MD 21703 6-8 600 23.08 107,212
Deer Crossing Elementary 10601 Finn Drive, New Market, MD 21774 PreK-5 587 22 77,966
Earth & Space Science Laboratory 210 Madison Street, Frederick, MD 21701 Special N/A 2 10,624
Emmitsburg Elementary 300 South Seton Avenue, Emmitsburg, MD 21727 PreK-5 316 13.35 45,080
Frederick High 650 Carroll Parkway, Frederick, MD 21701 9-12 1,603 28 242,646
Glade Elementary 9525 Glade Road, Walkersville, MD 21793 Prek-5 638 13 66,500
Governor Thomas Johnson High 1501 North Market Street, Frederick, MD 21701 9-12 2,091 39.31 312,533
Governor Thomas Johnson Middle 1799 Schifferstadt Drive, Frederick, MD 21701 6-8 900 25.31 126,700
Green Valley Elementary 11501 Fingerboard Road, Monrovia, MD 21770 K-5 504 31.22 51,888
Heather Ridge School 1445 Taney Avenue, Frederick, MD 21702 6-12 148 10 31,553
Hillcrest Elementary 1285 Hillcrest Drive, Frederick, MD 21703 PreK-5 670 12.7 62,305
Kemptown Elementary 3456 Kemptown Church Road, Monrovia, MD 21770 K-5 435 39.46 53,800
Lewistown Elementary 11119 Hessong Bridge Road, Thurmont, MD 21788 K-5 242 13 50,898
Liberty Elementary 11820 Liberty Road, Frederick, MD 21701 PreK-5 364 11.64 54,902
Lincoln Elem. "A" 250 Madison Street, Frederick, MD 21701 N/A N/A 3.153 20,334
Lincoln Elementary 200 Madison Street, Frederick, MD 21701 PreK-5 633 11 98,463
Linganore High 12013 Old Annapolis Road, Frederick, MD 21701 9-12 1,635 50 253,565
Middletown Elementary 201 East Green Street, Middletown, MD 21769 3-5 526 8 54,854
Middletown High 200 Schoolhouse Drive, Middletown, MD 21769 9-12 1,169 46 189,641
Middletown Middle 100 Martha Mason Street, Middletown, MD 21769 6-8 914 24 114,974
Middletown Primary 403 Franklin Street, Middletown, MD 21769 PreK-2 482 20.026 70,288
Monocacy Elementary 7421 Hayward Road, Frederick, MD 21702 PreK-5 567 12.55 57,900
Monocacy Middle 8009 Opossumtown Pike, Frederick, MD 21702 6-8 860 20.38 114,445
Myersville Elementary 429 Main Street, Myersville, MD 21773 K-5 458 12 54,889
New Market Elementary 93 West Main Street, New Market, MD 21774 PreK-5 659 12.3 88,983
New Market Middle 125 West Main Street, New Market, MD 21774 6-8 881 19.9 114,936
New Midway Elementary 12226 Woodsboro Pike, Keymar, MD 21757 3-5 115 6.6 21,894
North Frederick Elementary 1010 Fairview Avenue, Frederick, MD 21701 PreK-5 679 15.01 95,613
Oakdale Elementary 5830 Oakdale School Road, Ijamsville, MD 21754 PreK-5 692 14.781 89,566
Oakdale High 5850 Eaglehead Drive, Ijamsville, MD 21754 9-12 1,531 49.1 241,061
Oakdale Middle 5810 Oakdale School Road, Ijamsville, MD 21754 6-8 600 22.3 109,089
Orchard Grove Elementary 5898 Hannover Drive, Frederick, MD 21703 PreK-5 639 15.68 70,142
Parkway Elementary 300 Carroll Parkway, Frederick, MD 21701 PreK-5 248 5 32,223
Rock Creek 191 Waverley Drive, Frederick, MD 21702 Spec. 242 Same lot as Waverly 55,214
Sabillasville Elementary 16210-B Sabillasville Road, Sabillasville, MD 21780 K-5 160 15 27,000
FACILITIES INVENTORYFCPS operates and maintains 66 school buildings. These buildings constitute approximately 6.4 million square feet and occupy over 1,400 acres. In addition to 66 school buildings, administrative facilities are housed in two locations. The FCPS Central Office is at 191 South East Street in downtown Frederick City and houses the business services group and the curriculum staff. Technology support services, food services, maintenance/operations, transportation and Child Find are located at a two-building complex on Hayward Road and Thomas Johnson Drive, on the north side of Frederick City. Also included on this campus are a warehouse, bus storage and maintenance facilities.

Frederick County Public Schools FY 2018 Operating Budget 152
Informational
SCHOOL NAME ADDRESS GRADESSTATE RATED
CAPACITYACREAGE
SQUARE FEET
Spring Ridge Elementary 9051 Ridgefield Drive, Frederick, MD 21701 PreK-5 577 20 66,276
Thurmont Elementary 805 East Main Street, Thurmont, MD 21788 3-5 483 15.31 64,250
Thurmont Middle 408 East Main Street, Thurmont, MD 21788 6-8 900 13 135,260
Thurmont Primary 7989 Rocky Ridge Road, Thurmont, MD 21788 PreK-2 528 13.47 66,334
Tuscarora Elementary 6321 Lambert Drive, Frederick, MD 21703 K-5 662 13 86,938
Tuscarora High 5312 Ballenger Creek Pike, Frederick, MD 21703 9-12 1,606 46.49 257,062
Twin Ridge Elementary 1106 Leafy Hollow Circle, Mount Airy, MD 21771 PreK-5 674 17 68,900
Urbana Elementary 3554 Urbana Pike, Frederick, MD 21704 PreK-5 511 19.87 64,133
Urbana High 3471 Campus Drive, Ijamsville, MD 21754 9-12 1,636 59.7 249,609
Urbana Middle 3511 Pontius Court, Ijamsville, MD 21754 6-8 900 26.18 125,049
Valley Elementary 3519 Jefferson Pike, Jefferson, MD 21755 PreK-5 504 31.71 59,989
Walkersville “B” 44 West Frederick Street, Walkersville, MD 21793 N/A NA 5 27,352
Walkersville Elementary 83 West Frederick Street, Walkersville, MD 21793 K-5 662 15 89,514
Walkersville High 81 West Frederick Street, Walkersville, MD 21793 9-12 1,197 35 181,416
Walkersville Middle 55 West Frederick Street, Walkersville, MD 21793 6-8 1,051 28.68 119,353
Waverley Elementary 201 Waverley Drive, Frederick, MD 21702 PreK-5 416 18.17 54,178
West Frederick Middle 515 West Patrick Street, Frederick, MD 21701 6-8 955 12 166,439
Whittier Elementary 2400 Whittier Drive, Frederick, MD 21702 PreK-5 671 10.126 81,244
Windsor Knolls Middle 11150 Windsor Road, Ijamsville, MD 21754 6-8 924 57 116,644
Wolfsville Elementary 12520 Wolfsville Road, Myersville, MD 21773 PreK-5 226 14 41,657
Woodsboro Elementary 101 Liberty Road, Woodsboro, MD 21798 PreK-2 225 5 28,557
Yellow Springs Elementary 8717 Yellow Springs Road, Frederick, MD 21702 K-5 456 17 52,600
FACILITIES INVENTORY (CONTINUED)
Frederick County Public Schools FY 2018 Operating Budget153
Informational
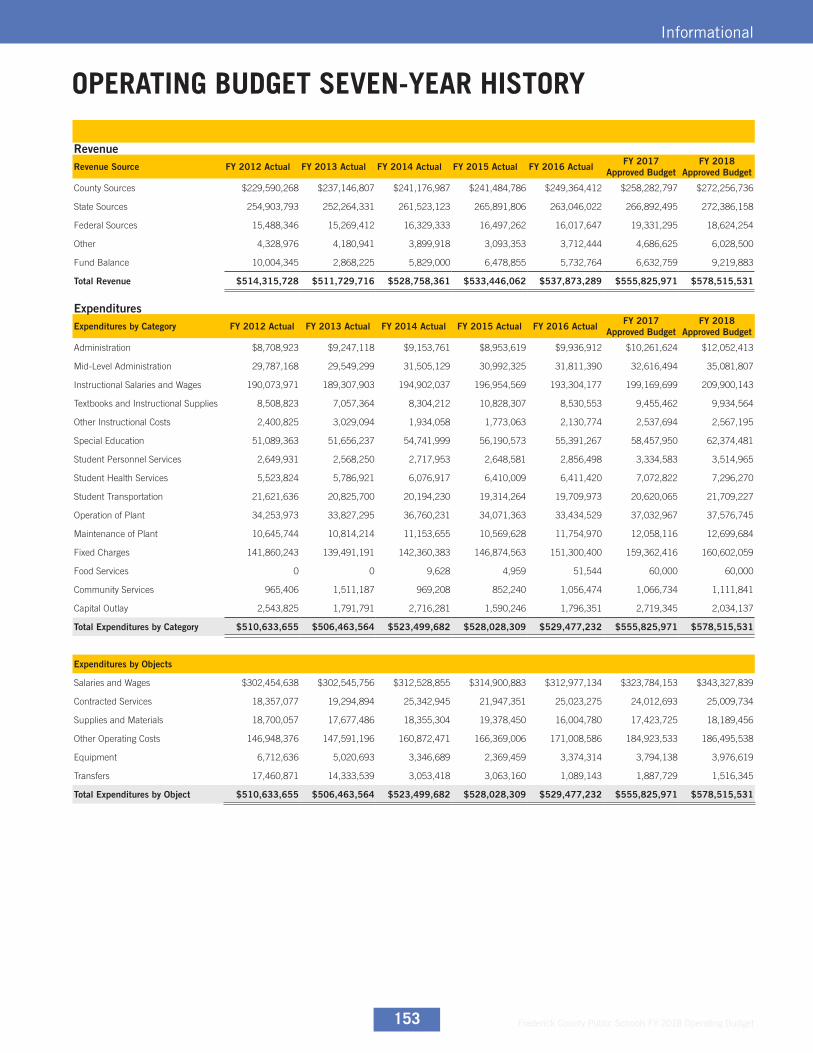
RevenueRevenue Source FY 2012 Actual FY 2013 Actual FY 2014 Actual FY 2015 Actual FY 2016 Actual FY 2017
Approved BudgetFY 2018
Approved Budget
County Sources $229,590,268 $237,146,807 $241,176,987 $241,484,786 $249,364,412 $258,282,797 $272,256,736
State Sources 254,903,793 252,264,331 261,523,123 265,891,806 263,046,022 266,892,495 272,386,158
Federal Sources 15,488,346 15,269,412 16,329,333 16,497,262 16,017,647 19,331,295 18,624,254
Other 4,328,976 4,180,941 3,899,918 3,093,353 3,712,444 4,686,625 6,028,500
Fund Balance 10,004,345 2,868,225 5,829,000 6,478,855 5,732,764 6,632,759 9,219,883
Total Revenue $514,315,728 $511,729,716 $528,758,361 $533,446,062 $537,873,289 $555,825,971 $578,515,531
ExpendituresExpenditures by Category FY 2012 Actual FY 2013 Actual FY 2014 Actual FY 2015 Actual FY 2016 Actual FY 2017
Approved BudgetFY 2018
Approved Budget
Administration $8,708,923 $9,247,118 $9,153,761 $8,953,619 $9,936,912 $10,261,624 $12,052,413
Mid-Level Administration 29,787,168 29,549,299 31,505,129 30,992,325 31,811,390 32,616,494 35,081,807
Instructional Salaries and Wages 190,073,971 189,307,903 194,902,037 196,954,569 193,304,177 199,169,699 209,900,143
Textbooks and Instructional Supplies 8,508,823 7,057,364 8,304,212 10,828,307 8,530,553 9,455,462 9,934,564
Other Instructional Costs 2,400,825 3,029,094 1,934,058 1,773,063 2,130,774 2,537,694 2,567,195
Special Education 51,089,363 51,656,237 54,741,999 56,190,573 55,391,267 58,457,950 62,374,481
Student Personnel Services 2,649,931 2,568,250 2,717,953 2,648,581 2,856,498 3,334,583 3,514,965
Student Health Services 5,523,824 5,786,921 6,076,917 6,410,009 6,411,420 7,072,822 7,296,270
Student Transportation 21,621,636 20,825,700 20,194,230 19,314,264 19,709,973 20,620,065 21,709,227
Operation of Plant 34,253,973 33,827,295 36,760,231 34,071,363 33,434,529 37,032,967 37,576,745
Maintenance of Plant 10,645,744 10,814,214 11,153,655 10,569,628 11,754,970 12,058,116 12,699,684
Fixed Charges 141,860,243 139,491,191 142,360,383 146,874,563 151,300,400 159,362,416 160,602,059
Food Services 0 0 9,628 4,959 51,544 60,000 60,000
Community Services 965,406 1,511,187 969,208 852,240 1,056,474 1,066,734 1,111,841
Capital Outlay 2,543,825 1,791,791 2,716,281 1,590,246 1,796,351 2,719,345 2,034,137
Total Expenditures by Category $510,633,655 $506,463,564 $523,499,682 $528,028,309 $529,477,232 $555,825,971 $578,515,531
Expenditures by Objects
Salaries and Wages $302,454,638 $302,545,756 $312,528,855 $314,900,883 $312,977,134 $323,784,153 $343,327,839
Contracted Services 18,357,077 19,294,894 25,342,945 21,947,351 25,023,275 24,012,693 25,009,734
Supplies and Materials 18,700,057 17,677,486 18,355,304 19,378,450 16,004,780 17,423,725 18,189,456
Other Operating Costs 146,948,376 147,591,196 160,872,471 166,369,006 171,008,586 184,923,533 186,495,538
Equipment 6,712,636 5,020,693 3,346,689 2,369,459 3,374,314 3,794,138 3,976,619
Transfers 17,460,871 14,333,539 3,053,418 3,063,160 1,089,143 1,887,729 1,516,345
Total Expenditures by Object $510,633,655 $506,463,564 $523,499,682 $528,028,309 $529,477,232 $555,825,971 $578,515,531
OPERATING BUDGET SEVEN-YEAR HISTORY
Frederick County Public Schools FY 2018 Operating Budget 154
Informational
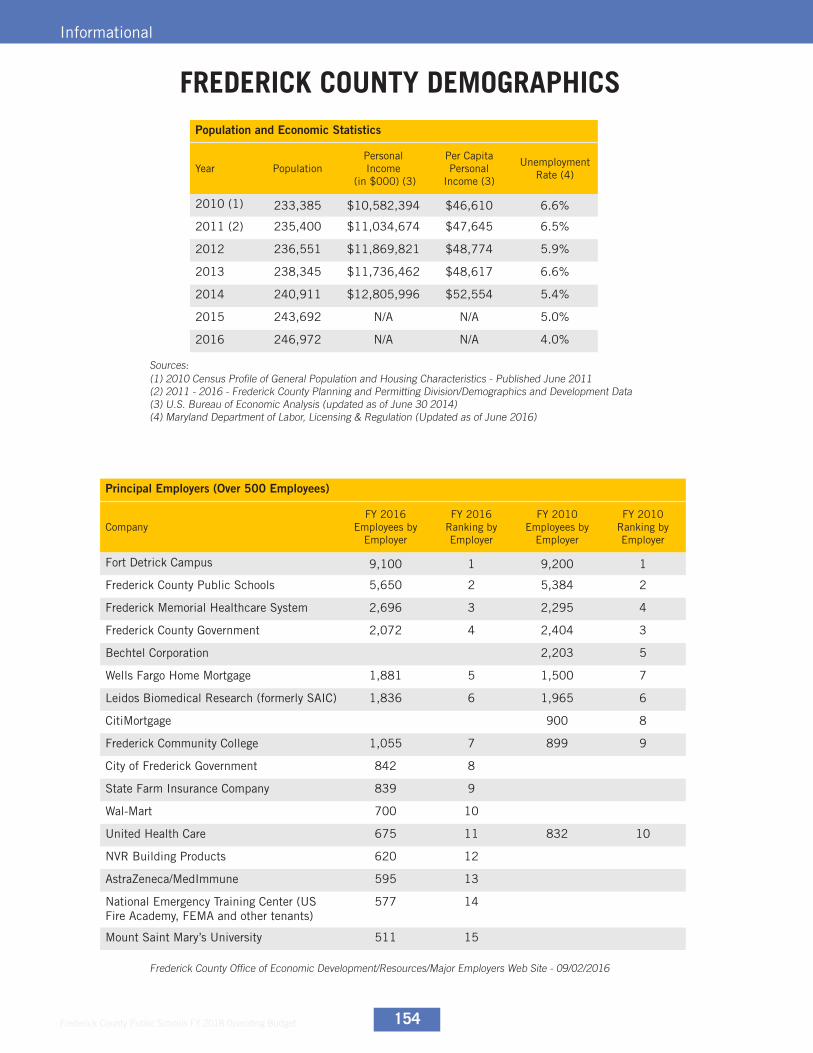
FREDERICK COUNTY DEMOGRAPHICSPopulation and Economic Statistics
Year PopulationPersonal Income
(in $000) (3)
Per Capita Personal
Income (3)
Unemployment Rate (4)
2010 (1) 233,385 $10,582,394 $46,610 6.6%
2011 (2) 235,400 $11,034,674 $47,645 6.5%
2012 236,551 $11,869,821 $48,774 5.9%
2013 238,345 $11,736,462 $48,617 6.6%
2014 240,911 $12,805,996 $52,554 5.4%
2015 243,692 N/A N/A 5.0%
2016 246,972 N/A N/A 4.0%
Principal Employers (Over 500 Employees)
CompanyFY 2016
Employees by Employer
FY 2016 Ranking by Employer
FY 2010 Employees by
Employer
FY 2010 Ranking by Employer
Fort Detrick Campus 9,100 1 9,200 1
Frederick County Public Schools 5,650 2 5,384 2
Frederick Memorial Healthcare System 2,696 3 2,295 4
Frederick County Government 2,072 4 2,404 3
Bechtel Corporation 2,203 5
Wells Fargo Home Mortgage 1,881 5 1,500 7
Leidos Biomedical Research (formerly SAIC) 1,836 6 1,965 6
CitiMortgage 900 8
Frederick Community College 1,055 7 899 9
City of Frederick Government 842 8
State Farm Insurance Company 839 9
Wal-Mart 700 10
United Health Care 675 11 832 10
NVR Building Products 620 12
AstraZeneca/MedImmune 595 13
National Emergency Training Center (US Fire Academy, FEMA and other tenants)
577 14
Mount Saint Mary’s University 511 15
(1) 2010 Census Profile of General Population and Housing Characteristics - Published June 2011(2) 2011 - 2016 - Frederick County Planning and Permitting Division/Demographics and Development Data(3) U.S. Bureau of Economic Analysis (updated as of June 30 2014)(4) Maryland Department of Labor, Licensing & Regulation (Updated as of June 2016)
Sources:
Frederick County Office of Economic Development/Resources/Major Employers Web Site - 09/02/2016
Frederick County Public Schools FY 2018 Operating Budget155
Informational
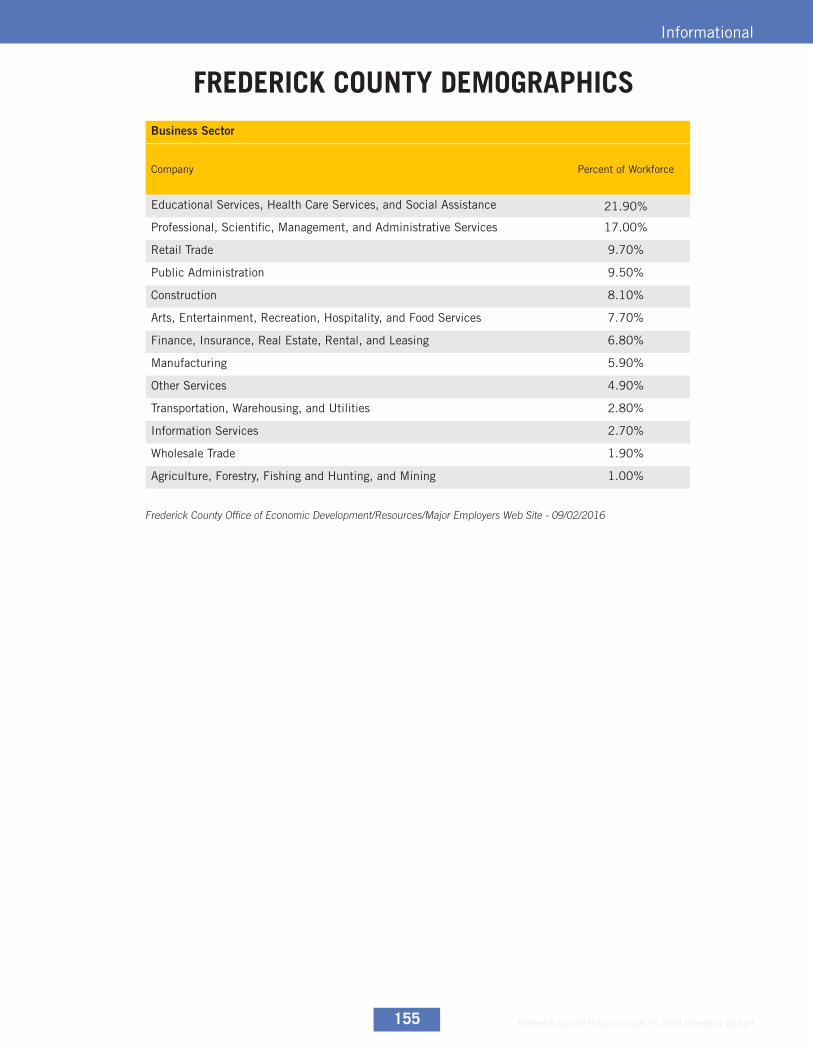
Business Sector
Company Percent of Workforce
Educational Services, Health Care Services, and Social Assistance 21.90%
Professional, Scientific, Management, and Administrative Services 17.00%
Retail Trade 9.70%
Public Administration 9.50%
Construction 8.10%
Arts, Entertainment, Recreation, Hospitality, and Food Services 7.70%
Finance, Insurance, Real Estate, Rental, and Leasing 6.80%
Manufacturing 5.90%
Other Services 4.90%
Transportation, Warehousing, and Utilities 2.80%
Information Services 2.70%
Wholesale Trade 1.90%
Agriculture, Forestry, Fishing and Hunting, and Mining 1.00%
FREDERICK COUNTY DEMOGRAPHICS
Frederick County Office of Economic Development/Resources/Major Employers Web Site - 09/02/2016

Frederick County Public Schools FY 2018 Operating Budget 156
Informational
Frederick County Public Schools FY 2018 Operating Budget157
Informational
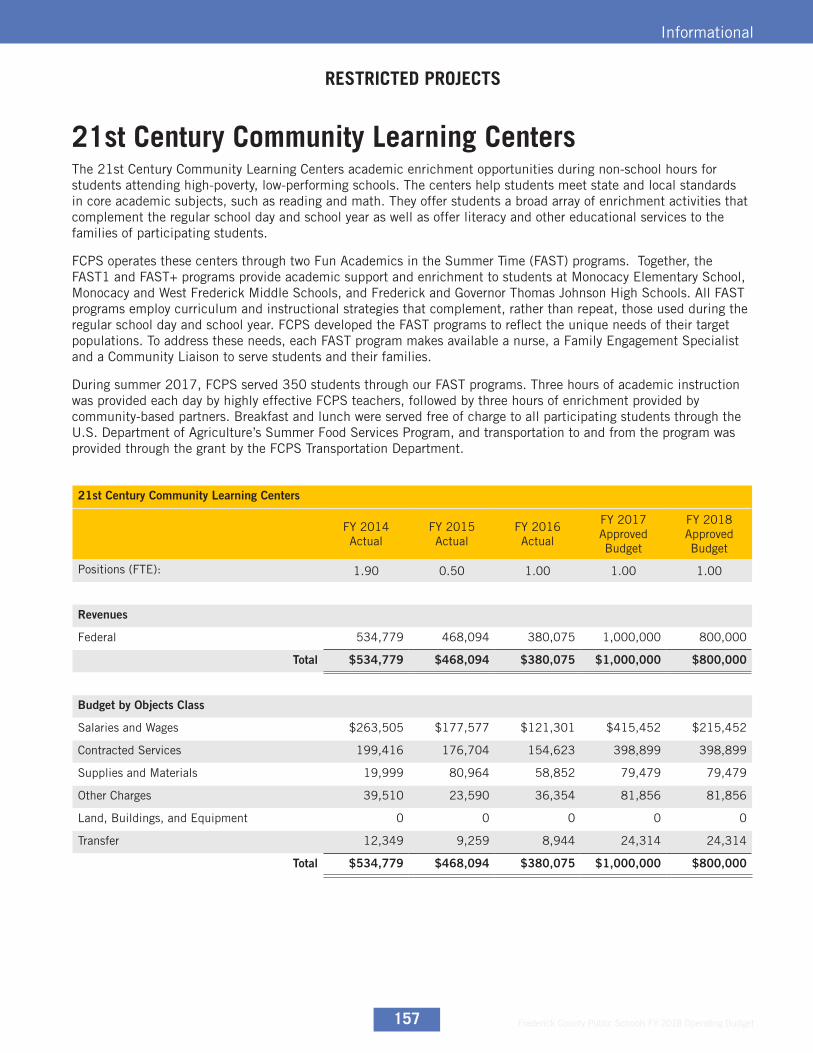
The 21st Century Community Learning Centers academic enrichment opportunities during non-school hours for students attending high-poverty, low-performing schools. The centers help students meet state and local standards in core academic subjects, such as reading and math. They offer students a broad array of enrichment activities that complement the regular school day and school year as well as offer literacy and other educational services to the families of participating students.
FCPS operates these centers through two Fun Academics in the Summer Time (FAST) programs. Together, the FAST1 and FAST+ programs provide academic support and enrichment to students at Monocacy Elementary School, Monocacy and West Frederick Middle Schools, and Frederick and Governor Thomas Johnson High Schools. All FAST programs employ curriculum and instructional strategies that complement, rather than repeat, those used during the regular school day and school year. FCPS developed the FAST programs to reflect the unique needs of their target populations. To address these needs, each FAST program makes available a nurse, a Family Engagement Specialist and a Community Liaison to serve students and their families.
During summer 2017, FCPS served 350 students through our FAST programs. Three hours of academic instruction was provided each day by highly effective FCPS teachers, followed by three hours of enrichment provided by community-based partners. Breakfast and lunch were served free of charge to all participating students through the U.S. Department of Agriculture’s Summer Food Services Program, and transportation to and from the program was provided through the grant by the FCPS Transportation Department.
21st Century Community Learning Centers
FY 2014 Actual
FY 2015 Actual
FY 2016 Actual
FY 2017 Approved Budget
FY 2018 Approved Budget
Positions (FTE): 1.90 0.50 1.00 1.00 1.00
Revenues
Federal 534,779 468,094 380,075 1,000,000 800,000
Total $534,779 $468,094 $380,075 $1,000,000 $800,000
Budget by Objects Class
Salaries and Wages $263,505 $177,577 $121,301 $415,452 $215,452
Contracted Services 199,416 176,704 154,623 398,899 398,899
Supplies and Materials 19,999 80,964 58,852 79,479 79,479
Other Charges 39,510 23,590 36,354 81,856 81,856
Land, Buildings, and Equipment 0 0 0 0 0
Transfer 12,349 9,259 8,944 24,314 24,314
Total $534,779 $468,094 $380,075 $1,000,000 $800,000
21st Century Community Learning Centers
RESTRICTED PROJECTS
Frederick County Public Schools FY 2018 Operating Budget 158
Informational
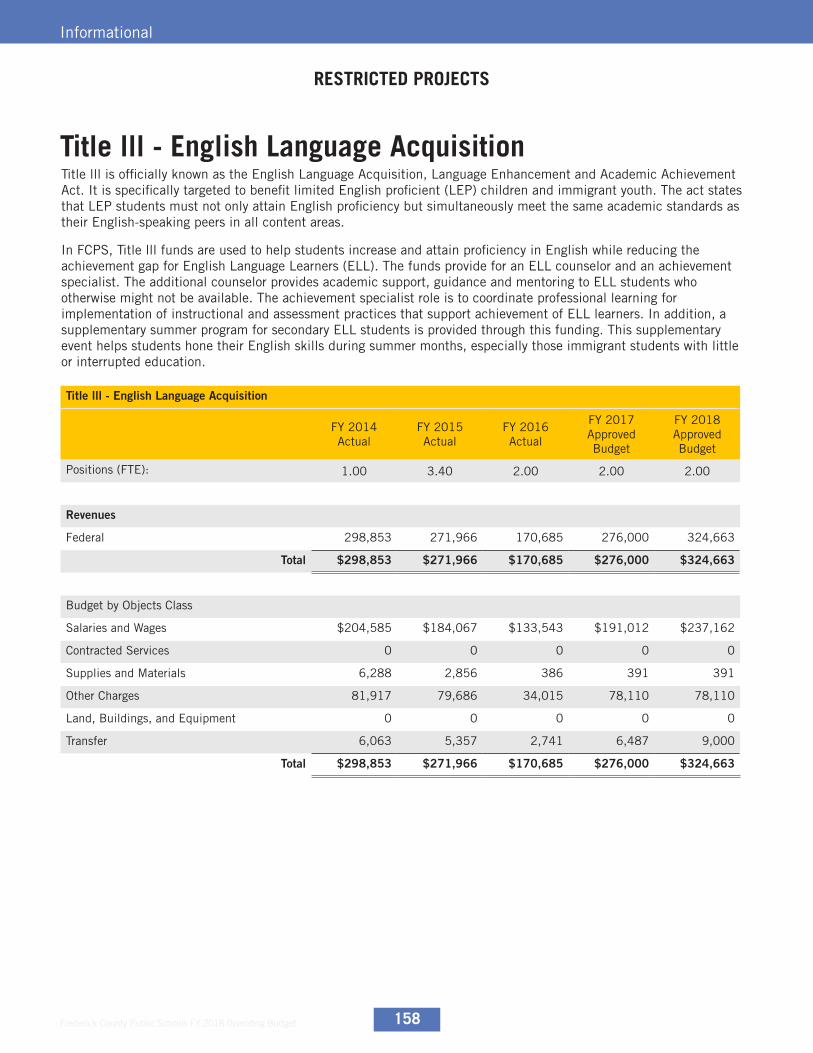
Title lll is officially known as the English Language Acquisition, Language Enhancement and Academic Achievement Act. It is specifically targeted to benefit limited English proficient (LEP) children and immigrant youth. The act states that LEP students must not only attain English proficiency but simultaneously meet the same academic standards as their English-speaking peers in all content areas.
In FCPS, Title lll funds are used to help students increase and attain proficiency in English while reducing the achievement gap for English Language Learners (ELL). The funds provide for an ELL counselor and an achievement specialist. The additional counselor provides academic support, guidance and mentoring to ELL students who otherwise might not be available. The achievement specialist role is to coordinate professional learning for implementation of instructional and assessment practices that support achievement of ELL learners. In addition, a supplementary summer program for secondary ELL students is provided through this funding. This supplementary event helps students hone their English skills during summer months, especially those immigrant students with little or interrupted education.
Title lll - English Language Acquisition
FY 2014 Actual
FY 2015 Actual
FY 2016 Actual
FY 2017 Approved Budget
FY 2018 Approved Budget
Positions (FTE): 1.00 3.40 2.00 2.00 2.00
Revenues
Federal 298,853 271,966 170,685 276,000 324,663
Total $298,853 $271,966 $170,685 $276,000 $324,663
Budget by Objects Class
Salaries and Wages $204,585 $184,067 $133,543 $191,012 $237,162
Contracted Services 0 0 0 0 0
Supplies and Materials 6,288 2,856 386 391 391
Other Charges 81,917 79,686 34,015 78,110 78,110
Land, Buildings, and Equipment 0 0 0 0 0
Transfer 6,063 5,357 2,741 6,487 9,000
Total $298,853 $271,966 $170,685 $276,000 $324,663
Title lll - English Language Acquisition
RESTRICTED PROJECTS

Frederick County Public Schools FY 2018 Operating Budget159
Informational
Title l, Part A (Title l) is part of the Elementary and Secondary Education Act, currently authorized as the Every Student Succeeds Act (ESSA). This federal program provides financial assistance to schools with high percentage of disadvantaged students. All Title l activities must align to the school’s Continuous Strategic Improvement Plan and may include, but is not limited to, additional staffing, extended-day learning opportunities, family involvement, professional learning, supplemental instructional materials and technology.
Title l schools conduct one of two models: Targeted Assistance or Schoolwide. In Target Assistance model, a select group of students who are at risk of not meeting grade level standards receive supplemental support through Title l supported activities and resources. The Schoolwide program supports the learning of all students at the identified school. In this program model, all students at the school benefit from Title l supported staffing, resources and training. In the 2017-2018 school year, all FCPS Title l schools will conduct Schoolwide programs.
Participation in the Title l program is determined by a school’s percentage of students who are eligible for Free or Reduced Priced Meals. In the 2017-2018 school year, the Title l program will support approximately 2,500 students in five elementary schools who have a free or reduced meal participation rate of at least 50 percent. The elementary schools are: Hillcrest, Lincoln, Monocacy, North Frederick and Waverley.
Title lll - English Language Acquisition
FY 2014 Actual
FY 2015 Actual
FY 2016 Actual
FY 2017 Approved Budget
FY 2018 Approved Budget
Positions (FTE): 61.96 65.63 71.50 66.00 70.00
Revenues
Federal 3,750,096 4,135,632 4,079,434 4,388,472 4,215,958
Total $3,750,096 $4,135,632 $4,079,434 $4,388,472 $4,215,958
Budget by Objects Class
Salaries and Wages $2,593,730 $2,839,779 $2,906,296 $3,012,096 $3,095,095
Contracted Services 1,355 1,125 1,125 0 0
Supplies and Materials 377,287 334,962 209,722 403,472 246,550
Other Charges 1,147,940 1,302,237 1,320,747 1,368,613 1,306,016
Land, Buildings, and Equipment 0 0 0 0 0
Transfer -370,216 -342,471 -358,457 -395,709 -431,703
Total $3,750,096 $4,135,632 $4,079,434 $4,388,472 $4,215,958
Title l - Part A, Accept & Challenge
RESTRICTED PROJECTS
Frederick County Public Schools FY 2018 Operating Budget 160
Informational
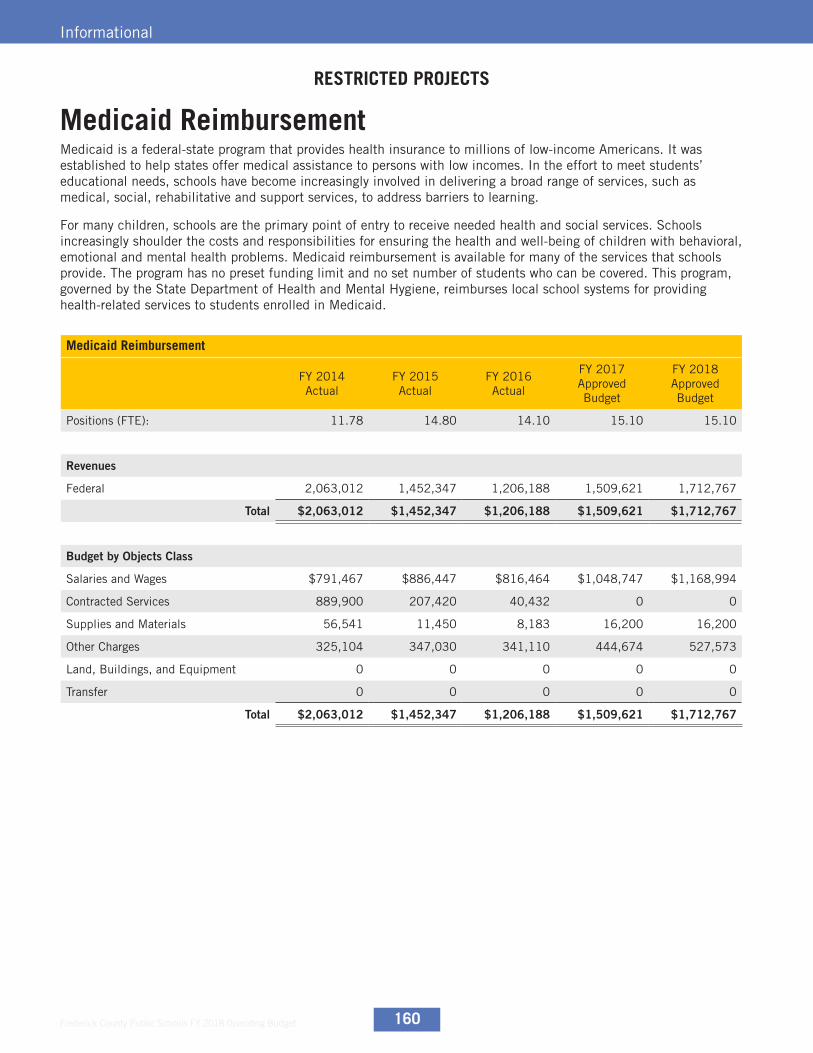
Medicaid is a federal-state program that provides health insurance to millions of low-income Americans. It was established to help states offer medical assistance to persons with low incomes. In the effort to meet students’ educational needs, schools have become increasingly involved in delivering a broad range of services, such as medical, social, rehabilitative and support services, to address barriers to learning.
For many children, schools are the primary point of entry to receive needed health and social services. Schools increasingly shoulder the costs and responsibilities for ensuring the health and well-being of children with behavioral, emotional and mental health problems. Medicaid reimbursement is available for many of the services that schools provide. The program has no preset funding limit and no set number of students who can be covered. This program, governed by the State Department of Health and Mental Hygiene, reimburses local school systems for providing health-related services to students enrolled in Medicaid.
Medicaid Reimbursement
FY 2014 Actual
FY 2015 Actual
FY 2016 Actual
FY 2017 Approved Budget
FY 2018 Approved Budget
Positions (FTE): 11.78 14.80 14.10 15.10 15.10
Revenues
Federal 2,063,012 1,452,347 1,206,188 1,509,621 1,712,767
Total $2,063,012 $1,452,347 $1,206,188 $1,509,621 $1,712,767
Budget by Objects Class
Salaries and Wages $791,467 $886,447 $816,464 $1,048,747 $1,168,994
Contracted Services 889,900 207,420 40,432 0 0
Supplies and Materials 56,541 11,450 8,183 16,200 16,200
Other Charges 325,104 347,030 341,110 444,674 527,573
Land, Buildings, and Equipment 0 0 0 0 0
Transfer 0 0 0 0 0
Total $2,063,012 $1,452,347 $1,206,188 $1,509,621 $1,712,767
Medicaid Reimbursement
RESTRICTED PROJECTS

Frederick County Public Schools FY 2018 Operating Budget161
Informational
It is estimated that 13% of children in the United States have a disability. The Individual with Disabilities Education Act (IDEA) mandates the provision of a free and appropriate public school education for eligible children and youth through early intervention and special education services. Eligible children and youth receive special education and related services to address the disability that adversely affects academic and functional performance.
IDEA has several key requirements: 1) Local school districts must offer free appropriate public education to all children with disabilities age 3 through 21 years; 2) School districts must identify, locate and evaluate all children with disabilities; 3) Each child with a disability who is deemed eligible will receive an individualized education program (IEP;) 4) Children with disabilities must be educated with children without disabilities “to maximum extent possible;” 5) Procedural safeguards must be put in place for children and their families; 6) Schools must collaborate with parents and students with disabilities in the design and implementation of special education services.
The Department of Special Education and Psychological Services serves FCPS by supporting systemic instructional programming focusing on eliminating the achievement gap, developing social competencies, nurturing independence and preparing student with disabilities to become contributing members of a global society. These grant funds are for the purposes of initiating, expanding and improving programs and project for the education of students with disabilities at the elementary and secondary levels in their least restrictive environment. The funds will support the salaries of school therapists, special education instructional assistants, an early intervention coordinator and a system community liaison.
IDEA Part B, Section 611 Passthrough - Education of the Handicapped
FY 2014 Actual FY 2015 Actual FY 2016 ActualFY 2017 Approved Budget
FY 2018 Approved Budget
Positions (FTE): 235.80 256.30 200.60 203.80 204.00
Revenues
Federal 6,857,411 7,187,789 7,139,195 7,358,905 7,343,960
Total $6,857,411 $7,187,789 $7,139,195 $7,358,905 $7,343,960
Budget by Objects Class
Salaries and Wages $6,473,282 $6,970,045 $5,532,611 $6,020,686 $5,916,578
Contracted Services 1,000 1,000 1,000 1,000 1,000
Supplies and Materials 0 0 0 0 0
Other Charges 3,190,281 3,767,728 1,631,008 1,771,724 1,860,887
Land, Buildings, and Equipment 0 0 0 0 0
Transfer -2,807,152 -3,550,984 -25,424 -434,505 -434,505
Total $6,857,411 $7,187,789 $7,139,195 $7,358,905 $7,343,960
IDEA Part B, Section 611 Passthrough - Education of the Handicapped
RESTRICTED PROJECTS
Frederick County Public Schools FY 2018 Operating Budget 162
Informational
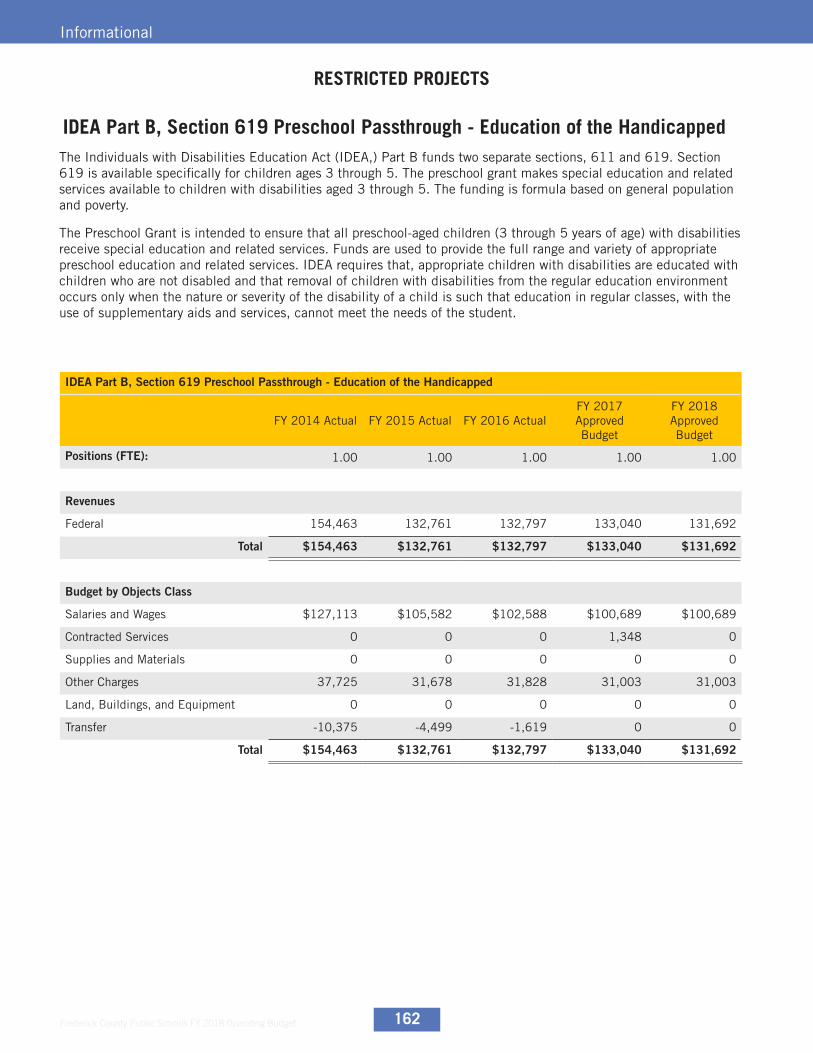
The Individuals with Disabilities Education Act (IDEA,) Part B funds two separate sections, 611 and 619. Section 619 is available specifically for children ages 3 through 5. The preschool grant makes special education and related services available to children with disabilities aged 3 through 5. The funding is formula based on general population and poverty.
The Preschool Grant is intended to ensure that all preschool-aged children (3 through 5 years of age) with disabilities receive special education and related services. Funds are used to provide the full range and variety of appropriate preschool education and related services. IDEA requires that, appropriate children with disabilities are educated with children who are not disabled and that removal of children with disabilities from the regular education environment occurs only when the nature or severity of the disability of a child is such that education in regular classes, with the use of supplementary aids and services, cannot meet the needs of the student.
IDEA Part B, Section 619 Preschool Passthrough - Education of the Handicapped
FY 2014 Actual FY 2015 Actual FY 2016 ActualFY 2017 Approved Budget
FY 2018 Approved Budget
Positions (FTE): 1.00 1.00 1.00 1.00 1.00
Revenues
Federal 154,463 132,761 132,797 133,040 131,692
Total $154,463 $132,761 $132,797 $133,040 $131,692
Budget by Objects Class
Salaries and Wages $127,113 $105,582 $102,588 $100,689 $100,689
Contracted Services 0 0 0 1,348 0
Supplies and Materials 0 0 0 0 0
Other Charges 37,725 31,678 31,828 31,003 31,003
Land, Buildings, and Equipment 0 0 0 0 0
Transfer -10,375 -4,499 -1,619 0 0
Total $154,463 $132,761 $132,797 $133,040 $131,692
IDEA Part B, Section 619 Preschool Passthrough - Education of the Handicapped
RESTRICTED PROJECTS
Frederick County Public Schools FY 2018 Operating Budget163
Informational
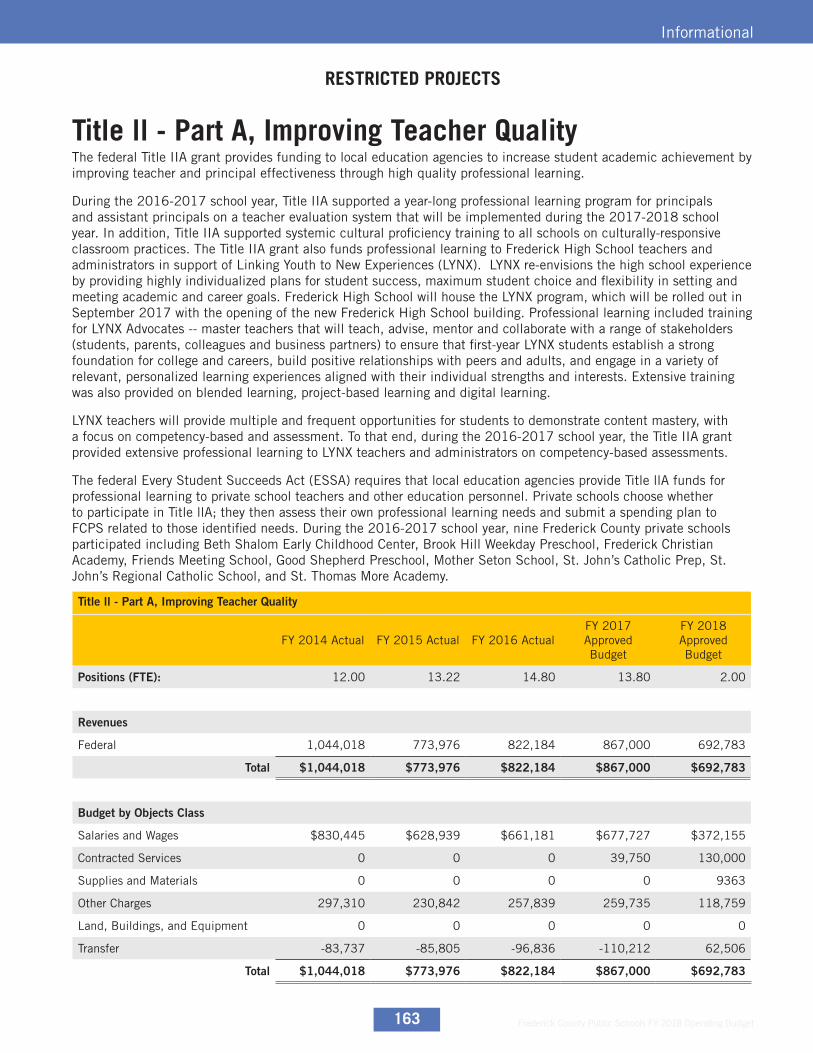
The federal Title IIA grant provides funding to local education agencies to increase student academic achievement by improving teacher and principal effectiveness through high quality professional learning.
During the 2016-2017 school year, Title IIA supported a year-long professional learning program for principals and assistant principals on a teacher evaluation system that will be implemented during the 2017-2018 school year. In addition, Title IIA supported systemic cultural proficiency training to all schools on culturally-responsive classroom practices. The Title IIA grant also funds professional learning to Frederick High School teachers and administrators in support of Linking Youth to New Experiences (LYNX). LYNX re-envisions the high school experience by providing highly individualized plans for student success, maximum student choice and flexibility in setting and meeting academic and career goals. Frederick High School will house the LYNX program, which will be rolled out in September 2017 with the opening of the new Frederick High School building. Professional learning included training for LYNX Advocates -- master teachers that will teach, advise, mentor and collaborate with a range of stakeholders (students, parents, colleagues and business partners) to ensure that first-year LYNX students establish a strong foundation for college and careers, build positive relationships with peers and adults, and engage in a variety of relevant, personalized learning experiences aligned with their individual strengths and interests. Extensive training was also provided on blended learning, project-based learning and digital learning.
LYNX teachers will provide multiple and frequent opportunities for students to demonstrate content mastery, with a focus on competency-based and assessment. To that end, during the 2016-2017 school year, the Title IIA grant provided extensive professional learning to LYNX teachers and administrators on competency-based assessments.
The federal Every Student Succeeds Act (ESSA) requires that local education agencies provide Title llA funds for professional learning to private school teachers and other education personnel. Private schools choose whether to participate in Title llA; they then assess their own professional learning needs and submit a spending plan to FCPS related to those identified needs. During the 2016-2017 school year, nine Frederick County private schools participated including Beth Shalom Early Childhood Center, Brook Hill Weekday Preschool, Frederick Christian Academy, Friends Meeting School, Good Shepherd Preschool, Mother Seton School, St. John’s Catholic Prep, St. John’s Regional Catholic School, and St. Thomas More Academy.
Title ll - Part A, Improving Teacher Quality
FY 2014 Actual FY 2015 Actual FY 2016 ActualFY 2017 Approved Budget
FY 2018 Approved Budget
Positions (FTE): 12.00 13.22 14.80 13.80 2.00
Revenues
Federal 1,044,018 773,976 822,184 867,000 692,783
Total $1,044,018 $773,976 $822,184 $867,000 $692,783
Budget by Objects Class
Salaries and Wages $830,445 $628,939 $661,181 $677,727 $372,155
Contracted Services 0 0 0 39,750 130,000
Supplies and Materials 0 0 0 0 9363
Other Charges 297,310 230,842 257,839 259,735 118,759
Land, Buildings, and Equipment 0 0 0 0 0
Transfer -83,737 -85,805 -96,836 -110,212 62,506
Total $1,044,018 $773,976 $822,184 $867,000 $692,783
Title ll - Part A, Improving Teacher Quality
RESTRICTED PROJECTS
Frederick County Public Schools FY 2018 Operating Budget 164
Informational
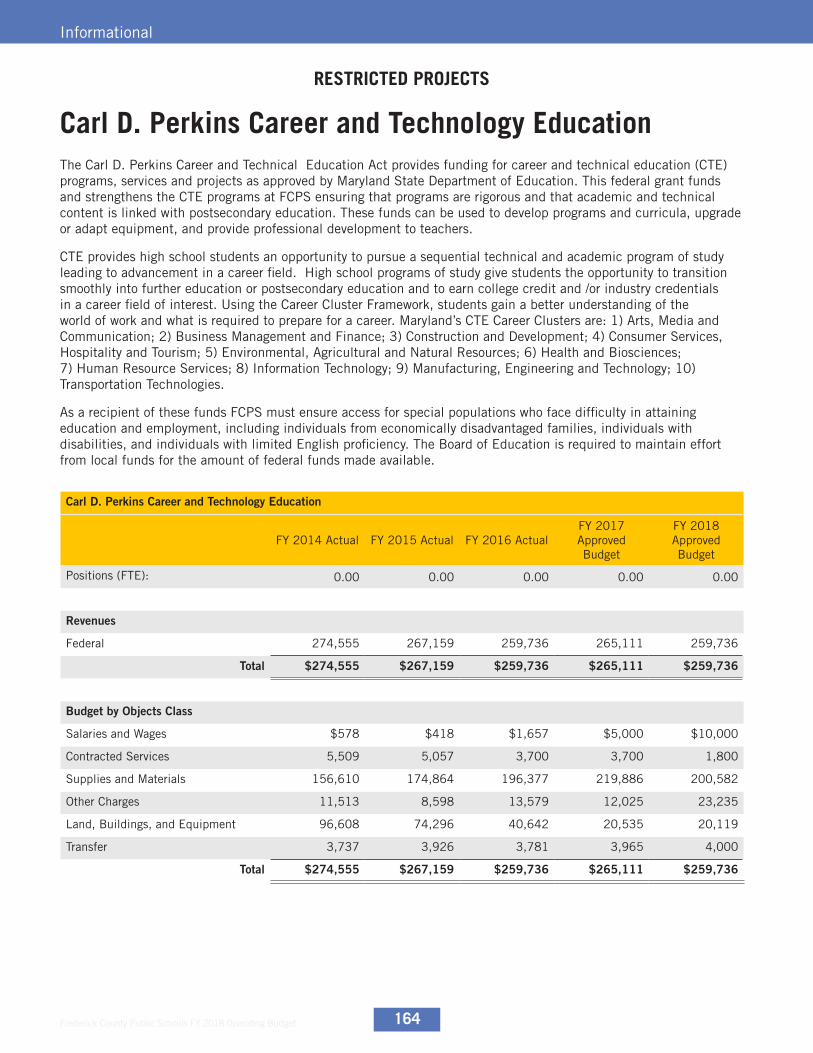
The Carl D. Perkins Career and Technical Education Act provides funding for career and technical education (CTE) programs, services and projects as approved by Maryland State Department of Education. This federal grant funds and strengthens the CTE programs at FCPS ensuring that programs are rigorous and that academic and technical content is linked with postsecondary education. These funds can be used to develop programs and curricula, upgrade or adapt equipment, and provide professional development to teachers.
CTE provides high school students an opportunity to pursue a sequential technical and academic program of study leading to advancement in a career field. High school programs of study give students the opportunity to transition smoothly into further education or postsecondary education and to earn college credit and /or industry credentials in a career field of interest. Using the Career Cluster Framework, students gain a better understanding of the world of work and what is required to prepare for a career. Maryland’s CTE Career Clusters are: 1) Arts, Media and Communication; 2) Business Management and Finance; 3) Construction and Development; 4) Consumer Services, Hospitality and Tourism; 5) Environmental, Agricultural and Natural Resources; 6) Health and Biosciences; 7) Human Resource Services; 8) Information Technology; 9) Manufacturing, Engineering and Technology; 10) Transportation Technologies.
As a recipient of these funds FCPS must ensure access for special populations who face difficulty in attaining education and employment, including individuals from economically disadvantaged families, individuals with disabilities, and individuals with limited English proficiency. The Board of Education is required to maintain effort from local funds for the amount of federal funds made available.
Carl D. Perkins Career and Technology Education
FY 2014 Actual FY 2015 Actual FY 2016 ActualFY 2017 Approved Budget
FY 2018 Approved Budget
Positions (FTE): 0.00 0.00 0.00 0.00 0.00
Revenues
Federal 274,555 267,159 259,736 265,111 259,736
Total $274,555 $267,159 $259,736 $265,111 $259,736
Budget by Objects Class
Salaries and Wages $578 $418 $1,657 $5,000 $10,000
Contracted Services 5,509 5,057 3,700 3,700 1,800
Supplies and Materials 156,610 174,864 196,377 219,886 200,582
Other Charges 11,513 8,598 13,579 12,025 23,235
Land, Buildings, and Equipment 96,608 74,296 40,642 20,535 20,119
Transfer 3,737 3,926 3,781 3,965 4,000
Total $274,555 $267,159 $259,736 $265,111 $259,736
Carl D. Perkins Career and Technology Education
RESTRICTED PROJECTS

Frederick County Public Schools FY 2018 Operating Budget165
Informational
The Race to the Top program was provided under the American Recovery and Reinvestment Act of 2009 (ARRA). This was a competitive grant designed to encourage and reward states that created the conditions for education innovation and reform; achieved significant improvement in student outcomes, including making substantial gains in student achievement, closing achievement gaps, improving high school graduation rates, and ensuring student preparation for success in college and careers; and implemented ambitious plans in four core education reforms.
Race to the Top rewarded states that demonstrated success in raising student achievement and have the best plans to accelerate reforms in the future. Frederick County was one of two districts that did not sign on to the Maryland RTTT application. However, some funding was allocated to FCPS based on the state application.
Race to the Top (RTTT)
FY 2014 Actual FY 2015 Actual FY 2016 ActualFY 2017 Approved Budget
FY 2018 Approved Budget
Positions (FTE): 0.00 0.00 0.00 0.00 0.00
Revenues
Federal 209,531 1,070,927 0 0 0
Total $209,531 $1,070,927 $0 $0 $0
Budget by Objects Class
Salaries and Wages $152,986 $149,245 $0 $0 $0
Contracted Services 0 19,816 0 0 0
Supplies and Materials 38,927 851,798 0 0 0
Other Charges 16,639 33,773 0 0 0
Land, Buildings, and Equipment 0 0 0 0 0
Transfer 979 16,295 0 0 0
Total $209,531 $1,070,927 $0 $0 $0
Race to the Top (RTTT)
RESTRICTED PROJECTS

Frederick County Public Schools FY 2018 Operating Budget 166
Informational
Intergovernmental Transfers (IGT) is the state share of the service billed to Medicaid. Medicaid is a federal-state program that provides health insurance to millions of low-income Americans. FCPS bills Medicaid for the full amount, the state and federal amount, for each provider service. This program is governed by the Department of Health and Mental Hygiene.
Medicaid was established to help states offer medical assistance to persons with low incomes. In the effort to meet students’ educational needs, schools have become increasingly involved in delivering a broad range of services, such as medical, social, rehabilitative and support services to address barriers to learning. Reimbursed services include case management, speech and language therapy, occupational and physical therapy and psychological assessments.
Intergovernmental Transfers (Medicaid Reimbursements)
FY 2014 Actual FY 2015 Actual FY 2016 ActualFY 2017 Approved Budget
FY 2018 Approved Budget
Positions (FTE): 0.00 0.00 0.00 0.00 0.00
Revenues
State 1,437,694 1,300,000 1,425,000 1,540,000 1,390,000
Total $1,437,694 $1,300,000 $1,425,000 $1,540,000 $1,390,000
Budget by Objects Class
Salaries and Wages $730,362 $668,614 $0 $0 $0
Contracted Services 624,126 566,116 0 0 0
Supplies and Materials 24,923 11,728 0 0 0
Other Charges 58,283 53,542 1,425,000 1,540,000 1,390,000
Land, Buildings, and Equipment 0 0 0 0 0
Transfer 0 0 0 0 0
Total $1,437,694 $1,300,000 $1,425,000 $1,540,000 $1,390,000
Intergovernmental Transfers (Medicaid Reimbursements)
RESTRICTED PROJECTS
Frederick County Public Schools FY 2018 Operating Budget167
Informational
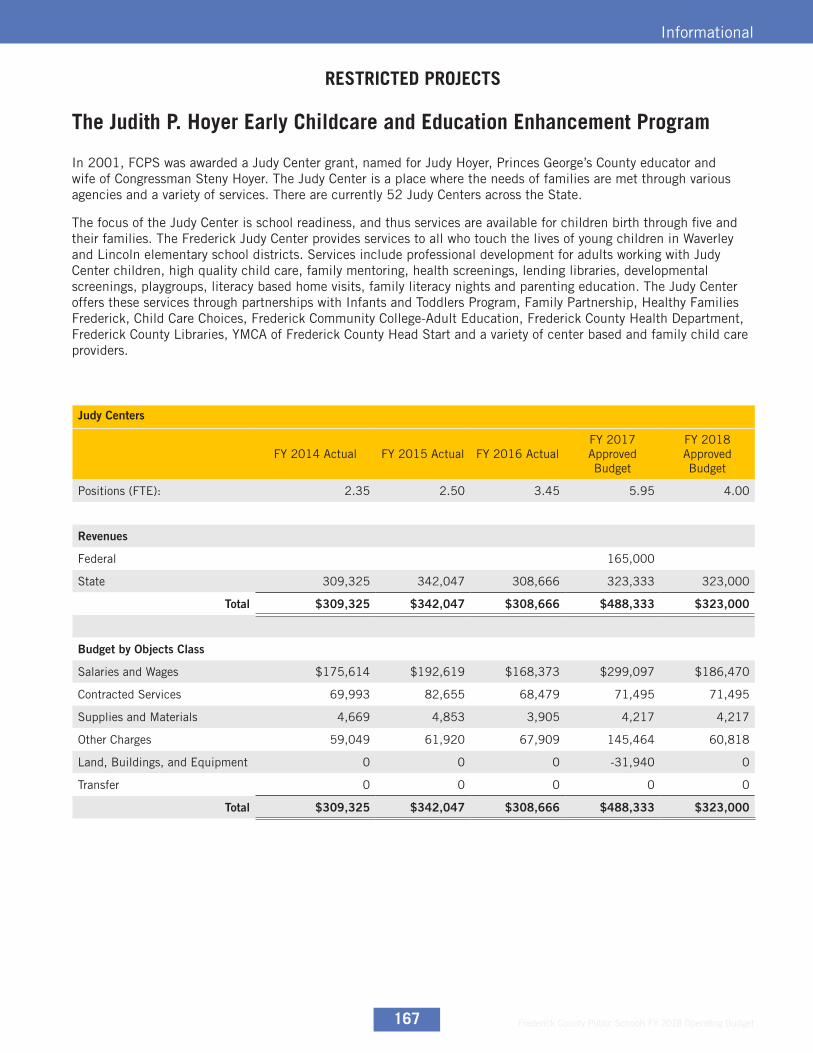
In 2001, FCPS was awarded a Judy Center grant, named for Judy Hoyer, Princes George’s County educator and wife of Congressman Steny Hoyer. The Judy Center is a place where the needs of families are met through various agencies and a variety of services. There are currently 52 Judy Centers across the State.
The focus of the Judy Center is school readiness, and thus services are available for children birth through five and their families. The Frederick Judy Center provides services to all who touch the lives of young children in Waverley and Lincoln elementary school districts. Services include professional development for adults working with Judy Center children, high quality child care, family mentoring, health screenings, lending libraries, developmental screenings, playgroups, literacy based home visits, family literacy nights and parenting education. The Judy Center offers these services through partnerships with Infants and Toddlers Program, Family Partnership, Healthy Families Frederick, Child Care Choices, Frederick Community College-Adult Education, Frederick County Health Department, Frederick County Libraries, YMCA of Frederick County Head Start and a variety of center based and family child care providers.
Judy Centers
FY 2014 Actual FY 2015 Actual FY 2016 ActualFY 2017 Approved Budget
FY 2018 Approved Budget
Positions (FTE): 2.35 2.50 3.45 5.95 4.00
Revenues
Federal 165,000
State 309,325 342,047 308,666 323,333 323,000
Total $309,325 $342,047 $308,666 $488,333 $323,000
Budget by Objects Class
Salaries and Wages $175,614 $192,619 $168,373 $299,097 $186,470
Contracted Services 69,993 82,655 68,479 71,495 71,495
Supplies and Materials 4,669 4,853 3,905 4,217 4,217
Other Charges 59,049 61,920 67,909 145,464 60,818
Land, Buildings, and Equipment 0 0 0 -31,940 0
Transfer 0 0 0 0 0
Total $309,325 $342,047 $308,666 $488,333 $323,000
The Judith P. Hoyer Early Childcare and Education Enhancement Program
RESTRICTED PROJECTS
Frederick County Public Schools FY 2018 Operating Budget 168
Informational
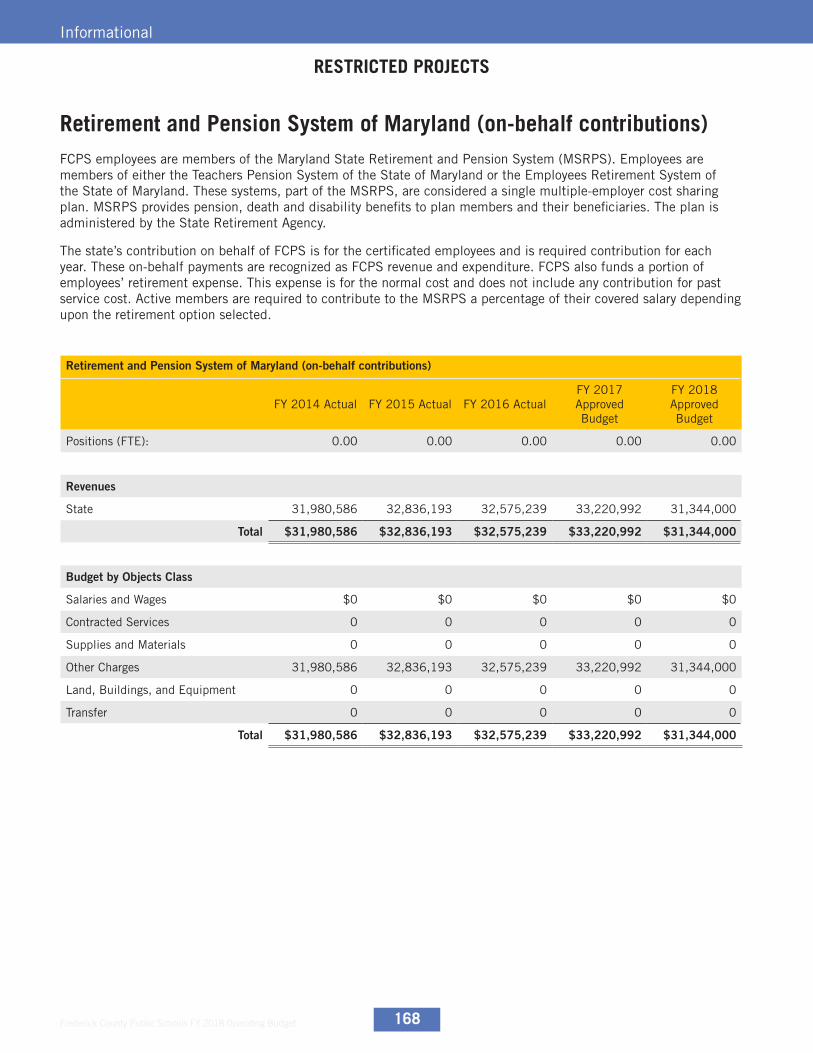
FCPS employees are members of the Maryland State Retirement and Pension System (MSRPS). Employees are members of either the Teachers Pension System of the State of Maryland or the Employees Retirement System of the State of Maryland. These systems, part of the MSRPS, are considered a single multiple-employer cost sharing plan. MSRPS provides pension, death and disability benefits to plan members and their beneficiaries. The plan is administered by the State Retirement Agency.
The state’s contribution on behalf of FCPS is for the certificated employees and is required contribution for each year. These on-behalf payments are recognized as FCPS revenue and expenditure. FCPS also funds a portion of employees’ retirement expense. This expense is for the normal cost and does not include any contribution for past service cost. Active members are required to contribute to the MSRPS a percentage of their covered salary depending upon the retirement option selected.
Retirement and Pension System of Maryland (on-behalf contributions)
FY 2014 Actual FY 2015 Actual FY 2016 ActualFY 2017 Approved Budget
FY 2018 Approved Budget
Positions (FTE): 0.00 0.00 0.00 0.00 0.00
Revenues
State 31,980,586 32,836,193 32,575,239 33,220,992 31,344,000
Total $31,980,586 $32,836,193 $32,575,239 $33,220,992 $31,344,000
Budget by Objects Class
Salaries and Wages $0 $0 $0 $0 $0
Contracted Services 0 0 0 0 0
Supplies and Materials 0 0 0 0 0
Other Charges 31,980,586 32,836,193 32,575,239 33,220,992 31,344,000
Land, Buildings, and Equipment 0 0 0 0 0
Transfer 0 0 0 0 0
Total $31,980,586 $32,836,193 $32,575,239 $33,220,992 $31,344,000
Retirement and Pension System of Maryland (on-behalf contributions)
RESTRICTED PROJECTS

Frederick County Public Schools FY 2018 Operating Budget169
Informational
The Frederick County public school system receives in-kind services from Frederick County Government. Funds are not appropriated to FCPS to procure these services, but the services are carried out by Frederick County Government for the benefit of FCPS. For FY 2018, the in-kind services include school health services, school-based occupational and physical therapy, school crossing guards at 15 county schools, school resource officers in 10 high schools and one alternative school, performance audits and building evaluations. Beginning in FY 2015, FCPS no longer received in-kind computer services. Those contracts and associated costs were transferred through local appropriation to the BOE.
Beginning in FY 2013, the normal cost for the Teachers Retirement System was shifted to Frederick County for funding over a four year phase-in period (FY 2013-16). Beginning in FY 2017, the normal cost funded by Frederick County was reflected in the general fund.
County Support
FY 2014 Actual FY 2015 Actual FY 2016 ActualFY 2017 Approved Budget
FY 2018 Approved Budget
Positions (FTE): 0.00 0.00 0.00 0.00 0.00
Revenues
State 19,292,887 18,429,809 19,983,720 11,216,320 11,430,113
Total $19,292,887 $18,429,809 $19,983,720 $11,216,320 $11,430,113
Budget by Objects Class
Salaries and Wages $0 $0 $0 $0 $0
Contracted Services 11,822,759 9,991,204 10,125,406 11,216,320 11,430,113
Supplies and Materials 0 0 0 0 0
Other Charges 7,470,128 8,438,605 9,858,314 0 0
Land, Buildings, and Equipment 0 0 0 0 0
Transfer 0 0 0 0 0
Total $19,292,887 $18,429,809 $19,983,720 $11,216,320 $11,430,113
County Support
RESTRICTED PROJECTS

Frederick County Public Schools FY 2018 Operating Budget 170
Informational
There are other supplemental activities that are deemed restricted but are not detailed in this document. These grants are restricted to specific programs, and the expenses and revenues are recorded as separate projects. These funds may not be used to supplant local funds, and some projects may require a local match.
Other Grants and Restricted Projects
Other Grants and Restricted Projects
FY 2014 Actual FY 2015 Actual FY 2016 ActualFY 2017 Approved Budget
FY 2018 Approved Budget
Positions (FTE): 11.33 24.11 9.50 13.45 12.00
Revenues
Federal 1,141,630 711,998 1,801,750 3,285,764 3,092,694
State 1,519,092 2,185,399 644,860 1,560,081 1,560,414
County 1,197,471 803,573 2,325,230 1,762,265 2,462,265
Total $3,858,193 $3,700,970 $4,771,840 $6,608,110 $7,115,373
Budget by Objects Class
Salaries and Wages $1,716,083 $2,244,541 $1,725,323 $2,856,698 $2,050,020
Contracted Services 261,391 217,529 2,166,607 534,484 2,332,308
Supplies and Materials 1,179,259 1,029,737 606,376 891,069 1,327,216
Other Charges 600,986 224,623 352,122 2,953,891 2,464,707
Land, Buildings, and Equipment 142,973 53,614 30,618 20,107 40,642
Transfer -42,499 -69,074 -108,206 -648,139 -1,099,520
Total $3,858,193 $3,700,970 $4,772,840 $6,608,110 $7,115,373
RESTRICTED PROJECTS
Frederick County Public Schools FY 2018 Operating Budget171
Informational
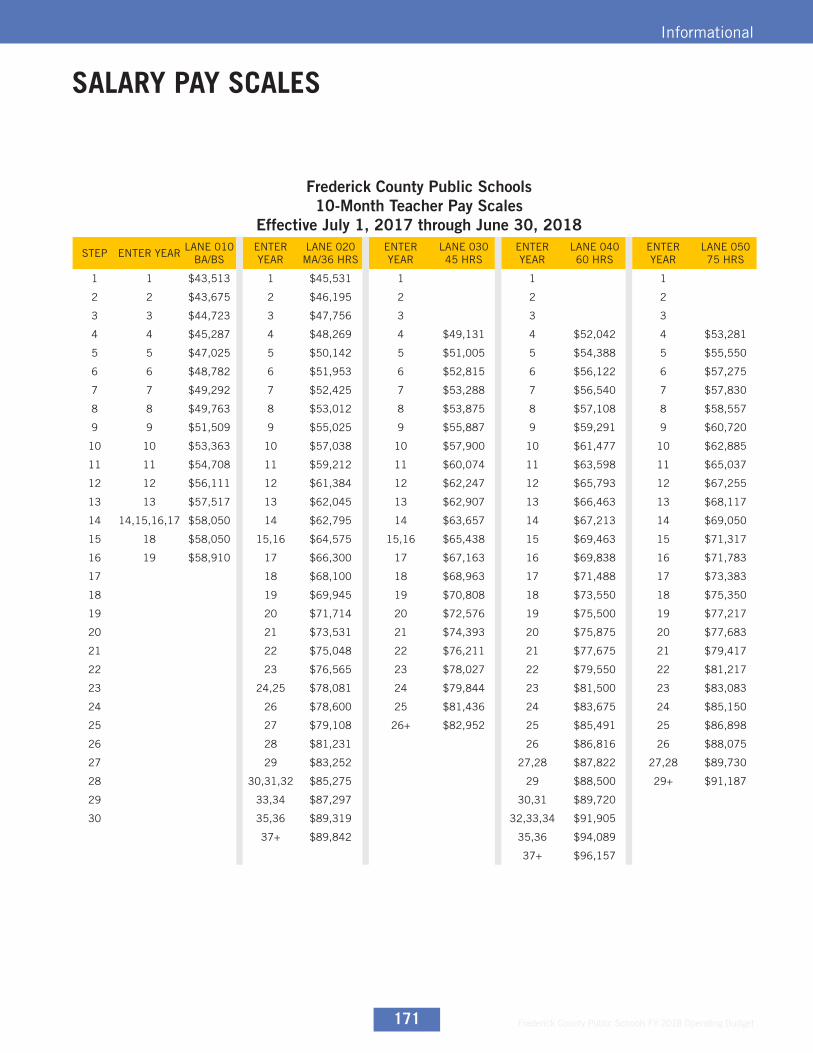
SALARY PAY SCALES
Frederick County Public Schools10-Month Teacher Pay Scales
Effective July 1, 2017 through June 30, 2018
STEP ENTER YEARLANE 010
BA/BSENTER YEAR
LANE 020 MA/36 HRS
ENTER YEAR
LANE 030 45 HRS
ENTER YEAR
LANE 040 60 HRS
ENTER YEAR
LANE 050 75 HRS
1 1 $43,513 1 $45,531 1 1 1
2 2 $43,675 2 $46,195 2 2 2
3 3 $44,723 3 $47,756 3 3 3
4 4 $45,287 4 $48,269 4 $49,131 4 $52,042 4 $53,281
5 5 $47,025 5 $50,142 5 $51,005 5 $54,388 5 $55,550
6 6 $48,782 6 $51,953 6 $52,815 6 $56,122 6 $57,275
7 7 $49,292 7 $52,425 7 $53,288 7 $56,540 7 $57,830
8 8 $49,763 8 $53,012 8 $53,875 8 $57,108 8 $58,557
9 9 $51,509 9 $55,025 9 $55,887 9 $59,291 9 $60,720
10 10 $53,363 10 $57,038 10 $57,900 10 $61,477 10 $62,885
11 11 $54,708 11 $59,212 11 $60,074 11 $63,598 11 $65,037
12 12 $56,111 12 $61,384 12 $62,247 12 $65,793 12 $67,255
13 13 $57,517 13 $62,045 13 $62,907 13 $66,463 13 $68,117
14 14,15,16,17 $58,050 14 $62,795 14 $63,657 14 $67,213 14 $69,050
15 18 $58,050 15,16 $64,575 15,16 $65,438 15 $69,463 15 $71,317
16 19 $58,910 17 $66,300 17 $67,163 16 $69,838 16 $71,783
17 18 $68,100 18 $68,963 17 $71,488 17 $73,383
18 19 $69,945 19 $70,808 18 $73,550 18 $75,350
19 20 $71,714 20 $72,576 19 $75,500 19 $77,217
20 21 $73,531 21 $74,393 20 $75,875 20 $77,683
21 22 $75,048 22 $76,211 21 $77,675 21 $79,417
22 23 $76,565 23 $78,027 22 $79,550 22 $81,217
23 24,25 $78,081 24 $79,844 23 $81,500 23 $83,083
24 26 $78,600 25 $81,436 24 $83,675 24 $85,150
25 27 $79,108 26+ $82,952 25 $85,491 25 $86,898
26 28 $81,231 26 $86,816 26 $88,075
27 29 $83,252 27,28 $87,822 27,28 $89,730
28 30,31,32 $85,275 29 $88,500 29+ $91,187
29 33,34 $87,297 30,31 $89,720
30 35,36 $89,319 32,33,34 $91,905
37+ $89,842 35,36 $94,089
37+ $96,157
Frederick County Public Schools FY 2018 Operating Budget 172
Informational
SALARY PAY SCALES
Frederick County Public Schools11-Month Teacher Pay Scales
Effective July 1, 2017 through June 30, 2018
STEP ENTER YEARLANE 010
BA/BSENTER YEAR
LANE 020 MA/36 HRS
ENTER YEAR
LANE 030 45 HRS
ENTER YEAR
LANE 040 60 HRS
ENTER YEAR
LANE 050 75 HRS
1 1 $46,732 1 $48,901 1 1 1
2 2 $46,907 2 $49,613 2 2 2
3 3 $48,033 3 $51,290 3 3 3
4 4 $48,639 4 $51,840 4 $52,767 4 $55,893 4 $57,224
5 5 $50,505 5 $53,853 5 $54,779 5 $58,412 5 $59,661
6 6 $52,391 6 $55,797 6 $56,723 6 $60,274 6 $61,513
7 7 $52,939 7 $56,304 7 $57,231 7 $60,724 7 $62,109
8 8 $53,445 8 $56,935 8 $57,861 8 $61,333 8 $62,890
9 9 $55,320 9 $59,096 9 $60,023 9 $63,679 9 $65,213
10 10 $57,311 10 $61,259 10 $62,185 10 $66,026 10 $67,538
11 11 $58,756 11 $63,593 11 $64,520 11 $68,304 11 $69,849
12 12 $60,263 12 $65,927 12 $66,853 12 $70,661 12 $72,232
13 13 $61,773 13 $66,636 13 $67,562 13 $71,381 13 $73,157
14 14,15,16,17 $62,346 14 $67,441 14 $68,368 14 $72,186 14 $74,160
15 18 $62,346 15,16 $69,354 15,16 $70,280 15 $74,603 15 $76,594
16 19+ $63,276 17 $71,206 17 $72,133 16 $75,005 16 $77,095
17 18 $73,139 18 $74,066 17 $76,778 17 $78,814
18 19 $75,121 19 $76,047 18 $78,993 18 $80,926
19 20 $77,020 20 $77,947 19 $81,087 19 $82,931
20 21 $78,972 21 $79,898 20 $81,490 20 $83,432
21 22 $80,602 22 $81,850 21 $83,423 21 $85,294
22 23 $82,230 23 $83,801 22 $85,437 22 $87,227
23 24 $83,859 24 $85,752 23 $87,531 23 $89,232
24 25 $84,416 25 $87,462 24 $89,867 24 $91,451
25 26 $84,416 26 $89,090 25 $91,818 25 $93,328
26 27 $87,169 27+ $90,538 26 $93,240 26 $94,593
27 28 $89,342 27 $94,321 27 $96,370
28 29,30 $91,515 28 $95,049 28+ $98,003
29 31,32 $93,687 29,30 $96,493
30 33,34,35 $95,857 31,32 $98,705
31 36+ $96,502 33,34,35 $101,187
36+ $104,104
Frederick County Public Schools FY 2018 Operating Budget173
Informational
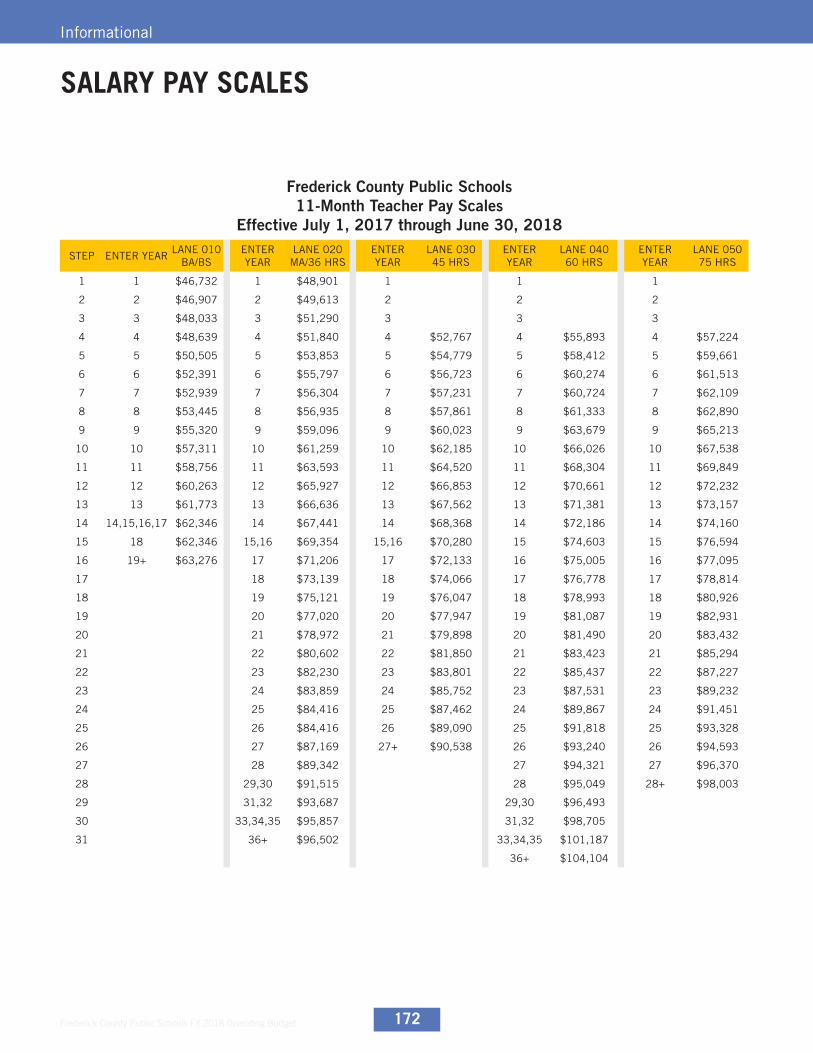
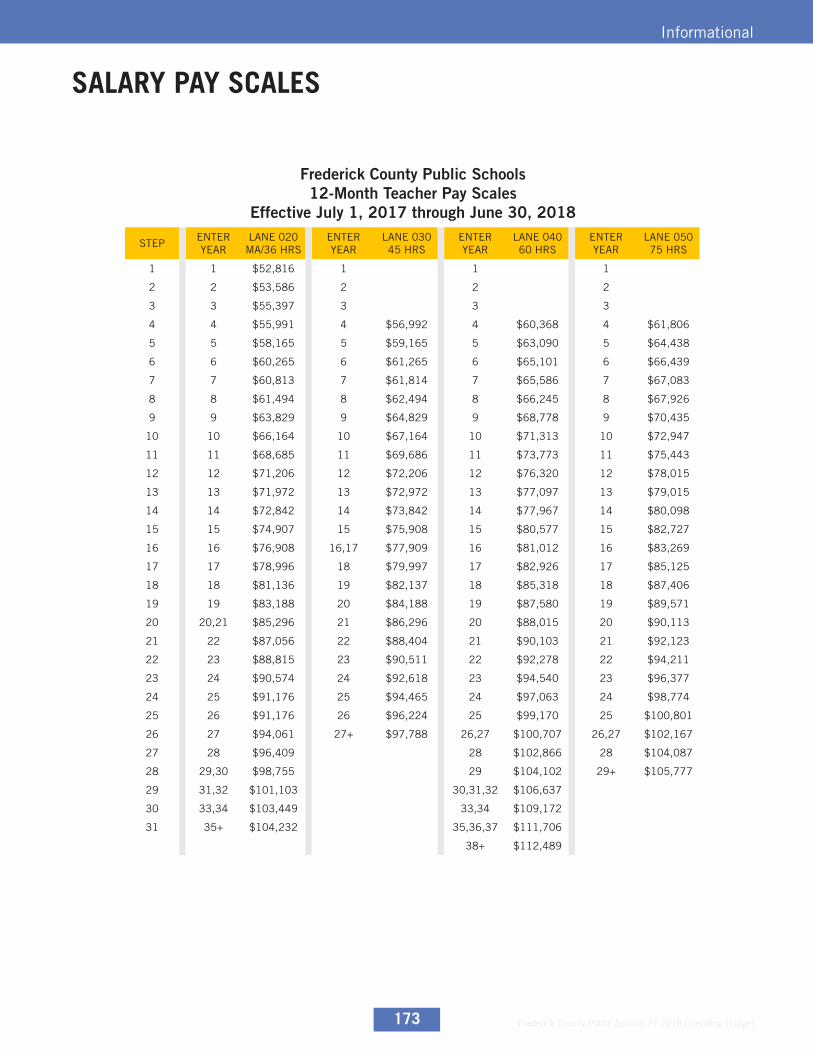
SALARY PAY SCALES
Frederick County Public Schools12-Month Teacher Pay Scales
Effective July 1, 2017 through June 30, 2018
STEPENTER YEAR
LANE 020 MA/36 HRS
ENTER YEAR
LANE 030 45 HRS
ENTER YEAR
LANE 040 60 HRS
ENTER YEAR
LANE 050 75 HRS
1 1 $52,816 1 1 1
2 2 $53,586 2 2 2
3 3 $55,397 3 3 3
4 4 $55,991 4 $56,992 4 $60,368 4 $61,806
5 5 $58,165 5 $59,165 5 $63,090 5 $64,438
6 6 $60,265 6 $61,265 6 $65,101 6 $66,439
7 7 $60,813 7 $61,814 7 $65,586 7 $67,083
8 8 $61,494 8 $62,494 8 $66,245 8 $67,926
9 9 $63,829 9 $64,829 9 $68,778 9 $70,435
10 10 $66,164 10 $67,164 10 $71,313 10 $72,947
11 11 $68,685 11 $69,686 11 $73,773 11 $75,443
12 12 $71,206 12 $72,206 12 $76,320 12 $78,015
13 13 $71,972 13 $72,972 13 $77,097 13 $79,015
14 14 $72,842 14 $73,842 14 $77,967 14 $80,098
15 15 $74,907 15 $75,908 15 $80,577 15 $82,727
16 16 $76,908 16,17 $77,909 16 $81,012 16 $83,269
17 17 $78,996 18 $79,997 17 $82,926 17 $85,125
18 18 $81,136 19 $82,137 18 $85,318 18 $87,406
19 19 $83,188 20 $84,188 19 $87,580 19 $89,571
20 20,21 $85,296 21 $86,296 20 $88,015 20 $90,113
21 22 $87,056 22 $88,404 21 $90,103 21 $92,123
22 23 $88,815 23 $90,511 22 $92,278 22 $94,211
23 24 $90,574 24 $92,618 23 $94,540 23 $96,377
24 25 $91,176 25 $94,465 24 $97,063 24 $98,774
25 26 $91,176 26 $96,224 25 $99,170 25 $100,801
26 27 $94,061 27+ $97,788 26,27 $100,707 26,27 $102,167
27 28 $96,409 28 $102,866 28 $104,087
28 29,30 $98,755 29 $104,102 29+ $105,777
29 31,32 $101,103 30,31,32 $106,637
30 33,34 $103,449 33,34 $109,172
31 35+ $104,232 35,36,37 $111,706
38+ $112,489

Frederick County Public Schools FY 2018 Operating Budget 174
Informational
SALARY PAY SCALES
Frederick County Public SchoolsAthletic Director Pay Scales
Effective July 1, 2017 through June 30, 2018
STEPENTER YEAR
LANE 020 MA/36 HRS
ENTER YEARLANE 030 45 HRS
ENTER YEARLANE 040 60 HRS
ENTER YEARLANE 050 75 HRS
1 1 $57,707 1 1 1
2 2 $57,997 2 2 2
3 3 $59,879 3 3 3
4 4 $60,845 4 $61,988 4 $65,973 4 $67,059
5 5 $62,804 5 $63,947 5 $68,090 5 $69,176
6 6 $65,115 6 $66,258 6 $70,537 6 $71,623
7 7 $65,848 7 $66,991 7 $71,314 7 $72,401
8 8 $66,826 8 $67,969 8 $72,195 8 $73,282
9 9 $67,671 9 $68,814 9 $73,073 9 $74,160
10 10 $69,660 10 $70,803 10 $75,087 10 $76,174
11 11 $72,251 11 $73,393 11 $77,665 11 $78,751
12 12 $74,842 12 $75,984 12 $80,391 12 $81,477
1313,14,15,
16,17$77,320
13,14,15,16,17
$78,574 13,14,15,16,
17,18,19$83,116
13,14,15,16,17,18,19
$84,203
14 18 $79,799 18 $81,164 20 $85,841 20 $86,928
15 19 $82,277 19 $83,754 21 $88,568 21 $89,655
16 20 $84,755 20 $85,898 22,23 $91,294 22,23 $92,380
17 21,22 $86,899 21,22 $88,041 24 $93,573 24 $94,659
18 23 $89,042 23 $90,185 25 $95,853 25 $96,939
19 24 $91,185 24 $92,328 26 $98,131 26 $99,217
20 25 $93,329 25 $94,472 27,28 $100,410 27,28 $101,497
21 26 $94,417 26 $96,616 29,30 $102,691 29,30 $103,777
22 27 $96,831 27 $98,759 31,32,33 $104,969 31,32,33 $106,056
23 28,29 $99,376 28+ $100,966 34,35 $107,249 34,35 $108,335
24 30,31,32 $101,920 36,37,38 $109,890 36,37,38 $109,559
25 33,34 $104,466 39 $112,639 39 $110,006
26 35,36 $107,011 40 $115,387
27 37 $109,554 41 $118,134
38+ $110,429 42+ $119,179
Frederick County Public Schools FY 2018 Operating Budget175
Informational
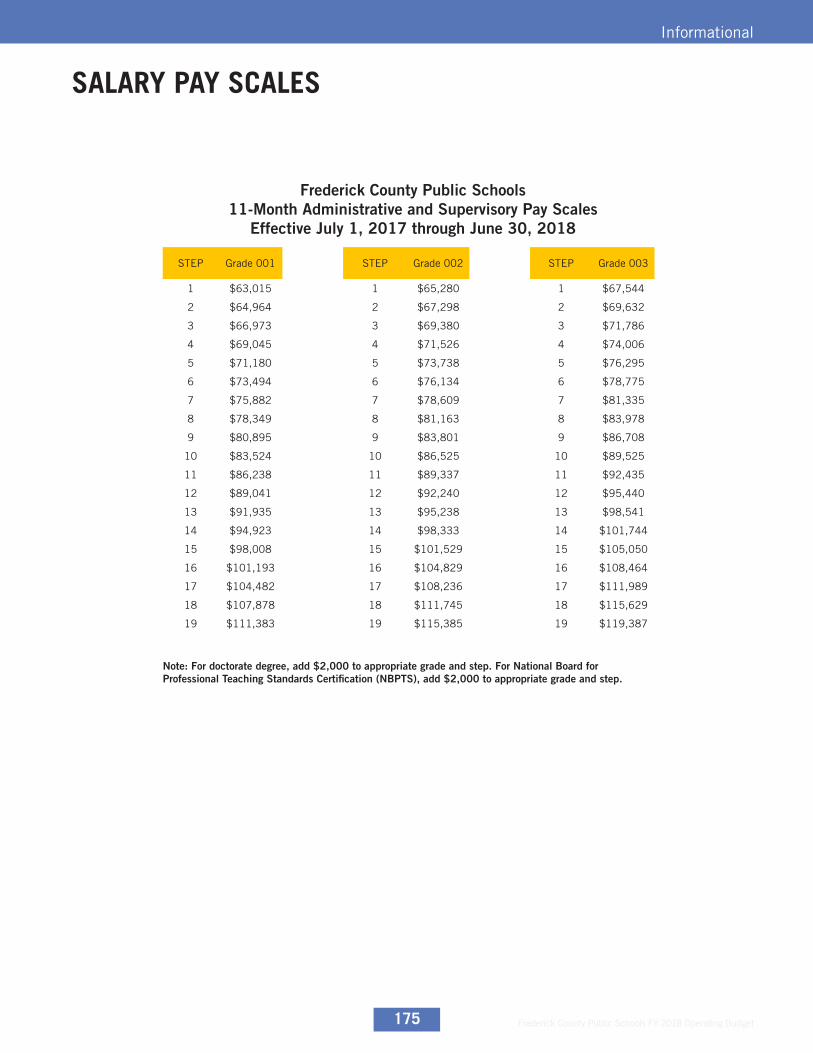
SALARY PAY SCALES
Frederick County Public Schools11-Month Administrative and Supervisory Pay Scales
Effective July 1, 2017 through June 30, 2018
Note: For doctorate degree, add $2,000 to appropriate grade and step. For National Board for Professional Teaching Standards Certification (NBPTS), add $2,000 to appropriate grade and step.
STEP Grade 001 STEP Grade 002 STEP Grade 003
1 $63,015 1 $65,280 1 $67,544
2 $64,964 2 $67,298 2 $69,632
3 $66,973 3 $69,380 3 $71,786
4 $69,045 4 $71,526 4 $74,006
5 $71,180 5 $73,738 5 $76,295
6 $73,494 6 $76,134 6 $78,775
7 $75,882 7 $78,609 7 $81,335
8 $78,349 8 $81,163 8 $83,978
9 $80,895 9 $83,801 9 $86,708
10 $83,524 10 $86,525 10 $89,525
11 $86,238 11 $89,337 11 $92,435
12 $89,041 12 $92,240 12 $95,440
13 $91,935 13 $95,238 13 $98,541
14 $94,923 14 $98,333 14 $101,744
15 $98,008 15 $101,529 15 $105,050
16 $101,193 16 $104,829 16 $108,464
17 $104,482 17 $108,236 17 $111,989
18 $107,878 18 $111,745 18 $115,629
19 $111,383 19 $115,385 19 $119,387

Frederick County Public Schools FY 2018 Operating Budget 176
Informational
SALARY PAY SCALES
Frederick County Public Schools12-Month Administrative and Supervisory Pay Scales
Effective July 1, 2017 through June 30, 2018
STEP GRADE 001 STEP GRADE 002 STEP GRADE 003 STEP GRADE 004 STEP GRADE 005
1 $73,922 1 $76,578 1 $79,234 1 $84,545 1 $89,857
2 $76,208 2 $78,946 2 $81,684 2 $87,160 2 $92,636
3 $78,565 3 $81,388 3 $84,211 3 $89,856 3 $95,501
4 $80,995 4 $83,905 4 $86,815 4 $92,635 4 $98,455
5 $83,500 5 $86,500 5 $89,500 5 $95,500 5 $101,500
6 $86,214 6 $89,311 6 $92,409 6 $98,604 6 $104,799
7 $89,016 7 $92,214 7 $95,412 7 $101,808 7 $108,205
8 $91,909 8 $95,211 8 $98,513 8 $105,117 8 $111,721
9 $94,896 9 $98,305 9 $101,715 9 $108,533 9 $115,352
10 $97,980 10 $101,500 10 $105,020 10 $112,061 10 $119,101
11 $101,164 11 $104,799 11 $108,433 11 $115,703 11 $122,972
12 $104,452 12 $108,205 12 $111,958 12 $119,463 12 $126,969
13 $107,847 13 $111,721 13 $115,596 13 $123,346 13 $131,095
14 $111,352 14 $115,352 14 $119,353 14 $127,354 14 $135,356
15 $114,971 15 $119,101 15 $123,232 15 $131,493 15 $139,755
16 $118,707 16 $122,972 16 $127,237 16 $135,767 16 $144,297
17 $122,565 17 $126,969 17 $131,372 17 $140,179 17 $148,986
18 $126,549 18 $131,085 18 $135,642 18 $144,735 18 $153,829
19 $130,661 19 $135,356 19 $140,050 19 $149,439 19 $158,828
Note: For doctorate degree, add $2,000 to appropriate scale and step. For National Board for Professional Teaching Standards Certification (NBPTS), add $2,000. For Lead Curriculum Specialist, add $5,000.
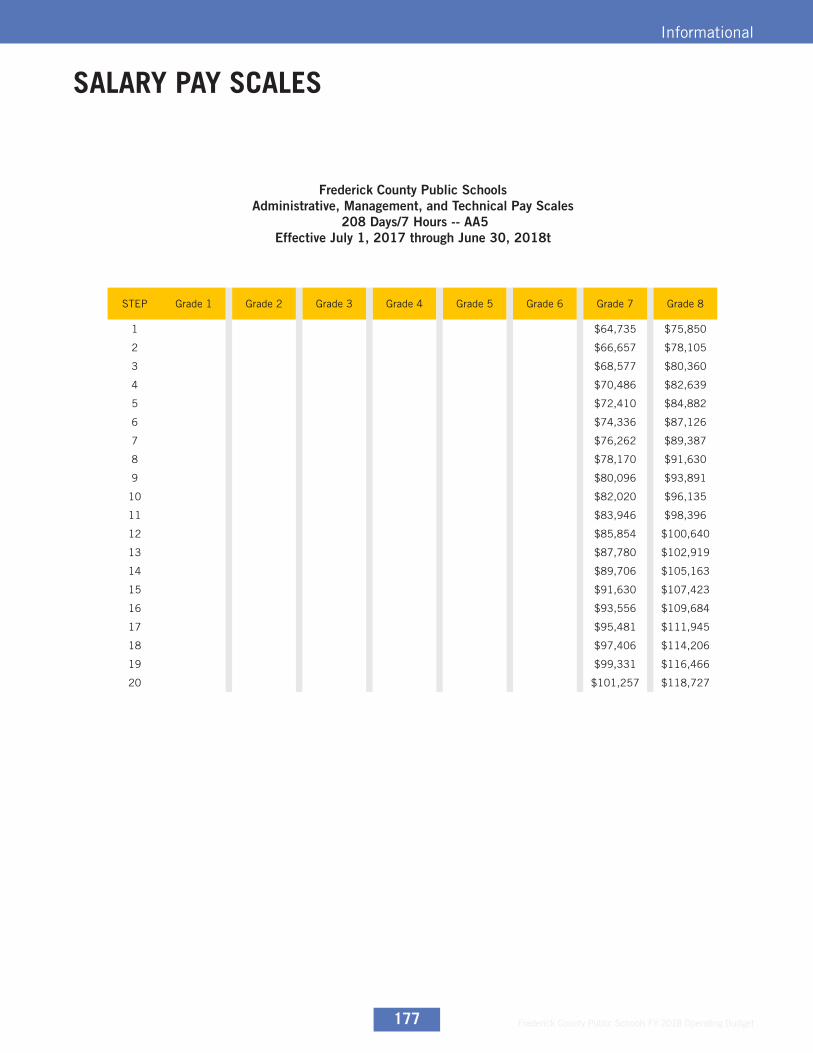
Frederick County Public Schools FY 2018 Operating Budget177
Informational
SALARY PAY SCALES
STEP Grade 1 Grade 2 Grade 3 Grade 4 Grade 5 Grade 6 Grade 7 Grade 8
1 $64,735 $75,850
2 $66,657 $78,105
3 $68,577 $80,360
4 $70,486 $82,639
5 $72,410 $84,882
6 $74,336 $87,126
7 $76,262 $89,387
8 $78,170 $91,630
9 $80,096 $93,891
10 $82,020 $96,135
11 $83,946 $98,396
12 $85,854 $100,640
13 $87,780 $102,919
14 $89,706 $105,163
15 $91,630 $107,423
16 $93,556 $109,684
17 $95,481 $111,945
18 $97,406 $114,206
19 $99,331 $116,466
20 $101,257 $118,727
Frederick County Public SchoolsAdministrative, Management, and Technical Pay Scales
208 Days/7 Hours -- AA5Effective July 1, 2017 through June 30, 2018t
Frederick County Public Schools FY 2018 Operating Budget 178
Informational
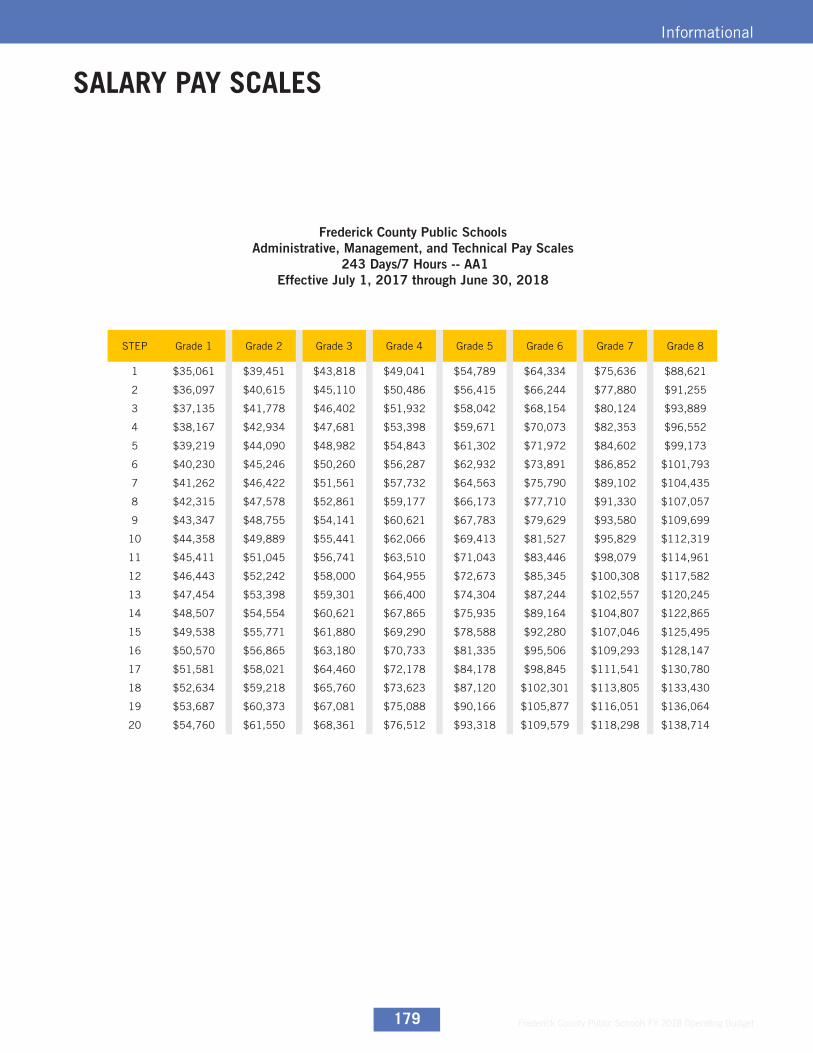
Frederick County Public Schools FY 2018 Operating Budget179
Informational
STEP Grade 1 Grade 2 Grade 3 Grade 4 Grade 5 Grade 6 Grade 7 Grade 8
1 $35,061 $39,451 $43,818 $49,041 $54,789 $64,334 $75,636 $88,621
2 $36,097 $40,615 $45,110 $50,486 $56,415 $66,244 $77,880 $91,255
3 $37,135 $41,778 $46,402 $51,932 $58,042 $68,154 $80,124 $93,889
4 $38,167 $42,934 $47,681 $53,398 $59,671 $70,073 $82,353 $96,552
5 $39,219 $44,090 $48,982 $54,843 $61,302 $71,972 $84,602 $99,173
6 $40,230 $45,246 $50,260 $56,287 $62,932 $73,891 $86,852 $101,793
7 $41,262 $46,422 $51,561 $57,732 $64,563 $75,790 $89,102 $104,435
8 $42,315 $47,578 $52,861 $59,177 $66,173 $77,710 $91,330 $107,057
9 $43,347 $48,755 $54,141 $60,621 $67,783 $79,629 $93,580 $109,699
10 $44,358 $49,889 $55,441 $62,066 $69,413 $81,527 $95,829 $112,319
11 $45,411 $51,045 $56,741 $63,510 $71,043 $83,446 $98,079 $114,961
12 $46,443 $52,242 $58,000 $64,955 $72,673 $85,345 $100,308 $117,582
13 $47,454 $53,398 $59,301 $66,400 $74,304 $87,244 $102,557 $120,245
14 $48,507 $54,554 $60,621 $67,865 $75,935 $89,164 $104,807 $122,865
15 $49,538 $55,771 $61,880 $69,290 $78,588 $92,280 $107,046 $125,495
16 $50,570 $56,865 $63,180 $70,733 $81,335 $95,506 $109,293 $128,147
17 $51,581 $58,021 $64,460 $72,178 $84,178 $98,845 $111,541 $130,780
18 $52,634 $59,218 $65,760 $73,623 $87,120 $102,301 $113,805 $133,430
19 $53,687 $60,373 $67,081 $75,088 $90,166 $105,877 $116,051 $136,064
20 $54,760 $61,550 $68,361 $76,512 $93,318 $109,579 $118,298 $138,714
Frederick County Public SchoolsAdministrative, Management, and Technical Pay Scales
243 Days/7 Hours -- AA1Effective July 1, 2017 through June 30, 2018
SALARY PAY SCALES

Frederick County Public Schools FY 2018 Operating Budget 180
Informational
STEP Grade 1 Grade 2 Grade 3 Grade 4 Grade 5 Grade 6 Grade 7 Grade 8
1 $37,506 $42,204 $46,875 $52,464 $58,614 $68,827 $80,920 $94,813
2 $38,615 $43,449 $48,258 $54,011 $60,354 $70,871 $83,321 $97,631
3 $39,725 $44,694 $49,640 $55,558 $62,094 $72,914 $85,722 $100,450
4 $40,829 $45,930 $51,009 $57,126 $63,839 $74,968 $88,106 $103,299
5 $41,956 $47,167 $52,400 $58,671 $65,583 $76,999 $90,513 $106,103
6 $43,038 $48,403 $53,769 $60,217 $67,328 $79,053 $92,920 $108,908
7 $44,142 $49,662 $55,160 $61,763 $69,072 $81,084 $95,327 $111,734
8 $45,268 $50,899 $56,552 $63,309 $70,794 $83,138 $97,712 $114,538
9 $46,372 $52,157 $57,921 $64,854 $72,517 $85,192 $100,119 $117,365
10 $47,454 $53,372 $59,312 $66,400 $74,261 $87,223 $102,526 $120,169
11 $48,580 $54,608 $60,703 $67,946 $76,006 $89,277 $104,933 $122,996
12 $49,684 $55,889 $62,050 $69,492 $77,750 $91,308 $107,318 $125,800
13 $50,766 $57,126 $63,441 $71,037 $79,495 $93,340 $109,725 $128,649
14 $51,892 $58,362 $64,854 $72,605 $81,239 $95,393 $112,131 $131,453
15 $52,996 $59,665 $66,201 $74,129 $82,983 $97,447 $114,538 $134,279
16 $54,101 $60,835 $67,593 $75,674 $84,727 $99,500 $116,944 $137,105
17 $55,183 $62,072 $68,962 $77,220 $86,472 $101,553 $119,351 $139,931
18 $56,309 $63,353 $70,353 $78,766 $88,216 $103,606 $121,757 $142,757
19 $57,435 $64,589 $71,766 $80,334 $89,960 $105,659 $124,164 $145,583
20 $58,583 $65,848 $73,135 $81,857 $91,704 $107,712 $126,571 $148,409
Frederick County Public SchoolsAdministrative, Management, and Technical Pay Scales
260 Days/7 Hours -- AA2Effective July 1, 2017 through June 30, 2018
SALARY PAY SCALES
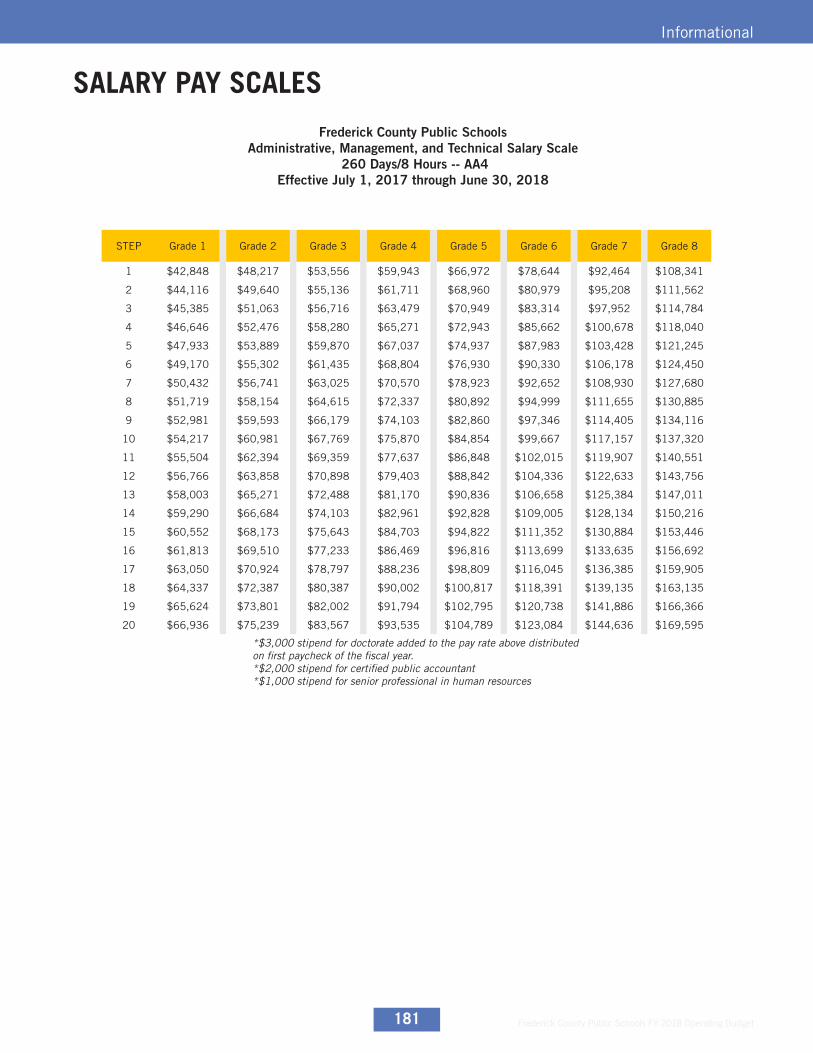
Frederick County Public Schools FY 2018 Operating Budget181
Informational
STEP Grade 1 Grade 2 Grade 3 Grade 4 Grade 5 Grade 6 Grade 7 Grade 8
1 $42,848 $48,217 $53,556 $59,943 $66,972 $78,644 $92,464 $108,341
2 $44,116 $49,640 $55,136 $61,711 $68,960 $80,979 $95,208 $111,562
3 $45,385 $51,063 $56,716 $63,479 $70,949 $83,314 $97,952 $114,784
4 $46,646 $52,476 $58,280 $65,271 $72,943 $85,662 $100,678 $118,040
5 $47,933 $53,889 $59,870 $67,037 $74,937 $87,983 $103,428 $121,245
6 $49,170 $55,302 $61,435 $68,804 $76,930 $90,330 $106,178 $124,450
7 $50,432 $56,741 $63,025 $70,570 $78,923 $92,652 $108,930 $127,680
8 $51,719 $58,154 $64,615 $72,337 $80,892 $94,999 $111,655 $130,885
9 $52,981 $59,593 $66,179 $74,103 $82,860 $97,346 $114,405 $134,116
10 $54,217 $60,981 $67,769 $75,870 $84,854 $99,667 $117,157 $137,320
11 $55,504 $62,394 $69,359 $77,637 $86,848 $102,015 $119,907 $140,551
12 $56,766 $63,858 $70,898 $79,403 $88,842 $104,336 $122,633 $143,756
13 $58,003 $65,271 $72,488 $81,170 $90,836 $106,658 $125,384 $147,011
14 $59,290 $66,684 $74,103 $82,961 $92,828 $109,005 $128,134 $150,216
15 $60,552 $68,173 $75,643 $84,703 $94,822 $111,352 $130,884 $153,446
16 $61,813 $69,510 $77,233 $86,469 $96,816 $113,699 $133,635 $156,692
17 $63,050 $70,924 $78,797 $88,236 $98,809 $116,045 $136,385 $159,905
18 $64,337 $72,387 $80,387 $90,002 $100,817 $118,391 $139,135 $163,135
19 $65,624 $73,801 $82,002 $91,794 $102,795 $120,738 $141,886 $166,366
20 $66,936 $75,239 $83,567 $93,535 $104,789 $123,084 $144,636 $169,595
Frederick County Public SchoolsAdministrative, Management, and Technical Salary Scale
260 Days/8 Hours -- AA4Effective July 1, 2017 through June 30, 2018
*$3,000 stipend for doctorate added to the pay rate above distributed on first paycheck of the fiscal year.*$2,000 stipend for certified public accountant*$1,000 stipend for senior professional in human resources
SALARY PAY SCALES
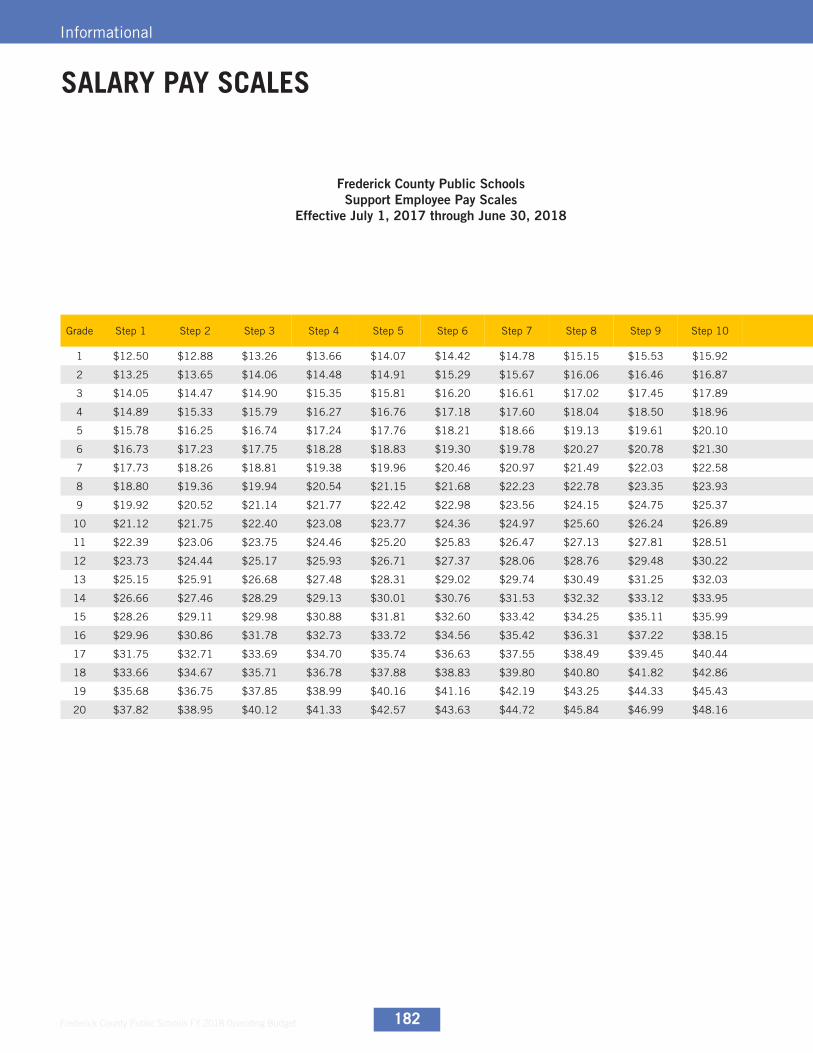
Frederick County Public Schools FY 2018 Operating Budget 182
Informational
Frederick County Public SchoolsSupport Employee Pay Scales
Effective July 1, 2017 through June 30, 2018
SALARY PAY SCALES
Grade Step 1 Step 2 Step 3 Step 4 Step 5 Step 6 Step 7 Step 8 Step 9 Step 10 Step 11 Step 12 Step 13 Step 14 Step 15 Step 16 Step 17 Step 18 Step 19 Step 20 Step 21
1 $12.50 $12.88 $13.26 $13.66 $14.07 $14.42 $14.78 $15.15 $15.53 $15.92 $16.24 $16.56 $16.89 $17.23 $17.57 $17.93 $18.28 $18.65 $19.02 $19.40 $19.79
2 $13.25 $13.65 $14.06 $14.48 $14.91 $15.29 $15.67 $16.06 $16.46 $16.87 $17.21 $17.55 $17.91 $18.26 $18.63 $19.00 $19.38 $19.77 $20.16 $20.57 $20.98
3 $14.05 $14.47 $14.90 $15.35 $15.81 $16.20 $16.61 $17.02 $17.45 $17.89 $18.24 $18.61 $18.98 $19.36 $19.75 $20.14 $20.54 $20.96 $21.37 $21.80 $22.24
4 $14.89 $15.33 $15.79 $16.27 $16.76 $17.18 $17.60 $18.04 $18.50 $18.96 $19.34 $19.72 $20.12 $20.52 $20.93 $21.35 $21.78 $22.21 $22.66 $23.11 $23.57
5 $15.78 $16.25 $16.74 $17.24 $17.76 $18.21 $18.66 $19.13 $19.61 $20.10 $20.50 $20.91 $21.33 $21.75 $22.19 $22.63 $23.08 $23.55 $24.02 $24.50 $24.99
6 $16.73 $17.23 $17.75 $18.28 $18.83 $19.30 $19.78 $20.27 $20.78 $21.30 $21.73 $22.16 $22.61 $23.06 $23.52 $23.99 $24.47 $24.96 $25.46 $25.97 $26.49
7 $17.73 $18.26 $18.81 $19.38 $19.96 $20.46 $20.97 $21.49 $22.03 $22.58 $23.03 $23.49 $23.96 $24.44 $24.93 $25.43 $25.94 $26.46 $26.98 $27.52 $28.07
8 $18.80 $19.36 $19.94 $20.54 $21.15 $21.68 $22.23 $22.78 $23.35 $23.93 $24.41 $24.90 $25.40 $25.91 $26.43 $26.95 $27.49 $28.04 $28.60 $29.18 $29.76
9 $19.92 $20.52 $21.14 $21.77 $22.42 $22.98 $23.56 $24.15 $24.75 $25.37 $25.88 $26.40 $26.92 $27.46 $28.01 $28.57 $29.14 $29.73 $30.32 $30.93 $31.54
10 $21.12 $21.75 $22.40 $23.08 $23.77 $24.36 $24.97 $25.60 $26.24 $26.89 $27.43 $27.98 $28.54 $29.11 $29.69 $30.29 $30.89 $31.51 $32.14 $32.78 $33.44
11 $22.39 $23.06 $23.75 $24.46 $25.20 $25.83 $26.47 $27.13 $27.81 $28.51 $29.08 $29.66 $30.25 $30.86 $31.47 $32.10 $32.74 $33.40 $34.07 $34.75 $35.44
12 $23.73 $24.44 $25.17 $25.93 $26.71 $27.37 $28.06 $28.76 $29.48 $30.22 $30.82 $31.44 $32.07 $32.71 $33.36 $34.03 $34.71 $35.40 $36.11 $36.83 $37.57
13 $25.15 $25.91 $26.68 $27.48 $28.31 $29.02 $29.74 $30.49 $31.25 $32.03 $32.67 $33.32 $33.99 $34.67 $35.36 $36.07 $36.79 $37.53 $38.28 $39.04 $39.82
14 $26.66 $27.46 $28.29 $29.13 $30.01 $30.76 $31.53 $32.32 $33.12 $33.95 $34.63 $35.32 $36.03 $36.75 $37.48 $38.23 $39.00 $39.78 $40.57 $41.39 $42.21
15 $28.26 $29.11 $29.98 $30.88 $31.81 $32.60 $33.42 $34.25 $35.11 $35.99 $36.71 $37.44 $38.19 $38.95 $39.73 $40.53 $41.34 $42.17 $43.01 $43.87 $44.75
16 $29.96 $30.86 $31.78 $32.73 $33.72 $34.56 $35.42 $36.31 $37.22 $38.15 $38.91 $39.69 $40.48 $41.29 $42.12 $42.96 $43.82 $44.70 $45.59 $46.50 $47.43
17 $31.75 $32.71 $33.69 $34.70 $35.74 $36.63 $37.55 $38.49 $39.45 $40.44 $41.25 $42.07 $42.91 $43.77 $44.65 $45.54 $46.45 $47.38 $48.33 $49.29 $50.28
18 $33.66 $34.67 $35.71 $36.78 $37.88 $38.83 $39.80 $40.80 $41.82 $42.86 $43.72 $44.59 $45.49 $46.40 $47.32 $48.27 $49.24 $50.22 $51.22 $52.25 $53.29
19 $35.68 $36.75 $37.85 $38.99 $40.16 $41.16 $42.19 $43.25 $44.33 $45.43 $46.34 $47.27 $48.22 $49.18 $50.16 $51.17 $52.19 $53.23 $54.30 $55.38 $56.49
20 $37.82 $38.95 $40.12 $41.33 $42.57 $43.63 $44.72 $45.84 $46.99 $48.16 $49.12 $50.11 $51.11 $52.13 $53.17 $54.24 $55.32 $56.43 $57.56 $58.71 $59.88
Frederick County Public SchoolsSupport Employee Pay Scales
Effective July 1, 2017 through June 30, 2018
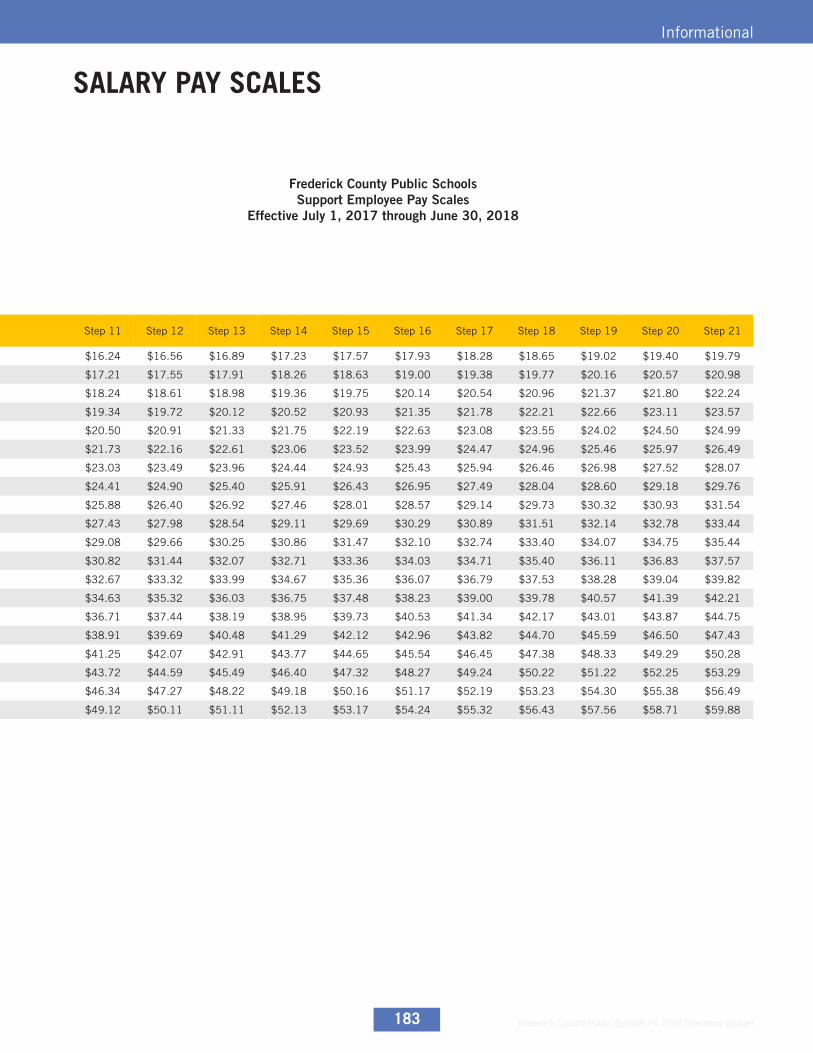
Frederick County Public Schools FY 2018 Operating Budget183
Informational
Frederick County Public SchoolsSupport Employee Pay Scales
Effective July 1, 2017 through June 30, 2018
Grade Step 1 Step 2 Step 3 Step 4 Step 5 Step 6 Step 7 Step 8 Step 9 Step 10 Step 11 Step 12 Step 13 Step 14 Step 15 Step 16 Step 17 Step 18 Step 19 Step 20 Step 21
1 $12.50 $12.88 $13.26 $13.66 $14.07 $14.42 $14.78 $15.15 $15.53 $15.92 $16.24 $16.56 $16.89 $17.23 $17.57 $17.93 $18.28 $18.65 $19.02 $19.40 $19.79
2 $13.25 $13.65 $14.06 $14.48 $14.91 $15.29 $15.67 $16.06 $16.46 $16.87 $17.21 $17.55 $17.91 $18.26 $18.63 $19.00 $19.38 $19.77 $20.16 $20.57 $20.98
3 $14.05 $14.47 $14.90 $15.35 $15.81 $16.20 $16.61 $17.02 $17.45 $17.89 $18.24 $18.61 $18.98 $19.36 $19.75 $20.14 $20.54 $20.96 $21.37 $21.80 $22.24
4 $14.89 $15.33 $15.79 $16.27 $16.76 $17.18 $17.60 $18.04 $18.50 $18.96 $19.34 $19.72 $20.12 $20.52 $20.93 $21.35 $21.78 $22.21 $22.66 $23.11 $23.57
5 $15.78 $16.25 $16.74 $17.24 $17.76 $18.21 $18.66 $19.13 $19.61 $20.10 $20.50 $20.91 $21.33 $21.75 $22.19 $22.63 $23.08 $23.55 $24.02 $24.50 $24.99
6 $16.73 $17.23 $17.75 $18.28 $18.83 $19.30 $19.78 $20.27 $20.78 $21.30 $21.73 $22.16 $22.61 $23.06 $23.52 $23.99 $24.47 $24.96 $25.46 $25.97 $26.49
7 $17.73 $18.26 $18.81 $19.38 $19.96 $20.46 $20.97 $21.49 $22.03 $22.58 $23.03 $23.49 $23.96 $24.44 $24.93 $25.43 $25.94 $26.46 $26.98 $27.52 $28.07
8 $18.80 $19.36 $19.94 $20.54 $21.15 $21.68 $22.23 $22.78 $23.35 $23.93 $24.41 $24.90 $25.40 $25.91 $26.43 $26.95 $27.49 $28.04 $28.60 $29.18 $29.76
9 $19.92 $20.52 $21.14 $21.77 $22.42 $22.98 $23.56 $24.15 $24.75 $25.37 $25.88 $26.40 $26.92 $27.46 $28.01 $28.57 $29.14 $29.73 $30.32 $30.93 $31.54
10 $21.12 $21.75 $22.40 $23.08 $23.77 $24.36 $24.97 $25.60 $26.24 $26.89 $27.43 $27.98 $28.54 $29.11 $29.69 $30.29 $30.89 $31.51 $32.14 $32.78 $33.44
11 $22.39 $23.06 $23.75 $24.46 $25.20 $25.83 $26.47 $27.13 $27.81 $28.51 $29.08 $29.66 $30.25 $30.86 $31.47 $32.10 $32.74 $33.40 $34.07 $34.75 $35.44
12 $23.73 $24.44 $25.17 $25.93 $26.71 $27.37 $28.06 $28.76 $29.48 $30.22 $30.82 $31.44 $32.07 $32.71 $33.36 $34.03 $34.71 $35.40 $36.11 $36.83 $37.57
13 $25.15 $25.91 $26.68 $27.48 $28.31 $29.02 $29.74 $30.49 $31.25 $32.03 $32.67 $33.32 $33.99 $34.67 $35.36 $36.07 $36.79 $37.53 $38.28 $39.04 $39.82
14 $26.66 $27.46 $28.29 $29.13 $30.01 $30.76 $31.53 $32.32 $33.12 $33.95 $34.63 $35.32 $36.03 $36.75 $37.48 $38.23 $39.00 $39.78 $40.57 $41.39 $42.21
15 $28.26 $29.11 $29.98 $30.88 $31.81 $32.60 $33.42 $34.25 $35.11 $35.99 $36.71 $37.44 $38.19 $38.95 $39.73 $40.53 $41.34 $42.17 $43.01 $43.87 $44.75
16 $29.96 $30.86 $31.78 $32.73 $33.72 $34.56 $35.42 $36.31 $37.22 $38.15 $38.91 $39.69 $40.48 $41.29 $42.12 $42.96 $43.82 $44.70 $45.59 $46.50 $47.43
17 $31.75 $32.71 $33.69 $34.70 $35.74 $36.63 $37.55 $38.49 $39.45 $40.44 $41.25 $42.07 $42.91 $43.77 $44.65 $45.54 $46.45 $47.38 $48.33 $49.29 $50.28
18 $33.66 $34.67 $35.71 $36.78 $37.88 $38.83 $39.80 $40.80 $41.82 $42.86 $43.72 $44.59 $45.49 $46.40 $47.32 $48.27 $49.24 $50.22 $51.22 $52.25 $53.29
19 $35.68 $36.75 $37.85 $38.99 $40.16 $41.16 $42.19 $43.25 $44.33 $45.43 $46.34 $47.27 $48.22 $49.18 $50.16 $51.17 $52.19 $53.23 $54.30 $55.38 $56.49
20 $37.82 $38.95 $40.12 $41.33 $42.57 $43.63 $44.72 $45.84 $46.99 $48.16 $49.12 $50.11 $51.11 $52.13 $53.17 $54.24 $55.32 $56.43 $57.56 $58.71 $59.88
Frederick County Public SchoolsSupport Employee Pay Scales
Effective July 1, 2017 through June 30, 2018
SALARY PAY SCALES

Frederick County Public Schools FY 2018 Operating Budget 184
Informational
Full-Time Equivalent (FTE) Position Changes
Divisions/DepartmentsFY 2017 Approved Budget
FY 2018 Approved Budget
Change
Board of Education 1.00 1.00 0.00Office of the Superintendent 2.00 2.00 0.00Academics, Communications, Technology and Student Achievement (ACTS) 4,274.18 4,362.15 87.97
Office of the Deputy Superintendent 3.00 3.00 0.00
Communication Services 14.00 13.00 (1.00)
Coordinator 2.00
Other Technical (2.00)
Secretary (1.00)
Accelerating Achievement and Equity 0.00 46.15 46.15
Teacher Staffing Formula 13.00
English Language Program from CII 32.41
Non-Formula Instructional Staff Redistribution 0.74
Special Education & Psychological Services 856.92 895.50 38.58
Special Education Staffing Formula 5.10
Non-Formula Instructional Staff Redistribution 33.48
System Accountability & School Improvement 19.00 19.00 0.00
Technology Infrastructure 32.00 31.00 (1.00)
Technology Support Specialist (1.00)
School Administration & Leadership 32.00 32.00 0.00
Elementary Schools 1,463.31 1,517.10 53.79
School Administration & Support Staffing Formula 6.60
School Classroom Teacher Staffing Formula 19.40
Non-Formula Instructional Staff Redistribution 27.79
Middle Schools 727.20 682.40 (44.80)
School Administration & Support Staffing Formula 5.00
School Classroom Teacher Staffing Formula 21.00
Non-Formula Instructional Staff Redistribution (70.80)
High Schools 902.73 925.05 22.32
School Administration & Support Staffing Formula 10
School Classroom Teacher Staffing Formula 10.60
Non-Formula Instructional Staff Redistribution 1.72
Charter Schools 81.70 89.04 7.34
Enrollment Growth 7.34
Student Services 28.36 27.36 (1.00)
CASS Worker (2.00)
Secretary 1.00
Curriculum, Instruction & Innovation 2.00 2.00 0.00
Curriculum Supervision 104.96 72.55 (32.41)
English Language Program to AAE (32.41)
Professional Learning 7.00 7.00 0.00
Full-Time Equivalent (FTE) Position Changes
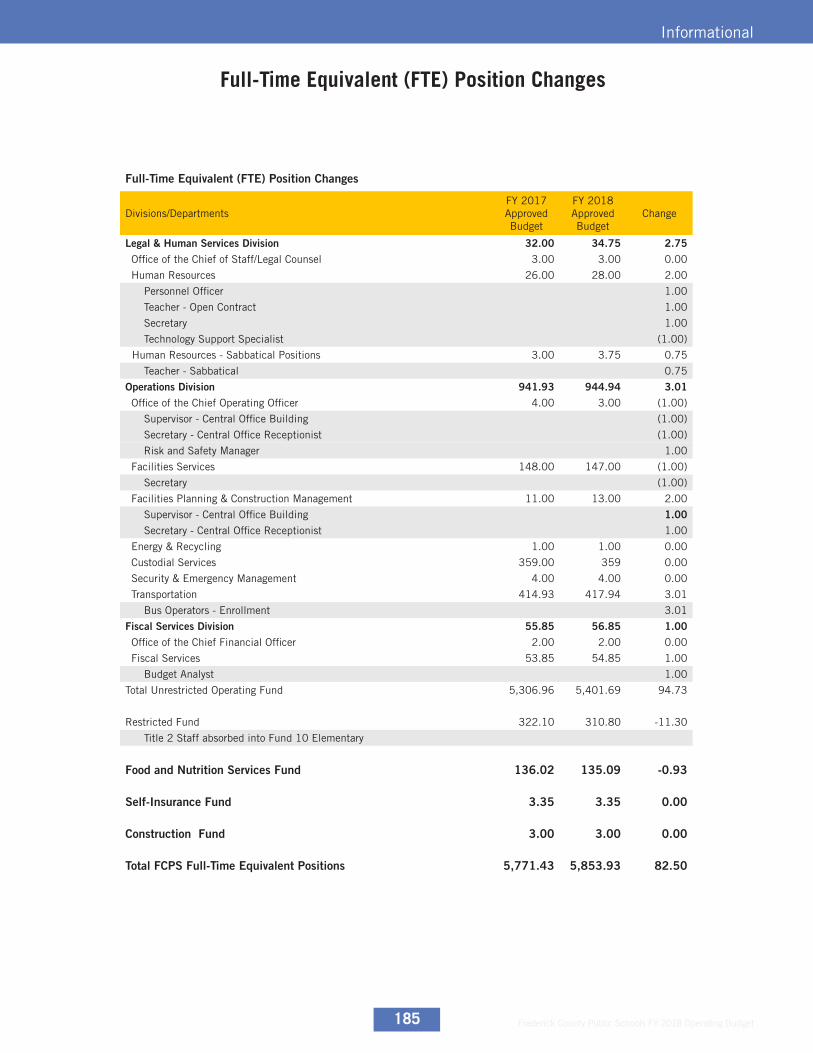
Frederick County Public Schools FY 2018 Operating Budget185
Informational
Full-Time Equivalent (FTE) Position Changes
Divisions/DepartmentsFY 2017 Approved Budget
FY 2018 Approved Budget
Change
Legal & Human Services Division 32.00 34.75 2.75Office of the Chief of Staff/Legal Counsel 3.00 3.00 0.00
Human Resources 26.00 28.00 2.00
Personnel Officer 1.00
Teacher - Open Contract 1.00
Secretary 1.00
Technology Support Specialist (1.00)
Human Resources - Sabbatical Positions 3.00 3.75 0.75
Teacher - Sabbatical 0.75
Operations Division 941.93 944.94 3.01Office of the Chief Operating Officer 4.00 3.00 (1.00)
Supervisor - Central Office Building (1.00)
Secretary - Central Office Receptionist (1.00)
Risk and Safety Manager 1.00
Facilities Services 148.00 147.00 (1.00)
Secretary (1.00)
Facilities Planning & Construction Management 11.00 13.00 2.00
Supervisor - Central Office Building 1.00Secretary - Central Office Receptionist 1.00
Energy & Recycling 1.00 1.00 0.00
Custodial Services 359.00 359 0.00
Security & Emergency Management 4.00 4.00 0.00
Transportation 414.93 417.94 3.01
Bus Operators - Enrollment 3.01
Fiscal Services Division 55.85 56.85 1.00Office of the Chief Financial Officer 2.00 2.00 0.00
Fiscal Services 53.85 54.85 1.00
Budget Analyst 1.00
Total Unrestricted Operating Fund 5,306.96 5,401.69 94.73
Restricted Fund 322.10 310.80 -11.30
Title 2 Staff absorbed into Fund 10 Elementary
Food and Nutrition Services Fund 136.02 135.09 -0.93
Self-Insurance Fund 3.35 3.35 0.00
Construction Fund 3.00 3.00 0.00
Total FCPS Full-Time Equivalent Positions 5,771.43 5,853.93 82.50
Full-Time Equivalent (FTE) Position Changes

Frederick County Public Schools FY 2018 Operating Budget 186
Informational
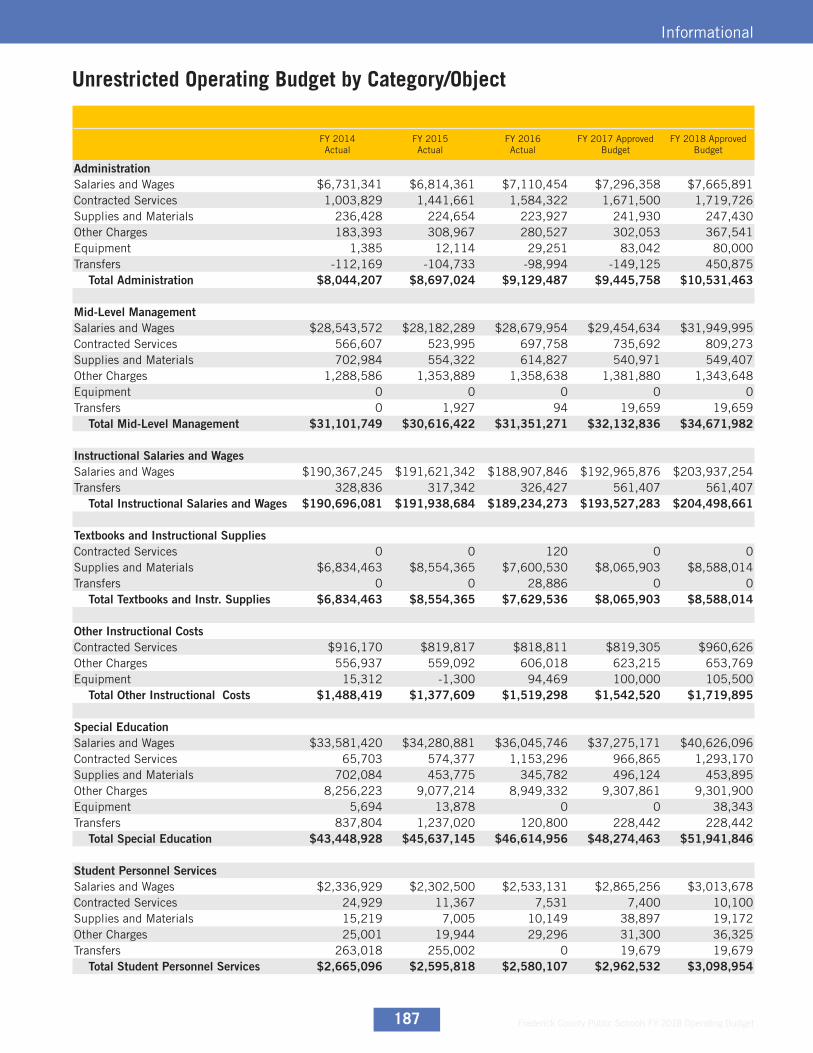
Frederick County Public Schools FY 2018 Operating Budget187
Informational
Unrestricted Operating Budget by Category/Object
FY 2014 Actual
FY 2015 Actual
FY 2016 Actual
FY 2017 Approved Budget
FY 2018 Approved Budget
AdministrationSalaries and Wages $6,731,341 $6,814,361 $7,110,454 $7,296,358 $7,665,891 Contracted Services 1,003,829 1,441,661 1,584,322 1,671,500 1,719,726Supplies and Materials 236,428 224,654 223,927 241,930 247,430Other Charges 183,393 308,967 280,527 302,053 367,541Equipment 1,385 12,114 29,251 83,042 80,000Transfers -112,169 -104,733 -98,994 -149,125 450,875 Total Administration $8,044,207 $8,697,024 $9,129,487 $9,445,758 $10,531,463
Mid-Level ManagementSalaries and Wages $28,543,572 $28,182,289 $28,679,954 $29,454,634 $31,949,995 Contracted Services 566,607 523,995 697,758 735,692 809,273Supplies and Materials 702,984 554,322 614,827 540,971 549,407Other Charges 1,288,586 1,353,889 1,358,638 1,381,880 1,343,648Equipment 0 0 0 0 0Transfers 0 1,927 94 19,659 19,659 Total Mid-Level Management $31,101,749 $30,616,422 $31,351,271 $32,132,836 $34,671,982
Instructional Salaries and WagesSalaries and Wages $190,367,245 $191,621,342 $188,907,846 $192,965,876 $203,937,254 Transfers 328,836 317,342 326,427 561,407 561,407 Total Instructional Salaries and Wages $190,696,081 $191,938,684 $189,234,273 $193,527,283 $204,498,661
Textbooks and Instructional SuppliesContracted Services 0 0 120 0 0Supplies and Materials $6,834,463 $8,554,365 $7,600,530 $8,065,903 $8,588,014 Transfers 0 0 28,886 0 0 Total Textbooks and Instr. Supplies $6,834,463 $8,554,365 $7,629,536 $8,065,903 $8,588,014
Other Instructional CostsContracted Services $916,170 $819,817 $818,811 $819,305 $960,626 Other Charges 556,937 559,092 606,018 623,215 653,769Equipment 15,312 -1,300 94,469 100,000 105,500 Total Other Instructional Costs $1,488,419 $1,377,609 $1,519,298 $1,542,520 $1,719,895
Special EducationSalaries and Wages $33,581,420 $34,280,881 $36,045,746 $37,275,171 $40,626,096 Contracted Services 65,703 574,377 1,153,296 966,865 1,293,170Supplies and Materials 702,084 453,775 345,782 496,124 453,895Other Charges 8,256,223 9,077,214 8,949,332 9,307,861 9,301,900Equipment 5,694 13,878 0 0 38,343Transfers 837,804 1,237,020 120,800 228,442 228,442 Total Special Education $43,448,928 $45,637,145 $46,614,956 $48,274,463 $51,941,846
Student Personnel ServicesSalaries and Wages $2,336,929 $2,302,500 $2,533,131 $2,865,256 $3,013,678 Contracted Services 24,929 11,367 7,531 7,400 10,100Supplies and Materials 15,219 7,005 10,149 38,897 19,172Other Charges 25,001 19,944 29,296 31,300 36,325Transfers 263,018 255,002 0 19,679 19,679 Total Student Personnel Services $2,665,096 $2,595,818 $2,580,107 $2,962,532 $3,098,954
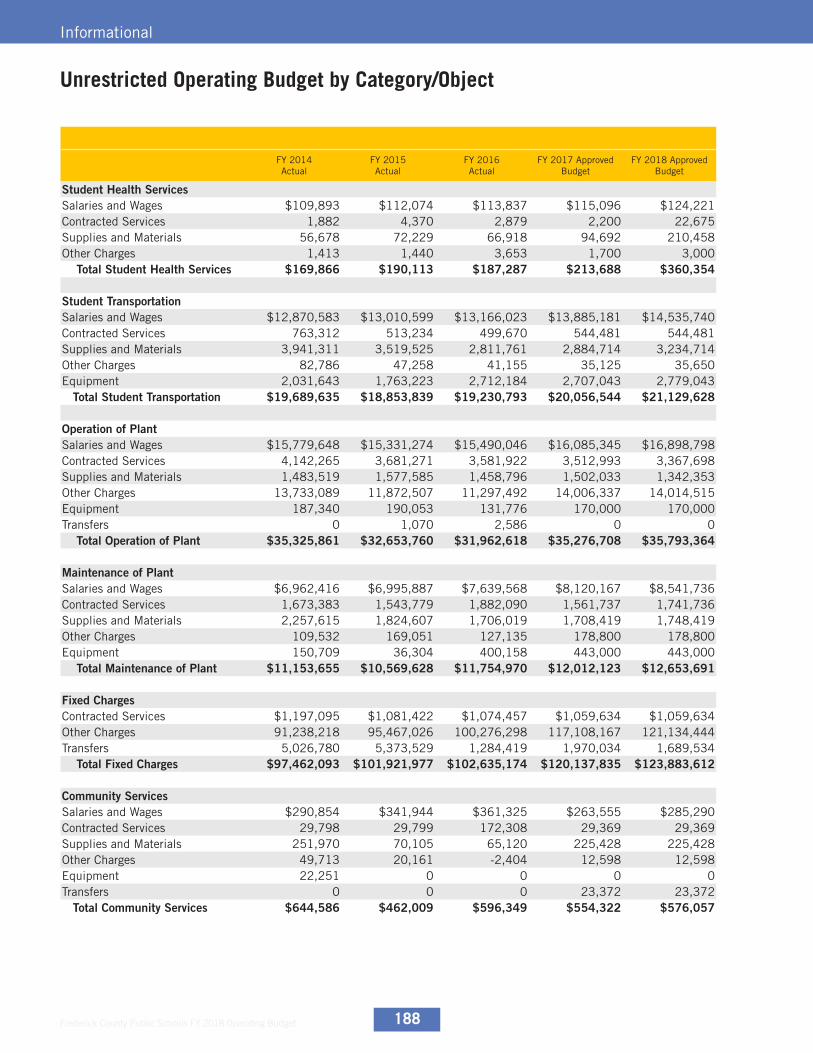
Frederick County Public Schools FY 2018 Operating Budget 188
Informational
Unrestricted Operating Budget by Category/Object
FY 2014 Actual
FY 2015 Actual
FY 2016 Actual
FY 2017 Approved Budget
FY 2018 Approved Budget
Student Health ServicesSalaries and Wages $109,893 $112,074 $113,837 $115,096 $124,221 Contracted Services 1,882 4,370 2,879 2,200 22,675Supplies and Materials 56,678 72,229 66,918 94,692 210,458Other Charges 1,413 1,440 3,653 1,700 3,000 Total Student Health Services $169,866 $190,113 $187,287 $213,688 $360,354
Student Transportation Salaries and Wages $12,870,583 $13,010,599 $13,166,023 $13,885,181 $14,535,740 Contracted Services 763,312 513,234 499,670 544,481 544,481Supplies and Materials 3,941,311 3,519,525 2,811,761 2,884,714 3,234,714Other Charges 82,786 47,258 41,155 35,125 35,650Equipment 2,031,643 1,763,223 2,712,184 2,707,043 2,779,043 Total Student Transportation $19,689,635 $18,853,839 $19,230,793 $20,056,544 $21,129,628
Operation of PlantSalaries and Wages $15,779,648 $15,331,274 $15,490,046 $16,085,345 $16,898,798 Contracted Services 4,142,265 3,681,271 3,581,922 3,512,993 3,367,698Supplies and Materials 1,483,519 1,577,585 1,458,796 1,502,033 1,342,353Other Charges 13,733,089 11,872,507 11,297,492 14,006,337 14,014,515Equipment 187,340 190,053 131,776 170,000 170,000Transfers 0 1,070 2,586 0 0 Total Operation of Plant $35,325,861 $32,653,760 $31,962,618 $35,276,708 $35,793,364
Maintenance of PlantSalaries and Wages $6,962,416 $6,995,887 $7,639,568 $8,120,167 $8,541,736 Contracted Services 1,673,383 1,543,779 1,882,090 1,561,737 1,741,736Supplies and Materials 2,257,615 1,824,607 1,706,019 1,708,419 1,748,419Other Charges 109,532 169,051 127,135 178,800 178,800Equipment 150,709 36,304 400,158 443,000 443,000 Total Maintenance of Plant $11,153,655 $10,569,628 $11,754,970 $12,012,123 $12,653,691
Fixed ChargesContracted Services $1,197,095 $1,081,422 $1,074,457 $1,059,634 $1,059,634 Other Charges 91,238,218 95,467,026 100,276,298 117,108,167 121,134,444Transfers 5,026,780 5,373,529 1,284,419 1,970,034 1,689,534 Total Fixed Charges $97,462,093 $101,921,977 $102,635,174 $120,137,835 $123,883,612
Community ServicesSalaries and Wages $290,854 $341,944 $361,325 $263,555 $285,290 Contracted Services 29,798 29,799 172,308 29,369 29,369Supplies and Materials 251,970 70,105 65,120 225,428 225,428Other Charges 49,713 20,161 -2,404 12,598 12,598Equipment 22,251 0 0 0 0Transfers 0 0 0 23,372 23,372 Total Community Services $644,586 $462,009 $596,349 $554,322 $576,057
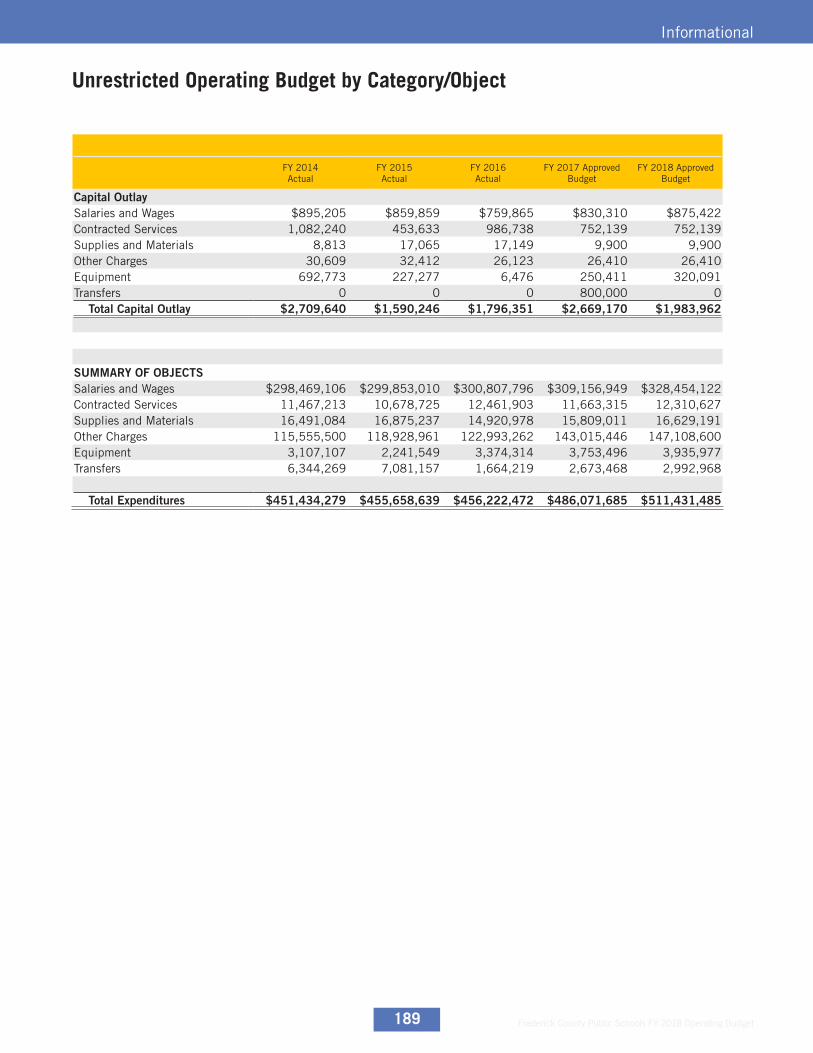
Frederick County Public Schools FY 2018 Operating Budget189
Informational
FY 2014 Actual
FY 2015 Actual
FY 2016 Actual
FY 2017 Approved Budget
FY 2018 Approved Budget
Capital OutlaySalaries and Wages $895,205 $859,859 $759,865 $830,310 $875,422 Contracted Services 1,082,240 453,633 986,738 752,139 752,139Supplies and Materials 8,813 17,065 17,149 9,900 9,900Other Charges 30,609 32,412 26,123 26,410 26,410Equipment 692,773 227,277 6,476 250,411 320,091Transfers 0 0 0 800,000 0 Total Capital Outlay $2,709,640 $1,590,246 $1,796,351 $2,669,170 $1,983,962
SUMMARY OF OBJECTS Salaries and Wages $298,469,106 $299,853,010 $300,807,796 $309,156,949 $328,454,122 Contracted Services 11,467,213 10,678,725 12,461,903 11,663,315 12,310,627Supplies and Materials 16,491,084 16,875,237 14,920,978 15,809,011 16,629,191Other Charges 115,555,500 118,928,961 122,993,262 143,015,446 147,108,600Equipment 3,107,107 2,241,549 3,374,314 3,753,496 3,935,977Transfers 6,344,269 7,081,157 1,664,219 2,673,468 2,992,968
Total Expenditures $451,434,279 $455,658,639 $456,222,472 $486,071,685 $511,431,485
Unrestricted Operating Budget by Category/Object
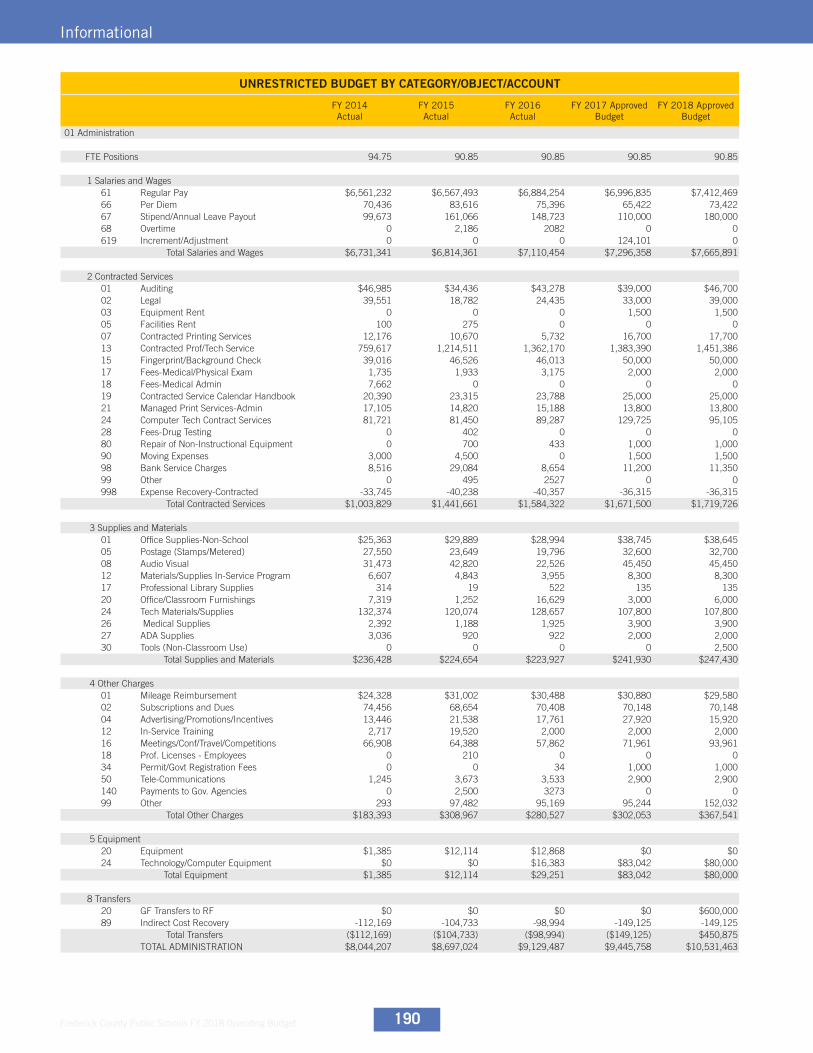
Frederick County Public Schools FY 2018 Operating Budget 190
Informational
UNRESTRICTED BUDGET BY CATEGORY/OBJECT/ACCOUNT
FY 2014 Actual
FY 2015 Actual
FY 2016 Actual
FY 2017 Approved Budget
FY 2018 Approved Budget
01 Administration
FTE Positions 94.75 90.85 90.85 90.85 90.85
1 Salaries and Wages61 Regular Pay $6,561,232 $6,567,493 $6,884,254 $6,996,835 $7,412,469 66 Per Diem 70,436 83,616 75,396 65,422 73,42267 Stipend/Annual Leave Payout 99,673 161,066 148,723 110,000 180,00068 Overtime 0 2,186 2082 0 0619 Increment/Adjustment 0 0 0 124,101 0
Total Salaries and Wages $6,731,341 $6,814,361 $7,110,454 $7,296,358 $7,665,891
2 Contracted Services01 Auditing $46,985 $34,436 $43,278 $39,000 $46,700 02 Legal 39,551 18,782 24,435 33,000 39,00003 Equipment Rent 0 0 0 1,500 1,50005 Facilities Rent 100 275 0 0 007 Contracted Printing Services 12,176 10,670 5,732 16,700 17,70013 Contracted Prof/Tech Service 759,617 1,214,511 1,362,170 1,383,390 1,451,38615 Fingerprint/Background Check 39,016 46,526 46,013 50,000 50,00017 Fees-Medical/Physical Exam 1,735 1,933 3,175 2,000 2,00018 Fees-Medical Admin 7,662 0 0 0 019 Contracted Service Calendar Handbook 20,390 23,315 23,788 25,000 25,00021 Managed Print Services-Admin 17,105 14,820 15,188 13,800 13,80024 Computer Tech Contract Services 81,721 81,450 89,287 129,725 95,10528 Fees-Drug Testing 0 402 0 0 080 Repair of Non-Instructional Equipment 0 700 433 1,000 1,00090 Moving Expenses 3,000 4,500 0 1,500 1,50098 Bank Service Charges 8,516 29,084 8,654 11,200 11,35099 Other 0 495 2527 0 0998 Expense Recovery-Contracted -33,745 -40,238 -40,357 -36,315 -36,315
Total Contracted Services $1,003,829 $1,441,661 $1,584,322 $1,671,500 $1,719,726
3 Supplies and Materials01 Office Supplies-Non-School $25,363 $29,889 $28,994 $38,745 $38,645 05 Postage (Stamps/Metered) 27,550 23,649 19,796 32,600 32,70008 Audio Visual 31,473 42,820 22,526 45,450 45,45012 Materials/Supplies In-Service Program 6,607 4,843 3,955 8,300 8,30017 Professional Library Supplies 314 19 522 135 13520 Office/Classroom Furnishings 7,319 1,252 16,629 3,000 6,00024 Tech Materials/Supplies 132,374 120,074 128,657 107,800 107,80026 Medical Supplies 2,392 1,188 1,925 3,900 3,90027 ADA Supplies 3,036 920 922 2,000 2,00030 Tools (Non-Classroom Use) 0 0 0 0 2,500
Total Supplies and Materials $236,428 $224,654 $223,927 $241,930 $247,430
4 Other Charges01 Mileage Reimbursement $24,328 $31,002 $30,488 $30,880 $29,580 02 Subscriptions and Dues 74,456 68,654 70,408 70,148 70,14804 Advertising/Promotions/Incentives 13,446 21,538 17,761 27,920 15,92012 In-Service Training 2,717 19,520 2,000 2,000 2,00016 Meetings/Conf/Travel/Competitions 66,908 64,388 57,862 71,961 93,96118 Prof. Licenses - Employees 0 210 0 0 034 Permit/Govt Registration Fees 0 0 34 1,000 1,00050 Tele-Communications 1,245 3,673 3,533 2,900 2,900140 Payments to Gov. Agencies 0 2,500 3273 0 099 Other 293 97,482 95,169 95,244 152,032
Total Other Charges $183,393 $308,967 $280,527 $302,053 $367,541
5 Equipment20 Equipment $1,385 $12,114 $12,868 $0 $0 24 Technology/Computer Equipment $0 $0 $16,383 $83,042 $80,000
Total Equipment $1,385 $12,114 $29,251 $83,042 $80,000
8 Transfers20 GF Transfers to RF $0 $0 $0 $0 $600,000 89 Indirect Cost Recovery -112,169 -104,733 -98,994 -149,125 -149,125
Total Transfers ($112,169) ($104,733) ($98,994) ($149,125) $450,875 TOTAL ADMINISTRATION $8,044,207 $8,697,024 $9,129,487 $9,445,758 $10,531,463
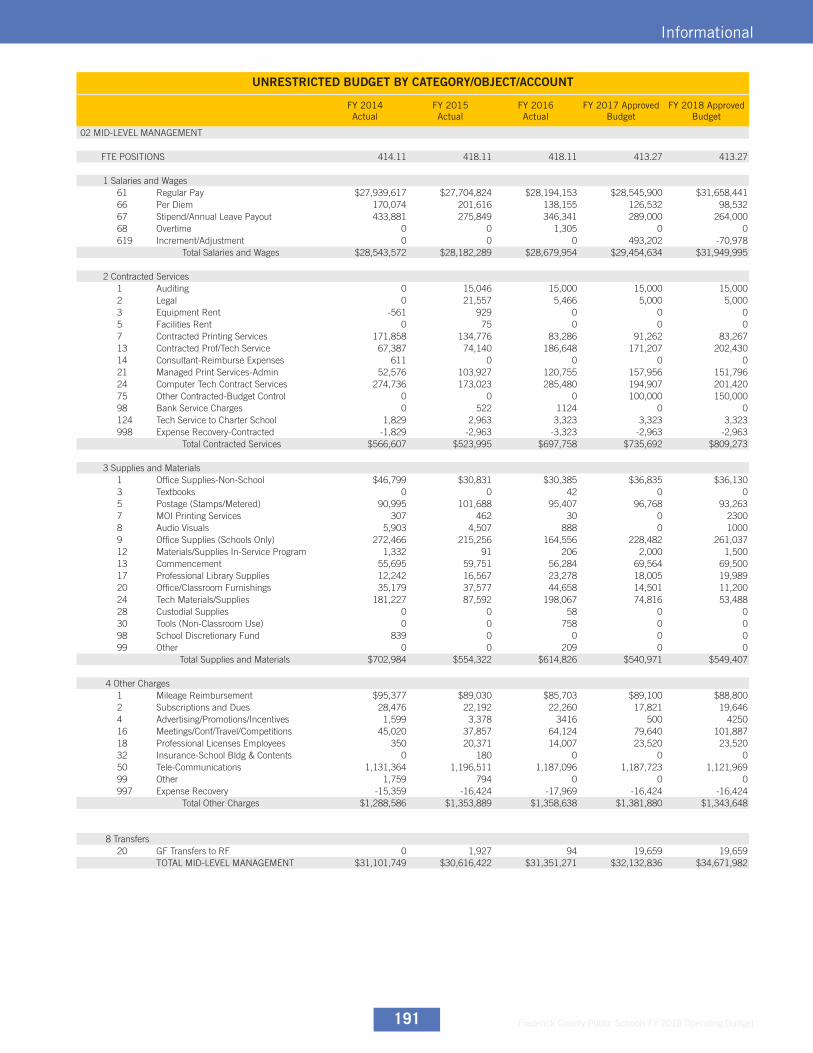
Frederick County Public Schools FY 2018 Operating Budget191
Informational
UNRESTRICTED BUDGET BY CATEGORY/OBJECT/ACCOUNT
FY 2014 Actual
FY 2015 Actual
FY 2016 Actual
FY 2017 Approved Budget
FY 2018 Approved Budget
02 MID-LEVEL MANAGEMENT
FTE POSITIONS 414.11 418.11 418.11 413.27 413.27
1 Salaries and Wages61 Regular Pay $27,939,617 $27,704,824 $28,194,153 $28,545,900 $31,658,441 66 Per Diem 170,074 201,616 138,155 126,532 98,53267 Stipend/Annual Leave Payout 433,881 275,849 346,341 289,000 264,00068 Overtime 0 0 1,305 0 0619 Increment/Adjustment 0 0 0 493,202 -70,978
Total Salaries and Wages $28,543,572 $28,182,289 $28,679,954 $29,454,634 $31,949,995
2 Contracted Services1 Auditing 0 15,046 15,000 15,000 15,0002 Legal 0 21,557 5,466 5,000 5,0003 Equipment Rent -561 929 0 0 05 Facilities Rent 0 75 0 0 07 Contracted Printing Services 171,858 134,776 83,286 91,262 83,26713 Contracted Prof/Tech Service 67,387 74,140 186,648 171,207 202,43014 Consultant-Reimburse Expenses 611 0 0 0 021 Managed Print Services-Admin 52,576 103,927 120,755 157,956 151,79624 Computer Tech Contract Services 274,736 173,023 285,480 194,907 201,42075 Other Contracted-Budget Control 0 0 0 100,000 150,00098 Bank Service Charges 0 522 1124 0 0124 Tech Service to Charter School 1,829 2,963 3,323 3,323 3,323998 Expense Recovery-Contracted -1,829 -2,963 -3,323 -2,963 -2,963
Total Contracted Services $566,607 $523,995 $697,758 $735,692 $809,273
3 Supplies and Materials1 Office Supplies-Non-School $46,799 $30,831 $30,385 $36,835 $36,130 3 Textbooks 0 0 42 0 05 Postage (Stamps/Metered) 90,995 101,688 95,407 96,768 93,2637 MOI Printing Services 307 462 30 0 23008 Audio Visuals 5,903 4,507 888 0 10009 Office Supplies (Schools Only) 272,466 215,256 164,556 228,482 261,03712 Materials/Supplies In-Service Program 1,332 91 206 2,000 1,50013 Commencement 55,695 59,751 56,284 69,564 69,50017 Professional Library Supplies 12,242 16,567 23,278 18,005 19,98920 Office/Classroom Furnishings 35,179 37,577 44,658 14,501 11,20024 Tech Materials/Supplies 181,227 87,592 198,067 74,816 53,48828 Custodial Supplies 0 0 58 0 030 Tools (Non-Classroom Use) 0 0 758 0 098 School Discretionary Fund 839 0 0 0 099 Other 0 0 209 0 0
Total Supplies and Materials $702,984 $554,322 $614,826 $540,971 $549,407
4 Other Charges1 Mileage Reimbursement $95,377 $89,030 $85,703 $89,100 $88,800 2 Subscriptions and Dues 28,476 22,192 22,260 17,821 19,6464 Advertising/Promotions/Incentives 1,599 3,378 3416 500 425016 Meetings/Conf/Travel/Competitions 45,020 37,857 64,124 79,640 101,88718 Professional Licenses Employees 350 20,371 14,007 23,520 23,52032 Insurance-School Bldg & Contents 0 180 0 0 050 Tele-Communications 1,131,364 1,196,511 1,187,096 1,187,723 1,121,96999 Other 1,759 794 0 0 0997 Expense Recovery -15,359 -16,424 -17,969 -16,424 -16,424
Total Other Charges $1,288,586 $1,353,889 $1,358,638 $1,381,880 $1,343,648
8 Transfers20 GF Transfers to RF 0 1,927 94 19,659 19,659
TOTAL MID-LEVEL MANAGEMENT $31,101,749 $30,616,422 $31,351,271 $32,132,836 $34,671,982
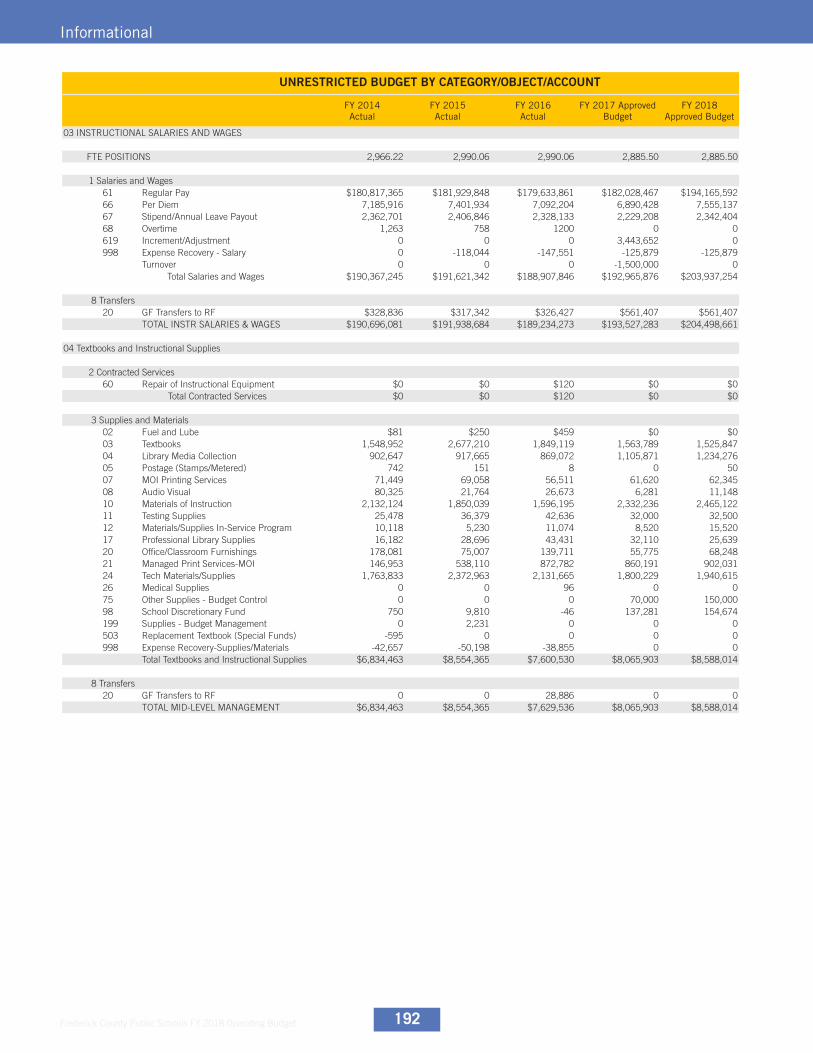
Frederick County Public Schools FY 2018 Operating Budget 192
Informational
UNRESTRICTED BUDGET BY CATEGORY/OBJECT/ACCOUNT
FY 2014 Actual
FY 2015 Actual
FY 2016 Actual
FY 2017 Approved Budget
FY 2018 Approved Budget
03 INSTRUCTIONAL SALARIES AND WAGES
FTE POSITIONS 2,966.22 2,990.06 2,990.06 2,885.50 2,885.50
1 Salaries and Wages61 Regular Pay $180,817,365 $181,929,848 $179,633,861 $182,028,467 $194,165,592 66 Per Diem 7,185,916 7,401,934 7,092,204 6,890,428 7,555,13767 Stipend/Annual Leave Payout 2,362,701 2,406,846 2,328,133 2,229,208 2,342,40468 Overtime 1,263 758 1200 0 0619 Increment/Adjustment 0 0 0 3,443,652 0998 Expense Recovery - Salary 0 -118,044 -147,551 -125,879 -125,879
Turnover 0 0 0 -1,500,000 0Total Salaries and Wages $190,367,245 $191,621,342 $188,907,846 $192,965,876 $203,937,254
8 Transfers20 GF Transfers to RF $328,836 $317,342 $326,427 $561,407 $561,407
TOTAL INSTR SALARIES & WAGES $190,696,081 $191,938,684 $189,234,273 $193,527,283 $204,498,661
04 Textbooks and Instructional Supplies
2 Contracted Services60 Repair of Instructional Equipment $0 $0 $120 $0 $0
Total Contracted Services $0 $0 $120 $0 $0
3 Supplies and Materials02 Fuel and Lube $81 $250 $459 $0 $0 03 Textbooks 1,548,952 2,677,210 1,849,119 1,563,789 1,525,84704 Library Media Collection 902,647 917,665 869,072 1,105,871 1,234,27605 Postage (Stamps/Metered) 742 151 8 0 5007 MOI Printing Services 71,449 69,058 56,511 61,620 62,34508 Audio Visual 80,325 21,764 26,673 6,281 11,14810 Materials of Instruction 2,132,124 1,850,039 1,596,195 2,332,236 2,465,12211 Testing Supplies 25,478 36,379 42,636 32,000 32,50012 Materials/Supplies In-Service Program 10,118 5,230 11,074 8,520 15,52017 Professional Library Supplies 16,182 28,696 43,431 32,110 25,63920 Office/Classroom Furnishings 178,081 75,007 139,711 55,775 68,24821 Managed Print Services-MOI 146,953 538,110 872,782 860,191 902,03124 Tech Materials/Supplies 1,763,833 2,372,963 2,131,665 1,800,229 1,940,61526 Medical Supplies 0 0 96 0 075 Other Supplies - Budget Control 0 0 0 70,000 150,00098 School Discretionary Fund 750 9,810 -46 137,281 154,674199 Supplies - Budget Management 0 2,231 0 0 0503 Replacement Textbook (Special Funds) -595 0 0 0 0998 Expense Recovery-Supplies/Materials -42,657 -50,198 -38,855 0 0
Total Textbooks and Instructional Supplies $6,834,463 $8,554,365 $7,600,530 $8,065,903 $8,588,014
8 Transfers20 GF Transfers to RF 0 0 28,886 0 0
TOTAL MID-LEVEL MANAGEMENT $6,834,463 $8,554,365 $7,629,536 $8,065,903 $8,588,014
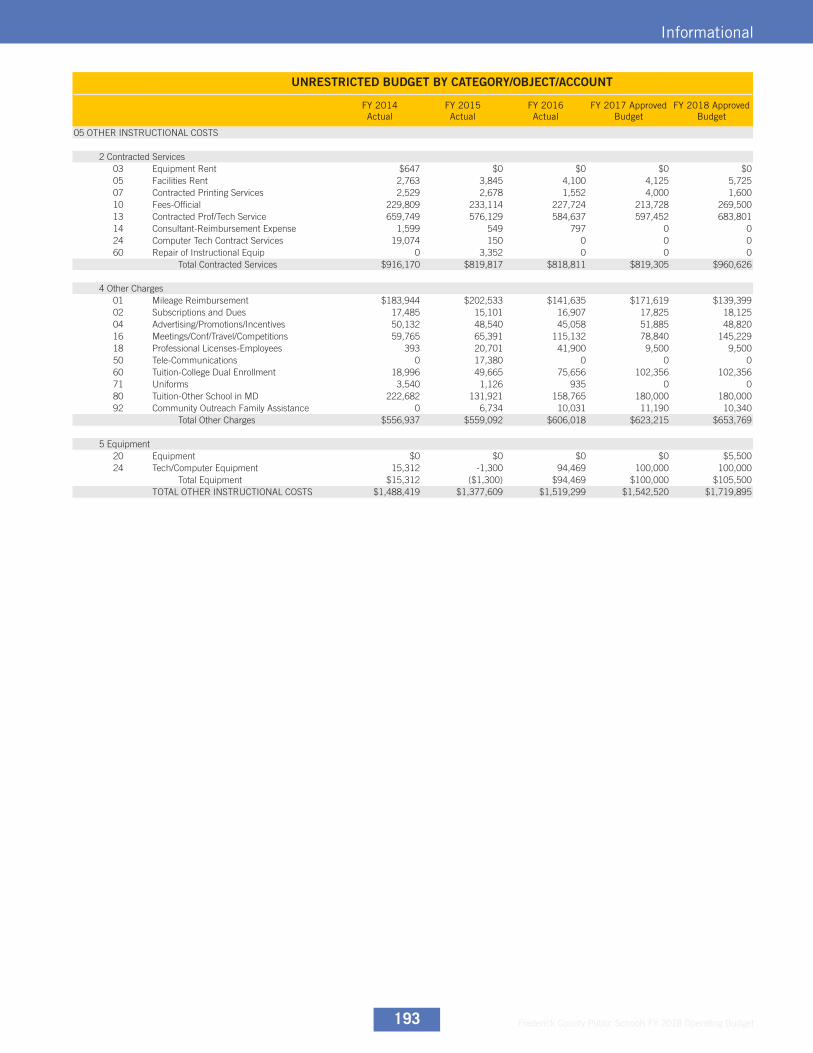
Frederick County Public Schools FY 2018 Operating Budget193
Informational
UNRESTRICTED BUDGET BY CATEGORY/OBJECT/ACCOUNT
FY 2014 Actual
FY 2015 Actual
FY 2016 Actual
FY 2017 Approved Budget
FY 2018 Approved Budget
05 OTHER INSTRUCTIONAL COSTS
2 Contracted Services03 Equipment Rent $647 $0 $0 $0 $0 05 Facilities Rent 2,763 3,845 4,100 4,125 5,72507 Contracted Printing Services 2,529 2,678 1,552 4,000 1,60010 Fees-Official 229,809 233,114 227,724 213,728 269,50013 Contracted Prof/Tech Service 659,749 576,129 584,637 597,452 683,80114 Consultant-Reimbursement Expense 1,599 549 797 0 024 Computer Tech Contract Services 19,074 150 0 0 060 Repair of Instructional Equip 0 3,352 0 0 0
Total Contracted Services $916,170 $819,817 $818,811 $819,305 $960,626
4 Other Charges01 Mileage Reimbursement $183,944 $202,533 $141,635 $171,619 $139,399 02 Subscriptions and Dues 17,485 15,101 16,907 17,825 18,12504 Advertising/Promotions/Incentives 50,132 48,540 45,058 51,885 48,82016 Meetings/Conf/Travel/Competitions 59,765 65,391 115,132 78,840 145,22918 Professional Licenses-Employees 393 20,701 41,900 9,500 9,50050 Tele-Communications 0 17,380 0 0 060 Tuition-College Dual Enrollment 18,996 49,665 75,656 102,356 102,35671 Uniforms 3,540 1,126 935 0 080 Tuition-Other School in MD 222,682 131,921 158,765 180,000 180,00092 Community Outreach Family Assistance 0 6,734 10,031 11,190 10,340
Total Other Charges $556,937 $559,092 $606,018 $623,215 $653,769
5 Equipment20 Equipment $0 $0 $0 $0 $5,500 24 Tech/Computer Equipment 15,312 -1,300 94,469 100,000 100,000
Total Equipment $15,312 ($1,300) $94,469 $100,000 $105,500 TOTAL OTHER INSTRUCTIONAL COSTS $1,488,419 $1,377,609 $1,519,299 $1,542,520 $1,719,895
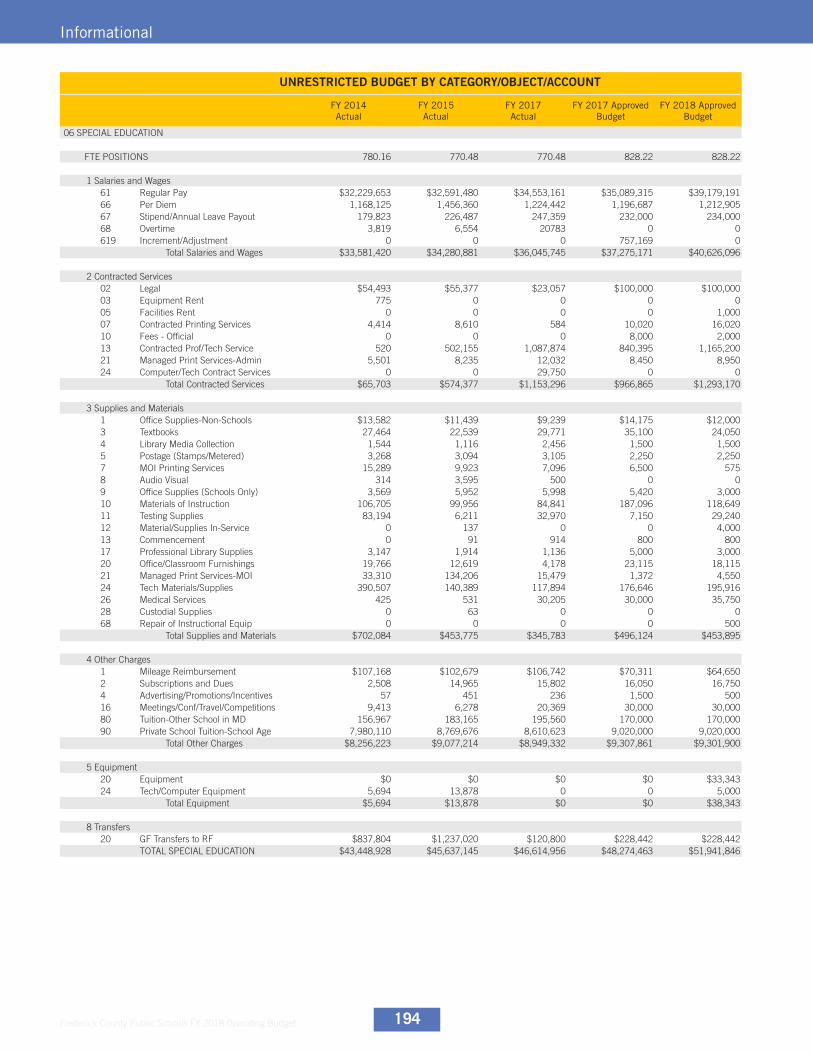
Frederick County Public Schools FY 2018 Operating Budget 194
Informational
UNRESTRICTED BUDGET BY CATEGORY/OBJECT/ACCOUNT
FY 2014 Actual
FY 2015 Actual
FY 2017 Actual
FY 2017 Approved Budget
FY 2018 Approved Budget
06 SPECIAL EDUCATION
FTE POSITIONS 780.16 770.48 770.48 828.22 828.22
1 Salaries and Wages61 Regular Pay $32,229,653 $32,591,480 $34,553,161 $35,089,315 $39,179,191 66 Per Diem 1,168,125 1,456,360 1,224,442 1,196,687 1,212,90567 Stipend/Annual Leave Payout 179,823 226,487 247,359 232,000 234,00068 Overtime 3,819 6,554 20783 0 0619 Increment/Adjustment 0 0 0 757,169 0
Total Salaries and Wages $33,581,420 $34,280,881 $36,045,745 $37,275,171 $40,626,096
2 Contracted Services02 Legal $54,493 $55,377 $23,057 $100,000 $100,000 03 Equipment Rent 775 0 0 0 005 Facilities Rent 0 0 0 0 1,00007 Contracted Printing Services 4,414 8,610 584 10,020 16,02010 Fees - Official 0 0 0 8,000 2,00013 Contracted Prof/Tech Service 520 502,155 1,087,874 840,395 1,165,20021 Managed Print Services-Admin 5,501 8,235 12,032 8,450 8,95024 Computer/Tech Contract Services 0 0 29,750 0 0
Total Contracted Services $65,703 $574,377 $1,153,296 $966,865 $1,293,170
3 Supplies and Materials1 Office Supplies-Non-Schools $13,582 $11,439 $9,239 $14,175 $12,000 3 Textbooks 27,464 22,539 29,771 35,100 24,0504 Library Media Collection 1,544 1,116 2,456 1,500 1,5005 Postage (Stamps/Metered) 3,268 3,094 3,105 2,250 2,2507 MOI Printing Services 15,289 9,923 7,096 6,500 5758 Audio Visual 314 3,595 500 0 09 Office Supplies (Schools Only) 3,569 5,952 5,998 5,420 3,00010 Materials of Instruction 106,705 99,956 84,841 187,096 118,64911 Testing Supplies 83,194 6,211 32,970 7,150 29,24012 Material/Supplies In-Service 0 137 0 0 4,00013 Commencement 0 91 914 800 80017 Professional Library Supplies 3,147 1,914 1,136 5,000 3,00020 Office/Classroom Furnishings 19,766 12,619 4,178 23,115 18,11521 Managed Print Services-MOI 33,310 134,206 15,479 1,372 4,55024 Tech Materials/Supplies 390,507 140,389 117,894 176,646 195,91626 Medical Services 425 531 30,205 30,000 35,75028 Custodial Supplies 0 63 0 0 068 Repair of Instructional Equip 0 0 0 0 500
Total Supplies and Materials $702,084 $453,775 $345,783 $496,124 $453,895
4 Other Charges1 Mileage Reimbursement $107,168 $102,679 $106,742 $70,311 $64,650 2 Subscriptions and Dues 2,508 14,965 15,802 16,050 16,7504 Advertising/Promotions/Incentives 57 451 236 1,500 50016 Meetings/Conf/Travel/Competitions 9,413 6,278 20,369 30,000 30,00080 Tuition-Other School in MD 156,967 183,165 195,560 170,000 170,00090 Private School Tuition-School Age 7,980,110 8,769,676 8,610,623 9,020,000 9,020,000
Total Other Charges $8,256,223 $9,077,214 $8,949,332 $9,307,861 $9,301,900
5 Equipment20 Equipment $0 $0 $0 $0 $33,343 24 Tech/Computer Equipment 5,694 13,878 0 0 5,000
Total Equipment $5,694 $13,878 $0 $0 $38,343
8 Transfers20 GF Transfers to RF $837,804 $1,237,020 $120,800 $228,442 $228,442
TOTAL SPECIAL EDUCATION $43,448,928 $45,637,145 $46,614,956 $48,274,463 $51,941,846
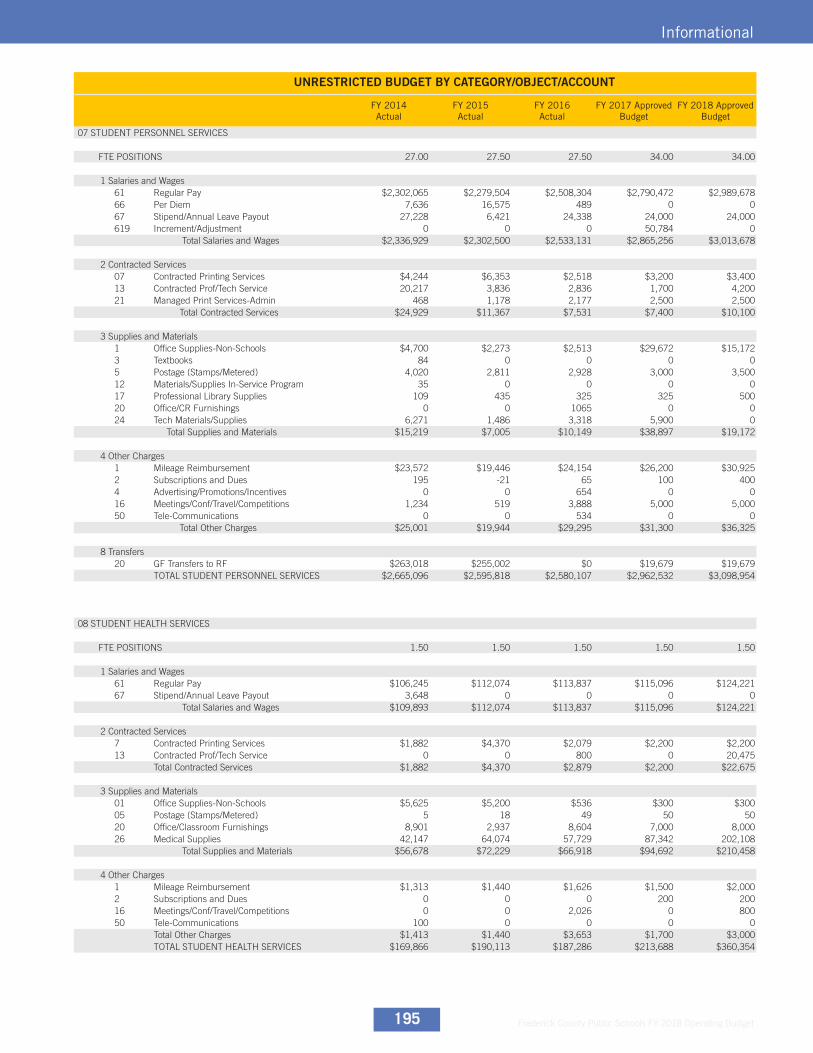
Frederick County Public Schools FY 2018 Operating Budget195
Informational
UNRESTRICTED BUDGET BY CATEGORY/OBJECT/ACCOUNT
FY 2014 Actual
FY 2015 Actual
FY 2016 Actual
FY 2017 Approved Budget
FY 2018 Approved Budget
07 STUDENT PERSONNEL SERVICES
FTE POSITIONS 27.00 27.50 27.50 34.00 34.00
1 Salaries and Wages61 Regular Pay $2,302,065 $2,279,504 $2,508,304 $2,790,472 $2,989,678 66 Per Diem 7,636 16,575 489 0 067 Stipend/Annual Leave Payout 27,228 6,421 24,338 24,000 24,000619 Increment/Adjustment 0 0 0 50,784 0
Total Salaries and Wages $2,336,929 $2,302,500 $2,533,131 $2,865,256 $3,013,678
2 Contracted Services07 Contracted Printing Services $4,244 $6,353 $2,518 $3,200 $3,400 13 Contracted Prof/Tech Service 20,217 3,836 2,836 1,700 4,20021 Managed Print Services-Admin 468 1,178 2,177 2,500 2,500
Total Contracted Services $24,929 $11,367 $7,531 $7,400 $10,100
3 Supplies and Materials1 Office Supplies-Non-Schools $4,700 $2,273 $2,513 $29,672 $15,172 3 Textbooks 84 0 0 0 05 Postage (Stamps/Metered) 4,020 2,811 2,928 3,000 3,50012 Materials/Supplies In-Service Program 35 0 0 0 017 Professional Library Supplies 109 435 325 325 50020 Office/CR Furnishings 0 0 1065 0 024 Tech Materials/Supplies 6,271 1,486 3,318 5,900 0
Total Supplies and Materials $15,219 $7,005 $10,149 $38,897 $19,172
4 Other Charges1 Mileage Reimbursement $23,572 $19,446 $24,154 $26,200 $30,925 2 Subscriptions and Dues 195 -21 65 100 4004 Advertising/Promotions/Incentives 0 0 654 0 016 Meetings/Conf/Travel/Competitions 1,234 519 3,888 5,000 5,00050 Tele-Communications 0 0 534 0 0
Total Other Charges $25,001 $19,944 $29,295 $31,300 $36,325
8 Transfers20 GF Transfers to RF $263,018 $255,002 $0 $19,679 $19,679
TOTAL STUDENT PERSONNEL SERVICES $2,665,096 $2,595,818 $2,580,107 $2,962,532 $3,098,954
08 STUDENT HEALTH SERVICES
FTE POSITIONS 1.50 1.50 1.50 1.50 1.50
1 Salaries and Wages61 Regular Pay $106,245 $112,074 $113,837 $115,096 $124,221 67 Stipend/Annual Leave Payout 3,648 0 0 0 0
Total Salaries and Wages $109,893 $112,074 $113,837 $115,096 $124,221
2 Contracted Services7 Contracted Printing Services $1,882 $4,370 $2,079 $2,200 $2,200 13 Contracted Prof/Tech Service 0 0 800 0 20,475
Total Contracted Services $1,882 $4,370 $2,879 $2,200 $22,675
3 Supplies and Materials01 Office Supplies-Non-Schools $5,625 $5,200 $536 $300 $300 05 Postage (Stamps/Metered) 5 18 49 50 5020 Office/Classroom Furnishings 8,901 2,937 8,604 7,000 8,00026 Medical Supplies 42,147 64,074 57,729 87,342 202,108
Total Supplies and Materials $56,678 $72,229 $66,918 $94,692 $210,458
4 Other Charges1 Mileage Reimbursement $1,313 $1,440 $1,626 $1,500 $2,000 2 Subscriptions and Dues 0 0 0 200 20016 Meetings/Conf/Travel/Competitions 0 0 2,026 0 80050 Tele-Communications 100 0 0 0 0
Total Other Charges $1,413 $1,440 $3,653 $1,700 $3,000 TOTAL STUDENT HEALTH SERVICES $169,866 $190,113 $187,286 $213,688 $360,354
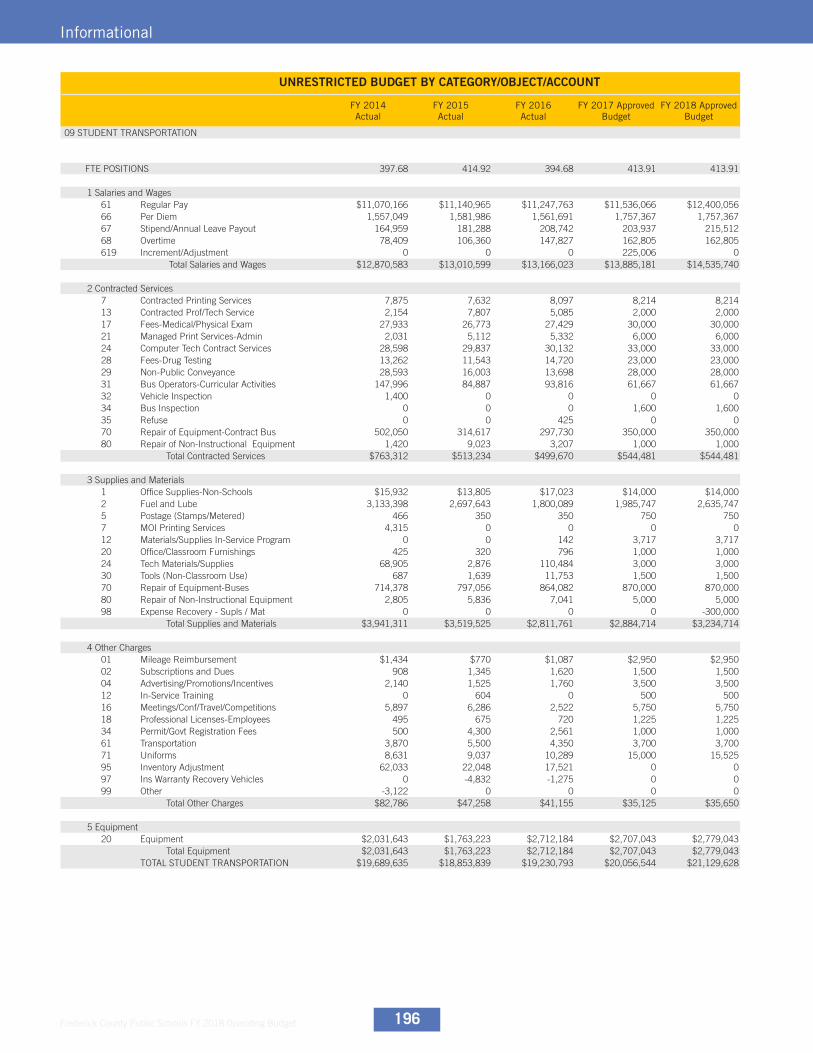
Frederick County Public Schools FY 2018 Operating Budget 196
Informational
UNRESTRICTED BUDGET BY CATEGORY/OBJECT/ACCOUNT
FY 2014 Actual
FY 2015 Actual
FY 2016 Actual
FY 2017 Approved Budget
FY 2018 Approved Budget
09 STUDENT TRANSPORTATION
FTE POSITIONS 397.68 414.92 394.68 413.91 413.91
1 Salaries and Wages61 Regular Pay $11,070,166 $11,140,965 $11,247,763 $11,536,066 $12,400,056 66 Per Diem 1,557,049 1,581,986 1,561,691 1,757,367 1,757,36767 Stipend/Annual Leave Payout 164,959 181,288 208,742 203,937 215,51268 Overtime 78,409 106,360 147,827 162,805 162,805619 Increment/Adjustment 0 0 0 225,006 0
Total Salaries and Wages $12,870,583 $13,010,599 $13,166,023 $13,885,181 $14,535,740
2 Contracted Services7 Contracted Printing Services 7,875 7,632 8,097 8,214 8,21413 Contracted Prof/Tech Service 2,154 7,807 5,085 2,000 2,00017 Fees-Medical/Physical Exam 27,933 26,773 27,429 30,000 30,00021 Managed Print Services-Admin 2,031 5,112 5,332 6,000 6,00024 Computer Tech Contract Services 28,598 29,837 30,132 33,000 33,00028 Fees-Drug Testing 13,262 11,543 14,720 23,000 23,00029 Non-Public Conveyance 28,593 16,003 13,698 28,000 28,00031 Bus Operators-Curricular Activities 147,996 84,887 93,816 61,667 61,66732 Vehicle Inspection 1,400 0 0 0 034 Bus Inspection 0 0 0 1,600 1,60035 Refuse 0 0 425 0 070 Repair of Equipment-Contract Bus 502,050 314,617 297,730 350,000 350,00080 Repair of Non-Instructional Equipment 1,420 9,023 3,207 1,000 1,000
Total Contracted Services $763,312 $513,234 $499,670 $544,481 $544,481
3 Supplies and Materials1 Office Supplies-Non-Schools $15,932 $13,805 $17,023 $14,000 $14,000 2 Fuel and Lube 3,133,398 2,697,643 1,800,089 1,985,747 2,635,7475 Postage (Stamps/Metered) 466 350 350 750 7507 MOI Printing Services 4,315 0 0 0 012 Materials/Supplies In-Service Program 0 0 142 3,717 3,71720 Office/Classroom Furnishings 425 320 796 1,000 1,00024 Tech Materials/Supplies 68,905 2,876 110,484 3,000 3,00030 Tools (Non-Classroom Use) 687 1,639 11,753 1,500 1,50070 Repair of Equipment-Buses 714,378 797,056 864,082 870,000 870,00080 Repair of Non-Instructional Equipment 2,805 5,836 7,041 5,000 5,00098 Expense Recovery - Supls / Mat 0 0 0 0 -300,000
Total Supplies and Materials $3,941,311 $3,519,525 $2,811,761 $2,884,714 $3,234,714
4 Other Charges01 Mileage Reimbursement $1,434 $770 $1,087 $2,950 $2,950 02 Subscriptions and Dues 908 1,345 1,620 1,500 1,50004 Advertising/Promotions/Incentives 2,140 1,525 1,760 3,500 3,50012 In-Service Training 0 604 0 500 50016 Meetings/Conf/Travel/Competitions 5,897 6,286 2,522 5,750 5,75018 Professional Licenses-Employees 495 675 720 1,225 1,22534 Permit/Govt Registration Fees 500 4,300 2,561 1,000 1,00061 Transportation 3,870 5,500 4,350 3,700 3,70071 Uniforms 8,631 9,037 10,289 15,000 15,52595 Inventory Adjustment 62,033 22,048 17,521 0 097 Ins Warranty Recovery Vehicles 0 -4,832 -1,275 0 099 Other -3,122 0 0 0 0
Total Other Charges $82,786 $47,258 $41,155 $35,125 $35,650
5 Equipment20 Equipment $2,031,643 $1,763,223 $2,712,184 $2,707,043 $2,779,043
Total Equipment $2,031,643 $1,763,223 $2,712,184 $2,707,043 $2,779,043 TOTAL STUDENT TRANSPORTATION $19,689,635 $18,853,839 $19,230,793 $20,056,544 $21,129,628
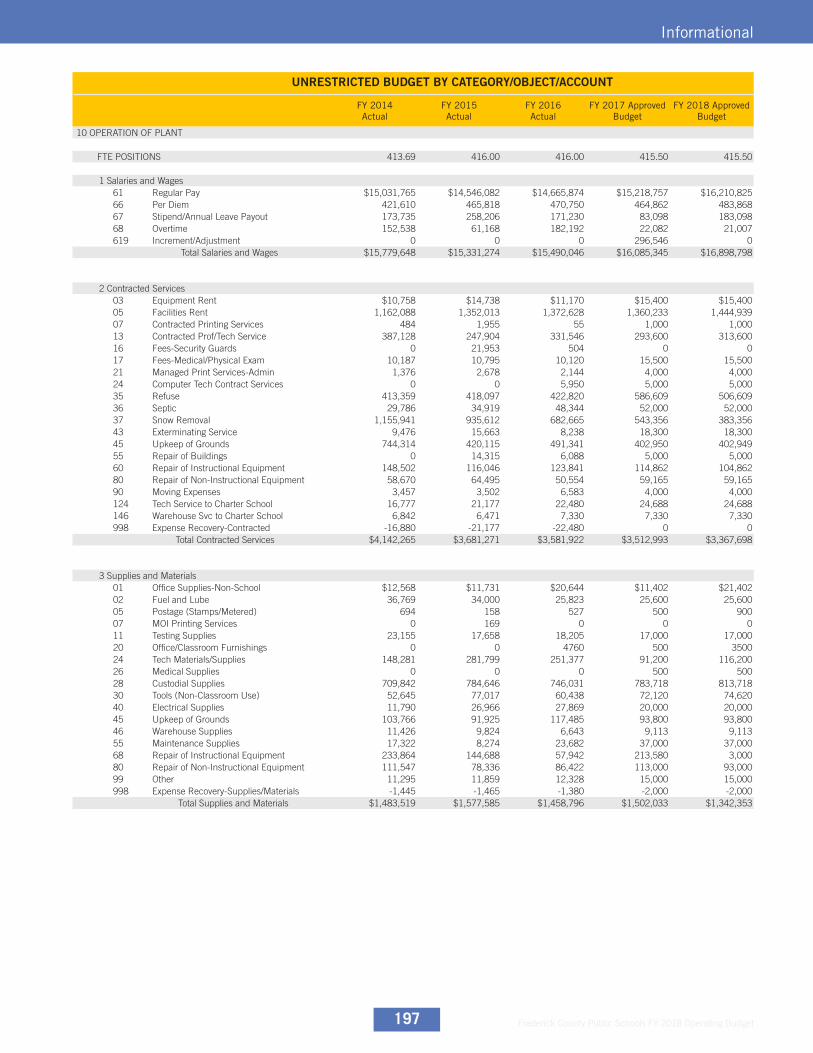
Frederick County Public Schools FY 2018 Operating Budget197
Informational
UNRESTRICTED BUDGET BY CATEGORY/OBJECT/ACCOUNT
FY 2014 Actual
FY 2015 Actual
FY 2016 Actual
FY 2017 Approved Budget
FY 2018 Approved Budget
10 OPERATION OF PLANT
FTE POSITIONS 413.69 416.00 416.00 415.50 415.50
1 Salaries and Wages61 Regular Pay $15,031,765 $14,546,082 $14,665,874 $15,218,757 $16,210,825 66 Per Diem 421,610 465,818 470,750 464,862 483,86867 Stipend/Annual Leave Payout 173,735 258,206 171,230 83,098 183,09868 Overtime 152,538 61,168 182,192 22,082 21,007619 Increment/Adjustment 0 0 0 296,546 0
Total Salaries and Wages $15,779,648 $15,331,274 $15,490,046 $16,085,345 $16,898,798
2 Contracted Services03 Equipment Rent $10,758 $14,738 $11,170 $15,400 $15,400 05 Facilities Rent 1,162,088 1,352,013 1,372,628 1,360,233 1,444,93907 Contracted Printing Services 484 1,955 55 1,000 1,00013 Contracted Prof/Tech Service 387,128 247,904 331,546 293,600 313,60016 Fees-Security Guards 0 21,953 504 0 017 Fees-Medical/Physical Exam 10,187 10,795 10,120 15,500 15,50021 Managed Print Services-Admin 1,376 2,678 2,144 4,000 4,00024 Computer Tech Contract Services 0 0 5,950 5,000 5,00035 Refuse 413,359 418,097 422,820 586,609 506,60936 Septic 29,786 34,919 48,344 52,000 52,00037 Snow Removal 1,155,941 935,612 682,665 543,356 383,35643 Exterminating Service 9,476 15,663 8,238 18,300 18,30045 Upkeep of Grounds 744,314 420,115 491,341 402,950 402,94955 Repair of Buildings 0 14,315 6,088 5,000 5,00060 Repair of Instructional Equipment 148,502 116,046 123,841 114,862 104,86280 Repair of Non-Instructional Equipment 58,670 64,495 50,554 59,165 59,16590 Moving Expenses 3,457 3,502 6,583 4,000 4,000124 Tech Service to Charter School 16,777 21,177 22,480 24,688 24,688146 Warehouse Svc to Charter School 6,842 6,471 7,330 7,330 7,330998 Expense Recovery-Contracted -16,880 -21,177 -22,480 0 0
Total Contracted Services $4,142,265 $3,681,271 $3,581,922 $3,512,993 $3,367,698
3 Supplies and Materials01 Office Supplies-Non-School $12,568 $11,731 $20,644 $11,402 $21,402 02 Fuel and Lube 36,769 34,000 25,823 25,600 25,60005 Postage (Stamps/Metered) 694 158 527 500 90007 MOI Printing Services 0 169 0 0 011 Testing Supplies 23,155 17,658 18,205 17,000 17,00020 Office/Classroom Furnishings 0 0 4760 500 350024 Tech Materials/Supplies 148,281 281,799 251,377 91,200 116,20026 Medical Supplies 0 0 0 500 50028 Custodial Supplies 709,842 784,646 746,031 783,718 813,71830 Tools (Non-Classroom Use) 52,645 77,017 60,438 72,120 74,62040 Electrical Supplies 11,790 26,966 27,869 20,000 20,00045 Upkeep of Grounds 103,766 91,925 117,485 93,800 93,80046 Warehouse Supplies 11,426 9,824 6,643 9,113 9,11355 Maintenance Supplies 17,322 8,274 23,682 37,000 37,00068 Repair of Instructional Equipment 233,864 144,688 57,942 213,580 3,00080 Repair of Non-Instructional Equipment 111,547 78,336 86,422 113,000 93,00099 Other 11,295 11,859 12,328 15,000 15,000998 Expense Recovery-Supplies/Materials -1,445 -1,465 -1,380 -2,000 -2,000
Total Supplies and Materials $1,483,519 $1,577,585 $1,458,796 $1,502,033 $1,342,353
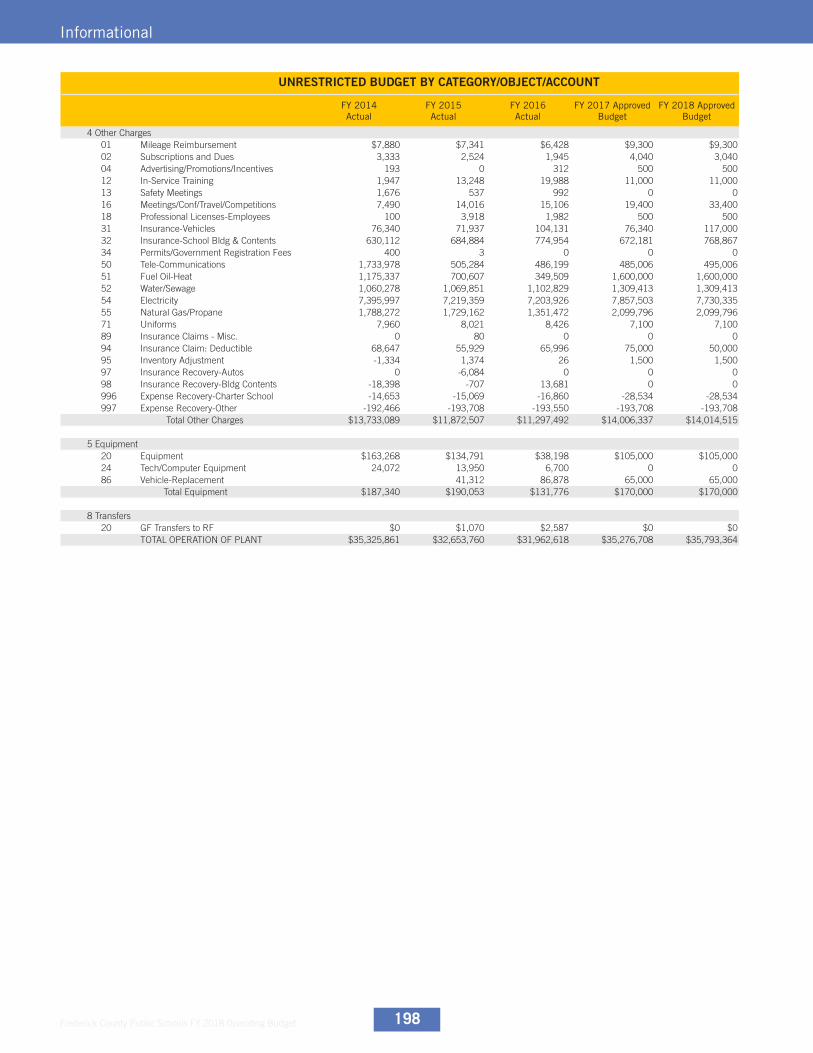
Frederick County Public Schools FY 2018 Operating Budget 198
Informational
UNRESTRICTED BUDGET BY CATEGORY/OBJECT/ACCOUNT
FY 2014 Actual
FY 2015 Actual
FY 2016 Actual
FY 2017 Approved Budget
FY 2018 Approved Budget
4 Other Charges01 Mileage Reimbursement $7,880 $7,341 $6,428 $9,300 $9,300 02 Subscriptions and Dues 3,333 2,524 1,945 4,040 3,04004 Advertising/Promotions/Incentives 193 0 312 500 50012 In-Service Training 1,947 13,248 19,988 11,000 11,00013 Safety Meetings 1,676 537 992 0 016 Meetings/Conf/Travel/Competitions 7,490 14,016 15,106 19,400 33,40018 Professional Licenses-Employees 100 3,918 1,982 500 50031 Insurance-Vehicles 76,340 71,937 104,131 76,340 117,00032 Insurance-School Bldg & Contents 630,112 684,884 774,954 672,181 768,86734 Permits/Government Registration Fees 400 3 0 0 050 Tele-Communications 1,733,978 505,284 486,199 485,006 495,00651 Fuel Oil-Heat 1,175,337 700,607 349,509 1,600,000 1,600,00052 Water/Sewage 1,060,278 1,069,851 1,102,829 1,309,413 1,309,41354 Electricity 7,395,997 7,219,359 7,203,926 7,857,503 7,730,33555 Natural Gas/Propane 1,788,272 1,729,162 1,351,472 2,099,796 2,099,79671 Uniforms 7,960 8,021 8,426 7,100 7,10089 Insurance Claims - Misc. 0 80 0 0 094 Insurance Claim: Deductible 68,647 55,929 65,996 75,000 50,00095 Inventory Adjustment -1,334 1,374 26 1,500 1,50097 Insurance Recovery-Autos 0 -6,084 0 0 098 Insurance Recovery-Bldg Contents -18,398 -707 13,681 0 0996 Expense Recovery-Charter School -14,653 -15,069 -16,860 -28,534 -28,534997 Expense Recovery-Other -192,466 -193,708 -193,550 -193,708 -193,708
Total Other Charges $13,733,089 $11,872,507 $11,297,492 $14,006,337 $14,014,515
5 Equipment20 Equipment $163,268 $134,791 $38,198 $105,000 $105,000 24 Tech/Computer Equipment 24,072 13,950 6,700 0 086 Vehicle-Replacement 41,312 86,878 65,000 65,000
Total Equipment $187,340 $190,053 $131,776 $170,000 $170,000
8 Transfers20 GF Transfers to RF $0 $1,070 $2,587 $0 $0
TOTAL OPERATION OF PLANT $35,325,861 $32,653,760 $31,962,618 $35,276,708 $35,793,364
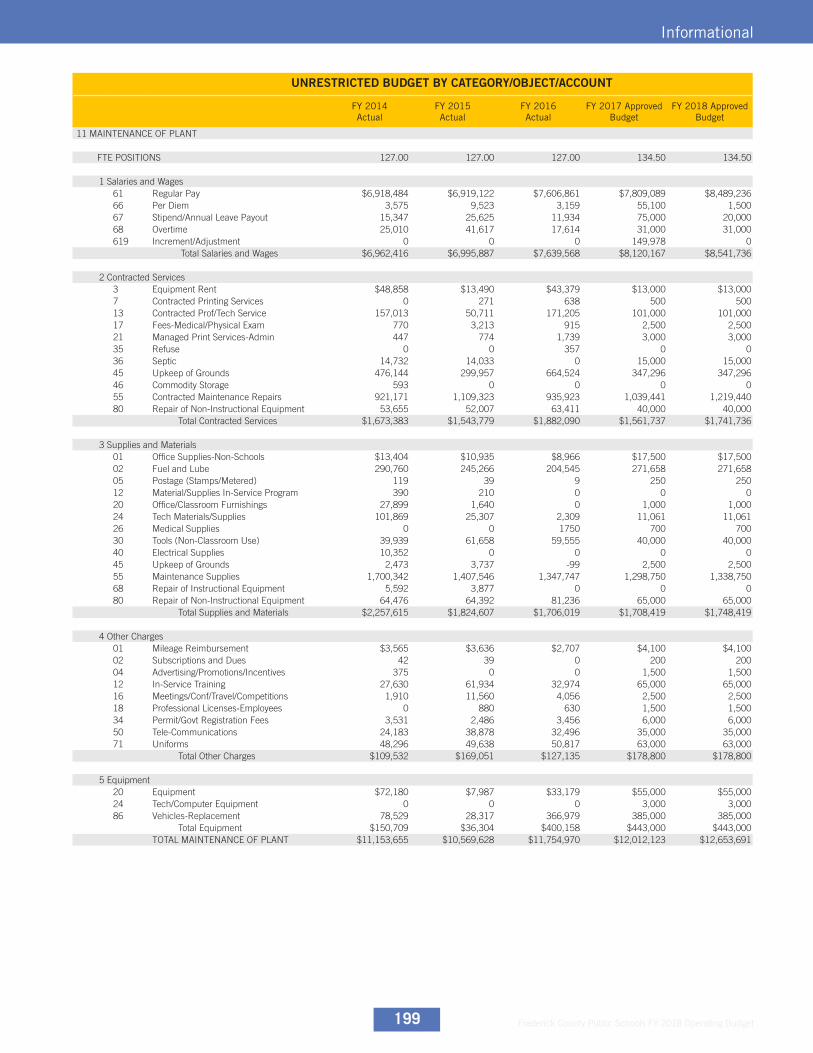
Frederick County Public Schools FY 2018 Operating Budget199
Informational
UNRESTRICTED BUDGET BY CATEGORY/OBJECT/ACCOUNT
FY 2014 Actual
FY 2015 Actual
FY 2016 Actual
FY 2017 Approved Budget
FY 2018 Approved Budget
11 MAINTENANCE OF PLANT
FTE POSITIONS 127.00 127.00 127.00 134.50 134.50
1 Salaries and Wages61 Regular Pay $6,918,484 $6,919,122 $7,606,861 $7,809,089 $8,489,236 66 Per Diem 3,575 9,523 3,159 55,100 1,50067 Stipend/Annual Leave Payout 15,347 25,625 11,934 75,000 20,00068 Overtime 25,010 41,617 17,614 31,000 31,000619 Increment/Adjustment 0 0 0 149,978 0
Total Salaries and Wages $6,962,416 $6,995,887 $7,639,568 $8,120,167 $8,541,736
2 Contracted Services3 Equipment Rent $48,858 $13,490 $43,379 $13,000 $13,000 7 Contracted Printing Services 0 271 638 500 50013 Contracted Prof/Tech Service 157,013 50,711 171,205 101,000 101,00017 Fees-Medical/Physical Exam 770 3,213 915 2,500 2,50021 Managed Print Services-Admin 447 774 1,739 3,000 3,00035 Refuse 0 0 357 0 036 Septic 14,732 14,033 0 15,000 15,00045 Upkeep of Grounds 476,144 299,957 664,524 347,296 347,29646 Commodity Storage 593 0 0 0 055 Contracted Maintenance Repairs 921,171 1,109,323 935,923 1,039,441 1,219,44080 Repair of Non-Instructional Equipment 53,655 52,007 63,411 40,000 40,000
Total Contracted Services $1,673,383 $1,543,779 $1,882,090 $1,561,737 $1,741,736
3 Supplies and Materials01 Office Supplies-Non-Schools $13,404 $10,935 $8,966 $17,500 $17,500 02 Fuel and Lube 290,760 245,266 204,545 271,658 271,65805 Postage (Stamps/Metered) 119 39 9 250 25012 Material/Supplies In-Service Program 390 210 0 0 020 Office/Classroom Furnishings 27,899 1,640 0 1,000 1,00024 Tech Materials/Supplies 101,869 25,307 2,309 11,061 11,06126 Medical Supplies 0 0 1750 700 70030 Tools (Non-Classroom Use) 39,939 61,658 59,555 40,000 40,00040 Electrical Supplies 10,352 0 0 0 045 Upkeep of Grounds 2,473 3,737 -99 2,500 2,50055 Maintenance Supplies 1,700,342 1,407,546 1,347,747 1,298,750 1,338,75068 Repair of Instructional Equipment 5,592 3,877 0 0 080 Repair of Non-Instructional Equipment 64,476 64,392 81,236 65,000 65,000
Total Supplies and Materials $2,257,615 $1,824,607 $1,706,019 $1,708,419 $1,748,419
4 Other Charges01 Mileage Reimbursement $3,565 $3,636 $2,707 $4,100 $4,100 02 Subscriptions and Dues 42 39 0 200 20004 Advertising/Promotions/Incentives 375 0 0 1,500 1,50012 In-Service Training 27,630 61,934 32,974 65,000 65,00016 Meetings/Conf/Travel/Competitions 1,910 11,560 4,056 2,500 2,50018 Professional Licenses-Employees 0 880 630 1,500 1,50034 Permit/Govt Registration Fees 3,531 2,486 3,456 6,000 6,00050 Tele-Communications 24,183 38,878 32,496 35,000 35,00071 Uniforms 48,296 49,638 50,817 63,000 63,000
Total Other Charges $109,532 $169,051 $127,135 $178,800 $178,800
5 Equipment20 Equipment $72,180 $7,987 $33,179 $55,000 $55,000 24 Tech/Computer Equipment 0 0 0 3,000 3,00086 Vehicles-Replacement 78,529 28,317 366,979 385,000 385,000
Total Equipment $150,709 $36,304 $400,158 $443,000 $443,000 TOTAL MAINTENANCE OF PLANT $11,153,655 $10,569,628 $11,754,970 $12,012,123 $12,653,691
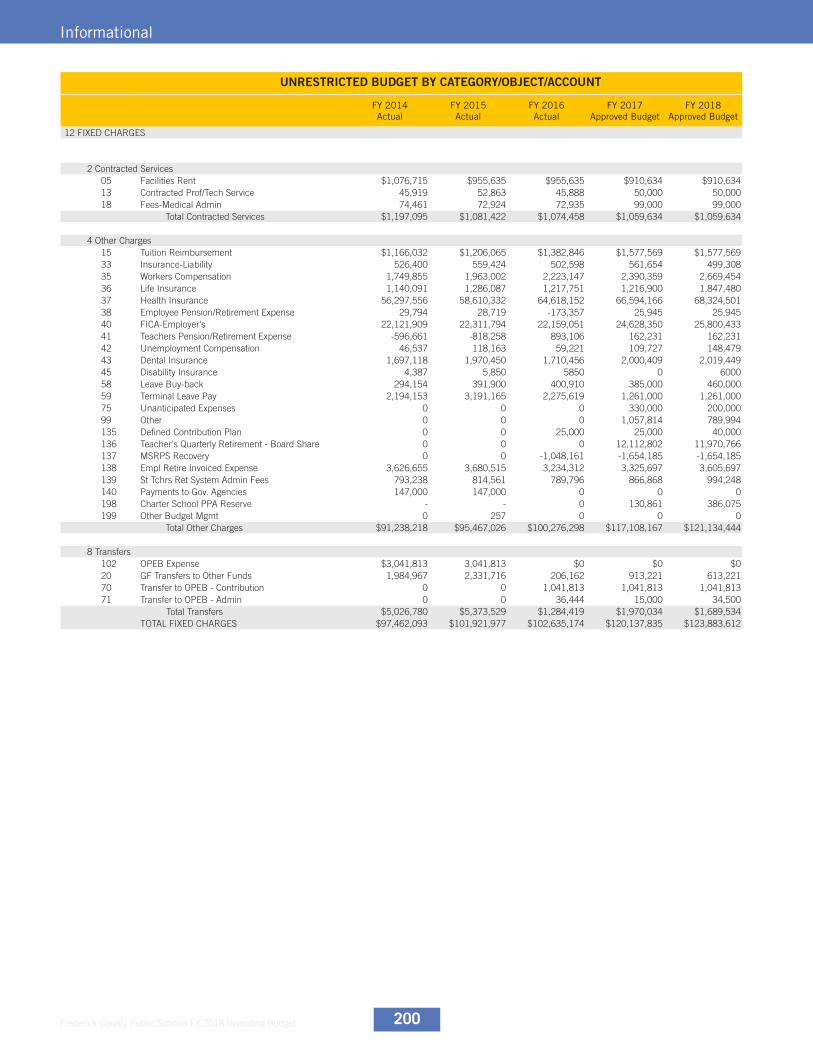
Frederick County Public Schools FY 2018 Operating Budget 200
Informational
UNRESTRICTED BUDGET BY CATEGORY/OBJECT/ACCOUNT
FY 2014 Actual
FY 2015 Actual
FY 2016 Actual
FY 2017 Approved Budget
FY 2018 Approved Budget
12 FIXED CHARGES
2 Contracted Services05 Facilities Rent $1,076,715 $955,635 $955,635 $910,634 $910,634 13 Contracted Prof/Tech Service 45,919 52,863 45,888 50,000 50,00018 Fees-Medical Admin 74,461 72,924 72,935 99,000 99,000 Total Contracted Services $1,197,095 $1,081,422 $1,074,458 $1,059,634 $1,059,634
4 Other Charges15 Tuition Reimbursement $1,166,032 $1,206,065 $1,382,846 $1,577,569 $1,577,569 33 Insurance-Liability 526,400 559,424 502,598 561,654 499,30835 Workers Compensation 1,749,855 1,963,002 2,223,147 2,390,359 2,669,45436 Life Insurance 1,140,091 1,286,087 1,217,751 1,216,900 1,847,48037 Health Insurance 56,297,556 58,610,332 64,618,152 66,594,166 68,324,50138 Employee Pension/Retirement Expense 29,794 28,719 -173,357 25,945 25,94540 FICA-Employer's 22,121,909 22,311,794 22,159,051 24,628,350 25,800,43341 Teachers Pension/Retirement Expense -596,661 -818,258 893,106 162,231 162,23142 Unemployment Compensation 46,537 118,163 59,221 109,727 148,47943 Dental Insurance 1,697,118 1,970,450 1,710,456 2,000,409 2,019,44945 Disability Insurance 4,387 5,850 5850 0 600058 Leave Buy-back 294,154 391,900 400,910 385,000 460,00059 Terminal Leave Pay 2,194,153 3,191,165 2,275,619 1,261,000 1,261,00075 Unanticipated Expenses 0 0 0 330,000 200,00099 Other 0 0 0 1,057,814 789,994135 Defined Contribution Plan 0 0 25,000 25,000 40,000136 Teacher's Quarterly Retirement - Board Share 0 0 0 12,112,802 11,970,766137 MSRPS Recovery 0 0 -1,048,161 -1,654,185 -1,654,185138 Empl Retire Invoiced Expense 3,626,655 3,680,515 3,234,312 3,325,697 3,605,697139 St Tchrs Ret System Admin Fees 793,238 814,561 789,796 866,868 994,248140 Payments to Gov. Agencies 147,000 147,000 0 0 0198 Charter School PPA Reserve - - 0 130,861 386,075199 Other Budget Mgmt 0 257 0 0 0
Total Other Charges $91,238,218 $95,467,026 $100,276,298 $117,108,167 $121,134,444
8 Transfers102 OPEB Expense $3,041,813 3,041,813 $0 $0 $0 20 GF Transfers to Other Funds 1,984,967 2,331,716 206,162 913,221 613,22170 Transfer to OPEB - Contribution 0 0 1,041,813 1,041,813 1,041,81371 Transfer to OPEB - Admin 0 0 36,444 15,000 34,500
Total Transfers $5,026,780 $5,373,529 $1,284,419 $1,970,034 $1,689,534 TOTAL FIXED CHARGES $97,462,093 $101,921,977 $102,635,174 $120,137,835 $123,883,612
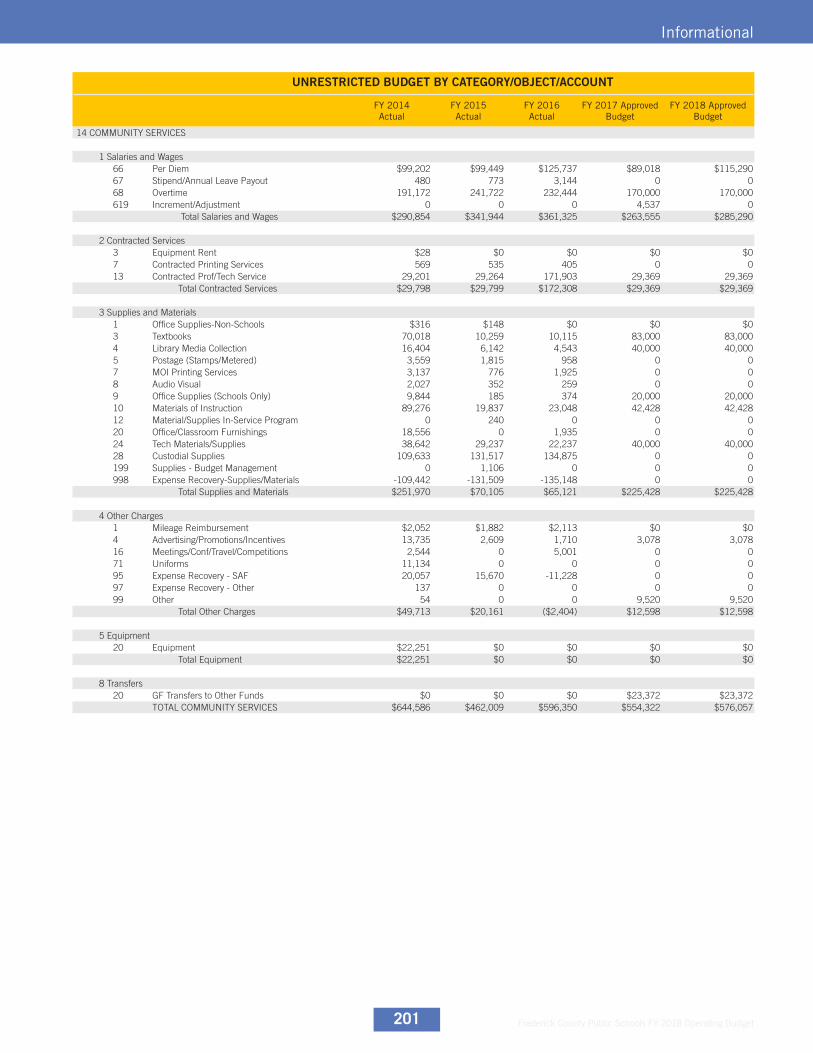
Frederick County Public Schools FY 2018 Operating Budget201
Informational
UNRESTRICTED BUDGET BY CATEGORY/OBJECT/ACCOUNT
FY 2014 Actual
FY 2015 Actual
FY 2016 Actual
FY 2017 Approved Budget
FY 2018 Approved Budget
14 COMMUNITY SERVICES
1 Salaries and Wages66 Per Diem $99,202 $99,449 $125,737 $89,018 $115,290 67 Stipend/Annual Leave Payout 480 773 3,144 0 068 Overtime 191,172 241,722 232,444 170,000 170,000619 Increment/Adjustment 0 0 0 4,537 0
Total Salaries and Wages $290,854 $341,944 $361,325 $263,555 $285,290
2 Contracted Services3 Equipment Rent $28 $0 $0 $0 $0 7 Contracted Printing Services 569 535 405 0 013 Contracted Prof/Tech Service 29,201 29,264 171,903 29,369 29,369
Total Contracted Services $29,798 $29,799 $172,308 $29,369 $29,369
3 Supplies and Materials1 Office Supplies-Non-Schools $316 $148 $0 $0 $0 3 Textbooks 70,018 10,259 10,115 83,000 83,0004 Library Media Collection 16,404 6,142 4,543 40,000 40,0005 Postage (Stamps/Metered) 3,559 1,815 958 0 07 MOI Printing Services 3,137 776 1,925 0 08 Audio Visual 2,027 352 259 0 09 Office Supplies (Schools Only) 9,844 185 374 20,000 20,00010 Materials of Instruction 89,276 19,837 23,048 42,428 42,42812 Material/Supplies In-Service Program 0 240 0 0 020 Office/Classroom Furnishings 18,556 0 1,935 0 024 Tech Materials/Supplies 38,642 29,237 22,237 40,000 40,00028 Custodial Supplies 109,633 131,517 134,875 0 0199 Supplies - Budget Management 0 1,106 0 0 0998 Expense Recovery-Supplies/Materials -109,442 -131,509 -135,148 0 0
Total Supplies and Materials $251,970 $70,105 $65,121 $225,428 $225,428
4 Other Charges1 Mileage Reimbursement $2,052 $1,882 $2,113 $0 $0 4 Advertising/Promotions/Incentives 13,735 2,609 1,710 3,078 3,07816 Meetings/Conf/Travel/Competitions 2,544 0 5,001 0 071 Uniforms 11,134 0 0 0 095 Expense Recovery - SAF 20,057 15,670 -11,228 0 097 Expense Recovery - Other 137 0 0 0 099 Other 54 0 0 9,520 9,520
Total Other Charges $49,713 $20,161 ($2,404) $12,598 $12,598
5 Equipment20 Equipment $22,251 $0 $0 $0 $0
Total Equipment $22,251 $0 $0 $0 $0
8 Transfers20 GF Transfers to Other Funds $0 $0 $0 $23,372 $23,372
TOTAL COMMUNITY SERVICES $644,586 $462,009 $596,350 $554,322 $576,057
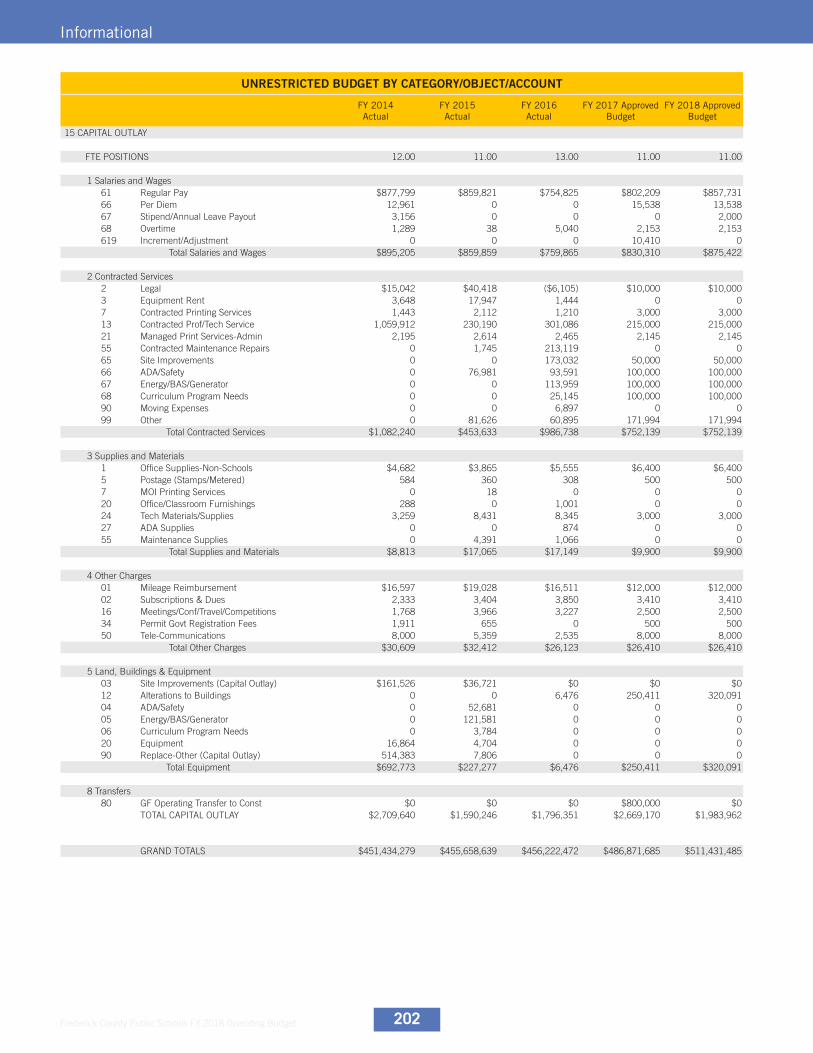
Frederick County Public Schools FY 2018 Operating Budget 202
Informational
UNRESTRICTED BUDGET BY CATEGORY/OBJECT/ACCOUNT
FY 2014 Actual
FY 2015 Actual
FY 2016 Actual
FY 2017 Approved Budget
FY 2018 Approved Budget
15 CAPITAL OUTLAY
FTE POSITIONS 12.00 11.00 13.00 11.00 11.00
1 Salaries and Wages61 Regular Pay $877,799 $859,821 $754,825 $802,209 $857,731 66 Per Diem 12,961 0 0 15,538 13,53867 Stipend/Annual Leave Payout 3,156 0 0 0 2,00068 Overtime 1,289 38 5,040 2,153 2,153619 Increment/Adjustment 0 0 0 10,410 0
Total Salaries and Wages $895,205 $859,859 $759,865 $830,310 $875,422
2 Contracted Services2 Legal $15,042 $40,418 ($6,105) $10,000 $10,000 3 Equipment Rent 3,648 17,947 1,444 0 07 Contracted Printing Services 1,443 2,112 1,210 3,000 3,00013 Contracted Prof/Tech Service 1,059,912 230,190 301,086 215,000 215,00021 Managed Print Services-Admin 2,195 2,614 2,465 2,145 2,14555 Contracted Maintenance Repairs 0 1,745 213,119 0 065 Site Improvements 0 0 173,032 50,000 50,00066 ADA/Safety 0 76,981 93,591 100,000 100,00067 Energy/BAS/Generator 0 0 113,959 100,000 100,00068 Curriculum Program Needs 0 0 25,145 100,000 100,00090 Moving Expenses 0 0 6,897 0 099 Other 0 81,626 60,895 171,994 171,994
Total Contracted Services $1,082,240 $453,633 $986,738 $752,139 $752,139
3 Supplies and Materials1 Office Supplies-Non-Schools $4,682 $3,865 $5,555 $6,400 $6,400 5 Postage (Stamps/Metered) 584 360 308 500 5007 MOI Printing Services 0 18 0 0 020 Office/Classroom Furnishings 288 0 1,001 0 024 Tech Materials/Supplies 3,259 8,431 8,345 3,000 3,00027 ADA Supplies 0 0 874 0 055 Maintenance Supplies 0 4,391 1,066 0 0
Total Supplies and Materials $8,813 $17,065 $17,149 $9,900 $9,900
4 Other Charges01 Mileage Reimbursement $16,597 $19,028 $16,511 $12,000 $12,000 02 Subscriptions & Dues 2,333 3,404 3,850 3,410 3,41016 Meetings/Conf/Travel/Competitions 1,768 3,966 3,227 2,500 2,50034 Permit Govt Registration Fees 1,911 655 0 500 50050 Tele-Communications 8,000 5,359 2,535 8,000 8,000
Total Other Charges $30,609 $32,412 $26,123 $26,410 $26,410
5 Land, Buildings & Equipment03 Site Improvements (Capital Outlay) $161,526 $36,721 $0 $0 $0 12 Alterations to Buildings 0 0 6,476 250,411 320,09104 ADA/Safety 0 52,681 0 0 005 Energy/BAS/Generator 0 121,581 0 0 006 Curriculum Program Needs 0 3,784 0 0 020 Equipment 16,864 4,704 0 0 090 Replace-Other (Capital Outlay) 514,383 7,806 0 0 0
Total Equipment $692,773 $227,277 $6,476 $250,411 $320,091
8 Transfers80 GF Operating Transfer to Const $0 $0 $0 $800,000 $0
TOTAL CAPITAL OUTLAY $2,709,640 $1,590,246 $1,796,351 $2,669,170 $1,983,962
GRAND TOTALS $451,434,279 $455,658,639 $456,222,472 $486,871,685 $511,431,485

Frederick County Public Schools FY 2018 Operating Budget203
Informational
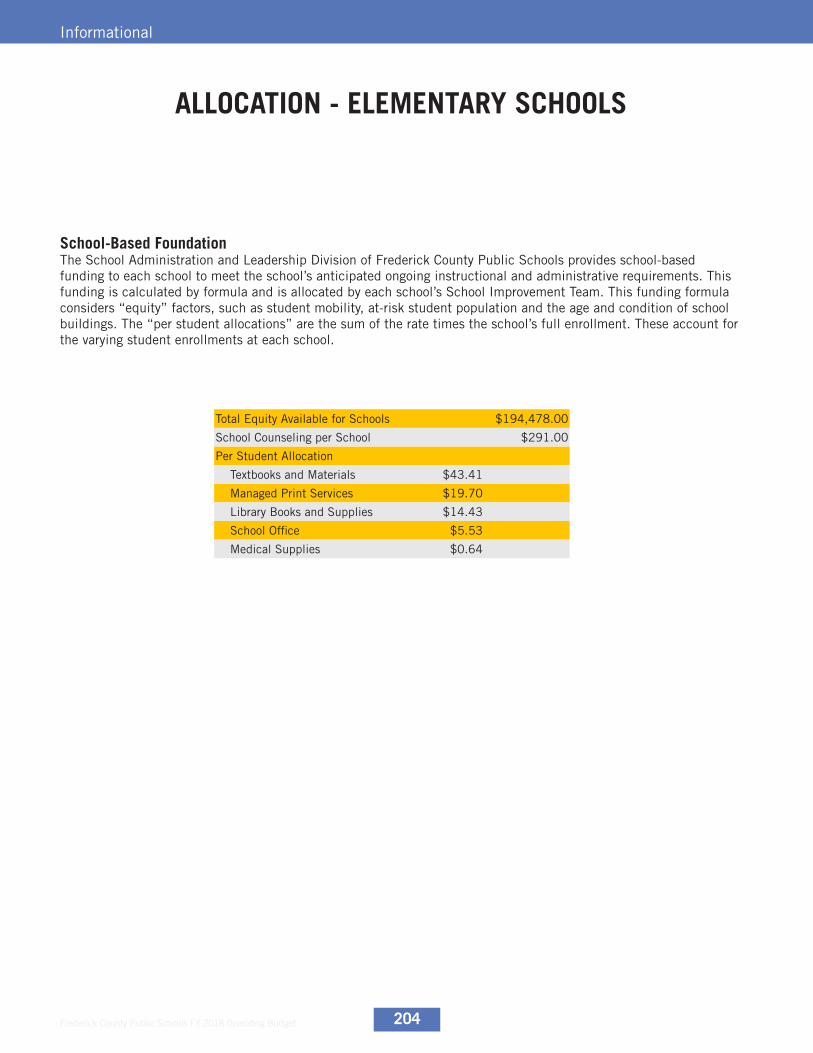
Frederick County Public Schools FY 2018 Operating Budget 204
Informational
ALLOCATION - ELEMENTARY SCHOOLS
The School Administration and Leadership Division of Frederick County Public Schools provides school-based funding to each school to meet the school’s anticipated ongoing instructional and administrative requirements. This funding is calculated by formula and is allocated by each school’s School Improvement Team. This funding formula considers “equity” factors, such as student mobility, at-risk student population and the age and condition of school buildings. The “per student allocations” are the sum of the rate times the school’s full enrollment. These account for the varying student enrollments at each school.
School-Based Foundation
Total Equity Available for Schools $194,478.00
School Counseling per School $291.00
Per Student Allocation
Textbooks and Materials $43.41
Managed Print Services $19.70
Library Books and Supplies $14.43
School Office $5.53
Medical Supplies $0.64
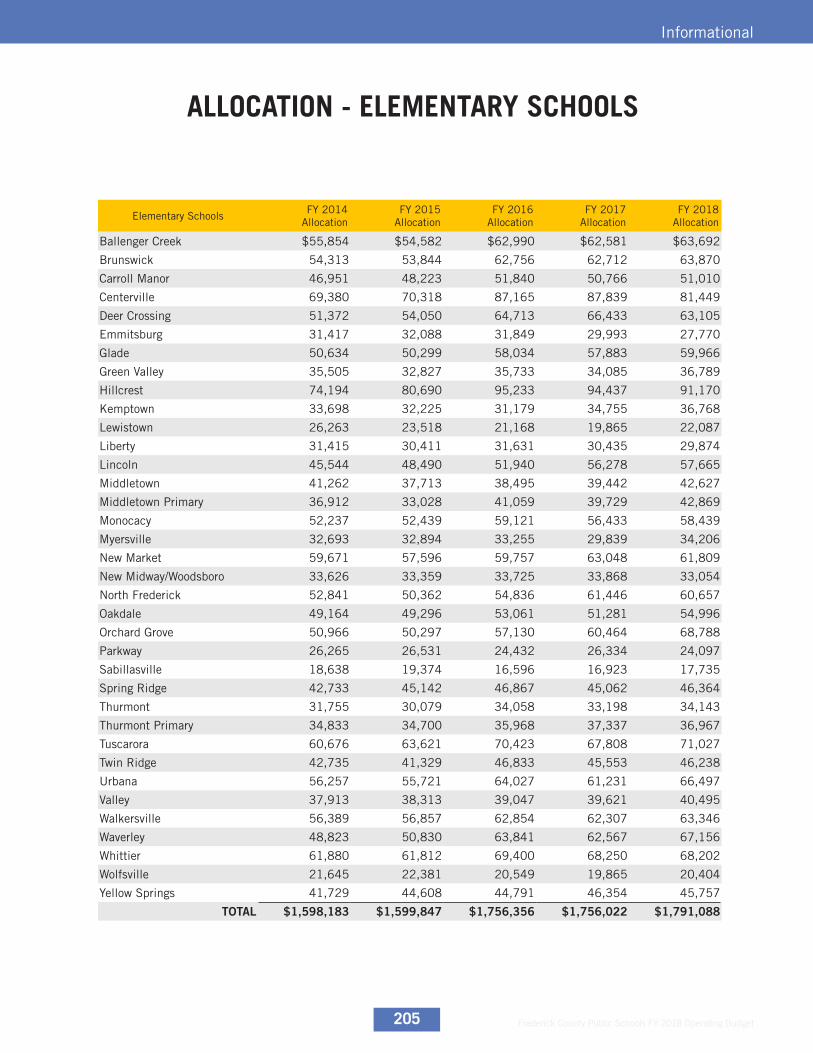
Frederick County Public Schools FY 2018 Operating Budget205
Informational
ALLOCATION - ELEMENTARY SCHOOLS
Elementary SchoolsFY 2014
AllocationFY 2015
AllocationFY 2016
AllocationFY 2017
AllocationFY 2018
Allocation
Ballenger Creek $55,854 $54,582 $62,990 $62,581 $63,692
Brunswick 54,313 53,844 62,756 62,712 63,870
Carroll Manor 46,951 48,223 51,840 50,766 51,010
Centerville 69,380 70,318 87,165 87,839 81,449
Deer Crossing 51,372 54,050 64,713 66,433 63,105
Emmitsburg 31,417 32,088 31,849 29,993 27,770
Glade 50,634 50,299 58,034 57,883 59,966
Green Valley 35,505 32,827 35,733 34,085 36,789
Hillcrest 74,194 80,690 95,233 94,437 91,170
Kemptown 33,698 32,225 31,179 34,755 36,768
Lewistown 26,263 23,518 21,168 19,865 22,087
Liberty 31,415 30,411 31,631 30,435 29,874
Lincoln 45,544 48,490 51,940 56,278 57,665
Middletown 41,262 37,713 38,495 39,442 42,627
Middletown Primary 36,912 33,028 41,059 39,729 42,869
Monocacy 52,237 52,439 59,121 56,433 58,439
Myersville 32,693 32,894 33,255 29,839 34,206
New Market 59,671 57,596 59,757 63,048 61,809
New Midway/Woodsboro 33,626 33,359 33,725 33,868 33,054
North Frederick 52,841 50,362 54,836 61,446 60,657
Oakdale 49,164 49,296 53,061 51,281 54,996
Orchard Grove 50,966 50,297 57,130 60,464 68,788
Parkway 26,265 26,531 24,432 26,334 24,097
Sabillasville 18,638 19,374 16,596 16,923 17,735
Spring Ridge 42,733 45,142 46,867 45,062 46,364
Thurmont 31,755 30,079 34,058 33,198 34,143
Thurmont Primary 34,833 34,700 35,968 37,337 36,967
Tuscarora 60,676 63,621 70,423 67,808 71,027
Twin Ridge 42,735 41,329 46,833 45,553 46,238
Urbana 56,257 55,721 64,027 61,231 66,497
Valley 37,913 38,313 39,047 39,621 40,495
Walkersville 56,389 56,857 62,854 62,307 63,346
Waverley 48,823 50,830 63,841 62,567 67,156
Whittier 61,880 61,812 69,400 68,250 68,202
Wolfsville 21,645 22,381 20,549 19,865 20,404
Yellow Springs 41,729 44,608 44,791 46,354 45,757
TOTAL $1,598,183 $1,599,847 $1,756,356 $1,756,022 $1,791,088
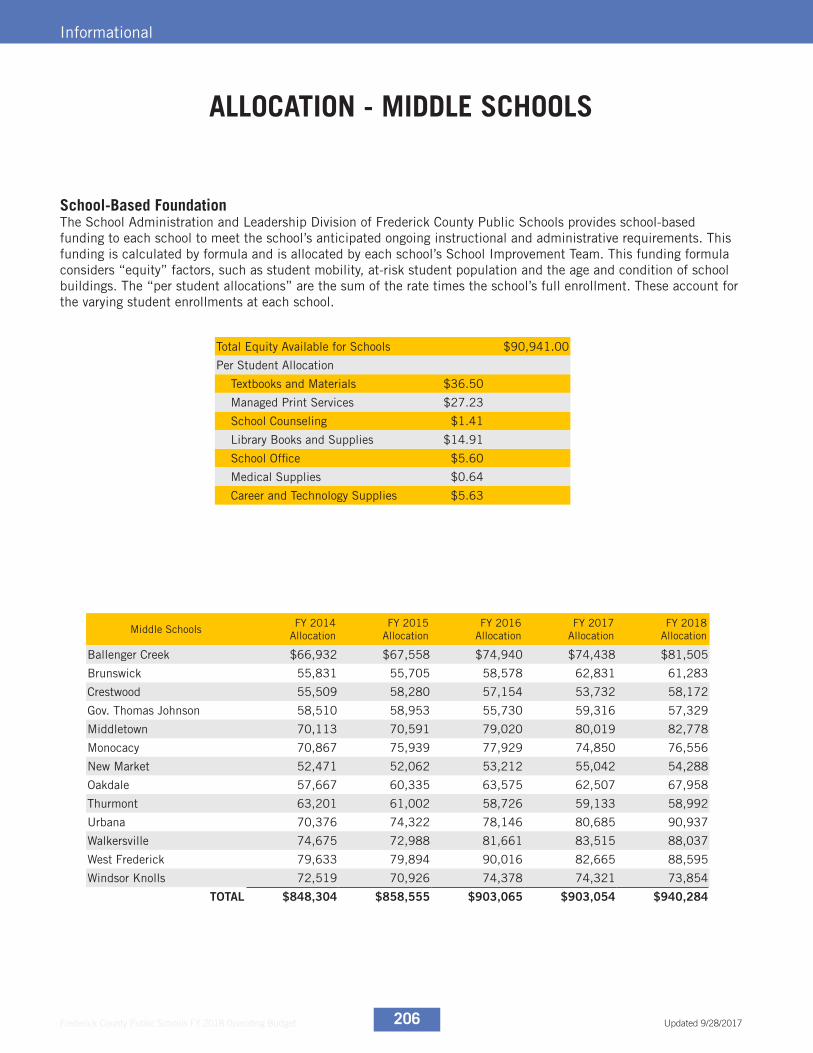
Frederick County Public Schools FY 2018 Operating Budget 206
Informational
ALLOCATION - MIDDLE SCHOOLS
Middle SchoolsFY 2014
AllocationFY 2015
AllocationFY 2016
AllocationFY 2017
AllocationFY 2018
Allocation
Ballenger Creek $66,932 $67,558 $74,940 $74,438 $81,505
Brunswick 55,831 55,705 58,578 62,831 61,283
Crestwood 55,509 58,280 57,154 53,732 58,172
Gov. Thomas Johnson 58,510 58,953 55,730 59,316 57,329
Middletown 70,113 70,591 79,020 80,019 82,778
Monocacy 70,867 75,939 77,929 74,850 76,556
New Market 52,471 52,062 53,212 55,042 54,288
Oakdale 57,667 60,335 63,575 62,507 67,958
Thurmont 63,201 61,002 58,726 59,133 58,992
Urbana 70,376 74,322 78,146 80,685 90,937
Walkersville 74,675 72,988 81,661 83,515 88,037
West Frederick 79,633 79,894 90,016 82,665 88,595
Windsor Knolls 72,519 70,926 74,378 74,321 73,854
TOTAL $848,304 $858,555 $903,065 $903,054 $940,284
The School Administration and Leadership Division of Frederick County Public Schools provides school-based funding to each school to meet the school’s anticipated ongoing instructional and administrative requirements. This funding is calculated by formula and is allocated by each school’s School Improvement Team. This funding formula considers “equity” factors, such as student mobility, at-risk student population and the age and condition of school buildings. The “per student allocations” are the sum of the rate times the school’s full enrollment. These account for the varying student enrollments at each school.
School-Based Foundation
Total Equity Available for Schools $90,941.00
Per Student Allocation
Textbooks and Materials $36.50
Managed Print Services $27.23
School Counseling $1.41
Library Books and Supplies $14.91
School Office $5.60
Medical Supplies $0.64
Career and Technology Supplies $5.63
Updated 9/28/2017
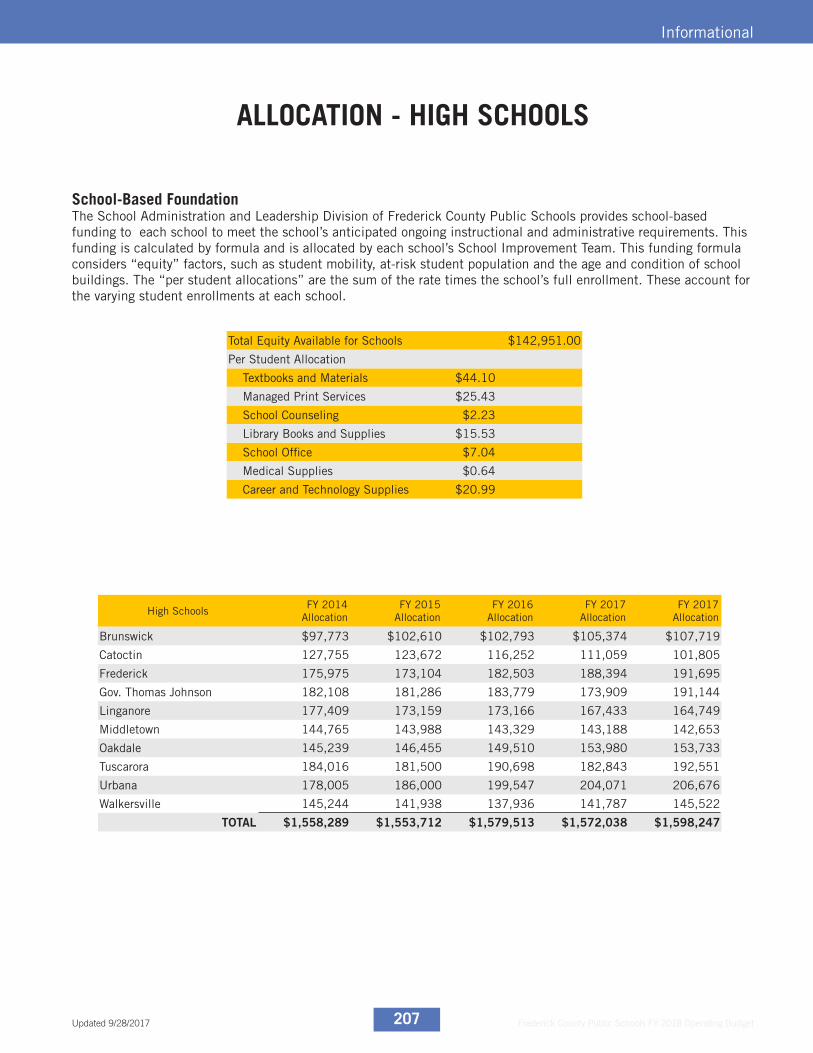
Frederick County Public Schools FY 2018 Operating Budget207
Informational
High SchoolsFY 2014
AllocationFY 2015
AllocationFY 2016
AllocationFY 2017
AllocationFY 2017
Allocation
Brunswick $97,773 $102,610 $102,793 $105,374 $107,719
Catoctin 127,755 123,672 116,252 111,059 101,805
Frederick 175,975 173,104 182,503 188,394 191,695
Gov. Thomas Johnson 182,108 181,286 183,779 173,909 191,144
Linganore 177,409 173,159 173,166 167,433 164,749
Middletown 144,765 143,988 143,329 143,188 142,653
Oakdale 145,239 146,455 149,510 153,980 153,733
Tuscarora 184,016 181,500 190,698 182,843 192,551
Urbana 178,005 186,000 199,547 204,071 206,676
Walkersville 145,244 141,938 137,936 141,787 145,522
TOTAL $1,558,289 $1,553,712 $1,579,513 $1,572,038 $1,598,247
The School Administration and Leadership Division of Frederick County Public Schools provides school-based funding to each school to meet the school’s anticipated ongoing instructional and administrative requirements. This funding is calculated by formula and is allocated by each school’s School Improvement Team. This funding formula considers “equity” factors, such as student mobility, at-risk student population and the age and condition of school buildings. The “per student allocations” are the sum of the rate times the school’s full enrollment. These account for the varying student enrollments at each school.
School-Based Foundation
Total Equity Available for Schools $142,951.00
Per Student Allocation
Textbooks and Materials $44.10
Managed Print Services $25.43
School Counseling $2.23
Library Books and Supplies $15.53
School Office $7.04
Medical Supplies $0.64
Career and Technology Supplies $20.99
ALLOCATION - HIGH SCHOOLS
Updated 9/28/2017

Frederick County Public Schools FY 2018 Operating Budget 208
Informational
AAE – Accelerating Achievement and Equity
Accounting Basis – The operating budget is presented on a modified accrual accounting basis where expenditures are
accrued, but revenues are not recorded until actually received or are “measurable” and “available for expenditures.”
ACT – A national college admissions examination that consists of English, mathematics, reading, and science
subjects.
ACTS – Division of Academics, Communications, Technology, and Student Achievement
Administration – Cost and staff associated with the regulation, direction, and control of the school system, such as
the superintendent, deputy superintendent, other professional staff, and secretaries. Some offices included in this
category are the Board of Education office, Fiscal Services, and Human Resources.
Advanced Academics – A curricular program that provides rigorous, responsive instructional experiences that support
students who perform or show the potential for performing at remarkably high levels of accomplishment. The program
supports FCPS’s goal of preparing students to be successful global citizens and innovators.
Advanced Placement (AP) – A program of challenging college-level courses available to high school students.
National exams administered by the College Board allow students to earn college credit for high scores.
ALT-MSA – Alternate Maryland School Assessment
APEX – Advanced Placement Experience
APFO – Adequate Public Facilities Ordinance
Appropriation – An allocated sum of monies designated to be provided during a fiscal year for the operation of the
school system.
ARRA – American Recovery and Reinvestment Act
ASBO – Association of School Business Officials
Balanced Budget – A budget where expenditures are equal to revenue.
BOE – Board of Education of Frederick County
BPW – Board of Public Works (State of Maryland)
Bridge to Excellence Master Plan (BTE or Master Plan) – Provides a long-range action plan to guide the system in
preparing students to be successful citizens in the 21st century. The plan reflects the mission of the school system
and addresses the system’s priority goals.
BST – Business Services Technology
Budget – A financial plan for a specified period of time that matches planned revenues and expenditures.
Budget Amendment – A revision of the category level of an approved budget that is presented to the county for
approval. This revision may be the inclusion of additional funding due to an award of a grant or to transfer funds from
one budget category to another budget category.
Budget Calendar – A schedule of dates followed to receive input, prepare, adopt, and implement a budget.
Budget Document – A written plan that presents a comprehensive financial program to the county.
Budget Object – A summarization of expenditure accounts: salary and wages, contracted services, supplies and
GLOSSARY OF TERMS
Frederick County Public Schools FY 2018 Operating Budget209
Informational
materials, other charges, equipment, and transfers.
Budget Transfer – A revision to budgeted funds from one budget to another within the same category.
CACFP – Child and Adult Care Food Program
Capital Budget – A plan for new school design and construction, major building renovations and additions, land
purchases, and related costs (Also Fund 80 or Construction Fund).
Capital Outlay – Cost for equipment and improvements to facilities that result in the acquisition of, or addition to,
fixed assets and staff associated with facilities planning and construction management.
Capital Improvement Program (CIP) – A plan of capital expenditures identified by project to be incurred each year for
the next and following five fiscal years. The plan includes a brief description of the project, key milestone dates for
implementation, and the amount to be expended. The school system’s capital improvement program is prepared and
considered by the Board of Education of Frederick County in the fall of each year before it is submitted to the county
and to the State’s Public School Construction Interagency Committee.
Career and Technology Center (CTC) - Offers career preparatory programs for grades 10-12.
CASS – Community Agency School Services
Category/Class – Budgetary and reporting classification set forth in the State law by which all LEAs (local educational
areas) must appropriate and record expenditures of the operating budget. See MSDE Categories for details. Also
known as MSDE Category or State Category.
CCMPCS – Carroll Creek Montessori Public Charter School
Charter School –Maryland’s law defines a “public charter school” as a “public school” that is nonsectarian, is chosen
by parents for their children and is open to all students on a space-available basis. A public charter school operates
with the approval of the a local board of education in accordance with a written charter agreement executed between
the local board of education and the administrative entity operating the public charter school.
CII – Curriculum, Instruction, and Innovation
COMAR – Code of Maryland Regulations
Common Core State Standards (CCSS) – A set of high quality academic expectations in English/language arts and
mathematics that define both the knowledge and skills all students should master by the end of each grade level
to be on track for success in college and careers. They were created through a state-led initiative and have been
adopted by more than 40 states, including Maryland.
Community Services – Activities that are provided by the LEA for the community or some segment of the community
other than for public school activities and adult education programs, including all expenditures other than insurance
and contributions to retirement funds for current expense items that are directly related to community services. Three
types of salaries that fall into community services are the prorated portion of the normal salaries of regular day school
employees, additional salaries paid to regular day school employees for community services, and salaries of personnel
employed specifically for some community service activity.
Comprehensive Annual Financial Report (CAFR) – A thorough and detailed presentation of FCPS’s position, activities
and balances for the preceding fiscal year. This is prepared in compliance with the Public School Laws of the State
GLOSSARY OF TERMS
Frederick County Public Schools FY 2018 Operating Budget 210
Informational
of Maryland.
Contracted Services – A classification of expenditures for services performed by persons who are not on the school
system’s payroll, including equipment repair.
COOP – Continuity of Operation Plans
County Council – The seven-member County Council consists of five members elected by district and two elected at-
large. Council members have the power to initiate legislation. Council meetings are limited to 45 days yearly. Council
members serve for four years and no more than three consecutive terms.
County Executive – The County Executive directs, supervises, and oversees Frederick County Government
departments and agencies, establishes policies, and proposes the budget. The County Executive serves a four-year
term and not more than two consecutive terms.
CPI – Consumer Price Index
CSI – Continuous Strategic Improvement
CTC – Career and Technology Center
CTE – Career and Technology Education
Debt Service Fund – The fund that is used to report the payment of interest and principal on long-term general
obligation debt used to finance the school system’s capital projects.
EAG – Eliminating the Achievement Gap
ECE – Early Childhood Education
EEA – Educator Effectiveness Academy
EFMP – Educational Facilities Master Plan
ELL – English Language Learners (also ESOL or LEP)
Employee Benefits – Payments by the employer for social security taxes, retirement contributions, and group health,
dental, and life insurance.
ERRP – Early Retiree Reinsurance Program
ESEA – Elementary and Secondary Education Act
ESOL – English as a Second Language (also ELL or LEP)
ESSA – Every Student Succeeds Act
ESSL – Earth and Space Science Laboratory (Also known as the Planetarium or Science Center)
ETMA – Education That is Multicultural and Achievement
Expenditure Recovery – Costs or expenditures for self-supporting programs incurred during the normal course of
business that are reimbursed by program areas that use the services.
FAME – Formative Assessment for Maryland Educators
FAST – Fun Academics in the Summer Time
FCC – Frederick Community College
FCPCS – Frederick Classical Public Charter School
FCPS – Frederick County Public Schools
GLOSSARY OF TERMS

Frederick County Public Schools FY 2018 Operating Budget211
Informational
FCVS – Frederick County Virtual School
Federal Sources – Revenue from any agency of the federal government that originates as a federal program either
directly from the federal government (e.g., Impact Aid and Head Start) or through the state of Maryland (e.g., Title I
and IDEA-Part B grants).
Feeder Area – The high school and those elementary and middle schools whose students will ultimately attend (“feed
into”) that high school. Provides FCPS a way to coordinate and improve delivery of instruction and other services
such as bus transportation.
FEHS – Flexible Evening High School
FFVP – Fresh Fruit and Vegetable Program
FICA – Federal Insurance Contributions Act
Fiscal Year (FY) – The 12-month budget/accounting year that begins July 1 and ends the following June 30.
Fixed Charges – Cost of FICA, health, dental, life, and unemployment insurances paid by the system, retirement
and workers’ compensation. Also included are costs for insurance covering school system property, buildings, and
contents; the bus fleet and other vehicles; and general liability. Employee tuition reimbursements, other post-
employment benefits trust, and building lease payments are also recorded in this category.
Food and Nutrition Services Fund – A special revenue fund used for financial transactions relating to all activities
involved in providing food to schools, students, staff, or the community (also Fund 30).
Frederick County Government (FCG) – Frederick County transitioned from the county commissioner form of
government to the county charter form of government on December 1, 2014. (Previously Board of County
Commissioners.)
Free and Reduced-Price Meals (FARM) – Category of students whose applications meet the U.S. Department of
Agriculture’s family size and income guidelines to qualify them for school lunch and/or breakfast at no or low cost.
Full-Time Equivalent (FTE) – The value given to positions, employees or students equating to the portion of time
relative to a specific value for one full-time position, employee or student. For instance, prekindergarten students
attend school for half of a day and are thus considered a 0.5 full-time equivalent student.
Fund Balance – Unliquidated surplus of funds, the actual from the previous fiscal year and the estimated from the
current fiscal year, whether accrued from revenues or expenditures.
Funding – Revenue that originates from county, state and federal governments (may be restricted or unrestricted).
GCEI – Geographic Cost of Education Index
General Fund (GF) –Financial transactions in support of the day-to-day educational process and the year-round
operation and maintenance of the systems grounds, buildings, and infrastructure, and administrative functions.
GIS – Geographic Information Systems
GPA – Grade point average
Grant – A program operated in accordance with a specific plan and budget to achieve specific objectives. Grant
revenues are restricted funds, the use of which must follow the budget plan submitted to the granting agency.
High School Assessments (HSA) – End-of-course tests that the Maryland State Department of Education produces,
GLOSSARY OF TERMS

Frederick County Public Schools FY 2018 Operating Budget 212
Informational
aimed at raising academic standards in all Maryland public high schools.
Highly Able Learner Program – FCPS Highly Able Learner program that was launched in middle schools during the
2012-13 school year.
IAC – Interagency Committee on School Construction (State of Maryland)
IDEA – Individuals with Disabilities Education Act
IGT – Inter-Governmental Transfer
In-kind Services – Payment made in the form of goods and services rather than money.
Individual Learning Plan (ILP) – An individually designed educational assistance program for students not meeting,
or failing to reach, established proficiency levels in math, reading or writing.
Individualized Education Program (IEP) – A collaborative effort mandated by the Individuals with Disabilities Act
(IDEA) whereby teachers, parents/guardians, administrators and other associated persons work together to improve
the educational results of the student. The stakeholders jointly develop a written document for each child identified
as eligible to receive special education and related services. The written plan is implemented in accordance with
federal and state laws and regulations and is reviewed periodically during a student’s school career.
Instructional Salaries and Wages – Funds activities directly related to the teaching of students, the interaction
between teacher and students, and the well-being of students (i.e., teachers, media specialists, counselors, school
psychologists, paraprofessional educators, and reading specialists).
Intermediate Grades – Upper elementary grades 3-5.
International Baccalaureate Diploma Programme (IB) – A challenging two-year high school curriculum offered at
Urbana High School that leads to a qualification that is widely recognized by the world’s leading universities.
IT – Information Technology
JROTC – Junior Reserve Officer Training Corp
KRA – Kindergarten Readiness Assessment
LAN – Local Area Network
LEED – Leadership in Energy and Environmental Design
LEP – Limited English Proficient (also ELL or ESOL)
Local Education Agency (LEA) – An individual Maryland school system/district including all 23 counties and
Baltimore City.
Local Sources – Revenue received out of funds from the appropriating body for school purposes.
MABE – Maryland Association of Boards of Education
Magnet Programs – Countywide educational programs held in one location to meet similar academic needs. FCPS has
several types of magnet programs, including High School Academies and Signature Programs.
Maintenance of Effort (MOE) – State law requiring the county government to provide local funds at the same per
pupil amount as the current fiscal year. The law provides for a minimum funding amount to ensure that additional
state aid will not supplant local aid.
GLOSSARY OF TERMS
Frederick County Public Schools FY 2018 Operating Budget213
Informational
Maintenance of Plant – Funds activities concerned with keeping the grounds, buildings, and fixed equipment in
their original condition of completeness or efficiency through repair, scheduled and preventive maintenance, or
replacement of property. Includes personnel such as equipment operators, journeymen, and trades helpers.
Master Plan – The comprehensive document that incorporates federal, state, and local funds with goals and
measurable performance standards. FCPS works closely with the Maryland Department of Education to assure
compliance with mandates of the No Child Left Behind (NCLB) Act. In turn, under the Maryland Bridge to Excellence
in Education Act, each school district develops a five-year master plan describing how they will meet state standards.
The FCPS master plan is online at www.fcps.org.
MCCRS – Maryland College and Career-Readiness Standards
MDS3 – Maryland’s Safe and Supportive Schools
Mid-level Administration – Funds administration and supervision of district-wide and school-level instructional
programs and activities. Includes personnel such as principals, assistant principals, directors, coordinators,
supervisors, specialists, and secretaries.
MLGIP – Maryland Local Government Investment Plan
MMSR – Maryland Model of School Readiness
MOI – Materials of Instruction
MPSSAA – Maryland Public Secondary Schools Athletic Association
MSA – Maryland School Assessment
MSRPS – Maryland State Retirement and Pension System
MSDE – Maryland State Department of Education
MVMPCS – Monocacy Valley Montessori Public Charter School
NBPTS – National Board for Professional Teaching Standards Certification
NEA – National Education Association
NIH – National Institutes of Health
No Child Left Behind Act (NCLB) – Legislation signed into law in January 2002 designed to close the achievement
gap between disadvantaged and minority students and their peers. Its basic principles include greater accountability
for schools, testing to determine student progress, expanded options for parents whose children are not making
progress, and an emphasis on proven teaching methods.
Nonpublic Placement – Placing students whose needs cannot be met in the local school system, even with the
provision of supplementary aids, services, and supports, in specialized nonpublic educational facilities.
Object – Identifies the purpose of expenditure (e.g., Salaries and Wages, Supplies) required under LEA reporting
requirements.
Operating Budget – The portion of the budget that pertains to the daily operation of the school system for a single
fiscal year.
Operation of Plant – Funds activities concerned with keeping the physical building clean and ready for daily use.
GLOSSARY OF TERMS
Frederick County Public Schools FY 2018 Operating Budget 214
Informational
Personnel such as custodians are included in this category.
OSHA – Occupational Safety and Health Administration
Other Charges – A classification of expenditures for employee benefits and other expenditures like travel and the cost
of attending meetings and conferences. Included in this classification are expenditures not reported in the objects of
salaries and wages, contracted services, supplies and materials, and equipment.
Other Instructional Costs – Funds rental of buildings, advertising, local travel, and registration fees.
Other Post-Employment Benefits (OPEB) – Contributions to the post-employment health care benefit plan.
Partnership for Assessment of Readiness for College and Careers (PARCC) – A consortium of 24 states working to
develop a new student assessment system aligned to the Common Core State Standards.
PDS – Professional Development Schools
PE – Physical Education
PLC – Professional Learning Community
PLTW – Project Lead the Way
Policies – The BOE of Frederick County sets policies as guidelines for the successful and efficient functioning of the
school system.
Positive Behavioral Interventions and Supports (PBIS) – A school-wide initiative that reinforces expected appropriate
behaviors that support a successful, productive school community by recognizing and rewarding positive behaviors
demonstrated by staff and students.
PPPSS – Parentally Placed Private School Students
PPW – Pupil Personnel Worker
PQI – Program Quality Index
PreK – Depicts prekindergarten students
Primary Grades – Elementary grades PreK-2.
PSAT – Practice SAT
PSCP – Public School Construction Program (State of Maryland)
PSSAM – Public School Superintendents Association of Maryland
QZAB – Qualified Zone Academy Board
Race to the Top (RTTT) – A part of the federal government’s American Recovery and Reinvestment Act Program.
On August 24, 2010, Maryland was awarded one of the federal government’s coveted Race to the Top grants in the
amount of $250 million over four years. The RTTT program is aimed at boosting student achievement, reducing gaps
in achievement among student subgroups, turning around struggling schools, and improving the teaching profession.
RADAR – Resource for Accountability Data Analysis and Reporting
Regulations – The FCPS Superintendent authorizes regulations to specify school-system procedures for carrying out
BOE policies.
Reserve – A portion of a fund balance legally restricted for a specific purpose and, therefore, not available for general
use.
GLOSSARY OF TERMS

Frederick County Public Schools FY 2018 Operating Budget215
Informational
Restricted Fund (RF) – Funds received primarily from state or federal sources in the form of grant awards (also Fund
20). Restricted funds may only be used for the specific purpose for which the funds were granted. Disbursements
must be in accordance with the budget plan approved by the granting agency.
Revenue – Funds received by the Board of Education during a fiscal year.
Revenue Source – Revenues are reported according to the source, such as state, federal, local, etc.
RISE – Relationships, Integrity, Strength, and Excellence (program at Lincoln Elementary School)
ROTC – Reserve Officers Training Corps
RTI – Response to Intervention
SAL – School Administration and Leadership
Salaries and Wages – An MSDE defined sub-group (object) of expenditures for payments to all full-time and part-
time employees, including temporaries and substitutes, in each budget category except Fixed Charges. This object
is then further segmented into four components: regular salary and wages, supplemental pay (substitutes, temporary
employees, and additional hours work by regular employees), activity pay and stipends, and overtime pay.
SASI – System Accountability and School Improvement
SAT – A national college-entrance examination designed to measure critical reading, writing and mathematical
reasoning skills. The PSAT is a Preliminary SAT that provides practice before taking the SAT and determines some
opportunities for student scholarships and awards.
School Activity Fund (SAF) – Each individual school maintains a school activity fund to account for cash resources of
various clubs and organizations.
School Construction Fund – A fund in which all major school construction project expenditures and revenues are
reported.
School Progress Index (SPI) – One measure in helping to gauge how well schools are progressing to improve
performance for all students.
School Resource Officer (SRO) – Frederick County Sheriff’s Office employees assigned to each high school and its
feeder-area schools.
Self-Insurance Fund – An internal service fund to provide health, dental, vision, and pharmacy services for employees
and retirees.
SHIP – Student Homelessness Initiative Partnership
SIT – School (or Site) Improvement Team
Special Education – Provides educational services to disabled students and funds personnel such as special
education teachers, paraprofessional educators, instructional specialists, therapists, hearing interpreters, and
programs such as Psychological Services, Compliance, K-12 Services, Early Childhood Programs, and Nonpublic
Education.
State Reporting/Budgeting Categories – Broad budget and expenditure groupings defined by the State Legislature
in the Code of Maryland Regulations. All local education areas must report their system’s annual operating budget,
expenditures, and staffing to the Maryland State Department of Education in these categories.
GLOSSARY OF TERMS

Frederick County Public Schools FY 2018 Operating Budget 216
Informational
Student Health Services – Funds personnel such as nurses and aides. Includes physical and mental health activities
that are not instructional and that provide students with appropriate medical, dental, and nursing services.
Student Personnel Services – Funds activities designed to improve student attendance at school and prevent or solve
student problems in the home, school, and community. Personnel such as pupil personnel workers, specialists, and
secretaries and programs such as the Student Services Office, counseling services, Family and Community Outreach
are included in this category.
Student Transportation Services – Funds activities that involve the transportation of pupils to and from school
activities either between home and school or on trips for curricular, co-curricular, and extracurricular activities.
Personnel such as bus drivers and bus aides and activities concerned with the conveyance of students between
home, school, and school activities are included in this category.
Supplies and Materials – A classification of expenditures where all expenditures for supplies and materials are
reported in each budget category except Fixed Charges. Funds textbooks, library books, office supplies, awards,
postage, and testing supplies and materials.
State Sources – Revenue from any agency of the State of Maryland that originates within the state, whether restricted
in use or not (e.g., state share of the Foundation Program, State Compensatory Education, Student Transportation
Aid, Limited English Proficiency, and Students with Disabilities).
STEM – Science, Technology, Engineering, and Mathematics
Textbooks and Instructional Supplies – Funds textbooks, instructional materials, library books, classroom teacher
supplies, and awards/recognitions.
TI – Technology Infrastructure
UDL – Universal Design for Learning
Unrestricted Funds – Appropriations comprising the majority of the total budget that can be used for any legal
purpose desired by the Board of Education.
USDA – U.S. Department of Agriculture
VAS – Virtual After School program
VDS – Virtual During School program
VOS – Virtual Outside of School program
ZBA – Zero balance account
GLOSSARY OF TERMS
Frederick County Public Schools FY 2018 Operating Budget217
Informational
This book was prepared by the Frederick County Public Schools Budget & Financial Reporting Departments for the benefit of our community. We would like to extend a thank you to Cabinet members and the staff of Communication Services who helped develop this document.
The Frederick County Public School system does not discriminate in admissions, access, treatment or employment in its programs and activities on the basis of race, color, gender, age, national origin, religion, sexual orientation or disability. For more information, contact the Chief of Staff & Legal Counsel at 301-696-6851.
Frederick County Public Schools Budget Office 191 South East StreetFrederick, MD 21701Phone: 301-644-5006Email: [email protected]: 301-644-5010
Leslie Pellegrino, Chief Financial Officer Heather Clabaugh, Budget OfficerCarl Parks, Budget AnalystJessica Clabaugh, Budget AnalystSue Weeks, Executive Secretary
ACKNOWLEDGEMENTS
CONTACTING THE BUDGET STAFF
191 S. East StreetFrederick, MD 21701
www.fcps.org

191 S. East StreetFrederick, MD 21701
www.fcps.org