Embed Size (px)
Citation preview
DP2012-22
Informational Efficiency under the Shogunate Governance:
Concentration and Integration of the Rice Market in Tokugawa Japan*
Yasuo TAKATSUKI
September 10, 2012
* The Discussion Papers are a series of research papers in their draft form, circulated to encourage discussion and comment. Citation and use of such a paper should take account of its provisional character. In some cases, a written consent of the author may be required.
Informational Efficiency under the Shogunate
Governance: Concentration and Integration of
the Rice Market in Tokugawa Japan ∗
Yasuo Takatsuki†
September 7, 2012
Abstract
In the Tokugawa period, the market transaction explosively grew,
and the local markets of all Japan were effectively integrated as a na-
tional market. This is the common view shared among the historians.
Then, an important question is how these markets performed. To
∗The author is deeply thankful to Masaki Nakabayashi, Matao Miyamoto, Kosuke Oya,
Yuzo Honda for their suggestions and kind support. He also appreciates for the helpful
comments from Toshihiro Matsumura, Dan Sasaki, Tetsuji Okazaki, Naofumi Nakamura,
Ryuzo Miyao, Kazuyuki Inagaki, Takenobu Yuki and the participants of seminars at Uni-
versity of Tokyo, Osaka University, Kobe University, and Bank of Japan. This study has
been supported by Grand-in-Aid for Scientific Research (C) 23530408, Grand-in-Aid for
Scientific Research (A) 60302676 and Research Grand of Seimeikai.†Research Institute for Economics and Business Administration, Kobe University, 2-1
Rokkodai, Nada, Kobe 657-8501, Japan. E-mail address: [email protected]
1
evaluate the performance, this paper focusses on the co-movement of
rice prices between Osaka and Otsu. Applying the Granger causality
test, it is shown that the Otsu market had reflected the rice prices in
Osaka within two days in the early 19th century, and within a day in
the mid-19th century. This change had stemmed from the develop-
ment of the communication technology. The rice merchants’ appetite
for the information had made the co-movement of the rice prices so
fast that the Otsu market did not need even one trading day to reflect
the rice prices in Osaka.
2
I. Introduction
Under the governance mechanism established by the Tokugawa Shogunate
in Edo,1 the Shogunate and the feudal lords collected rice as a tax in kind,2
and shipped it to the market to finance their expenditure. Originally, this
system of taxation emerged on the basis of the development of local markets,
which subsequently led to the development of a sophisticated rice transaction
mechanism in Osaka. The rice market in Osaka was called the Dojima rice
market, and it was chartered by the Tokugawa Shogunate in 1730. Trades
at the Osaka market were made, not through the trade of rice in kind, but
through the trade of rice bills (“Kome kitte”),3, with the claim over rice in
kind represented by the rice bill being protected by the Shogunate. 4 The
distribution network and the judicial system provided by the Shogunate made
Osaka the center of the market, with its sophisticated trading mechanism.
The local markets, in turn, followed this trading system. One typical
example of such a local market was the Otsu market. Otsu is located near
Osaka and it had the second largest rice market after the Osaka market. The
rice market in Otsu—“Goyo komekaisyo (The rice market authorized by the
Shogunate, henceforth referred to as the Otsu market)”—was chartered by
the Shogunate in 1735. Both Otsu and Osaka belonged to the Shogunate
1Edo was the Shogunate capital, subsequently renamed Tokyo in 1868.2In this context, tax refers to the total amount of tax and rent accrued to the Shogunate
and the feudal lords.3A rice bill was issued by the feudal lord’s warehouse, and represented a certain amount
of rice. It was introduced as a means to reduce the transaction costs involved in trading
large volumes of rice.4See Takatsuki (2009a), Takatsuki (2009b).
3
domain. While the Shogunate gave feudal lords the authority to rule their
domains, it had its own domains (“Ten-ryo”) in various regions in Japan,
which covered the most important and developed cities such as Osaka and
Otsu. The trades in the Shogunate domain were under the jurisdiction of
the Shogunate local court. In fact, as discussed later, the Otsu market had
a similar trading system, and judicial system, to the Osaka market.
These institutions resulted in an explosive growth of market transactions
in the Tokugawa period, and the local markets of Japan were effectively
integrated into a national market. Therefore, an important and interesting
question is how these institutions performed.
According to neoclassical economics, the sufficient development of market
transactions can lead to a Pareto-efficient allocation of resources. Unfortu-
nately, it is not easy to directly evaluate the Pareto-efficiency of the real
economy. However, the ability of market transactions to deliver an efficient
resource allocation depended upon an important condition: informational
efficiency. Using this basic but important idea, Fama (1970) established a
useful and practical measure to evaluate markets.
The concept of informational efficiency is a proxy to measure how much,
how fast, and how accurately available information is incorporated into prices.
Fama classified this informational efficiency into three categories—weak, semistrong,
strong—based on the nature of the “available information”.
Of these categories, the weak-form efficiency is the most basic but also
the most important criterion, because if it does not hold, then neither the
semistrong-form nor the strong-form efficiency will be satisfied. The weak-
form efficiency exists if prices fully reflect all the information contained in the
4
history of past prices and returns. In such a situation, traders cannot earn
excess profits from using only the information on past prices and returns.
The author has already documented that the weak-form efficiency was
achieved at the Osaka market. 5 The next step is to investigate the co-
movement of prices between Osaka and the local market. As in the case of
a trading system, it is quite natural to think that the prices in Osaka were
referred to by the local market.
The literature has examined the comovements of the Osaka market and
the local markets, focusing on price correlation between the markets. A
high correlation among prices was found, and it was considered that the
coefficient of correlation indicated that Osaka worked as a central market.
However, the coefficient of correlation on which the literature relied can tell
us only the results of the comovement of the variables. To argue that Osaka
was the central market, we need to observe not the results but the process
of transmission of the prices. As discussed below, this paper relies on the
bivariate Granger causality test.
Moreover, the price indices used by the literature were not frequent at all,
typically being monthly or yearly. In the Tokugawa period, letters from Edo
to Osaka, which were approximately 500 kilometers apart, were delivered
within about six days, and letters from Osaka to Otsu, a distance of about
50 kilometers, were delivered within a day. This implies that the prices
at Osaka could be transmitted to very distant markets within a week, or
to neighboring markets within a day. Given such a dense communication
system, monthly or yearly price indices could not convey any meaningful
5See Takatsuki (2008a), Takatsuki (2008b).
5
results about informational efficiency.
Therefore, we need to construct a more reliable and price index based on
frequent observations from an original historical document. Our new source
is “Yorozu souba nikki (Daily memorandum of commodity price indices)”.
From this memorandum, we can construct the daily price index in both Osaka
and Otsu during the period from 1798 to 1856. Relying on this new index,
this paper will evaluate the comovement of prices between Osaka and Otsu.
The structure of this paper is as follows. Section II introduces the in-
stitutional aspects of the Dojima market and the Otsu market, and reviews
the daily price index that was newly constructed. This section serves as
background for subsequent discussions. Section III establishes the model for
capturing the comovement of prices and presents the results, followed by
concluding remarks.
II. Institutions and the price index
Trades in the Osaka market
First, the trade activities in Osaka will be introduced.6 Rices, collected as
tax in kind and shipped by the feudal lords, were stored in the warehouses
(“Kura-Yashiki”,) located in Osaka, and sold at the auction. Rice brokers
who made a successful bid received the rice bills (“Kome-Kitte”) which, per
bill, was worth 1500kg rice in kind stored in the warehouses.7 In principle,
6See Miyamoto (1988) and Schaede (1989) for further institutional descriptions of the
Dojima rice market.7In the late 17th century, each rice bill corresponded to a particular set of rice that the
broker won at the auction. In later times, this correspondence gradually collapsed and
6
the rice brokers could have submitted their rice bills to the warehouse and
received real rice in exchange. In reality, however, they mainly sold the bills
in the secondary market, the Dojima rice market. Thus, the spot market in
Osaka should be regarded as a market for the exchange of rice bills, not of
rice in kind.
Issuing a rice bill without being backed by inventory had not been per-
mitted by the Shogunate since 1761. However, the Shogunate did not really
suppress that kind of rice bills. While the governor of Osaka8) implicitly
allow the warehouses to issue a rice bill without being backed by inventory,
he force the warehouses to respect the claim of the rice bill holders. It meant
that the claim over rice in kind represented by the rice bill was protected by
the court of the city of Osaka.9
In the spot market, rice bills were required to be delivered in exchange for
cash within four days of the transaction. Formally, only officially chartered
rice brokers could trade in the market, although in reality, anybody who paid
a fee to the chartered traders could join in the market.
There were about 30 types of rice bills issued by feudal lords’ warehouses,
and the traders’ association chose one rice bill among those 30 rice bills as
the standard rice. This standard rice was the underlying asset for futures
trade. Like the spot market, the traders in this market were formally limited
to officially authorized members. However, other traders could trade in the
market by paying a small fee to the authorized traders. The fee associated
rice bills came to take on the character of securities. See Shimamoto (1960).8The governor, “Osaka-Machi-Bugyo”, was in charge of the judiciary, the police, and
other administrative services.9For a further description, see Takatsuki (2009a), Takatsuki (2009b).
7
with the futures trades was less than that of the spot trades. In addition, the
amount of cash required in the futures market was relatively low compared
to that required for the spot market. These features of the futures market
attracted many traders, especially speculators.
In principle, the futures market traders had to close their positions by
buying back or selling back before the maturity date. That is, “roll over”
across the trading periods was strictly prohibited. For example, a trader
who took a long position during the trading period was required to close his
position by the maturity date by selling the same amount involved in the con-
tract. Settlement by delivery was permitted until the maturity date, subject
to a constraint imposed by the Tokugawa Shogunate. That is, in the Osaka
market, the amount permitted to be settled by delivery was strictly limited
to a fixed level of 1000 rice bills for the whole market. Under this constraint,
the futures market participants the rice bills thorough the futures market.
Usually, net settlements were the dominant method of the settlement.
The spot and futures markets had three separate trading seasons, with
the trading seasons for the spot market being a day longer (as shown in
parentheses): January 4–April 27 (28), May 7–October 8 (9), and October
17–December 23 (24)10. These trading seasons were referred to as the spring
market, the summer market, and the winter market, respectively. The mar-
kets were closed for about 10 days between any of the two trading seasons.
Every time the trading season started, the futures market committee was
supposed to reselect the standard rice measure. Usually, the standard rice
was selected from among the warehouses of the Big Five lords 11.
10The dates in parentheses are those for spot market.11That is, Kaga, Chikuzen, Chugoku, Higo, and Hiroshima. Each was regarded as
8
Trading began at about 8 a.m. in the futures market, followed by the spot
trading, which began about 10 a.m. Both trading sessions began with an
opening price being presented by the board members of the Dojima market.
In the futures market, the opening price was determined by the closing price
of the previous day. On the other hand, the opening price in the spot market
was determined by two factors: the closing price on the previous day, and
the price movements of the futures market preceding the spot market.
In both markets, the price was fixed by an open-outcry system. This
involved traders in the circuit shouting the price, accompanied by gestures
that indicated either an “ask” or a “bid”. The price was fixed only when
the ask price and the bid price matched each other. Every time a trading
deal was established, the clerk beat a wooden stick and shouted the price.
In the futures market, the trading records were not written down until the
completion of the trade at the end of the day. After trade was closed, the
traders submitted the record to the clearing house. Then, the clearing house
checked each traders’ transactions and canceled out his buying and selling.
Finally, a record was kept of each traders’ remaining position.
The spot market closed around noon. On the other hand, the futures
trade had a one-hour recess at noon and continued trading until around 2
p.m. The closing price of the futures market was fixed by a special method.
First, the clerk lit a fuse cord; the traders were allowed to trade until the fire
was extinguished. The closing price of the day was determined by the price
at the moment the fire went out.
The features detailed above indicate that the trades in the Osaka market
satisfying the requisite conditions, namely credibility and liquidity.
9
were designed to deal not only with real demand for rice and rice bills, but
also for speculation. In other words, the market was designed to accumulate
traders’ information. The concentration of rice and information made Osaka
the center of the market at that time.
Trades in the Otsu market
Some feudal lords whose domains were located along the Japan Sea coast
tended to ship their rice to Otsu. As in Osaka, the rice was stored in ware-
houses and sold at auction. Then, rice bills were issued and traded on the
Otsu markets. Again, here each rice bill was worth 1500 kg of rice in kind
stored in the warehouses, 12 and claims over rice in kind represented by rice
bills were protected by the governor in Otsu.13 Given that both the Otsu
and the Osaka markets were located in the Shogunate domain, it was rather
natural that both systems were similar.
The rice bills traded on the spot market in Otsu were issued mainly by
Wakasa warehouse and Hikone warehouse. The former was called “Kumagawa-
mai (The rice cropped in Kumagawa district, henceforth referred to as the
Kumagawa rice)”, and the latter was called “Sawa-mai (The rice cropped in
Sawayama district, henceforth referred to as the Sawa rice)”. Although a
standard rice was not officially chosen, the Kumagawa rice was recognized as
a kind of standard rice in Otsu.14 Both Kumagawa rice and Sawa rice were
designated as the underlying assets for the futures trades. That is, mainly
there existed two futures markets—the Kumagawa futures market, and the
12Otsu-Shi-Shi gekan (The history of Otsu city—volume 3), pp.94–95.13Otsu-Shi-Shi gekan (The history of Otsu city—volume 3), pp.80–81.14Otsu-Shi-Shi gekan (The history of Otsu city—volume 3), pp.94–95.
10
Sawa futures market. While the “Yorozu souba nikki (Daily memorandum
of commodity price indices)”, our new source for constructing a daily price
index, recorded the prices of both markets, only the Kumagawa futures prices
can be tracked continuously. Therefore, we focus on the Kumagawa market.
While the trading activities in Otsu have not been clearly described, es-
pecially compared with Osaka, we can provide an outline.
Trading began at about 10 a.m. in the spot market and the Kumagawa
futures market. In both markets, trading began with the opening price being
presented by the board members of the market. As mentioned in Section III,
the opening price was determined with reference to prices in Osaka on the
previous day. The Kumagawa futures market closed at about 2 p.m. as a
general rule.
While traders in both the spot market and the futures market were for-
mally limited to officially chartered members, in practice, other traders could
join the market by paying a small transaction fee.15 In the Kumagawa futures
market, the traders closed their positions by buying back or selling back in
principal. These procedures of the futures market were similar to those in
Osaka.
Despite these similarities between the Osaka and Otsu markets, some dif-
ferences existed. In the Otsu markets, settlement by delivery was permitted
up to the maturity date without any constraints, and the traders could “roll
over” trades across trading periods. While the Osaka markets were closed
between each trading period, the Otsu market was open throughout the year.
15Otsu-Shi-Shi gekan (The history of Otsu city—volume 3), p.85.
11
The new price index
As mentioned above, because infrequent price indices do not yield any in-
sights regarding informational efficiency, we need to construct a highly fre-
quent price index from an original historical document. Our new source,
“Yorozu souba nikki (Daily memorandum of commodity price indices)”, is
the memorandum described by a contemporary rice merchant who traded
rice and fertilizer. Although this merchant traded mainly in the Otsu mar-
ket, he regularly recorded prices in both Osaka and Otsu. The memorandum
mentions that his trades in Otsu were closely linked with the prices in Osaka.
From this memorandum, we can construct a daily price index for both
Osaka and Otsu, which covers the period from 1798 to 1856.16 Among the
prices listed, we will focus on: i) the futures price in Osaka, and ii) the fu-
tures price of Kumagawa rice in Otsu. In Osaka, as mentioned above, the
opening price in the spot market was determined by the price movements
in the futures market, and the spot market closed about three hours before
the futures market did. For this reason, all prices in Osaka can be seen as
summarized in the futures price. On the other hand, as the price indices of
Sawa rice and the spot prices of Kumagawa rice cannot be tracked continu-
ously, the futures prices of Kumagawa rice are used as representative prices
of the Otsu market. Using these two price indices, we will investigate the
comovement of prices between Osaka and Otsu.
16The prices in the period from 1819 to 1839 cannot be observed because the document’s
state of preservation for these years is very poor.
12
III. The comovement of rice prices between
Osaka and Otsu
Communication between Osaka and Otsu
The following historical document was submitted by the rice merchants to
the governor in Otsu. It reports the trading systems and practices in Otsu,
focusing on the relationship between Osaka and Otsu.
Because the rice prices in Osaka are representative prices of all
rice markets, a trader in Otsu cannot trade without informa-
tion about the rice prices in Osaka. A market report from Os-
aka, which records the prices on the previous day, arrives at the
Otsu market every morning. In addition, some traders person-
ally gather information on the Osaka markets before the market
report arrives at Otsu, because they are eager to catch the infor-
mation as soon as possible. 17
There are at least two points to be noted. First, the traders in Otsu mar-
ket referred to the prices in Osaka as representative ones. This supports the
results of Takatsuki (2008b); the Osaka market had achieved informational
efficiency at least in terms of weak-form efficiency. In fact, a market report
from Osaka can be found in many other markets. Not only the Otsu market,
but also many other local markets tried to determine the prices in Osaka as
17“Ho-reki 11 nen ku-gatsu, bugyo-no otazune-ni kootauru ko-jo-syo (The report sub-
mitted to the governor in September 1761)”, cited by Otsu-Shi-Shi tyu-kan (The history
and culture of Otsu city—volume 2), pp.856–859.
13
soon as they could. Indeed, the rice price indices in Osaka were referred to
as the informative prices by the local markets.
Second, the traders in Otsu were eager to know the prices in the Osaka
market as soon as they could. This meant that they could not earn excess
profits until the market report arrived in the morning.
The rice merchants’ appetite for excess profits led to the development of
a communication technique. According to the “Yorozu souba nikki”, from
1840, the prices in Osaka were transmitted to Otsu within a day. By this
stage, the communication methods developed from the mailman to a sys-
tem of flag signaling. In fact, while the “Yorozu souba nikki” recorded the
closing prices of the Osaka rice market before 1818, from 1840 onwards, it
recorded not only the closing prices but also the intra-day prices. This clearly
shows that dense trades in both Osaka and Otsu required an update of the
communication technique.
How did these developments influence the comovement of prices between
Osaka and Otsu? This is the question to be answered in the following section.
The test statistics
To inquire into these points, this paper relies on the bivariate Granger causal-
ity test. Here, we estimate the two-variable vector auto regressive (VAR)
model to assess the comovement of prices between Osaka and Otsu. The
model includes both the log return of the futures prices in Osaka and the log
return of the futures prices of Kumagawa rice in Otsu. The VAR model is
given as follows:
yt = ψ1yt−1 +ψ2yt−2 + · · ·+ψpyt−p + ut,
14
where y is the two-dimensional vector, consisting of the logarithmic returns
of the futures markets in Osaka and Otsu, u is the white noise vector, and t
is timing.
Running the least squares analysis, we can observe the cross-interaction
between Osaka and Otsu. The optimal number of lags is determined by the
Schwarz’s Bayesian Information Criterion (SBIC).
The results
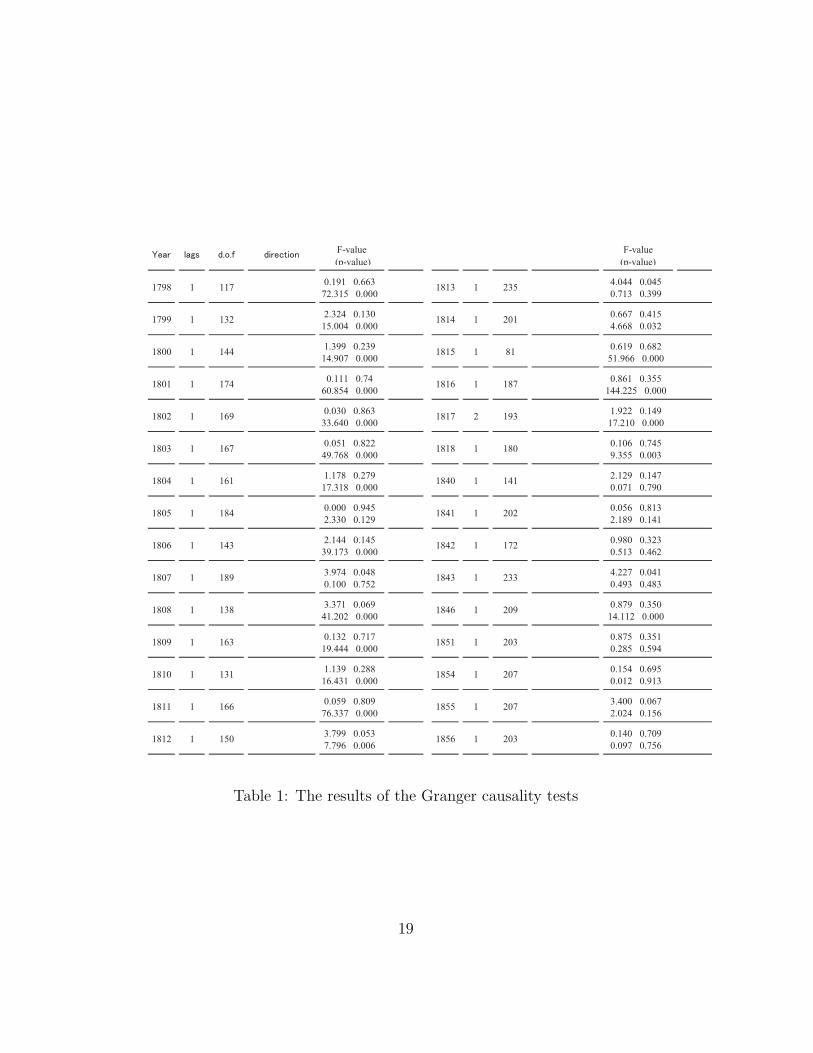
The results of the tests are shown in Table 1. In the period from 1798 to 1818,
the futures prices in Otsu obviously followed the prices in Osaka. In addition,
according to the SBIC, the futures prices in Osaka tended to precede those in
Otsu by one trading day. This result implies that the Otsu market reflected
the prices in Osaka within two days. Here, we need to remember that, in this
period, the information about the Osaka market was transmitted to Otsu by
mailman. Hence, the delay of one trading day does not necessarily mean
that the Otsu market took two trading days to reflect the prices in Osaka.
Given the communication technique utilized in those days, the Otsu market
reacted to the Osaka market immediately after market participants received
a market report.
On the other hand, in the period from 1840 to 1856, a clear lead–lag
relationship did not exist between the two markets. There are two possible
ways to understand the relationship in this period. First, both prices moved
independently. Second, both prices moved simultaneously. In both cases, the
lead–lag relationship cannot be detected by the VAR model.
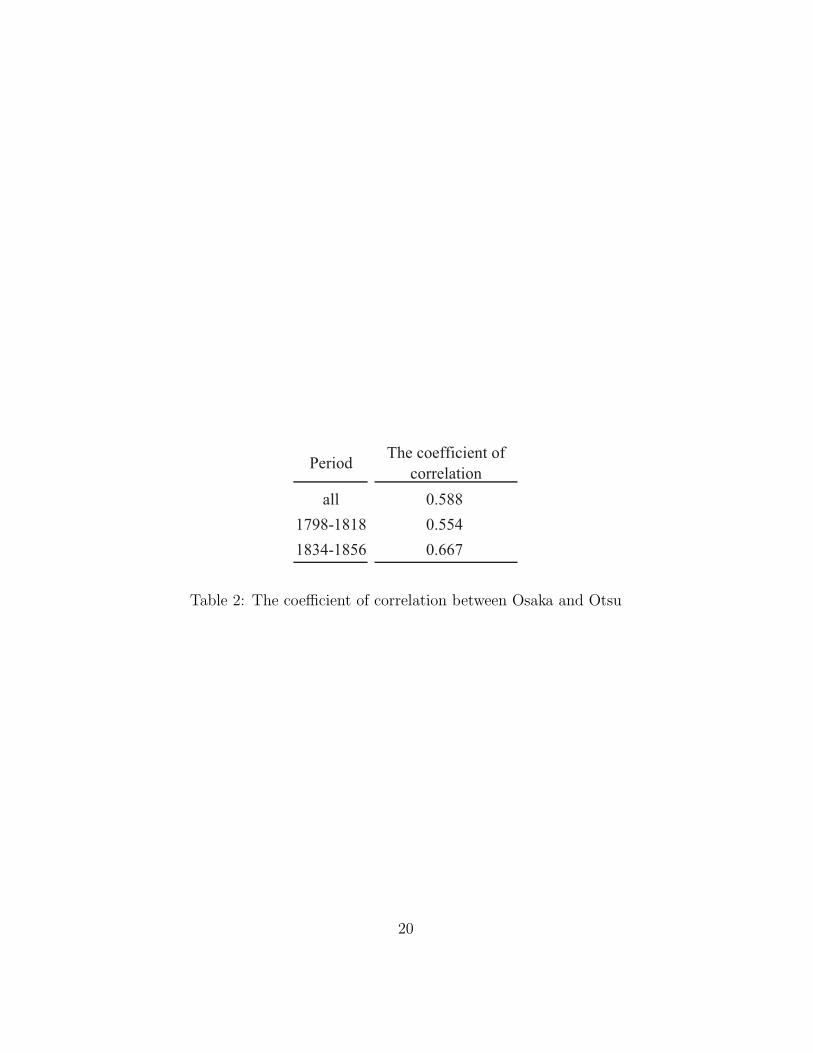
To determine which case occurred in reality, the coefficient of correlation
15
was calculated. Table 2 shows that both prices are highly correlated with
each other, and the coefficient in the latter period is bigger than that in the
earlier period. This implies that both prices moved simultaneously. That
is, the Otsu market reflected the prices in Osaka within a day. It was the
development of the communication technique that brought about this result.
After this stage, the Otsu market did not need even one trading day to reflect
the prices in Osaka.
Concluding remarks
The comovement of prices in the Tokugawa period reached a level that pre-
viously had not been experienced. The Otsu market did not need even one
trading day to reflect the prices in Osaka in the early 19th century, and the
traders at that time could not earn excess profits without the latest informa-
tion about the Osaka market.
Thus, Osaka did indeed work as a center market, with neighboring mar-
kets following Osaka sufficiently quickly. The distribution network had led
to a sophisticated trading system in Osaka, and the integration of the rice
market had led to a dense communication network being developed between
the center market and the local markets.
16
References
Fama, E.F., “Efficient Capital Markets:A Review of Theory and Empirical
Work,” The Journal of Finance, 1970, 25 (2), 383–417.
Miyamoto, M., Kinsei Nihon no Shijo Keizai (The marketet Economy of
Pre-Modern Japan, Yuuhikaku, 1988.
Schaede, U., “Forwards and futures in Tokugawa-period Japan,” Journal
of Banking and Finance, 1989, 13, 487–513.
Shimamoto, T., Kuramai Kitte no Kisoteki Kenkyu (A Fundamental Study
on the Rice Bills), Sangyo-Keizaisha, 1960.
Takatsuki, Y., “Kinsei ryousyumai chuoshijo no kinou (The center of
rice trade in Tokugawa Japan: efficiency of the Dojima rice market),”
Syakai-Keizaishigaku (Socio-Economic History), 2008a, 74 (4), 3–22.
, “The formation of the efficient market in Tokugawa Japan,” Institute
of Social Science, The University of Tokyo, Discussion Paper Series,
2008b, F-143.
, “Komekitte Saikou: Houreki jyuichinen karamaikitte choujirei no igi
(A reexamination of Rice Warrrants in late premodern Osaka: The
meaning of the 1761 Ban on Rice Warrants not confirmed by warehouse
inventory),” Shigaku-Zasshi (The Historical Society of Japan), 2009a,
118 (6), 73–88.
, “Kinseinihon komeshijo ni okeru zaisanken no hogo (Property rights
protection in Tokugawa Japan: The case of rice exchange market in Os-
17
aka),” Rekishi to Keizai (The journal of political economy and economic
history), 2009b, 205, 33–45.
Historical document
“Yorozu Souba Nikki (Daily memorandum of commodity price indices),” held
by Kokubungaku Kenkyushiryokan Rekishishiryo Etsuranjimushitsu (Office
of Archives Services in National Institute of Japanese Literature), Tokyo,
Japan.
Documents published by the public offices
Otsu-shi-shi—ge-kan (The history of Otsu city—volume 3), published by the
government of Otsu city in 1942.
Otsu-shi-shi—tyu-kan (The history and culture of Otsu city—volume 2),
published by Otsu education organization in 1911.
18
F-value
(p-value)
F-value
(p-value)
0.191 0.663 4.044 0.045
72.315 0.000 0.713 0.399
2.324 0.130 0.667 0.415
15.004 0.000 4.668 0.032
1.399 0.239 0.619 0.682
14.907 0.000 51.966 0.000
0.111 0.74 0.861 0.355
60.854 0.000 144.225 0.000
0.030 0.863 1.922 0.149
33.640 0.000 17.210 0.000
0.051 0.822 0.106 0.745
49.768 0.000 9.355 0.003
1.178 0.279 2.129 0.147
17.318 0.000 0.071 0.790
0.000 0.945 0.056 0.813
2.330 0.129 2.189 0.141
2.144 0.145 0.980 0.323
39.173 0.000 0.513 0.462
3.974 0.048 4.227 0.041
0.100 0.752 0.493 0.483
3.371 0.069 0.879 0.350
41.202 0.000 14.112 0.000
0.132 0.717 0.875 0.351
19.444 0.000 0.285 0.594
1.139 0.288 0.154 0.695
16.431 0.000 0.012 0.913
0.059 0.809 3.400 0.067
76.337 0.000 2.024 0.156
3.799 0.053 0.140 0.709
7.796 0.006 0.097 0.7562031812 1 150 1856 1
207
1811 1 166 1855 1 207
1810 1 131 1854 1
209
1809 1 163 1851 1 203
1808 1 138 1846 1
172
1807 1 189 1843 1 233
1806 1 143 1842 1
141
1805 1 184 1841 1 202
1804 1 161 1840 1
193
1803 1 167 1818 1 180
1802 1 169 1817 2
81
1801 1 174 1816 1 187
1800 1 144 1815 1
235
1799 1 132 1814 1 201
1798 1 117 1813 1
Table 1: The results of the Granger causality tests
19
PeriodThe coefficient of
correlation
all 0.588
1798-1818 0.554
1834-1856 0.667
Table 2: The coefficient of correlation between Osaka and Otsu
20