Embed Size (px)
Citation preview

Information Visualization
Trajectories, Traces and Tools for Augmenting Human
Intelligence
Dr. Ray UzwyshynUniversity of Miami Digital Libraries
Egyptian Amanuensis: ThothScribe
Weblog

Information Visualization and the Scientific Method
Sumerian Catalog (2000 B.C.)
Technology: Baked Clay Tablet, Hammer
Problem Solved : Limitation of Human Memory
Innovation: Visually Iconic Script
New Problem: Information Retrieval, Medium storage – The Bricks are heavy

New Technology, Medium Possibility, Historical Dialectic
Technology: Papyrus, rolled into scrolls, placed in Libraries, lightweight
Innovation: reduced character set - Alphabet
Kata + Logos(list of words)
Technology: Augments Human Intelligence Solves Problem of Previous Technology, Generates New Problem horizon Kuhn’s Paradigm Shift: Isn’t the
clay tablet enough? Problem of previous infrastructures (skillsets, experts)
MetadataList of Scrolls

1st Information Renaissance
• Gutenberg (Mechanical Reproduction, Moveable Type, 1452)
Technology: Printed Book
Solves Problem: Dissemination (Copies, Copyists)
Information explosion creates new knowledge, infrastructures, new problem sets: retrieval, organizing relationships between bodies of Information Augmenting Human Intelligence

Flashforward, 1876-1985 Information Design Systemization
• System Wide Classification of expanding Universe of Knowledge
Melvil Dewey: Dewey Decimal Classification System (1876)Origin of Species (Darwin, 1860)Age of hierarchical tree Taxonomies, systems
• Library of Congress Printed Cards (1901)Metadata Containers become Large
Problem: Unseen/Fluid Interdisciplinary Relationships among Larger Bibliographic Universe is Lost

1960 - 1980’s Automating 19th Century Innovation
• Microfiche: Card Catalogue on Microfiche, then CD-ROM.
•Innovation: Reduction Entire Printed card catalog (cabinets) to a small machine space
New Problem Set - Lost Larger Context, Non-linear searching
• Remapping 19th Century Innovation onto 21st Century Technology

1990’s - Present Academic OPAC Catalog & Google: Current Large
Scale Information Retrieval Models
Partially solves Linear A- Z analog Search either scanning microfiche or cards, infinite copiesProblem Creates Infinite Scrolling List Syndrome. Not Scalable, How Do Entities Relate
Lost Context of Larger Information Universe

Where do we go from here? Information Visualization offers possibilities
Command Line InterfaceInfinite Scrolling List ParadigmLiteral
GUI : Working on the level of Iconic abstraction: metaphor, narrative, icons used as cognitive tools or pointers
Semantic Relationships Visually Semiotic Relationships
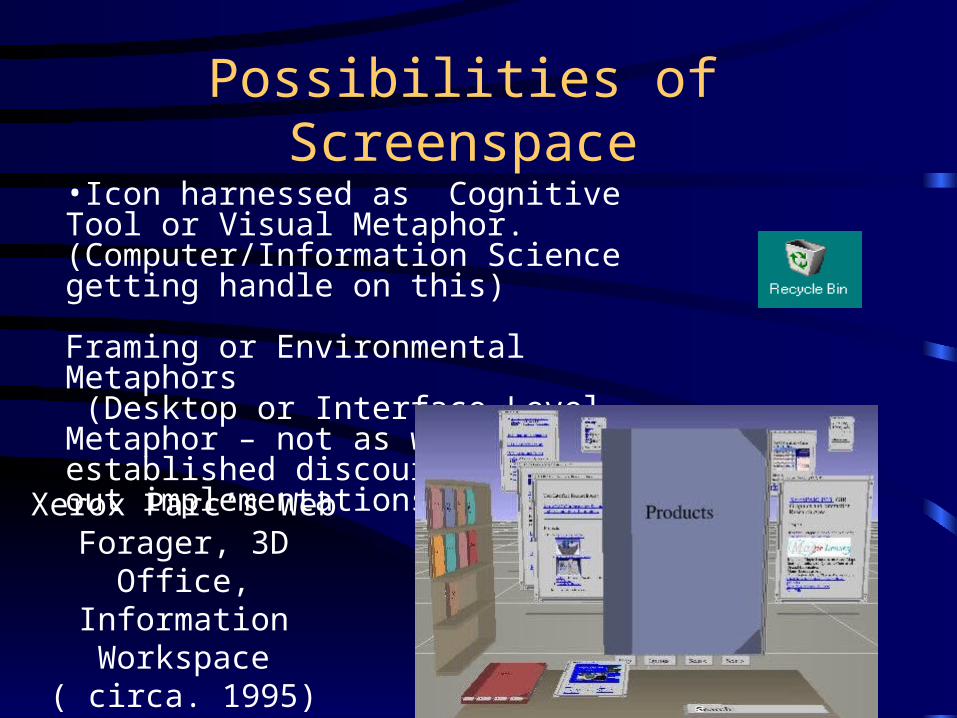
Possibilities of Screenspace
•Icon harnessed as Cognitive Tool or Visual Metaphor. (Computer/Information Science getting handle on this)
Framing or Environmental Metaphors (Desktop or Interface Level Metaphor – not as well established discourse or thought out implementations)
Xerox Parc’s Web Forager, 3D Office,
Information Workspace( circa. 1995)
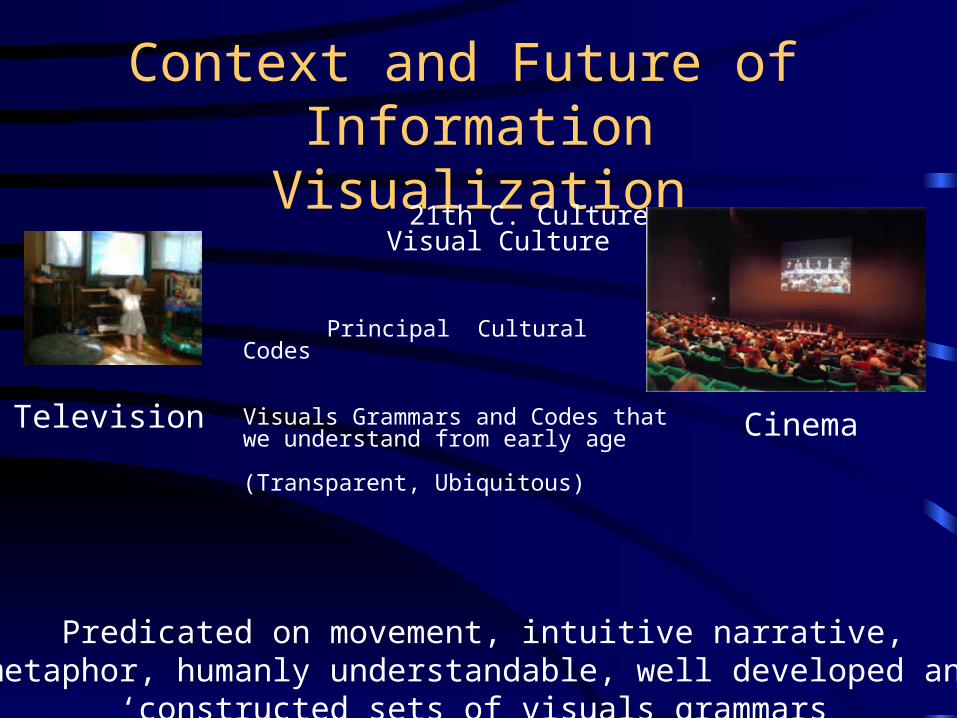
Context and Future of Information Visualization 21th C. Culture
Visual Culture
Principal Cultural Codes
Visuals Grammars and Codes that we understand from early age
(Transparent, Ubiquitous)
Television Cinema
Predicated on movement, intuitive narrative, metaphor, humanly understandable, well developed and ‘constructed sets of visuals grammars
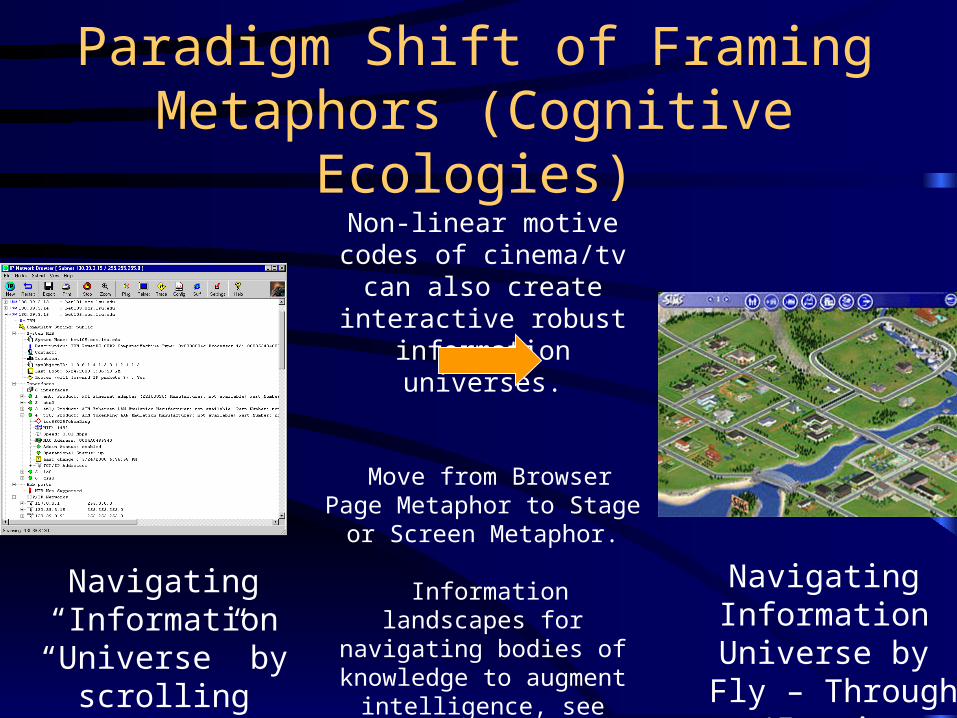
Paradigm Shift of Framing Metaphors (Cognitive Ecologies)
Non-linear motive codes of cinema/tv can also create
interactive robust information universes.
Move from Browser Page Metaphor to Stage or Screen
Metaphor.
Information landscapes for navigating bodies of knowledge
to augment intelligence, see larger relationships and create
new knowledge.
Navigating “Information
“Universe” by scrolling (remnant)
Navigating Information Universe by
Fly – Through (Iconic remnnant)

Motion, Narratology, Interactivity Harnessed as Information Visualization Tools, for large bodies of Information (data)
1st Phase Study of Visual Grammars, Visual Narrative Codes, Art History, Bertin (Geography) Tufte (Mathematical Statistics)
Overlooked bodies of theoretical literature, Cinema Studies: Structural/Formalist studies of Codes of Movement in Time. Visual Semiotics, (Eisentstein, Bazin, Christian Metz – Structural Visual Grammar)
•
The Next Cognitive Toys or Philosophical Toolsets for Information Science

AugmentingCognition
Data
Information Visualization: Larger Purposes Visually Augment Human Intelligence to Facilitate New
Knowledge Generation
BackendRelationalDatabase
MiddlewareInfinite StoragePotential,Memory Front End
Interface
Human User
Information Visualization(HCI)
Global NetworkedPotential of Internet
•Interactivity + Robust Backend Database Information + Online Connectivity + Theoretically thought out and Visually Iconic Motive Interfaces

Visual Cognitive Cartographies
• ASIST SIG VIS Websitehttp://www.asis.org/SIG/SIGVIS
Keywords subject headings mapped to motive
interactive 3d Space

3D Typographic Fly Through or 3D Cognitive Map.
Previously Unseen Subject Relationships in Same
Visual Space
Future: The trick is to begin thinking about mapping taxonomies visually (i.e. navigating the entire set of LCSH or an entire Robust Academic
Library Catalog)
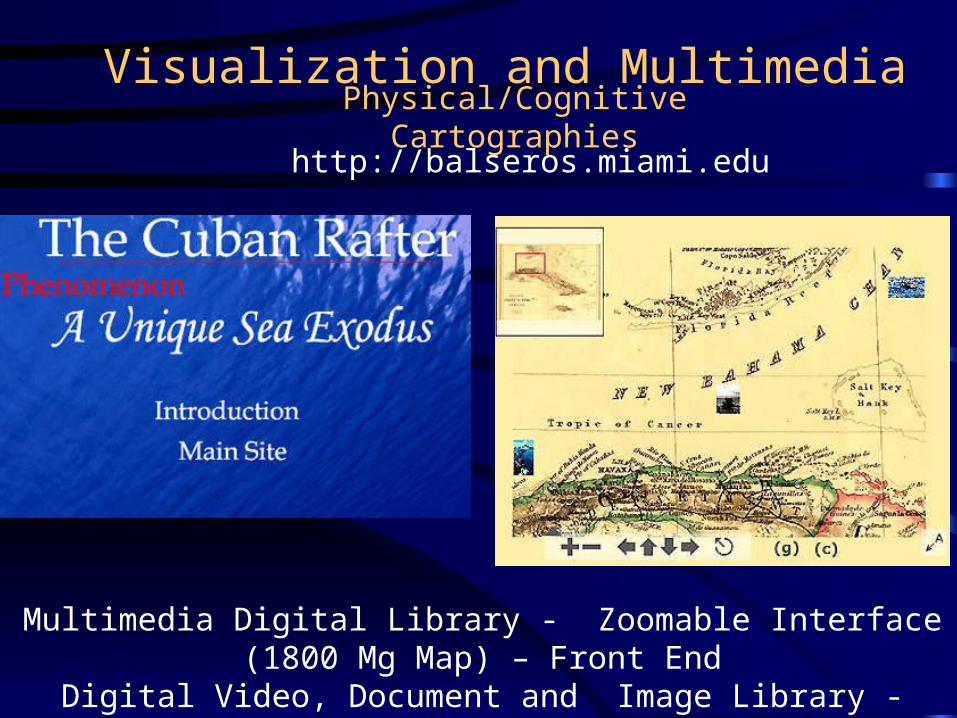
Visualization and Multimedia
http://balseros.miami.eduPhysical/Cognitive Cartographies
Multimedia Digital Library - Zoomable Interface (1800 Mg Map) – Front End
Digital Video, Document and Image Library - Database Back end.

Zoomable Fly-Through Intuitive Navigation
Context Preserved (Upper Left)/ Humanly Intuitive
Map
New Visual Interface Possibilities
Link to Image and Video Library Databases
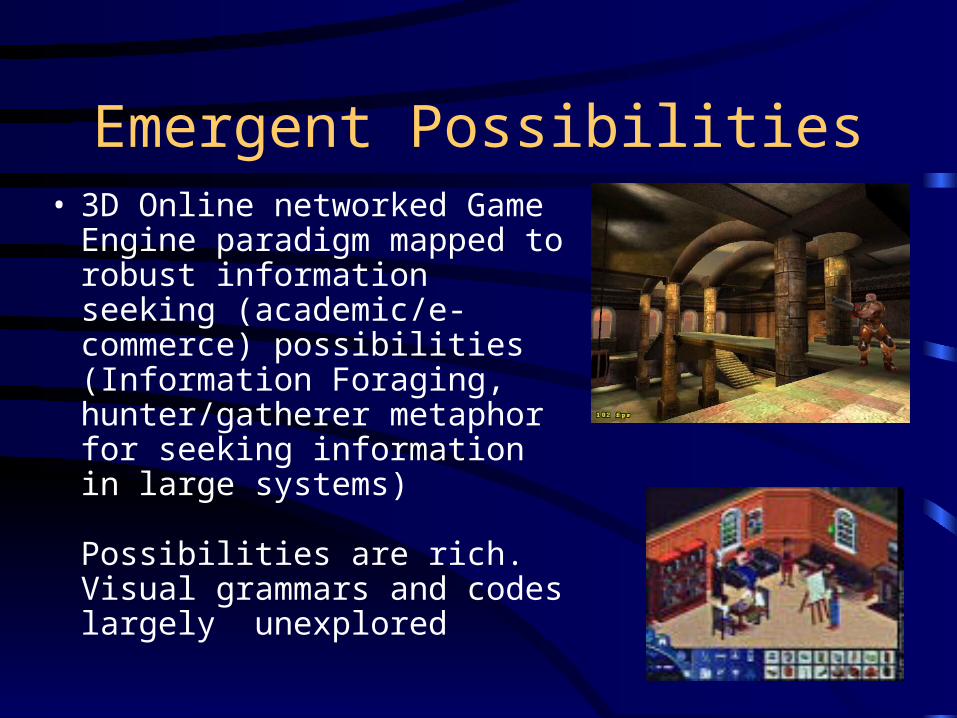
Emergent Possibilities• 3D Online networked Game
Engine paradigm mapped to robust information seeking (academic/e-commerce) possibilities (Information Foraging, hunter/gatherer metaphor for seeking information in large systems)
Possibilities are rich.Visual grammars and codes largely unexplored

Where has Innovation Been Historically Accomplished? Left Brain School of Info. Visualization
Math/computer/information science Ph.D’s Military Technology InnovatorsMedical Researchers (Gene Sequencing)GIS/Spatial Engineers
‘Serious’ Purposes: Information Mapping, Organizing Large bodies of information visually, relationally, dynamically. Historically high cost of entry (Computer Power, Warnock & Sutherland in Utah)

Right Brain School of Information Visualization
(The Low End or Historically Recent Barbarians at the Gates)
Web Designers (Flash Group, Online Vector Animation tied with Robust Programming Backend) Online Game Designers Graphic Designers (Advertising Catalogs/Database Synthesis)Innovative Usual Suspects (Parc, Maryland, MIT Media Lab)
(Renegade creators interested in Cognitive Cartography, Information Mapping, Information Architecture coming to this intuitively and out of necessity not aware of historical legacy but immersed in techno zeitgeist: games, comics, cinema codes, cool factor)
Lens, Telescope, Microscope, Screen

Information Visualization
Digital Renaissance Horizons Largely Unexplored
• Where is the new innovation to occur regarding Information Visualization or new solutions surrounding Visualizing large amounts of information?
• Transgressing/Bridging Boundaries/ Borders, marrying high and low, right and left
Info. Science Paradigms + Game EnginesSerious Purpose + Entertainment Innovation Visual Creativity + Mathematics
Need for Synthetic Renaissance Ideology (Discussion, Implementation/Praxis)

The real voyage of discovery consists of not in seeking new technological landscapes but
in learning to see with new eyes.
ProustRemembrance of Things Past

Brief Information Visualization Bibliography - Books
Chen, Chaomei. Information Visualization and Virtual Environments. New York: Springer, 1999. (also, other texts )
Shneiderman, Ben. Card, Stuart K., Mackinlay, Jock D. Readings in Information Visualization. San Francisco: Moran Kaufmann, 1999. (also, other texts)
Spence, Robert. Information Visualization. ACM Press, 2000.

Websites – Links to Working Applications and Current R&D
• Human Computer Interaction Laboratory (Shneiderman et al., College Park Maryland)http://www.cs.umd.edu/hcil/ (click Visualization)
Flashforward http://www.flashforward2003.com (Click on past winners for excellent examples)
MIT Media Lab, In particular John Maeda’s Aesthetics and Computation/Visual Language Groups) http://acg.media.mit.edu/ and http://plw.media.mit.edu
Xerox Parc Research Group http://www.parc.xerox.com/research

A Few R&D Developers
• Jared Tarbell http://levitated.netEric Natzke http://www.natzke.comYugo Nakamura http://www.yugop.comJoshua Davis http://www.joshuadavis.com
• Finally, my more informal weblog: horizons of visualization/digital library explorations: http://libprod.library.miami.edu:41430/webservices

Presentation Available Online• http://www.library.miami.edu/infoVisualization.ppt
• Handout available at front
• Thank You For Coming!
Contact Info: Dr. Ray Uzwyshyn, [email protected] of Miami Digital Library Initiativeshttp://members.aol.com/rayuwish(786)281-2824.