Embed Size (px)
Citation preview
Information Visualization and Machine Learning
Fabrice Rossi
Projet AxIS, INRIA Rocquencourt
27-28/02/2007
F. Rossi (INRIA) Infovis & ML 27-28/02/2007 1 / 172
Goals of this lecture
1 To give an introduction to Information Visualization (Infovis)enhancement methods for classical displaysspecialized displayswhy you should leverage infovis in your everyday work
2 To outline links between Infovis and Machine Learningwhy do they exist?current solutionsopen research problems
3 To give examples of successful joint researches:Machine learning methods designed for visualizationVisualization of machine learning algorithm results
F. Rossi (INRIA) Infovis & ML 27-28/02/2007 2 / 172
Organization of this lecture
Visualization orientedEach part consists in
an introduction to some visualization techniquesan analysis of their links with machine learning
Five parts:1 Introduction to Infovis2 Scatter plots3 Geometrically-transformed displays4 Iconic and pixel based displays5 Visualization methods designed in the machine learning community
F. Rossi (INRIA) Infovis & ML 27-28/02/2007 3 / 172
Outline of part I
Introduction
1 Information VisualizationDefinitionExamples from “everyday life with KDE”
2 Infovis goals and limitationsWhat is it used for?Limitations of Infovis and VDM
3 Links with machine learningFormal model of InfovisMachine learning
F. Rossi (INRIA) Infovis & ML 27-28/02/2007 4 / 172
Outline of part II
Scatter plots
4 Introduction
5 Feature number reductionPrinciplesNeighborhood structure preservation
6 Overlapping reductionRendering and interactionClustering
F. Rossi (INRIA) Infovis & ML 27-28/02/2007 5 / 172
Outline of part III
Geometrically-transformed displays
7 Introduction
8 Scatter plot matrixInteraction
9 Parallel CoordinatesOverlappingVariable order
F. Rossi (INRIA) Infovis & ML 27-28/02/2007 6 / 172
Outline of part IV
Iconic and pixel based displays
10 Introduction
11 Iconic displaysChernoff’s facesStar glyphGlyph Positioning
12 Pixel based displaysDense pixel displaysDissimilarity matrix
F. Rossi (INRIA) Infovis & ML 27-28/02/2007 7 / 172
Outline of part V
Machine Learning
13 Self Organizing MapPrinciplesVisualization
14 Latent Variable ModelsGeneral principlesGenerative Topographic Mapping
F. Rossi (INRIA) Infovis & ML 27-28/02/2007 8 / 172

Part I
Introduction
F. Rossi (INRIA) Infovis & ML 27-28/02/2007 9 / 172
Outline
1 Information VisualizationDefinitionExamples from “everyday life with KDE”
2 Infovis goals and limitationsWhat is it used for?Limitations of Infovis and VDM
3 Links with machine learningFormal model of InfovisMachine learning
F. Rossi (INRIA) Infovis & ML 27-28/02/2007 10 / 172
Information Visualization
The use of computer-supported interactive, visualrepresentation of abstract data to amplify cognition
Card, Mackinlay & Shneiderman
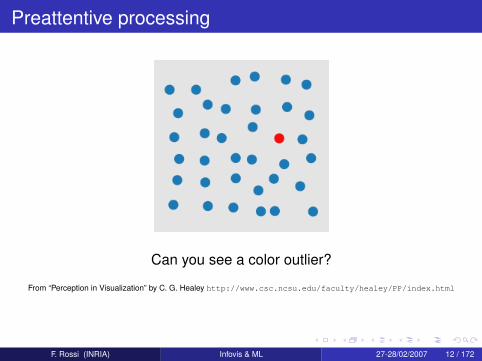
Human preattentive processing capabilities:non conscious processing (no thinking involved)low level visual systemextremely fast: 200 msscalable (no browsing ⇒ sublinear scaling)feature type must match data type (e.g., hue is suitable forcategories, not real value)
F. Rossi (INRIA) Infovis & ML 27-28/02/2007 11 / 172
Information Visualization
The use of computer-supported interactive, visualrepresentation of abstract data to amplify cognition
Card, Mackinlay & Shneiderman
Human preattentive processing capabilities:non conscious processing (no thinking involved)low level visual systemextremely fast: 200 msscalable (no browsing ⇒ sublinear scaling)feature type must match data type (e.g., hue is suitable forcategories, not real value)
F. Rossi (INRIA) Infovis & ML 27-28/02/2007 11 / 172
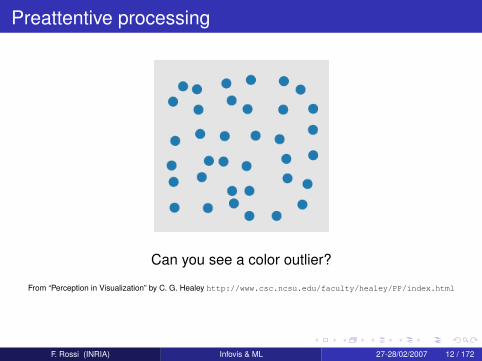
Preattentive processing
Can you see a color outlier?
From “Perception in Visualization” by C. G. Healey http://www.csc.ncsu.edu/faculty/healey/PP/index.html
F. Rossi (INRIA) Infovis & ML 27-28/02/2007 12 / 172
Preattentive processing
Can you see a color outlier?
From “Perception in Visualization” by C. G. Healey http://www.csc.ncsu.edu/faculty/healey/PP/index.html
F. Rossi (INRIA) Infovis & ML 27-28/02/2007 12 / 172
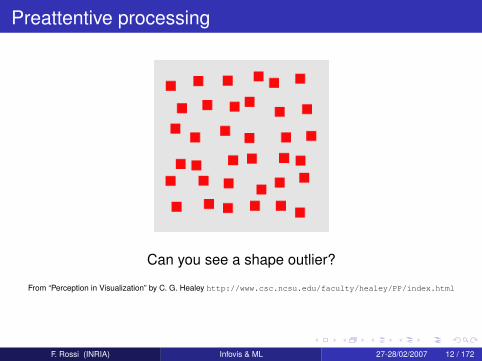
Preattentive processing
Can you see a shape outlier?
From “Perception in Visualization” by C. G. Healey http://www.csc.ncsu.edu/faculty/healey/PP/index.html
F. Rossi (INRIA) Infovis & ML 27-28/02/2007 12 / 172
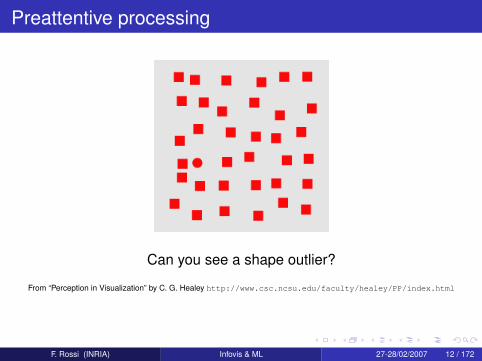
Preattentive processing
Can you see a shape outlier?
From “Perception in Visualization” by C. G. Healey http://www.csc.ncsu.edu/faculty/healey/PP/index.html
F. Rossi (INRIA) Infovis & ML 27-28/02/2007 12 / 172

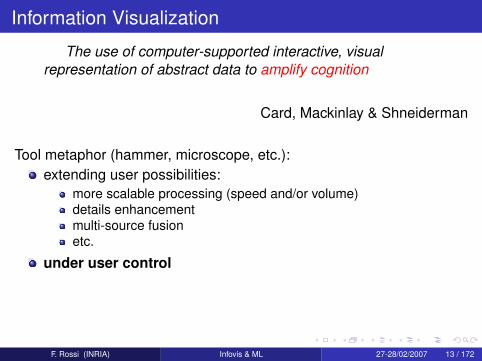
Information Visualization
The use of computer-supported interactive, visualrepresentation of abstract data to amplify cognition
Card, Mackinlay & Shneiderman
Tool metaphor (hammer, microscope, etc.):extending user possibilities:
more scalable processing (speed and/or volume)details enhancementmulti-source fusionetc.
under user control
F. Rossi (INRIA) Infovis & ML 27-28/02/2007 13 / 172
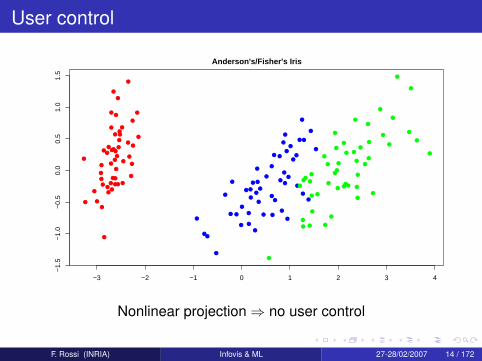
User control
●
●●
●
●
●
●
●
●
●
●
●
●
●
●
●
●
●
●
●
●
●
●
●
●
●
●
●●
●●
●
●
●
●
●
●
●
●
●●
●
●
●
●
●
●
●
●
●
●
●
●
●
●
●
●
●
●
●
●
●
●
●●
●
●
●
●
●
●
●
●
●
●
●●
●
●
●
●●
●
●
●
●
●
●
●
● ●
●
●
●
●
●
●
●
●
● ●
●
●
●
●
●
●
●
●
●
●
●
●
● ●
●
●
●
●
●
●
●
●
●
●
●
●●
●
●
●
●
●
●
●
●
●
●
●
●
●
●
●
●
●
●
●
●
●
−3 −2 −1 0 1 2 3 4
−1.
5−
1.0
−0.
50.
00.
51.
01.
5Anderson's/Fisher's Iris
Nonlinear projection ⇒ no user control
F. Rossi (INRIA) Infovis & ML 27-28/02/2007 14 / 172
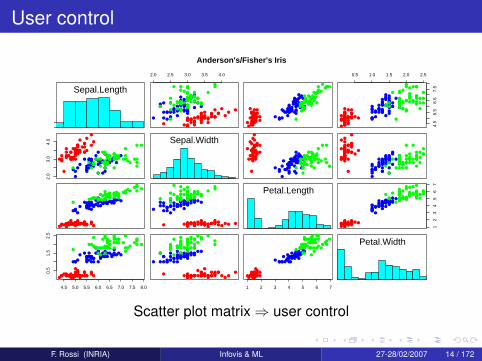
User control
Sepal.Length
2.0 2.5 3.0 3.5 4.0
●●
●●
●
●
●
●
●
●
●
●●
●
● ●
●
●
●
●
●
●
●
●
●● ●
●●
●●
●●
●
● ●
●
●
●
● ●
● ●
● ●
●
●
●
●
●
●
●
●
●
●
●
●
●
●
●●
●● ●
●
●
●●
●
●
●●
●●
●●
● ●
●
●●●
●●
●
●
●
●
●● ●
●
●
●
● ●●
●
●
●
●
●
●
●●
●
●
●
●
●
●●
●
● ●
●●
●●
●
●
●
●
●
●
●
● ●
●
●●
●
●●●
●
●●
●
●●●
●
● ●●
●●
●
●
●●
● ●
●
●
●
●
●
●
●
●●
●
● ●
●
●
●
●
●
●
●
●
●●●
●●
●●
●●
●
●●
●
●
●
●●
●●
● ●
●
●
●
●
●
●
●
●
●
●
●
●
●
●
●●
●● ●
●
●
●●
●
●
●●
●●
●●
● ●
●
●●●
●●
●
●
●
●
●● ●
●
●
●
●●●
●
●
●
●
●
●
●●
●
●
●
●
●
● ●
●
●●
● ●
● ●
●
●
●
●
●
●
●
●●
●
●●
●
●●●
●
●●
●
●●
●
●
●●●
●●
●
●
0.5 1.0 1.5 2.0 2.5
4.5
5.5
6.5
7.5
●●●●
●
●
●
●
●
●
●
●●
●
● ●
●
●
●
●
●
●
●
●
●● ●●●
●●
●●
●
●●
●
●
●
● ●
●●
●●
●
●
●
●
●
●
●
●
●
●
●
●
●
●
●●
●● ●
●
●
●●
●
●
●●
●●
●●● ●
●
●●●
●●
●
●
●
●
●●●
●
●
●
●● ●
●
●
●
●
●
●
●●
●
●
●
●
●
●●
●
● ●
●●
● ●
●
●
●
●
●
●
●
●●
●
●●
●
●●●
●
●●
●
●●
●
●
● ●●
●●
●
●
2.0
3.0
4.0
●
●
●●
●
●
● ●
●
●
●
●
●●
●
●
●
●
●●
●
●●
●●
●
●●●
●●
●
●●
●●
●●
●
●●
●
●
●
●
●
●
●
●
●●●
●
●
●●
●
●
●
●
●
●
●
●●
●●
●
●
●
●
●
●
●●
●
●
●●
●
●●
● ●
●
●
●
●
●
●●
●
●
●
●
●● ●
●
●
●
●
●●
● ●
●
●
●
●
●
●
●
●
●
●
●
●
●
●
●
● ●●
●●
●
●
●
●
●
●
●●
●
●
●
●●
●● ●
●
●●
●
●
●
●
●
Sepal.Width●
●
●●
●
●
●●
●
●
●
●
●●
●
●
●
●
●●
●
●●
●●
●
●●
●
●●
●
●●
●●
●●
●
●●
●
●
●
●
●
●
●
●
●●●
●
●
●●
●
●
●
●
●
●
●
●●
●●
●
●
●
●
●
●
●●●
●
●●
●
●●
● ●
●
●
●
●
●
●●
●
●
●
●
●●●
●
●
●
●
●●
● ●
●
●
●
●
●
●
●
●
●
●
●
●
●
●
●
● ●●
●●
●
●
●
●
●
●
●●
●
●
●
●●
● ●●
●
●●
●
●
●
●
●
●
●
●●
●
●
●●
●
●
●
●
●●
●
●
●
●
●●
●
●●
●●
●
●●●
●●
●
●●
●●
●●
●
●●
●
●
●
●
●
●
●
●
●● ●
●
●
●●
●
●
●
●
●
●
●
●●
●●
●
●
●
●
●
●
●●
●
●
●●
●
●●
● ●
●
●
●
●
●
●●
●
●
●
●
●●●
●
●
●
●
●●
●●
●
●
●
●
●
●
●
●
●
●
●
●
●
●
●
●●●
●●
●
●
●
●
●
●
●●
●
●
●
●●
● ●●
●
●●
●
●
●
●
●
●●●● ●
●● ●● ● ●●
●● ●
●●●
●●
●●
●
●●
●● ●●●● ●● ●●
● ●●●●
●●●●
●
●●
● ●●
●●
●
●
●●●
●
●
●●
●●
●
●
●●●
●
●
●
●
●●
● ●●
●
●
●●●
●
●
● ●●
●●●
●●
●
●
●●● ●
●
●
●
●
●●
●
●
●
●
●●
●●
●
●●●
●
●●
●
●
●
●
●
●●
●●
●●
●●
●
●
●
●
●●
●
●●
●●
●●
●●
●●
●
●● ●● ●
●●●● ● ●●
●● ●
●●●
●●
●●
●
●●
● ● ●●●● ● ● ●●● ● ●●
●●● ●●
●
●●
● ●●
●●
●
●
●●●
●
●
●●
●●
●
●
●●●
●
●
●
●
●●
● ●●
●
●
●●●
●
●
● ●●
●●●
●●
●
●
● ●●●
●
●
●
●
●●
●
●
●
●
●●
●●
●
● ●●
●
●●
●
●
●
●
●
●●
● ●
●●
●●
●
●
●
●
●●
●
●●
●●
●●
●●
●●
●
Petal.Length
12
34
56
7
●●●●●
●●●●● ●●●
● ●●●●
●●
●●
●
●●● ●●●●● ●● ●●●●
● ●●
●●●●
●
●●●●●
●●●
●
●●●
●
●
●●
●●
●
●
● ●●
●
●
●
●
●●
● ●●
●
●
●●●
●
●
● ●●
●●●
●●
●
●
●● ●●
●
●
●
●
●●
●
●
●
●
●●
●●
●
● ●●
●
●●
●
●
●
●
●
●●
●●
●●
●●
●
●
●
●
●●
●
●●
●●
●●
●●
●●
●
4.5 5.0 5.5 6.0 6.5 7.0 7.5 8.0
0.5
1.5
2.5
●●●● ●
●●
●●●
●●●●
●
●●● ●●
●
●
●
●
● ●
●
●●●●
●
●●●● ●
●● ●
●●●
●
●●
●● ●●
●● ●
●
●
●
●
●
●●
●
●
●
●●
●●
●
●
●
●
●
●
●●
● ●
●
●
●●●
●
●●
●●
●●●●
●
●
●
●●● ●
●
●
●
●
●
●
●●
●●●
●
●●
●●
●●
●
●●
●
●
● ●
●
●
●●●
●
●
●●
●
●●
●●
●●
●
●●
●
●
●
●
●●
●
●
●● ●● ●
●●●●
●●●
●●●
●●● ●●
●
●
●
●
●●
●
●●●●
●
●●● ● ●
●● ●
●●●
●
●●
●● ●●
●●●
●
●
●
●
●
●●
●
●
●
●●
●●
●
●
●
●
●
●
●●
●●
●
●
●●●
●
●●
●●
● ●●●
●
●
●
●●
●●
●
●
●
●
●
●
●●
●●●
●
●●
●●
●●
●
●●
●
●
●●
●
●
●● ●
●
●
●●
●
●●
●●
●●
●
●●
●
●
●
●
●●
●
●
1 2 3 4 5 6 7
●●● ●●
●●●●●●●
●●●
●●● ●●
●
●
●
●
●●
●
●● ●●
●
●●●●●●
● ●●●●
●
●●
●●●●
●● ●
●
●
●
●
●
●●
●
●
●
●●
●●
●
●
●
●
●
●
●●● ●
●
●
●●
●
●
●●●
●
●●●●
●
●
●
●●●●
●
●
●
●
●
●
●●
●●●
●
●●
●●
●●
●
●●
●
●
● ●
●
●
●●●
●
●
●●
●
●●
●●
●●
●
●●
●
●
●
●
●●
●
●
Petal.Width
Anderson's/Fisher's Iris
Scatter plot matrix ⇒ user control
F. Rossi (INRIA) Infovis & ML 27-28/02/2007 14 / 172

Information Visualization
The use of computer-supported interactive, visualrepresentation of abstract data to amplify cognition
Card, Mackinlay & Shneiderman
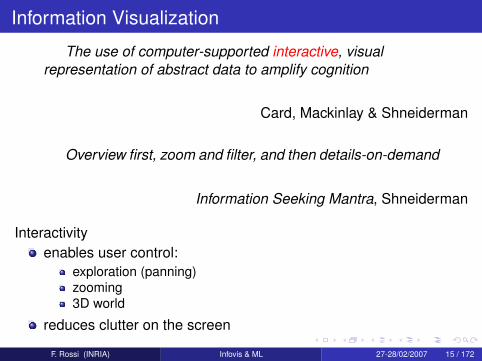
Overview first, zoom and filter, and then details-on-demand
Information Seeking Mantra, Shneiderman
Interactivityenables user control:
exploration (panning)zooming3D world
reduces clutter on the screen
F. Rossi (INRIA) Infovis & ML 27-28/02/2007 15 / 172
Information Visualization
The use of computer-supported interactive, visualrepresentation of abstract data to amplify cognition
Card, Mackinlay & Shneiderman
Overview first, zoom and filter, and then details-on-demand
Information Seeking Mantra, Shneiderman
Interactivityenables user control:
exploration (panning)zooming3D world
reduces clutter on the screen
F. Rossi (INRIA) Infovis & ML 27-28/02/2007 15 / 172
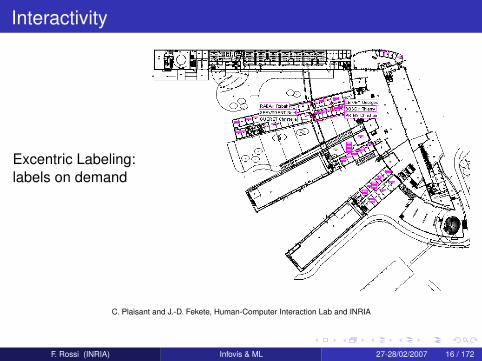
Interactivity
Excentric Labeling:labels on demand
C. Plaisant and J.-D. Fekete, Human-Computer Interaction Lab and INRIA
F. Rossi (INRIA) Infovis & ML 27-28/02/2007 16 / 172

Information Visualization
The use of computer-supported interactive, visualrepresentation of abstract data to amplify cognition
Card, Mackinlay & Shneiderman
Abstract data:digital data with no real world “visual” counterpart, e.g.:
soundhigh dimensional vectors
no “natural” visual representation of the data, e.g.:requests received by a web serverfile systemssource code
Infovis 6= scientific visualization (Scivis)
F. Rossi (INRIA) Infovis & ML 27-28/02/2007 17 / 172
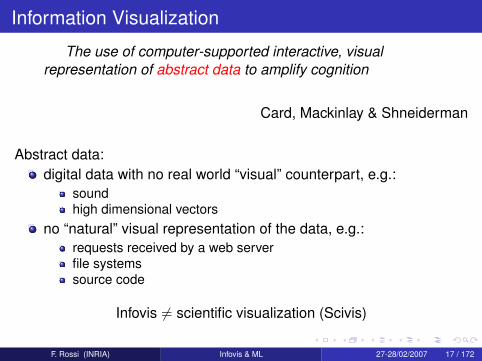
Scientific data
Yearly ArcticTemperatureAnomaly, 2002
NASA/Goddard Space Flight Center Scientific Visualization Studio
F. Rossi (INRIA) Infovis & ML 27-28/02/2007 18 / 172
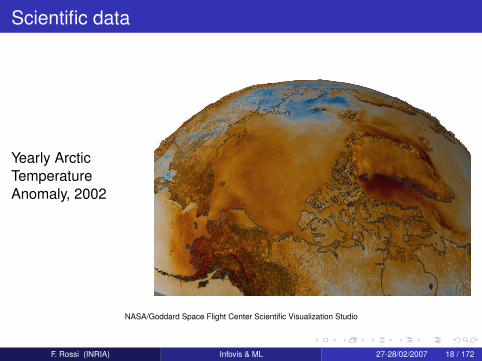
Scientific data
Growth of a brain tumorEPIDAURE team, Inria
F. Rossi (INRIA) Infovis & ML 27-28/02/2007 18 / 172
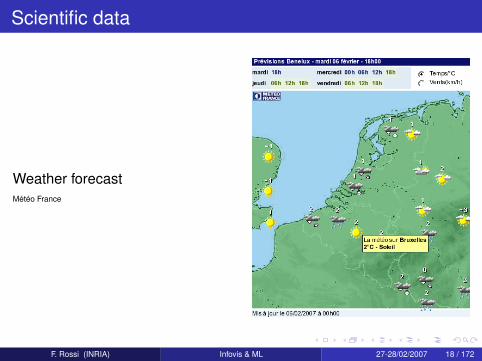
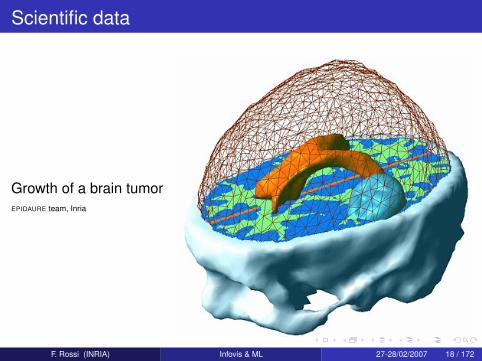
Scientific data
Weather forecastMétéo France
F. Rossi (INRIA) Infovis & ML 27-28/02/2007 18 / 172
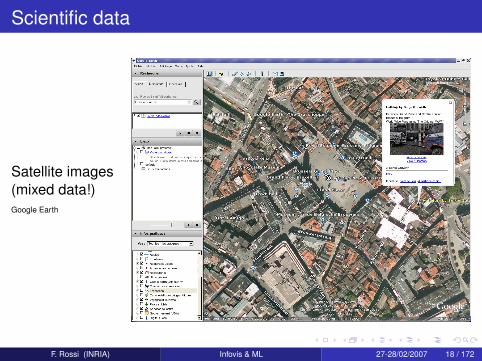
Scientific data
Satellite images(mixed data!)Google Earth
F. Rossi (INRIA) Infovis & ML 27-28/02/2007 18 / 172
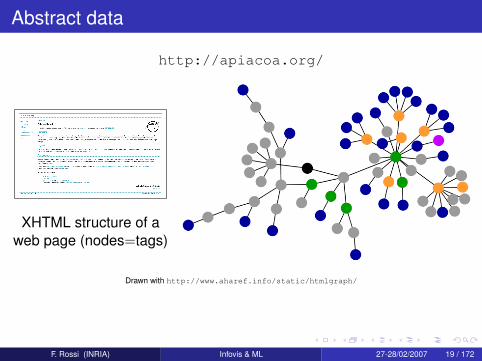
Abstract data
http://apiacoa.org/
XHTML structure of aweb page (nodes=tags)
Drawn with http://www.aharef.info/static/htmlgraph/
F. Rossi (INRIA) Infovis & ML 27-28/02/2007 19 / 172
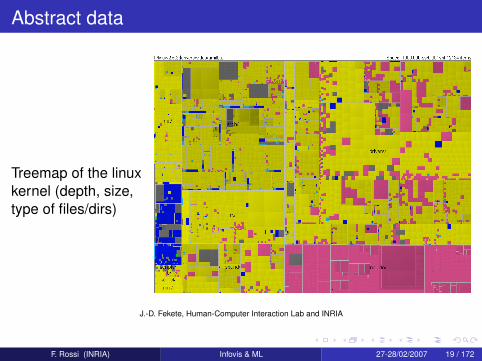
Abstract data
Treemap of the linuxkernel (depth, size,type of files/dirs)
J.-D. Fekete, Human-Computer Interaction Lab and INRIA
F. Rossi (INRIA) Infovis & ML 27-28/02/2007 19 / 172
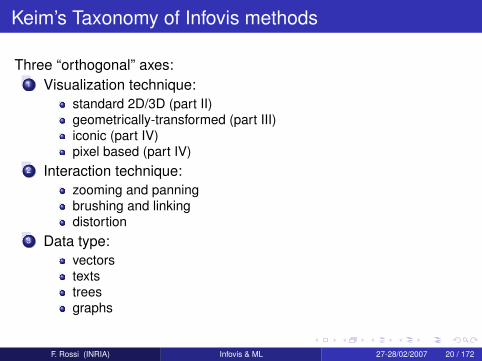
Keim’s Taxonomy of Infovis methods
Three “orthogonal” axes:1 Visualization technique:
standard 2D/3D (part II)geometrically-transformed (part III)iconic (part IV)pixel based (part IV)
2 Interaction technique:zooming and panningbrushing and linkingdistortion
3 Data type:vectorstextstreesgraphs
F. Rossi (INRIA) Infovis & ML 27-28/02/2007 20 / 172
Some examples from everyday life
Desktop programs are infovis tools for some abstract data:emails“text” filesfilesystemsimagesmusicthe webIDEetc.
F. Rossi (INRIA) Infovis & ML 27-28/02/2007 21 / 172
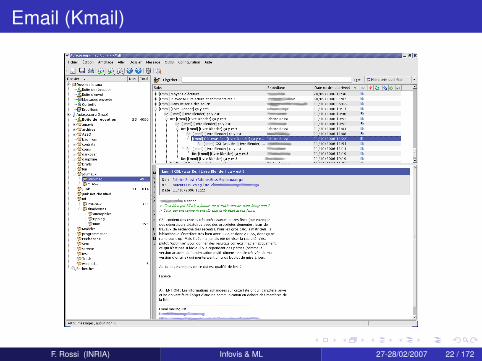
Email (Kmail)
F. Rossi (INRIA) Infovis & ML 27-28/02/2007 22 / 172
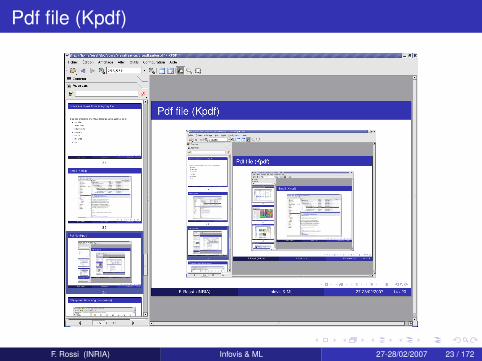
Pdf file (Kpdf)
F. Rossi (INRIA) Infovis & ML 27-28/02/2007 23 / 172
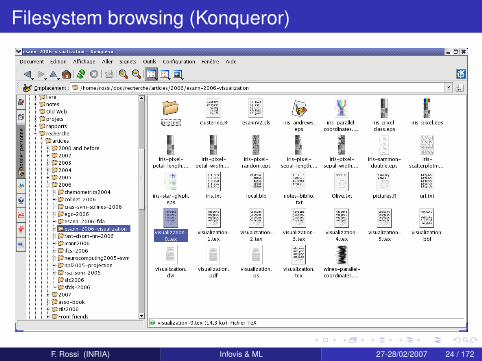
Filesystem browsing (Konqueror)
F. Rossi (INRIA) Infovis & ML 27-28/02/2007 24 / 172
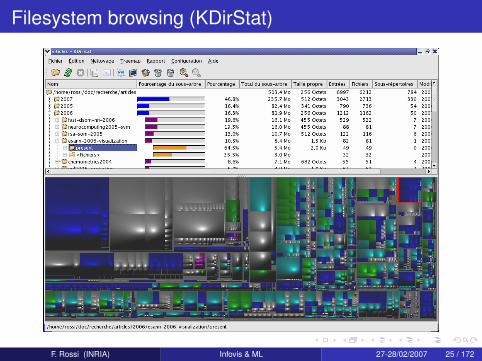
Filesystem browsing (KDirStat)
F. Rossi (INRIA) Infovis & ML 27-28/02/2007 25 / 172
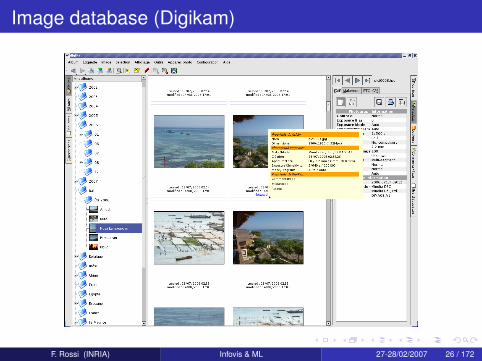
Image database (Digikam)
F. Rossi (INRIA) Infovis & ML 27-28/02/2007 26 / 172
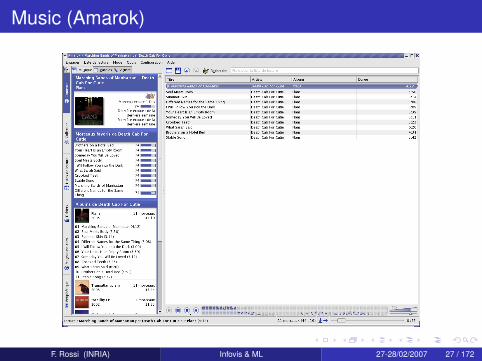
Music (Amarok)
F. Rossi (INRIA) Infovis & ML 27-28/02/2007 27 / 172
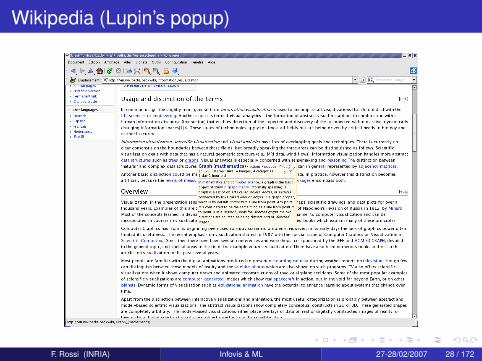
Wikipedia (Lupin’s popup)
F. Rossi (INRIA) Infovis & ML 27-28/02/2007 28 / 172
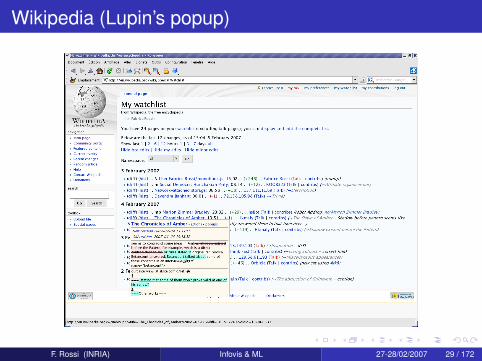
Wikipedia (Lupin’s popup)
F. Rossi (INRIA) Infovis & ML 27-28/02/2007 29 / 172
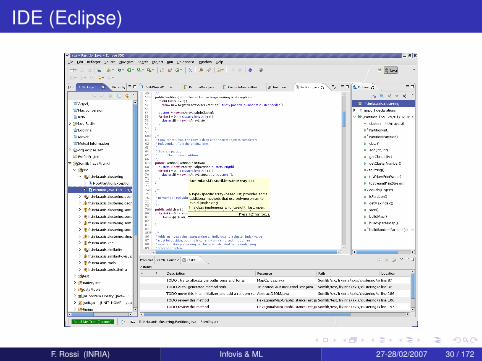
IDE (Eclipse)
F. Rossi (INRIA) Infovis & ML 27-28/02/2007 30 / 172
Outline
1 Information VisualizationDefinitionExamples from “everyday life with KDE”
2 Infovis goals and limitationsWhat is it used for?Limitations of Infovis and VDM
3 Links with machine learningFormal model of InfovisMachine learning
F. Rossi (INRIA) Infovis & ML 27-28/02/2007 31 / 172
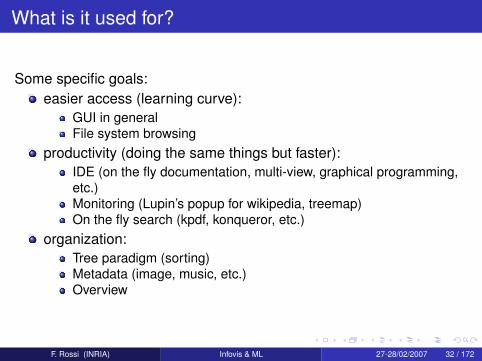
What is it used for?
Some specific goals:easier access (learning curve):
GUI in generalFile system browsing
productivity (doing the same things but faster):IDE (on the fly documentation, multi-view, graphical programming,etc.)Monitoring (Lupin’s popup for wikipedia, treemap)On the fly search (kpdf, konqueror, etc.)
organization:Tree paradigm (sorting)Metadata (image, music, etc.)Overview
F. Rossi (INRIA) Infovis & ML 27-28/02/2007 32 / 172
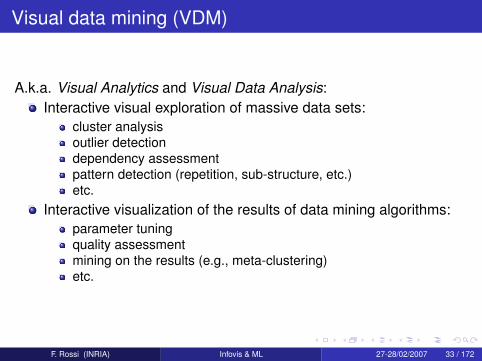
Visual data mining (VDM)
A.k.a. Visual Analytics and Visual Data Analysis:Interactive visual exploration of massive data sets:
cluster analysisoutlier detectiondependency assessmentpattern detection (repetition, sub-structure, etc.)etc.
Interactive visualization of the results of data mining algorithms:parameter tuningquality assessmentmining on the results (e.g., meta-clustering)etc.
F. Rossi (INRIA) Infovis & ML 27-28/02/2007 33 / 172
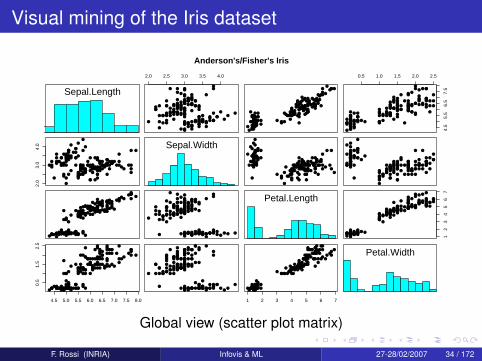
Visual mining of the Iris dataset
Sepal.Length
2.0 2.5 3.0 3.5 4.0
●●
●●
●
●
●
●
●
●
●
●●
●
● ●
●
●
●
●
●
●
●
●
●● ●
●●
●●
●●
●
● ●
●
●
●
● ●
● ●
● ●
●
●
●
●
●
●
●
●
●
●
●
●
●
●
●●
●● ●
●
●
●●
●
●
●●
●●
●●
● ●
●
●●●
●●
●
●
●
●
●● ●
●
●
●
● ●●
●
●
●
●
●
●
●●
●
●
●
●
●
●●
●
● ●
●●
●●
●
●
●
●
●
●
●
● ●
●
●●
●
●●●
●
●●
●
●●●
●
● ●●
●●
●
●
●●
● ●
●
●
●
●
●
●
●
●●
●
● ●
●
●
●
●
●
●
●
●
●●●
●●
●●
●●
●
●●
●
●
●
●●
●●
● ●
●
●
●
●
●
●
●
●
●
●
●
●
●
●
●●
●● ●
●
●
●●
●
●
●●
●●
●●
● ●
●
●●●
●●
●
●
●
●
●● ●
●
●
●
●●●
●
●
●
●
●
●
●●
●
●
●
●
●
● ●
●
●●
● ●
● ●
●
●
●
●
●
●
●
●●
●
●●
●
●●●
●
●●
●
●●
●
●
●●●
●●
●
●
0.5 1.0 1.5 2.0 2.5
4.5
5.5
6.5
7.5
●●●●
●
●
●
●
●
●
●
●●
●
● ●
●
●
●
●
●
●
●
●
●● ●●●
●●
●●
●
●●
●
●
●
● ●
●●
●●
●
●
●
●
●
●
●
●
●
●
●
●
●
●
●●
●● ●
●
●
●●
●
●
●●
●●
●●● ●
●
●●●
●●
●
●
●
●
●●●
●
●
●
●● ●
●
●
●
●
●
●
●●
●
●
●
●
●
●●
●
● ●
●●
● ●
●
●
●
●
●
●
●
●●
●
●●
●
●●●
●
●●
●
●●
●
●
● ●●
●●
●
●
2.0
3.0
4.0
●
●
●●
●
●
● ●
●
●
●
●
●●
●
●
●
●
●●
●
●●
●●
●
●●●
●●
●
●●
●●
●●
●
●●
●
●
●
●
●
●
●
●
●●●
●
●
●●
●
●
●
●
●
●
●
●●
●●
●
●
●
●
●
●
●●
●
●
●●
●
●●
● ●
●
●
●
●
●
●●
●
●
●
●
●● ●
●
●
●
●
●●
● ●
●
●
●
●
●
●
●
●
●
●
●
●
●
●
●
● ●●
●●
●
●
●
●
●
●
●●
●
●
●
●●
●● ●
●
●●
●
●
●
●
●
Sepal.Width●
●
●●
●
●
●●
●
●
●
●
●●
●
●
●
●
●●
●
●●
●●
●
●●
●
●●
●
●●
●●
●●
●
●●
●
●
●
●
●
●
●
●
●●●
●
●
●●
●
●
●
●
●
●
●
●●
●●
●
●
●
●
●
●
●●●
●
●●
●
●●
● ●
●
●
●
●
●
●●
●
●
●
●
●●●
●
●
●
●
●●
● ●
●
●
●
●
●
●
●
●
●
●
●
●
●
●
●
● ●●
●●
●
●
●
●
●
●
●●
●
●
●
●●
● ●●
●
●●
●
●
●
●
●
●
●
●●
●
●
●●
●
●
●
●
●●
●
●
●
●
●●
●
●●
●●
●
●●●
●●
●
●●
●●
●●
●
●●
●
●
●
●
●
●
●
●
●● ●
●
●
●●
●
●
●
●
●
●
●
●●
●●
●
●
●
●
●
●
●●
●
●
●●
●
●●
● ●
●
●
●
●
●
●●
●
●
●
●
●●●
●
●
●
●
●●
●●
●
●
●
●
●
●
●
●
●
●
●
●
●
●
●
●●●
●●
●
●
●
●
●
●
●●
●
●
●
●●
● ●●
●
●●
●
●
●
●
●
●●●● ●
●● ●● ● ●●
●● ●
●●●
●●
●●
●
●●
●● ●●●● ●● ●●
● ●●●●
●●●●
●
●●
● ●●
●●
●
●
●●●
●
●
●●
●●
●
●
●●●
●
●
●
●
●●
● ●●
●
●
●●●
●
●
● ●●
●●●
●●
●
●
●●● ●
●
●
●
●
●●
●
●
●
●
●●
●●
●
●●●
●
●●
●
●
●
●
●
●●
●●
●●
●●
●
●
●
●
●●
●
●●
●●
●●
●●
●●
●
●● ●● ●
●●●● ● ●●
●● ●
●●●
●●
●●
●
●●
● ● ●●●● ● ● ●●● ● ●●
●●● ●●
●
●●
● ●●
●●
●
●
●●●
●
●
●●
●●
●
●
●●●
●
●
●
●
●●
● ●●
●
●
●●●
●
●
● ●●
●●●
●●
●
●
● ●●●
●
●
●
●
●●
●
●
●
●
●●
●●
●
● ●●
●
●●
●
●
●
●
●
●●
● ●
●●
●●
●
●
●
●
●●
●
●●
●●
●●
●●
●●
●
Petal.Length
12
34
56
7
●●●●●
●●●●● ●●●
● ●●●●
●●
●●
●
●●● ●●●●● ●● ●●●●
● ●●
●●●●
●
●●●●●
●●●
●
●●●
●
●
●●
●●
●
●
● ●●
●
●
●
●
●●
● ●●
●
●
●●●
●
●
● ●●
●●●
●●
●
●
●● ●●
●
●
●
●
●●
●
●
●
●
●●
●●
●
● ●●
●
●●
●
●
●
●
●
●●
●●
●●
●●
●
●
●
●
●●
●
●●
●●
●●
●●
●●
●
4.5 5.0 5.5 6.0 6.5 7.0 7.5 8.0
0.5
1.5
2.5
●●●● ●
●●
●●●
●●●●
●
●●● ●●
●
●
●
●
● ●
●
●●●●
●
●●●● ●
●● ●
●●●
●
●●
●● ●●
●● ●
●
●
●
●
●
●●
●
●
●
●●
●●
●
●
●
●
●
●
●●
● ●
●
●
●●●
●
●●
●●
●●●●
●
●
●
●●● ●
●
●
●
●
●
●
●●
●●●
●
●●
●●
●●
●
●●
●
●
● ●
●
●
●●●
●
●
●●
●
●●
●●
●●
●
●●
●
●
●
●
●●
●
●
●● ●● ●
●●●●
●●●
●●●
●●● ●●
●
●
●
●
●●
●
●●●●
●
●●● ● ●
●● ●
●●●
●
●●
●● ●●
●●●
●
●
●
●
●
●●
●
●
●
●●
●●
●
●
●
●
●
●
●●
●●
●
●
●●●
●
●●
●●
● ●●●
●
●
●
●●
●●
●
●
●
●
●
●
●●
●●●
●
●●
●●
●●
●
●●
●
●
●●
●
●
●● ●
●
●
●●
●
●●
●●
●●
●
●●
●
●
●
●
●●
●
●
1 2 3 4 5 6 7
●●● ●●
●●●●●●●
●●●
●●● ●●
●
●
●
●
●●
●
●● ●●
●
●●●●●●
● ●●●●
●
●●
●●●●
●● ●
●
●
●
●
●
●●
●
●
●
●●
●●
●
●
●
●
●
●
●●● ●
●
●
●●
●
●
●●●
●
●●●●
●
●
●
●●●●
●
●
●
●
●
●
●●
●●●
●
●●
●●
●●
●
●●
●
●
● ●
●
●
●●●
●
●
●●
●
●●
●●
●●
●
●●
●
●
●
●
●●
●
●
Petal.Width
Anderson's/Fisher's Iris
Global view (scatter plot matrix)
F. Rossi (INRIA) Infovis & ML 27-28/02/2007 34 / 172
Visual mining of the Iris dataset
Sepal.Length
2.0 2.5 3.0 3.5 4.0
●●
●●
●
●
●
●
●
●
●
●●
●
● ●
●
●
●
●
●
●
●
●
●● ●
●●
●●
●●
●
● ●
●
●
●
● ●
● ●
● ●
●
●
●
●
●
●
●
●
●
●
●
●
●
●
●●
●● ●
●
●
●●
●
●
●●
●●
●●
● ●
●
●●●
●●
●
●
●
●
●● ●
●
●
●
● ●●
●
●
●
●
●
●
●●
●
●
●
●
●
●●
●
● ●
●●
●●
●
●
●
●
●
●
●
● ●
●
●●
●
●●●
●
●●
●
●●●
●
● ●●
●●
●
●
●●
● ●
●
●
●
●
●
●
●
●●
●
● ●
●
●
●
●
●
●
●
●
●●●
●●
●●
●●
●
●●
●
●
●
●●
●●
● ●
●
●
●
●
●
●
●
●
●
●
●
●
●
●
●●
●● ●
●
●
●●
●
●
●●
●●
●●
● ●
●
●●●
●●
●
●
●
●
●● ●
●
●
●
●●●
●
●
●
●
●
●
●●
●
●
●
●
●
● ●
●
●●
● ●
● ●
●
●
●
●
●
●
●
●●
●
●●
●
●●●
●
●●
●
●●
●
●
●●●
●●
●
●
0.5 1.0 1.5 2.0 2.5
4.5
5.5
6.5
7.5
●●●●
●
●
●
●
●
●
●
●●
●
● ●
●
●
●
●
●
●
●
●
●● ●●●
●●
●●
●
●●
●
●
●
● ●
●●
●●
●
●
●
●
●
●
●
●
●
●
●
●
●
●
●●
●● ●
●
●
●●
●
●
●●
●●
●●● ●
●
●●●
●●
●
●
●
●
●●●
●
●
●
●● ●
●
●
●
●
●
●
●●
●
●
●
●
●
●●
●
● ●
●●
● ●
●
●
●
●
●
●
●
●●
●
●●
●
●●●
●
●●
●
●●
●
●
● ●●
●●
●
●
2.0
3.0
4.0
●
●
●●
●
●
● ●
●
●
●
●
●●
●
●
●
●
●●
●
●●
●●
●
●●●
●●
●
●●
●●
●●
●
●●
●
●
●
●
●
●
●
●
●●●
●
●
●●
●
●
●
●
●
●
●
●●
●●
●
●
●
●
●
●
●●
●
●
●●
●
●●
● ●
●
●
●
●
●
●●
●
●
●
●
●● ●
●
●
●
●
●●
● ●
●
●
●
●
●
●
●
●
●
●
●
●
●
●
●
● ●●
●●
●
●
●
●
●
●
●●
●
●
●
●●
●● ●
●
●●
●
●
●
●
●
Sepal.Width●
●
●●
●
●
●●
●
●
●
●
●●
●
●
●
●
●●
●
●●
●●
●
●●
●
●●
●
●●
●●
●●
●
●●
●
●
●
●
●
●
●
●
●●●
●
●
●●
●
●
●
●
●
●
●
●●
●●
●
●
●
●
●
●
●●●
●
●●
●
●●
● ●
●
●
●
●
●
●●
●
●
●
●
●●●
●
●
●
●
●●
● ●
●
●
●
●
●
●
●
●
●
●
●
●
●
●
●
● ●●
●●
●
●
●
●
●
●
●●
●
●
●
●●
● ●●
●
●●
●
●
●
●
●
●
●
●●
●
●
●●
●
●
●
●
●●
●
●
●
●
●●
●
●●
●●
●
●●●
●●
●
●●
●●
●●
●
●●
●
●
●
●
●
●
●
●
●● ●
●
●
●●
●
●
●
●
●
●
●
●●
●●
●
●
●
●
●
●
●●
●
●
●●
●
●●
● ●
●
●
●
●
●
●●
●
●
●
●
●●●
●
●
●
●
●●
●●
●
●
●
●
●
●
●
●
●
●
●
●
●
●
●
●●●
●●
●
●
●
●
●
●
●●
●
●
●
●●
● ●●
●
●●
●
●
●
●
●
●●●● ●
●● ●● ● ●●
●● ●
●●●
●●
●●
●
●●
●● ●●●● ●● ●●
● ●●●●
●●●●
●
●●
● ●●
●●
●
●
●●●
●
●
●●
●●
●
●
●●●
●
●
●
●
●●
● ●●
●
●
●●●
●
●
● ●●
●●●
●●
●
●
●●● ●
●
●
●
●
●●
●
●
●
●
●●
●●
●
●●●
●
●●
●
●
●
●
●
●●
●●
●●
●●
●
●
●
●
●●
●
●●
●●
●●
●●
●●
●
●● ●● ●
●●●● ● ●●
●● ●
●●●
●●
●●
●
●●
● ● ●●●● ● ● ●●● ● ●●
●●● ●●
●
●●
● ●●
●●
●
●
●●●
●
●
●●
●●
●
●
●●●
●
●
●
●
●●
● ●●
●
●
●●●
●
●
● ●●
●●●
●●
●
●
● ●●●
●
●
●
●
●●
●
●
●
●
●●
●●
●
● ●●
●
●●
●
●
●
●
●
●●
● ●
●●
●●
●
●
●
●
●●
●
●●
●●
●●
●●
●●
●
Petal.Length
12
34
56
7
●●●●●
●●●●● ●●●
● ●●●●
●●
●●
●
●●● ●●●●● ●● ●●●●
● ●●
●●●●
●
●●●●●
●●●
●
●●●
●
●
●●
●●
●
●
● ●●
●
●
●
●
●●
● ●●
●
●
●●●
●
●
● ●●
●●●
●●
●
●
●● ●●
●
●
●
●
●●
●
●
●
●
●●
●●
●
● ●●
●
●●
●
●
●
●
●
●●
●●
●●
●●
●
●
●
●
●●
●
●●
●●
●●
●●
●●
●
4.5 5.0 5.5 6.0 6.5 7.0 7.5 8.0
0.5
1.5
2.5
●●●● ●
●●
●●●
●●●●
●
●●● ●●
●
●
●
●
● ●
●
●●●●
●
●●●● ●
●● ●
●●●
●
●●
●● ●●
●● ●
●
●
●
●
●
●●
●
●
●
●●
●●
●
●
●
●
●
●
●●
● ●
●
●
●●●
●
●●
●●
●●●●
●
●
●
●●● ●
●
●
●
●
●
●
●●
●●●
●
●●
●●
●●
●
●●
●
●
● ●
●
●
●●●
●
●
●●
●
●●
●●
●●
●
●●
●
●
●
●
●●
●
●
●● ●● ●
●●●●
●●●
●●●
●●● ●●
●
●
●
●
●●
●
●●●●
●
●●● ● ●
●● ●
●●●
●
●●
●● ●●
●●●
●
●
●
●
●
●●
●
●
●
●●
●●
●
●
●
●
●
●
●●
●●
●
●
●●●
●
●●
●●
● ●●●
●
●
●
●●
●●
●
●
●
●
●
●
●●
●●●
●
●●
●●
●●
●
●●
●
●
●●
●
●
●● ●
●
●
●●
●
●●
●●
●●
●
●●
●
●
●
●
●●
●
●
1 2 3 4 5 6 7
●●● ●●
●●●●●●●
●●●
●●● ●●
●
●
●
●
●●
●
●● ●●
●
●●●●●●
● ●●●●
●
●●
●●●●
●● ●
●
●
●
●
●
●●
●
●
●
●●
●●
●
●
●
●
●
●
●●● ●
●
●
●●
●
●
●●●
●
●●●●
●
●
●
●●●●
●
●
●
●
●
●
●●
●●●
●
●●
●●
●●
●
●●
●
●
● ●
●
●
●●●
●
●
●●
●
●●
●●
●●
●
●●
●
●
●
●
●●
●
●
Petal.Width
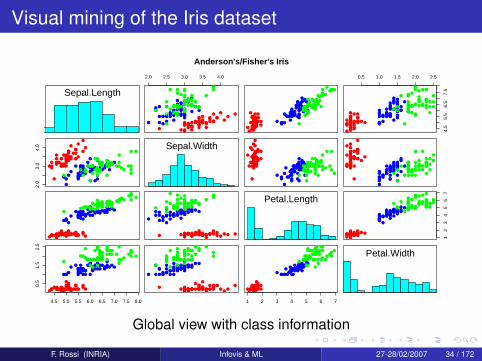
Anderson's/Fisher's Iris
Global view with class information
F. Rossi (INRIA) Infovis & ML 27-28/02/2007 34 / 172
Visual mining of the Iris dataset
●● ●● ●
●
●
●●
●
●●
●●
●
●●
● ●●
●
●
●
●
●●
●
●●●●
●
●
●● ● ●
●
● ●
●●
●
●
●
●
●● ●●
●
●●
●
●
●
●
●
●
●
●
●
●
●
●
●
●
●
●
●
●
●
●
●
●
●●
●
●
●
●
●
●
●
●
●
●
● ●●
●
●
●
●
●
●
●●
●
●
●
●
●
●
●
●
●
●●
●
●
●
●
●
●
●
●
●
●
●
●
●●
●
●
●● ●
●
●
●
●
●
●
●
●
●
●●
●
●
●
●
●
●
●
●
●
●
●
2.0 2.5 3.0 3.5 4.0
0.5
1.0
1.5
2.0
2.5
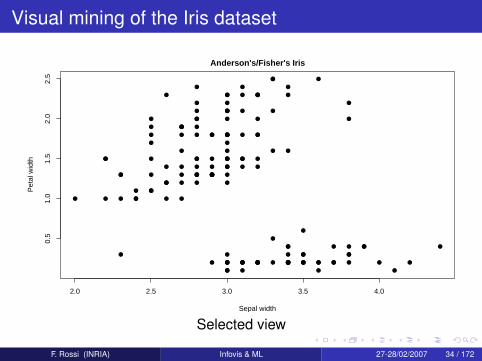
Anderson's/Fisher's Iris
Sepal width
Pet
al w
idth
Selected view
F. Rossi (INRIA) Infovis & ML 27-28/02/2007 34 / 172
Visual mining of the Iris dataset
●● ●● ●
●
●
●●
●
●●
●●
●
●●
● ●●
●
●
●
●
●●
●
●●●●
●
●
●● ● ●
●
● ●
●●
●
●
●
●
●● ●●
●
●●
●
●
●
●
●
●
●
●
●
●
●
●
●
●
●
●
●
●
●
●
●
●
●●
●
●
●
●
●
●
●
●
●
●
● ●●
●
●
●
●
●
●
●●
●
●
●
●
●
●
●
●
●
●●
●
●
●
●
●
●
●
●
●
●
●
●
●●
●
●
●● ●
●
●
●
●
●
●
●
●
●
●●
●
●
●
●
●
●
●
●
●
●
●
2.0 2.5 3.0 3.5 4.0
0.5
1.0
1.5
2.0
2.5
Anderson's/Fisher's Iris
Sepal width
Pet
al w
idth
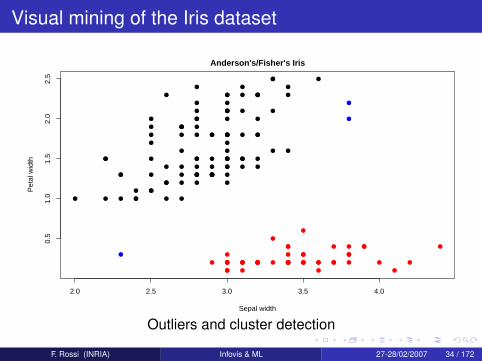
Outliers and cluster detection
F. Rossi (INRIA) Infovis & ML 27-28/02/2007 34 / 172
Visual mining of the Iris dataset
●● ●● ●
●
●
●●
●
●●
●●
●
●●
● ●●
●
●
●
●
●●
●
●●●●
●
●
●● ● ●
●
● ●
●●
●
●
●
●
●● ●●
●
●●
●
●
●
●
●
●
●
●
●
●
●
●
●
●
●
●
●
●
●
●
●
●
●●
●
●
●
●
●
●
●
●
●
●
● ●●
●
●
●
●
●
●
●●
●
●
●
●
●
●
●
●
●
●●
●
●
●
●
●
●
●
●
●
●
●
●
●●
●
●
●● ●
●
●
●
●
●
●
●
●
●
●●
●
●
●
●
●
●
●
●
●
●
●
2.0 2.5 3.0 3.5 4.0
0.5
1.0
1.5
2.0
2.5
Anderson's/Fisher's Iris
Sepal width
Pet
al w
idth
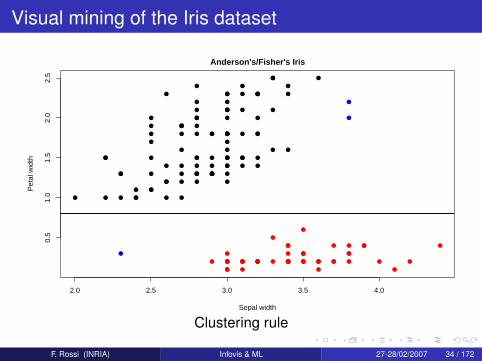
Clustering rule
F. Rossi (INRIA) Infovis & ML 27-28/02/2007 34 / 172
Visual mining of the Iris dataset
●● ●● ●
●
●
●●
●
●●
●●
●
●●
● ●●
●
●
●
●
●●
●
●●●●
●
●
●● ● ●
●
● ●
●●
●
●
●
●
●● ●●
●
●●
●
●
●
●
●
●
●
●
●
●
●
●
●
●
●
●
●
●
●
●
●
●
●●
●
●
●
●
●
●
●
●
●
●
● ●●
●
●
●
●
●
●
●●
●
●
●
●
●
●
●
●
●
●●
●
●
●
●
●
●
●
●
●
●
●
●
●●
●
●
●● ●
●
●
●
●
●
●
●
●
●
●●
●
●
●
●
●
●
●
●
●
●
●
2.0 2.5 3.0 3.5 4.0
0.5
1.0
1.5
2.0
2.5
Anderson's/Fisher's Iris
Sepal width
Pet
al w
idth
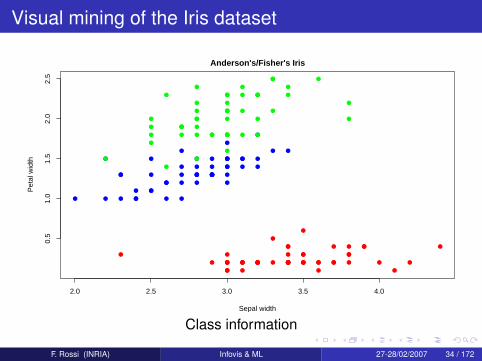
Class information
F. Rossi (INRIA) Infovis & ML 27-28/02/2007 34 / 172
Visual mining of the Iris dataset
●● ●● ●
●
●
●●
●
●●
●●
●
●●
● ●●
●
●
●
●
●●
●
●●●●
●
●
●● ● ●
●
● ●
●●
●
●
●
●
●● ●●
●
●●
●
●
●
●
●
●
●
●
●
●
●
●
●
●
●
●
●
●
●
●
●
●
●●
●
●
●
●
●
●
●
●
●
●
● ●●
●
●
●
●
●
●
●●
●
●
●
●
●
●
●
●
●
●●
●
●
●
●
●
●
●
●
●
●
●
●
●●
●
●
●● ●
●
●
●
●
●
●
●
●
●
●●
●
●
●
●
●
●
●
●
●
●
●
2.0 2.5 3.0 3.5 4.0
0.5
1.0
1.5
2.0
2.5
Anderson's/Fisher's Iris
Sepal width
Pet
al w
idth
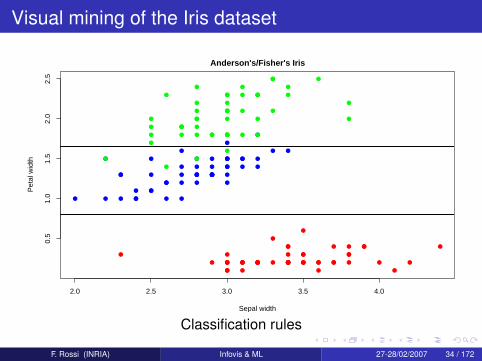
Classification rules
F. Rossi (INRIA) Infovis & ML 27-28/02/2007 34 / 172
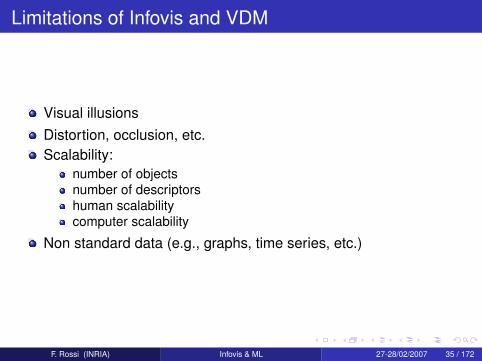
Limitations of Infovis and VDM
Visual illusionsDistortion, occlusion, etc.Scalability:
number of objectsnumber of descriptorshuman scalabilitycomputer scalability
Non standard data (e.g., graphs, time series, etc.)
F. Rossi (INRIA) Infovis & ML 27-28/02/2007 35 / 172
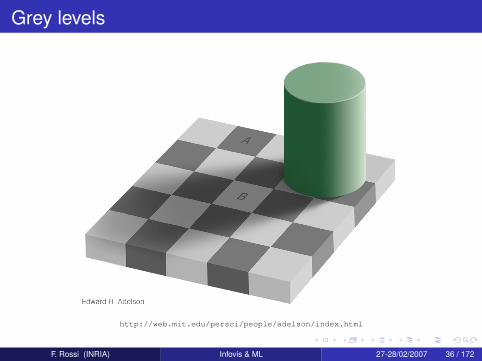
Grey levels
http://web.mit.edu/persci/people/adelson/index.html
F. Rossi (INRIA) Infovis & ML 27-28/02/2007 36 / 172
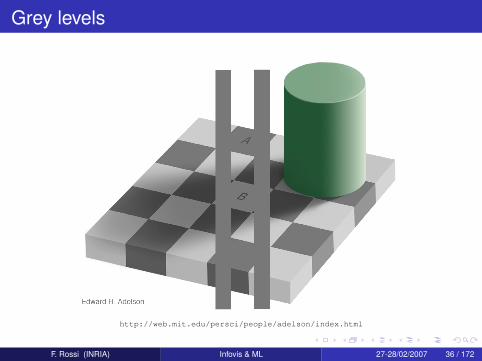
Grey levels
http://web.mit.edu/persci/people/adelson/index.html
F. Rossi (INRIA) Infovis & ML 27-28/02/2007 36 / 172
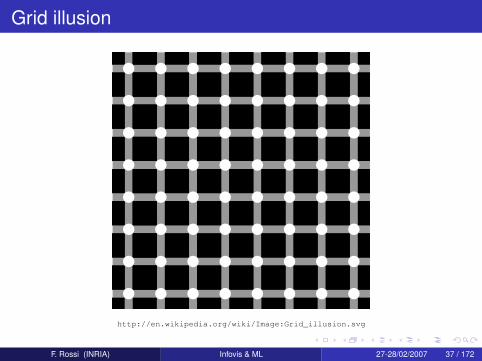
Grid illusion
http://en.wikipedia.org/wiki/Image:Grid_illusion.svg
F. Rossi (INRIA) Infovis & ML 27-28/02/2007 37 / 172
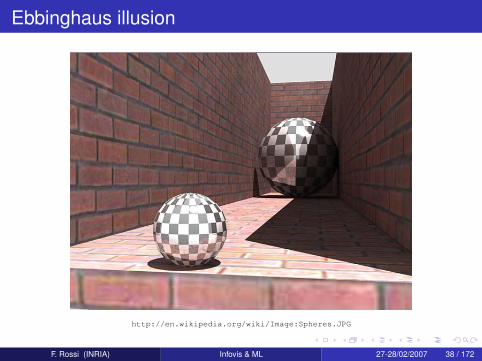
Ebbinghaus illusion
http://en.wikipedia.org/wiki/Image:Spheres.JPG
F. Rossi (INRIA) Infovis & ML 27-28/02/2007 38 / 172
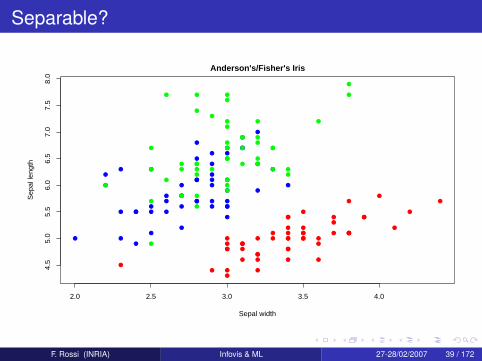
Separable?
●
●
●●
●
●
●
●
●
●
●
●●
●
●●
●
●
●
●
●
●
●
●
●
● ●
●●
●●
●
●
●
●●
●
●
●
●●
●●
●●
●
●
●
●
●
●
●
●
●
●
●
●
●
●
●
●
●●
●
●
●
●
●
●
●
●
●
●
●
●
●
●●
●
●
●●
●
●
●
●
●
●
●● ●
●
●
●
●●●
●
●
●
●
●
●
●
●
●
●
●
●
●
●●
●
●●
●●
●●
●
●
●
●
●
●
●
●●
●
●
●
●
●●
●
●
●●
●
●
●
●
●
●●●
●
●
●
●
2.0 2.5 3.0 3.5 4.0
4.5
5.0
5.5
6.0
6.5
7.0
7.5
8.0
Anderson's/Fisher's Iris
Sepal width
Sep
al le
ngth
F. Rossi (INRIA) Infovis & ML 27-28/02/2007 39 / 172
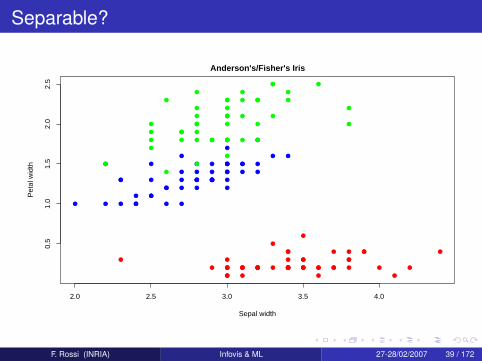
Separable?
●● ●● ●
●
●
●●
●
●●
●●
●
●●
● ●●
●
●
●
●
●●
●
●●●●
●
●
●● ● ●
●
● ●
●●
●
●
●
●
●● ●●
●
●●
●
●
●
●
●
●
●
●
●
●
●
●
●
●
●
●
●
●
●
●
●
●
●●
●
●
●
●
●
●
●
●
●
●
● ●●
●
●
●
●
●
●
●●
●
●
●
●
●
●
●
●
●
●●
●
●
●
●
●
●
●
●
●
●
●
●
●●
●
●
●● ●
●
●
●
●
●
●
●
●
●
●●
●
●
●
●
●
●
●
●
●
●
●
2.0 2.5 3.0 3.5 4.0
0.5
1.0
1.5
2.0
2.5
Anderson's/Fisher's Iris
Sepal width
Pet
al w
idth
F. Rossi (INRIA) Infovis & ML 27-28/02/2007 39 / 172
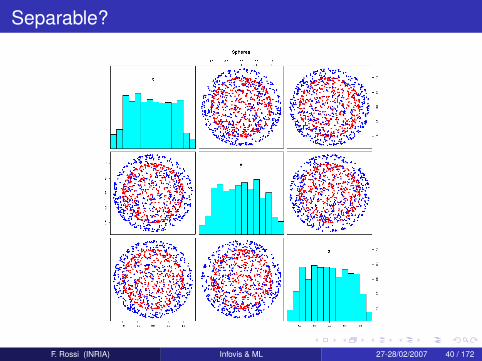
Separable?
F. Rossi (INRIA) Infovis & ML 27-28/02/2007 40 / 172
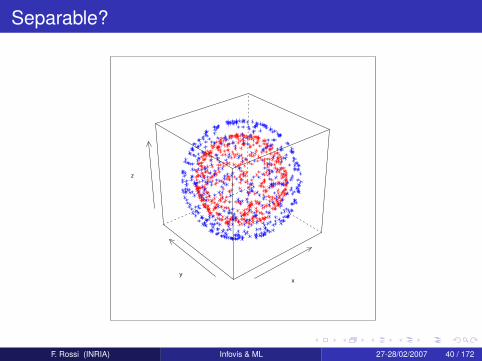
Separable?
xy
z
F. Rossi (INRIA) Infovis & ML 27-28/02/2007 40 / 172
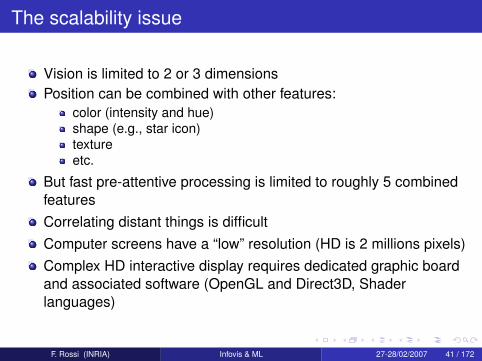
The scalability issue
Vision is limited to 2 or 3 dimensionsPosition can be combined with other features:
color (intensity and hue)shape (e.g., star icon)textureetc.
But fast pre-attentive processing is limited to roughly 5 combinedfeaturesCorrelating distant things is difficultComputer screens have a “low” resolution (HD is 2 millions pixels)Complex HD interactive display requires dedicated graphic boardand associated software (OpenGL and Direct3D, Shaderlanguages)
F. Rossi (INRIA) Infovis & ML 27-28/02/2007 41 / 172
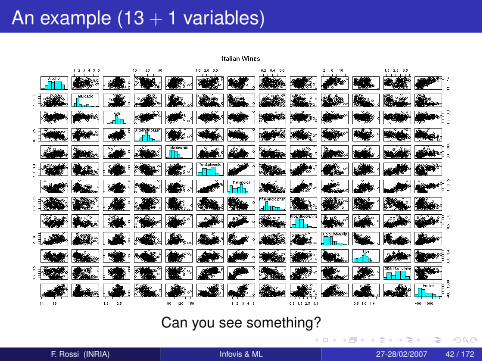
An example (13 + 1 variables)
Can you see something?
F. Rossi (INRIA) Infovis & ML 27-28/02/2007 42 / 172
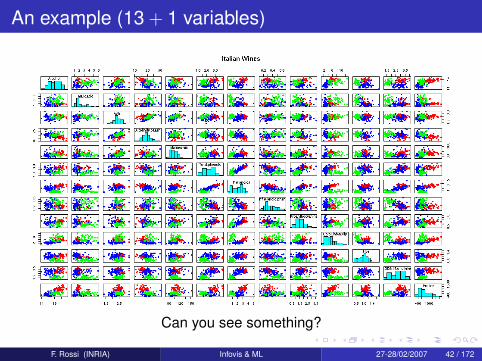
An example (13 + 1 variables)
Can you see something?
F. Rossi (INRIA) Infovis & ML 27-28/02/2007 42 / 172
Outline
1 Information VisualizationDefinitionExamples from “everyday life with KDE”
2 Infovis goals and limitationsWhat is it used for?Limitations of Infovis and VDM
3 Links with machine learningFormal model of InfovisMachine learning
F. Rossi (INRIA) Infovis & ML 27-28/02/2007 43 / 172
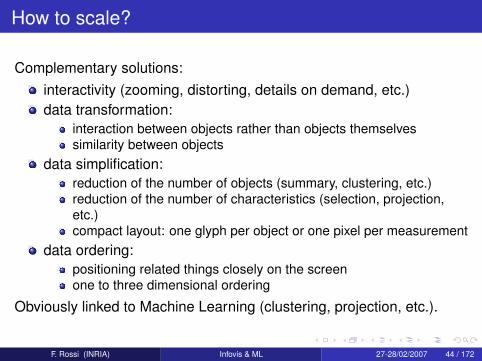
How to scale?
Complementary solutions:interactivity (zooming, distorting, details on demand, etc.)data transformation:
interaction between objects rather than objects themselvessimilarity between objects
data simplification:reduction of the number of objects (summary, clustering, etc.)reduction of the number of characteristics (selection, projection,etc.)compact layout: one glyph per object or one pixel per measurement
data ordering:positioning related things closely on the screenone to three dimensional ordering
Obviously linked to Machine Learning (clustering, projection, etc.).
F. Rossi (INRIA) Infovis & ML 27-28/02/2007 44 / 172
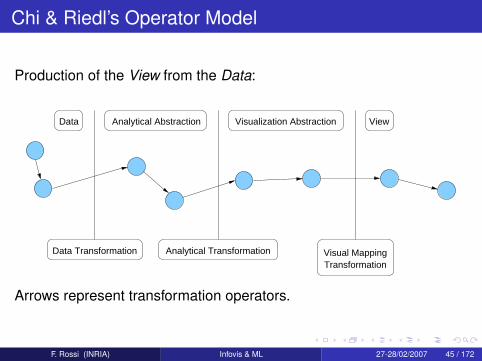
Chi & Riedl’s Operator Model
Production of the View from the Data:
Data Analytical Abstraction Visualization Abstraction View
Data Transformation Analytical Transformation
TransformationVisual Mapping
Arrows represent transformation operators.
F. Rossi (INRIA) Infovis & ML 27-28/02/2007 45 / 172
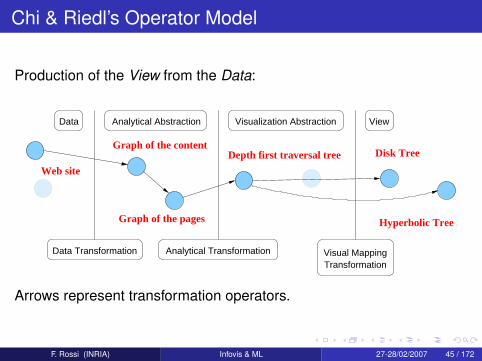
Chi & Riedl’s Operator Model
Production of the View from the Data:
Data Analytical Abstraction Visualization Abstraction View
Data Transformation Analytical Transformation
TransformationVisual Mapping
Graph of the content
Graph of the pages
Depth first traversal tree Disk Tree
Hyperbolic Tree
Web site
Arrows represent transformation operators.
F. Rossi (INRIA) Infovis & ML 27-28/02/2007 45 / 172
Where is machine learning?
(almost) everywhere! Two types of operators:1 data independent2 data dependent ⇒ machine learning, optimization, artificial
intelligence (AI)ML and AI operators:
Data: preprocessing, cleaning, etc.Data transformation: feature extraction, dissimilarity, etc.Visualization transformation: projection, clustering, ordering, etc.
F. Rossi (INRIA) Infovis & ML 27-28/02/2007 46 / 172
Organization of the lecture
Description of major visualization methods for vector/table dataFor each class of methods:
LimitationsRendering & InteractivityAI problems
Major AI challenges:ClusteringFeature extractionOrdering
Many things are left out, e.g.:Non vector dataDistortion techniquesetc.
F. Rossi (INRIA) Infovis & ML 27-28/02/2007 47 / 172


![Fabrice Romelard [MVP] Intranet – Extranet CTO SGS](https://img.pdfslide.us/doc/110x75/56649d445503460f94a20350/fabrice-romelard-mvp-intranet-extranet-cto-sgs.jpg)