Embed Size (px)
Citation preview
INFORMATION TO USERS
The most advanced technology has been used to photograph andreproduce this manuscript from the microfilm master. UMI films thetext directly from the original or copysubmitted. Thus, some thesis anddissertation copies are. in typewriter face, while others may be from anytype of computer printer.
The quality of this reproduction is dependent upon the quality or thecopy submitted. Broken or indistinct print, colored or poor qualityillustrations and photographs, print bleedthrough, substandard margins,and improper alignment can adverselyaffect reproduction.
In the unlikely event that the author did not send UMI a complete
manuscript and there are missing pages, these will be noted. Also, ifunauthorized copyright material had to be removed, a note will indicatethe deletion.
Oversize materials (e.g., maps, drawings, charts) are reproduced bysectioning the original, beginning at the upper left-hand corner andcontinuing from left to right in equal sections with small overlaps. Each
original is also photographed in one exposure and is included inreduced form at the back of the book.
Photographs included in the original manuscript have been reproducedxerographically in this copy. Higher quality 6" x 9" black and whitephotographic prints are available for any photographs or illustrationsappearing in this copy for an additional charge. Contact UMI directlyto order.
U·M·IUruvers.ty Microfilms International
A Bell & Howcn Information Company300 North Zeeb Road. Ann Arbor. M148106·1346 USA
.313761-4700 800:521-0600

Order Number 9018990
Indonesian interisland shipping: An assessment of therelationship of government policies and quality of shippingservices
Purwaka, Tommy Hendra, Ph.D.
University of Hawaii, 1989
COPYJ;.J,ght @1989 by Purwaka, Tommy Hendra. All rights reserved.
U·M·I300 N. Zceb Rd.Ann Arbor, MI48106

------- ---------------
INDONESIAN INTERISLAND SHIPPING:
AN ASSESSMENT OF THE RELATIONSHIP OF GOVERNMENT POLICIES
AND QUALITY OF SHIPPING SERVICES
A DISSERTATION SUBMITTED TO THE GRADUATE DIVISION OF THEUNIVERSITY OF HAWAI I IN PARTIAL FULFILLMENT
OF THE REQUIREMENTS FOR THE DEGREE OF
DOCTOR OF PHILOSOPHY
IN GEOGRAPHY
DECEMBER 1989
By
Tommy Hendra Purwaka
Dissertation Committee:
Joseph R. Morgan, ChairmanNorton S. GinsburgForrest R. PittsAlice G. DeweyH. David Bess
-- - ----------------------------------------
ACKNOWLEDGMENTS
I would like to offer my sincere thanks to the many people who have
contributed to this study. Dr. Joseph R. Morgan, Advisor and Chairman
of my dissertation committee, always provided me with intense guidance,
critical comments, valuable suggestions, constant encouragement, and
patient advice from the beginning of this study. His skillful editing
aided in the completion of the study.
Grateful acknowledgment is extended to Dr. Norton S. Ginsburg for
his comments on the draft. His excellent advice had strengthened my
confidence in finishing the study. I also would like to thank Dr.
Forrest R. Pitts, Dr. H. David Bess, and Dr. Alice G. Dewey, members
of the dissertation committee, for their valuable comments and
suggestions.
I would like to express my appreciation to Dr. Lyndon L. Wester
for his availability to be the proxy of Dr. Forrest R. Pitts, who has
retired and left Honolulu in June 1989. He read and edited the final
draft of this study.
I am grateful for the financial support provided by the East-West
Environment and Policy Institute, East-West Center, during my study at
the Department of Geography, University of Hawaii. I have been
fortunate to be able to work in the stimulating atmosphere in the
Institute and in the Department of Geography.
Additionally, I would like to thank the ~irectorate General of
Fisheries for giving me permission to continue my studies, and to the
iv
Cirectorate General of Sea Communications for allowing me to gather data
on interisland shipping. Finally, special thanks must be given to Ms.
Freda Hellinger for typing my dissertation.
This study is dedicated to my mother, Elizabeth Sumaryati, and to
my wife Dhian and daughters Ninda and Nindi Purwaka.
- - - ----------------------
ABSTRACT
The specific aim of this study is to examine the quality of
Indonesian interisland snipping in achieving national policy objectives
as stated in the Five Year Development Plan. This examination includes
an analysis of regularity of shipping services, frequency of sailing,
shipping capacity, freight rates, and government policies.
The results of data analysis indicate that excess capacity,
irregularity, infrequent sailing, and low freight rates were deficiencies
of interisland shipping services. The reasons for shipping deficiencies
included: (1) frequent changes in shipping policies and regulations;~
(2) centralization of shipping capacity in certain growth centers; (3)
route deviations and port omissions; (4) inter- and intra-modal com
petition; (5) insufficient volume of return cargoes; (6) poor port
conditions and insufficient port facilities.
Major findings of the study show that the relationship of government
policies to shipping services is based on the concept that lithe ship
promotes the trade." However the contrary vi ew that "the shi p fo11 O\'JS
the trade" implies that interisland shipping will comply with government
policies only if their interests of obtaining sufficient volume of
cargoes can be guaranteed. Obviously, interisland ships always followed
the trade rather than shipping policies and regulations. Deregulation
would likely increase irregular shipping services, infrequent sailing,
irregular distribution of basic commodities, centralization of trade,
imbalance of economic development between east and west Indonesia, and
number of lagging regions ..As a result, the achievement of national
policy objectives and the implementation of Wawasan Nusantara through
interisland shipping are still far from reality. In order to achieve
government policy objectives through interisland shipping, this study
suggests that the government should provide interisland shipping with
subsidies, encourage the formation of and regulate domestic shipping
conferences, and extend economic decentralization to all Indonesian
provinces.
This study also indicates that interisland ships are capable of
facilitating exchange processes toward the realization of vertical and
horizontal homogeneity in sociopolitical and cultural conditions
throughout the archipelago. This has strengthened the unity of the
nation.
vi
TABLE OF CONTENTS
ACKNOWLEDGMENTS
ABSTRACT
LIST OF TABLES
LIST OF FIGURES .
iii
v
x
xv
CHAPTER I
CHAPTER II
CHAPTER III
CHAPTER IV
INTRODUCTI ON .
Background . . . .Problem Statement ....Scope of the Study . . . . .Significance of the StudySource of Data . . .
REGIONAL DESCRIPTION OF THE STUDY AREA
Physical Characteristics.Population .Resources .. . . . . . . .Ports and Shipping RoutesThe Regions .
WAWASAN NUSANTARA AND GOVERNMENT POLICIES
The Nature of Wawasan Nusantara . . .Government Policies .Shipping Regulations .
Government Regulation No. 2 of 1969Port Regulations .....Shipping Route RegulationsRegulations of Ship's Age.Freight Rate Regulations
SHIPPING PERFORMANCE ..•.
Shipping Capacity .•......Capacity of Nusantara ShippingCapacity of Lokal ShippingCapacity of Prahu ShippingCapacity of Perintis ShippingCapacity of Special Shipping
15689
11
1116171923
31
3137434549535961
65
656675818485
CHAPTER V
APPENDICES
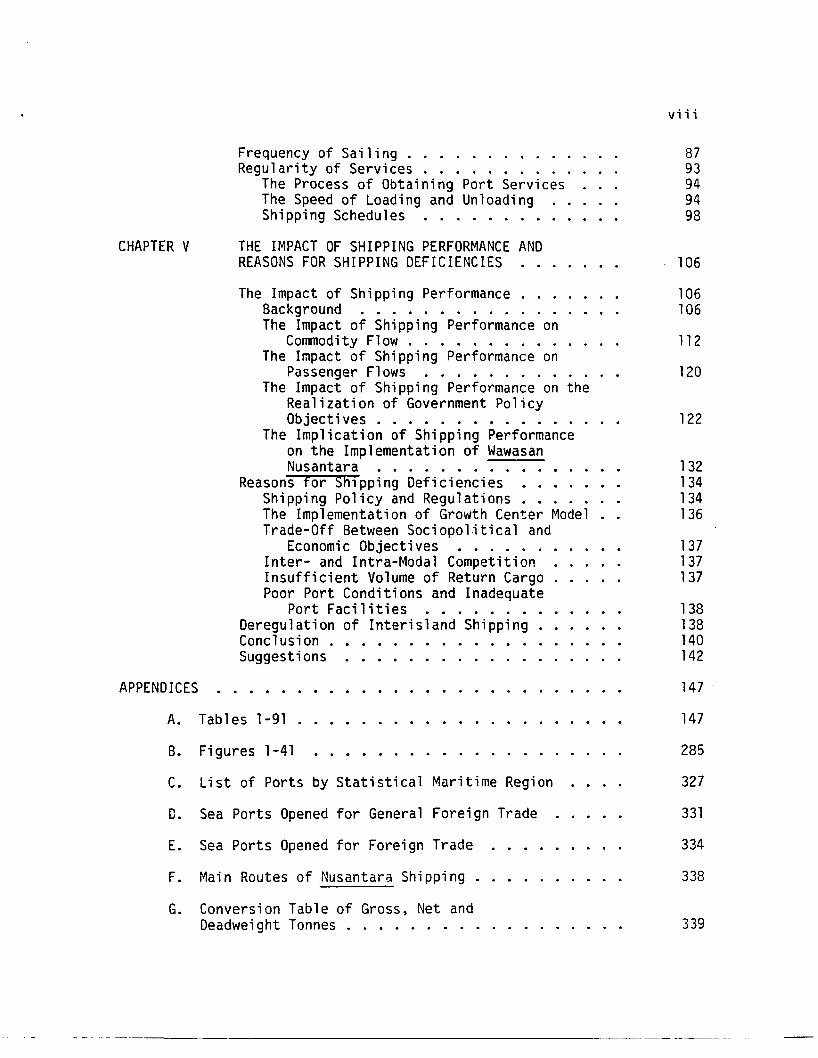
Frequency of Sailing .Regularity of Services .
The Process of Obtaining Port ServicesThe Speed of Loading and UnloadingShipping Schedules .
THE IMPACT OF SHIPPING PERFORMANCE ANDREASONS FOR SHIPPING DEFICIENCIES
The Impact of Shipping Performance ..Background . . . . . . . . . . . .The Impact of Shipping Performance on
Commodity Flow .The Impact of Shipping Performance on
Passenger Flows .The Impact of Shipping Performance on the
Realization of Government PolicyObjectives ...•..........
The Implication of Shipping Performanceon the Implementation of WawasanNusantara . . . . . . . . . . .
Reasons for Shipping DeficienciesShipping Policy and Regulations ..The Implementation of Growth Center ModelTrade-Off Between Sociopolitical and
Economic Objectives .Inter- and Intra-Modal CompetitionInsufficient Volume of Return Cargo .Poor Port Conditions and Inadequate
Port Facilities .Deregulation of Interisland Shipping.Conclusion ..Suggestions ....
viii
8793949498
106
106106
112
120
122
132134134136
137137137
138138140142
147
A. Tables 1-91
B. Figures 1-41
C. List of Ports by Statistical Maritime Region
D. Sea Ports Opened for General Foreign Trade
E. Sea Ports Opened for Foreign Trade
F. Main Routes of Nusantara Shipping.
147
285
327
331
334
338
G. Conversion Table of Gross, Net andDeadweight Tonnes . 339
- ----------------------------------------- --- --
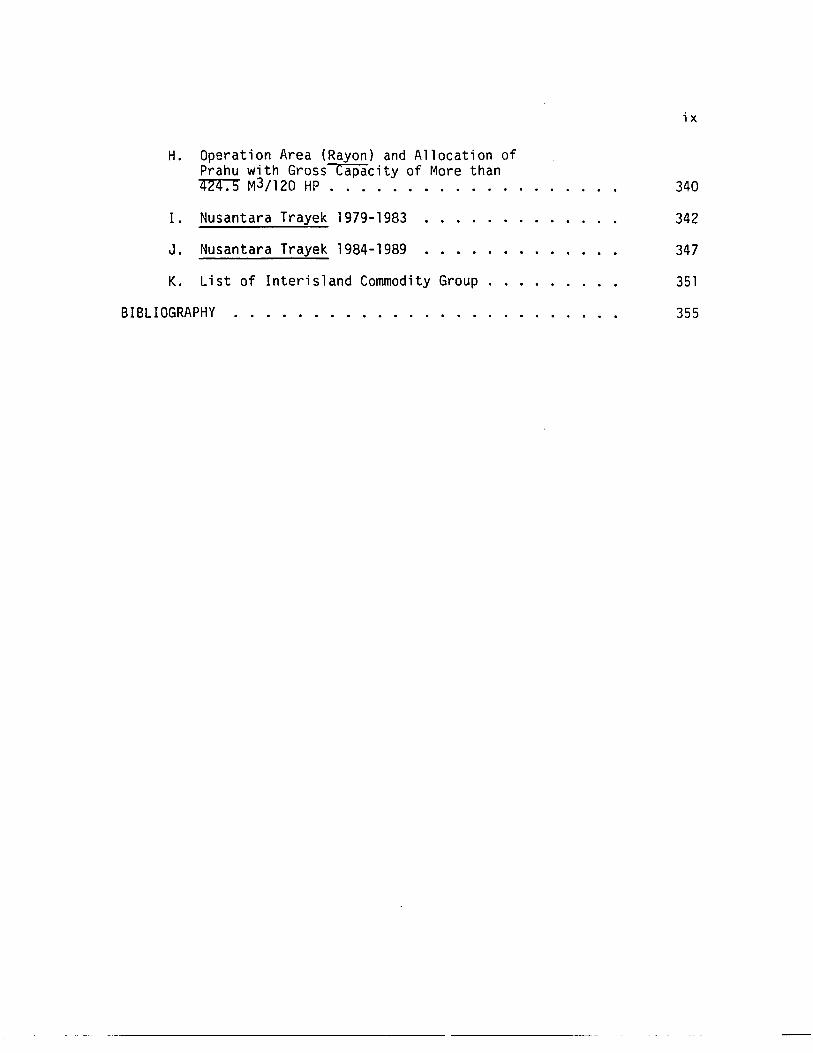
H. Operation Area (Rayon) and Allocation ofPrahu with Gross Capacity of More than424.5 M3/120 HP . . . . .. ..
ix
340
I. Nusantara Trayek 1979-1983
BIBLIOGRAPHY
K. List of Interisland Commodity Group
J. Nusantara Trayek 1984-1989
342
347
351
355
Table
2
3
4
5
6
7
8
9
10
11
12
13
14
15
16
17
18
19
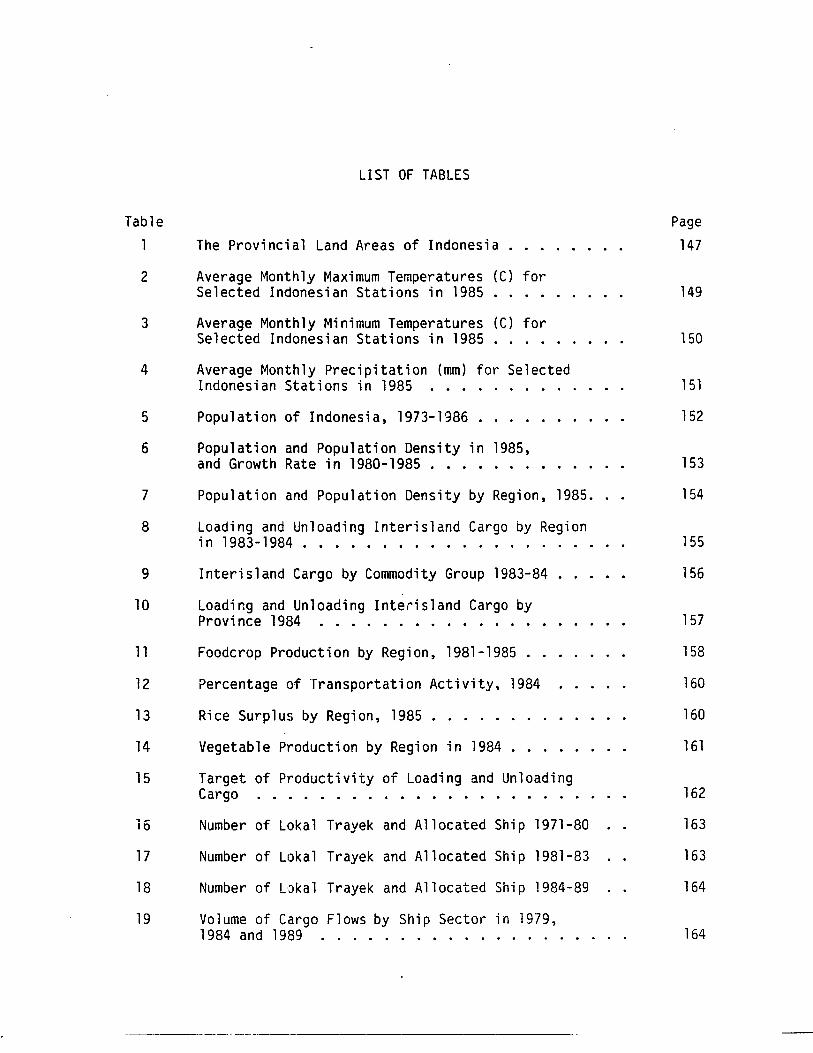
LIST OF TABLES
The Provincial Land Areas of Indonesia.
Average Monthly Maximum Temperatures (C) forSelected Indonesian Stations in 1985
Average Monthly Minimum Temperatures (C) forSelected Indonesian Stations in 1985
Average Monthly Precipitation (mm) for SelectedIndonesian Stations in 1985
Population of Indonesia, 1973-1986
Population and Population Density in 1985,and Growth Rate in 1980-1985 ....
Population and Population Density by Region, 1985.
Loading and Unloading Interisland Cargo by Regionin 1983-1984 . • . . . . . . . . ...
Interisland Cargo by Commodity Group 1983-84
Loading and Unloading Interisland Cargo byProvince 1984 .
Foodcrop Production by Region, 1981-1985 ..
Percentage of Transportation Activity, 1984
Rice Surplus by Region, 1985 •
Vegetable Production by Region in 1984
Target of Productivity of Loading and UnloadingCargo . . . . . . . . ..... . . . . . . .
Number of Loka1 Trayek and Allocated Ship 1971-80
Number of Loka1 Trayek and Allocated Ship 1981-83
Number of LJka1 Trayek and Allocated Ship 1984-89
Volume of Cargo Flows by Ship Sector in 1979,1984 and 1989 . . . . . . . . . . . . . . . . .
Page
147
149
150
151
152
153
154
155
156
157
158
160
160
161
162
163
163
164
164
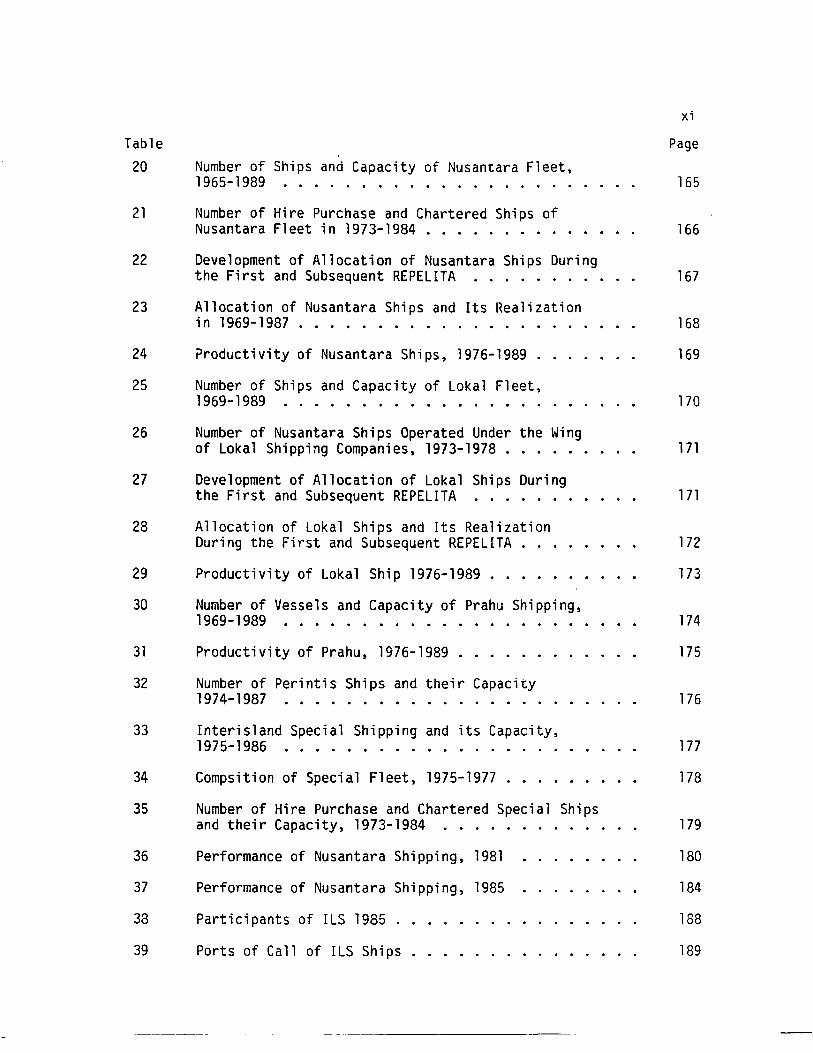
Table20
21
22
23
24
25
26
27
28
29
30
31
32
33
34
35
36
37
38
39
Number of Ships and Capacity of Nusantara Fleet,1965-1989 .
Number of Hire Purchase and Chartered Ships ofNusantara Fleet in 1973-1984 . . . . . . ...
Development of Allocation of Nusantara Ships Duringthe First and Subsequent REPELITA .
Allocation of Nusantara Ships and Its Realizationin 1969-1987 .
?roductivity of Nusantara Ships, 1976-1989 .
Number of Ships and Capacity of Lokal Fleet,1969-1989 .
Number of Nusantara Ships Operated Under the Wingof Lokal Shipping Companies, 1973-1978 .
Development of Allocation of Lokal Ships Duringthe First and Subsequent REPELITA
Allocation of Lokal Ships and Its RealizationDuring the First and Subsequent REPELITA
Productivity of Lokal Ship 1976-1989 .
Number of Vessels and Capacity of Prahu Shipping,1969-1989 .........•.
Productivity of Prahu, 1976-1989 .
Number of Perintis Ships and their Capacity1974-1987......... . ...
Interisland Special Shipping and its Capacity,1975-1986 •..........•..
Compsition of Special Fleet, 1975-1977 .....
Number of Hire Purchase and Chartered Special Shipsand their Capacity, 1973-1984 ....
Performance of Nusantara Shipping, 1981
Performance of Nusantara Shipping, 1985
Participants of ILS 1985
Ports of Call of ILS Ships
xi
Page
165
166
167
168
169
170
171
171
172
173
174
175
176
177
178
179
180
184
188
189
Table
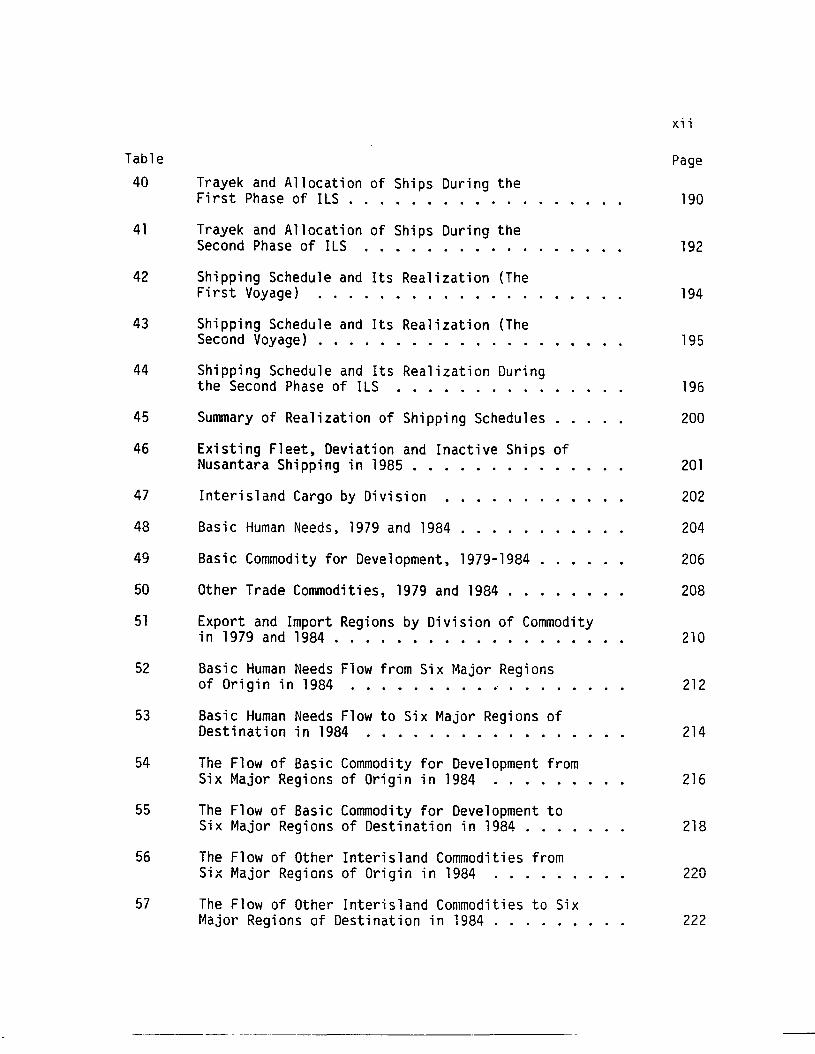
40 Trayek and Allocation of Ships During theFirst Phase of ILS . . . . . . . . . . . . . . .
41 Trayek and Allocation of Ships During theSecond Phase of ILS . . . . . . . . . . . .
xii
Page
190
192
42
43
44
45
46
47
48
49
50
51
52
53
54
55
56
57
Shipping Schedule and Its Realization (TheFirst Voyage) .....•........
Shipping Schedule and Its Realization (TheSecond Voyage) .
Shipping Schedule and Its Realization Duringthe Second Phase of ILS •.........
Summary of Realization of Shipping Schedules
Existing Fleet, Deviation and Inactive Ships ofNusantara Shipping in 1985 . . . . . . •
Interisland Cargo by Division
Basic Human Needs, 1979 and 1984
Basic Commodity for Development, 1979-1984
Other Trade Commodities, 1979 and 1984 .
Export and Import Regions by Division of Commodityin 1979 and 1984 ....•.......
Basic Human Needs Flow from Six Major Regionsof Origin in 1984 ...••....•....
Basic Human Needs Flow to Six Major Regions ofDestination in 1984 ...•..........
The Flow of Basic Commodity for Development fromSix Major Regions of Origin in 1984 .....
The Flow of Basic Commodity for Development toSix Major Regions of Destination in 1984 ...
The Flow of Other Interisland Commodities fromSix Major Regions of Origin in 1984 ....
The Flow of Other Interisland Commodities to SixMajor Regions of Destination in 1984 ....
194
195
196
200
201
202
204
206
208
210
212
214
216
218
220
222
---- -~~--~
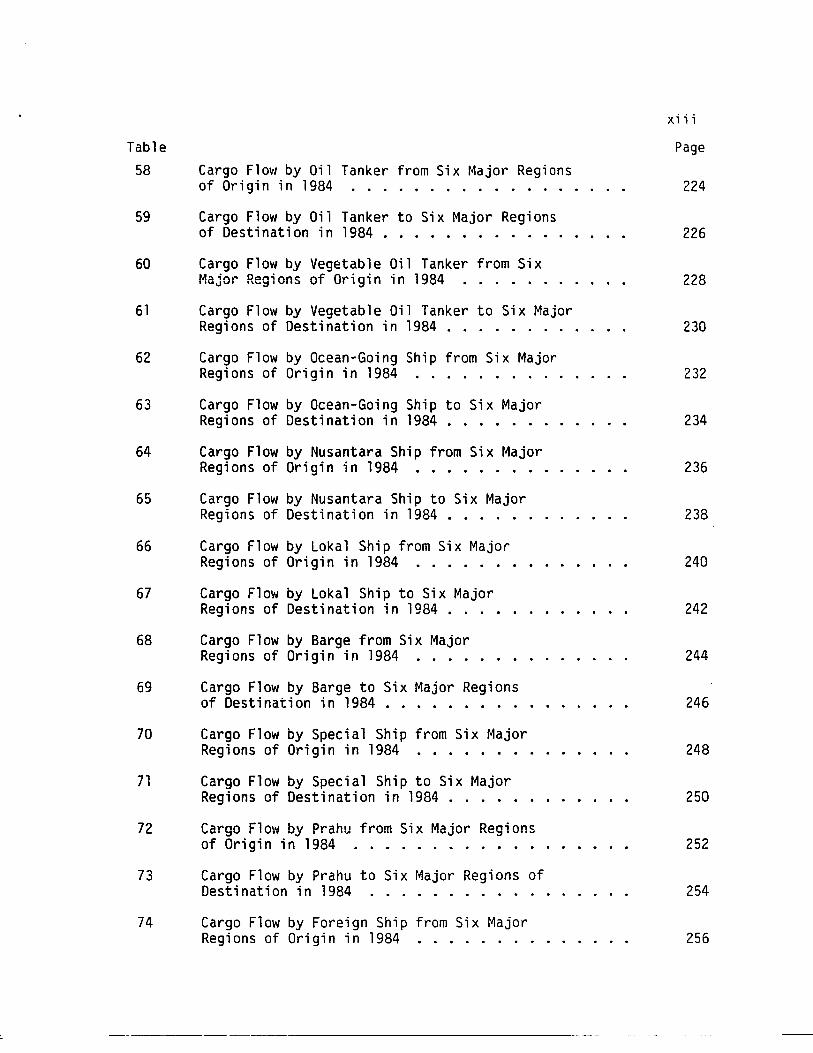
Table58
59
60
61
62
63
64
65
66
67
68
69
70
71
72
73
74
Cargo Flow by Oil Tanker from Six Major Regionsof Origin in 1984 ......•....
Cargo Flow by Oil Tanker to Six Major Regionsof Destination in 1984 .......•...
Cargo Flow by Vegetable Oil Tanker from SixMajor Regions of Origin in 1984 .
Cargo Flow by Vegetable Oil Tanker to Six MajorRegions of Destination in 1984 .
Cargo Flow by Ocean-Going Ship from Six MajorRegions of Origin in 1984 .
Cargo Flow by Ocean-Going Ship to Six MajorRegions of Destination in 1984 ...•...
Cargo Flow by Nusantara Ship from Six MajorRegions of Origin in 1984 ..•.....
Cargo Flow by Nusantara Ship to Six MajorRegions of Destination in 1984 .....
Cargo Flow by Lokal Ship from Six MajorRegions of Origin in 1984 ..•...
Cargo Flow by Lokal Ship to Six MajorRegions of Destination in 1984 ..
Cargo Flow by Barge from Six MajorRegions of Origin in 1984 ..•.
Cargo Flow by Barge to Six Major Regionsof Destination in 1984 ....•....
Cargo Flow by Special Ship from Six MajorRegions of Origin in 1984 ..•....
Cargo Flow by Special Ship to Six MajorRegions of Destination in 1984 ..
Cargo Flow by Prahu from Six Major Regionsof Origin in 1984 •...•....
Cargo Flow by Prahu to Six Major Regions ofDestination in 1984 .
Cargo Flow by Foreign Ship from Six MajorRegions of Origin in 1984 .
xi i i
Page
224
226
228
230
232
234
236
238
240
242
244
246
248
250
252
254
256
Table
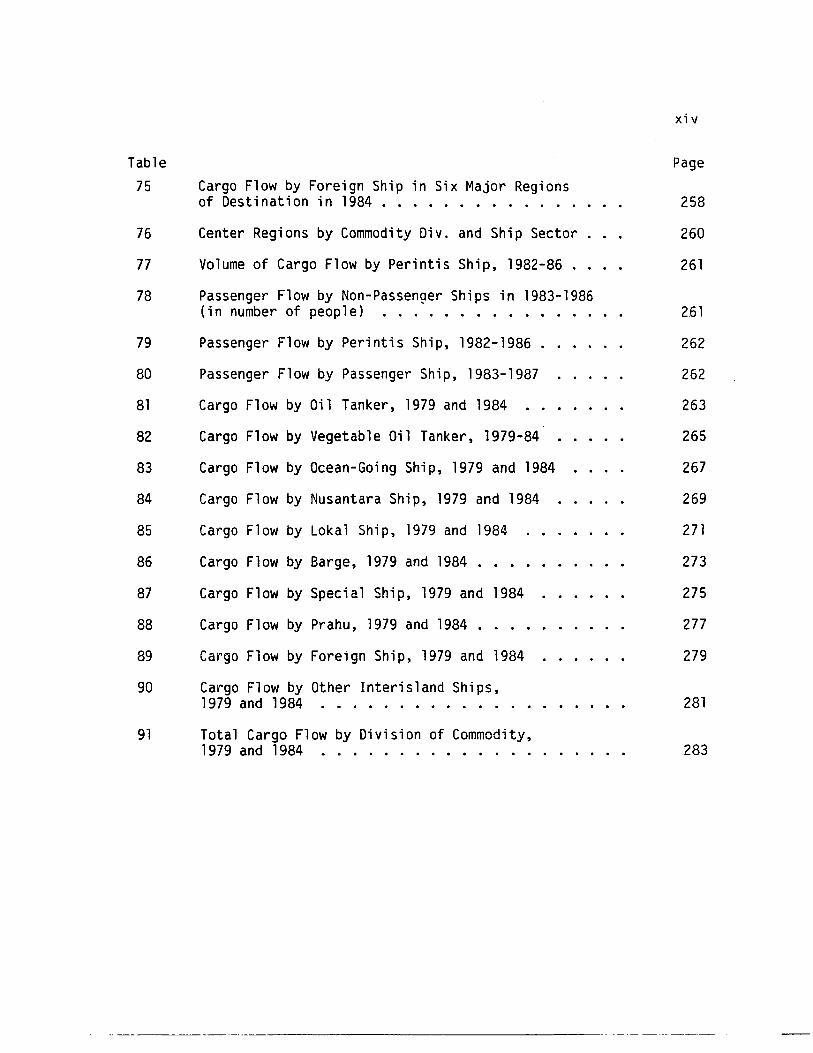
75
76
77
78
79
80
81
82
83
84
85
86
87
88
89
90
91
Cargo Flow by Foreign Ship in Six Major Regionsof Destination in 1984 . . . . . . .....
Center Regions by Commodity Div. and Ship Sector
Volume of Cargo Flow by Perintis Ship, 1982-86 ..
Passenger Flow by Non-Passenger Ships in 1983-1986(in number of people) .
Passenger Flow by Perintis Ship, 1982-1986 ..
Passenger Flow by Passenger Ship, 1983-1987
Cargo Flow by Oil Tanker, 1979 and 1984
Cargo Flow by Vegetable Oil Tanker, 1979-84
Cargo Flow by Ocean-Going Ship, 1979 and 1984
Cargo Flow by Nusantara Ship, 1979 and 1984
Cargo Flow by Lokal Ship, 1979 and 1984
Cargo Flow by Barge, 1979 and 1984 .
Cargo Flow by Special Ship, 1979 and 1984
Cargo Flow by Prahu, 1979 and 1984 .
Cargo Flow by Foreign Ship, 1979 and 1984
Cargo Flow by Other Interisland Ships,1979 and 1984 .•..........
Total Cargo Flow by Division of Commodity,1979 and 1984 •.............
xiv
Page
258
260
261
261
262
262
263
265
267
269
271
273
275
277
279
281
283
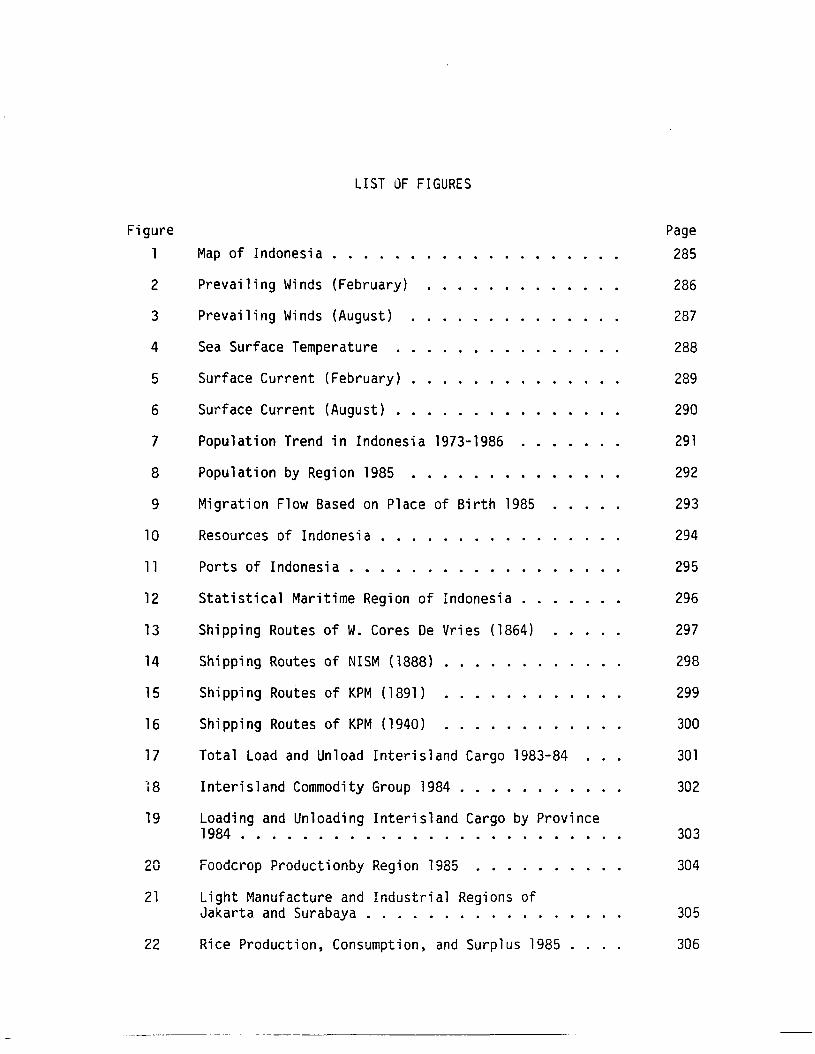
Figure1
2
3
4
5
6
7
8
9
10
11
12
13
14
15
16
17
19
20
21
22
LIST OF FIGURES
Map of Indonesia
Prevailing Winds (February)
Prevailing Winds (August)
Sea Surface Temperature
Surface Current (February)
Surface Current (August) •.
Population Trend in Indonesia 1973-1986
Popu1at i on by Regi on 1985 . . .
Migration Flow Based on Place of Birth 1985
Resources of Indonesia
Ports of Indonesia .•.
Statistical Maritime Region of Indonesia
Shipping Routes of W. Cores De Vries (1864)
Shipping Routes of NISM (1888) .
Shipping Routes of KPM (1891)
Shipping Routes of KPM (1940)
Total Load and Unload Interisland Cargo 1983-84
Interi s1and Commodity Group 1984 . . . . . . . .
Loading and Unloading Interisland Cargo by Province1984 . . . . . . . . • . . .
Foodcrop Productionby Region 1985 ...
Light Manufacture and Industrial Regions ofJakarta and Surabaya . . . . . . . . . .
Rice Production, Consumption, and Surplus 1985
Page
285
286
287
288
289
290
291
292
293
294
295
296
297
298
299
300
301
302
303
304
305
306
Figure
23
24
25
26
27
28
29
30
31
32
33
34
35
36
37
38
39
40
41
Trans-Sulawesi Highway .
The Path Diagram of Port Services
Nusantara Shipping Routes
Passenger Routes .
Lokal Shipping Routes
Perintis Shipping Routes .
The Path Diagram of the Study
Number of Nusantara Ships 1965-1989.
Capacity of Nusantara Shipping 1965-1989 .
Number of Hire Purchase and Chartered NusantaraShips1973-1984 .............•...
Capacity of Hire Purchase and CharteredNusantara Ships 1973-1984 ...
Number of Lokal Ships 1969-1989
Capacity of Lokal Shipping 1969-1989 .
Number of Prahu 1969-1989
Capacity of Prahu 1969-1989
Number of Perintis Ships and Their Capacity1974-1987 . . . . . . • . . . ....
Number of Special Ships 1975-1987
Capacity of Special Shipping 1975-1986 .
Main Routes of Nusantara Shipping
xvi
Page
307
309
310
311
312
313
314
315
316
317
318
319
320
321
322
323
324
325
326
CHAPTER I
INTRODUCTION
Background
In the modern world, no nation can live in absolute isolation.
Nations need to communicate and trade with each other. Efficient
communication and trade help to overcome isolation induced by geographic
location. In this respect, an efficient transportation system is one
of the means to break down the isolation.
[This is why] each nation requires a comprehensive and[adequate transportation network] to move goods and people,[especially] within its national boundaries. [Its] needs[will eventually] extend further to [include a good transportation] system linking [other] nations so that theresources and amenities of the world may be available to[its] peop1e. 1
It is quite clear that transportation has occupied a most important role
in modern life; as has been stated by Munby "there is no escape from
transport" 2 for any country. Even in the most remote and least developed
inhabited regions, transportation in some form or another is a funda-
mental part of the daily rhythm of life.
Domestic transportation problems in archipelagic nations are much
different from those of continental nations. In an archipelagic nation,
,'Leslie A. Schumer, Elements of Transport, 3d ed. (Sydney:
Butterworths, 1974), 21.
20enys L. Munby, Transport, Selected Readings (Harmondsworth:Penguin Books, 1968), 7.
2
domestic transportation lacks the possibility of land transport to
connect fragmented portions of the nation.
[In addition,] whereas an effective and efficient overlandtransportation network must connect the various ports withtheir contiguous hinterlands, in an archipelago, the majordependence must be, perforce, upon water transport, [i.e.interisland shipping.]3
The role of interisland shipping in Indonesia occupies a strategic
position in interisland transportation. This is because air transport a-
tion is still primarily a oassenger operation, and it only connects areas
which have airports. Not all areas, particularly small islands with
a few thousand inhabitants, have airports. In consequence, the movement
of goods and people between small islands and the rest of the archipelago
depends upon a good interisland shipping system.
For the transport of goods, [shipping] services shouldhave the quality of speed, safety, adequacy, frequency,regularity, comprehensiveness, responsibility, and acceptable cost. For the transport of people, the additionalquality of comfort is called for. 4
The demand for shipping with adequate quality of service leads to
the development of new shipping technology.
[Such a demand] exists or will develop for: (1) largerand safer ships to handle high-volume flows of both bulkand general cargoes; (2) a greater variety of ship typessuitable for serving an increased diversity of trade insemi manufactures and .for carrying some of the higher volumegeneral cargoes in bulk; (3) increasingly speedy, efficient,
3Frederick L. Wernstedt, The Role and Importance of Philippine Interisland Shipping and Trade (Ithaca, Ny: Southeast ASla Program, Departmentof Far Eastern Studies, Cornell University, July 1957), 1.
4Les1ie A. Schumer, Elements of Transport, 3d ed. (Sydney:Butterworths, 1974), 21.
3
and low cost package cargo services to prevent diversionof high value cargoes to ~ir and to assist nations to maintain t~eir position in an increasingly competitive tradein consumer goods; (4) [ways to extend] the advantagesof containerization to less developed areas lackingexpensive port facilities; and (S) improved methods ofcargo routing and control and for transfering cargoesbetween transport modes. S
Among those qualities of shipping service, regularity is the most
important for a country like Indonesia. This is because demand for
shipping in Indonesia is generally unstable. In this regard, a lack
of capability to communicate frequently and regularly makes administra
tion and unification of the country difficult. 6 Regularity implies that
shipping is carried out on schedule, with fixed or regular departures
and arrivals. In other words, shipping movements are either at evenly
spaced intervals or at known times. 7
It is generally accepted that shipping policies have considerable
impact and sometimes cause conflicts between carriers and shippers.
This is because different entities view the interisland shipping industry
with different goals in mind. The carriers' objective is to maximize
profit by reducing over-capacity, minimizing numbers of laborers and
SSamuel A. Lawrence, International Sea Transport: The Years Ahead(Lexington, MA: D. C. Heath, 1972), 154.
6Roy J. Sampson, Martin T. Farris and David L. Shrock, DomesticTransportation: Practice, Theory and Policy, Sth ed. (Boston, MA:Roughton Mlff11n, 1985), 4.
7Rahardo Adisasmita, The Role of Shipping in the Context ofArchipelagic Concept (Ujung Pandang, Indonesla: University of Hasanuddin,1978), 17.
4
by ~liminating "service not absolutely necessary to satisfy customers.,,8
On the other hand, the shippers' objective is to have "more service at
less cost to themselves, and they desire more choice among firms and
modes. 119 Unlike the carriers and shippers, the government is interested
in a "sound" interisland shipping which is available as needed, capable
of insuring regular communications linking all islands or the archipelago
and able to carry out government policies. 10
In the case of shipping policy, the basic issues should not be
viewed in isolation from other sectors. They must be considered in
relation to national and regional objectives, both long run and short
run. The impact of sea transportation is intertwined almost without
exception with social, political and economic considerations.
Shipping affects all economic activities; indeed it touches the
life of every citizen. In consequence, it becomes a highly regulated
industry, subject to state control. l l Put another way, in the shipping
sectors, public intervention has been frequent. 12 This is why Cooper
BRoy J. Sampson, Martin T. Farris and David L. Shrock, DomesticTransportation: Practice, Theory and Policy, 5th ed. (Boston, MA:Houghton Mifflln, 19$5), 495.
9Ibi d., 495.
10Ibid., 496.
llDonald W. Fryer, World Economic Development (New York: McGrawHill, 1965). See also Roy J. Sampson, Martin T. Farris and David L.Shrock, Domestic Transportation: Practice, Theory and Policy (Boston,MA: Houghton Mifflin, 1985), 377.
12Rahardjo Adisasmita, The Role of Shipping in the Context ofArchipelagic Concept (Ujung Pandang, Indonesla: Onlverslty of Rasanuddin,1978), 20.
----- - ----- ----
5
stated that shipping has always been of political as well as economic
significance in an archipelagic state like Indonesia. 13
Problem Statement
The basic question of this study is how well Indonesian interisland
shipping serves the needs of the nation. This question may be answered
by assessing the performance of shipping in achieving national policy
objectives. Any assessment of shipping performance must consider
shipping qualities (regularity of services, frequency of shipping,
shipping capacity, and freight rates) and government policies as stated
in the Rencana Pembangunan Lima Tahun (REPELITA) or the Five Year
Development Plan which has been carried out by the government since
1969.
For a country such as Indonesia, shipping is undeniably important.
This is because Indonesia is the world's largest archipelagic nation,
consisting of 13,667 islands with a coastline of approximately 81,000
km. It occupies a strategic position in the international crossroads
between Asia and Australia and between the Pacific and Indian Oceans.
It stretches 6,400 km. east-west from Merauke to Sabang and 2,500 km.
north-south from the Miangas to Roti Islands. The country has an uneven
distribution of population, including many distinct ethnic groups.
Although the bulk of the population and economic activity is con
centrated in the western part of the archipelago, mostly on the island
of Java, for obvious political and social reasons the eastern archipelago
13A. D. Cooper, The Geography of Sea Transport (London: HutchinsonUniversity Library, 1972).
6
cannot be ignored. Indonesia has declared that it is an archipelagic
nation; hence, the seas among the various islands are part of the
national territory. If Indonesia is to be a true (de facto) archipelagic
nation, not merely a legal (de jure) one, the seas among the various
isl~r.ds must bind the country together, not separate it. This self
evident statement is embodied in official Indonesian policy. A central
premise of this study is that proficient and regular services of adequate
capacity are essential in achieving the government's officially stated
aims.
Scope of the Study
The purpose of this study is to examine the qualities of Indonesian
interisland shipping in achieving national policy of objectives as stated
in the REPELITA. These include an analysis of regularity of services,
frequency of shipping, shipping capacity, freight rates, and government
policy.
During the Dutch colonial era, the maritime policy was carried out
to ensure regular inter-insular communications both for administrative
and commercial purposes, to open up the outer islands for export
production, and to integrate the entire archipelago into the world
economy. In order to achieve these objectives, the government of the
Netherlands East Indies granted a monopoly of the whole interisland
shipping network to the Koninklijke Paketvaart Maatschapij (KPM) (Royal
Packet Navigation company).14 At the time Indonesia gained independence
l4Howard W. Dick, The Indonesian Interisland Shipping Industry: AnAnalysis of Competition and Regulatlon (Singapore: Instltute of SoutheastASlan Studles, 1987), I.
7
from the Dutch, the maritime policy of Indonesia was to facilitate the
achievement of national integration. Interisland shipping was frequently
used to support the defense and security of the country. At the present
time, the maritime policy of Indonesia is much broader than previously.
It emphasizes not only the achievement of national integration or socio
political unity, but also the achievement of economic unity. Therefore,
for an archipelagic nation like Indonesia with hundreds of ports
throughout the whole region, regular liner services would seem to be
an important contribution to the unity of the country. The concept of
Indonesian archipelagic status, Wawasan Nusantara, is an essential
element of this study.
Two examples may help to explain the purposes of this study. It
is possible that the Indonesian government might have decreed that
service to one or more small islands of the eastern part of the archi
pelago be made more frequent. In this case, Indonesian objectives might
be primarily economic and political; the islands need to be drawn more
closely into the Indonesian national structure, and the people of these
islands will remain isolated and underdeveloped unless they are provided
with frequent shipping connections with the core of the country. By
studying changes in shipping characteristics, it is possible to determine
whether the changes in shipping performance can be explained as a conse
quence of specific national policy objectives or as a result of a trade
off between sociopolitical and economic objectives. On the other hand,
if changes cannot be explained in terms of specific policy objectives,
it might be possible to suggest changes in shipping that would make inter
island liner services more effective in carrying out government policies.
8
It is likewise possible that frequency of sailing to an outer island
is less logical than one might think in view of the stated objectives
of the Indonesian government. In other words, it might appear that one
or more islands are being "short changed." However, it might be that
these islands have better port and storage facilities than other similar
islands--they may have container terminals, for instance--and that in
effect the cargo carrying capacity of the current service is adequate
to meet the current needs, even though the frequency of service is less
than that of the previous services. In this regard, there is need to
consider different combinations of shipping qualities in order to under
stand the effectiveness of the shipping patterns in relation to the
specific policy objectives.
Thus, the major goal of the study is to analyze whether or not the
characteristics of interisland shipping in Indonesia are a direct
reflection of the country's national policy objectives. In case these
objectives are not being met, an attempt will be made to identify the
possible existence of conflicting objectives and the reasons for the
deficiency, and to suggest possible ways in which these can be removed.
Significance of the Study
Improvements in interisland shipping services are most important
for Indonesia in two ways. First, regularity of services would permit
the movement of goods and people on schedule, with fixed and regular
departures and arrivals. Regular shipping services would therefore
enable people to organize their movements, while conversion of materials
could be planned to match the available transport movements. In addition,
----------- -
9
the government would also be able to insure regular communications and
to ensure a smooth distribution of food and other basic commodities
throughout the country. By moving goods and people from one place to
another, transport facilities stimulate economic growth at the places
and along connecting routes. Thus it can be hoped that by providing
shipping services to all regions the idea of Wawasan Nusantara might
be realized.
Second, the development of interisland shipping would enable the
government to strengthen national defense and security. In the past,
some interisland ships were used as troop carriers and for logistic
purposes by the Indonesian armed forces to suppress the Republik Maluku
Selatan (RMS) rebellion in the Moluccas in 1950-1951, the Permesta
rebellion in Sulawesi and PRRI in Sumatera in 1958. Campaigns to gain
control of Dutch New Guinea (TRIKORA) and the "confrontation" with
Malaysia were supported by interisland ships. At the present times,
frequent shipping might be used to identify threats and illegal activities
at sea.
Source of Data
The sources of Indonesian interisland shipping data are based
primarily on field work which extended over a period of five months in
Indonesia. There were interviews with government officials and shipping
company representatives pertaining to how interisland shipping serves
the needs of the nation and how shipping services carry out the national
policy objectives as stated in the REPELITA. Information on national
policy objectives was obtained by examination of official documents,
10
government development reports, commentaries by scholars both in
Indonesia and elsewhere, and interviews with government officials.
Data were obtained on scheduled regula. liner services along with
some general information relating to their capacities and annual commodity
flows. Numbers of trayek (shipping routes) and characteristics of flow
on each trayek were analyzed. Government policies and shipping regula
tions were examined. In addition, detailed shipping route maps were
prepared, indicating types of shipping in operation.
In reporting the findings, a regional description of the study area
is presented in Chapter II. Government policies and the nature of
Wawasan Nusantara are examined in Chapter III. The principal results
of the field work are given in Chapter IV, entitled "Shipping Per
formance." The major findings are presented in Chapter V, and impacts
of shipping performance, reasons for shipping deficiencies and suggestions
for improvement are identified.
CHAPTER II
REGIONAL DESCRIPTION OF THE STUDY AREA
Physical Characteristics
Indonesia consists of 13,667 islands in the equatorial zone between
94015'E and 141 005'E, and between 6008'N and 11 055'S. The western part
of the country is comprised of a group of large islands (Sumatera,
Kalimantan and Java), while the eastern part consists of a large islands
group (Sulawesi and Irian Jaya) and a smaller islands group, the West
and East Nusa Tenggara (Lesser Sunda) Islands and Ma1uku (Moluccas)
Islands. The land area is 1.92 million km2, archipelagic waters and
a 12 nautical mile territorial sea comprise 3.1 million km2, and there
is a 200 nautical mile exclusive economic zone (EEZ) of 2.7 million Km2. 1
The provincial and land areas of Indonesia are shown in Table 1 and
Figure 1. (See Appendix A and Appendix S.)
The geographical location of the archi pe1ago, with an uneven
distribution of islands and sea along the equator and the influence of
monsoonal circulation on the seasonal pattern of wind and rainfall, are
the principal determinants of climate . I d "? The Indonesian1n n oneS1a.-
1Apri 1ani Soegiarto, "The Indonesian Mari ne Envi ronment Problemsand Prospects for National Development," Prisma 39 (March 1986): 14.
2Joseph R. Morgan and Donald W. Fryer, "The Marine Geography ofSoutheast Asia," in Marine Policy in Southeast Asia, ed. George Kentand Mark J. Valencia (Berkeley, CA: Onivers1ty of California Press,1985), 13.
12
climate is characterized by two seasons. The rainy season and the dry
season alternate in accordance with north and south movements of the
equatorial low-pressure trough.
From June to September, the south monsoon induces a dry season.
At this time, atmospheric pressure over Australia is greater than that
over Asia. As a result, southeasterly winds prevail over the Indonesian
archipelago with wind-force less than 4 (13-18 miles per hour [mph] or
20-29 kilometer per hour [km/hr]), but in June they may reach wind-force
4 over the Arafura Sea. 3
On the other hand, from September to March, the north monsoon
induces a rainy season. During this period, a high atmospheric pressure
system is over Asia and the equatorial trough is over northern Australia.
Northwesterly winds prevail over the Indonesian archipelago, while south
westerly winds prevail over the region between Java and Australia. North
of the equator, strong northeasterly winds sometime exceed wind-force 5
(24 mph or 39 km/hr) in the South China and Andaman Seas. 4
April and May, and September through November, are musim pancaroba
or the transitional periods between the north and south monsoon. In
September through November "winds are generally weaker and less constant
in direction.,,5 Maps of the prevailing winds are presented in Figures
2 and 3.
The Indonesian land areas consist of coastal plains and higher
elevations, resulting in variable temperatures. In a coastal area such
as Medan (North Sumatera), the temperature in 1985 was quite high,
4Ibid., 14. 5Ibi d., 14.
13
ranging from 220C to 34°C. In a higher elevation such as Bandung (West
Java), the temperature was lower, ranging from 16°C to 28°C (Tables 2
and 3). Annual sea surface temperature in Indonesian waters are rela
tively stable, between 27°C and 29°C (Figure 4). Precipitation amounts,
however, vary widely throughout the islands. The maximum monthly rain
fall in 1985 was 873 mm (at Ambon, in May), while the minimum was 3 mm
(at Mataram, in September) (Table 4).
The prevailing monsoon winds in Indonesian waters drive the ocean
currents. During the north monsoon, currents are a continuation of the
South China Sea current that flows east of Peninsular Malaysia south
eastwards into the Java Sea. The current is deflected east to the Flores
Sea and later northeast to the Banda and Molucca Seas. In the south
of Sumatera, Java and Bali the current is normally weak, while in the
South China, Java and Molucca Seas the current is strong. The north
monsoon in the South China and Molucca Seas is referred to by navigators
and fishermen as musim utara, while in the Java, F1ores, and Banda Seas
it is called musim barat or west monsoon.
During the south monsoon or musim selatan, an east-west current
prevails and is quite strong over the Indian Ocean. In the Molucca and
Banda Seas, currents are influenced by circulation patterns of the
Pacific Ocean currents. Currents from the Pacific Ocean enter the
Molucca and Banda Seas through channels between Halmahera and Irian Jaya.
The current is deflected west to the Flores and Java Seas and then north
east to the South China Sea (Figures 5 and 6). During musim selatan,
surface currents in the Java and South China seas are generally weak,
14
while in the Molucca and Banda Seas the surface currents are strong.
Since the Indian Ocean current moves east to west during the south
monsoon, it is called musim timur or east monsoon.
An understanding of when and where the prevailing winds and currents
occur is important for navigation. Shipping accidents experienced by
Lokal (local) ships, prahus (sailing vessels), and fishing vessels in
the South China, Java, Flores, Banda, Arafura, and Molucca Seas are
generally associated with strong currents and winds, have a common
physical hazard to navigation, particularly in the eastern part of
Indonesia.
There are several maritime regions in Southeast Asian waters which
have navigational hazards associated with strong currents, storms,
shallow waters, and traffic density in poorly charted, narrow straits
and channels. The Malacca-Singapore Strait route, for instance, has
been identified by the Sailing Directions6 as the most difficult
navigational passage in the world dUI? to "shifting bottom sand," tidal
ranges, and strong tidal currents. In addition, "it is the most
important and frequently used passage from the Indian Ocean to the South
China Sea." In order to overcome navigational limitations of the
Malacca-Singapore Straits, traffic separation schemes have been applied
since May 1, 1981. "Alternatives to the Malacca-Singapore Straits are
Selat Sunda and Lombok-Makassar Straits," especially for very large
6U•S. Defense Mapping Agency (DMA), Sailing Directions (Enroute)for The Strait of Malacca and Sumatera, DMA Stock No. SDPUB 174, 2d ed.(Washlngton, D.C.: DMA Rydrographic/Topographic Center, 1982), 3.
15
tankers (VLCC). In addition to the Malacca-Singapore Straits, there
are several other straits which have navigational limitations.
Among these are Selat Sele, between Irian Jaya and SelawatiIsland (numerous dangers to navigation), Selat Sunda(strong currents and draft limited by lack of water tothe northeast), and Surabaya Strait (channel depth 7.3meters but subject to frequent change).7
In addition to those straits, Selat Capalulu, between Mangole and Taliabu
Islands, also has navigational limitations associated with narrow straits
and strong currents. Moreover, Morgan also identified other physical
hazards to navigation such as "the presence of World War II mines in
some areas" (e.g., in east Indonesia, including dumped ammunition), "the
danger from large floating logs" (e.g., on the south coast of Kalimantan,
near the Barito estuary), and
numerous uncharted oil exploration rigs and drilling platforms, particularly in the Java Sea, off the coasts ofKalimantan, in the Makassar Strait, and in the areas eastof Sulawesi and west Irian Jaya. 8
During musim utara and musaim barat, hazardous regions associated
with strong winds and currents are located around the Riau Archipelago,
Karimata Strait, Java Sea, Flores Sea, Banda Sea, and to the north of
Halmahera. Fishing and sailing by vessels less than 175 GT (500 m3)9
7Joseph R. Morgan, Navigation in Southeast Asian Waters: Physicaland Political Hazards (Honolulu, HI: Environment and POllCY Instltute,East-West Center, June 1981), 2-5.
8Ibid.,2-5.
9Thi s figure is derived from the classification of prahu and lokalshipping. According to shipping regulations, prahu shipplng includessailing vessels of less than 175 GT (500 m3 ) and auxiliary sailingvessels less than 35 GT (100 m3). Lokal shipping includes wooden and
16
in these areas are risky. Likewise, loading and unloading of cargoes
are difficult to carry out in ports located on the north coast of islands
of the Riau Archipelago and north Halmahera (Figure 5). During musim
selatan and musim timur, hazardous regions are situated in the south
of Nusa Tenggara and Java (the Indian Ocean), in the area between
Halmahera, Ceram and Irian Jaya (the Ha1mahera Sea) and on the east
coast of peninsular Malaysia (Figure 6).
Population
Indonesia's population is the fifth largest in the world, after
the People's Republic of China, India, the Soviet Union, and the United
States. In 1986, Indonesia's population was approximately 168.6 million,10with an annual increase between 1973 and 1986 of 2.26 percent. At
this growth rate, the population in 1989 is estimated to be 177.8 million,
and it will increase to 214 million in the year 2000 (Table 5; Figure 7).
Java, which accounts for 6.89 percent of Indonesia's land territory,
was inhabited by 99.8 million people in 1985, resulting in a density
of 755 persons per km2. The annual growth rate was 1.81 percent in 1980
1985. On the other hand, Irian Jaya, which accounts for 21.98 percent
of Indonesia's land area, was inhabited by 1.4 million people, giving
steel hulled motor vessels of 35 GT to 175 GT. Ships larger than 175GT of the Nusantara (archipelago) shipping can operate all the year round.See Howard w. Dick, "Prahu Shipping in Eastern Indonesia Part I,"Bulletin of Indonesian Economic Studies 11 {July 1975}: 70.
10Economic Office of ADS, Key Indicators of Developing MemberCountries of ADS (Manila: Asian Development Bank, 1987; 1988), 170-71.
17
a density of 3 persons per km2. The annual growth rate was 3.15 percent
in 1980-1985. Only 7 percent of the 13,667 islands in Indonesia are
inhabited; hence the population is unevenly distributed among islands
as well as among provinces (Tables 6, 7; Figure 8). From Tables 6 and 7
and Figure 8 it is obvious that population is concentrated in Java and
Sumatera with Jakarta the most densely populated area in Indonesia.
Difference in the level of development between Java and other islands
has resulted in an influx of population from other islands to Java.
Population mobility during the last few decades has grown rapidly with
urbanization, transmigration, and movement of people to industrialized
areas. The availability of land, air, and sea transportation has
facilitated this movement. Figure 9 indicates migration patterns of
people to industrialized areas from their places of birth in 1985. The
greatest flow occurred between Java and Sumatera, the two principal
islands of Indonesia.
Resources
Indonesia possesses considerable potential to develop agriculture
and mining resources. The most important mineral products are crude
oil, tin, bauxite, manganese, iron sand, nickel, iron ore, copper, coal,
and natural gas, while the primary agriculture estate items are rubber,
coffee, tea, cocoa, palm oil, copra, timber, and tobacco. The food crops
of Indonesia include paddy, maize, cassava, sweet potatoes, peanuts and
soyabeans. Indonesia is also a large producer of industrial goods such
as cement, fertilizer, yarn, paper, cigarettes, and handicrafts. The
distribution of resources in Indonesia is shown in Figure 10.
18
Indonesia is still predominantly an agricultural nation. Agricul-
tura1 production in 1987 totaled 108 million tons, 75 percent of which
was rice. In 1986, agricultural exports reached 1,662,800 tons, worth
US$ 1.843 million, ranking second after industrial exports and accounting
for 28 percent of the country's non-oil export earnings. l l
Though in large part an agricultural country, Indonesia has made
great progress in recent years in developing a modern infrastructure
and an industrial base, related in large measure to its abundant natural
resources. Industrial production in 1986 included 11.3 million tons
of cement, 5.7 million tons of fertilizer, 110,542 tons of paper, and
117,750 bales of yarn. In the same year, industrial exports reached
12.5 million tons, worth US$ 4.4 million or 68 percent of the total
value of non-oil exports. 12
Indonesia's economy still relies on oil, timber, and other highly
localized industries programs. Before oil prices collapsed in 1986,
oil revenues accounted for 82 percent of the country's gross export
earnings. After oil prices went down, the value of oil exports decreased
from US$20.66 million in 1981 to US$ 8.27 million or 56 percent of the
total export earnings in 1986. Oil production also went down from 585
million barrels in 1981 to 507 million barrels in 1986, and exports sank
from 78.5 million tons to 67.9 million tons. 13
llBiro Pusat Statistik (BPS), Indikator Ekonomi [Economic Indicator](April 1988): 61, 62, 92, 93.
12 Ibi d., 63, 92, 93.
12Ibi d., 68, 92, 93.
19
Indonesia has a wealth of heavy metals such as tin, bauxite, and
copper. Valuable tin deposits are mined on the Islands of Bangka,
Singkep, and Belitung, while nickel deposits are mined in Sulawesi,
copper in Irian Jaya, bauxite on Bintan Island, and coal deposits in
South Sumatera, mostly by Japanese and American multinational corpora-
tions. All these minerals may become economically important in the
Indonesian economy. Their production has increased since 1980, except
for tin and bauxite. 14
Indonesia has never relied on heavy metals production as it did
on oil. Production in 1986 included 24,049 metric tons (mt) of tin ore,
251,229 mt of copper ore, 1,553,094 mt of nickel ore, 648,815 mt of
bauxite, 1,725,356 mt of coal, 152,271 mt of iron sand, 201.46 kgs of
gold, and 2,530 kgs of silver. Total volume of heavy metals export in
1986 was 4.3 million tons or US$ 247 million in value. 15
Whether for domestic consumption or export, all these resources
and products are largely transported by sea. Similarly, almost all
import commodities reach Indonesia by sea.
Ports and Shipping Routes
The Indonesian archipelago has become one of the important trade
centers in Southeast Asia since the early seventeenth century when the
Dutch came and established the Vereenigde Oost Indische Compagnie (VOC)
14Si ro Pusat Statistik (BPS), Statistical Yearbook of Indonesia1986 (Jakarta: BPS, 1987), 281-83, 306.
15Si ro Pusat Statistik (BPS), Indikator Ekonomi [Economic Indicator](Apri1 1988): 68, 92, 93.
20
in Batavia (Jakarta) in 160i. 16 The strategic position of the ports
of Indonesia, which link their hinterlands with Southeast Asia and the
rest of the world, has meant that international shipping routes have
historically passed close by or through the archipelago.
The ports of Indonesia have grown up in response to the economic
development which has taken place in all inhabited islands of the
archipelago, mainly since the realization of REPELITA I and more
particularly since the beginning of the first oil boom era in 1973/1974.
At the present time, it is estimated that Indonesia has about 650
ports,17 264 of which are used by the Central Bureau of Statistics of
Indonesia for collecting data on interisland cargo traffic by ship sector
and by commodity group. These 264 ports are grouped into 48 maritime
regions (Figures 11, 12; Appendix C). In addition, Indonesia currently
has 16 ports for ocean-going ships; the largest ports are Jakarta and
Surabaya, which also serve as container ports. 18
Tanjung Priok (Jakarta), Tanjung Perak (Surabaya), Makassar (Ujung
Pandang), and Be1awan (Medan) have been well known as the main gateway
16The VOC was a private stock company empowered to trade, maketreaties, build forts, and operate courts of law in all the East Indieslands. Hence, the VOC was no longer simply a company of traders buta potential maritime power with its military strength made it a formidabletrading rival. See Zainu'ddin, A Short History of Indonesia (Sydney:Cassel, 1968).
l7George Lauriat, "Shipping," in Marine Policy in Southeast Asia,ed. George Kent and Mark J. Valencia (Berkeley, CA: Onlverslty ofCalifornia Press, 1985), 193.
18National Development Information Office, "REPELITA IV Plans MajorExpansion of Transport and Communication Sector," Indonesia DevelopmentNews 8 (September 1984): 5.
21
ports of Indonesia since 1982.19 The establishment of Jakarta as the
major trading port by the Dutch was motivated by the proximity of the
spot to international trade routes, even though its location made it
less suitable as a centrai port of the archipelago. Surabaya, on the
other hand, is more central than Jakarta, while Ujung Pandang has always
been the focal point of trade in the eastern half of the archipelago
since pre-colonial days and Medan has been a geographically advantaged
port because of its location on the Ma1acca Strait, one of the most
important channels of world traffic.
Figure 11 shows the uneven distribution of ports throughout the
archipelago. Most of them are concentrated along the east coast of
Sumatera, the north coast of Java, the west coast of Sulawesi, and the
south coast of Kalimantan. The concentration of ports is primarily
around several trade centers such as Medan, Singapore, Surabaya, and
Ujung Pandang. On the other hand, ports of east Indonesia are scattered
on many islands, an indication that interisland trade is heavier in the
western part than in the eastern part of the archipelago.
Interisland shipping routes are of primary' significance in Indonesia,
as they provide the most effective way of transporting large volumes
of commodities (general and bulk cargo) fr-om island to island. More
than 70 percent of dom~stic cargoes were transported by ships in 1984
(Table 12).
The development of liner shipping routes in Indonesia began in 1864,
when the Netherlands East Indies government granted financial support
19Ministeria1 Decree No. KM.113/HK.207/Phb-82 of 29 March 1982.
22
to W. Cores de Fries, a Dutch naval officer, to open shipping routes
linking 16 ports of Java, Sumatera, Kalimantan, Sulawesi, Nusa Tenggara
and Maluku (Figure 13). These routes were then contracted to the
Nederlandsch-Indie Stoomvaart Maatschapij (NISM), a company owned by
the British India Steam Navigation Co., but sailing under the Dutch
flag. 20 The rapid replacement of sail by steam after the opening of
the Suez Canal in 1869 accelerated the growth of interisland shipping
network in Indonesia. In 1888, the NISM's network covered approximately
90 ports, one of which was Fak-Fak, one of Irian Jaya's ports (Figure 14).
In 1891, three years after its establishment, the Koninklijke Paketvaart
Maatschapij (KPM) served more than 100 ports of Indonesia (Figure 15).
The KPM held a monopoly of the whole interisland network based on the
Great Archipelago Contract between The Netherlands East Indies government·
and the KPM. 21 Hence, the KPM carried practically all interisland
cargoes, passengers and mail, apart from a small amount carried by Prahus
and small Chinese steamers. In 1940, it served about 64 regular routes
connecting more than 140 ports (Figure 16).22 These routes became the
basic pattern of the present-day shipping routes (Figures 25-28).
20H. C. Darby, Netherlands East Indies, Geographical Handbook Series(Cambridge: Naval Inte111gence Olvlsion, 1944), 442.
21Howard W. Dick, The Indonesian Interisland Shipping Industry,An Analysis of Competitlon and Regulation (Slngapore: Instltute of Southeast ASlan Studles, 1987), 13, 38 no. 30.
22M. G. de Boer and J. C. Westermann, Een Halve Eeuw Paketvaart,1891-1941 [A Half Century of Royal Packet Nav;gatlon Company] (Amsterdam:de Bussy, 1941), Bij1age 5, Bijlage 7.
23
The Regions
Varying climate conditions, differing degrees of land capability,
abundance of natural resources, location of the archipelago across
important trade routes, and unevenness in population density from
island to island have long influenced interisland shipping and trade
in Indonesia. Between 1983 and 1984, the total volume of cargoes carried
by interisland ships increased by 18 percent per year (Table 8; Figure 17)
and consisted of such commodities as rice and other agricultural
products, animal feeds, fertilizers, paper, texti1es,sa1t, cement, crude
oil, and oil products (Table 9). Table 9 and Figure 18 illustrate that
crude oil and oil products ranked first (46 percent) in interisland cargo
movement in 1984, while food, cement, and wood and wood produr ~s each
accounted for 6 percent of the total volume of interisland cargo.
Based on interisland cargo data, the principal production areas
of Indonesia were in order East Kalimantan, Central Java, Riau, East
Java, South Sumatera, North Sumatera, Jakarta, and West Java. The
consumption areas consisted of Central Java, East Kalimantan, Jakarta,
East Java, North Sumatera, Riau, West Java, South Sulawesi, and South
Sumatera (Table 10; Figure 19). From Table 10 and Figure 19 it is
obvious that Central Java, East Kalimantan, Jakarta, Riau, and East Java
have been dominant.
Of the four production and consumption areas of Java: West Java,
Central Java, East Java, and Jakarta, the first three are well known
as agricultural production centers. Between 1981 and 1985, these areas
had the highest food crop production in the country, with rice and
cassava dominating (Table 11; Figure 20).
· 24
Light manufacturing and industrial areas are usually close to big
cities such as Jakarta, Semarang, and Surabaya, which have good trans-
portation systems and access to port facilities. Jakarta-Bogor
Tangerang-Bekasi (JABOTABEK) and Gresik-Bangka1an-Mojokerto-Surabaya
Sidoarjo-Lamongan (GERBANG KERTOSUSILA) are good examples of industrial
regions in Java (Figure 21). Industry in Java includes oil refineries,
fertilizers, cement, steel, timber, and wood processing. Light manu-
facturing focuses on furniture, shoes, textiles, drugs, cigarettes, and
automobile assembly plants.
Trade between production and consumption areas in Java depends upon
overland transportation. Java has adequate land transportation connecting
all major ports with their hinterlands. Highways, however, strongly
compete with rail lines for freight and passengers. Furthermore, the
development of road/ferry transport connecting Java with Sumatera,
Madura, Bali, Lombok, and Sumbawa has resulted in increased competition
between sea and road transport for general cargo and passengers. How-
ever, interisland shipping still plays an important role in transporting
bulk cargo 23 and in connecting Java with the rest of the archipelago.
According to the Department of Communications, in 1984 shipping trans-
ported 70.5 percent of the total cargo, and land transportation carried
29.5 percent. With respect to the transportation of passengers, sea
transportation carried only 2 percent, buses and taxis 82.5 percent,
railways 8.5 percent and aircraft 7 percent of the total passengers
(Tab1e 12).
23Howard W. Dick, "Interisland Shipping: Progress, Problems andProspects," Bulletin of Indonesian Economic Studies 21 (August 1985): 111.
25
Sumatera, the second largest island of Indonesia, supports a much
smaller population than Java. In 1985, approximately 20 percent of the
total population lived in eight provinces of Sumatera: Daerah Istimewa
Aceh, North Sumatera, West Sumatera, Riau, Jambi, South Sumatera,
Bengkulu, and Lampung (Tables 6, 7). Sumatera was a rice surplus area
in 1985 (Table 13; Figure 22), and it is also an important producer of
exportable agriculture, mineral, and industrial products.
Transportation of these products and the ~obility of people have
increased substantially since the development of the Trans-Sumatera
Highway and road/ferry system, which links the production areas of
Sumatera with the core of the country, Java. Since a large part of this
highway goes along the northern part of Sumatera, it does not cover
production and consumption areas in the south. The north and the south
areas are connected by long and winding roads through Bukit Barisan (the
Barisan Mountains). The Barisan mountain range, along the southern part
of the island, has always been a major barrier to the movement of both
geneial und b~1k c~~goes. In consequence, a large-volume of cargo move
ment between the north and the south areas or between the south areas
and Java is almost always carried by sea transport. Thus, shipping plays
an important role in the economy of the southern part of Sumatera,
including Kepulauan Mentawai (Mentawai Archipelago). Even though the
development of the Trans-Sumatera Highway has created competition between
road and sea transports along the north coast of Sumatera, the trans
portation of general and bulk cargoes from Sumatera to Kepulauan Riau,
Singapore, Penang (Malaysia), Kalimantan, Sulawesi, and other islands
which do not have road/ferry transportation systems is still dominated
by ships.
26
Kalimantan is the Indonesian part of the World's third largest
island, Borneo, covering 539,460 km2 or about 28.10 percent of Indonesia's
land area. Approximately eight million people occupied this land in
1985 (Tables 6, 7). The land area is divided into four provinces: West
Kalimantan, Central Kalimantan, South Kalimantan, and East Kalimantan.
Pontianak, Palangkaraya, Banjarmasin, and Samarinda are the respective
capital cities. These cities and their surroundings are the principal
consumption centers of Kalimanatan.
In 1985, Kalimantan had a rice surplus (Table 13). However, some
of its demand for vegetables was supplied from other islands, particularly
Java and Sulawesi ,24 because it had the lowest vegetable production in
1984 (Table 14). Kalimantan is also an important producer of timber,
rattan, coal, oil, and liquified natural gas (LNG). The main lines of
communication, especially between resource areas or hinterlands and
ports, are rivers. Coasters plying between the river mouths and small
aircraft are also intensively used. There are no railways, and the four
limited road systems in the capital cities are not reliable. The
cheapest way of transporting goods and passengers is through rivers such
as the Mahakam, Barito, Kapuas, and Kahayan, four of the largest and
most travelled. Communication and trade with other islands also rely
on water transport, i.e., interisland shipping. In this regard, prahu
shipping contributes significant services in the transportation of
24Bi ro Pusat Statistik (BPS), Interisland Cargo Traffic by CommodityGroup, Region of Origin and Region of Destination 1984 (Jakarta: BPS,1985), X", no. 11(4), 94-95.
27
general dry cargo and ti~ber,25 particularly on the routes between South
Kalimantan (Banjarmasin) and Java (Jakarta, Semarang and Surabaya).26
The Island of Sulawesi lies east of Kali~antan, separated from it
by the Makassar Strait. It consists of four provinces (North Sulawesi,
Central Sulawesi, Southeast Sulawesi, and South Sulawesi) located on
four long narrow peninsulas. It covers an area of 189,216 km2 or 9.85
percent of the national territory. Approximately 7 percent of the total
population of Indonesia resides on the Island of Sulawesi (Tables 6, 7).
The island is basically self-sufficient in agriculture. It had a rice
surplus of 1,373,330 tons in 1985 (Table 13). Large quantities of
cloves, copra, and timber are shipped by interisland vessels to
Surabaya27 as the raw materials for clove cigarettes, coconut oil,
plywoods, furniture, and housing. Prahu shipping carries some of these
cargoes, including rattan, from South and Southeast Sulawesi to Java,
particularly to Surabaya. On return voyages, prahus carry general cargoes
such as electronic goods and textiles. Because of the mountainous nature
of the island, distribution of general and bulk cargoes between penin
sulas is much cheaper and less risky by sea than by land. Perhpas for
this reason, a comprehensive and adequate land transportation system has
250avid Hughes, "The Prahu and Unrecorded Interisland Trade,"Bulletin of Indonesian Economic Studies 21 (August 1986): 103-13.
26Bi ro Pusat Statistik (BPS), Interisland Cargo Traffic by CommodityGroup, Region of Origin and Region of Destlnatlon 1984 (Jakarta: BPS,1986), XlV no. 18(1-5), 157-58.
27Ibi d., xiii no. 8(1-5), xiv no. 12(1) and 18(1-G), 67, 103, 157.
- -- ---------------------------------
28
not yet developed, although there is an incomplete Trans-Sulawesi Highway
connecting Ujung Pandang and Manado (Figure 23) and a limited number
of roads between ports and their hinterlands or production areas in the
four provinces of Sulawesi. Among these production areas are Soroako
in South Sulawesi (nickel), Baubau in Southeast Sulawesi (asphalt),
Parigi in Central Sulawesi (copra) and Manado (cement) and Bitung (tuna
and skipjack) in North Sulawesi. Most frozen tuna and skipjack are
exported to Japan by sea, while fresh chilled tunas are exported by air
through Manado. These fish commodities are also produced in Ma1uku and
Irian Jaya.
Ma1uku (Moluccas) consists of approximately 1,000 islands, varying
in size from small coral reefs to islands as large as Ceram and Ha1mahera.
The total land area of these islands is about 74,505 km2, with a popula
tion of 1.62 million in 1985. Irian Jaya forms the western portion of
New Guinea, the world's second largest island. It occupies 421,981 km2
or 21.98 percent of Indonesia's total land area, with 1.38 million people
living on it in 1985 (Tables 6, 7).
Maluku and Irian Jaya are surrounded by deep sea areas such as the
Pacific Ocean and the Ma1uku, Ha1mahera, Banda, Flores, Timor, and
Arafura Seas. Even though aircraft are used in Ma1uku and Irian Jaya,
transportation of goods and people from one island to another still
largely depends on interisland shipping.
The islands of Ma1uku grow spices. In fact, Ma1uku has been an
important originator of interisland commerce in spices since the colonial
era. Other products of Ma1uku are copra, sago, timber, tuna, skipjack,
shrimp, and pearls, while products of Irian Jaya include copra, copal,
29
nutmeg, maize, tuna, skipjack, shrimp, copper, and oil (Figure 10).
These islands receive foodstuffs, particularly rice (Table 13), and
manufactured goods from other islands, especially Java (Jakarta and
Surabaya) . 28
Bali and Nusa Tanggara (the Lesser Sundas) are a group of islands
stretching east-west from Timor to Bali. Wetar and Leti Islands are
geographically a part of Nusa Tenggara, but administratively a part of
Ma1uku Province. Bali and Nusa Tenggara are divided into four provinces:
Bali, West Nusa Tenggara, East Nusa Tenggara, and East Timor. Total
land area is 88,488 km2, with a population of approximately 9.4 million
in 1985 (Tables 6, 7). Bali and Lombok are the most densely populated
areas in the region. These two islands are considered the rice basket
for the entire region. Rice is distributed by road/ferry transport from
Lombok to Sumbawa and by interisland shipping from Bali and Lombok to
East Nusa Tenggara, and even to Ma1uku and Irian Jaya. 29 A good road/
ferry transport system connecting Java, Bali, Lombok, and Sumbawa has
increased not only the flow of rice, but also other trade commodities
and people as well. Imported goods from Java are paid for by the export
of coffee, cattle, horses, dried squid, and miikfish fries.
Even though an adequate road/ferry system has developed connecting
Lampung, Java, Madura, Bali, and West Nusa Tenggara, interisland shipping
is still the most important component of transportation in Indonesia.
28Ibid., xiii no. 4(1-2),35.
29Ib"d ...1 ., Xl 1 1 no. 4(l-2}, 35.

30
A very diverse physical and·geographical environment in the various
sections of the archipelago has resulted in great reliance on interisland
water transport for effective economic integration.
CHAPTER III
WAWASAN NUSANTARA AND GOVERNMENT POLICIES
The Nature of Wawasan Nusantara
Nationalist movement was born in 1908 with the establishment of
Boedi Oetomo. The Boedi Oetomo was a social organization aimed at,
primarily, educating people towards national consciousness. The national
consciousness of the people resulted in the 1928 Youth Pledge which
expressed the ideal of one nation, one language and one homeland (Tanah
air [tanah means land and air means water]): Indonesia. l This Youth
Pledge marked the beginning of a great effort to realize Indonesia as
one archipelagic nation by overcoming social and cultural differences
based on regional conceptions. It stated the ideal of Indonesia as one
archipelagic nation and viewed the people and national territory (land,
water and air) as an inseparable unit. Regional diversity of the people
was acknowledged as a richness and national unification have to preserve
social and cultural diversities. Thus the 1928 Youth Pledge founded
the ideal of Indonesia today--the "Unity in Diversity" of Bhineka Tunggai
Ika.
After fighting against the colonial rules of Japan and the Dutch,
Indonesia proclaimed its independence on August 17, 1945. Wheras
Indonesia struggled to defend its independence and national unity, the
lMochtar Kusumaatmadja, "The Concept of the Indonesian Archipelago,"The Indonesian Quarterly 10 (October 1982): 12.
32Dutch still desired to conquer Indonesia by practicing the politics of
divide and rule. The Dutch created several puppet states: The State
of East Sumatera, The State of South Sumatera, The State of Pasundan
(West Java), and The State of East Indonesia, in the regions which it
sill successfully occupied. 2 This was facilitated by the physical
division of Indonesia into islands separated by high seas.
The Territoriale Zee en Maritime Kringen Ordonantie 1939 (the
Territorial Sea and Maritime Ordinance of 1939) determined that each
island of Indonesia had its own three nautical mile Territorial Sea
limit, and the waters beyond it were High Seas. In consequence, the
freedom of the seas enunciated 350 years ago by a Dutch jurist, Grotius,
was applied in the High Seas, which are now Indonesian archipelagic
waters. 3 As a p01itical consequence, Indonesia was no longer a unit
envisioned by the Youth Pledge of 1928, but "simply a collection of
thousands of islands.,,4 This situation provided fertile ground for the
growth of regional separatist movements with the support of foreign
powers who used the freedom of the sea in Indonesian waters and straits. 5
The 1939 Territorial Sea and Maritime Ordinance created territorial
disintegration and threatened the integrity of Indonesians as a nation.
2Ibi d.. 13.
3Hasjim Djalal, "The 1982 Law of The Sea Convention: A SoutheastAsian Perspective," The Indonesian Quarterly 13 (January 1985):61.
4j,'ochtar Kusumaatmadja, "The concept of The Indonesian Archipelago,"The Indonesian Quarterly 10 (October 1982): 13.
5Hasjim Ojalal, "The 1982 Law of The Sea Convention: A SoutheastAsian Perspective," The Indonesian Quarterly 13 (January 1985): 62.
.33
In order to overcome this problem, the Indonesian government needed
a concept which in the short run could secure territorial integration
and a developm~ntal concept which, in the long run, could realize the
national unity of Indonesia. The concept of national territory, the
archipelagic state principle, was formulated in the Djuanda declaration
of 1957 concerning territorial waters of Indonesia. The declaration
reads as follows:
That all waters, between and connecting the islands orparts of islands, that make up the landmass of theIndonesian Republic, disregarding their breadth, are trueparts of the regional area of the Republic of Indonesiaand therefore are a part of the internal waters or nationalterritorial waters under the absolute sovereignty of thestate of the Republic of Indonesia. The innocent passageof foreign shipping in these territorial waters isguaranteed as long as, and only if, it does not conflictwith the sovereignty of the Indonesian state. The determination of territorial sea limits of a distance of 12miles measured from lines connecting the outermost pointsof the islands of the Republic of Indonesia will be securedby law. 6
Indonesia's experience as a victim of a divide and rule policy and the
implementation of a three mile territorial sea limit had made it aware
of the importance of maritime security and defense to guarantee the
integrity of the Indonesian archipelago. 7 In order to secure the seas
between islands, the seas should not be high seas. They must bind the
country together, not separate it. Therefore, they must be a part of
Indonesian national territory.
6Mochtar Kusumaatmadja, liThe Concept of the Indonesian Archipelago,"The Indonesian Quarterly 10 (October 1982): 13-14.
7Ibi d., 14-15.
34
When the 1958 Law of The Sea Conference failed to reach agreement
on the breadth of the territorial sea, the government of Indonesia made
a political decision to make the 1957 Djuanda declaration a law. In
1960, the government introduced Law no. 4/1960 concerning the Indonesian
territorial sea. This Law consists of four paragraphs which read as
follows:
1. For [the sake of] nation21 unity, regional integrityand economic unity, straight baselines are to be drawnconnecting the outermost points of the outermostislands;
2. The state has [and exercises sovereign rights] overall waters lying within these [straight] baselinesincluding the [seabed and subsoil] beneath it and theair above it with all natural resources [therein];
3. Territorial seas of 12 [nautical] miles width aremeasured from these [straight] baselines;
4. The right of innocent passage of foreign ships isguaranteed as long as it does not harm the interestsof the coastal state or interfere with its securityand order. 8
From the territorial point of view, four fundamental changes had been
made by issuing this Law. First, by encircling the archipelago with
straight baselines, the Law had enlarged the national territory of
Indonesia. Second, the three nautical mile territorial sea limit
measured from the normal baselines (low water lines encircling an island)
had been replaced by a 12 nautical mile territorial sea limit measured
from the straight baselines. Third, the waters which were previously
High Seas now became the archipelagic waters of Indonesia. And fourth,
the Law enabled the government of Indonesia to exercise its sovereign
rights Jver Indonesia's national territory and all natural resources
therein.
7Ibi d., 16-17.
- --- ------------------
35
In summary, Law no. 4/1960 decreed tha~ the seas between islands
were no longer a barrier to the integrity of the Indonesian archipelago;
they now became an integrating factor for the nation. However, the
archipelagic state principle launched by Indonesia was unilateral action
which still needed recognition from the international community. While
Indonesia's recognition of innocent passage of foreign ships through
Indonesian waters was to minimize conflict of interests between Indonesia
and the maritime powers, bilateral agreements with neighboring states
were to gain regional recognition of the archipelagic principle. 9 After
a long process of negotiation in the Third Law of The Sea Conference
(1973-1982), the archipelagic state principle eventually became a part
of the 1982 Law of The Sea Convention. The archipelagic state principle
was internationally recognized and accepted.
The territorial concept was designed to integrate not only land,
air, sea and natural resources, but also people of various social and
cultural backgrounds. The territorial concept implicitly realized the
aspirations of the 1928 Youth Pledge: Bhineka Tunggal Ika (national unity
in diversity). The national unity includes political, sociocultural,
economic, and defense and security unity.
A developmental concept for realizing the Indonesian archipelago
as a political unity, a sociocultural unity, an economic unity and a
unity of defense and security is Wawasan Nusantara.
[W]heras the archipelagic state principle is a conceptof national territory, the [Wawasan Nusantara] is a wayof looking at the [unity] of a natlon and people that
9Ibi d., 16-26.
36
subsumes the geographic reality of the archipelagic state.It can also be said that the conception of the unity ofland and seas contained in the [archipelagic stateprinciple] constitutes the physical forum for the archipelago's development. 10
It should be remembered however that both the archipelagic state
principle and Wawasan Nusantara are still concepts which are to be
implemented. Indonesians need implementing infrastructures. One of
the needed infrastructures is an integrated and coordinated sea trans-
portation system, which would facilitate a national life, in which the
progress of the society could be equalized throughout the country;
creation of steady and balanced economic growth in all regions of
Indonesia; unific~tion of many distinct ethnic groups who have different
social and cultural backgrounds; and protection of Indonesia from all
threats and illegal activities at sea.
In 1978, the Majelis Permusyawaratan Rakyat (MPR) (the People's
Consultative Assembly) issued Decree no. IV/MPR/1978, stating that
Wawasan Nusantara is the concept to achieve national development
objectives. According to Paragraph 1, Article 2 of the 1945 Constitution
of Indonesia:
[T]he ultimate authority in Indonesia's system of stateis in the hands of the people and that the structure ofits system of state is created by the MPR. The MPR isthus the ultimate state authority. Its position as theultimate state authority is reflected by the MPR'sresponsibilities according to the constitution, the mostimportant of which are the determining of the constitution,electing the president and vice-president and determiningthe Broad Guidelines to State Policy (GBHN).ll
10-b"· 251 10., •
llA. Sudiharto Djiwandono, "The General Election and PoliticalEducation," The Indonesian Quarterly 10 (October 1982): 28.
37
The formulation of Wawasan Nusantara as one of the MPR's decrees makes
Wawasan Nusantara a part of the Garis Garis Besar Haluan Negara (GBHN)
and an expression of the needs of the people. 12 Since the GBHN expresses
only basic state policy, the policy objectives of national development
based on the Wawasan Nusantara have to be clarified by the government
of Indonesia in the REPELITA.
Government Policies
According to the GBHN, the Indonesian national development program
will be carried out on a long term basis, including at least five to
six REPELITA. 13 Indonesia is now in the first stage of the Fifth
REPEL ITA (1989/90-1993/94).
Government policy in the First REPELITA (1969/70-1973/74) emphasized
the rehabilitation of the national economy which was left in a poor
condition by the Soekarno regime. The development of agriculture,
infrastructure, and industries was given primary attention. 14 The
primary objective of agricultural devev10pment was to increase food
production towards self-sufficiency.
In the Second REPELITA (1974/75-1978/79), economic development was
continued as a central priority with agricultural, rural, and regional
120epartment of Information, Indonesia 1988, An Official Handbook(Jakarta: Percetakan Negara R.I., 1988), 112-13.
13Ibid., 113.
140epartemen Penerangan, Rencana Pembangunan Lima Tahun Pertama1969/70-1973/74 [The First Five Year Development Plan 1969/70-1973/74],vol. 1 (Jakarta: Percetakan Negara R.I., 1969).
· 38
development dominating. Specific objectives of the second plan were
to provide people with better food, clothing and housing, and greater
employment opportunities. Education, primary health care, family
planning, infrastructure, and industry received greater attention than
in the First REPELITA. 15
Like the first two REPELITA, the Third REPELITA (1979/80-1983/84)
continued a focus on economic growth and national stability, but gave
more attention to an equitable distribution of national economic benefits.
Thus government policies in the Third REPELITA emphasized three funda
mental objectives which were called the Trilogi Pembangunan (the Trilogy
of Development). These included: 16
1. To increase an equitable distribution of development;
2. To achieve a sufficiently high economic growth;
3. To improve a healthy and dynamic national stability.
The first objective of the Trilogi Pembangunan would be achieved
through Delapan Jalur Pemerataan or Eight Distribution Channels: 17
1. Equitable distribution of access to means of fulfillingbasic human needs, particularly food, clothing andshelter;
15Departemen Penerangan, Rencana Pembangunan Lima Tahun Kedua 1974/75-1978/79 [The Second Five Year Development Plan 1974/75-1978/79],vol. 1 (Jakarta: Percetakan Negara R.I., 1974).
16Departemen Penerangan, Rencana Pembangunan Lima Tahun Ketiga1979/80-1983/84 [The Third Five Year Development Plan 1979/80-1983/84],vol. I (Jakarta: Percetakan Negara R.I., 1979), 19.
17Ibi d., 20.
39
2. Equitable distribution of access to education andhealth services;
3. Equitable distribution of income;4. Equitable distribution of employment opportunities;5. Equitable distribution of access to business
opportunities;6. Equitable distribution of access to participation
in development. particularly for young generationand women;
7. Equitable distribution of development effortsthroughout the country;
8. Equitable distribution of access to obtainjustice.
Equitable distribution of development would be impossible to achieve
without national stability. Thus, national stability, i.e., socio-
political and economic stabilities. was a prerequisite to the implementa-
tion of the eight distribution channels. Indonesia's experiences of
the 1950s through the mid-1960s indicated that territorial disintegration.
political instability, and economic stagnation had made integrated
development of the entire archipelago difficult to carry out,18 and had
threatened the national unity of the country.
In the Third REPELITA.sociopolitical stability would be improved
by strengthening the unity of the nation, while economic stability would
be accomplished by increasing economic growth in all development sectors. 19
In this respect, Wawasan Nusantara, national stability and national
1800nald W. Fryer. Emerging Southeast Asia. A Study in Growth andStagnation (London: George Ph,l,p and Son, 1970), 358-60.
190epartemen Penerangan, Rencana Pembangunan Lima Tahun Keempat1984/85-1988/89 [The Fourth Five Year Development Plan 1984785-1988789],vol. 1 (Jakarta: Percetakan Negara R.I., 1984), 20-25.
40
development constitute a hierarchy prominent in Indonesian sociopolitical
and economic thinking. Wawasan Nusantara determines how national unity
should be realized, and the strength of national unity will lead to the
improvement of national stability, which is an important precondition
for development.
National development in the Fourth REPELITA (1984/85-1989/90) is
basically an improvement of what has been achieved in the Third REPELITA.
The Trilogy of Development is still reflected in government policies.
Specific government policy objectives of the Fourth REPELITA were to
improve standards of living and welfare of the people, to increase
agricultural production towards self-sufficiency in food, to increase
industrial capabilities, and to construct a strong foundation for the
next REPELITA. The equitable distribution of development would still
be carried out through the eight distribution channels, while the
increase in economic growth rate would be achieved by increasing
production and services in various development sectors such as agricul
ture, industry, mining, energy, communication," and trade. In this regard,
the enlargement of employment opportunities would always be taken into
consideration. 20 Because of the collapse of oil prices in 1986, a
special prominence is given to increasing the production and improving
the competitiveness of non-oil commodities so that the national dependence
on oil revenues can be reduced. It should be pointed out here that along
with economic development, political and sociocultural development and
development of defense and security are also being improved.
20Ibid., 17-25.
41
From the implementation of four REPELITA it is obvious that govern
ment policy objectives emphasize growth, equity and stability, and these
policy objectives can be divided into two broader objectives: economic
and sociopolitical. To achieve a sufficiently high economic growth
rate, for instance, is clearly an economic objective, whereas to increase
an equitable distribution of development and to promote national
stability are more sociopolitical than economic.
As mentioned earlier, a sufficiently high economic growth rate will
be achieved by increasing production and services in various development
sectors. If production in various development sectors increases, it
is assumed that the volume of cargo flows and transportation services
from production to consumption centers will also increase. A large
volume of interregional cargo is expected to bring about trade inter
dependence. From the viewpoint of interisland shipping, trade inter-
dependence can be measured by the volume of cargo flows, frequency of
shipping and regularity of services.
"Derived sociopolitical objectives" are dependent on the socio-
political objectives formulated in the Trilogy of Development. The
"derived sociopolitical objectives" include "those factors leading to
consolidation and internal cohesion of the country--politically and as
society.,,2l
With regard to improvement of national stability, three factors
which can lead to strengthening the national unity are identified. These
21Sa1vatore Comitini and Sutanto Hardjo1ukito, Indonesian MarineFisheries Development and Strategy Under Extended Marltlme Jurisdiction(Ronolulu, HI: Environment and Policy Institute, East-West Center, 1983),48-51.
42
are sociocultural exchange, frequent shipping to remote islands, and
national defense and security.
Much of our social and cultural unity is based upon theexistence and adequate transportation. Society is a blendof many regional and local viewpoints and traditionsgrowing out of differing heritages, environments, andproblems. Interregional contacts through travel and theexchange of goods promote the interchange of ideas andthe breakJown of parochialism, thus encouraging an upwarduniformity in tastes, health, education, and way of lifein general. 22
The above quotation indicates that trade interdependence is a factor
in promoting sociocultural exchange. Moreover, if trade expansion
reaches remote and economically weak areas, it will be able to open and
develop these areas into new centers of economic, social, and govern-
mental administration. Frequent shipping to these areas makes unification
administratively feasible. Furthermore, frequent and regular shipping
to all regions of the archipelago means that shipping has the capability
to support national defense and security by supplying troop carriers
and logistic suppliers in war time. In peace time, it can be used to
identify threats and illegal activities at sea. 23
In summary, government policy objectives stated in the four REPELITA
can be grouped into two broader objectives, economic and sociopolitical.
With respect to interisland shipping, several "derived objectives" can
be obtained from these two broad objectives. The "derived objectives"
consist of:
22Roy J. Sampson, Martin T. Farris and David L. Shrock, DomesticTransportation: Practice, Theory and Policy, 5th ed. (Boston, MA:Roughton Mlff1in, 1985), 3-4.
23Ibi d., 3-4.
43
1. "Derived economic objectives":a. Increased interisland cargo flows;b. Improved trade interdependence.
2. "Derived soctopo l i t tcal objectives":
a. Increased distribution of basic human needs;b. Increased distribution of basic commodities
for development;c. Improved sociocultural exchange between regions;d. Increased frequency of shipping to remote areas;e. Strengthened national defense and security.
Shipping Regulations
Shipping regulations are important elements of government policies,
which are made at the operations1 level. Policy making at the conceptual
or highest level is undertaken by the MPR, which meets only once every
five years to formulate and ratify the GBHN. The GBHN is the basis for
government to formulate the REPELITA at the semi-conceptual or semi
operational level. The REPELITA sets out government policies and policy
objectives for each development sector and provides the overall framework
within which operational decisions are made by each development sector.
Thus, shipping regulations are operational instruments of government
policies in the shipping sector. 24
From the First and subsequent REPELITA, it is evident that shipping
is of strategic importance in supporting sociopolitical and economic
24For summary of the relationships between regulation and publicpolicy see H. David Bess and Martin T. Farris, U.S. Maritime Policy,History and Prospects (New York: Praeger, 1981), 1-2; Frederlck Thomsonand L. R. Jones Regulatory Policy and Practices, Regulating Better andRegulating Less (New York: Praeger, 1982), 8-17; Charles S. Bullock III,James E. Anderson and David W. Brady, Public Policy in the Eighties(Belmont, CA: Brooks/Cole, 1983), 2-5.
44
development to increase the overall living standard of the Indonesian
people. In the first three REPELITA, the government's main concern in
the shipping sector was to rehabilitate shipping fleets and port
facilities which had been neglected for years by the former government.
In addition, the government also extended interisland shipping networks
to areas of development potential and to remote and economically weak
areas. By extending these shipping networks, the government could ensure
a smooth distribution of basic human needs and commodities for develop
ment throughout the country.25 The Fourth REPELITA emphasized development
of interisland shipping capacities and port facilities, extension of
interisland shipping networks, and regional integration of inter-marine
transportation mode system. 26 Specific objectives to be achieved by
government in the shipping sector were to smooth and increase the flow
of goods and people, to make shipping services available to every island,
particularly the remote ones, and to realize equitable distribution of
development gains throughout the country.27
During the implementation of the four REPELITA, various government
regulations were enacted for the development of the interisland shipping
250epartemen Perhubungan, Rencana Pembangunan Lima Tahun KeempatOepartemen Perhubungan 1984/85-1988789 [The Fourth Flve Year DevelopmentPlan of The Department of Communicatlons 1984/85-1988/89] (Jakarta:Oepartemen Perhubungan, 1984), 64-68.
260irector General of Sea Communications, Perhubungan Laut [SeaCommunications], Paper presented at the Workshop of the Department ofCommunications, Jakarta, Oecember 16-18, 1985, 24-25.
270 L" T h K tepartemen Perhubungan, Rencana Pembangunan lma a un eempaOepartemen Perhubungan 1984/85-1988789 [The Fourth Flve Year DevelopmentPlan of The Department of Communications] (Jakarta: Oepartemen Perhubungan, 1984), 64-68.
45
industry. These include port regulations, trayek or shipping route
regulations, and freight rate regulations. A broad outline of Indonesian
shipping was laid down in the Scheepvaartwet 1936 or the Shipping Act
of 1936.28 Since it was an outline and was produced decades ago during
the Dutch colonial rule, its implementation has to be revised by govern-
ment regulations.
Government Regulation No. 2 of 1969
Legislation pertaining to sea transportation is embodied in Govern-
ment Regulation No.2 of 1969 (PP2/1969), which forms the basis for
shipping operations and exploitation. It classifies Indonesian ports
into two categories: sea and coastal ports. Sea ports are opened for
foreign trade (export and import). Coastal ports are not generally
opened for foreign trade, even though some of them may be opened for
limited foreign trade (export of certain commodities) based on joint-
ministerial decrees issued by the Minister of Communications, Minister
of Finance, and Minister of Trade. PP2/l969 also defines two basic
categories of shipping: domestic shipping and overseas shipping.
Domestic shipping consists of Pelayaran Nusantara (archipelago shipping),
Pelayaran Lokal (local shipping), Pelayaran Rakyat (prahu or proa
shipping), Pelayaran Pedalaman, Terusan dan Sungai (inland waterway
shipping),29 Pelayaran Penundaan Laut (tug and barge shipping), and
28For detailed contents of the Act see Direktorat La1u LintasAngkutan Laut, Himpunan Peraturan Angkutan Laut Tahun 1969-1975 [ACollection of Shipping Regulations 1969-1975J (Jakarta: DlrektoratJenderal Perhubungan Laut, 1986), 1-13.
29In1and water way shipping in Indonesia is managed by DirectorateGeneral of Land Transportation.
46
'Pelayaran Khusus Dalam Negeri (special/bulk shipping-domestic service).
Overseas shipping includes Pelayaran Samudera Dekat (short distance ocean
shipping), Pelayaran Samudera (ocean shipping), and Pelayaran Khusus
(special/bulk shipping-ocean service).30
According to Article 5 of PP2/l969, Pelayaran Nusantara is inter-
island shipping which is designated to provide regular services to all
ports in Indonesia. Pelayaran Lokal is interisland shipping which is
designated to carry out regular services on a regional basis and to
provide feeder services to Pelayaran Nusantara and overseas shipping.
Pelayaran Rakyat is interisland shipping using prahus or sailing vessels.
Pelayaran Pedalaman, terusan dan sungai is shipping services which are
carried out in inland waters (waterway, river and lake). Pelayaran
Penundaan Laut is interisland shipping using barges towed by tug-boats.
Pelayaran Khusus Dalam Negeri is interisland shipping using special
ships to carry special cargo (liquid and dry bulk cargoes). Pelayaran
Samudera Dekat is overseas shipping which serves routes between
Indonesian ports and ports of neighboring states, provided that the
distance from the outerlfiost seaport of Indonesia is not more than 3,000
miles. Pelayaran Samudera is overseas shipping on voyages and inter-
national route of more than 3,000 miles. Pelayaran Khusus Luar Negeri
is overseas shipping using special ships to transport special cargoes. 31
30Direktorat Lalu Lintas Angkutan Laut, Himpunan Peraturan AngkutanLaut Tahun 1969-1975 [A collection of Shipping Regu!atlons 1969-1975J(Jakarta: 01rektorat Jenderal Perhubungan Laut, 1986), 46-71.
310irektorat Jenderal Perhubungan Laut, Petunjuk Angkutan LautIndonesia 1986 [Indonesian Shipping Directory 1986J (Jakarta: c. v.$andaan, 1986), 23.
47
Additional articles of PP2/l969 cover the requirements of shipping
companies, route patterns, and operational aspects which have a close
linkage to port operations. In order to obtain a Nusantara shipping
license, a domestic company should be Indonesian; it has to have at least
two vessels with a total gross capacity of 3,000 m3, and these vessels
should be of Indonesian registry; it also has to have sufficient capital,
and as an interisland shipping liner, it is not allowed to charter
foreign ships. However, if the available domestic tonnage is not
sufficient, the charter of foreign ships is permitted. Although
Nusantara shipping is designated as interisland liner shipping, in an
urgent situation the Minister of Communications may grant Nusantara
shipping companies permission to deviate from their existing routes.
This dispensation is made possiblG by PP2/l969 so that the government
can ensure a smooth distribution of basic human needs and basic
commodities for development throughout the country. The owner of a
Nusantara shipping company must be an Indonesian citizen who lives in
Indonesia. The reason behind this policy is that if national shipping
is not owned by Indonesians, it will be difficult to mobilize the
national shipping fleet to achieve important objectives related to
national defense and security. In this regard, national shipping has
been viewed by the government as a reserve for national defense and
security.32 Furthermore, the prohibition of foreign vessels operating
in Indonesian waters will protect domestic shipping companies from
competition.
32 Ibi d., 20-50.
---- --- ~- - ----
48
For overseas shipping, the company must own at least two ships with
a total gross capacity of 28,000 m3. It is allowed to charter foreign
ships, provided that the charter is made on a long term basis. It is
also permitted to make a joint-venture with a foreign shipping line,
with government approval. A foreign liner is allowed to carry cargo
directly to designated Indonesian ports, provided that it is registered
with a designated Indonesian shipping agency. Such agencies are required
to provide the government with full details of services operated by their
clients, including name and type of vessel, ports of call, and type and
volume of cargo. Foreign vessels calling at Indonesian ports are not
allowed to engage in interisland trade. Other requirements are that
shipping schedules and freight rates of both interisland and ocean-going
ships have to be made pUblic by the respective companies.
Shipping companies are not allowed to load and unload their own
cargo. Loading, unloading and delivering cargo from ships to the godown
should be done by the stevedoring companies, while the godown is run by
warehousing companies. Likewise, distribution of cargo from and to the
godown should be carried out by freight forwarding companies. The
government has the right to inspect ships to insure that companies comply
with requirements stated in the regulations.
In its closing articles, PP2/l969 stated that all other shipping
matters which have not yet been sufficiently regulated in this regulation
would be decreed by the Minister of Communications or other appointed
government officials. 33
33 Ibi d., 20-50.
49
Port Regulations
Following PP2/1969, several decrees on interisland shipping have
been issued by the Minister of Communications, Minister of Finance,
Minister of Trade, and Director General of Sea Communication. Between
1969 and 1974, five joint-ministerial decrees on the opening of a number
of sea ports and coastal ports for foreign trade were issued by the three
Ministers. 34 In order to strengthen the Indonesian cabotage policy,
the 1969 joint-ministerial decrees reviewed and revised the status of
all sea ports and some coastal ports which are opened for foreign trade.
These decrees designated 50 sea ports for general foreign trade, 37
coastal ports for export of certain commodities, and six sea ports for
general foreign trade with transshipment at Singapore (Appendix D).
Special priority of services in these ports, however, should be given
to national liner shipping, particularly to companies which were members
of Badan Operasi Bersama Pelayaran Nusantara (BOPBERPAN) or the Inter
island Shipping Combined Operations Board. 35 In 1982, four of those
sea ports, Belawan (Medan), Tanjung Priok (Jakarta), Tanjung Perak
(Surabaya), and Makassar (Ujung Pandang), were designated by Ministerial
Decree No. KM.113/HK.207/Phb-82 as the main gateway ports of Indonesia.
All non-oil commodity exports have to be shipped from these ports. As
34Direktorat Lalu Lintas Angkutan Laut, Himpunan Peraturan AngkutanLaut Tahun 1969-1975 [A Collection of Shipping Regulatlons 1969-1975](Jakarta: Direktorat Jenderal Perhubungan Laut, 1986), 149-54, 168-69,196, 227, 310-11.
35Joint-Instruction of Minister of Communications and Minister ofFinance No. M.8/2/19 Mphb. and No. INS-Ol/MK/2 of 1969.
-------------------------------------------- --------
50
a result of limited entry/exit for forei9n ships to certain Indonesian
ports, imported cargoes, particularly those which were financed and owned
by the government, have to be transshipped to carriers flying the
Indonesian flag for distribution to their final destination. Since
Presidential Instruction No.4 of 1985 (INPRES 4/1985) was issued, all
non-oil commodity exports are allowed to be shipped from 41 sea ports,
34 coastal ports, and 42 special coastal ports (Appendix E). In addition,
all foreign merchant ships are allowed to call at any of the 41 desig-
nated sea ports as stated in their agreement with the Indonesian shipping
agency. The issuance of INPRES 4/1985 has brought about deregulation
of port activities which retard the flow of commodities.
In 1980, the Minister of Communications introduced Ministerial
Decree No. KM.322/AL.005/Phb-80 concerning efforts to increase port
services. Twenty-six ports with A, B, and C classifications were to
serve 24 hours a day. Ni ne "A" ports had to provi de pil ot servi ces for
the entry/exit of ships and to provide for loading and unloading cargo,
while three "B" ports had only to load and unload cargo. It was not
mandatory for 14 "c" ports to operate 24 hours a day, except if needed.
"A" ports included Belawan, Teluk Bayur, Dumai, Panjang, Tanjung Priok,
Sunda Kelapa, Cilacap, Tanjung Perak, and Benoa. "B" ports consisted
of Pakan Baru, Palembang, and Pontianak. "c" ports included Tanjung
Pinang, Jambi, Cirebon, Semarang, Meneng, Kupang, Banjarmasin, Balikpapan,
Ujung Pandang, Kendari, Bitung, Pantoloan, Ambon, and Jayapura. 36
36Direktorat Lalu Lintas Angkutan Laut, Himpunan Peraturan AngkutanLaut Tahun 1975-1983 [A Collection of Shipping Regulatlons 1975-1983](Jakarta: Oirektorat Jenderal Perhubungan Laut, 1986), 197-98.
51
In 1981, the Director General of Sea Communication issued Decree
No. DPP.30/1/16 to implement the above Ministerial Decree. In order
to facilitate the flow of interisland and export/import commodities,
this Decree reemphasized the importance of 24 hour daily services in
the 26 designated ports, regardless of their classifications. Daily
loading and unloading cargo in those ports was divided into two working
shifts. By employing two working shifts it was expected that produc
tivity of loading and unloading cargo in Belawan, Jakarta, and Surabaya
each would reach 1,000 tons of ocean cargo per vessel per day, 600 tons
of interisland cargo per vessel per day, and 1,500 tons of bag-cargo
per vessel per day (Table 15). The Decree also made several changes
for the better use of the first line godaown. The operation of the first
line godown, which was previously operated by warehousing companies,
and loading and unloading cargo, which were formerly the responsibility
of stevedoring companies, were now carried out directly by appointed
shipping companies (godown operators). As godown operators, the com
panies had to serve every national ship which was permitted to load and
unload cargo before their godown. Non-operator shipping companies were
allowed to unload cargo from their ships and pile up the cargo in their
respective godowns as long as there was space available. In order to
increase efficiency and avoid port congestion, port administrators had
the power to appoint other shipping companies to load and unload cargo,
provided that there was evidence showing that the godown operators had
worked inefficiently. The port administrator also had the right to order
ships to use other godowns or to move l~ading and unloading activities
52
of a particular ship to other ports in his jurisdiction. 37 Obtaining
port services as described by the above Decree is a long process. It
involves ten major and 38 minor steps (Figure 24), with a number of forms
to be filled in by the shipping company and documents and certificates
to be examined by port officials through complicated bureaucratic
procedures. 38
Four years later, this long process of obtaining port services was
simplified by INPRES 4/1985 and Ministerial Decrees No. KM.90/PR.302/
Phb-85 and No. KM.92/PR.302/Phb-85 concerning policies to facilitate
the flow of interisland and export/import cargoes. A specific objective
of these regulations was to reduce high costs in economic activities.
With respect to interisland shipping INPRES 4/1985 abolished the inter-
island fiscal certificate, ship's tax payment certificate, identification
paper showing types of cargo on board, and custom document indicating
types of cargo loaded and unloaded by port of origin and destination.
In addition, calculation of port-service rates was simplified and several
port fees were eliminated. It also determined that the operation of
the first line godown had to be carried out by specialist companies.
The functions of stevedoring companies were reactivated.
Working shifts were also changed, from two working ~hifts to three
working shifts a day. Productivity targets were 12 tons/gang/hour for
general cargo, 18 tons/gang/hour for dry bulk cargo, and 17 tons/gang/
hour for liquid cargo.
IMPRES 4/1985 also reorganized port management authority and
services. Independent port authorities such as customs, health,
37 Ibi d.,214-36. 38Ibi d., 2.19-36.
53
quarantine, and immigration were placed under the coordination of the
port administrator, while the port administrator was directly responsible
to the Minister of Communications, not to the Director General of Sea
Communications. It should be pointed out here also that most of the
roles of the customs were abolished. In consequence, a large number
of minor steps in the long bureaucratic process of port services have
been reduced and the process itself simplified.
Shipping Route Regulations
Two primary policy objectives of shipping route development in
Indonesia are to facilitate cargo movements between production and
consumption centers and to provide the people with adequate and compre-
hensive sea transportation services connecting all ports of the
archipelago.
Only Nusantara shipping, Lokal shipping, and Perintis shipping are
regulated by the government. Shipping routes of Prahu shipping, inland
waterway shipping, and special shipping are not regulated by the govern
ment. Prahu shipping does not have regular schedules of services. Its
movements are influenced by monsoonal winds and determined by seasonal
demand. Inland waterway shipp tnq is not interisland; it is combined
with and regulated as land transportation. Special shipping consists
of trampers which can "go wherever and whenever their services are
needed.,,39
39Bernhard J. Abrahamsson, International Ocean Shipping, CurrentConcepts and Principles (Boulder, co: Westview Press, 1980), 2-3.
54
Nusantara shipping has'the main task of connecting all regions of
the archipelago on regular schedules and routes which are laid down by
the government. It consists of ships larger than 500 m3 gross capacity
(175 GT). Loka1 shipping includes wooden and steel hulled motor vessels
between 100 m3 (35 GT) and 500 m3 gross capacity (175 GT). It is
designated to provide regional sea transportation and feeder services
to Nusantara shipping within a radius of 200 miles from the home base
and with a total route length of 500 miles up to the final port of
destination. These limitations are not applied to Loka1 shipping
operating in Maluku and Irian Jaya. 40 The purpose of Perintis shipping
is to provide economically weak areas with frequent shipping services
connecting these areas with the rest of the archipelago, so that these
areas are able to develop their economies. 41 The Perintis fleet is
operated by PELNI, a state owned Nusantara shipping compa~y, on a
regular basis. It consists of ships larger than 500 m3 gross capacity
(175 GT). Prahu shipping includes sailing vessels of less than 500 m3
gross capacity (175 GT) and sailing vessels of less than 424.50 m3 (150
GT) with an auxiliary engine of 120 horsepower. 42 The operational region
of Prahu shipping generally covers areas which are not profitable to
40Articles 2 and 10 of the Decree of Minister of CommunicationsNo. M.8/1/25 Mphb., and Article 7 of the Decree of Director General ofSea Communications No. DAL.l/4l/9.
41Article 1 of the Decree of Minister of Communications No.KM.13/AL.3010/Phb-81.
42Decree of Director General of Sea Communication No. DAL.ll/19/13of 1975.
55
Nusantara and Loka1 shipping. In certain regions Prahus provide feeder
services for Nusantara ships and Loka1 vesse1s. 43 Special shipping
includes dry and liquid bulk cargo ships and barges, which are generally
owned or operated by Indonesian private or state owned industrial
enterprises. 44
According to the Decree of the Minister of Communications No.
M.8/2/1 Mphb. of 1969, the Indonesian archipelago was served by Nusantara
ships on 29 trayek (shipping routes) connecting more than 50 ports.
Frequency of services on these trayek ranged between once a week and
once a month. Trayek between Pa1embang and Jambi, Surabaya and Bawean,
and between ports in eastern Indonesia were served once a month
(Appendi x F).
Realizing that interisland trade was developing, in 1973 trayek
of Nusantara shipping was revised and improved by Instruction of the
Director General of Sea Communications No. DAL.1/7/17. The trayek were
divided into four categories, which included 25 trunk routes, 15 feeder
routes, 15 Singapore routes, and one passenger route. Total allocated
shipping capacity was 129,600 DWT on trunk routes, 25,000 DWT on feeder
routes, 34,300 DWT on Singapore routes, and 9,000 DWT on the passenger
route. The inclusion of feeder routes in the Nusantara trayek duplicated
the functions of Lokal shipping.
The feeder function of Loka1 vessels was again duplicated by
Nusantara ships through the issuance of Decree of the Director General
.. , 43Shamser Ali, "Inter-Island Shipping," Bulletin of IndonesianEconomic Studies 3 (February 1966): 33.
44Howard W. Dick, The Indonesian Interisland Shipping Industry,An Analysis of Competitlon and Regu1atlon (Slngapore: Instltute of Southeast ASlan Studies, 1987), 41-43.
56
of Sea Communication No. OAL.13/38/8 of 1975 concerning Nusantara trayek.
This Decree was issued to improve bilateral trade relationships between
Indonesia and Singapore. A specific objective was to accommodate demands
of Nusantara shipping companies for increasing frequency of services
on Singapore routes. As a result, five additional Singapore routes were
added in the 1975 Nusantara trayek, which included 26 trunk routes, 14
feeder routes, 20 Singapore routes, and one passenger route. Allocations
included 140 ships of 174,647 OWT on trunk routes, 76 ships of 26,712
OWT on feeder routes, 123 ships of 140,523 OWT on Singapore routes, and
2 ships of 710 OWT on the passenger route. Frequency of services ranged
between 5 to 18 voyages per ship/year on trunk routes, 5-16 voyages/ship/
year on feeder routes, 6-25 voyages/ship/year on Singapore routes, and
10-12 voyages per ship/year on the passenger route. This trayek was
carried out from 1976 to 1979.
In 1979, new Nusantara trayek and ship allocations were introduced
by Director General's Decree No. OAL.13/1/8. In this trayek, Nusantara
routes substituted for trunk and feeder routes and duplication of feeder
functions was abolished. However, another duplication appeared when
additional routes for special cargo and passenger/cargo ships were
included in the Decree. The trayek now consisted of 46 Nusantara routes,
two passenger routes, three passenger/cargo routes, two special cargo
routes, and 19 Singapore routes. Twenty-two Nusantara routes were
located in western Indonesia, while the rest were in eastern Indonesia.
Allocated carriers included 127 ships of 138,175 OWT on western Nusantara
routes, 142 ships of 140,264 OWT on eastern Nusantara routes, four ships
of 10,629 OWT on the passenger routes, seven ships of 19,180 DWT on
57
passenger/cargo routes, and 79 ships of 106,768 DWT on .Singapore routes.
Frequency of services ranged from 10-28 voyages/ship/year on western
Nusantara routes, 8-28 voyages/ship/year on eastern Nusantara routes,
52 voyages per ship/year on passenger routes, 1-9 voyages/ship/year on
passenger/cargo routes, 18 voyages/ship/year on special routes, and 7-33
voyages/ship/year on Singapore routes.
The 1979 Nusantara trayek was replaced by a new one in 1984,45 which
included 47 Nusantara routes, 13 Singapore routes, and eight passenger
routes. Numbers of ships allocated on the Nusantara trayek consisted
of 294 ships of 366,479 DWT on Nusantara routes, 51 ships of 104,625
DWT on Singapore routes, and six ships of 18,130 DWT on passenger routes.
The frequency of services was at 8-28 voyages per ship/year on Nusantara
routes, 7-33 voyages/ship/year on Singapore routes, and 10-52 voyages/
ship/year on passenger routes. This trayek was carried out from 1984
through 1989. The patterns of Nusantara trayek are shown in Figure 25
and passenger routes are shown in Figure 26.
Lokal shipping routes began to be regulated in 1971. From 1971
to 1980, Lokal trayek were unchanged, nor were the number of ships and
allocated capacity. In this period, Lokal trayek consisted of 217
routes, with 623 Lokal vessles of 80,720 GRT allocated (Table 16). The
trayek covered nine Wi1ayah Perhubungan Laut (sea communication
districts):
District I:
District II:
Belawan and environs;
Dumai and environs;
45Decree of Director General of Sea Communication No. DAL.13/2/5of 22 December 1983.
·58
District I I I : Jakarta and environs;
District IV: Surabaya and environs;
District V: Banjarmasin and environs;
District VI: Ujung Pandang and environs;
District VII: Manado/Bitung and environs;
District VI II: Ambon and environs;
District IX: Jayapura and environs.
The purpose of establishing the nine sea communication districts was
to facilitate the administration of Loka1 shipping and the coordination
of port activities in each district. It was also expected that the nine
district system would prevent unfair competition between Lokal vessels
and other ship sectors and among Loka1 vessels themselves. Each district
had the authority to issue Loka1 licenses, determine Lokal shipping
routes, issue license for port operators of stevedoring companies, and
control Loka1 shipping activities within the respective district.
In 1981, the previous Loka1 trayek was renewed by Decree of the
Director General of Sea Communication No. DAL.13/1/18. The new Lokal
trayek consisted of 148 routes served by 720 vessels of 81,717 GRT
(Table 17). In order to conform to the 1984 Nusantara trayek, the 1981
Loka1 trayek was revised in 1984 by Decree of the Director General of
Sea Communication No. DAL. 13/2/6. There were 148 routes connecting
ports within the nine sea communication districts, served by 889 vessels
of 108,381 GRT (Table 18). The present-day Lokal trayek is shown in
Figure 27.
59
Perintis shipping was developed in 1974 to connect the frontiers
and far-flung islands with the core of the country.46 Perintis shipping
was to achieve sociopolitical objectives, though economic considerations
were involved in its operations. In 1981, it had 11 home bases and
operated 35 ships of 23,179 DWT on 33 routes. Frequency of services
ranged from weekly to monthly.47 In 1985, Perintis trayek was revised
by Decree of Director General of Sea Communication No. AL.59/1/13-85.
It still covered 11 home bases and their environs, but with a smaller
number of routes and ships. This was because the government budget for
Perintis shipping had been cut due to the decrease of government revenues
from oil. Since then, 22 Perintis ships of 10,482 DWT have been
allocated on 25 routes with frequency of services ranging from once a
week to once a month. The operational areas of Perintis ships are shown
in Figure 28.
It should be pointed out here that while the Directorate General
of Sea Communication was preparing new Nusantara, Lokal and Perintis
trayek, the government introduced a package of deregulation on shipping
trayek and imports on November 21, 1988. This deregulation package was
known as Paket November 21 (PAKNOV 21). The possible impacts of PAKNOV
21 will be discussed in the next chapters of this study.
Regulations of Ship's Age
Limitation of ship's age, to improve safety of navigation, became
an instrument to overcome the problem of overcapacity in Indonesian
46Decree of Minister of Communications No. M.8/1/25 Mphb. of 1974.
47Decree of Director General of Sea Communication No. DAL.13/1/8.
60
shipping. The idea of prohibiting the operation of ships older than
25 years old in Indonesian waters became the government's policy 25 years48ago. However, serious attention to the prohibition of operating old
ships came about only after problems of overcapacity and shipping
inefficiency associated with recession and because of an evident shortage
of raw materials for steel industries. In order to overcome these
problems, in 1984 the Minister of Communications issued Decree No.
KM.57/HK.404/Phb-84, concerning the prohibition of operating old merchant
ships in Indonesian waters. The Decree stated that Indonesian merchant
ships older than 30 years had to stop operating in Indonesian waters
on the first of May 1984, while merchant ships older than 25 years must
stop service on the first of January 1985. The Decree also banned the
sale of old ships for scrapping overseas, so that raw materials for
Indonesian steel industries could be made available. Another specific
objective of the Decree was to modernize the Indonesian shipping fleet
by replacing old ships with new ones which had to be purchased from
domestic industries. As a result of this Decree approximately 376 ships
of more than 150,000 tons were scrapped in the domestic scrapping
yards. 49
Because domestic shipping industries cannot meet the demand for
new ships, the lack of shipping capacity is a national problem requiring
solution. In 1988, without cancelling the Ministerial Decree, the
48Howard W. Dick, The Indonesian Interisland Shipping Industry,An Analysis of Competition and Regulation (Slngapore: Institute of Southeast ASlan Studles, 1987), 152.
49Ibi d., 152-55.
61
government's solution was kebijaksanaan. 50 The kebijaksanaan of the
government allows shipping companies to operate their old ships, pro
vided that they meet required sailing conditions. 51
Freight Rate Regulations
The government realizes that freight rates determine the avail-
ability of adequate shipping capacity and influence regularity of
shipping. In order to ensure the availability of regular liner services
throughout the country, freight rates should not be left fully in the
hands of market forces.
Before 1969, the government experienced three changes in freight
rates: "free-for-all" frei ght rates, PELN I tari f f s , and the 1967 frei ght
rates. AFter the withdrawal of all ships of the Royal Packet Navigation
Company (KPM) in 1957, freight rates were determined simply on the basis
of "free-for-all" due to the shortage of national shipping capacity.52
However, because of the unstable political situation at that time,
shipping companies had to provide ships to the government if needed,
with or without compensation. As a result, the shipping companies'
profits were affected, and the ships were often returned in poor con-
dition. In order to provide compensation and to control the national
50Kebijaksanaan is the bureaucratic tradition, which means ambiguously 'polley', 'wlsdom' and, by extension, 'discretion'. Thus 'policy'is firmly set out, by definition is 'wise', must be accepted withoutquestion but, in return for submission and cooperation, may be administered with 'direction'. See Ibid., 187.
51Toriq Hadad and Linda Djalil, "Tua-Tua Layarkan Saja" [Old ShipsSail Again], Tempo, 13 Februari 1988, 94.
52Howard W. Dick, The Indonesian Interisland Shipping Industry, AnAnalysis of Competition and ReguJatlon (Slngapore: Instltute of SoutheastASl an Studl es , 1987), 172.
62
shipping fleet, the government set up an official tariff which was
applied to interisland shipping. However, only PELNI complied with this
new tariff, whereas private companies continued with their own freight
rates. For this reason, in 1967 the government tried to balance official
and actual freight rates by making two 50 percent increases in the
official tariff. However, the new tariff could not be implemented due
to "recession brought on by the New Order's monetary stringency" and
the increase of shipping capacity in 1967 as a result of increasing
number of imported ships.53
In 1969, the government continued its efforts to improve the balance
of the official tariff and actual freight rates by Ministerial Decree
No. M.8/3/13/Mphb. of 28 February 1969 and No. S.K.62/4/1969 of
23 November 1969. However, the official tariff never took effect in
interisland shipping due to official tariff discounting. Tariff adjust
ment was then made by the government by Ministerial Decree No. KM.59/K/
Phb-73 of 8 May 1973. Based on this Decree, the government increased
the official tariff by 25 percent above that of 1969. Whereas the over
tonnage problem could be drastically reduced by the introduction of the
scrapping policy in 1984, heavy discounting of the official tariff still
continued firmly "more or less up to now.,,54
On 7 April 1985, the existing freight rate or tariff was revised
and simplified by INPRES 4/1985. INPRES 4/1985 stated that the
1985 official freight rate listed in the Ministerial Decree No.
KM.87/PR.302/Phb-85 of 11 April 1985 can be used as a guiding rate for
53Ibi d., 172. 54Ibid., 173.
-~----~_._---------
· 63
shippers and carriers in negotiating freight rates. Thus, the official
tariff is no longer binding on both shippers and carriers. 55 The basic
calculations of this tariff are on a ton mile basis and the category
of cargo. The cargo is divided into several classes and each class has
a certain tariff per ton mile. The shipper may bargain with the carrier
in order to obtain a reasonable freight rate for a particular cargo
listed in the regulation. Although these provisions are stated in the
regulation, forwarding companies and brokers have a key role in cargo
reservation, so that the shipping companies still depend on them to
obtain cargoes.
On 10 July 1986, a freight rate adjustment was made due to the
decrease of official oil prices. The official freight rate was lowered
by 5 percent of the 1985 freight rate effective on 1 September 1986.56
Figure 29 shows the sequential relationships of the GBHN (Wawasan
Nusantara), government policies (REPELITA), and shipping regulations.
The diagram illustrates how government policy objectives will be
fulfilled by the use of shipping. In order to achieve government policy
objectives, shipping must meet required conditions stated in the shipping
regulations. Since the shipping regulations are important instruments
of government policy, their revisions can be an indication of a shift
in or a trade-off between particular policy objectives to be pursued.
55 Ibid., 171-80.
560epartemen Perhubungan, Uraian Singkat Penyesuaian Tarip JasaPerhubungan Sebagai Akibat Turunnya Rarga BBM Tanggal 10 JUll 1986[Transportation Rate Adjustments Due to The Decrease of 011 Price onJuly 10, 1986] (Jakarta, Oepartemen Perhubungan, 1986), 1-11.
A~ a logical consequence, it is expected that examination of the
relationships of shipping regulations and shipping qualities will lead
to answers of the basic question of the study.
64
CHAPTER IV
SHIPPING PERFORMANCE
This chapter discusses the performance of Indonesian interisland
shipping by emphasizing the impact of government policies and shipping
regulations on capacity. frequency of sailing. and regularity of services.
In this discussion. particular attention will be given to the performance
of Nusantara shipping due to the shortage of reliable data on other ship
sectors, especially frequency of sailing and regularity of services.
Shipping Capacity
The importance of shipping to national development can be considered
in relation to the capacity available to support interisland trade.
The capacity of interisland shipping in 1986 consisted of 259 Nusantara
ships of 391.031 DWT, 2,829 special ships of 2.833,365 DWT and 551,374
GRT, 992 Lokal ships of 144,100 GRT, 3,641 Prahus of 194,448 GRT, and
21 Perintis ships of approximately 12,243 OWT. 1 The capacity of special
ships amounts to 82.13 percent of the total capacity of the interisland
fleet. The total tonnage of Nusantara ships ranks second (8.46 percent),
Prahus, Lokal ships, and Perintis ships rank third (5.26 percent), fourth
10epartemen Perhubungan, Bahan Nota Keuangan dan RAPBN 1988/1989[Budgeting for Communications Development 1988789] (Jakarta: DepartemenPerhubungan, 1988), 35, 37, 40, 42, 43. For tonnage of Perintis shipssee Direktorat Jendera1 Perhubungan Laut, Petunjuk Angkutan lautIndonesia 1986 [Indonesian Shipping Director 1986J (Jakarta: C. v.Sandaan, 1986), 197-201.
66
(3.89 percent) and fifth (0.26 percent) respectively.2 In terms of
commodities carried by each sector of interisland shipping, special ships
transported 33,476,853 tons of cargo,3 while Nusantara ships, Lokal
vessels, Prahus, and Perintis ships carried subsequently 4,060,516 tons,
2,052,645 tons, 3,604,263 tons respectively in 1989 (Table 19), and
250,514 tons of cargo in 1986.4 Since the beginning of REPELITA I, there
have been fluctuations in the capacity of each ship sector. Interisland
shipping capacity increases by new entrants and decreases by laying up,
scrapping and casualties. 5
Capacity of Nusantara Shipping
In 1965, 179 vessels with a capacity of 251,205 DWT operated
Nusantara liner services. Between 1965 and 1968, the number of Nusantara
ships and their capacity increased by 7.5 percent and 6.~ percent per
year respectively (Table 20; Figures 30, 31). This increase can be
2Average conversion from GRT to DWT for general cargo ship is 1.25or 1 GRT = 1.25 DWT and for tanker/bulk cargo ship is 1 GRT = 1.75 DWT(see Appendix G).
3Thi s includes oil tanker, vegetable oil tanker and barge (seeTab1e 19).
4perintis ships carried a very low tonnage of cargoes becausecargoes were often not available at the ports of call; other reasonswill be discussed in Chapter V. Proyek Armada Perintis, Laporan TahunanPengcperasian Armada Perintis 1985/1986 [Annual Report on The Operationor-~oneer Fleet 198571986] (Jakarta: Oirektorat Jendera1 PerhubunganLaut, 1986), 13-20.
5Sernhard J. Abrahamsson, International Ocean Shipping, Current~oncepts and Principles (Boulder, CO: Westvlew Press, 1980), 113.
~~-------~ -~- ---~-----------------
67
attributed to the liberalization of imports in the late 1960s6 and the
practice of "free-for-all" freight rates. Some ships were imported
through hire purchase arrangement between Indonesian shipping companies
and foreign shipowners. In 1965, there were 31 interisland and ocean-
going ships of approximately 260,000 DWT operated under hire purchase
agreement. Three years later, there were only seven hire purchased
vessels of about 90,000 DWT. 7 Twenty-four ships of 170,000 DWT had
apparently entered the Indonesian shipping fleet. The increase of
imported tonnage as a result of relaxation of foreign exchange restric
tions in the late 1960s8 led to overcapacity and inefficiency of services.
Since then, the government has considered scrapping as to overcome the
problem of inefficiency and overcapacity. Scrapping was included in
the rehabilitation and modernization programs to be carried out in
REPELITA I.
In 1969, the first year of REPELITA I, the number of ships decreased
by 41 percent to 130 vessels, from 221 vessels in the previous year.
Likewise, the capacity declined by 55 percent, from 306,250 DWT in 1968
to 138,004 DWT in 1969. Three reasons can account for this decrease.
First, the government's plan to rehabilitate and modernize the Indonesian
6Howard W. Dick, The Indonesian Interisland Shipping Industry: AnAnalysis of Competition and Regu1atlon (Slngapore: Instltute of Southeast ASlan Studles, 1987), 152.
7Bi ro Pusat Statistik (BPS), Statistical Pocketbook of Indonesia1972/1973 (Jakarta: BPS, 1974), 303.
8Howard W. Dick, The Indonesian Interisland Shipping Industry: AnAnalysis of Competition and Regulatlon (Slngapore: Inst1tute of Southeast ASlan Studles, 1987), 172.
68
fleet had encouraged PELNI, a state owned Nusantara shipping company,
to sell its old vessels to private firms, "often Lokal firms," instead
of scrapping them.9 Second, there were 52 inactive ships of 46,346 OWT
due to poor condition. 10 These ships needed to be rehabilitated. Third,
the increase of shipping capacity had raised freight rate competition
which led to lowering of tariffs. As a short term response to this
situation, several shipping companies laid up their ships and waited
for a freight rate which was, at least, enough to cover their operational
costs.
After a sudden drop in 1969, the Nusantara fleet rose again and
reached 282 ships with a total capacity of 321,669 OWT in 1972. The
fleet experienced an annual increase of 34 percent in number of vessels
and 35 percent in capacity. An increasing number of imported ships was
still a major reason. For example, a hire purchase agreement signed
in 1972 contributed 35 ships of 51,481 DWT to Nusantara shipping. l l
Another reason for the increase was the success of the rehabilitation
program.12 Ships in lay up were put into operation again.
9Ibi d., 153.
lODepartemen Perhubungan, Bahan Nota Keuangan dan RAPBN 1988/1989[Budgeting for Communications Development 1988789] (Jakarta: DepartemenPerhubungan, 1988), 35.
ll Bi r o Pusat Statistik (BPS), Statistical Pocketbook of Indonesia1974/1975 (Jakarta: BPS, 1976), 331.
l2Departemen Perhubungan, Bahan Nota Keuangan dan RAPBN 1988/1989[Budgeting for Communications Development 1988789] (Jakarta: DepartemenPerhubungan, 1988), 35.
69
After a slight decrease in 1973 due to the introduction of a ban
on importing second-hand ships in 1972,13 the number of Nusantara vessels
and their capacity continued to increase and reached a peak in 1982
(Table 20; Figures 30, 31). During this period (1973-1982), Nusantara
carriers increased by 4.7 percent per year. Excess capacity at that
time was no longer a problem, apparently due to strong economic growth
in 1973-1982. During that time, Indonesia experienced two oil booms,
in 1973-1974 and in 1979-1980, which increased the government's revenues,
reduced the country's balance of payments constraints, increased produc
tion of various development sectors and services, and improved national
trade. 14 In addition, Indonesia experienced a rice deficit that needed
to be overcome by importing rice. 15 Large rice imports, which had to
be distributed throughout the country, resulted in a demand for shipping
in 1973.16 Demand for the transportation of rice in Indonesia has
persisted up to now. The increase of shipping capacity during the oil
booms was also facilitated by the ease of entry. Shipping licenses were
easy to obtain as long as shipping companies had close relationships
with government officials and agreed to meet unofficial conditions set
13Howard W. Dick, The Indonesian Interisland Shipping Industry:An Analysis of Competitlon and Regulation (Slngapore: Instltute of Southeast ASlan Studles, 1987), 152, 172.
14The Economist Intelligence Unit, "Country Profile: Indonesia,"Quarterly Economic Review of Indonesia (Annual Supplement 1987-88): 36.
l5self-sufficienCy was achieved in 1984/1985 (see Table 13), butit is now in question again.
l6Howard W. Dick, The Indonesian Interisland Shipping Industry:An Analysis of Competition and Regulatlon (Slngapore: Instltute of Southeast ASlan Studles, 1987), 172.
70
up by the officials. This procedure opened opportunities for shipping
companies, especially the inefficient ones, to not comply strictly with
shipping regulations.
At the end of the second oil boom, oil prices gradually dropped
and finally collapsed in 1986. In consequence, the country's revenues
from oil dropped, the economy slowed down and the business climate was
depressed. 17 There was a recession. The government reduced oil sub
sidies as part of a tight money policy. The reduction of government
subsidies increased domestic oil prices, thus raising transportation
costs. Freight rates increased and hampered marketing and distribution
of goods. 18 The flow of commodities by Nusantara ships, however, still
increased from 24,210,849 tons in 1979 to 36,730,004 tons in 1984, and
was forecast to increase to 44,012,835 tons in 1989. During the
recession the government exerted efforts to increase distribution of
commodities, particularly for basic human needs, throughout the country
in order to prevent social and political unrest. This was possible
during the recession because all Indonesian liner shipping was required
to give priority to the carriage of cargo which had been determined by
the government, particularly in emergency situations.
17Anne Booth, "Indonesia's Economy: Performance and Policy Optionsin Post-OPEC World," in Southeast Asian Affairs 1986, ed. Kernia1 S.Sandhu and Mohamed Ayoob (Slngapore: Instltute of Southeast Asian Studies[1986]), 131. See also The Economist Intelligence Unit, QuarterlyEconomic Review of Indonesia (Annual Supplement 1987-88): 37.
18A. R. Soehoed, "Reflection on Industrialization and IndustrialPolicy in Indonesia," Bulletin of Indonesian Economic Studies 24(August 1988): 48.•
71
Based on experience during the first oil boom era, Nusantara firms
operated more hire-purchase ships and less chartered vessels during the
second oil boom era (Table 21; Figures 32, 33), with the expectation
of earning more profits. This was facilitated by the withdrawal of a
number of ships from Nusantara services during the period of 1981-1985.
In 1981, ten ships of 8,079 OWT were allocated to support Perintis
shipping, 34 ships of 40,969 OWT were docked every month, 14 ships of
10,325 OWT broke down, three ships of 5,730 DWT sank, and four ships
withdrew from Nusantara shipping. 19 In 1982,61 Nusantara ships of
65,439 OWT were no longer operational. 20 In 1985, three ships of 2,287
OWT were in Perintis service, six ships of 9,484 OWT were docked every
month, four ships of 4,830 OWT broke down, two ships of 1,480 OWT sank,
and five ships of 1,873 OWT withdrew from Nusantara shipping. 21
Purchasing and chartering additional vessels as replacements led to over
capacity when the recession appeared. The government had paid serious
attention to this problem, particularly since the opening of the Krakatau
Steel Industry at cilegon. 22 In order to reduce overcapacity and to
19BOPBERPAN, Laporan Kegiatan Kapal-Kapa1 RLS Nusantara 1981 [Reporton RLS Nusantara ShlPS Actlvltles 1981J (Jakarta: BOPBERPAN, 1982).
20Howard W. Oick, The Indonesian Interisland Shipping Industry,An Analysis of Competitlon and ReguJatlon (Slngapore: Instltute ofSoutheast ASlan Studies, 1987), 128.
21 BOPBERPAN, Laporan Kegiatan Kepa1-Kepa1 RLS Nusantara 1985 [Reporton RLS Nusantara ShlPS Actlvltles 1985J (Jakarta: BOPBERPAN, 1986).
22"[The issue of] excess capacity re-emerged after the PERTAMI NAcrisis of the mid-1970s and has persisted until the present." Howard W.Oick, The Indonesian Interisland Shipping Industry: An Analysis ofCompetltlon and Regu1atlon (Slngapore: Instltute of Southeast ASlanStudles, 1987), 152-53.
- -------------
72
supply the Krakatau Steelworks with steel scrap, the government intro
duced a scrapping policy in 1984. In the first year of the implementation
of this policy, 50 ships of 51,649 DWT were subtracted from the Nusantara
fleet. Following the scrapping of 63 ships of 70,277 DWT in 1985, 16
ships of 21,373 DWT were scrapped in 1986. Thus a total of 129 Nusantara
ships of 143,299 DWT were scrapped in 1984-1986.23 Between 1982 and
1987, the number of ships decreased by 9 percent per year and their
capacity went down by 5.5 percent per year (Table 20; Figures 30, 31).
Since the beginning of 1988, the scrapping program has been stopped by
the government to prevent a further shortage of capacity. To overcome
this problem, the government allows Nusantara firms to operate their
old ships as long as they meet required sailing conditions.
The scrapping policy lasted only four years. This led to a question
of whether or not over supply of shipping capacity really existed.
Excess capacity in the Indonesian interisland shipping can be indicated
by comparing allocated capacity and supplied capacity. Overcapacity
takes place when supplied capacity exceeds allocated capacity. Over
capacity can also be identified by comparing shipping productivity in
a particular year with that of previous years. The decrease in shipping
productivity indicates that the existing capacity is not fully
. uti 1i zed. 24
23Departemen Perhubungan, Bahan Nota Keuangan dan RAPBN 1988/1989[Budgeting for Communications Development 1988/89J (Jakarta: DepartemenPerhubungan, 1988), 35.
24Bernhard J. Abrahamsson, International Ocean Shipping, CurrentConcepts and Principles (Boulder, co: Westview Press, 1980), 112-15.
-------------
73
Tables 22 and 23 show shipping allocation and its realization in
1969-1987. Shipping allocation is defined as the level of allowable
output of services (capacity) supplied by each ship sector in the inter
island trade. 25 The supply of shipping capacity in Indonesia is
regulated by the government to prevent overcapacity. Overcapacity,
however, occurred before the first and second oil booms (Table 23).
The prohibition of ship imports in 1972 had failed to reduce overcapacity
due to the ease of entry. The overcapacity disappeared after 1975 due
to the economic bonanza, but it reappeared after 1980 leading to the
introduction of the scrapping policy.
Table 24 shows that the decrease of productivity in 1980-1982 was
due to the increase of capacity and the decrease of cargo volume. A
severe overcapacity occurred in 1982. Ayear after the introduction
of the scrapping policy, productivity went back to the level of 1980.
It continued to increase and peaked at 11.17 tons/OWT in 1987. After
the introduction of kebijaksanaan, however, productivity decreased due
to the increase of capacity, although cargo volume increased. This
productivity was still lower than that of Loka1 vessels (Tables 24, 29).
Hence, it can be assumed that overcapacity occurred again.
The increase of productivity in 1985-1987 indicates that Nusantara
shipping was not in short supply. A shortage of capacity, however, had
been used by the government to issue kebijaksanaan in 1988, which
cancelled the implementation of the scrapping program. It is obvious
that the kebijaksanaan of government did not directly solve the problem
25Graham Bannock, R. E. Baxter and Ray Rees, "Resource Allocation,"in Oictionary of Economics, 3d ed. Harmondsworth: Penguin Books, 1984
74
of shortage of capacity. Shipping companies were disappointed with the
implementation of the scrapping program because the Directorate General
of Sea Communications could not explain why many ships 25 years old,
which were still economically operable and still met sailing conditions,
were scrapped. Conflicts between shipping companies and the government
were unavoidable. The scrapping policy brought about open conflicts
between shipowners and government officials who wanted to seize ships
in several major Indonesian ports. These conflicts would hamper the
smoothness of cargo flow and might lead to social unrest. For this
reason, the government made a political decision to discontinue the
scrapping program.
For passenger transport, the government has reserved six newly
procured luxury cruise ships: Km. Kerinci, Km. Kambuna, Km. Rinjani,
Km. Umsini, Km Ke1imutu, and Km. Lawit, with a total capacity of 16,568
DWT. They are operated by PELNI and serve 46 port-towns in 21
provinces. 26 In 1983, the Kerinci (3,400 DWT or 13,950 GRT) was operated
on the most important routes connecting the four main gateway ports and
Bitung (North Sulawesi). Beginning in 1984, these routes were served
by the Kambuna and the Kerinci was allocated on the routes between Sibolga
(west coast of North Sumatera) and Tarakan (northern part of East
Kalimanatan). The Rinjani (3,434 DWT or 13,850 GRT) was put into
service on the routes connecting Be1awan (North Sumatera) and Sarong
260irektorat Jendera1 Perhubungan Laut, Ringkasan Laporan AkhirTinjau Lanjut Angkutan Penumpang Laut dan Studl Kelayakan kapal PenumpangVIII dan IX LA Summary of FlnaJ Reports on the Evaluatlon of PassengerFlows and Feasibility Study of Passenger Ships VIII and IX] (Jakarta:Oirektorat Jendera1 Perhubungan Laut, 1988), 6.
75
(Irian Jaya). In 1985, the Umsini, the sister ship of the Rinjani,
began to transport passengers from Java, South and Southeast Sulawesi,
North Maluku, and Irian Jaya. In 1986, there followed two sister ships
of 1,450 OWT or 5,685 GRT each, the Lawit and Kelimutu, which served
the routes connecting the ports of Java, Kalimantan and Nusa Tenggara. 27
The passenger routes connecting Belawan, Jakarta, Surabaya and Makassar
are served most frequently (Figure 26).
Capacity of Lokal Shipping
According to shipping regulations, the operation of Nusantara ships
is supported by Lokal fleets. Between 1969 and 1970, the capacity of
Lokal fleets increased by 48 percent from 60,700 GRT to 90,000 GRT,
although the number of carriers decreased slightly by 3 percent from
803 vessels to 777 vessels (Table 25; Figures 34, 35). The decrease
in the number of ships and the increase in capacity could be associated
with the replacement of old Lokal ships by larger vessels of Nusantara
size. 28 It should be pointed out here that in order to obtain a Lokal
license a firm was required to have at least two ships of Lokal size,
i.e., less than 175 GRT. 29 Even though both Lokal and private shipping
companies had purchased ships of Nusantara size, they could still obtain
270irektorat Jenderal Perhubungan Laut, Konsep Penataan Trayek 1988[Organizing The 1988 Routes] (Jakarta: Direktorat Jenderal PerhubunganLaut, 1988),16. See also A. Rutz, "Indonesia's Sea Transport System--ASeri es of Maps," Geo Journal 14.4 (1987): 492.
28pELNI sold its relatively old ships to private firms, often Lokalfi rms , in 1969.
29PP2/1969 and Decree No. DAL.1/41/9 of 8 July 1974.
76
a Loknl license for their new ships from local authorities due to
personal connection with government officials. By buying Nusantara
ships, obtaining a Lokal license and, at the cost of a modest fee,
placing the ships under "the nominal management of a licensed Nusantara
firm,,,30 the purchasers could escape from conditions that must be met
by a Nusantara firm. It was also reported that many ships of Nusantara
size were operated under the wing of licensed Lokal firms and vessels
of Lokal size operated under the wing of licensed Nusantara firms.
Table 26 is an example of the former, while the reclassification of
several Nusantara ships as Loka1 vessels of less than 175 GRT in 198231
is an example of the latter.
The "under-the-wing" operation was a way out taken by many ship-
owners who had only one vessel of the required size. It was required
by PP2/1969 that a shipowner had to have at least two vessels of certain
tonnages in order to obtain a license to establish either a Nusantara
or a Loka1 shipping company and licenses to operate ships. There were
two licenses, a business license and a shipping ;icense. In consequence,
those who had only one vessel of the required size could not establish
a shipping company and could not operate their vessels. To operate their
vessels, they exerted efforts to get shipping licenses from the govern
ment and put their vessels "under-the-wing" of a licensed shipping
company. This marked the beginning of the "under-the-wing" operation.
30Howard W. Dick, The Indonesian Interisland Shipping Industry:An Analysis of Competitlon and Regulatlon (Slngapore: Instltute ofSoutheast ASlan Studles, 1987), 62.
31 Ibid., 128.
------------- --
77
By using under-the-wing operation, they could easily enter and withdraw
from the interisland shipping industry. The "under-the-wing" practice
increased after the government introduced a Decree in 1976 which stated
that no more business licenses would be issued for the establishment
of new shipping companies. 32 Since the main objective of this Decree
was to overcome the problem of overcapacity, shipowners who had two or
more ships could not enter the interisland shipping industry. The only
way to enter the industry was by joining a licensed shipping company.
The 1976 Decree was a trigger for the increase of "under-the-wing"
operations through manipulation of shipping regulations. The 1976
Decree likewise protected inefficient shipping companies, some of which
did not have even one vessel, because there would be no new shipping
companies or new competitors coming in. In such a situation, personal
relationships with government officials became an important factor for
the survival of a shipping business. Licensing brokers grew like
mushrooms during the rainy season; a licensing black-market became a
common channel for obtaining a license; business licensing fees became
very expensive ranging from Rp 400 million to Rp 450 million (US$ 235,000
and US$ 265,000);33 and the corruption of government officials was
uncontrollable. For these reasons, the government abandoned the under
the-wing operation on the first of May 1984. 34 The discontinuance of
32Kompas (Jakarta), Minggu, 27 November 1988. 33 Ibi d.
34"The concern seems to have been that many owners of [under-thewing ships] were traders rather than bona fide shipowners and were using'under the wing' arrangements as a loophole to evade [PP2/1969 and otherrelated regu1ationsJ." Howard W. Dick, The Indonesian Interisland
78
under-the-wing operation would affect approximately 148 ships of 94,000
OWT of Nusantara size (15 percent of Lokal ships or 62 percent of Lokal
capacity) and 501 vessels of 61,000 GRT of Lokal size (50 percent of
Lokal vessels or 50 percent of Lokal capacity) (Table 25).35
Table 25 also shows that in 1971 the number of Loka1 ships and their
capacity decreased to 623 v~ssels of 83,000 GRT. At the same time, the
problem of over-tonnaging reappeared. However, the decline in number
of ships and capacity in 1971 could not be attributed to the problem
of excess capacity. Annual increases of capacity were recorded after
1971. The decrease was most likely due to the rehabilitation of a number
of Loka1 ships. Thus, it was associated with the rehabilitation program
launched by the government in 1969 and also with a number of vessels
in lay up.
Between 1971 and 1978, the number of Loka1 ships increased from
623 ships of 83,000 GRT to 1,448 ships of 155,600 GRT, an' annual increase
of ships and capacity by 14.6 percent and 9.6 percent respectively.
Comparison between Tables 25 and 26 indicates that vessels of Lokal
size still dominated the Loka1 shipping industry, even though the number
of ships of Nusantara size operated under the wing of licensed Loka1
firms increased (Table 26). In general, the growth of Lokal shipping
Shipping Industry: An Analysis of Competition and Regulation (Singapore:lnstltute of Southeast ASlan $tudles, 1987), 123.
35 ibi d., i23. The 148 ships of Nusantara size were granted Lokallicense, but operated under the wing of licensed Nusantara firms, Whl Iethe 501 vessels of Lokal size obtained Lokal license and were operatedunder the wing of 11censed Lokal firms. One GRT = 1.25 OWT (Appendix G).
79
in 1971-1978 was accelerated by the increase of new entrants joining
the under-the-wing operation.
After reaching a peak in 1978, the number of Loka1 vessels began
to fall from 1,448 to 1,389 in 1979 and continued to drop to 1,090 in
1981. It was assumed that at that time a large number of Lokal vessels
was laid up for major repairs and a few had sunk. This marked an annual
decline of 8.3 percent within three years, during which time Indonesia's
economy continued to grow as a result of the second oil boom. In order
to take advantage of this situation, approximately 170 ships of 72,138
GRT of Nusantara size were operated under the wing of licensed Lokal
firms in 1979, which increased to about 196 ships of 84,940 GRT in
1981.36 This increased the Lokal shipping capacity slightly by 1.3
percent per year, from 155,600 GRT in 1978 to 161,400 in 1981.
Between 1981 and 1984, the number of Loka1 vessels declined by 3
percent per year, from 1,090 vessels to 992 vessels. Likewise, their
capacity went down by 8 percent per year, from 161,400 GRT to 121,800
GRT. In general, this decrease was associated with the recession and
tight money policy. Specifically, this decline was caused by the with
drawal of ships of Nusantara and Lokal sizes from under-the-wing
arrangements, the scrapping of 49 vessels of 6,449 GRT,37 and the sinking
of 27 vessels of 3,186 GRT in 1984.38
36These figures are derived from linear regression of the data ofunder-the-wing ships shown in Table 26.
37By 1984, the government issued two regulations on the banningof under-the-wing operation and on the limitation of ship's age (scrappingpolicy) to relieve severe problems of excess capacity and to modernizethe Indonesian fleet.
38pelni, "Improvement of Sea Transport Services," Warta EkonomiMaritim [Maritime Economic] (December 1985/January 1986): 15.
80
By 1985, 26 vessels with a total capacity of 2,213 GRT were scrapped
in domestic yards. At the same time, 80 ships, which were formerly
operated under the wing of licensed Nusantara firms, were granted Lokal
license and allocated on the Lokal Trayek. These new entrants contributed
a total capacity of 13,234 GRT to the Lokal f1eet. 39 This contribution
resulted in an increase of capacity by approximately 9 percent, from
121,800 GRT in 1984 to 144,100 GRT in 1986. During this period, the
number of ships increased from 992 vessels in 1984 to 1,036 vessels in
1985, but then decreased to 992 vessels again in 1986. This was a very
small increase of 0.09 percent per year between 1984 and 1986 (Table 25;
Figures 34, 35). Considering the increase of Loka1 shipping capacity
in 1984-1986, it can be assumed that the scrapping policy failed to
achieve its objective.
The ease of entry continued to go on and no one seemed to comply
with the shipping allocation policy (Tables 27, 28). As a result, over-
capacity, which was characterized by the decrease of productivity, was
unavoidable, particularly after 1981 (Table 29). Furthermore, allocation
of Loka1 vessels had made many shipping routes overlap (Figures 25,
27).40 Since the Loka1 shipping also had Singapore as a transshipment
port in its several routes,41 the feeder function of Loka1 vessels became
39Departemen Perhubungan, Bahan Nota Keuangan dan RAPBN 1988/1989[Budgeting for Communications Development 1988/89] (Jakarta: DepartemenPerhubungan, 1988), 36.
40For detailed overlapping routes see Directorate General of SeaCommunications, Indonesian Shipping Directory 1986 (Jakarta: C. V.Sandaan, 1986), 89-201.
41 In addition to Singapore routes, some of the Nusantara routesalso pass through Singapore.
---- --- -_ .. - ._------------------
81
unclear, the distinction between Lokal and Nusantara shipping was
blurred,42 and the differentiation of shipping routes was meaningless.
However, it should be noted that the Nusantara and Lokal shipping network
had covered more ports in 1986-1987 than in the previous years.
Capacity of Prahu Shipping
The third component of the Indonesian interisland shipping is
Pelayaran Rakyat or the People's shipping which consists of traditional
sailing vessels or Prahus. This fleet has been developed to strengthen
the trade flow network to the remote islands. Prahu shipping comprised
400 sailing vessels in 1969 and 1970 with a total tonnage of 18,442 GRT
(Table 30). Figures 36 and 37 show that between 1969 and 1976, Prahu
shipping performed at virtually steady capacity (an annual decrease of
0.7 percent), although the number of prahus rose by 3 percent per year,
from 400 in 1969 to 481 in 1976. The first REPELITA and the first three
years of the second REPELITA could be considered a transitional period
.for Prahu shipping to adapt itself to a new economic situation brought
about by the change of government administration in 1966. Between 1958
and 1968, Prahu shipping grew and was healthy. It benefited from a
shipping vacuum caused by the withdrawal of the Royal Packet Navigation
Company (KPM) from interisland shipping in 1957 and from the absence
of national motorized shipping services to small ports. In addition,
illegal trading and political instability at that time gave Prahu
42Howard w. Dick, "Prahu Shipping in Eastern Indonesia Part I,"Bulletin of Indonesian Economic Studies 11 (July 1975): 70.
82
shipping opportunities to make profits. 43 When the New Order government
was established in 1966, the Indonesian economy was depressed. Produc-
tion and investment had fallen in many sectors, per capita income in
1966 was lower than in 1950, export. earnings slumped, and inflation
reached 640 percent in 1966.44 In consequence, demands for prahu were
likely to be reduced and Prahu shipping seemed to have few opportunities
to make profit. For this reason, a number of Prahus were laid up,
waiting for an improving market (Figures 36, 37).
Strong economic growth in 1974/1975, combined with two oil booms
and production increases in many development sectors, led to accelerated
growth of Prahu shipping in 1976-1986. During this period, Prahus in
lay up and new Prahus were put into operation. As a result, the number
of prahus rose by 28 percent per year, from 481 prahus in 1976 to 3,641
prahus in 1986. Also, Prahu capacity increased by 36 percent per year,
from 16,488 GRT in 1976 to 194,448 GRT in 1986 (Table 30; Figures 36,
37). According to official statistics of 1983, Prahu shipping consisted
of 1,284 sailing prahus of 52,979 GRT, 1,326 motor prahus of 110,793
GRT, and 840 motor vessels of less than 35 GRT of 16,675 GRT. 45 It is
obvious from Figures 36 and 37 that Prahu shipping was not influenced
43Ibi d., 81.
44The Economist Intelligence Unit, "Country Profile: Indonesia,"Quarterly Economic Review of Indonesia (Annual Supplement 1987-88): 12.
45According to shipping regulations, motor vessels of less than 35GRT can be operated by Prahu shipping firms. See David Hughes, liThePrahu and Unrecorded Inter-lsland Trade," Bulletin of Indonesian EconomicStudies 22 (August 1986): 110.
83
by the economic recession. In fact, it benefited from the declining
of Nusantara and Lokal shipping services after the second oil boom in
1979/1980. Three advantages of prahus which enabled them to thrive under
the economic recession were:
They were virtually independent of imported materials anddid not suffer from the shortage of spare parts whichplagued the modern sector. They placed almost no demandson infrastructure and were not inconvenienced by portcongestion, breakdown of port equipment, or shortages ofbunker oil or fresh water supplies or dockyard services.They were not handicapped by the huge bureaucracy whichwas stifling the modern sector; there were no licensingprocedures, no freight rate controls, no official routings,no requisitioning by the Armed Forces. The Prahus wereself-sufficient, labor intensive and unregulated. 46
Moreover, Prahu shipping did not have to comply with the provisions of
ship·s age regulations or the scrapping policy.
Those advantages enabled Prahus to capture more cargo than Lokal
vessels and to transport more goods per DWT than Nusantara ships (Tables
24, 29, 31). In 1976, a very high productivity of Prahu became a trigger
for the increase of Prahu capacity in the following years. In 1976 Prahu
shipping was in a short of capacity. This gave room for new entrants.
Realizing that Prahus were very productive and were probably making
profits by intruding into other ship sectors, the Directorate General
of Sea Communications began to control the supply of and demand for
Prahus by issuing Decree No. AL.59/l/20-87 on 20 August 1987.47 The
46Howard W. Dick, "Prahu Shipping in Eastern Indonesia Part I,"Bulletin of Indonesian Economic Studies 11 (July 1975): 81.
47Direktorat Jendera1 Perhubungan Laut, Laporan Akhir Tinjau LanjutAngkutan Penumpang Laut dan Studi Kelayakan Kapal Penumpang VIII dan IXLA Summary of Final Reports on the Evaluation of Passenger Flows andFeasibility Study of Passenger Ships VIII and IX] (Jakarta: DirektoratJendera1 Perhubungan Laut, 1988), 7-8.
84
Decree regulated Prahus which had a gross capacity of more than 424.5
m3/ 120 HP by determining their operational regions (rayon), allocating
their capacity on each rayon, and designating their home bases and ports
of call (Appendix H). This marked the beginning of bureaucratic control
over Prahu shipping. However, before this small scale traditional
shipping was caught in complicated bureaucratic procedures, the Decree
was abolished by PAKNOV 21, a deregulation package on interisland
shipping issued on 21 November 1988. According to PAKNOV 21, all inter
island ships were free to determine their routes, allocate their capacity
on each route, and designate their ports of call.
Capacity of Perintis Shipping
The Perintis fleet, the fourth component of the Indonesian inter-
island fleet, has been operated since the beginning of REPELITA II
(1974/1975) to provide isolated and underdeveloped areas with regular
sea transport connecting these areas with the rest of the country. Since
Perintis shipping is highly subsidized, it is understandable that
fluctuation of its supply is determined by financial conditions of the
government. Perintis shipping was not established in the first year
of REPELITA I, but in the first year of REPELITA II, during which time
the government earned high oil revenues.
Between 1974 and 1982, the supply of perintis ships and their
capacity increased from 15 ships of 8,745 DWT to 36 ships of 20,805 DWT.
When government oil revenues dropped after the second oil boom, the
number of perintis ships declined from 36 ships in 1982 to 14 ships in
1987. In consequence, capacity fell from 20.805 DWT in 1982 to 8,1662
DWT in 1987 (Table 32; Figure 38).
85
Capacity of Special Shipping
The fifth component of Indonesia's interisland fleet, the Pelayaran
Khusus or special shipping, consists of log carriers, oil tankers, off-
shore oil logistic ships, industrial carriers (estate carriers, mining
carriers, and salt carriers), fishery (fishing vessels and fish carriers),
and forestry ships. This also includes a number of tugboats and
barges. 48 The total number of special ships and their capacity in
1975-1986 is shown in Table 33 and Figures 39 and 40, while the com
position of the special fleet is illustrated in Table 34.
Table 33 and Figures 39 and 40 show that between 1975 and 1986 both
the number of ships and shipping capacity increased by approximately
7 percent per year. This increase could be attributed to new entrants
and to the fact that special shipping was not affected by the scrapping
program. The new entrants consisted of ship imports, hire purchase and
chartered ships. The disappearance of chartered ships during the
PERTAMINA crisis49 made capacity in 1976-1977 decline (Tables 33, 35;
Figure 40).
A specific reason for the decrease of special shipping capacity
in 1982-1984 was the introduction of a cargo preference policy in 1982.
This policy, which was formulated in Presidential Decree No. 18 of April
1982, stated that all imports and exports of government goods had to
48Barges are special cargo carriers pulled by tugboat.
49The crisis was a severe financial crlS1S caused by the charterand hire purchase of many tankers by PERTAMINA and by the involvementof PERTAMINA in various non-oil projects.
86
carried by Indonesian ships. Such government goods included import and
export cargoes financed by the government or owned by state enterprises.
If space was not available on Indonesian operated vessels, priority would
be given to vessels chartered by Indonesian shipping companies before
foreign carriers would be allowed to transport the cargoes. As a result
of this policy, approximately 40 percent of import and export cargoes
were shipped by Indonesian flag carriers. 50 Since special ships are
tramps, which can go wherever and whenever their services are needed,
it was assumed that the introduction and implementation of the cargo
preference policy in 1982 encouraged special shipping companies to try
their luck by allocating their larger ships on ocean-going routes, so
that they could obtain government cargoes. For this reason, domestic
special shipping capacity decreased by approximately 16 percent per year,
from 3,404,346 DWT in 1982 to 2,416,321 DWT in 1984 (Table 33; Figure
40). This decrease would be more obvious if the transport of crude oil
t k . t t 51were a en ln 0 accoun .
Learning from the impacts of recession on Indonesia's economy,
the government realized that the country's dependence on energy exports
had to be reduced by promoting the development of non-energy sectors.
50Mary R. Brooks, Fleet Development and The Control of Shippingin Southeast Asia (Singapore: Institute of Southeast Asian Studles,1985), 14.
51Indonesia is the largest exporter of oil in Southeast Asia. SeeNational Development Information Office, "Post-Devaluation Package:New Measures Aimed at Stimulating Economy," Indonesia Development News10 (September/October 1986): 1.
87
In 1985, therefore, the government introduced a policy to increase non-
oil production as well as to promote non-oil commodity exports. This
policy was accompanied by INPRES 4/1985 which aimed at the removal of
the barrage of controls on trade, the improvement of port operation,
the simplification of tariff structure for interisland shipping, and
the removal of the requirement for foreign vessels to obtain an agency
permit to enter an Indonesian port. 52 These policies likely accelerated
the growth of interisland flows of both oil and non-oil commodities.
This was facilitated by the simplification of interisland freight rates,
the drastic reduction of port charges and the abolition of unofficial
port fees due to the implementation of INPRES 4/1985. In response to
the growth of interisland commodity flows, the supply of special shipping
capacity rose by 26 percent per year, from 2,416,321 OWT in 1984 to
3,798,269 OWT in 1986 (Table 33; Figure 40).
Frequency of Sailing
One of the sociopolitical objectives of Indonesian interisland
shipping is to increase frequency of sailing to all ports, particularly
to the far-flung ports in eastern Indonesia. By increasing frequency
of sailing it is expected that the availability of an adequate capacity
of sea transport can be ensured, equitable distribution of development
can be realized, interinsular communication and sociocultural exchange
can be improved, and national defense and security can be strengthened.
52Anne Booth, "Indonesia's Economy: Performance and Policy Optionsin Post-OPEC World," in Southeast Asian Affairs 1986, ed. Kernia1 S.Sandhu and Mohammed Ayoob (Singapore: Institute of Southeast AsianStudies, 1986), 132.
88
For these reasons, the government regulated sailing frequencies of each
ship sector together with allocation of shipping capacity and shipping
routes in the trayek regulations.
Discussion of this subject focuses on sailing frequency of Nusantara
shipping in 1981 and 1985. Since Nusantara shipping is the backbone
of Indonesian interisland liner shipping, its frequency of sailing
illustrates the sailing performance of interisland shipping liners in
general.
Tables 36 and 37 show the allocation of Nusantara ships and the
performance of Nusantara shipping in 1981 and 1985 in terms of number
of ships and capacity that can be made available, average shipping days,
and average productivity on each route. Shipping days include sailing
days, port days, docking times, and inactive shipping days. Inactive
shipping involves ships which are in lay up, broken down, or used for
other purposes such as to serve Perintis shipping, to support the trans
migration program or to carry out other government missions. Thus,
inactive shipping is a temporary withdrawal of a number of ships from
interisland shipping services.
It is obvious from Tables 36 and 37 that in 1981 and 1985 almost
all Nusantara ships sailed less frequently than they should have
according to trayek regulations. They 1ikewishe had a low load factor
per mile and less sailing days than port days. Repair time and inactive
shipping days were high. In 1981, 68 routes (90.67 percent) were served
less frequently than required by Nusantara ships, three routes (Nl, P5,
S13) were more frequently served, and four routes (N27, N37, N43, S8)
were served as designated by the 1979 trayek regulation. In 1985, a
89
year after the introduction of the scrapping program, the number of
routes which were less frequently served was reduced to 48 (70.6 percent),
while those which received more sailing frequencies increased to 20
(29.4 percent). Fifty-five percent of these 20 routes were located in
eastern Indonesia.
There are economic and sociopolitical reasons that the government
required all Nusantara ships to achieve a high frequency of sailing on
every route. 53 In discussing those reasons, one or two routes, particu-
larly those which have a high frequency of sailing, are chosen as
examples.
The N1 route connecting Be1awan (Medan), one of the Indonesian
gateway ports, with Aceh ports and Penang (see Appendix I) was served
by six Nusantara ships of 4,712 DWT, and 32 frequencies of sailing per
ship per year. The province of Daerah Istimewa Aceh is located in the
extreme west of Indonesia, where fanatical Moslems live. The war against
the Dutch (Perang Padri) in 1873-1900 had united Moslems in Aceh to free
their land from colonial rule. Perang Padri and other similar wars
throughout the country had led to the 1928 Youth Pledge. During the
Old Order government (1945-1965), however, a Moslem separatist movement
called Daru1 Islam, located in Aceh, West Java, and South Sulawesi, was
fighting against the central government for the creation of Negara Islam
Indonesia (the Moslem State of Indonesia). This movement failed to
achieve its objective and bogged down in the early 1960s. Since then,
the desire to create a Moslem State was continued in Aceh by a few
53See derived and economic and sociopolitical objectives inChapter III.
90
militant Moslems who proclaimed Aceh Merdeka, the independent Moslem
State of Aceh. Although this separatist movement also failed to achieve
its objective, the government directed a high sailing frequency of
Nusantara ships to Aceh ports in 1981 in order to strengthen national
unity, even though the ships had only a low load factor per mile. The
allocation of a high frequency of sailing was to improve sea communication
between Aceh and its neighbor provinces and to facilitate the movement
of goods and people to and from Aceh, to improve interregional contacts
and reduce parochialism. In addition, it was intended to integrate
Aceh, which was a producer of rice and agricultural products, LNG, woods,
palm oil, coffee, cement, and fertilizer, into the Indonesian market
system. 54
The P5 is a passenger/cargo route connecting Jakarta, Surabaya,
Ujung Pandang, Ambon, Sorong, Biak, and Jayapura. It covered three
development centers of west Indonesia and four development centers of
east Indonesia. 55 Four ships of 13,088 serve these areas on a thrice
weekly schedule. One of the objectives of frequent sailing by Nusantara
ships from Java and South Sulawesi to Maluku and Irian Jaya is to
increase the distribution of basic human needs and basic commodities
for development, particularly to economically weak areas. Another
objective of frequent sailing is to support the transmigration program,
540epartemen Penerangan, Rencana Pembangunan Lima Tahun Keempat1984/85-1988/89 [The Fourth Five Year Development Plan 1984/85-1988/89],vol. 4 (Jakarta: Percetakan Negara R.I., 1984), 18-19.
55Ibi d., 785.
91
which aims at moving people from Java and Sulawesi to Maluku and Irian
Jaya, to reduce population density in densely populated areas and improve
social and cultural unity. In addition, frequent shipping to east
Indonesia is to maintain the islands of Maluku and Irian Jaya, both
politically and administratively, as an integral part of Indonesia.
This implies that any separatist movement such as Gerakan Papua Merdeka
(the Papua Liberation Movement) would never be able to separate Irian
Jaya from Indonesia.
The above examples show the influence of government policies to
promote economic development and to strengthen national unity on the
determination of frequency of sailing. In this connection, the
Indonesian concept of Wawasan Nusantara has placed great importance on
interisland shipping. As mentioned earlier, however, many sailing
frequencies stated in the trayek regulation cannot be achieved. There
are two possible reasons why this is so.
First, since frequency of sailing changes according to the avail
ability of sufficient two-way traffic cargoes, an adequate supply of
shipping capacity, and sailing speed, it cannot be determined simply
by statistical data and regulations. Frequent changes in regulation
have not been based on a careful evaluation of the shipping situation.
Moreover, changes in shipping regulation are frequently followed by
implementation rules which confuse the carriers. As a result, the
carriers find it hard to comply. Instead of complying, the carriers
and government officials compromise. In consequence, frequency of
sailing determined by the trayek regulation has never been achieved.
92
Second, the low performance of Nusantara shipping in 1981 and 1985
(Tables 36 and 37) was actually a normal consequence of the interisland
shipping situation at that time. As mentioned earlier, in 1981 Nusantara
shipping was in a severe excess capacity (Table 23). Even though Table
23 shows that in 1985 overcapacity had been reduced by the introduction
of the scrapping program and Tables 36 and 37 indicate that in 1981 and
1985 not all shipping routes experienced excess capacity, overcapacity
still occurred. This was because other ship sectors also operated on
the same routes and, as a result, Nusantara ships had to compete with
them. In addition, domestic fuel prices at that time increased due to
the reduction of the government subsidy and return cargoes were difficult
to obtain during the recession. If return cargoes were available, they
would usually be insufficient and spread over several small ports, so
that ships were reluctant to pick up the cargoes. In such a situation,
it is understandable that some Nusantara ships were laid up and many
others operated at reduced speeds (slow steaming) and sailed less
frequently in order to reduce operational costs.
Since Nusantara ships spent more days in port than in sailing, it
can be assumed that they were waiting for a sufficient volume of cargo.
Cargo was not available in a particular port all year round. Cargoes
were limited seasonally. Spending more days in port could also be
associated with a low rate of loading and unloading cargo and a long
bureaucratic process in obtaining port services. All these factors
increased operational costs of the ships. As a result, ships would not
call at high cost ports. In order to be able to bypass a port, a ship
had to get dispensation from the government to deviate from its
--------------- ------------------
93
designated routes. Deviation from shipping routes reduced sailing
frequencies to a particular port and increased operational costs as well.
As discussed above, Nusantara ships still had to compete with other
ship sectors on the same route for a certain volume of cargo in a limited
time. Competition usually encouraged carriers to increase speeds, but
it was not necessary to increase frequencies of sailing. Frequencies
of sailing would probably be reduced because competition tended to lower
freight rates. Heavy discounting of official tariffs was a clear example
of the existence of low freight rates during competition. 56 Combined
with uncertain availability of cargo, low freight rates would of course
discourage carriers, both Lokal and Nusantara, to increase their
frequency of sailing. With respect to Perintis shipping, it was reported
that in 1982-1986 the number of sailing days and frequency of services
could not be achieved as planned. This was because ships had to spend
more days in port due to lack of port facilities; docking and repairs
were behind schedule; and substitution for inactive Perintis ships was
t " . 57lme consumlng.
Regularity of Services
Regularity of services implies that interisland shipping is carried
out on fixed time schedules, with regular frequency of departures and
56For an excellent discussion on freight rates see Howard W. Dick,The Indonesian Interisland Shipping Industry: An Analysis of Competitionand ReguJatlon (S1ngapore: Instltute of Southeast ASlan Studles, 1987),158-80.
57proyek Armada Perintis, Laporan Tahunan Pengoperasian ArmadaPerintis 1985/1986 [Annual Report on the Operatlon of Ploneer Fleet198571986] (Jakarta: Direktorat Jenderal Perhubungan Laut, 1986), 42.
94
arrivals. Fluctuation of frequency of departures and arrivals will cause
irregularity of services. In liner shipping, irregularity of services
has to be adjusted quickly to the existing shipping schedules. If not,
new shipping schedules must be introduced and made public. Otherwise,
liners should be considered tramps.
Maintaining a constant frequency of departures and arrivals in
accordance with shipping schedules is the most important aspect of a
regular shipping service. In Indonesia, the regularity of services
depends on the process of obtaining port services, the speed of loading
and unloading, and shipping schedules.
The Process of Obtaining Port Services
As has been discussed in Chapter III, the process of obtaining port
services is long. It begins a few days before arrival of the ship and
involves complicated bureaucratic procedures which are regulated by the
government (Figure 24). This usually prevents the ship entering and
departing the port on time. In consequence, liner shipping services
become irregular. In such a situation, short cuts in the procedures
usually are made by government officials through the manipulation of
regulations. Even though these long procedures have been simplified
by INPRES 4/1985, irregularity of shipping services still persists.
Regularity of shipping services is also influenced by the speed of
loading and unloading.
The Speed of Loading and Unloading
The speed of loading and unloading, in turn, depends on the physical
condition of the port, the availability of adequate port facilities and
95
labor, and the volume of cargo available. One of the major problems
facing Indonesian shipping at the present time is that of siltation of
the ports. Siltation of ports is due to faulty site selection, poor
design, and corruption of government officials and contractors. 58
Siltation of the ports hampers the movements of ships and often prevents
ships from entering the port. The ships have to anchor at offshore,
either waiting for high tide to enter the port or loading and unloading
cargo at the anchorage. The process of loading and unloading in offshore
areas may cause cargo damage due to strong currents. It almost always
increases expenses of the ship because it involves additional facilities
such as barges, floating cranes, and tugboats. In addition, communica-
tions between port and offshore areas need additional time. The process
of loading and unloading in offshore areas is risky, costly, and time
consuming. As a result, liners have difficulty maintaining their regular
schedules. In Semarang, for instance, ships of more than 3,000 OWT have
to anchor about three miles offshore. Likewise, vessels of Nusantara
size have to wait for high tide before berthing at the ports of Malahayati
(Banda Aceh), Pulau Baii (Bengku1u), Ende (Flores), Martapura (Banjar
masin), and Merauke (Irian Jaya).59 In general, all the ports of
northern Java and eastern Sumatera need to be dredged to remove the silt
carried down by the rivers over the years. They could be of more value
if deepened. The same is true of river ports some distance upstream,
like Palembang and Pakanbaru, which are less effective than they should
58Kompas (Jakarta), Selasa, 31 Januari; Kamis, 2 Februari; Sabtu,4 Februar; 1989.
59 Ibi d.
96
be. Another physical problem of the ports is location in relation to
monsoonal winds and currents. During the north monsoon, for example,
vessels cannot load and unload cargo on schedule at many ports of
Kepulauan Riau and Ma1uku, such as Ranai (Natuna) and Ternate (North
Maluku).
In addition to physical condition of the port, the availability
of sufficient port facilities also determines the rate of loading and
unloading. Not all Indonesian ports have adequate facilities for
handling cargo. In February 1989, for instance, it was reported that
operational capacity of quays of 110 feeder (supplier/origin) ports was
only 60 percent of the capacity which was originally planned, and 344
feeder ports had no facility at all for berthing, loading, and unloading.
The development of these ports was incomplete due to the manipulation
of port development budgets by contractors and government officials. 60
As a result, not all vessels calling at those ports, particularly at
the 344 feeder ports, can be berthed and loading and unloading have to
be carried out by manual labor. Nearly all domestic cargoes are still
being handled by conventional labor intensive methods. Domestic cargoes
are breakbulk, usually packed in cartons, drums, bags or baskets, with
only a few using pallets. Therefore, cargo operations are time consuming
and there are increased handling costs. The result is a very low output
as the vessels have to spend long periods alongside the quay. There
is likewise a high incidence of cargo damage during the handling process.
60Ibi d. According to Ministerial Decree No. 20 (20 February 1988),there are 454 operational feeder ports spread over 23 provinces.
97
Under such circumstances it is evident that fixed and regular departures
and arrivals are difficult to maintain. It is obvious that those ports
cannot function properly as points of contact between their hinterlands
and the rest of the archipelago.
Another reason for delays in loading and unloading is that a
sufficient volume of cargoes cannot be made available at the time when
ships are berthing at a port. The availability of cargoes at a particular
port depends on land transportation which connects the port with its
hinterland. In Indonesia, land transportation constitutes a problem
which needs consideration. The total length of roads and highways is
inadequate to accommodate the need for transport. The arterial networks
on the outer islands are generally discontinuous. Some of them are
damaged due to poor construction and overloaded vehicles. The axle load
of almost all roads and highways is not more than eight tons; only a
few have an axle load of up to 20 tons. Furthermore, the load limitations
of bridges affect the capability of land transport to carry heavy weight
cargoes. Road congestion such as in Jakarta and Surabaya is an additional
barrier to the movement of cargoes between ports and their hinterlands.
Unlike the roads and highways, the railways have not been able to attract
cargoes due to limited axle load (8-14 tons), insufficient space and
lack of facilities for handling a large-volume of cargoes. Moreover,
most of the utilization of railways in Java is for the transport of
passengers. However, the railways have made a significant contribution
to the transportation of industrial commodities such as petroleum,
fertilizer and cement in Java, coal in South Sumatera, cement and coal
in West Sumatera, and palm oil in North Sumatera. In addition to roads
...._-_._--_ ..- •..__ . ----------------
98
and railways, inland waterways are also used to transport goods to the
ports, particularly in part of Sumatera, Kalimantan, and part of Irian
Jaya. The goods generally consist of agricultural and forestry products,
which are seasonal in character. The speed of transporting these products
is usually slow, because it depends on the speed of the carriers, which
are usually traditional wooden motor vessels, and the physical character-
istics of the rivers such as meanders and seasonal floods. The avail-
ability of cargoes at a port is determined by the seasonal production
of agriculture and forestry and by the speed of commodity flows. It
will take time to achieve a sufficient volume of freight required by
a merchant ship. In consequence, departures and arrivals of the ship
are often behind schedule and, as a result, the ship has to spend more
days at port. The ship wastes time in port (idle time). In addition
to idle time, inactive shipping days, such as docking days, which are
behind schedule can also be a cause of delays.
Shipping Schedules
The above discussion has concerned factors which can result in
irregularity of services. Those factors, however, are only indicators;
they are not actual evidence of the existence of irregularity. Evidence
of irregularity of services can only be found in the implementation of
shipping schedules. Results of the implementation of shipping schedules
used in this discussion are derived from the experiment of the Integrated
Liner System (ILS) carried out by the Directorate General of Sea
Communications from April to December 1985.61
61 The implementation of the ILS project was based on the Decrees ofDirector General of Sea Communications No. UM.48/10/10-85 (8 April 1985)and No. AL.63/1/2/85 (30 Maret 1985).
99
The ILS experiment was the realization of advice and recommendations
provided by the Netherlands Shipping Team since 1968.62 The ILS was
proposed by the Netherlands advisory team to replace the existing Regular
Liner System (RtS). The main objective of the ILS experiment was to
find an appropriate model of integrated liner shipping in Indonesia,
so as to promote regularity of inter-modal services. 63 Between April
and July 1985, the first phase of ILS involved 32 Nusantara ships of
11 shipping companies, with a total capacity of 60,163 DWT (Table 38).
Six shipping routes were employed to connect 15 ports, consisting of
two gateway (main) ports, seven trunk (collector/transshipment) ports,
and six feeder (supplier/origin) ports (Tables 39, 40). During the
second phase (August-December 1985), those 11 shipping companies
contributed 37 Nusantara ships of 60,982 DWT to the ILS program (Table
38). These ships served 27 ports which were connected by six shipping
routes (Tables 39, 41).
From the implementation of ILS shipping schedules (Tables 42, 43,
44), it is obvious that more than 70 percent of the total number of ships
departed and arrived behind schedule, approximately 20 percent were ahead
of schedules, and more than 5 percent were on schedules (Table 45).
More than 90 percent of the total number of ships carried out irregular
62For detailed historical information see Howara W. Dick, TheIndonesian Interisland Shipping Industry, An Analysis of CompetitTonand Regulatlon (Slngapore: Instltute of Southeast ASlan $tudles, 1987),192 no. 13.
63For a detailed implementation of ILS see Team Pengenda1i danPengawas Uji Coba ILS, Laporan Eva1uasi Pelaksanaan Uji (oba ILS [Reporton Evaluation of ILS Trials] (Jakarta: Olrektorat Jenderal PerhubunganLaut, 1986).
100
services. According to the ILS reports, the main reasons fer irregu-
larity were too many port days, route deviation, and the omission of
designated ports. 64 Most deviations and omissions by many ILS carriers
were based on government dispensations or specific permissions either
from the Directorate General of Sea Communications or from the Chief
of Sea Communication District. The ILS team reported that between April
and July 1985:
Eighteen vessels carried out deviation, one of which (KM.Mahaja) obtained three government's dispensations to deviatefrom the designated routes for 71 days. Ten vesselsomitted 18 ports. Thirty-seven government's dispensationswere issued during that time, nine of which were issuedby the Directorate General of Sea Communications and 28of which by the Chief of Sea Communication District, whilefive of which were unknown. 65
It was also reported by the ILS team that during the second phase of
ILS implementation:
Seven ships deviated from 4AA routes 24 times.Three ships deviated from 4AB routes 20 times.Five ships deviated from 5AA routes 28 times.Five ships deviated from 5AB routes 32 times.Three ships deviated from lOA routes 11 times.Two ships deviated from llA routes 17 times. 66
In addition to the ILS reports, the Interisland Shipping Combined
Operations Board (BOPBERPAN) reported that in 1981-1985 there were
deviations and omissions by many Nusantara ships. In 1985, for example,
approximately 106 ships of 183,532 DWT deviated from the routes, and
about 151 ships of 170,672 DWT omitted the designated ports every month.
By the end of 1985, 89 ships of 163,607 DWT were allowed or given
64Ibi d., 3-8. 65Loose translation. See Ibid., 4.
66Loose translation. See Ibid., 6-7.
101
dispensations to deviate from the routes to carry essential commodities
such as rice, cement and fertilizer; to support the transmigration
program; and to substitute 24 ships of 21,155 DWT which were not in
Nusantara service. At the same time, 159 ships of 183,984 DWT had
omitted several designated ports of call from their routes (Table 46).
Between April and July 1985, dispensations were also granted to eight
Loka1 vessels and 31 Prahus to call at ILS ports which were not their
designated ports. Between August and December 1985, 30 Nusantara (non
ILS) and Loka1 ships were allowed by the government to deviate from their
designated routes to ILS routes. 67 From the above evidence it could
be assumed that Nusantara, Loka1 and Perintis shipping had failed to
provide interisland trade with regular services, and this irregularity
has probably persisted up to now.
A long bureaucratic process of obtaining port services was estab
lished by port regulations in 1980. In the implementation of port
regulations, several additional rules and operational procedures were
introduced, and this had made the process longer and more complicated.
In consequence, carriers had to spend more days in port to finish their
business with each port division. For this reason, in 1985 the govern-
ment deregulated port services by launching INPRES 4/1985. In the first
two years of its implementation, this deregulation had brought about
simplification of port procedures, reduction of customs involvement,
and decrease of port charges. 68 One of the causes of irregularity, i.e.,
67Ibid., 5, 53-54, 74-75.
68While before INPRES 4/1985 interisland shipping rates betweenJakarta and Singapore reached US $500 per box of container, now they
102
irrelevant port regulations, had been removed. However, irregularity
of services still exists. Port services and procedures have still to
be improved and there are other causes of irregularity that have to be
eliminated.
The regularity of services requires a continuous supply of a
sufficient volume of cargo and this, in turn, requires a consolidation
of cargo either at the port of origin or at the port of transshipment.
The availability of a sufficient volume of cargoes at the port of origin
will attract ships to call at that port; otherwise they will omit that
port. These calls are only made on incentive bases. Shippers in the
outer islands collect a sufficient volume of cargoes to arrange space
charter on Nusantara or Lokal shipping services or they negotiate for
a route deviation. This arrangement is often used because the use of
feeder services may cause high costs of transport, in turn caused by
the high costs of handling, and port dues in transshipment ports. Thus,
the high difference of costs between direct shipment and transportation
of cargoes through transshipment has discouraged shippers from trans
porting their cargoes through transshipment ports. Instead, shippers
collect a sufficient volume of cargoes and arrange direct shipment by
space charter or route deviation agreements. This arrangement has
attracted many liner vessels to call at nearly all ports and, as a
have effectively come down to US$ 260 per box of container. In addition,importers claim at least a 20-30 percent reduction in costs and a smallnumber of interisland carriers experience a decrease in port days.
See Marine Research Institute Netherlands and P. T. PoliteknikJakarta, General Aspects of Cargo Unitization and Finding and Recommendations in Relatlon to Cargo Onltlzatlon (Jakarta: Olrectorate Generalof Sea ConmUnlCatlons, 1987), 17.
103
result, this causes a disturbance of the regularity of shipping services.
Transshipment of interisland cargoes and regular shipping services are
practically nonexistent in Indonesian interisland shipping.
The route system designated by the government is unable to ensure
the availability of a sufficient volume of cargo at ports. The shipping
route regulations have failed to guarantee that liner vessels allocated
on the designated routes will obtain an adequate volume of freight at
their ports of call. Since an adequate volume of freight is not always
available at all ports, the problems of thin and fat routes appear.
It is understandable that all shipping companies want to operate their
vessels on fat routes and, in consequence, they compete for a fat trayek
permit. Those who have close relationships with government officials
will find it easy to acquire that permit. They may have to pay approxi
mately Rp 400,000 (US$ 235) for a permit. 69 This permit has to be
renewed every year, even though according to shipping regulations a
trayek permit is actually valid for five years. Hence, the issuance
of trayek permits becomes a source of manipulation and corruption by
government officials. Shipping companies are not free to choose shipping
routes for their own vessels. Once a trayek permit is issued, vessels
are not allowed to change their routes. Therefore, those who obtain
a thin trayek permit cannot deviate from the thin routes to the fat
routes. In order to deviate from a shipping route or to omit a
designated port, vessels have to obtain a special permit called govern-
ment's dispensation. Like the t~ayek pe~mit, dispensation of the
government is easy to acquire as long as shipping companies have good
69Kompas (Jakarta), Minggu, 27 Nopember 1988.
104
personal relationships with the government officials. Since the
enforcement of shipping regulations is weak, many ships have dared to
deviate from their original routes or to omit several designated ports
without dispensation from the government. The presence of such deviation
and omission during the implementation of the ILS program is a good
example of such circumstances. From a service point of view the quality
of sea transport is so poor that it should not be termed "liner shipping."
Shipping policies and regulations are no longer effective rules
which govern Indonesian interisland shipping. Instead, in their imple
mentation, they have become rules of a few government officials who
hold the power to control supply of and demand for shipping. As has
been reported elsewhere,70 the control of sea transport in Indonesia
has always been carried out by binding supply of shipping with various
regulatory policies, numerous licensing requirements and complicated
procedures. In consequence, interisland shipping becomes inefficient
and is a high cost industry. Barriers to smooth interisland commodity
flows have existed for years. These barriers are removed by PAKNOV 21
(deregulation package of 21 November 1988) through the abolition of
trayek regulations and the simplification of the licensing system. After
being substantially closed for 13 years, opportunities to establish a
shipping company are now reopened. Shipowners are no longer required
to have two ships; one ship is enough to establish a shipping company.
They have to obtain only one business license, which will include a
70Ibid. See also Mary R. Brooks, Fleet Development and The Controlof Shipping in Southeast Asia (Singapore: Institute of Southeast AsianStudles, 1985), 63-65. Kevin Chinnery, "Trade First, Again," Lloyd'sMaritime Asia (March 1989): 17-19.
105
shipping license. Types of business licenses are reduced from five
(overseas shipping license, Nusantara shipping license, Lokal shipping
license, special shipping license, and Prah~ shipping license) to two
(overseas shipping license and domestic shipping license). Beginning
on the first of January 1989, shipping companies are allowed to determine
their own trayek and to deviate from this trayek, provided that they
give a month1s prior notification to the Directorate General of Sea
Communications. By deregulating trayek it is expected that competition
can be improved, and, as a result, shipping deficiencies can be removed.
The PAKNOV 21 is therefore to improve shipping quality and regularity.
CHAPTER V
THE IMPACT OF SHIPPING PERFORMANCE
AND REASONS FOR SHIPPING DEFICIENCIES
The performance of Indonesian interisland shipping has been
deficient in regularity for years. Overcapacity, infrequent sailing,
route deviations, and port omissions are characteristics of interisland
shipping services. These need improvements if the nation is to achieve
economic and sociopolitical objectives. In order to provide suggestions
for improvement, this chapter discusses the impact of shipping performance
on commodity and passenger flows and the degree to which shipping policy
has achieved government goals. It also identifies reasons for shipping
deficiencies. Since to increase commodity and passenger flows is one
of the shipping policy objectives, several repetitions of arguments may
be found elsewhere in this discussion.
The Impact of Shipping Performance
Background
The most obvious impact of ship traffic performance on spatial
relationships in Indonesia can be seen in the characteristics of
commodity and passenger flows throughout the archipelago. Commodity
flows between two or more areas led to the identification of export and
import regions. The words "export region" here refer to areas which
have more loaded than unloaded cargoes and the "import region" relates
to areas which have fewer loaded than unloaded cargoes. Long term export
and import relationships between two or more regions may result in trade
107
interdependency. A region generally requires regular services of
adequate capacity to maintain trade interdependency relationships with
other regions. Regularity of services, in turn, needs the availability
of a sufficient volume of two-way traffic cargoes. Otherwise. the region
is dependent on supply of both commodities and shipping from other
regions. This leads to the identification of "fat" and "thin" regions.
Irregular services between fat and thin regions reflect the
relationships of trade dependency between center and periphery. Such
services hamper the interchange between the center and peripheral regions
of different economic production and create incoherence in social and
economic conditions. This indicates that there is disharmony of
interests between the center and the peripheral regions. which can widen
inequality between the two. The center regions, for example, are
interested in centralization of shipping services so that they can
control the movement of cargoes. On the other hand, the peripheral
regions are interested in regular shipping services so that they can
organize their local production to match the available transport move-
ments. In such relationships, however, there is harmony of interests
between the core of the center regions and the core of the peripheral
regions,l because both of them are centers of government and accumulation
and distribution of commodities. However, since the interisland services
are irregular, the core of the peripheral region cannot fully function
as the center of accumulation and distribution of commodities within
its region. The pattern of cargo distribution between the core and its
lJan Servaes, Communication and Development (Netherlands: ACCO,1983), 18.
108
hinterland is weakened, and the flow of local production from the
hinterland to the core is discouraged by irregular shipping services.
In consequence, the relationships between the core of the peripheral
region and its hinterland will probably be missing and the peripheral
region remains weak and underdeveloped. This leads to the formation
of a "lagging region." The existence of lagging regions is usually
evidence of social and economic cleavages between the center and the
peripheral regions. Not all cleavages lead to national disunity. How-
ever, where sociopolitical and economic cleavages coincide, they are
likely to constitute serious problems of national disunity.2
To overcome the above problems, trade relationships among the
regions of the archipelago have to be maintained through the improvement
of regular shipping services. The improvement of regular shipping
services will, in turn, narrow social and economic gaps, promote harmony
of interests, and create trade interdependency relationships between
the center and the peripheral regions. However, it should be noted here
that the supply of regular shipping services to the thin (peripheral)
regions must involve a trade-off between economic and sociopolitical
objectives. The allocation of Perintis ships to remote areas, for
instance, is to achieve sociopolitical objectives at the expense of
moving away from economic objectives. Even though the thin regions are
still economically dependent on the fat (center) regions, regular
shipping services to the thin and other peripheral regions might
facilitate the creation of sociopolitical homogeneity throughout all
2Richard Hartshorne, "Political Geography," in American GeographyInventory and Prospect, ed. Preston E. James and Clarence F. Jones(Syracuse: Syracuse University Press, 1954), 196-97.
109
regions. The transport of transmigrants from densely populated center
areas to peripheral regions is a clear example of a government program
aimed at promoting greater understanding among the nation's many ethnic
groups and strengthening national cohesion. The sociopolitical objec
tives of this program are to create homogeneity of attitudes, uniformity
of relations, and to increase harmony of interests between the center
and the peripheral regions. The expected result of achieving socio
political objectives is the formation of a politically homogeneous region.
A state is [a] politically homogeneous region if in allits diverse areas there is homogeneity of attitudes anduniformity of relations between the political organizationand the people. A state may be regionally homogeneouseven though there are marked differences, even conflicts,in political attitudes among different social groups,provided these conflicts are fairly evenly distributedthroughout the state. It may be said that such a stateis heterogeneous, or lacking of uniformity, in the verticalsense, but homogeneous in the horizontal sense. 3
The availability of regular shipping services throughout the regions
implies that each region is treated equally. This leads to the notion
that regular shipping services can be used to reduce vertical hetero
geneity and to extend horizontal homogeneity.
In Indonesian national development, interisland shipping facilitates
government efforts to bring about changes in political, economic, social,
and cultural life towards ultimate goals stated in the Wawasan Nusantara,
i.e., national unity. This implies that although economic growth is
fundamental to national development, the real yardstick of success should
be the extent to which it satisfies sociopolitical and cultural needs.
Therefore, national integration can be achieved if the structure of
3Ibi d., 196.
110
society is not neglected. Two of the most successful efforts in this
respect have been "the creation of a national language, Bahasa Indonesia,
aimed at promoting a sense of national identity among the people,'.4 and
the promulgation of the archipelagic state principle, a territorial
concept designed to integrate the archipelago, its people, and its
natural resources.
However, national integration is still constrained by the problems
of vertical and horizontal heterogeneity. The problems of horizontal
heterogeneity include factors related to regional diversity, including
geographical, demographic, economic, social, and cultural diversity.
The problems of vertical heterogeneity are generally associated with
political organization of the state, administration of the state, and
the economic development system carried out by the state. Indonesia
is organized politically into divisions according to administrative
levels (central, provincial, district, subdistrict, village, and other
lower divisions). Each level differs in the degree of regional
homogeneity based on various administrative functions and degree of
autonomy. 5 The operation of interisland ships, particularly government
ships and state-owned shipping company vessels, represents lines of
communication from the center to all regions of the archipelago. There-
fore, regular interisland shipping services can facilitate a constant
flow of authority between the centers of government and the different
regions of the country.
4Muhammad A. S. Hikam, "Communication and Rural Development inIndonesia: A Framework for Policy" (M.A. Thesis, University of Hawaii,August 1987), 49.
5Ibi d., 180-88.
111
The center-periphery relationships of commodity flows and the top-
down approach in the administration of the state have characterized the
national economic development system since the beginning of REPELITA.
The adoption of a growth pole model or growth centers6 in regional
development is a clear example of the influence of such relationships.
Even though a growth center is capable of rapid growth and of trans-
mitting that growth through multiplier effects to other sectors of the
economy in other regions, in its implementation it is colored by various
policies of government participation in interisland shipping rather than
ones of government regulation. The former refers to a government direct
involvement in shipping activities such as allocating ships on a
particular route, designating ports of call, and establishing state-
owned shipping companies. The latter, on the other hand, refers to
government control over shipping activities, whereas these activities
are carried out by shipping companies. As a consequence of government
participation, many ships are allocated at the centers of development,
which are also the centers of government. Examples of such centers are
the four gateway ports of Indonesia: Medan, Jakarta, Surabaya, and Ujung
Pandang. Irregularity of interisland shipping services combined with
strong participation of the government in shipping will apparently create
unequal spread effects--the transmission of growth from the center to
its surrounding regions via trading opportunities. It might create
backwash effects, which increase development gaps and accelerate vertical
heterogeneity between the center and the peripheral regions. In response
6Srian Goodal, "Groth Pole," in Dictionary of Human Geography, ed.Brian Goodal (Harmondsworth: Penguin Books, 1987).
112
to the problems of vertical and horizontal heterogeneity, the implementa
tion of Wawasan Nusantara is being improved in all development sectors.
The Impact of Shipping Performance on Commodity Flow
The impact of shipping performance on the movements of goods and
people can be shown by examining statistical data of passenger flows
and interisland cargo traffic by ship sector and commodity group.
According to the Indonesian Central Bureau of Statistics, there are 35
groups of interisland commodities transported by ships. For the purpose
of analysis in this study, the 35 commodity groups are divided into three
divisions of commodity: basic human needs, basic commodity for develop
ment, and other trade commodities. The first two divisions each comprise
12 commodity groups and the latter includes 11 commodity groups (Table
47; Appendix K).
The inclusion of 12 commodity groups in the first division is based
on the fact that these commodities, particularly rice and other food
products, are most needed by the people in their daily life. Of
strategic importance is that a sufficient supply and equitable distribu
tion of basic human needs for Indonesian people, the fifth largest
population in the world, will strengthen economic and political stability.
Specifically, an adequate food supply, equitable food distribution, and
a diversity of food consumption will alleviate hunger problems and
improve nutritional values of Indonesian people. To facilitate a smooth
distribution of basic human needs, the government carries out a price
stability policy on sembilan bahan pokok (nine principal commodities)
such as rice, meat, wheat, sugar, coffee, food, palm oil, salt, and
113
kerosene, so that these commodities and other basic human needs are
within the reach of the purchasing power of the people.
The second commodity division is formed on the basis of "the7util ity of goods for development." The word "goods" here refers to
natural and cultural resources. 8 Thus, the utility of goods is the
capacity of these resources to support development in various sectors
as to give satisfaction to demands to the public. Therefore, basic
commodity for development includes resources widely used in such develop-
ment sectors as agriculture, industry, mining, energy, pUblic works,
and transportation. The third commodity division consists simply of
those not included in the first two divisions.
Since the beginning of REPELITA II (1974/1975), the three divisions
have shown annual increases in amounts shipped, with a large-volume of
oil and oil products dominating. By the end of 1989, the total volume
of commodity flows is estimated to increase to 44,012,835 tons from
24,210,849 tons in 1984 (Table 19). The total volume of cargo flow by
division of commodity in 1979 and 1984 is shown in Tables 48, 49, and 50.
These tables show the distribution of basic human needs, basic commodities
for development, and other trade commodities throughout the archipelago.
Export and import regions can be identified from those tables. The
number of export regions of basic human needs increased from 11 in 1979
7Brian Goodal, "Utility," in Dictionary of Human Geography, ed.Brian Goodal (Harmondsworth: Penguln Books, 1987).
8J. Russell Whi taker, "The Geography of REsrouces," in Ameri canGeography Inventory and Prospect, ed. Preston E. James and Clarence F.Jones (Syracuse: Syracuse University Press, 1954), 277-29.
114
to 16 in 1984. while those of basic commodity for development increased
from nine to 15 regions. At the same time. the number of export regions
of other trade commodities decreased from 22 to 21. The number of export
regions is smaller than import regions (Table 51). Tables 48. 49. and
50 show that Bengku1u. South Ma1uku, North Irian Jaya III, and South
Irian Jaya II are fully dependent on supplies from other regions. Sabang
is likewise fully dependent on supply of the first and the third
commodity division.
Tables 48-51 indicate that most export and import regions are
located in west Indonesia, particularly Java and Sumatera. 9 This is
supported by the fact that a large population lives in Java and Sumatera
(Figure 8); Java is the principal location for foodcrop production,
manufacturing and processing industries, while Sumatera is the main
producer of estate and mining products. One of the world's busiest
straits is located between Sumatera and Peninsular Malaysia, with
Singapore as the international transshipment port, and many ports of
Indonesia are concentrated in Java and Sumatera (Figure 11). On the
other hand, many regions of east Indonesia have low population densities.
significant unexploited natural resources, and scattered ports.
Scattered ports imply that distances between markets and supply are great
and costly to overcome. This leads to the shift of supply areas from
east to west Indonesia, where widely differing resource production and
industries are availab1e--intervening opportunities of Java's competitive
9Boundaries between east and west Indonesia are the Lombok-MakassarStraits.
::
115
10sources and markets. In 1984, for example, Java received more fish
supplies from North Sumatera, Riau, South Kalimantan, East Kalimantan,
and Bali than from Nusa Tenggara, Sulawesi, Ma1uku, and Irian Jaya all
together. Another example, demands for animal feeds in East Java were
supplied mostly from Bali rather than from Sulawesi, Nusa Tenggara, and
Ma1uku. 11 The shift of supply areas from east to west Indonesia can
also be explained by the fact that more industries are developed in
west Indonesia than in east Indonesia. In consequence, more ships
operate on fat routs in the western part of the archipelago (fat region)
than on thin routes in the eastern part of the archipelago (thin region)
(Tables 52-75). Many ships prefer competing with each other for cargoes
in the fat region to transporting cargoes to the thin region, where a
sufficient volume of return cargoes is often not available and freight
rates are very low compared to fixed costs. 12 This results in an
irregular pattern of cargo distribution.
Table 19 shows that in 1989, oil tankers ship the largest volume
of i nteri s1and cargo, and they rank fi rst among the sh i p sectors. In
the same year, foreign ships, ocean going ships, vegetable oil tankers,
10Edward L. Ullman, "Geography as Spatial Interaction," in Transportation Geography: Comments and Readings, ed. Michael E. Eliot Aurst(New York: McGraw Alll, 1974), 30-34.
llBiro Pusat Statistik (BPS), Interisland Cargo Traffic by CommodityGroup, Region of Origin and Region of Destlnatlon 1984 (Jakarta: BPS,1986), 21, 22, 85.
12Maritime Research Institute Netherlands and P. T. PoliteknikJakarta, General Aspects of Cargo Unitization and Findings and Recommendations in Relatlon to Cargo Unitization (Jakarta: Directorate Generalof Sea Communications, April 1987), 34.
------_. -----------------------------------
116
and other interisland vessels rank respectively seventh, eighth, ninth,
and tenth. Whereas the ranks of these five ship sectors are stable,
the rank composition of the other five ship sectors shift. As the back-
bone of regular shipping services, Nusantara and Lokal ships cannot hold
their positions, although volume of their cargoes increase. In 1979,
Nusantara ships ranked second after oil tankers. Since the movement
of oil and oil products is a monopoly of oil tankers, Nusantara ships
could be viewed as holding the first rank in 1979. In 1984, however,
the second rank was occupied by special ships and Nusantara ships fell
to the third rank. In 1989, the position of Nusantara ships is predicted
to fall again to the fourth rank, surpassed by barges. The position
of Lokal vessels in 1979 was taken over by barges in 1984. Barges moved
up from fifth in 1979 to fourth in 1984 and then to third place in 1989.
Lokal vessels, on the other hand, fell two steps from fourth in 1979
to sixth in 1984 and in 1989 and at the same time Prahus moved up from
sixth to fifth. Extreme competition from barges, special ships, and
Prahus put freight rates of Nusantara and Lokal vessels to low levels,
even lower than the regulated (official) tariffs. 13 Severe competition,
low freight rates, and insufficient return tonnage of cargoes14 are
obstacles to regular service by Nusantara and Lokal vessels.
Three examples may help to explain the impact of irregular shipping
services on commodity flows. In 1988, fish traders in Samarinda (East
Kalimantan) waited for a ship too long to transport their fish to
13Ibi d., 34.
14Thi s is a conclusion of Table 51, which shows more import thanexport regions.
117
Surabaya; the representative of P. T. Meratus in Kendari (Southeast
Sulawesi) waited for its vessel for more than a month to ship cargoes
to Jakarta; and traders in Southeast Maluku and South Irian Jaya
complained about not having enough regular services. 15 These cases
indicate that delay and cancellation of shipments are direct results
of route deviations and port omissions. The indirect results of
irregular shipping services are the worsening of trade relationships
between producers and consumers. To overcome this problem, shippers
usually try to get access to other nearby ports by chartering either
non-commercial vessels, such as small wooden fishing vessels, or use
land transport at lower cost. If there is no alternative, the area is
for practical purposes in temporary isolation. If such an area is
located in west Indonesia, the area will form an enclave within the fat
region. Such enclaves may be found along the west coast of Sumatera,
including the Mentawai Archipelago, and in the northern part of the Riau
Archipelago. Before 1989, Padang, the capital city of West Sumatera
Province, and Bengku1u, the capital city of Bengku1u Province, experienced
several periods of temporary iso1ation. 16 If ports of Padang and
Bengku1u can become temporary enclaves, there may be other smaller
temporary enclaves in the western part of the archipelago. If the
enclaves are relatively permanet, they will form "lagging regions."
The lagging regions may be found particularly in Southeast Maluku,
along the south coast of Irian Jaya, and along the east coast of
15Kompas (Jakarta), Rabu, 23 November 1988.
16Kompas (Jakarta), Sabtu, 9 Ju1i 1988; Se1asa, 31 Januari 1989.
118
Halmahera. This indicates that feeder shipping does not exist and that
the pattern of cargo distribution is irregular.
Irregular patterns of cargo distribution are also caused by con
centration of ships at growth centers, such as Jakarta and Surabaya.
Tables 52-75 show six major regions of origin and six major regions of
destination by divisions of commodity and by ship sectors. The selection
of these regions was based on the volume of loaded and unloaded cargoes.
"Six" is not a magic number; it was chosen because five regions would
be located on five main islands and one in either the Riau or the Maluku
Archipelagoes. Those tables illustrate the center-periphery patterns
of commodity flows in 1984, in which Jakarta and Surabaya were the cores
of the whole archipelago, representing the implementation of a growth
center model in sea transportation. Accumulation and distribution of
commodities from and to all regions of the country were maintained from
these two cores (Tables 48-50, 52-57). The commodity flows to and from
Jakarta and Surabaya were carried primarily by Nusantara ships, Lokal
vessels, and Prahus (Table 76). Table 76 shows the concentration of
interisland cargo traffic by ship sector and by division of commodity
at 25 growth centers in 1984. Eighty-eight percent of the growth centers
were located in west Indonesia. If Jakarta I, Jakarta II, West Java,
Central Java I, Central Java II, East Java, and Surabaya (Java) are
considered the center regions of Indonesia, the other 18 growth centers
can be considered semi-peripheral regions.
The centralization of commodities and ships in certain growth
centers has resulted in a vertical (dependency) pattern of commodity
flows between the center and the peripheral regions, irregularity of
119
distribution of cargo throughout the country, formation of temporary
enclaves and lagging regions, weakening horizontal patterns of trade
relationships among the peripheral regions, and imbalance of development
between east and west Indonesia.
To prevent enclaves from forming and to open remote areas are the
primary objectives of Perintis shipping. Between 1982 and 1986, Perintis
ships served eight regions, including the west coast of Sumatera, the
Riau Archipelago, East Java, Nusa Tenggara, the south coast of Kalimantan/
Central Java, the Sangir-Talaud Archipelago (North Sulawesi), Maluku,
and Irian Jaya (Figure 28). The performance of Perintis ships in 1985
was considered unsatisfactory due to infrequent sailing, irregularity
of services, and fewer sailing days than port, repair, and docking
days.17 As a result, the volume of cargo flows in six of the eight
regions decreased (Table 77). Between 1982 and 1985, the volume of cargo
flows in the Riau Archipelago, Central Java/the south coast of Kalimantan,
and North Sulawesi decreased by 5 percent, 72 percent, and 57 percent
per year respectively. Between 1982 and 1986, the volume of commodity
movemenst in the west coast of Sumatera, Ma1uku, and Irian Jaya each
decreased by 72 percent, 14 percent, and 2 percent respectively, whereas
the volume of cargo flows in Nusa Tenggara increased by 34 percent
annually. In the case of East Java, trade dropped sharply from 10,481
tons in 1982 to 725 tons in 1983, and there were no commodity flow in
1984. After 1984, a sudden increase was recorded from 11,511 tons in
17proyek Armada Perintis, Laporan Tahunan Pengoperasian ArmadaPerintis [Annual Report on the Operation of Pioneer Fleet] (Jakarta:Direktorat Jendera1 Perhubungan Laut, 1986), 42-43.
120
1985 to 228,653 tons in 1986. However, the total volume of freight
carried by Perintis ships was still very low compared to other ship
sectors. This indicates that trade development in the Perintis regions
is slow and the problems of lagging regions remains. Trade relationships
within each Perintis region are characterized by a horizontal pattern
of commodity flows among the peripheral regions, particularly in Maluku
and Irian Jaya, and by a vertical pattern of cargo movements between
the peripheral, the semi-peripheral, and the center regions. The
operation of Perintis ships in East Java indicates that there are enclave
areas within the center region.
The Impact of Shipping Performance on Passenger Flows
The transport of passengers in Indonesia is not only carried out
by the six Nusantara passenger ships (see Chapter IV, pp. 74-75), but
also by Nusantara general cargo ships, Lokal vessels, Perintis ships,
and Prahus. Ports of origin and destination of passenger flows both
by Nusantara passenger and general cargo ships are Belawan, Jakarta,
Surabaya, and Ujung Pandang (Figure 26). As in the transport of goods,
Jakarta and Surabaya are centers of passenger flows by Nusantara general
cargo ships.18 Whereas the movement of people by Perintis ships is
limited in the eight regions designated by the government (Figure 28),
the flows of passengers by Lokal vessels and Prahus are concentrated
in regions such as Riau, Jambi, South Sumatera, East Kalimantan,
Southeast Sulawesi, North Sulawesi, and Central Maluku. 19 Competition
18Rut z, "Indonesia's Sea Transport System--A Series of Maps," GeoJournal 14.4 (1983): Map 3.
19Ibi d., Map 3.
121
probably occurs between Nusantara passenger ships and non-passenger
vessels along the east coast of Sumatera, between Nusantara passenger
and general cargo ships in Jakarta, Surabaya, and Ujung Pandang, and
between Loka1 vessels and Prahus in East Kalimantan, North Sulawesi,
Southeast Sulawesi, and Central Ma1uku. These competitions can be
illustrated by looking at the number of people transported by each
carrier.
Table 78 shows that Nusantara general cargo ships carried the
largest number of passengers (54.6 percent of the total) among the non
passenger ships in 1986. While at the same time Loka1 vessels
transported 29.4 percent of the total passengers, Prahus and Perintis
vessels shipped 9.4 percent and 6.6 percent respectively. Between 1983
and 1986, the number of passengers who travelled on non-passenger
carriers increased by 14.5 percent per year.
Between 1982 and 1986, the number of passengers carried by Perintis
ships increased annually, ranging from 1 percent in the Riau Archipelago
and North Sulawesi to 44 percent in Nusa Tenggara. However, the number
of passengers transported by Perintis ships on the west coast of Sumatera
decreased by 17 percent per year (Table 79).
Since the beginning of 1983, the operation of Nusantara passenger
ships in Indonesia has received a positive response from the people,
particularly those who live in big cities. This can be shown by the
increasing number of passengers travelling on board Nusantara passenger
ships between 1983 and 1987 (Table 80). These numbers were small,
compared to the number of passengers travelling on non-passenger ships
(Tables 78, 80). This was influenced by sailing patterns of each ship
122
sector. Nusantara passenger ships called only at certain sea ports,
while non-passenger ships called at both sea and coastal ports. The
number of non-passenger ships was larger than that of Nusantara passenger
ships, so that the former were almost always available when they were
needed. Travel on non-passenger ships was probably cheaper than on
Nusantara passenger ships. In addition, Nusantara passenger ships had
to compete with land and air transportation, especially on the routes
connecting Medan, Jakarta, and Surabaya.
The Impact of Shipping Performance on the Realization
of Government Policy Objectives
Since the beginning of REPELITA, Indonesian national development
has been preoccupied by economic developmental concepts, emphasizing
a sufficient high economic growth and distribution of development gains.
Economic growth requires the increase of production in all development
sectors and the distribution of development gains through spread (trickle
down) effects. To facilitate the implementation of this concept in
regional development. several growth centers were formed in all
Indonesian provinces. These growth centers are to integrate economic
activities of the hinterlands in the district levels into the national
economic system. Apparently, this integration has not yet been fully
achieved due to, among other things, irregular shipping services and
concentration of ships at certain growth centers. Gaps in sea trans
portation may be considered responsible for the lack of participation
of the peripheral regions in economic development. This has caused
economic development gaps between the center, the semi-peripheral, and
the peripheral regions. The existence of enclaves and lagging regions,
123
the inability of the peripheral regions to provide a sufficient volume
of cargoes, and the poor conditions of ports of the peripheral regions
are clear examples of such gaps. Centralization of interisland shipping
services at the center regions has enabled these regions to continue
to grow as the principal markets for imported and domestic goods and
as the main locations for foodcrop production, manufacturing, and
processing industries. In consequence, the center regions can control
the flows of raw materials from the peripheral regions and manage the
distribution of basic human needs and basic commodities for development.
The peripheral regions become dependent on the center regions. As a
result, trade interdependence between the two is still far from reality.
The peripheral regions located close to the trade centers, such
as Port Klang, Singapore, Jakarta, and Surabaya, can take advantage of
their geographical locations and natural resources to develop manu
facturing and processing industries. Thus, the peripheral regions
surrounding the Java Sea and the Malacca-Singapore Straits (Table 76)
can develop into semi-peripheral regions. However, most agricultural
and industrial developments in these regions are usually financed,
managed, and controlled by the center regions. All final decisions and
policies are made at the center regions. These regions provide sea
transportation and determine when and where those products should be
marketed. Production, processing, marketing, and distribution of oil,
cement, asphalt, fertilizers, wood, rice, wheat, sugar, and salt are
examples of that mechanism.
Another example is trade relationships between the indigeneous
producers and Chinese traders, who often have connections (kongsi) with
124
Indonesian Chinese capital in the center regions or with Malaysian or
Singaporean Chinese capital. Chinese traders usually provide the
indigeneous producers with capital and daily needs. In return, the
indigeneous producers have to surrender their products to the Chinese
traders, who transport these products either to Java or to Malaysia and
Singapore. In Javanese terms this mechanism is called ijon. The ijon
relationships with Malaysian or Singaporean Chinese often fosters
smuggling. In such a mechanism, centralization of ships and commodities
becomes essential. Centralization of ships at certain regions to
transport particular products will minimize supply of an adequate shipping
capacity to other regions and, in consequence, hamper the movements of
other products from those regions. If shipping capacity is inadequate
or not available, those particular industries have to charter or wait
for regular liner services calling at their ports. Even though most
shipping services are already concentrated in west Indonesia, infrequent
sailing and irregular services disturb shipment plans, especially of
small-scale agricultural and processing industries. However, this might
not occur if shippers can make a sufficient volume of cargoes available.
Since shipping in Indonesia follows trade, regular shipping services
are difficult to maintain throughout the archipelago, and centralization
of shipping services at certain regions is unavoidable. The government
policy to promote trade interdependence has not yet been accomplished.
The existence of overcapacity, irregularity of services, infrequent
sailings, route deviations, and port omissions implies that the
Directorate General of Sea Communications was not able to implement and
enforce regulations. Instead of looking into its own capability, the
125
Directorate General of Sea Communications, after a quick evaluation,
considered the shipping regulations to be out of date and in need of
revision. Screening policies to impede entry, for instance, had been
renewed several times. Between 1963 and 1966 a tight screening policy
was employed to limit the number of firms in the interisland shipping
industry. Between 1966 and 1971, however, new licenses were issued.
Between 1971 and 1982 screening and licensing requirements were reimposed
to reduce the number of firms and to limit entry, but several licenses
were again issued between 1982 and 1983.20 Other examples discussed
in Chapters III and IV include the changes of trayek regulations,
regionalization of Lokal and Prahu shipping, the import banning policy,
freight rates, and the scrapping policy. Frequent changing in shipping
policies and regulations, however, were still unable to improve the
performance of interisland shipping. Shipping liners did not comply
with the policies and regulations; policies and regulations had to adapt
to changes in shipping performance. This led to the deregulation of
shipping through the introduction of INPRES 4/1985 and PAKNOV 21 (this
will be discussed in the last part of this chapter).
Even though interisland shipping has deficiencies, it should be
recognized that the volume of commodities and the number of passengers
carried by each ship sector increased (Tables 19, 77-80). All ship
sectors have transported and distributed cargoes for basic human needs,
basic commodities for development, and other trade commodities to all
20Howard W. Dick, "Interisland Shipping: Progress, Problems andProspects, II Bulletin of Indonesi an Economic Studies 21 (August 1985);95-114.
126
regions of the archipelago (Tables 48-50, 81-91), and Perintis shipping
has developed pioneer routes connecting remote islands and their main
islands.
Interisland commodity and passenger flows can be viewed as the
movements of natural, cultural, and human resources from one island to
another.
[Natural resources refer to] those derived from thephysical and biotic conditions of the land [that peoplefind useful]. [Human resources are] those derived fromthe population in the sense of man-power. [Culturalresources refer to] those derived from the attitudes,objectives, and technologies of the people. Culturalresources may be divided into two groups: the elementsof material culture, such as houses, roads, tools, andmachines; and those of non-material culture, such aseconomic, social, and political institutions, religiousideas, and group attitudes. 21
Resources are something material or abstract which have proved useful
to man. 22 Their existence depends on their value to man, not on their
intrinsically valuable properties--"a cultural concept.,,23 This concept
considers "man as the agent, conditioned by his non-material culture,
utilizing the natural resources to produce his material culture.,,24
21Russell Whitaker, "The Geography of Resources," in AmericanGeography Inventory and Prospect, ed. Preston E. James and Clarence F.Jones (Syracuse: Syracuse University Press, 1954), 227-28.
22Ibi d., 227.
23Brian Goodall, "Resource," in Dictionary of Human Geography, ed.Brian Goodall (Harmondsworth: Penguin Books, 1987).
24Russell Whitaker, "The Geography of Resources," in AmericanGeography Inventory and Prospect, ed. Preston E. James and Clarence F.Jones (Syracuse: Syracuse University Press, 1954), 229.
127
The distribution of resources by interisland shipping to all regions
of the archipelago can promote and accelerate cultural exchange--the
exchange of ideas, thoughts, values, norms, patterned behavior of groups
of people, and things made by people. 25 This will lead to social change,
a process by which a traditional society gradually develops into a
modern one. The processes of cultural exchange and social change involve
the exchange of material culture through means of transportation and
that of non-material culture through various interpersonal communication
systems, ranging from traditional face-to-face communication networks
to a more complex, modern, and advanced communication system. In the
process of exchange, the material culture should not be viewed in
isolation from the non-material, but the reciprocal relationship between
the two must be considered. In the early 1960s, for instance, inter
island ships transported migrants from Java to South Sumatera, Kalimantan,
and Su1awesi. 26 Some of the earliest settlements in South Sumatera are
now towns and cities with many benefits for the people living there.
Educational, health, civic, and cultural facilities have been established.
Those who are impoverished, landless farmers now own their homes and
land. Agricultural production has increased, new jobs have been created,
and trade relationships with other islands, particularly Java, have
improved. The latter depends on the availability of an adequate sea
25Koentjaraningrat, Bunga Rampai Kebudayaan, Mentalitet danPembangunan [The Anthology of Culture, Mentality and Development](Jakarta: Gramedia, 1974), 11.
2600nald W. Fryer, Emerging Southeast Asia, A Study in Growth andStagnation (London: George Ph,l,p and Son, 1970), 313.
128
transportation system. Irregularity of shipping services and infrequent
sail i ng hamper the exchange of "natura1-materi a1,,27 cul ture. For
example. agricultural products of transmi~rants in Aceh very often could
not be transported to market. 28 The exchange of non-material culture
between the transmigrants and the Acehnese may be continued, even though
not accompanied by the exchange of their natural-material culture. In
this respect, the whole sociocultural exchange between the trans-
migrants and the Acehnese can be considered incomplete. Such circum-
stances occur in many transmigration settlements and other remote
regions of the archipelago. Since the regional development process in
every sector involves the exchange of natural-material and non-material
culture, incomplete sociocultural exchange will eventually slow that
process. This is because the new techniques/ideas and the technologies
to carry out a local or regional development may, either or both, be
lacking. If both lacking is very serious, but even if only one, either
ideas or tools, is almost as serious. Incomplete sociocultural exchange
will therefore lead to continuance of dependency relationships of the
peripheral on the center regions. This will widen economic development
gaps between the two. Clearly, problems of lagging regions have not
yet been overcome completely.
27J. Russell Whitaker, "The Geography of Resources," in Ameri canGeography Inventory and Prospect, ed. Preston E. James and Clarence F.Jones (Syracuse: Syracuse University Press, 1954), 229.
28Departemen Penerangan, Rencana Pembangunan Lima Tahun Keempat1984/85-1988/89 [The Fourth Five Year Development Plan 1984785-1988789],vol. 1 (Jakarta: Percetakan Negara R.I., 1984), 20-25.
129
The continued exchange of non-material culture between two or more
societies in all regions of Indonesia will lead to sociopolitical
homogeneity throughout the country. Of particular importance in this
exchange process is the role of transmigrants, who are mostly Javanese
and Balinese. Javanese and Balinese transmigrants are generally better
educated, more technologically advanced in agriculture, and more
experienced in rural sociopolitical and economic activities than the
native population of the destination regions. In consequence, agricul
tural institutions and activities, such as Subak (Balinese irrigation
system), Lumbung Desa (Javanese rice barn for the whole village), and
Pasar Desa (Javanese and Balinese village market system), are able to
develop rapidly. Traditional performing arts and their institutions,
such as Ketoprak (Central Java), Ludruk (East Java), and Lenong (Jakarta),
also develop.29 The most important non-material culture exchanged is
the Javanese principle of democracy. This is important because the
Indonesian principle of democracy (Demokrasi Panca Sila) today is a
synthesis of indigeneous democracy, which is strongly influenced by
Javanese democracy, and modern democracy of the West. The principle
of Musyawarah untuk Mufakat (deliberation to achieve consensus) and
Kebijaksanaan 30 to solve problems are examples of the Javanese principles
of democracy brought into the Demokrasi Panca Sila. In such a democracy,
the decisions of the MPR and DPR (Indonesian Parliament), for instance,
29For a detailed discussion see Muhammad A. S. Hikam, "Communicationand Rural Development in Indonesia: A Framework For Policy" (M.A. thesis,University of Hawaii, August 1987), 115-18.
30See definition of Kebijaksanaan in p. 61 no. 50.
130
are taken collectively through a consensus among the members.· The
solution of the scrapping problem through Kebijaksanaan is another
example of the implementation of the Javanese democracy at the government
level. Almost all traditional societies in Indonesia have similar
principles of democracy, although they differ in the implementation.
Therefore, the introduction of the Demokrasi Panca Sila by Javanese and
Balinese transmigrants can be accepted almost without resistance from
native populations at the transmigration settlements. The exchange of
non-material culture has apparently increased sociopolitical and
cultural homogeneity. This eventually promotes people's consciousness
of identity with the state; they identify themselves as Indonesians.
As the carriers of the transmigrants, basic human needs, and basic
commodities for development, interisland ships can be considered an
accelerator, in the vertical sense, of the process of sociopolitical
and cultural exchange between the center and the peripheral regions.
Small Prahus and traditional fishing vessels, on the other hand, can
be viewed as a catalyst, in the horizontal sense, of the exchange process
among the peripheral regions. Interisland ships are capable of
facilitating exchange processes toward the realization of vertical and
horizontal homogeneity in sociopoligical and cultural conditions
throughout the archipelago.
The lagging regions, particularly in east Indonesia are seldom
served by interisland ships. Socioeconomic conditions of lagging regions
are generally weak and only a few hundred inhabitants live there. From
the viewpoint of defense and security, these regions are often considered
a soft target. A threat to one island or region of the archipelago is
131
considered a threat to the entire nation. The unity of the state is
lessened by the existence of lagging regions. Regular shipping services
and frequent sailings to or through those regions are necessities of
defense and security. Interisland ships could be used to identify
illegal activities at those regions such as illegal fishing and log
smuggling. However, interisland ships visit the lagging regions
irregularly and infrequently, and many illegal activities in east
Indonesian waters take place far from their routes. Generally, they
have not reported cases of illegal activities, although several cases
were reported by fishing vessels.
Illegal activities such as piracy and smuggling along the east coast
of Sumatera, from Aceh to Lampung, are special cases. They are seldom
reported, either by interisland ships or by the victims. This may be
because these cases involve the Indonesian maritime officials. If the
cases are reported, they will be brought to the irregular Joint Border
Committee meetings between Indonesia and Malaysia. By this time however
it is too late to correct the situation. 31 In early 1989, the Indonesian
Police carried out Srigunting operation against illegal activities in
the Malacca and Singapore Straits. Two hundred and one people were
arrested, and 90 cases were brought to courts. Seventy-six of the 90
cases occurred in Riau. These cases included primarily smuggling and
piracy. Two piratical speedboats were seized and the priates arrested.
However, the citizenship of the pirates was not reported. 32
31 For a detailed discussion see Abu Bakar Jaafar, "Prospects forMarine Regionalism in the Ma1acca and Singapore Straits" (Ph.D. diss.,University of hawaii, May 1984), 139-50.
32Suara Pembaruan (Jakarta), Kamis, 9 Februari 1989.
132
The Implication of Shipping Performance on the
Implementation of Wawasan Nusantara
As mentioned elsewhere in this study, Wawasan Nusantara is a
developmental concept aimed at realizing Indonesia as a political, an
economic, sociocultural, and defense and security unity. The ultimate
goal of national development is to promote national unity. This can
only be achieved if the national development is capable of creating
regional homogeneity.33 Development efforts to attain regional
homogeneity have to combat horizontal heterogeneity related to
geographical, economic, social, and cultural diversity, and vertical
heterogeneity caused by the political organization and administration
of the state, and the application of the growth center model in national
economic development. Frequent sailings and regular shipping services
of adequate capacity should be capable of acting as an integrating
factor of the national territory, representing a constant flow of
government authority, balancing economic development between east and
west Indonesia, overcoming the problem of lagging regions, promoting
sociocultural exchange, and identifying illegal activities at sea. The
previous discussions show that these objectives have not yet been
accomplished due to inadequate shipping quality: overcapacity,
irregularity of services, and infrequent sailing. The implementation
of Wawasan Nusantara is therefore marked by several weaknesses.
33Richard Hartshorne, "Political Geography," in American GeographyInventory and Prospect, ed. Preston E. James and Clarence F. Jones(Syracuse: Syracuse Oniversity Press, 1954), 189.
133
From the economic point of view, such weaknesses include the
formation of lagging regions in several areas of the archipelago and
the differentiation of thin and fat regions, representing imbalanced
economic development between east and west Indonesia. Centralization
of shipping servicees and accumulation of commodities caused by the
implementation of the growth center model has hampered the attainment
of trade interdependency relationships among regions of the archipelago.
Interisland trade between east and west Indonesia and between lagging
and other regions is therefore characterized by dependency relationships
and irregular distribution of commodities. Peripheral regions are not
able to participate equally in economic development due to the lack of
adequate port facilities and a sufficient volume of cargoes. Interisland
ships are reluctant to transport cargoes to the peripheral regions,
unless readjustments in freight rates are made. The semi-peripheral
regions, on the other hand, lack necessary means to market and distribute
their production.
The delivery of basic human needs and basic commodities for develop
ment from the center regions, although generally done irregularly, is
made possible by the existence of administrative communications system
and government participation in national development. Central authority
over innumerable islands that compose the archipelagic state of Indonesia
is thus dependent on interisland shipping. Within a centralized single
government system, in which significant degrees of automony are delegated
to lower level governmental units, the flow of authority through
interisland shipping accelerates the creation of uniformity in the
operation and implementation of government functions, which facilitate
the accomplishment of political homogeneity.
134
Sociopolitical and cultural homogeneity appear stronger than
economic heterogeneity. It is assumed there is a trade-off between
sociopolitical and economic objectives. This trade-off has apparently
prevented the disintegration of the archipelagic state. On the other
hand, the heterogeneity in economic conditions, although an element of
national weakness, is not a serious threat to national unity.
The problem of national disunity has been overcome successfully by such
integrating factors as the 1928 Youth Pledge, the State Idea: "Bhineka
Tunggal Ika," the Indonesian Proclamation of Independence of 17 August
1945, the 1945 Indonesian Constitution, the archipelagic state principle,
and Wawasan Nusantara (see Chapter III). This success has strengthened
the people's consciousness of identity with the archipelagic state of
Indonesia; they identify themselves as Indonesians.
Reasons for Shipping Deficiencies
From the previous discussions several reasons for shipping
deficiencies can be identified. They are as follows:
Shipping Policy and Regulation
Interisland shipping in Indonesia is highly regulated by the
government because it is held to playa pivotal role in the national
development. The most important shipping regulations were port
regulation, trayek regulation, freight rate regulation, and ship's age
regulation. The first three regulations were changed frequently in
response to changes in shipping performance.
The frequent changes in port regulations produced long and
complicated bureaucratic procedures, resulting in increase of idle times
135
and decrease of sailing days. The introduction of gateway ports, port
classifications, and regionalization of ports led to the centralization
of ships in certain ports, particularly in west Indonesia. This created
route deviations, port omissions, irregular services, infrequent
sailings, and severe competition.
The frequent changes in trayek regulations produced overlapping
routes, increased competition, increased shipping costs, and lower
freight rates. In consequence, interisland ships reduced their sailing
frequencies and became irregular. The differentiation of trayek between
west and east bound routes affirmed the formation of fat and thin
regions, resulting in increases of shipping in west Indonesia and a
decrease of shipping services to east Indonesia. The division of trayek
into Nusantara routes, Lokal routes, Singapore routes, and passenger/
cargo routes in fact did not guarantee that interisland ships would
obtain a sufficient volum~ of two-way cargoes. They had to follow the
trade.
The scrapping policy, introduced through the issuance of ship's
age regulations, was apparently unable to reduce overcapacity, because
it held particularly for Nusantara. Lokal. and Perintis shipping. not
for other ship sectors. The scrapping policy was replaced by Kebijak
sanaan, which increased shipping capacity again.
Freight rate regulations were changed several times to balance
official tariffs and actual freight rates. The result was a discounting
of official tariffs in response to severe competition. Official tariffs
could not attract shipping companies to allocate adequate shipping
capacity in particular ports. The availability of adequate shipping
136
capacity was determined by market forces. This resulted in irregularity
of shipping services.
The frequent changes in shipping regulations indicated that the
policy of the Directorate General of Sea Communications consisted of
separate, discrete decisions or actions rather than a course of action.
The implementation of policy and regulations varied according to
interpretation of individual Sea Communication District. Misinterpre
tation often lead to the manipulation of shipping policy and regulation
by government officials. The Director General of Sea Communications,
for example, misinterpreted PAKNOV 21 by saying that the existing
shipping could not be changed directly, whereas PAKNOV 21 is intended
to liberate shipping routes from complicated bureaucratic procedures
and regulations. Thus, the Director General of Sea Communications had
to withdraw his statement. 34 Misinterpretation of shipping regulations
on licensing, designation of trayek, route deviations, and port omissions
became sources of officials' corruption. All these have been contributed
to the continuance of poor shipping performance.
The Implementation of Growth Center Model
The implementation of the growth center model and top-down approach,
in which the role of government is dominant in every sector of national
development, has increased bureaucratic control over interisland shipping
activities. Tight shipping policy, frequent changes in shipping
regulations, and centralization of trade and shipping services became
34Kompas (Jakarta), Senin, 26 Desember 1988; Senin, 2 Januari 1969.
---- -----
137
necessary to carry out such control and this, in turn, caused unwieldy
and inflexible operation of interisland ships and dependency relation
ships between the growth centers and other regions of the country.
Trade-Off Between Sociopolitical and Economic Objectives
The delivery of basic human needs and the transport of government
cargoes for development often required route deviation. The government
usually granted dispensation to certain shipping companies to deviate
from designated routes to carry those cargoes. Thus, the smooth
distribution of such important cargoes often involved the sacrifice of
regular shipping services on particular routes.
Inter- and Intra-Modal Competition
Short and long distance intermodal competition has affected the
productivity of shipping liners. Competition from land transportation
along the north coast of Java, from the road/ferry system bp.tween Java
and Sumatera, Bali, and Madura, and from air carriers on the routes
connecting Medan, Palembang, Jakarta, Surabaya, and Ujung Pandang have
only slightly reduced frequency of sailing in those areas.
Of particularly great significance is the intramodal competition.
Although each ship sector had its own trade, in practice trade was over
lapping, and fixed shipping routes, even theoretically regulated, were
not kept. Consequently, severe competition was unavoidable. This
resulted in poor performance of regular shipping services.
Insufficient Volume of Return Cargo
The application of the growth center model and the top-down approach
has resulted in inequality of participation of the peripheral regions
138
in economic development. In consequence, these regions were not able
to develop as expected. Low production, insufficient volume of freight,
and changing cargo composition were general characteristics. Interisland
ships were very reluctant to sail to those regions because they often
could not obtain a sufficient volume of return cargoes. As a result,
those regions were served irregularly and infrequently.
Poor Port Conditions and Inadequate Port Facilities
Many ports along the north coast of Java, the east coast of
Sumatera, and the south coast of Kalimantan have siltation problems.
Several ports in the Riau Archipelago, and Maluku lack adequate shelters
to protect loading and unloading activities from strong winds and
currents. Many coastal ports do not have sufficient port facilities,
so that it is difficult to berth ships and to load and unload cargoes.
Several ports are considered high costs ports due to long bureaucratic
procedures to obtain port services. All these have hampered the
smoothness of regular shipping services and frequent sailing.
Deregulation of Interisland Shipping
Inefficient port services, overcapacity, irregularity of shipping
services, and infrequent sailing have led to the introduction of INPRES
4/1985 and PAKNOV 21. The objectives of INPRES 4/1985 are to remove
"cumbersome transport and port handling procedures which had greatly
impeded the smooth operation of both interisland and foreign trade,"35
35Anne Booth, "Indonesia's Economy: Performance and Policy Optionsin Post-OPEC World," in Southeast Asian Affairs 1986, ed. Kernial S.Sandhu and Mohammad Ayoob (Slngapore: Instltute of Southeast AsianStudies, 1986), 132.
139
while those of PAKNOV 21 are to smooth the flow of interisland shipping
throughout the archipelago and to make foreign shipping available if
needed to cover shortfalls by indonesian carriers. 36 The expected result
of INPRES 4/1985 is that the removal of controls will increase non-oil
commodity exports, while PAKNOV 21 will increase regularity of the
distribution of basic commodities, improve interisland trade, and
facilitate decentralization in economic development.
There are optimistic and pessimistic views regarding the deregula-
tion of interisland shipping. The above expected results of deregulation
can be considered views of the former. The pessimist usually argues
that even though a drastic reduction in transshipment costs for many
exporters was reported during the first year of the implementation of
INPRES 4/1985,37 it is too early to expect positive impacts of deregula
tion on the entire interisland shipping industry, because INPRES 4/1985
is just four years old and PAKNOV 21 is less than one year old. It often
occurs in Indonesia that a new policy is well carried out wh~n it is
still warm, but poorly administered after a few years of implementation.
The 1972 import banning pol.icy and the 1984 scrapping policy are
examples.
Deregulation means no regulation at all. In the context of INPRES
4/1985 and PAKNOV 21, deregulation means to let market forces regulate
36Kompas. Selasa, 22 November 1988. See also Kevin Chinnery,"Trade Flrst, Again," Lloyd1s Maritime Asia (March 1989): 17.
37Anne Booth, "Indonesia's Economy: Performance and Policy Optionsin Post-OPEC World," in Southeast Asian Affairs 1986, ed. Kernial S.Sandhu and Mohammed Ayoob (Singapore: Institute of Southeast AsianStudies, 1986), 132.
140
the interisland shipping industry. This means free competiti~n with
minimal bureaucratic control over the industry. In a situation of free
competition, the stronger (more efficient) shipping companies will take
over from the weaker ones and monopolize the interisland trade. There
is a fear that powerful foreign shipping companies such as PIL of
Singapore and Evergreen of Taiwan will also have an opportunity to
monopolize interisland trade. 38 Domestic shipping companies will face
difficulties in competing with PIL and Evergreen.
Further consequences of deregulation are that irregular shipping
services, infrequent sailing, and irregular distribution of basic
commodities will continue; centralization of trade and the imbalance
of economic development between east and west Indonesia will increase;
and the problem of lagging regions will remain.
Conclusion
This study concludes that the relationship of government policies
to shipping services is based on the concept that "the ship promotes
the trade." However, the contrary view that "the ship follows the
trade" implies that interisland shipping will comply with government
policies only if their interests of obtaining sufficient volume of
cargoes can be guaranteed. It is obvious from the previous discussions
that interisland ships have always followed the availability of
sufficient volume of cargoes rather than shipping policies and regula
tions.
39Kompas (Jakarta), Rabu, 23 November 1988.
141
Shipping policies and regulations could not guarantee the avail
ability of sufficient volume of cargoes because their assumption that
interisland ships would promote trade did not always hold. This assumed
that the ships would be able to accelerate economic development in a
particular region and the region. in turn. would be able to make
sufficient volumes of cargoes available for the ships. The formulation
of shipping policies and regulations was not based on a careful analysis
of interisland trade data and an evaluation of interisland shipping
behavior. Consequently. shipping policy objectives were not achieved.
Even though shipping policy objectives could not be achieved. inter
island cargo traffic by each ship sector increased. The distribution
of basic human needs and basic commodities for development. although
irregular, also increased. This distribution was often made through
route deviations.
The achievement of government policy objectives through interisland
shipping is still far from reality. Implementation of the growth center
model, top-down approach, and centralization of trade has resulted in
inequality of participation of the peripheral regions in economic
development. Accordingly, the peripheral regions were slow in economic
development characterized by low production. Interisland shipping was
unable to accelerate economic development in lagging regions and to
promote a balance of economic development between east and west Indonesia.
Since interisland shipping was unable to comply with government
policies and regulations, it was often blamed for the failure of the
government policy objectives. It became the victim of the concept that
the ship promotes the trade. Since in Indonesia, the ship follows the
142
trade, blaming the victim will not help to find a solution. The solution,
on the other hand, has to be found by examining both government policies
and interisland shipping. This examination has eventually led to
deregulation.
Deregulation, however, "is a trade boosting measure, and not a new
plan for curing the greater ills of the shipping industry.,,39 It Joes
not touch the problems of overcapacity, irregularity of services, and
infrequent sailing. Overcoming these is essential fGr the achievement
of government policy objectives.
Suggestions
Efforts to achieve government policy objectives depend on the
availability of adequate shipping capacity, regularity of shipping
services, frequency of sailing, and reasonable freight rates which permit
the goods to move and the carriers to live. During the era of deregula
tion, the government might adopt several strategies that can ensure the
availability of regular shipping services of adequate capacity throughout
the archipelago.
1. The irregularity of shipping services, particularly in east
Indonesia and other areas, may be solved by operating government ships
and vessels of state-owned shipping companies on a regular basis in those
areas.
Another method to overcome this problem is by subsidizing private
shipping companies, so that they can operate their ships regularly on
39Kevin Chinnery, "Trade First, Again," Lloyd's Maritime Asia(March 1989): 18.
143
uneconomical routes. These subsidies could include an operational
subsidy and a purchasing subsidy. The latter consists of direct and
indirect subsidies. A direct subsidy is government assistance to the
shipping company through the bank to purchase ships either from domestic
or foreign shipyards. An indirect subsidy is government assistance to
the shipping company through domestic shipyards for the purchase of ships
from those shipyards at a low price.
3. In the situation of no trayek regulation, the efforts of
ensuring the availability of regular shipping services of adequate
capacity will be difficult if the government is unable to encourage
shipping companies to form domestic shipping conferences. The avail
ability of an adequate quality of shipping services will be reached more
easily through domestic conferences, because:
1. The conference has rights to designate routes,
allocate ships of the members, determine sailing
schedules, and to set rates.
2. Since the conference carries out marketing and
financial management, it will be able to provide
vessels in response to the market demands.
3. The establishment of domestic conferences will promote
the flexibility and elasticity of fleet tonnage, con
tinuity of services due to the fact that the conference
possesses a large fleet, the application of cross
subsidies among the members, and the involvement of
fewer participants (in terms of number of conferences)
in the route negotiations.
144
4. In addition. domestic conferences will be capable of
competing with foreign shipping in interisland trade.
The task of the government in relation to the above matters is to
supervise implementation and facilitate fair competition. which can
counteract possible monopoly abuses. The government might delegate this
task to INSA (Indonesian Shipowners' Association).
To facilitate the above strategies. the government should consider
the following:
1. Since regular shipping services of adequate capacity are
determined by the availability of a sufficient volume of two-way traffic
cargoes and this. in turn, depends on the capability of a particular
region to increase its production, the government might adopt a policy
to increase the allocation of developmental resources in all regions
of the archipelago. This means that the government should improve the
equality of participation in economic development. The equality of
participation will be achieved if it is accompanied by the extension
of economic decentralizaticn to all provinces of Indonesia. The govern
ment should delegate greater economic autonomy to all provinces, so that
they do not always depend on the central government in all economic
matters. Consequently, they will be able to develop their regions and
promote economic interdependency relationships with other regions. An
adequate volume of commodities with a constant composition might become
available.
145
2. To insure the continuance of a supply of commodities, coordin
ation between the Department of Industry, Department of Agriculture,
Department of Trade, Department of Communications, and Indonesian
Shippers Council is essential. This coordination should be carried out
both in the central and provincial governments.
3. To reduce the time ships spend in ports and to increase the
productivity of ports, cargo should be unitized. In addition, port
operation, port facilities, port conditions, and intermodal transporta
tion should be improved.
4. The government should make national regulations on open and
closed domestic conferences to prevent monopoly. It should also exert
efforts to encourage domestic conferences to enter agreements concerning
rates, routes, and capacities. By such regulations and agreements,
regular feeder shipping can be developed, fair competition can be
maintained, and monopoly abuses can be minimized.
An independent national rate committee should be set up by the
government to accommodate the shippers' request for a change of freight
rates. After examining information from the conference and shippers,
the committee makes a rate adjustment which binds the two parties.
Therefore, the committee functions as a conciliatory board in the
settlement of rate disputes between the conference and shippers.
5. To smooth the process of spread effects from the center to the
peripheral regions through interisland shipping, the implementation of
the growth center and top-down approaches has to be combined with
decentralization and a bottom-up approach. Allocations of interisland
146
shipping services to all levels of the hierarchy of regions facilitate,
through the top-down and bottom-up approaches, the exchange between the
center and the peripheral regions of ideas and information growing out
of differing sociopolitical and economic conditions and problems. This
will help the central government to recognize local problems and to take
these problems into consideration in the political decision-making
process. On the other hand, the local governments will be able to under
stand national problems and appreciate any effort carried out by the
central government to solve the problems. By this mechanism, socio
political and economic development policies can be formulated based on
more accurate information from the peripheral regions.
Interisland shipping services also offer the means of improving
the role of the core of the peripheral regions from that of being the
connectors to progenitors of rural development in their respective
regions. Interregional contacts through interisland shipping, therefore,
encourage the breakdown of parochialism and promote a uniformity in
sociopolitical and economic conditions. By this mechanism, economic
interdependency among the regions can be maintained, which in turn should
promote regular shipping services.
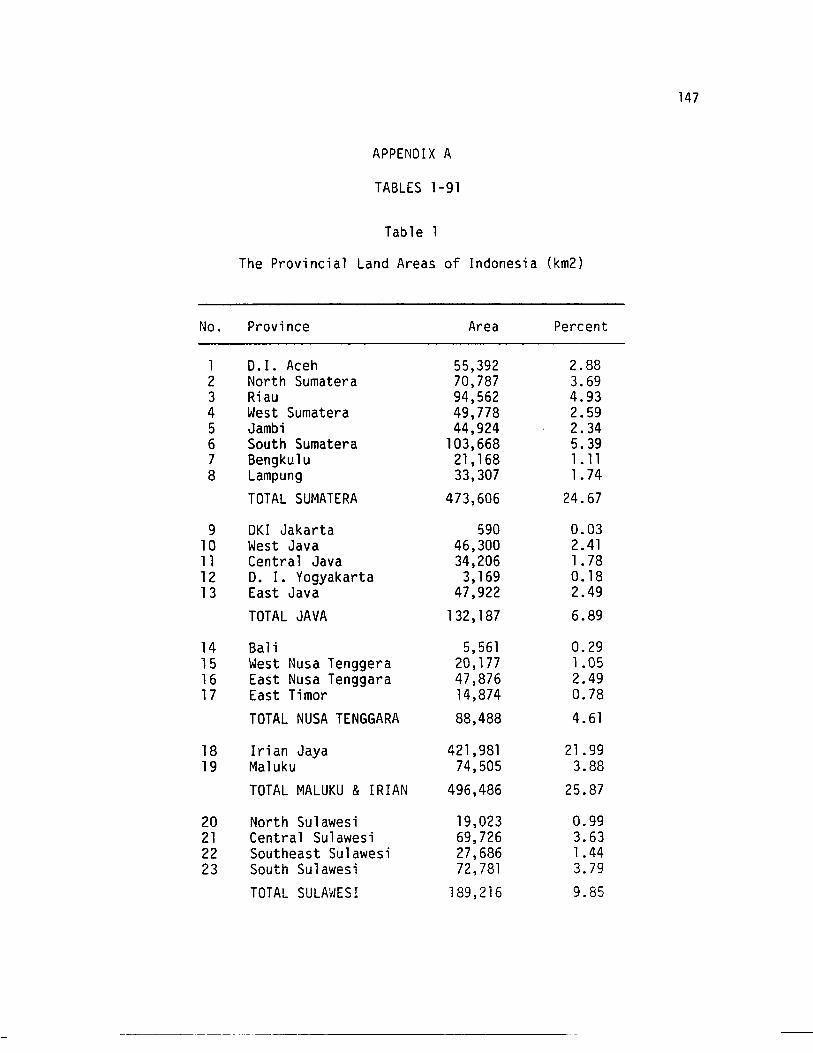
APPENDIX A
TABLES 1-91
Table 1
The Provincial Land Areas of Indonesia (km2)
No. Province Area Percent
1 O. I. Aceh 55,392 2.882 North Sumatera 70,787 3.693 Riau 94,562 4.934 West Sumatera 49,778 2.595 Jambi 44,924 2.346 South Sumatera 103,668 5.397 Bengkulu 21 , 168 loll8 Lampung 33,307 1. 74
TOTAL SUMATERA 473,606 24.67
9 OKI Jakarta 590 0.0310 West Java 46,300 2.4111 Central Java 34,206 1. 7812 o. I. Yogyakarta 3,169 O. 1813 East Java 47,922 2.49
TOTAL JAVA 132,187 6.89
14 Bal i 5,561 0.2915 West Nusa Tenggera 20,177 1.0516 East Nusa Tenggara 47,876 2.4917 East Timor 14,874 0.78
TOTAL NUSA TENGGARA 88,488 4.61
18 Irian Jaya 421,981 21 .9919 Maluku 74,505 3.88
TOTAL MALUKU & IRIAN 496,486 25.87
20 North Sulawesi 19,023 0.9921 Central Sulawesi 69,726 3.6322 Southeast Sulawesi 27,686 1.4423 South Sulawesi 72,781 3.79
TOTAL SULAvlES I 189,216 9.85
147
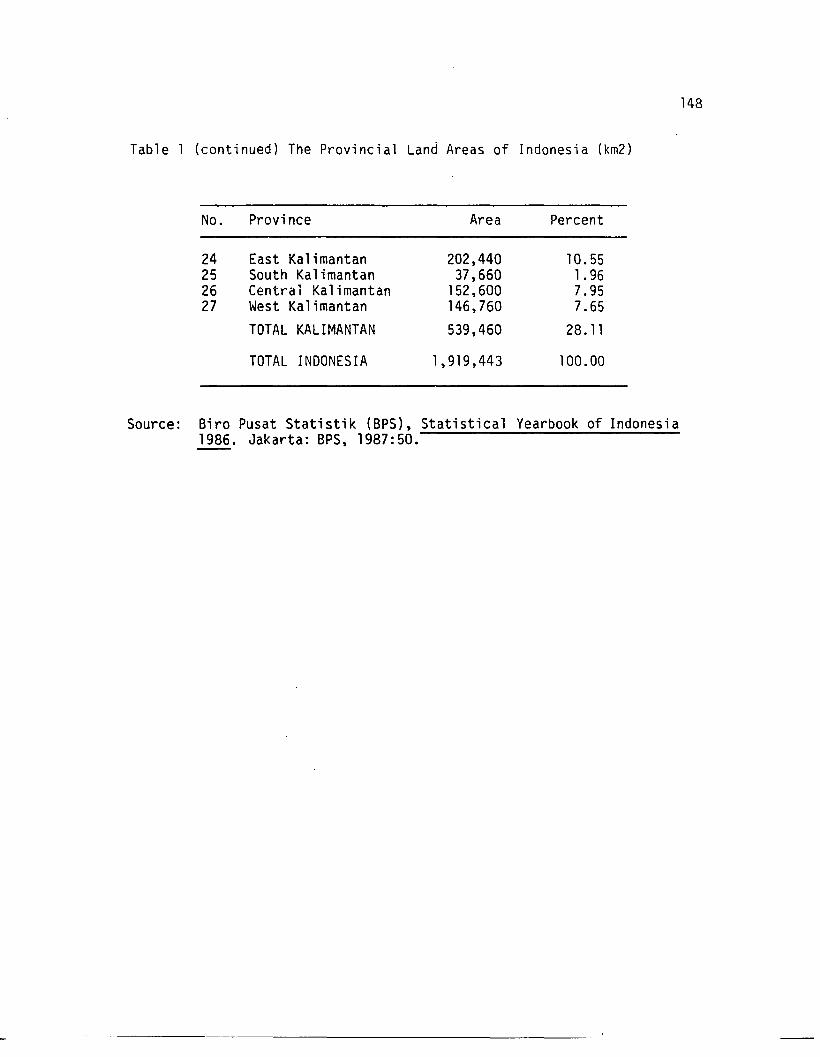
Tab1e 1 (cont i nued) The Provi nci a1 Land Areas of Indones i a (km2)
No. Province Area Percent
24 East Kalimantan 202,440 10.5525 South Kalimantan 37,660 1. 9626 Central Kalimantan 152,600 7.9527 West Kalimantan 146,760 7.65
TOTAL KALIMANTAN 539,460 28.11
TOTAL INDONESIA 1,919,443 100.00
148
Source: Biro Pusat Statistik (BPS), Statistical Yearbook of Indonesia1986. Jakarta: BPS, 1987:50.
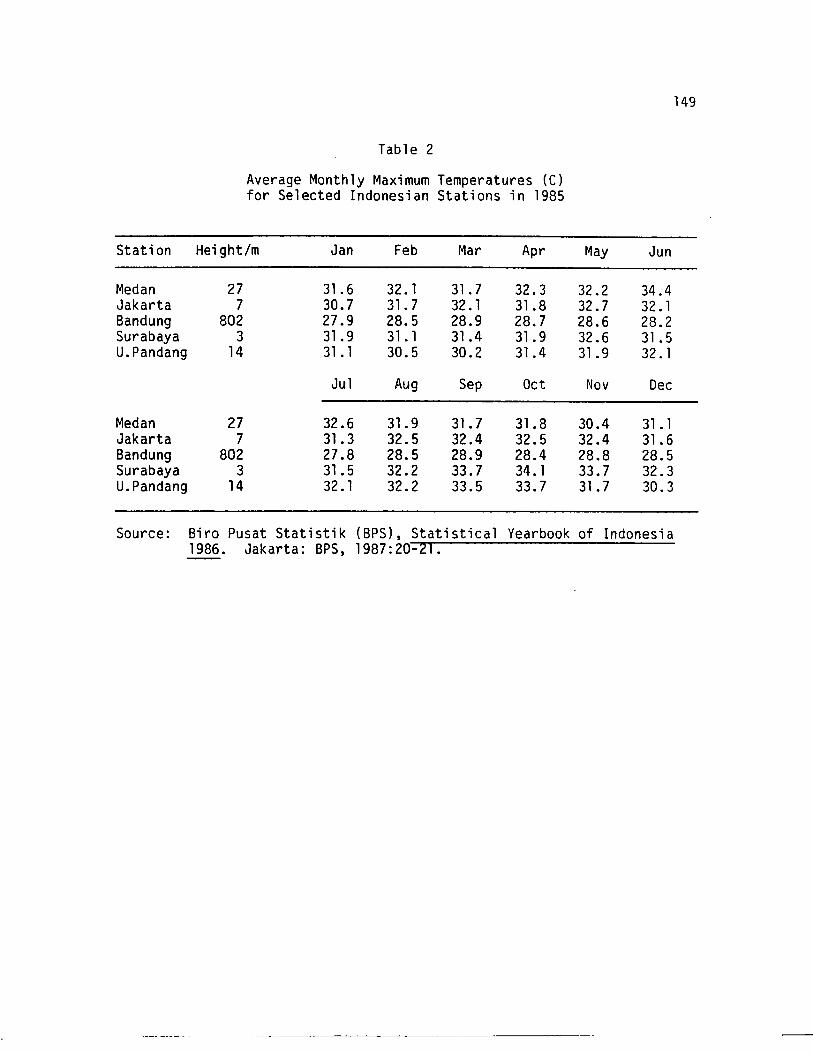
Table 2
Average Monthly Maximum Temperatures (C)for Selected Indonesian Stations in 1985
149
Station Height/m Jan Feb Mar Apr May Jun
Medan 27 31.6 32. 1 31. 7 32.3 32.2 34.4Jakarta 7 30.7 31. 7 32.1 31.8 32.7 32.1Bandung 802 27.9 28.5 28.9 28.7 28.6 28.2Surabaya 3 31.9 31.1 31.4 31. 9 32.6 31.5U.Pandang 14 31.1 30.5 30.2 31.4 31.9 32. 1
Jul Aug Sep Oct Nov Dec
Medan 27 32.6 31. 9 31.7 31.8 30.4 31.1Jakarta 7 31.3 32.5 32.4 32.5 32.4 31. 6Bandung 802 27.8 28.5 28.9 28.4 28.8 28.5Surabaya 3 31.5 32.2 33.7 34. 1 33.7 32.3U.Pandang 14 32. 1 32.2 33.5 33.7 31.7 30.3
Source: Biro Pusat Statistik (BPS), Statistical Yearbook of Indonesia1986. Jakarta: BPS, 1987:20-21.
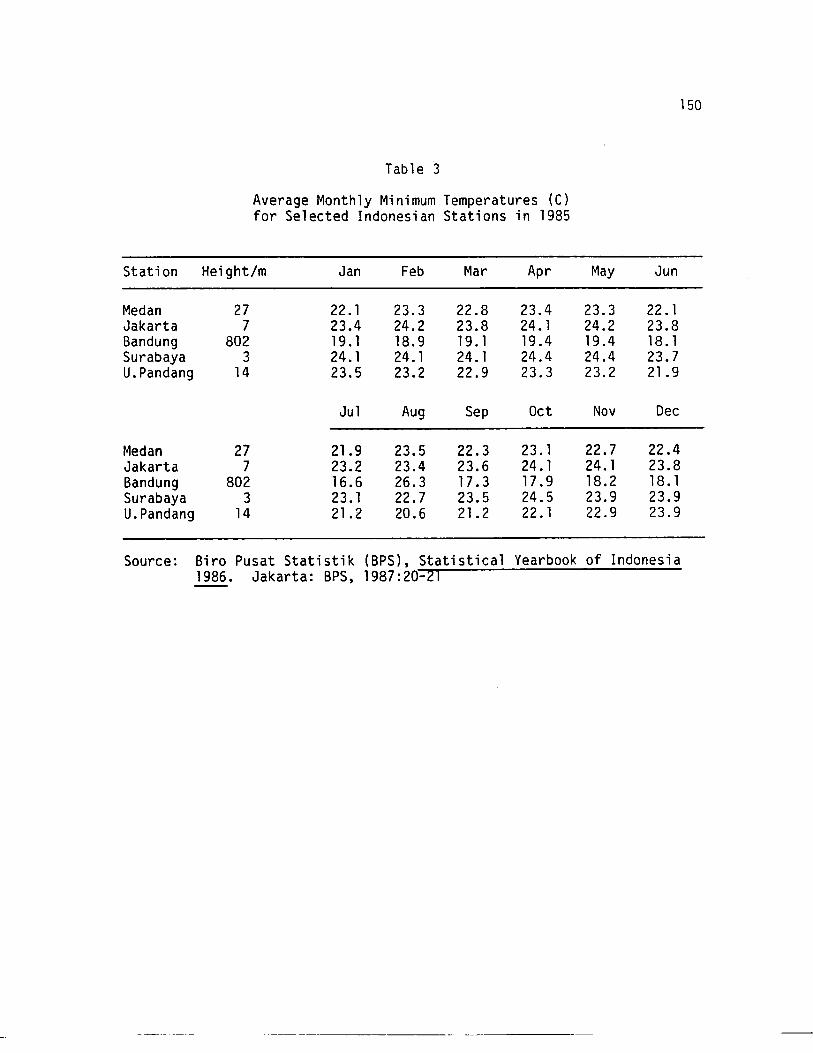
Table 3
Average Monthly Minimum Temperatures (C)for Selected Indonesian Stations in 1985
150
Station Height/m Jan Feb Mar Apr May Jun
Medan 27 22.1 23.3 22.8 23.4 23.3 22. 1Jakarta 7 23.4 24.2 23.8 24. 1 24.2 23.8Bandung 802 19. 1 18.9 19. 1 19.4 19.4 18. 1Surabaya 3 24.1 24.1 24.1 24.4 24.4 23.7U.Pandang 14 23.5 23.2 22.9 23.3 23.2 21.9
Ju1 Aug Sep Oct Nov Dec
Medan 27 21.9 23.5 22.3 23.1 22.7 22.4Jakarta 7 23.2 23.4 23.6 24.1 24.1 23.8Bandung 802 16.6 26.3 17.3 17.9 18.2 18. 1Surabaya 3 23.1 22.7 23.5 24.5 23.9 23.9U.Pandang 14 21.2 20.6 21.2 22. 1 22.9 23.9
Source: Biro Pusat Statistik (BPS), Statistical Yearbook of Indonesia1986. Jakarta: BPS, 1987:20-21
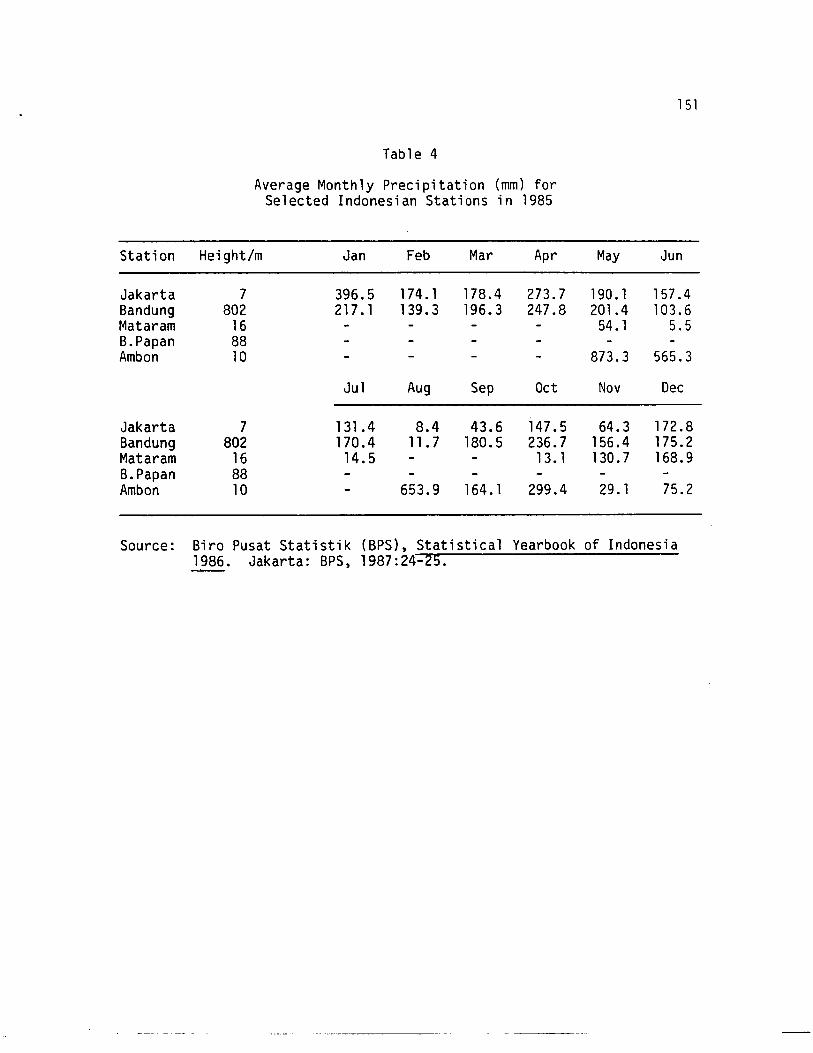
Table 4
Average Monthly Precipitation (mm) forSelected Indonesian Stations in 1985
151
Station Height/m Jan Feb Mar Apr May Jun
Jakarta 7 396.5 174. 1 178.4 273.7 190.1 157.4Bandung 802 217.1 139.3 196.3 247.8 201.4 103.6Mataram 16 54.1 5.5B.Papan 88Ambon 10 873.3 565.3
Jul Aug Sep Oct Nov Dec
Jakarta 7 131.4 8.4 43.6 147.5 64.3 172.8Bandung 802 170.4 11.7 180.5 236.7 156.4 175.2Mataram 16 14.5 13. 1 130.7 168.9B.Papan 88Ambon 10 653.9 164. 1 299.4 29. 1 75.2
Source: Biro Pusat Statistik (BPS), Statistical Yearbook of Indonesia1986. Jakarta: BPS, 1987:24-25.
- - ------
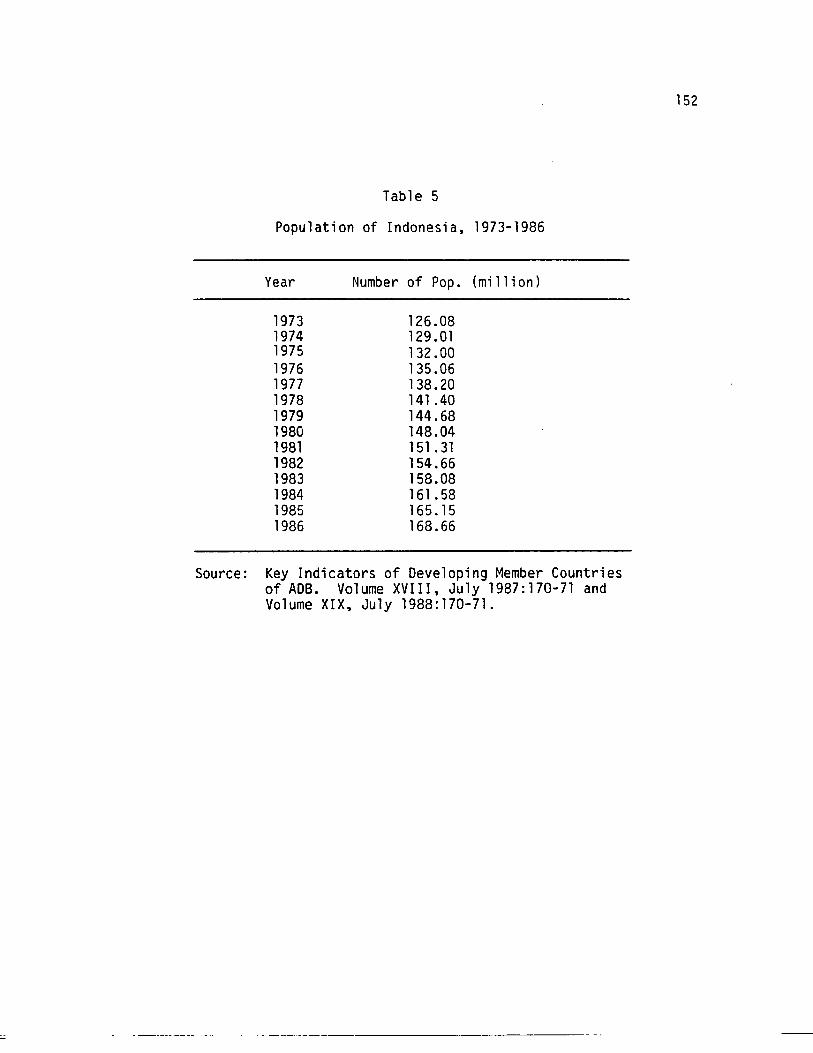
Table 5
Population of Indonesia, 1973-1986
Year Number of Pop. (mill i on)
1973 126.081974 129.011975 132.001976 135.061977 138.201978 141.401979 144.681980 148.041981 151.311982 154.661983 158.081984 161 .581985 165.151986 168.66
Source: Key Indicators of Developing Member Countriesof ADS. Volume XVIII, July 1987:170-71 andVolume XIX, July 1988:170-71.
152
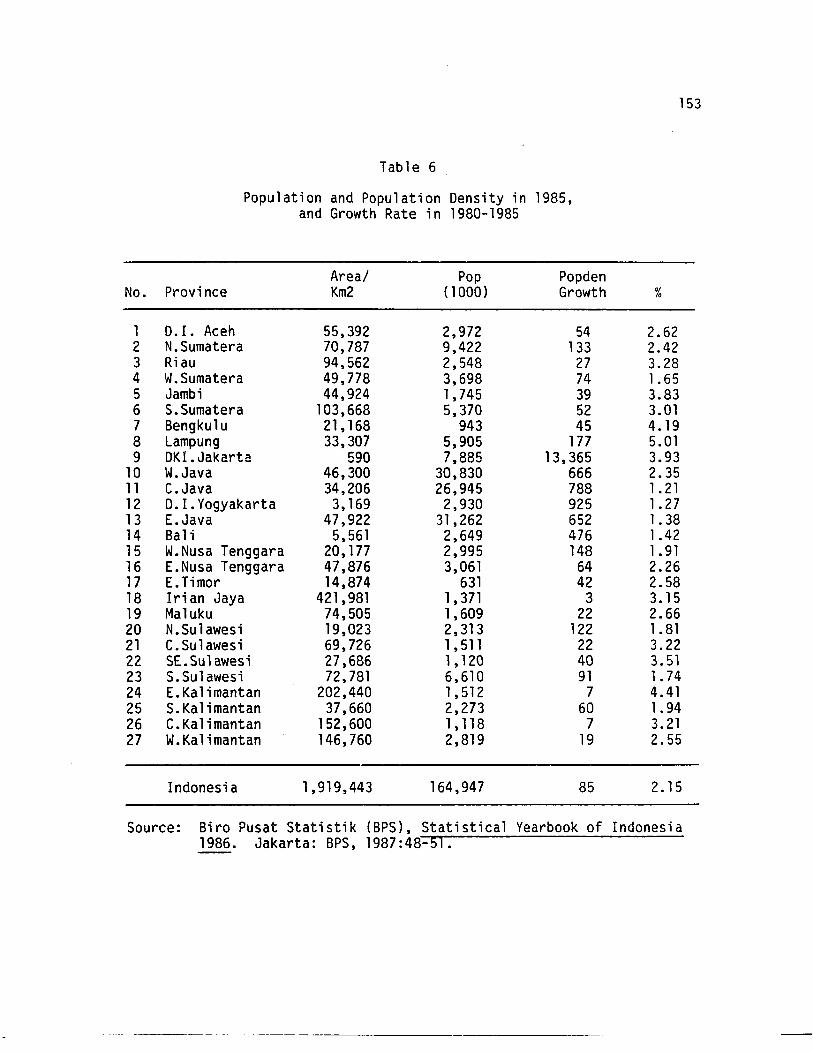
Table 6
Population and Population Density in 1985,and Growth Rate in 1980-1985
153
Areal Pop PopdenNo. Province Km2 (1000) Growth %
1 D. I. Aceh 55,392 2,972 54 2.622 N.Sumatera 70,787 9,422 133 2.423 Riau 94,562 2,548 27 3.284 W.Sumatera 49,778 3,698 74 1. 655 Jambi 44,924 1,745 39 3.836 S.Sumatera 103,668 5,370 52 3.017 Bengkulu 21,168 943 45 4. 198 Lampung 33,307 5,905 177 5.019 DKI.Jakarta 590 7,885 13,365 3.93
10 W.Java 46,300 30,830 666 2.3511 C.Java 34,206 26,945 788 1. 2112 D.I.Yogyakarta 3,169 2,930 925 1.2713 E.Java 47,922 31,262 652 1. 3814 Bali 5,561 2,649 476 1.4215 W.Nusa Tenggara 20,177 2,995 148 1. 9116 E. Nusa Tenggara 47,876 3,061 64 2.2617 E.Timor 14,874 631 42 2.5818 Irian Jaya 421,981 1,371 3 3. 1519 Maluku 74,505 1,609 22 2.6620 N.Sulawesi 19,023 2,313 122 1. 8121 C.Sulawesi 69,726 1,511 22 3.2222 SEe Su1awesi 27,686 1,120 40 3.5123 S.Sulawesi 72,781 6,610 91 1. 7424 E.Kalimantan 202,440 1,512 7 4.4125 S.Kalimantan 37,660 2,273 60 1. 9426 C.Kalimantan 152,600 1,118 7 3.2127 W.Kalimantan 146,760 2,819 19 2.55
Indonesia 1,919,443 164,947 85 2. 15
Source: Biro Pusat Statistik (BPS), Statistical Yearbook of Indonesia1986. Jakarta: BPS, 1987:48-51.
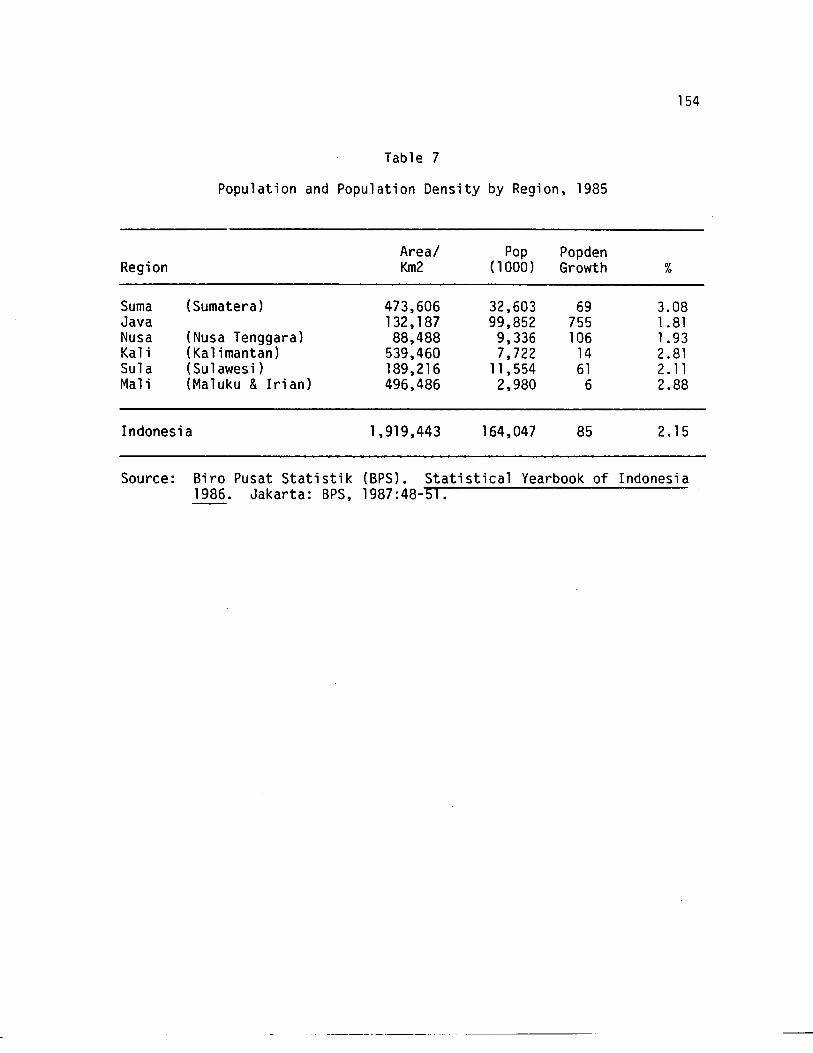
Table 7
Population and Population Density by Region, 1985
154
Areal Pop PopdenRegion Km2 (1000) Growth %
Suma (Sumatera) 473,606 32,603 69 3.08Java 132,187 99,852 755 1.81Nusa (Nusa Tenggara) 88,488 9,336 106 1.93Ka 1i (Kalimantan) 539,460 7,722 14 2.81Sula (Sulawesi) 189,216 11,554 61 2.11Ma 1i (Maluku &Irian) 496,486 2,980 6 2.88
Indonesia 1,919,443 164,047 85 2.15
Source: Biro Pusat Statistik (BPS ). Stati stical Yearbook of Indonesia1986. Jakarta: BPS, 1987:48-51.
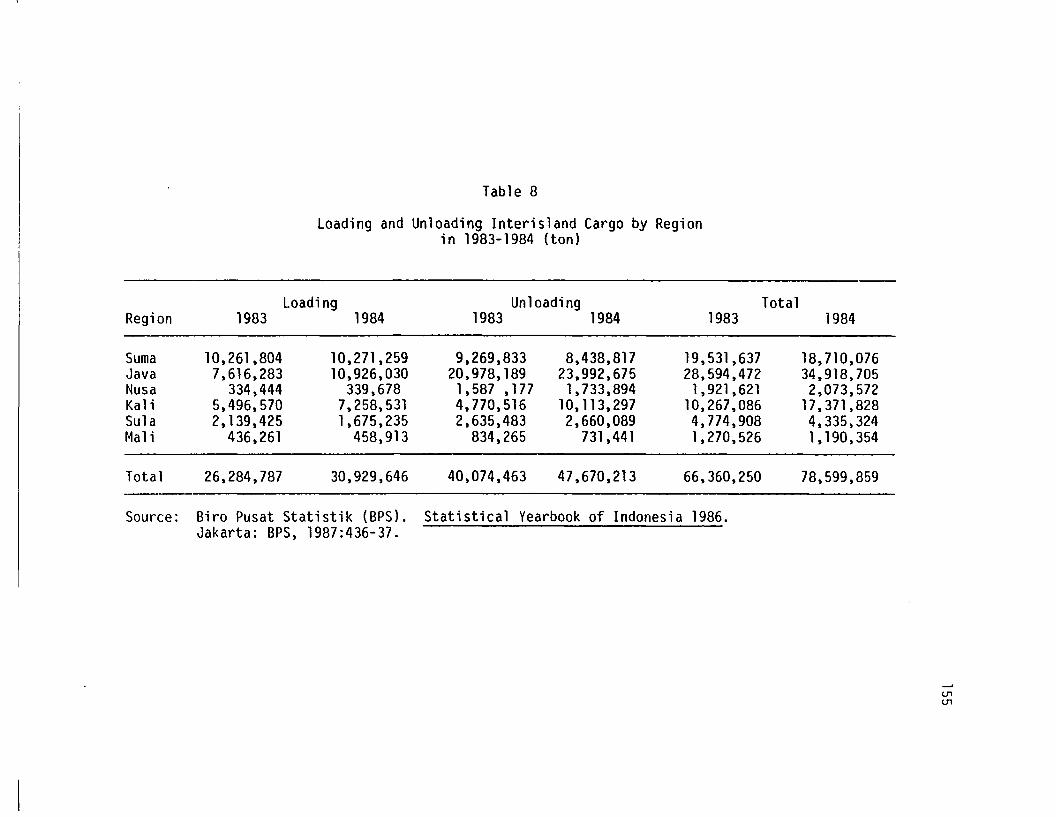
Table 8
Loading and Unloading Interisland Cargo by Regionin 1983-1984 (ton)
Loading Unloading TotalRegion 1983 1984 1983 1984 1983 1984
Suma 10,261,804 10,271,259 9,269,833 8,438,817 19,531,637 18,710,076Java 7,616,283 10,926,030 20,978,189 23,992,675 28,594,472 34,918.705Nusa 334,444 339,678 1,587 , 177 1,733,894 1,921,621 2,073,572Ka1i 5,496,570 7,258,531 4,770,516 10,113,297 10,267,086 17,371,828Su1a 2,139,425 1,675,235 2,635,483 2,660,089 4,774,908 4,335,324Mali 436,261 458,913 834,265 731,441 1,270,526 1,190,354
Total 26,284,787 30,929,646 40,074,463 47,670,213 66,360,250 78,599,859
Source: Biro Pusat Statistik (BPS). Statistical Yearbook of Indonesia 1986.Jakarta: BPS, 1987:436-37.
U'1U1
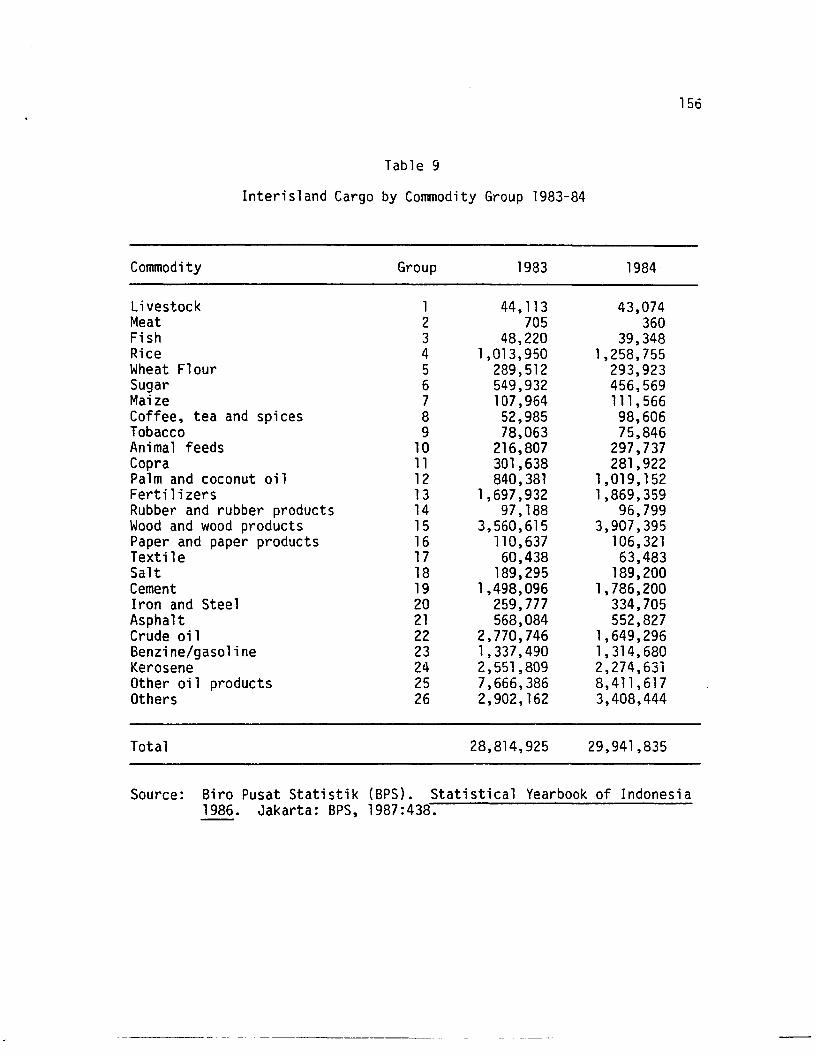
156
Table 9
Interisland Cargo by Commodity Group 1983-84
Commodity
LivestockMeatFishRiceWheat FlourSugarMaizeCoffee, tea and spicesTobaccoAnimal feedsCopraPalm and coconut oilFertil i zersRubber and rubber productsWood and wood productsPaper and paper productsTextil eSaltCementIron and SteelAsphaltCrude oilBenzine/gasolineKeroseneOther oil productsOthers
Total
Group
123456789
1011121314151617181920212223242526
1983
44,113705
48,2201,013,950
289,512549,932107,96452,98578,063
216,807301,638840,381
1,697,93297,188
3,560,615110,63760,438
189,2951,498,096
259,777568,084
2,770,7461,337,4902,551,8097,666,3862,902,162
28,814,925
1984
43,074360
39,3481,258,755
293,923456,569111,56698,60675,846
297,737281,922
1,019,1521,869,359
96,7993,907,395
106,32163,483
189,2001,786,200
334,705552,827
1,649,2961,314,6802,274,6318,411,6173,408,444
29,941,835
Source: Biro Pusat Statistik (BPS). Statistical Yearbook of Indonesia1986. Jakarta: BPS, 1987:438.
---- -- --- --
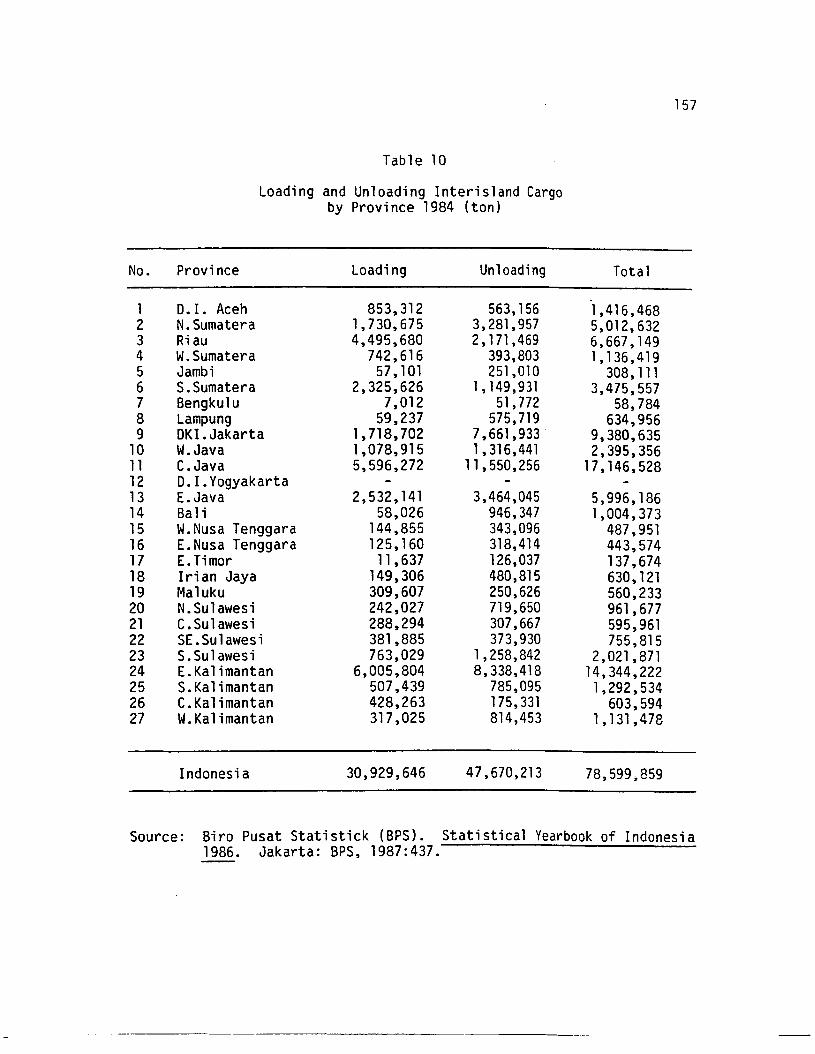
157
Table 10
Loading and Unloading Interisland Cargoby Province 1984 (ton)
No. Province Loading Unloading Total
853,312 -1 D. I. Aceh 563,156 1,416,4682 N.Sumatera 1,730,675 3,281,957 5,012,6323 Riau 4,495,680 2, 171 ,469 6,667,1494 W.Sumatera 742,616 393,803 1,136,4195 Jambi 57,101 251,010 308,1116 S.Sumatera 2,325,626 1,149,931 3,475,5577 Bengkulu 7,012 51,772 58,7848 Lampung 59,237 575,719 634,9569 DKI.Jakarta 1,718,702 7,661,933· 9,380,635
10 W.Java 1,078,915 1,316,441 2,395,35611 C.Java 5,596,272 11,550,256 17,146,52812 D.I.Yogyakarta13 E.Java 2,532,141 3,464,045 5,996,18614 Ba1i 58,026 946,347 1,004,37315 W.Nusa Tenggara 144,855 343,096 487,95116 E.Nusa Tenggara 125,160 318,414 443,57417 E.Timor 11 ,637 126,037 137,67418 Irian Jaya 149,306 480,815 630,12119 Maluku 309,607 250,626 560,23320 N.Sulawesi 242,027 719,650 961,67721 C.Sulawesi 288,294 307,667 595,96122 SE.Su1awes i 381,885 373,930 755,81523 S.Sulawesi 763,029 1,258,842 2,021,87124 E. Ka1imantan 6,005,804 8,338,418 14,344,22225 S.Kalimantan 507,439 785,095 1,292,53426 C.Kalimantan 428,263 175,331 603,59427 W.Kalimantan 317,025 814,453 1,131,478
Indonesia 30,929,646 47,670,213 78,599.859
Source: Biro Pusat Statistick (BPS). Statistical Yearbook of Indonesia1986. Jakarta: BPS, 1987:437.
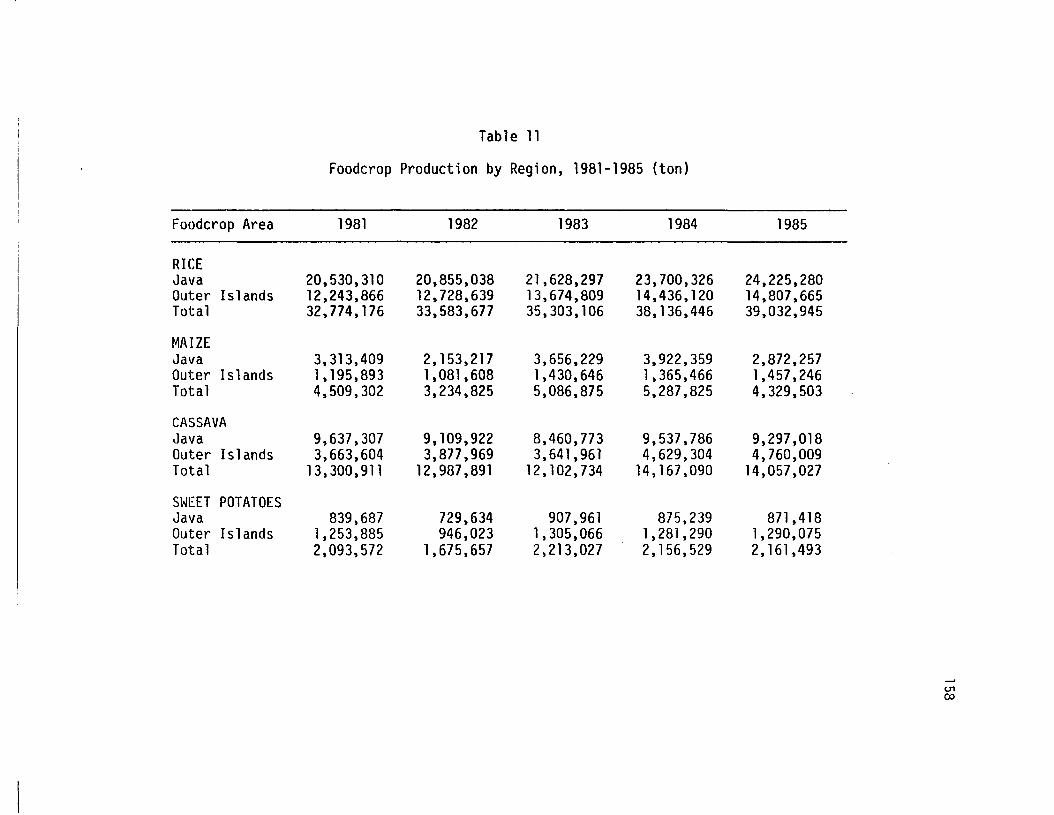
Table 11
Foodcrop Production by Region, 1981-1985 (ton)
Foodcrop Area 1981 1982 1983 1984 1985
RICEJava 20,530,310 20,855,038 21,628,297 23,700,326 24,225,280Outer Islands 12,243,866 12,728,639 13,674,809 14,436,120 14,807,665Total 32,774,176 33,583,677 35,303,106 38,136,446 39,032,945
MAIZEJava 3,313,409 2,153,217 3,656,229 3,922,359 2,872,257Outer Islands 1,195,893 1,081,608 1,430,646 1.365,466 1,457,246Total 4,509,302 3,234,825 5,086,875 5,287,825 4,329,503
CASSAVAJava 9,637,307 9,109,922 8,460,773 9,537,786 9,297,018Outer Islands 3,663,604 3,877,969 3,641,961 4,629,304 4,760,009Total 13,300,911 12,987,891 12,102,734 14,167,090 14,057,027
SWEET POTATOESJava 839,687 729,634 907,961 875,239 871,418Outer Islands 1,253,885 946,023 1,305,066 1,281,290 1,290,075Total 2,093,572 1,675,657 2,213,027 2,156,529 2,161,493
U1ex>
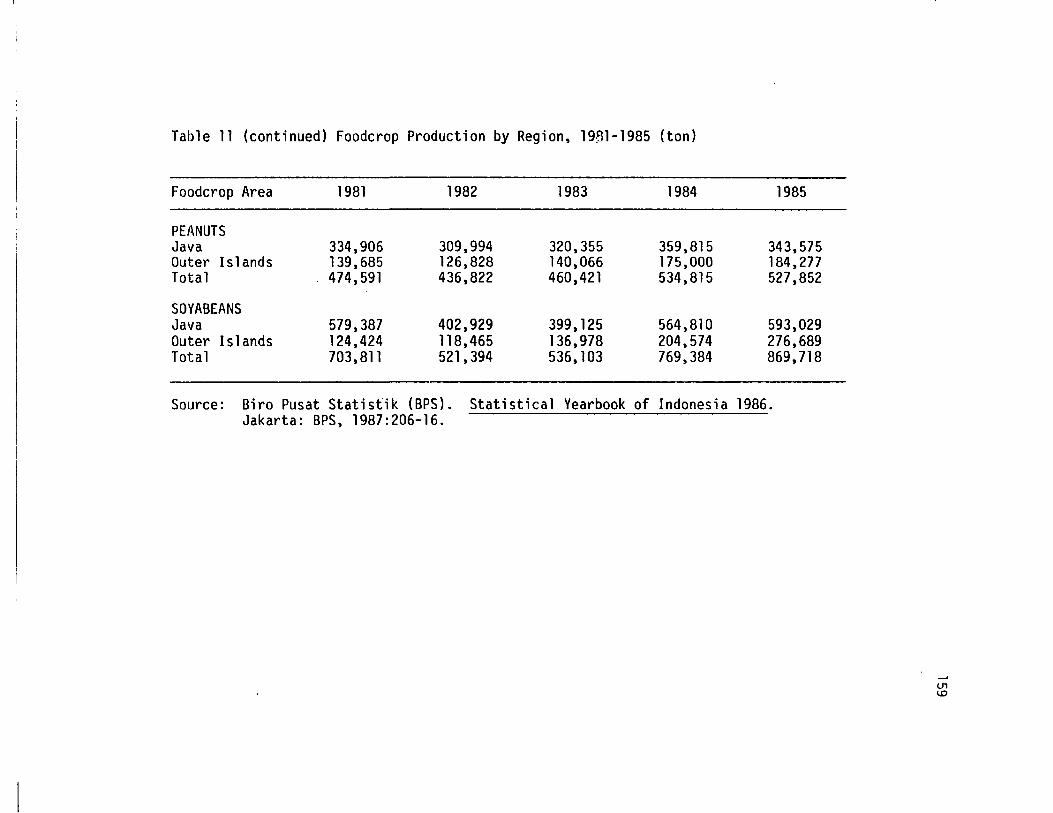
Table 11 (continued) Foodcrop Production by Region, 1981-1985 (ton)
Foodcrop Area 1981 1982 1983 1984 1985
PEANUTSJava 334,906 309,994 320,355 359,815 343,575Outer Islands 139,685 126,828 140,066 175,000 184,277Total 474,591 436,822 460,421 534,815 527,852
SOYABEANSJava 579,387 402,929 399,125 564,810 593,029Outer Islands 124,424 118,465 136,978 204,574 276,689Total 703,811 521,394 536,103 769,384 869,718
Source: Biro Pusat Statistik (BPS). Statistical Yearbook of Indonesia 1986.Jakarta: BPS, 1987:206-16.
U1u:>
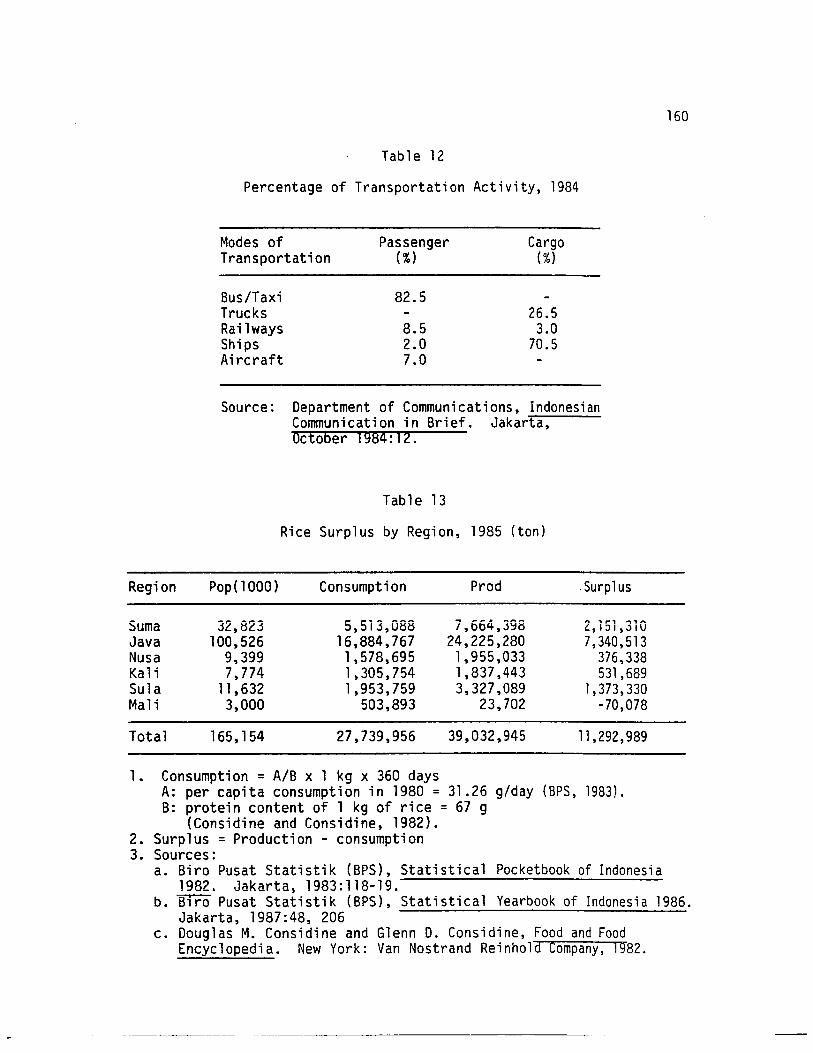
160
Table 12
Percentage of Transportation Activity, 1984
Modes ofTransportation
Bus/TaxiTrucksRailwaysShipsAircraft
Passenger(%)
82.5
8.52.07.0
Cargo(%)
26.53.0
70.5
Source: Department of Communications, IndonesianCommunication in Brief. Jakarta,October 1984:12.
Table 13
Rice Surplus by Region, 1985 (ton)
Region Pop(1000) Consumption Prod .Surplus
Suma 32,823 5,513,088 7,664,398 2,151,310Java 100,526 16,884,767 24,225,280 7,340,513Nusa 9,399 1,578,695 1,955,033 376,338Kali 7,774 1,305,754 1,837,443 531,689Sula 11,632 1,953,759 3,327,089 1,373,330Mali 3,000 503,893 23,702 -70,078
Total 165,154 27,739,956 39,032,945 11 ,292,989
1. Consumption = AlB x 1 kg x 360 daysA: per capita consumption in 1980 = 31.26 g/day (BPS, 1983).B: protein content of 1 kg of rice = 67 g
(Considine and Considine, 1982).2. Surplus = Production - consumption3. Sources:
a. Biro Pusat Statistik (BPS), Statistical Pocketbook of Indonesia1982. Jakarta, 1983:118-19.
b. Biro Pusat Statistik (BPS), Statistical Yearbook of Indonesia 1986.Jakarta, 1987:48, 206
c. Douglas M. Considine and Glenn D. Considine, Food and FoodEncyclopedia. New York: Van Nostrand Reinhold Company, 1982.
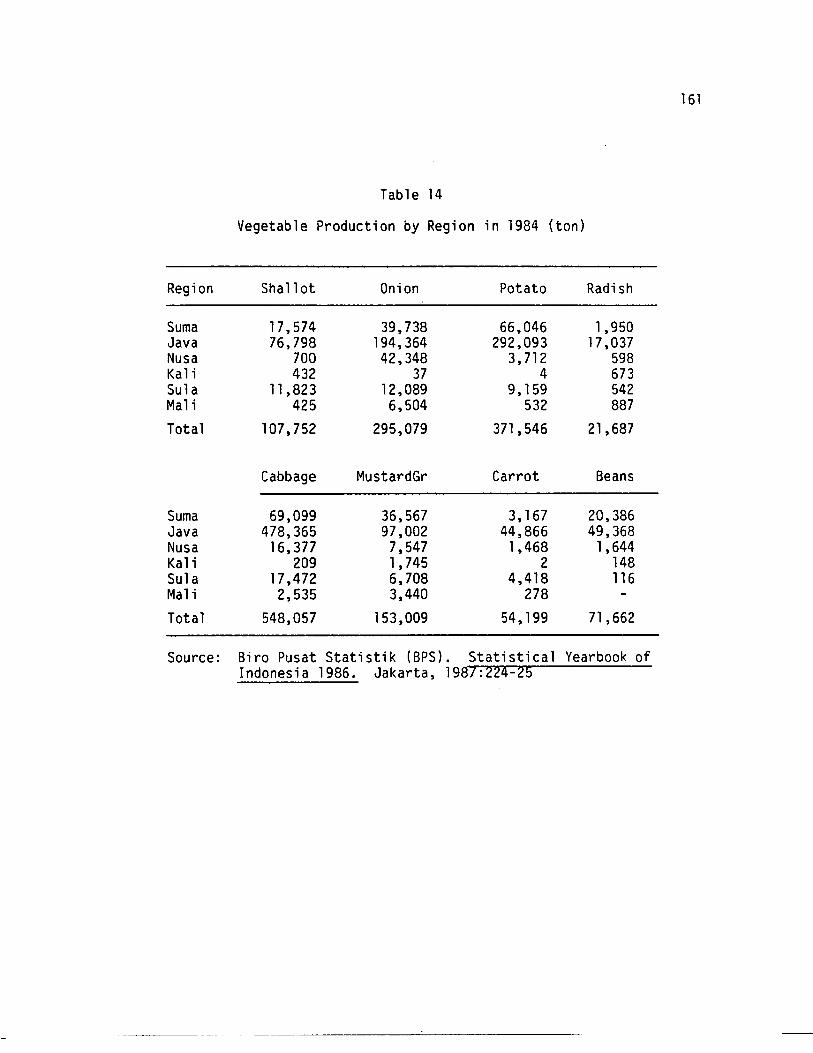
Table 14
Vegetable Production by Region in 1984 (ton)
Region Sha11 ot Onion Potato Radish
Suma 17,574 39,738 66,046 1,950Java 76,798 194,364 292,093 17,037Nusa 700 42,348 3,712 598Kali 432 37 4 673Sula 11 ,823 12,089 9,159 542Mali 425 6,504 532 887
Total 107,752 295,079 371,546 21,687
Cabbage MustardGr Carrot Beans
Suma 69,099 36,567 3,167 20,386Java 478,365 97,002 44,866 49,368Nusa 16,377 7,547 1,468 1,644Kali 209 1,745 2 148Sula 17,472 6,708 4,418 116Mali 2,535 3,440 278
Total 548,057 153,009 54,199 71,662
Source: Biro Pusat Statistik (BPS). Statistical Yearbook ofIndonesia 1986. Jakarta, 1987:224-25
161
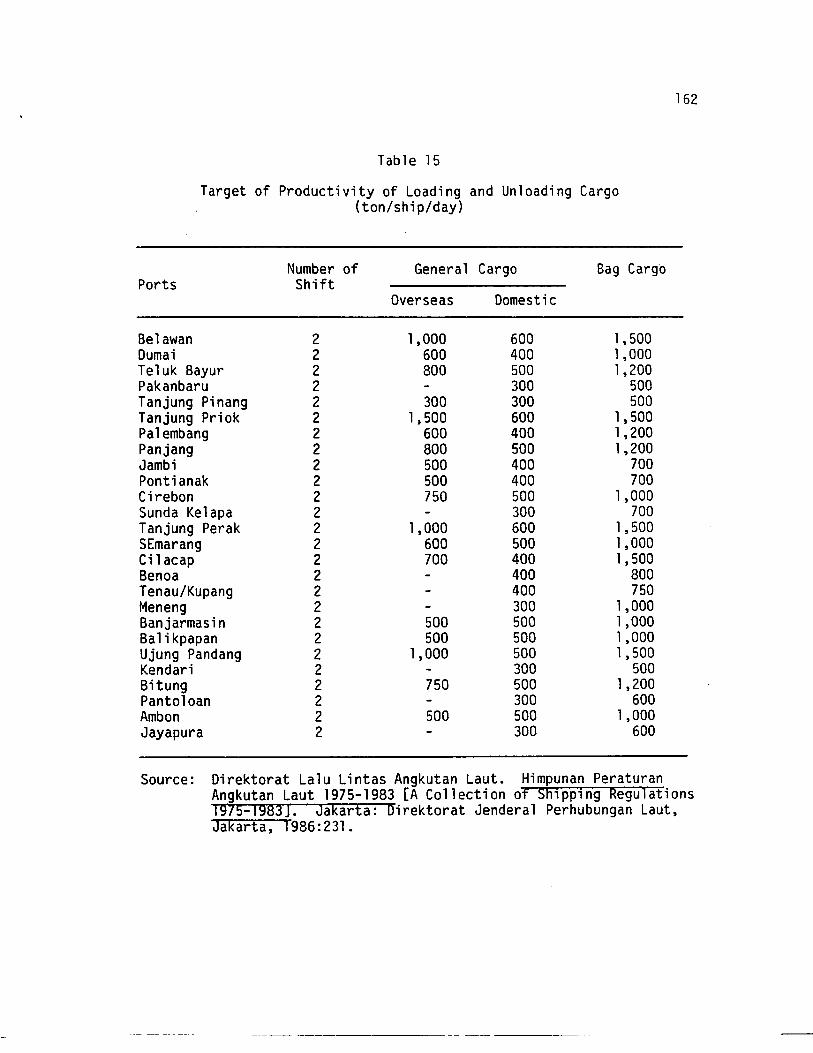
Table 15
Target of Productivity of Loading and Unloading Cargo(ton/ship/day)
162
Number of General Cargo Bag CargoPorts Shift
Overseas Domestic
Belawan 2 1,000 600 1,500Dumai 2 600 400 1,000Teluk Bayur 2 800 500 1,200Pakanbaru 2 300 500Tanjung Pinang 2 300 300 500Tanjung Priok 2 1 J 500 600 1,500Palembang 2 600 400 1,200Panjang 2 800 500 1,200Jambi 2 500 400 700Pontianak 2 500 400 700Cirebon 2 750 500 1,000Sunda Kelapa 2 300 700Tanjung Perak 2 1,000 600 1,500SEmarang 2 600 500 1,000Cilacap 2 700 400 1,500Benoa 2 400 800Tenau/Kupang 2 400 750Meneng 2 300 1,000Banjarmasin 2 500 500 1,000Balikpapan 2 500 500 1,000Ujung Pandang 2 1, 000 500 1,500Kendari 2 300 500Bitung 2 750 500 1,200Pantoloan 2 300 600Ambon 2 500 500 1,000Jayapura 2 300 600
Source: Direktorat Lalu Lintas Angkutan Laut. Himpunan PeraturanAngkutan Laut 1975-1983 [A Collection of Shlpplng Regulations1975-1983J. Jakarta: Direktorat Jenderal Perhubungan Laut,Jakarta, 1986:231.
----------- --~----
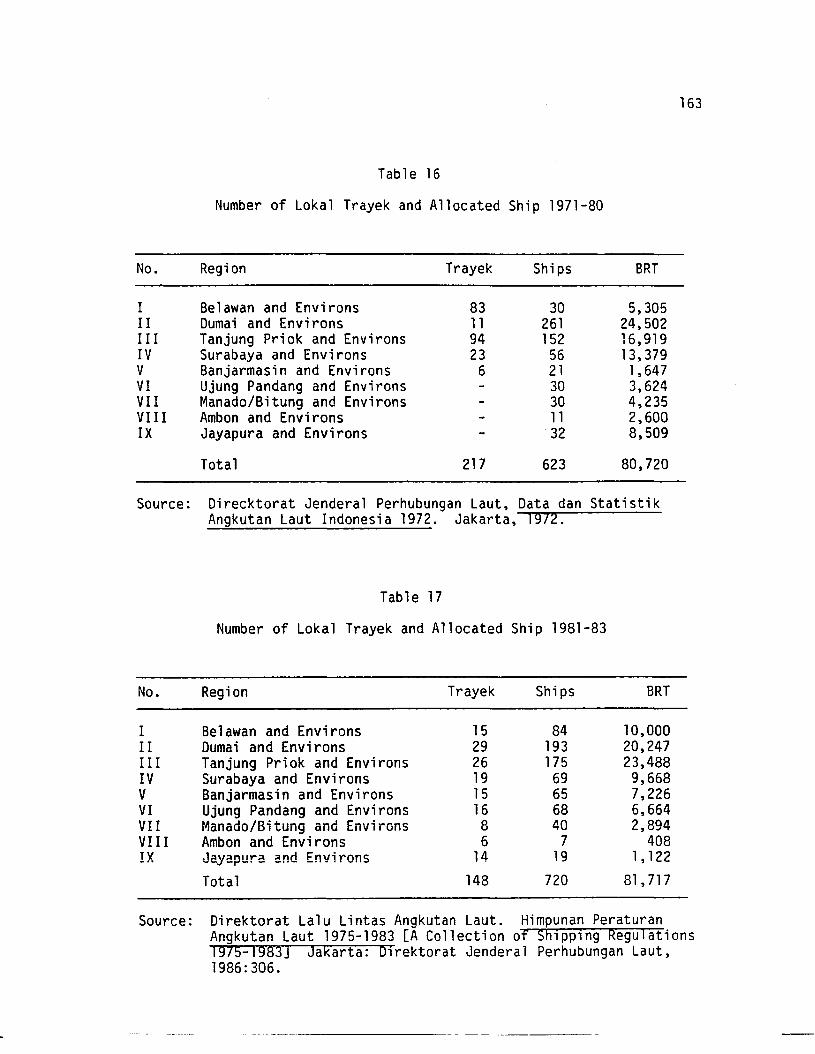
Table 16
Number of Loka1 Trayek and Allocated Ship 1971-80
No. Region Trayek Ships BRT
I Be1awan and Environs 83 30 5,305II Dumai and Environs 11 261 24,502III Tanjung Priok and Environs 94 152 16,919IV Surabaya and Environs 23 56 13,379V Banjarmasin and Environs 6 21 1,647VI Ujung Pandang and Environs 30 3,624VII Manado/Bitung and Environs 30 4,235VIII Ambon and Environs 11 2,600IX Jayapura and Environs 32 8,509
Total 217 623 80,720
Source: Direcktorat Jendera1 Perhubungan Laut, Data dan StatistikAngkutan Laut Indonesia 1972. Jakarta, 1972.
Table 17
Number of Loka1 Trayek and Allocated Ship 1981-83
163
No. Region Trayek Ships BRT
I Be1awan and Environs 15 84 10,000II Dumai and Environs 29 193 20,247III Tanjung Priok and Environs 26 175 23,488IV Surabaya and Environs 19 69 9,668V Banjarmasin and Environs 15 65 7,226VI Ujung Pandang and Environs 16 68 6,664VII Manado/Bitung and Environs 8 40 2,894VIII Ambon and Environs 6 7 408IX Jayapura and Environs 14 19 1, 122
Total 148 720 81,717
Source: Direktorat Lalu Lintas Angkutan Laut. Himpunan PeraturanAngkutan Laut 1975-1983 [A Collection of Shlpplng Regulations1975-1983] Jakarta: Dlrektorat Jenderal Perhubungan Laut,1986:306.
----------------
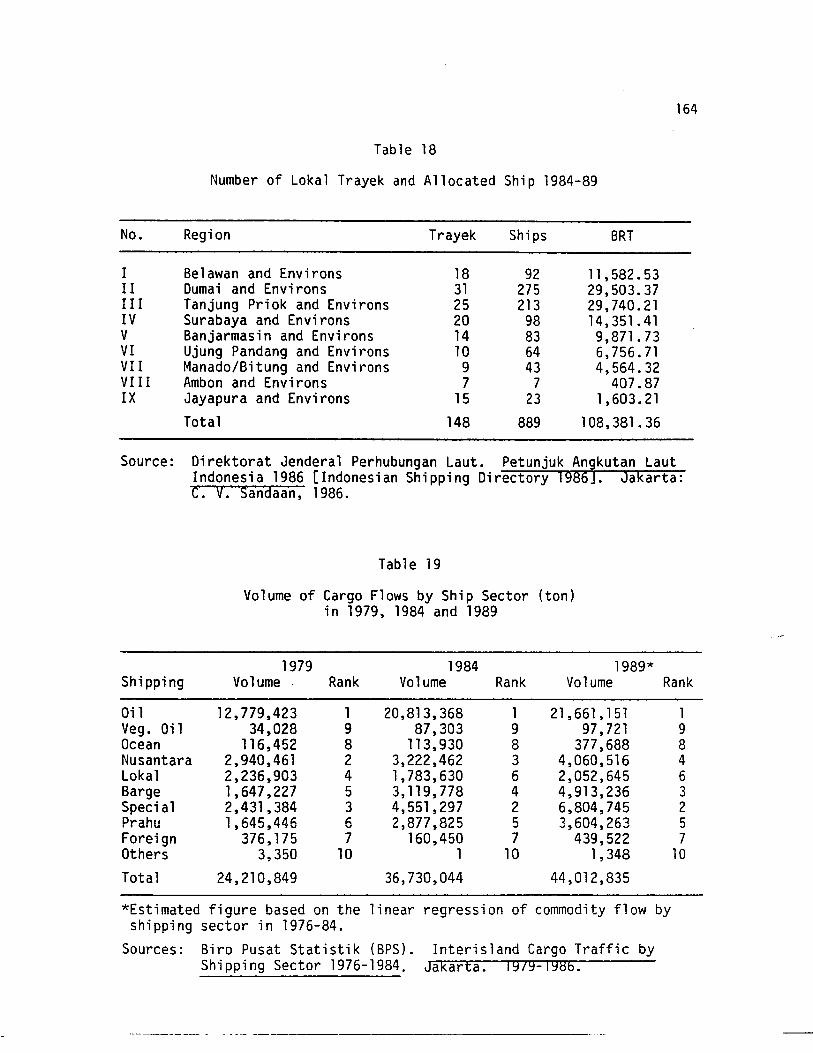
Table 18
Number of Loka1 Trayek and Allocated Ship 1984-89
164
No. Region Trayek Ships BRT
I Be1awan and Environs 18 92 11 ,582.53I I Dumai and Environs 31 275 29,503.37III Tanjung Priok and Environs 25 213 29,740.21IV Surabaya and Environs 20 98 14,351 .41V Banjarmasin and Environs 14 83 9,871.73VI Ujung Pandang and Environs 10 64 6,756.71VII Manado/Bitung and Environs 9 43 4,564.32VIII Ambon and Environs 7 7 407.87IX Jayapura and Environs 15 23 1,603.21
Total 148 889 108,381.36
Source: Direktorat Jenderal Perhubungan Laut. Petunjuk Angkutan LautIndonesia 1986 [Indonesian Shipping Directory 1986]. Jakarta:c. v. Sandaan, 1986.
Table 19
Volume of Cargo Flows by Ship Sector (ton)in 1979, 1984 and 1989
1979 1984 1989*Shipping Volume Rank Volume Rank Volume Rank
Oil 12,779,423 1 20,813,368 1 21,661,151 1Veg. Oil 34,028 9 87,303 9 97,721 9Ocean 116,452 8 113,930 8 377 ,688 8Nusantara 2,940,461 2 3,222,462 3 4,060,516 4Lokal 2,236,903 4 1,783,630 6 2,052,645 6Barge 1,647,227 5 3,119,778 4 4,913,236 3Speci al 2,431,384 3 4,551,297 2 6,804,745 2Prahu 1,645,446 6 2,877 ,825 5 3,604,263 5Foreign 376,175 7 160,450 7 439,522 7Others 3,350 10 1 10 1,348 10
Total 24,210,849 36,730,044 44,012,835
*Estimated figure based on the 1i near regression of commodity flow byshipping sector in 1976-84.
Sources: Biro Pusat Statistik (BPS). Interisland Cargo Traffic byShipping Sector 1976-1984. Jakarta. 1979-1986.
-----------
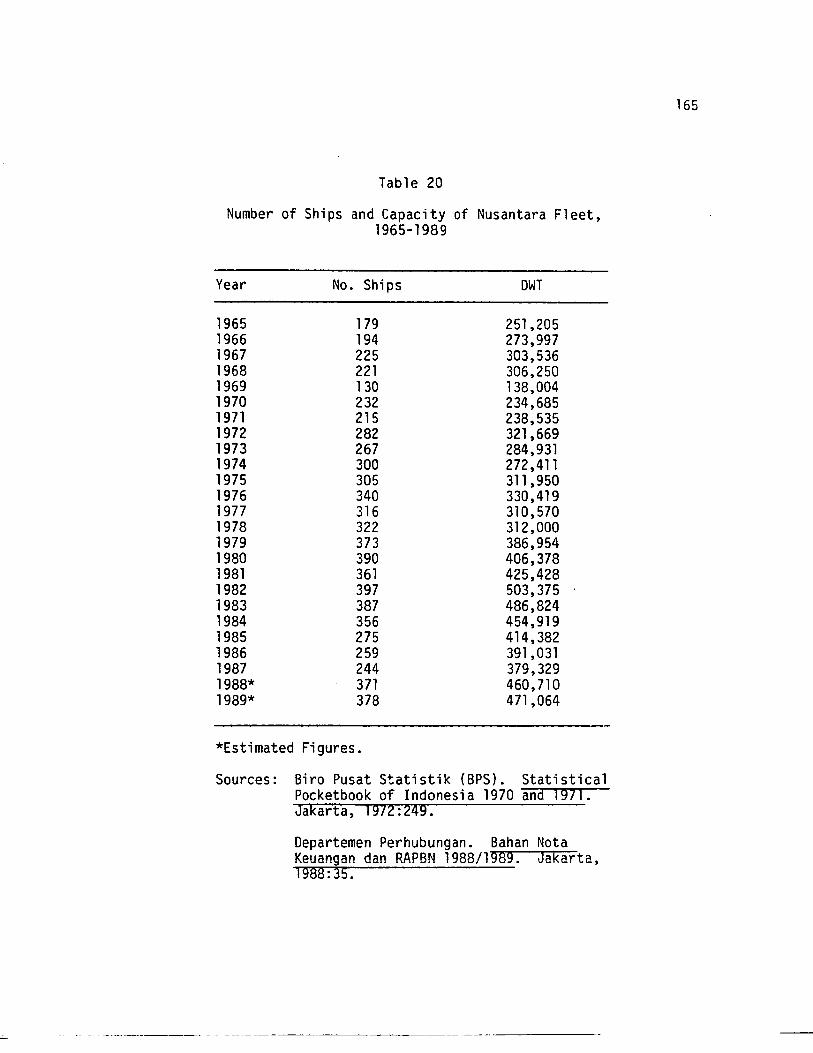
Table 20
Number of Ships and Capacity of Nusantara Fleet,1965-1989
Year No. Ships OWT
1965 179 251,2051966 194 273,9971967 225 303,5361968 221 306,2501969 130 138,0041970 232 234,6851971 215 238,5351972 282 321,6691973 267 284,9311974 300 272,4111975 305 311 ,9501976 340 330,4191977 316 310,5701978 322 312,0001979 373 386,9541980 390 406,3781981 361 425,4281982 397 503,3751983 387 486,8241984 356 454,9191985 275 414,3821986 259 391,0311987 244 379,3291988* 371 460,7101989* 378 471,064
*Estimated Figures.
Sources: Biro Pusat Statistik (BPS). StatisticalPocketbook of Indonesia 1970 and 1971.Jakarta, 1972:249.
Oepartemen Perhubungan. Bahan NotaKeuangan dan RAPBN 1988/1989. Jakarta,1988:35.
_. -- - ---------- -- ----------_._-----
165
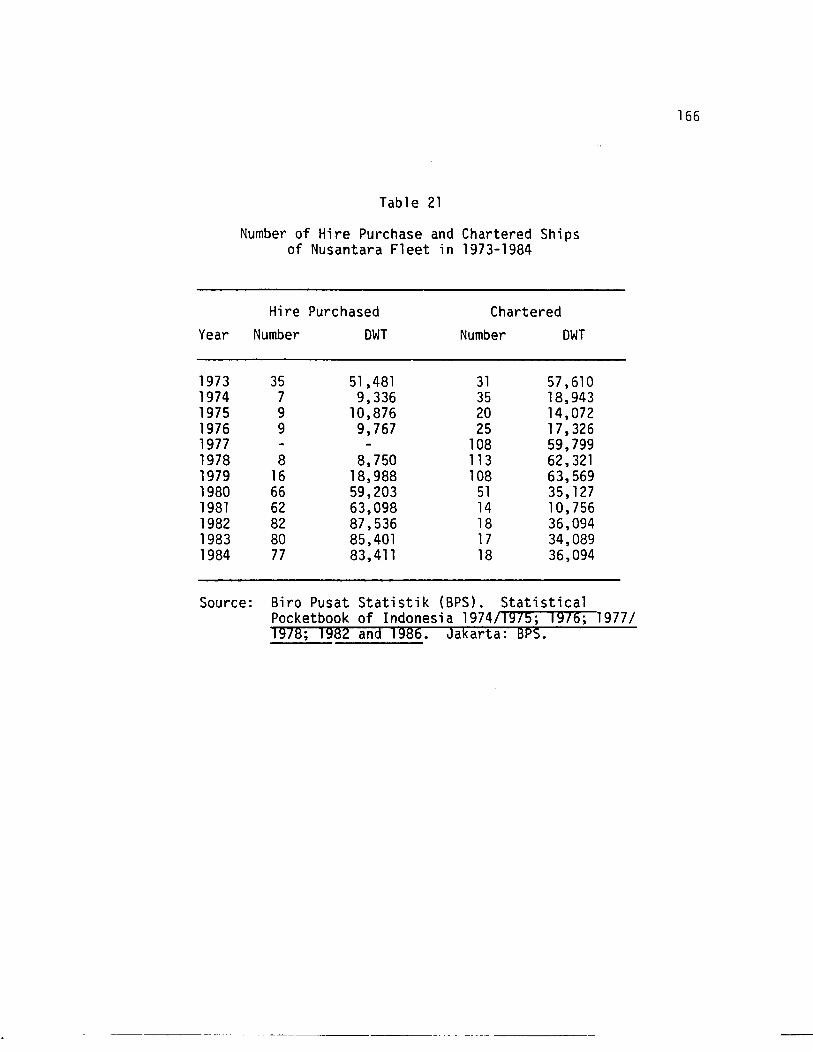
Table 21
Number of Hire Purchase and Chartered Shipsof Nusantara Fleet in 1973-1984
Hire Purchased CharteredYear Number DWT Number DWT
1973 35 51,481 31 57,6101974 7 9,336 35 18,9431975 9 10,876 20 14,0721976 9 9,767 25 17,3261977 108 59,7991978 8 8,750 113 62,3211979 16 18,988 108 63,5691980 66 59,203 51 35,1271981 62 63,098 14 10,7561982 82 87,536 18 36,0941983 80 85,401 17 34,0891984 77 83,411 18 36,094
Source: Biro Pusat Statistik (BPS). StatisticalPocketbook of Indonesia 1974/1975; 1976; 1977/1978; 1982 and 1986. Jakarta: BPS.
166
--- ---~- ~ -~-~- -------_.. - - ---------
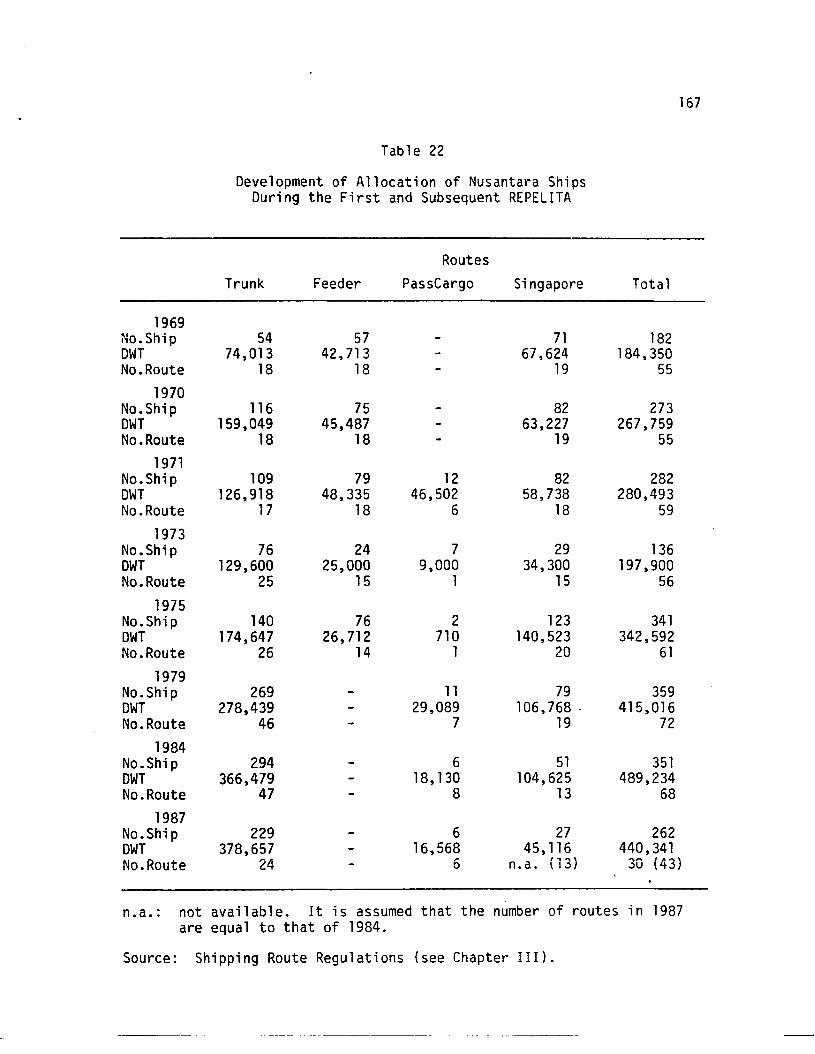
Table 22
Development of Allocation of Nusantara ShipsDuring the First and Subsequent REPELITA
167
Routes
Trunk Feeder PassCargo Singapore Total
1969No.Ship 54 57 71 182DWT 74,013 42,713 67,624 184,350No.Route 18 18 19 55
1970No.Ship 116 75 82 273DWT 159,049 45,487 63,227 267,759No. Route 18 18 19 55
1971No.Ship 109 79 12 82 282DWT 126,918 48,335 46,502 58,738 280,493No. Route 17 18 6 18 59
1973No.Ship 76 24 7 29 136DWT 129,600 25,000 9,000 34,300 197,900No. Route 25 15 1 15 56
1975No.Ship 140 76 2 123 341DWT 174,647 26,712 710 140,523 342,592No. Route 26 14 1 20 61
1979No.Ship 269 11 79 359DWT 278,439 29,089 106,768. 415,016No. Route 46 7 19 72
1984No.Ship 294 6 51 351DWT 366,479 18,130 104,625 489,234No. Route 47 8 13 68
1987No.Ship 229 6 27 262DWT 378,657 16,568 45,116 440,341No. Route 24 6 n.a. (13) 30 (43)
n. a. : not available. It is assumed that the number of routes in 1987are equal to that of 1984.
Source: Shipping Route Regulations (see Chapter III).
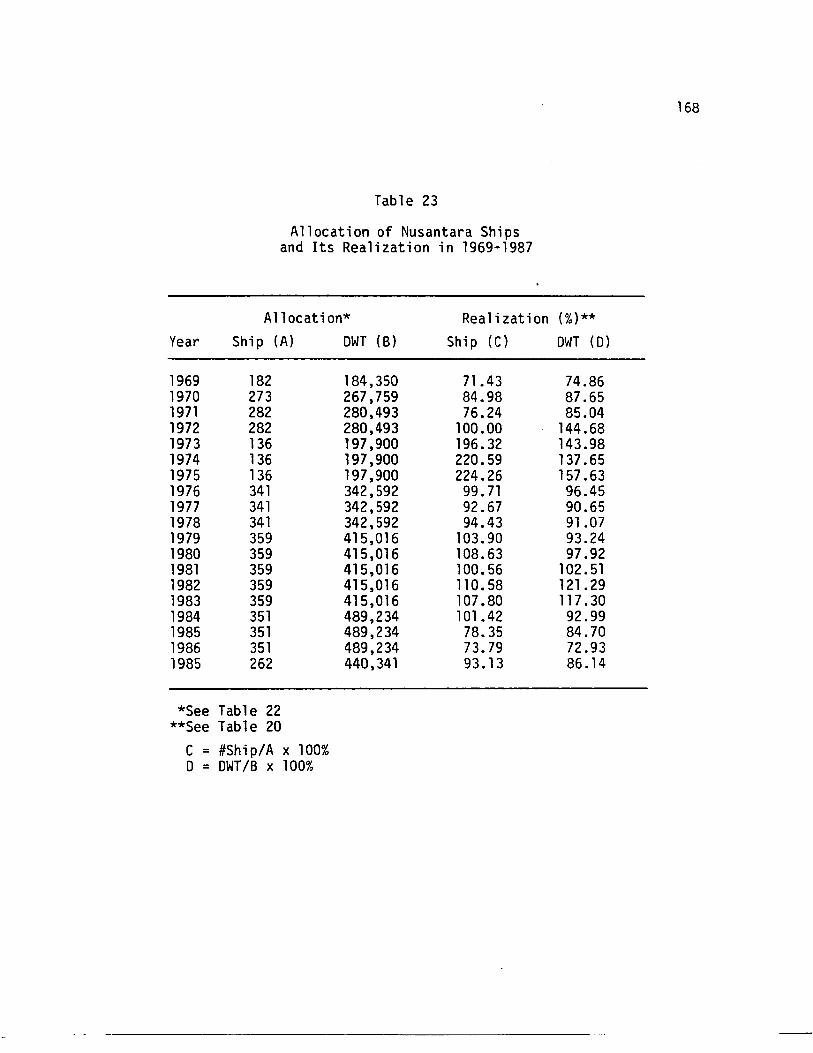
Table 23
Allocation of Nusantara Shipsand Its Realization in 1969-1987
A11ocation* Realization (%)**
Year Ship (A) DWT (B) Ship (C) DWT (0)
1969 182 184,350 71.43 74.861970 273 267,759 84.98 87.651971 282 280,493 76.24 85.041972 282 280,493 100.00 144.681973 136 197,900 196.32 143.981974 136 197,900 220.59 137.651975 136 197,900 224.26 157.631976 341 342,592 99.71 96.451977 341 342,592 92.67 90.651978 341 342,592 94.43 91.071979 359 415,016 103.90 93.241980 359 415,016 108.63 97.921981 359 415,016 100.56 102.511982 359 415,016 11 0.58 121.291983 359 415,016 107.80 117.301984 351 489,234 101.42 92.991985 351 489,234 78.35 84.701986 351 489,234 73.79 72 .931985 262 440,341 93.13 86.14
*See Table 22**See Table 20
C = #Ship/A x 100%o = OWT/B x 100%
168
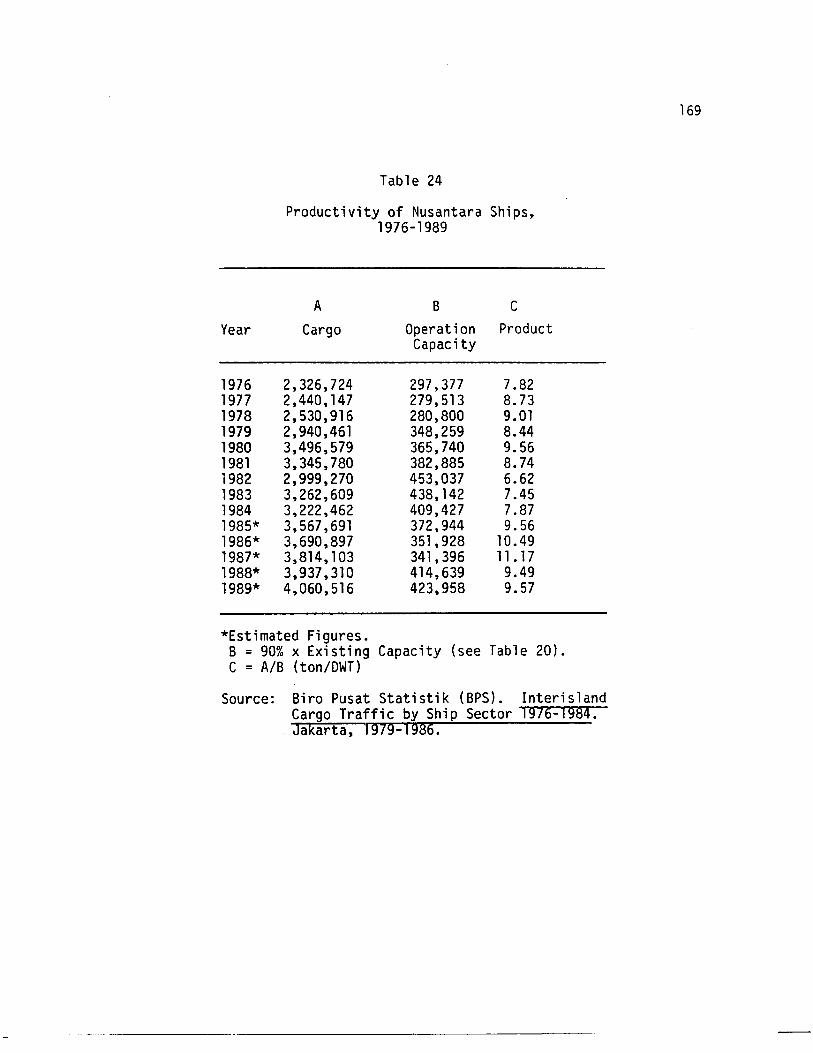
Table 24
Productivity of Nusantara Ships,1976-1989
A B C
Year Cargo Operation ProductCapacity
1976 2,326,724 297,377 7.821977 2,440,147 279,513 8.731978 2,530,916 280,800 9.011979 2,940,461 348,259 8.441980 3,496,579 365,740 9.561981 3,345,780 382,885 8.741982 2,999,270 453,037 6.621983 3,262,609 438,142 7.451984 3,222,462 409,427 7.871985* 3,567,691 372,944 9.561986* 3,690,897 351,928 10.491987* 3,814,103 341,396 11. 171988* 3,937,310 414,639 9.491989* 4,060,516 423,958 9.57
*Estimated Figures.B = 90% x Existing Capacity (see Table 20).C = AlB (ton/DWT)
Source: Biro Pusat Statistik (BPS). InterislandCargo Traffic by Ship Sector 1976-1984.Jakarta, 1979-1986.
169
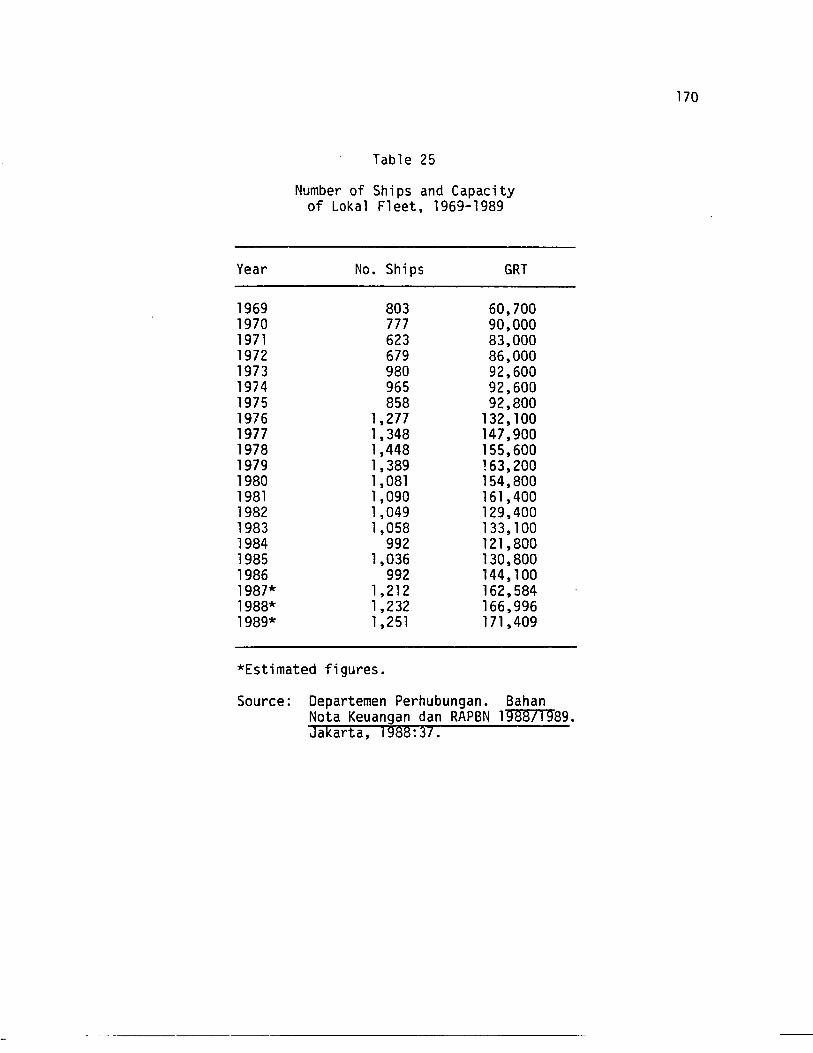
Table 25
Number of Ships and Capacityof Loka1 Fleet, 1969-1989
170
Year
1969197019711972197319741975197619771978197919801981198219831984198519861987*1988*1989*
No. Ships
803777623679980965858
1,2771,3481,4481,3891,0811,0901,0491,058
9921,036
9921,2121,2321,251
GRT
60,70090,00083,00086,00092,60092,60092,800
132,100147,900155,600163,200154,800161,400129,400133,100121,800130,800144,100162,584166,996171,409
*Estimated figures.
Source: Departemen Perhubungan. BahanNota Keuangan dan RAPBN 1988/1989.Jakarta, 1988:37.
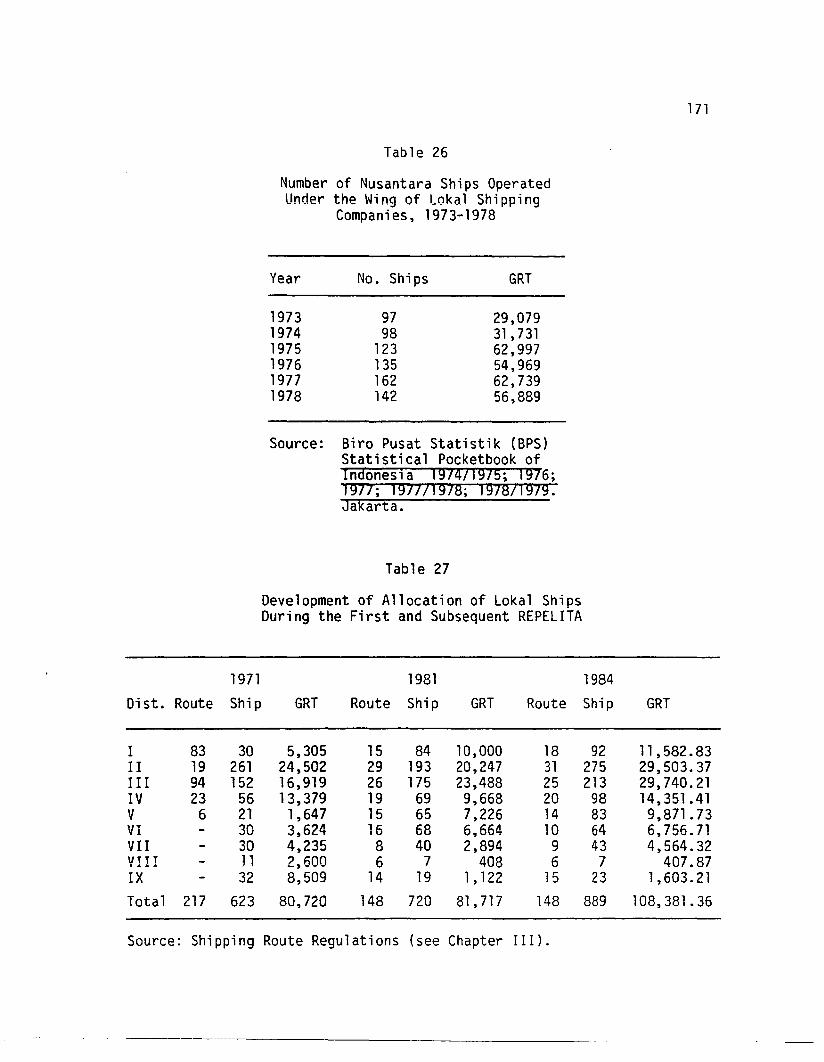
Table 26
Number of Nusantara Ships OperatedUnder the Wing of Lokal Shipping
Companies, 1973-1978
Year No. Ships GRT
1973 97 29,0791974 98 31,7311975 123 62,9971976 135 54,9691977 162 62,7391978 142 56,889
Source: Biro Pusat Statistik (BPS)Statistical Pocketbook ofIndonesla 197471975; 1976;1977; 197771978; 197871979.Jakarta.
Table 27
Development of Allocation of Loka1 ShipsDuring the First and Subsequent REPELITA
171
1971 1981 1984
Dist. Route Ship GRT Route Ship GRT Route Ship GRT
I 83 30 5,305 15 84 10,000 18 92 11,582.83II 19 261 24,502 29 193 20,247 31 275 29,503.37III 94 152 16,919 26 175 23,488 25 213 29,740.21IV 23 56 13,379 19 69 9,668 20 98 14,351.41V 6 21 1,647 15 65 7,226 14 83 9,871.73VI 30 3,624 16 68 6,664 10 64 6,756.71VII 30 4,235 8 40 2,894 9 43 4,564.32VI!! 11 2,600 6 7 408 6 7 407.87IX 32 8,509 14 19 1, 122 15 23 1,603.21
Total 217 623 80,720 148 720 81,717 148 889 108,381.36
Source: Shipping Route Regulations (see Chapter I I I ).
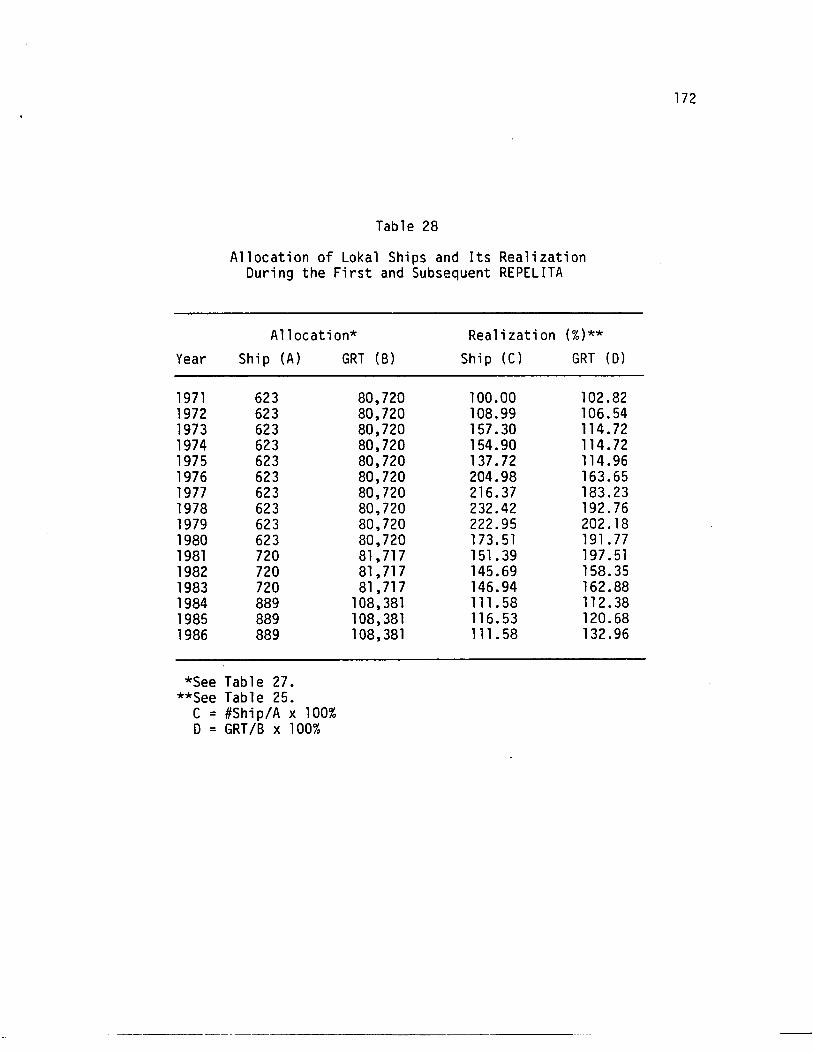
Table 28
Allocation of Lokal Ships and Its RealizationDuring the First and Subsequent REPELITA
A11ocation* Realization (%)**
Year Ship (A) GRT (B) Ship (C) GRT (0)
1971 623 80,720 100.00 102.821972 623 80,720 108.99 106.541973 623 80,720 157.30 114.721974 623 80,720 154.90 114.721975 623 80,720 137.72 114.961976 623 80,720 204.98 163.651977 623 80,720 216.37 183.231978 623 80,720 232.42 192.761979 623 80,720 222.95 202.181980 623 80,720 173.51 191 .771981 720 81,717 151.39 197.511982 720 81,717 145.69 158.351983 720 81,717 146.94 162.881984 889 108,381 111.58 112.381985 889 108,381 116.53 120.681986 889 108,381 111.58 132.96
*See Table 27.**See Table 25.
C = #Ship/A x 100%D = GRT/B x 100%
172
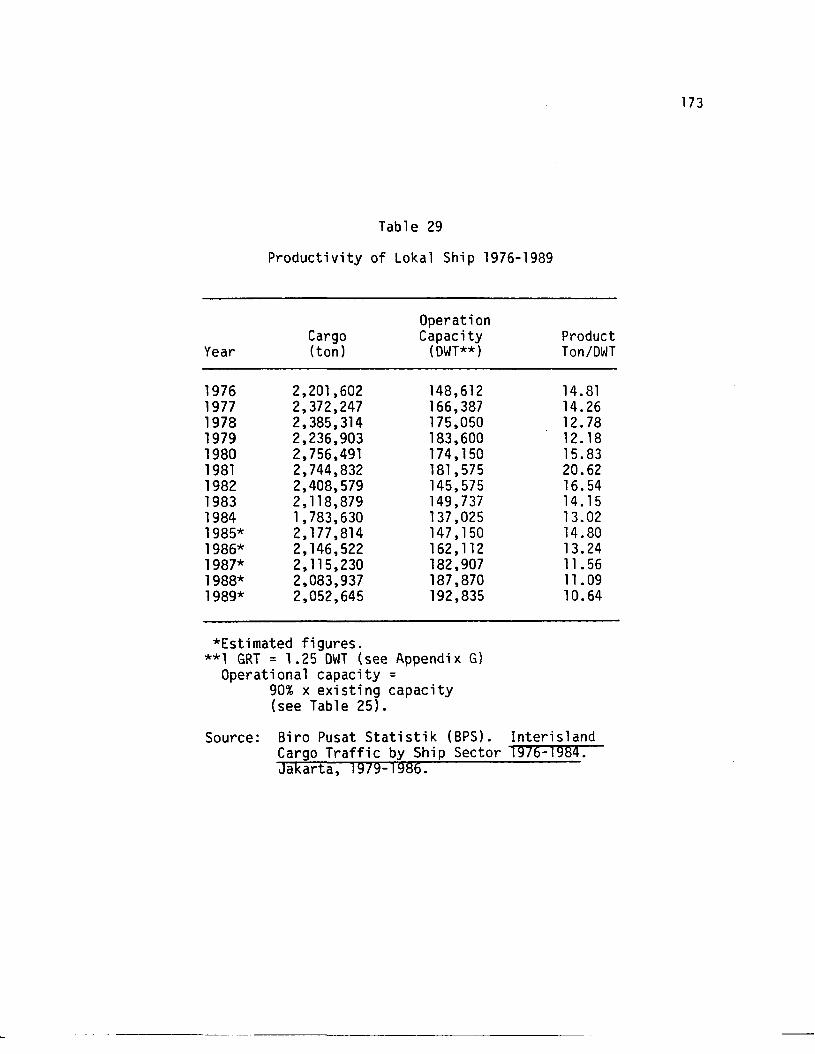
Table 29
Productivity of Lokal Ship 1976-1989
OperationCargo Capacity Product
Year (ton) (OWT**) Ton/OWT
1976 2,201,602 148,612 14.811977 2,372,247 166,387 14.261978 2,385,314 175,050 12.781979 2,236,903 183,600 12. 181980 2,756,491 174, 150 15.831981 2,744,832 181,575 20.621982 2,408,579 145,575 16.541983 2,118,879 149,737 14.151984 1,783,630 137,025 13.021985* 2,177,814 147,150 14.801986* 2,146,522 162, 112 13.241987* 2,115,230 182,907 11 .561988* 2,083,937 187,870 11.091989* 2,052,645 192,835 10.64
*Estimated figures.**1 GRT = 1.25 OWT (see Appendix G)
Operational capacity =90% x existing capacity(see Table 25).
Source: Biro Pusat Statistik (BPS). InterislandCargo Traffic by Ship Sector 1976-1984.Jakarta, 1979-1986.
173
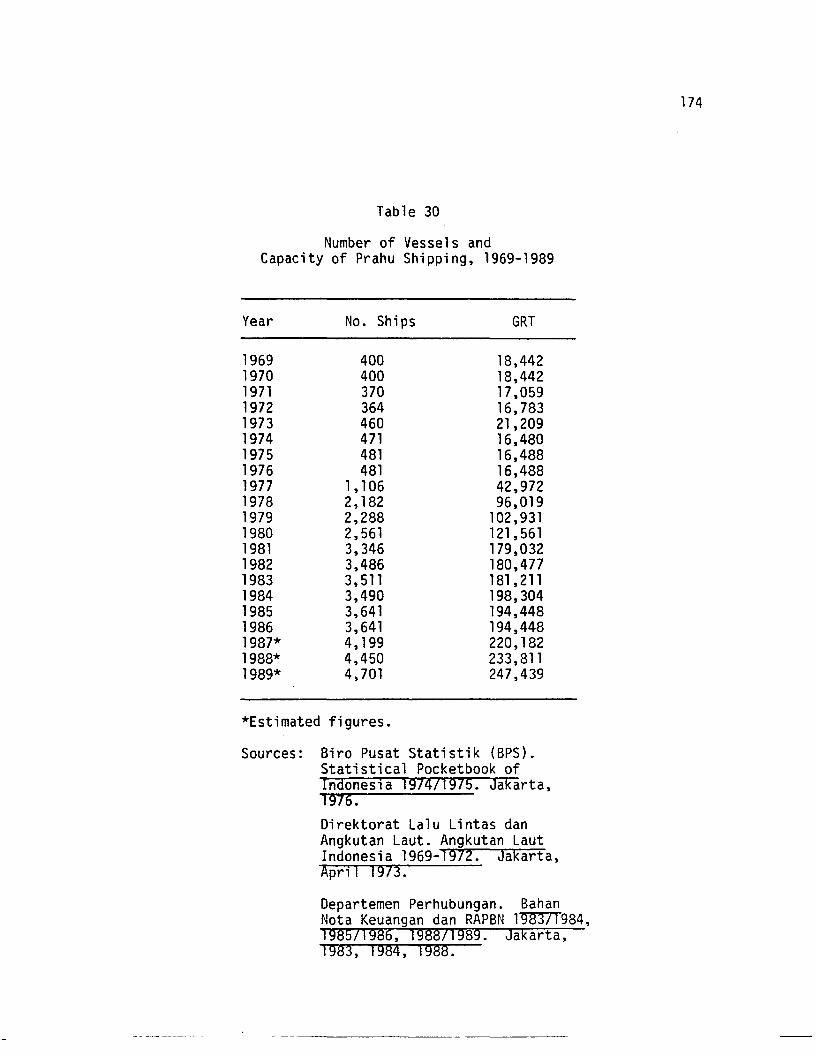
Table 30
Number of Vessels andCapacity of Prahu Shipping, 1969-1989
Year No. Ships GRT
1969 400 18,4421970 400 18,4421971 370 17,0591972 364 16,7831973 460 21,2091974 471 16,4801975 481 16,4881976 481 16,4881977 1,106 42,9721978 2,182 96,0191979 2,288 102,9311980 2,561 121,5611981 3,346 179,0321982 3,486 180,4771983 3,511 181,2111984 3,490 198,3041985 3,641 194,4481986 3,641 194,4481987* 4,199 220,1821988* 4,450 233,8111989* 4,701 247,439
*Estimated figures.
Sources: Biro Pusat Statistik (BPS).Statistical Pocketbook ofIndonesia 1974/1975. Jakarta,1976.
Direktorat La1u Lintas danAngkutan Laut. Angkutan LautIndonesia 1969-1972. Jakarta,Apr,1 1973.
Departemen Perhubungan. BahanNota Keuangan dan RAPBN 1983/1984,1985/1986, 1988/1989. Jakarta,1983, 1984, 1988.
174
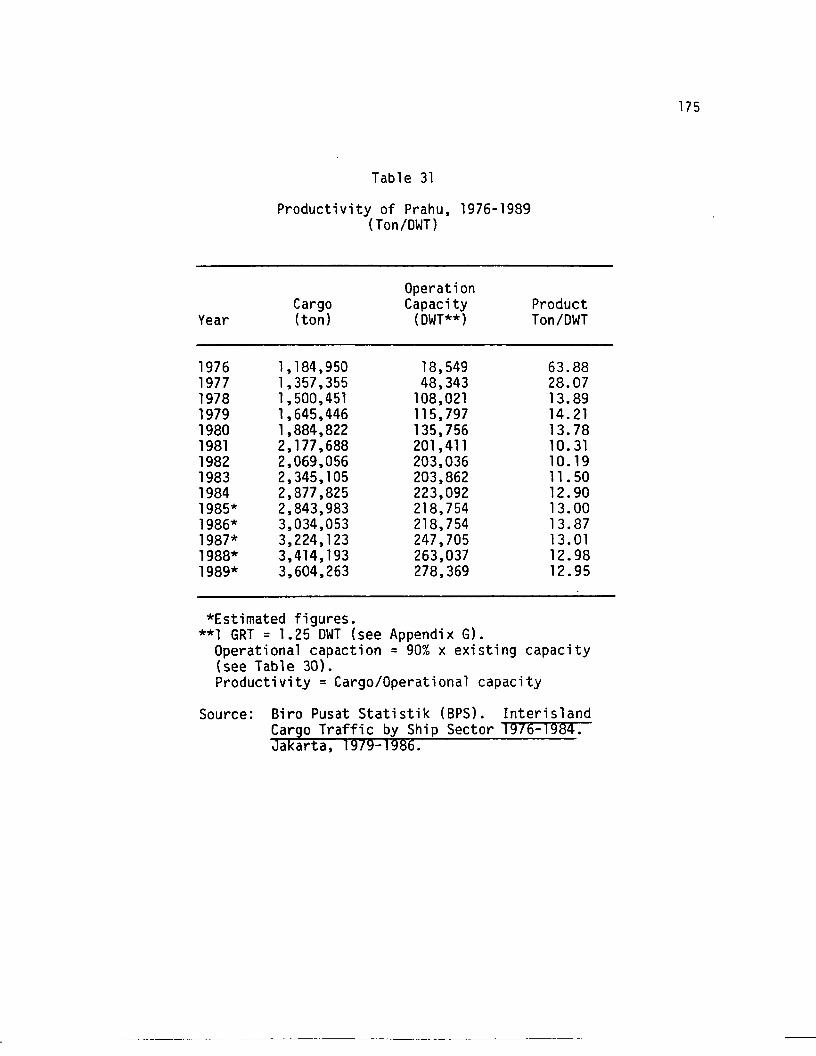
Table 31
Productivity of Prahu, 1976-1989(Ton/OWT)
OperationCargo Capacity Product
Year (ton) (OWT**) Ton/OWT
1976 1, 184,950 18,549 63.881977 1,357,355 48,343 28.071978 1,500,451 108,021 13.891979 1,645,446 115,797 14.211980 1,884,822 135,756 13.781981 2,177 ,688 201,411 10.311982 2,069,056 203,036 10. 191983 2,345,105 203,862 11.501984 2,877,825 223,092 12.901985* 2,843,983 218,754 13.001986* 3,034,053 218,754 13.871987* 3,224,123 247,705 13.011988* 3,414,193 263,037 12.981989* 3,604,263 278,369 12.95
*Estimated figures.**1 GRT = 1.25 OWT (see Appendix G).
Operational capaction = 90% x existing capacity(see Table 30).Productivity = Cargo/Operational capacity
Source: Biro Pusat Statistik (BPS). InterislandCargo Traffic by Ship Sector 1976-1984.Jakarta, 1979-1986.
--- - --- - ---------------
175
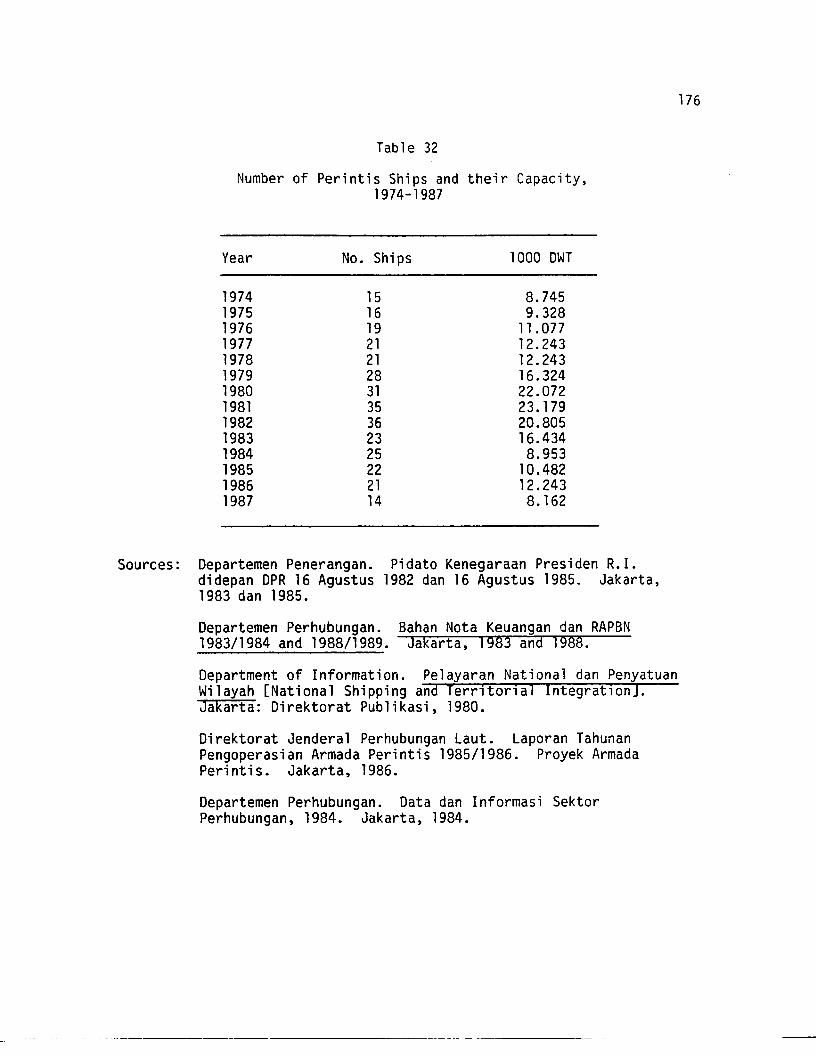
Table 32
Number of Perintis Ships and their Capacity,1974-1987
Year No. Ships 1000 DWT
1974 15 8.7451975 16 9.3281976 19 11.0771977 21 12.2431978 21 12.2431979 28 16.3241980 31 22.0721981 35 23.1791982 36 20.8051983 23 16.4341984 25 8.9531985 22 10.4821986 21 12.2431987 14 8.162
Sources: Departemen Penerangan. Pidato Kenegaraan Presiden R.I.didepan DPR 16 Agustus 1982 dan 16 Agustus 1985. Jakarta,1983 dan 1985.
Departemen Perhubungan. Bahan Nota Keuangan dan RAPBN1983/1984 and 1988/1989. Jakarta, 1983 and 1988.
176
Department of Information. Pelayaran National dan PenyatuanWilayah [National Shipping and Territorial Integration].Jakarta: Direktorat Publikasi, 1980.
Direktorat Jenderal Perhubungan Laut. Laporan TahunanPengoperasian Armada Perintis 1985/1986. Proyek ArmadaPerintis. Jakarta, 1986.
Departemen Perhubungan. Data dan Informasi SektorPerhubungan, 1984. Jakarta, 1984.
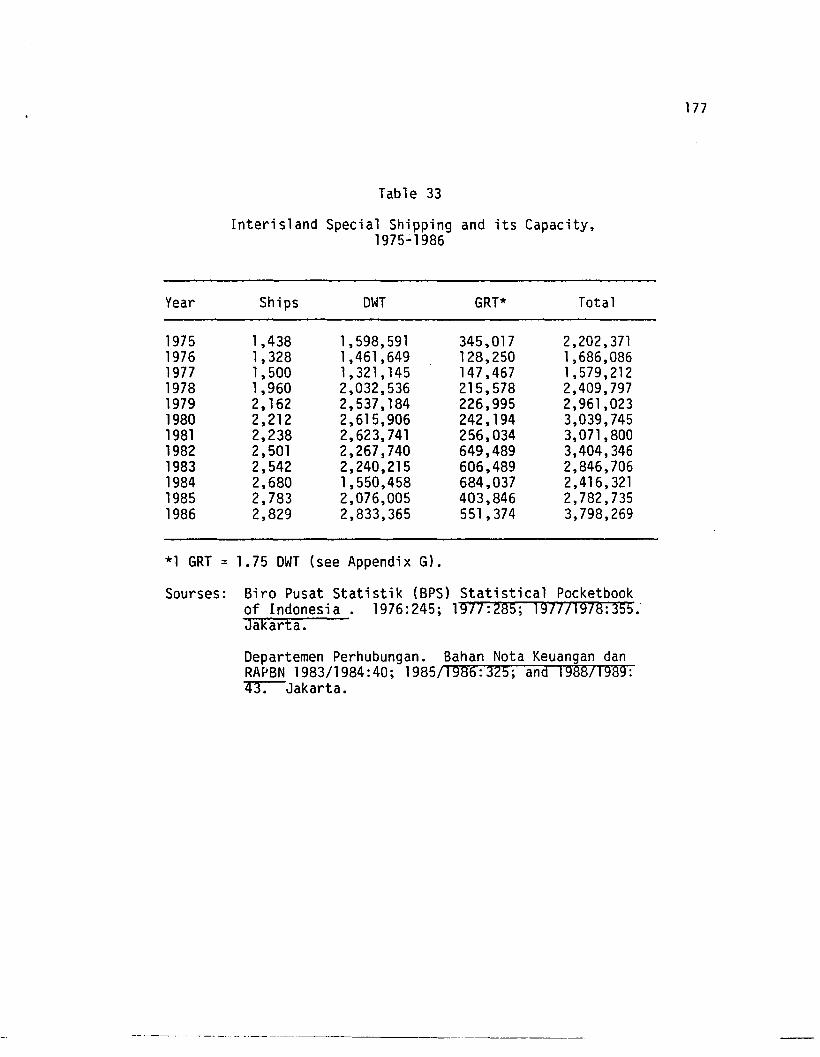
Table 33
Interisland Special Shipping and its Capacity,1975-1986
Year Ships DWT GRT* Total
1975 1,438 1,598,591 345,017 2,202,3711976 1,328 1,461,649 128,250 1,686,0861977 1,500 1,321,145 147,467 1,579,2121978 1,960 2,032,536 215,578 2,409,7971979 2,162 2,537,184 226,995 2,961,0231980 2,212 2,615,906 242,194 3,039,7451981 2,238 2,623,741 256,034 3,071,8001982 2,501 2,267,740 649,489 3,404,3461983 2,542 2,240,215 606,489 2,846,7061984 2,680 1,550,458 684,037 2,416,3211985 2,783 2,076,005 403,846 2,782,7351986 2,829 2,833,365 551,374 3,798,269
*1 GRT = 1.75 DWT (see Appendix G).
Sourses: Biro Pusat Statistik (BPS) Statistical Pocketbookof Indonesia. 1976:245; 1977:285; 197771978:355:Jakarta.
Departemen Perhubungan. Bahan Nota Keuangan danRAPBN 1983/1984:40; 1985/1986:325; and 198871989:43. Jakarta.
--_._- -------- - _._------- ---------
177
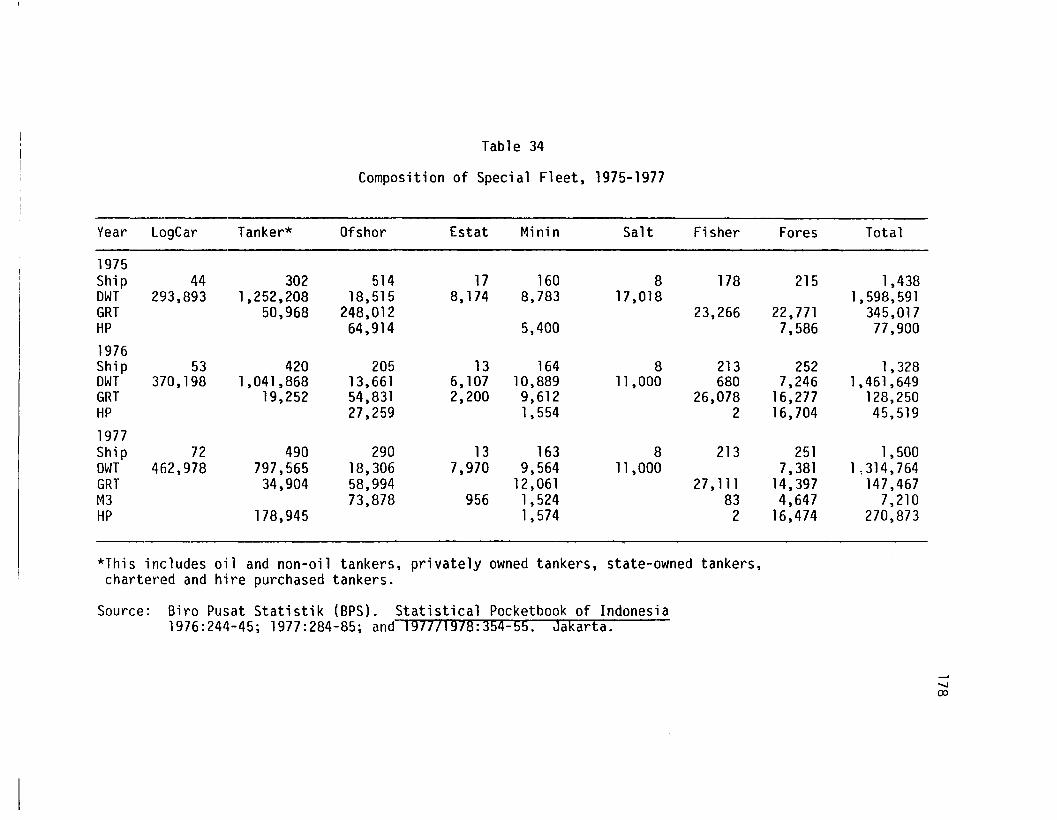
Table 34
Composition of Special Fleet, 1975-1977
Year LogCar Tanker* Ofshor Estat Minin Salt Fisher Fores Total
1975Ship 44 302 514 17 160 8 178 215 1,438OWT 293,893 1,252,208 18,515 8,174 8,783 17,018 1,598,591GRT 50,968 248,012 23,266 22,771 345,017HP 64,914 5,400 7,586 77,9001976Ship 53 420 205 13 164 8 213 252 1,328OWT 370,198 1,041,868 13,661 6,107 10,889 11,000 680 7,246 1,461,649GRT 19,252 54,831 2,200 9,612 26,078 16,277 128,250HP 27,259 1,554 2 16,704 45,5191977Ship 72 490 290 13 163 8 213 251 1,500DWT 462,978 797,565 18,306 7,970 9,564 11,000 7,381 1,314,764GRT 34,904 58,994 12,061 27, 111 14,397 147,467M3 73,878 956 1,524 83 4,647 7,210HP 178,945 1,574 2 16,474 270,873
*This includes oil and non-oil tankers, privately owned tankers, state-owned tankers,chartered and hire purchased tankers.
Source: Biro Pusat Statistik (BPS). Statistical Pocketbook of Indonesia1976:244-45; 1977:284-85; and 197771978:354-55. Jakarta.
"00
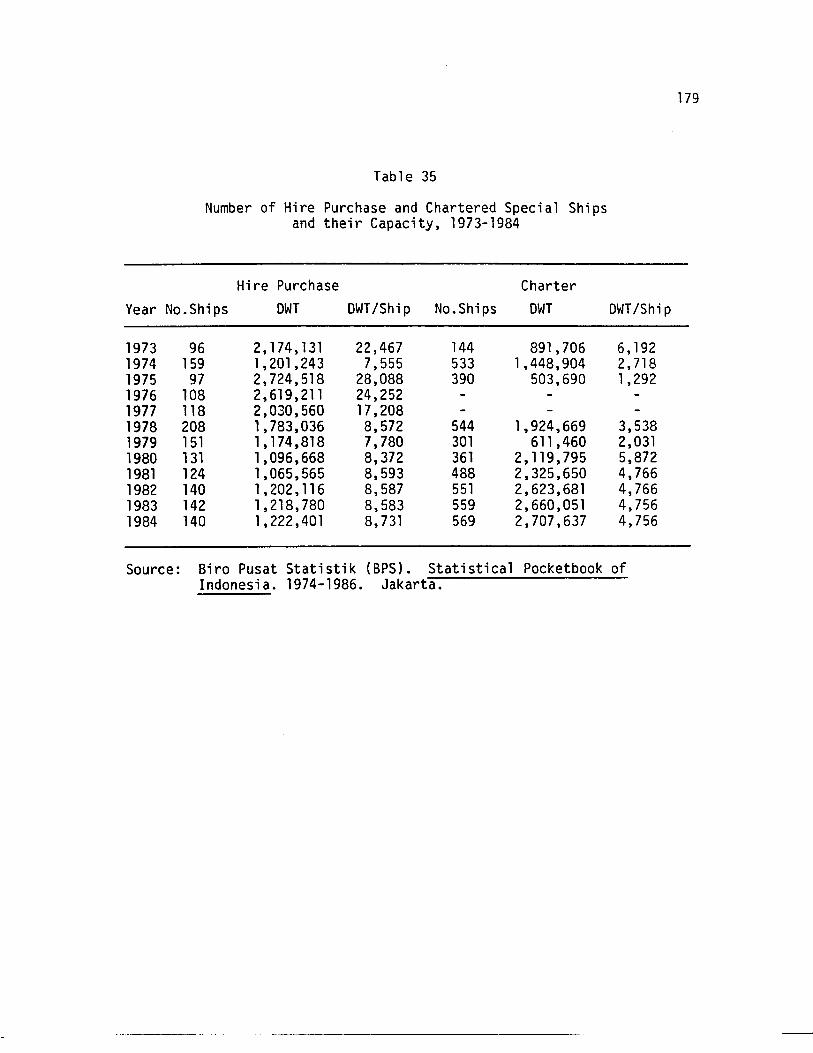
Table 35
Number of Hire Purchase and Chartered Special Shipsand their Capacity, 1973-1984
Hire Purchase CharterYear No.Ships DWT DWT/Ship No.Ships DWT DWT/Ship
1973 96 2,174,131 22,467 144 891,706 6,1921974 159 1,201,243 7,555 533 1,448,904 2,7181975 97 2,724,518 28,088 390 503,690 1,2921976 108 2,619,211 24,2521977 118 2,030,560 17,2081978 208 1,783,036 8,572 544 1,924,669 3,5381979 151 1,174,818 7,780 301 611,460 2,0311980 131 1,096,668 8,372 361 2,119,795 5,8721981 124 1,065,565 8,593 488 2,325,650 4,7661982 140 1,202, 116 8,587 551 2,623,681 4,7661983 142 1,218,780 8,583 559 2,660,051 4,7561984 140 1,222,401 8,731 569 2,707,637 4,756
Source: Biro Pusat Statistik (BPS). Statistical Pocketbook ofIndonesia. 1974-1986. Jakarta.
179
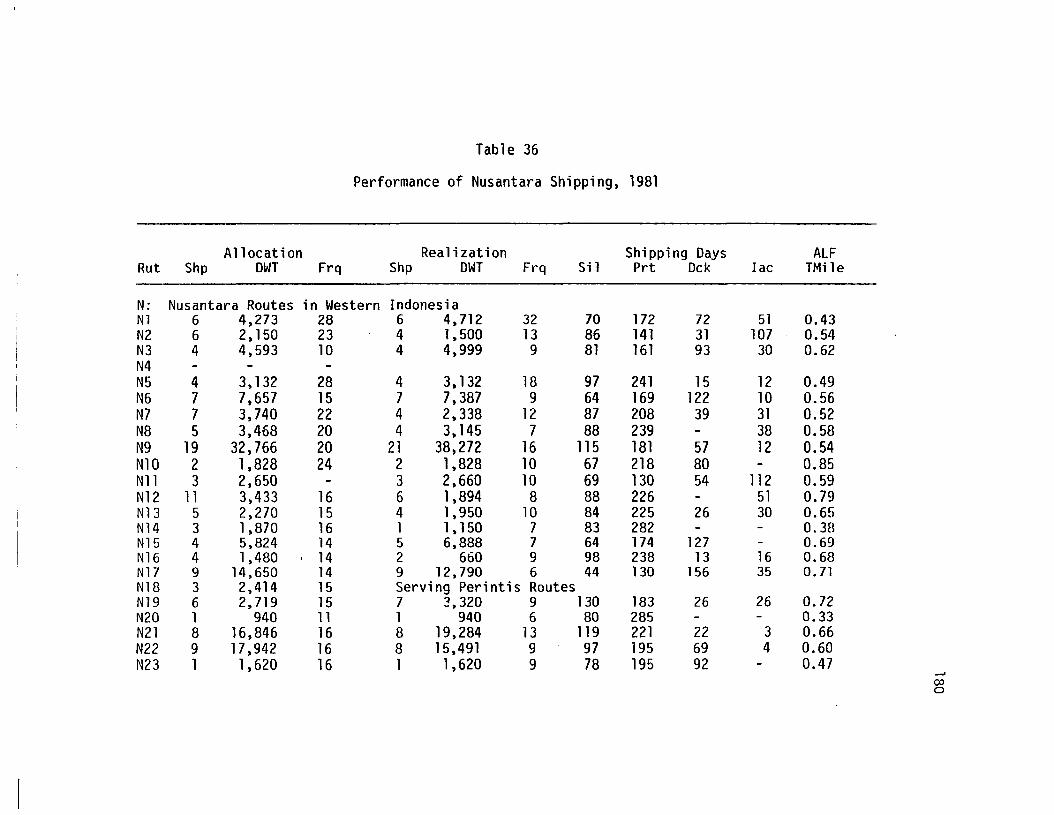
Table 36
Performance of Nusantara Shipping, 1981
Allocation Realization Shipping Days ALFRut Shp DWT Frq Shp DWT Frq Sil Prt Dck lac TMi1e
N: Nusantara Routes in Western IndonesiaN1 6 4,273 28 6 4,712 32 70 172 72 51 0.43N2 6 2,150 23 4 1.500 13 86 141 31 107 0.54N3 4 4,593 10 4 4.999 9 81 161 93 30 0.62N4N5 4 3.132 28 4 3.132 18 97 241 15 12 0.49N6 7 7,657 15 7 7,387 9 64 169 122 10 0.56N7 7 3,740 22 4 2,338 12 87 208 39 31 0.52N8 5 3,468 20 4 3,145 7 88 239 - 38 0.58N9 19 32,766 20 21 38,272 16 115 181 57 12 0.54N10 2 1,828 24 2 1,828 10 67 218 80 - 0.85N11 3 2,650 - 3 2,660 10 69 130 54 112 0.59N12 11 3,433 16 6 1,894 8 88 226 - 51 0.79N13 5 2,270 15 4 1.950 10 84 225 26 30 0.65N14 3 1,870 16 1 1.150 7 83 282 - - 0.38N15 4 5,824 14 5 6.888 7 64 174 127 - 0.69N16 4 1,480 , 14 2 660 9 98 238 13 16 0.68N17 9 14.650 14 9 12.790 6 44 130 156 35 0.71N18 3 2,414 15 Serving Perintis RoutesN19 6 2.719 15 7 3.320 9 130 183 26 26 0.72N20 1 940 11 1 940 6 80 285 - - 0.33N21 8 16,846 16 8 19.284 13 119 221 22 3 0.66N22 9 17,942 16 8 15,491 9 97 195 69 4 0.60N23 1 1,620 16 1 1,620 9 78 195 92 - 0.47 .....
co0
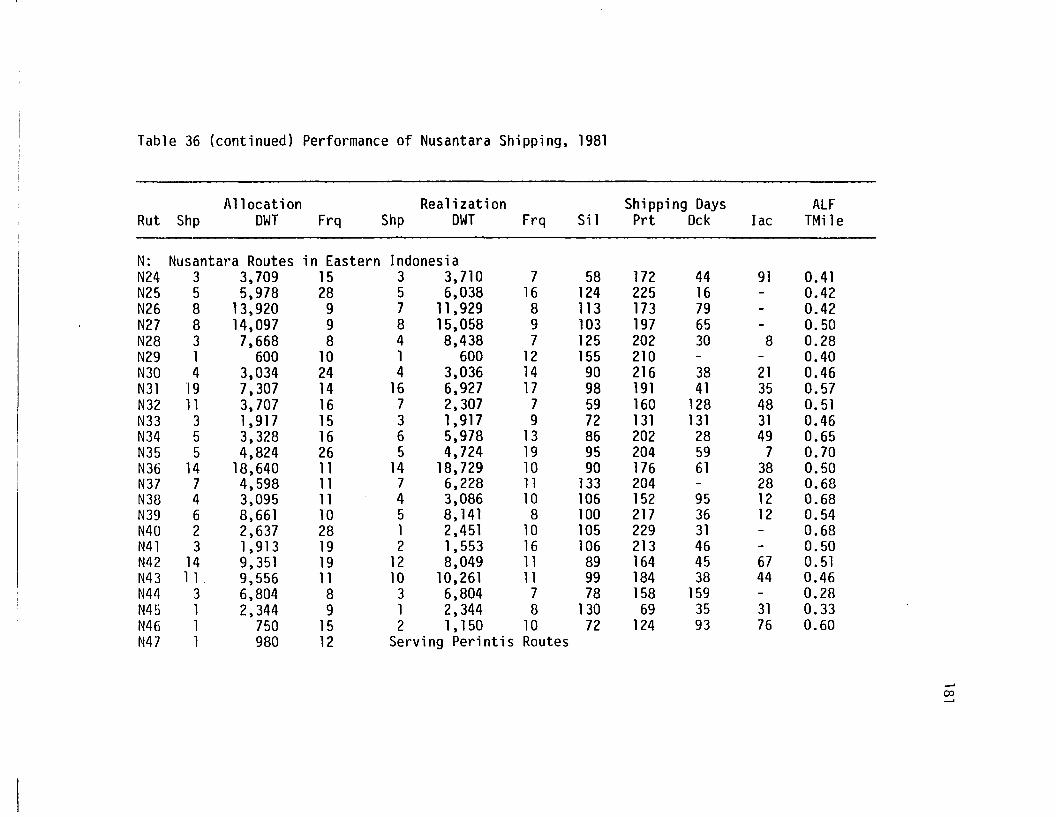
Table 36 (continued) Performance of Nusantara Shipping, 1981
Allocation Realization Shipping Oays ALFRut Shp OWl Frq Shp OWT Frq Si1 Prt Ock lac TMi1e
N: Nusantara Routes in Eastern IndonesiaN24 3 3,709 15 3 3,710 7 58 172 44 91 0.41N25 5 5,978 28 5 6,038 16 124 225 16 - 0.42N26 8 13,920 9 7 11 ,929 8 113 173 79 - 0.42N27 8 14,097 9 8 15,058 9 103 197 65 - 0.50N28 3 7,668 8 4 8,438 7 125 202 30 8 0.28N29 1 600 10 1 600 12 155 210 - - 0.40N30 4 3,034 24 4 3,036 14 90 216 38 21 0.46N31 ·19 7,307 14 16 6,927 17 98 191 41 35 0.57N32 11 3,707 16 7 2,307 7 59 160 128 48 0.51N33 3 1,917 15 3 1,917 9 72 131 131 31 0.46N34 5 3,328 16 6 5,978 13 86 202 28 49 0.65N35 5 4,824 26 5 4,724 19 95 204 59 7 0.70N36 14 18,640 11 14 18,729 10 90 176 61 38 0.50N37 7 4,598 11 7 6,228 11 133 204 - 28 0.68N38 4 3,095 11 4 3,086 10 106 152 95 12 0.68N39 6 8,661 10 5 8, 141 8 100 217 36 12 0.54N40 2 2,637 28 1 2,451 10 105 229 31 - 0.68N41 3 1,913 19 2 1,553 16 106 213 46 - 0.50N42 14 9,351 19 12 8,049 11 89 164 45 67 0.51N43 11 9,556 11 10 10,261 11 99 184 38 44 0.46N44 3 6,804 8 3 6,804 7 78 158 159 - 0.28N45 1 2,344 9 1 2,344 8 130 69 35 31 0.33N46 1 750 15 2 1, 150 10 72 124 93 76 0.60N47 1 980 12 Serving Perintis Routes
-'OJ-'
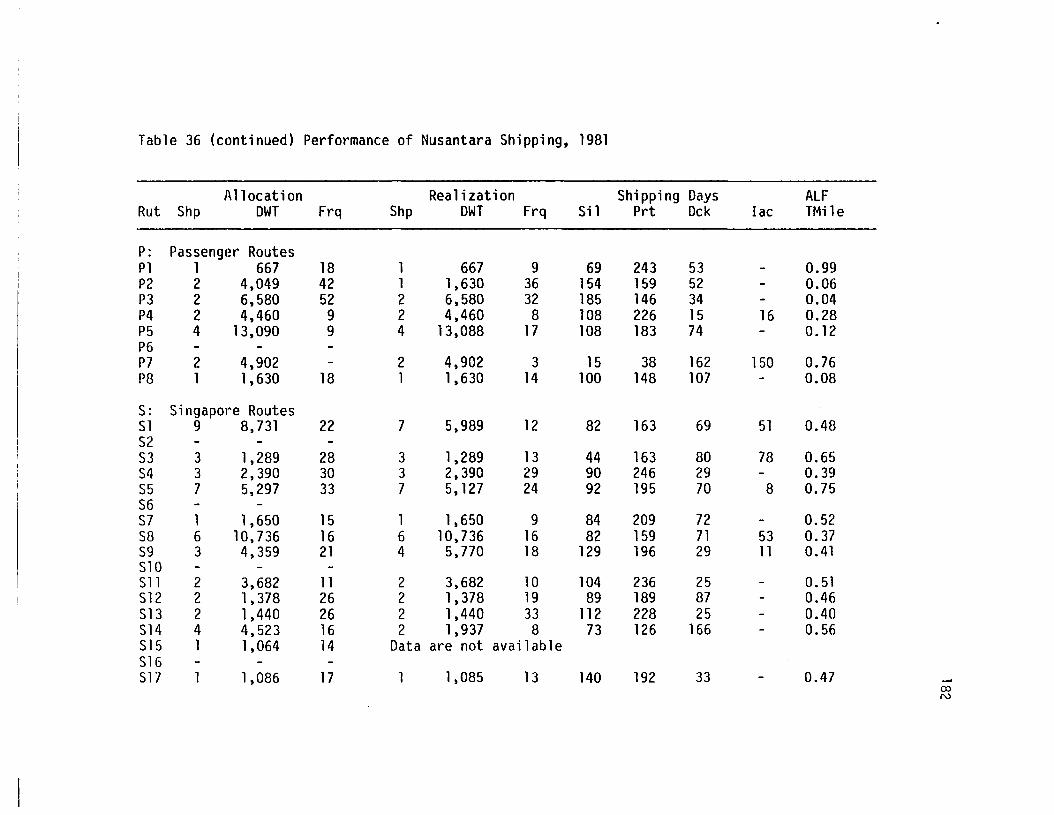
Table 36 (continued) Performance of Nusantara Shipping, 1981
Allocation Realization Shipping Days ALFRut Shp DWT Frq Shp DWT Frq Sil Prt Dck lac TMile
P: Passenger RoutesP1 1 667 18 1 667 9 69 243 53 - 0.99P2 2 4,04·9 42 1 1,630 36 154 159 52 - 0.06P3 2 6,580 52 2 6,580 32 185 146 34 - 0.04P4 2 4,460 9 2 4,460 8 108 226 15 16 0.28P5 4 13,090 9 4 13,088 17 108 183 74 - 0.12P6P7 2 4,902 - 2 4,902 3 15 38 162 150 0.76P8 1 1,630 18 1 1,630 14 100 148 107 - 0.08
S: Singapore RoutesSl 9 8,731 22 7 5,989 12 82 163 69 51 0.48S2S3 3 1,289 28 3 1,289 13 44 163 80 78 0.6554 3 2,390 30 3 2,390 29 90 246 29 - 0.3955 7 5,297 33 7 5,127 24 92 195 70 8 0.755657 1 1,650 15 1 1,650 9 84 209 72 - 0.5258 6 10,736 16 6 10,736 16 82 159 71 53 0.3759 3 4,359 21 4 5,770 18 129 196 29 11 0.41510511 2 3,682 11 2 3,682 10 104 236 25 - 0.51512 2 1,378 26 2 1,378 19 89 189 87 - 0.46513 2 1,440 26 2 1,440 33 112 228 25 - 0.40514 4 4,523 16 2 1,937 8 73 126 166 - 0.56515 1 1,064 14 Data are not available516517 1 1,086 17 1 1,085 13 140 192 33 - 0.47
OJN
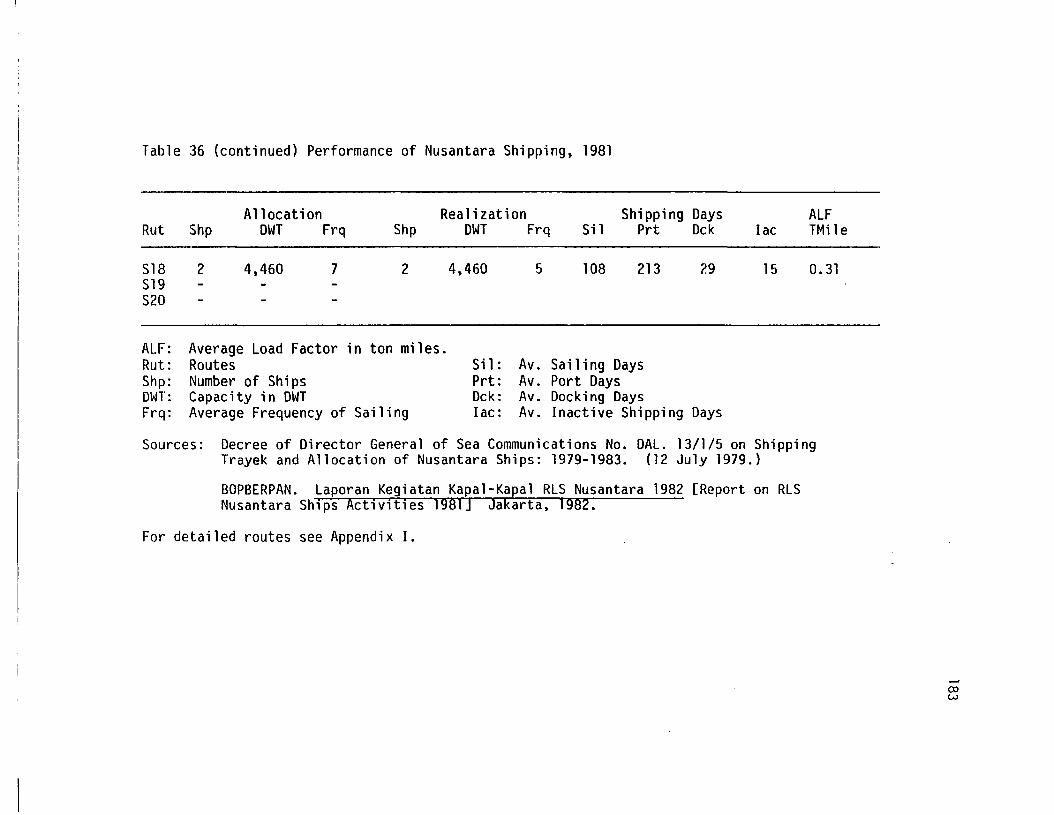
Table 36 (continued) Performance of Nusantara Shipping, 1981
All ocati on Realization Shipping Days ALFRut Shp DWT Frq Shp DWT Frq Si1 Prt Dck lac TMile
518 2 4,460 7 2 4,460 5 108 213 29 15 0.31519S20
ALF: Average Load Factor in ton miles.Rut: Routes Sil: Av. Sailing DaysShp: Number of Ships Prt: Av. Port DaysDWT: Capacity in OWl Dck: Av. Docking DaysFrq: Average Frequency of Sailing lac: Av. Inactive Shipping Days
Sources: Decree of Director General of Sea Communications No. DAL. 13/1/5 on ShippingTrayek and Allocation of Nusantara Ships: 1979-1983. (12 July 1979.)
BOPBERPAN. Laporan Kegiatan Kapal-Kapal RLS Nusantara 1982 [Report on RLSNusantara Ships Activities 1981] Jakarta. 1982.
For detailed routes see Appendix I.
cow
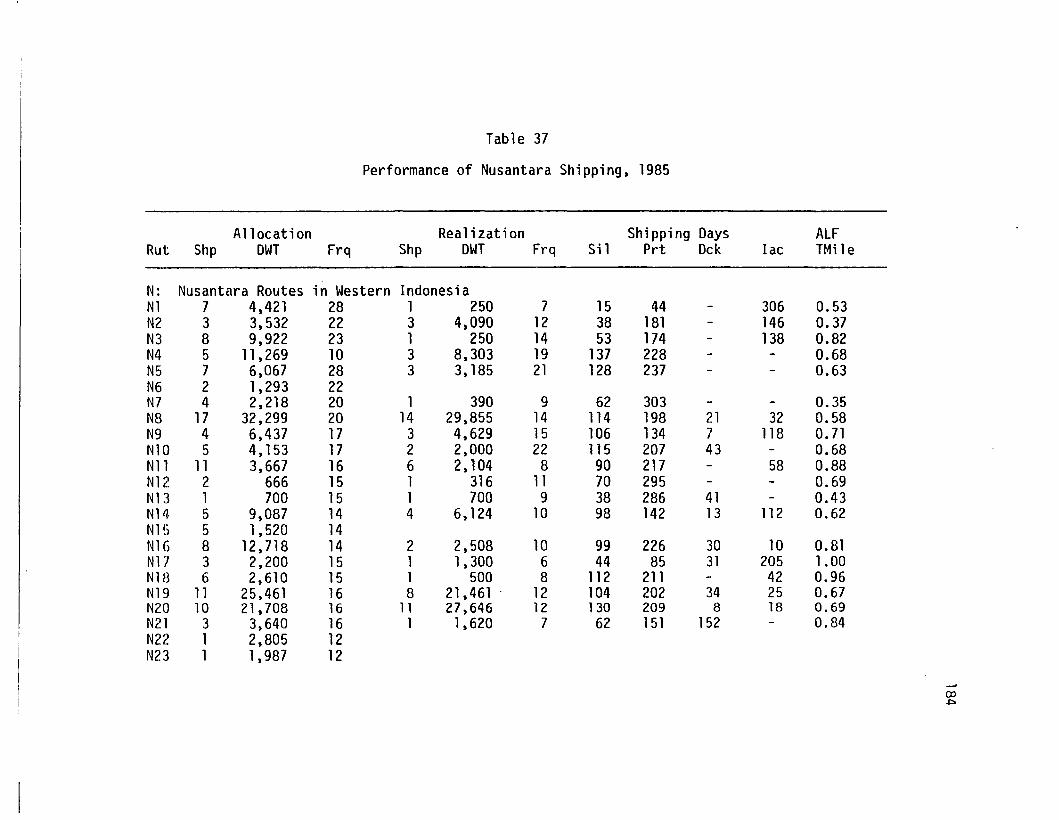
Table 37
Performance of Nusantara Shipping, 1985
All ocati on Realization Shipping Days ALFRut Shp DWT Frq Shp DWT Frq Sil Prt Dck lac TMi1e
N: Nusantara Routes in Western IndonesiaN1 7 4,421 28 1 250 7 15 44 - 306 0.53N2 3 3,532 22 3 4,090 12 38 181 - 146 0.37N3 8 9,922 23 1 250 14 53 174 - 138 0.82N4 5 11,269 10 3 8,303 19 137 228 - - 0.68N5 7 6,067 28 3 3,185 21 128 237 - - 0.63N6 2 1,293 22N7 4 2,218 20 1 390 9 62 303 - - 0.35N8 17 32,299 20 14 29,855 14 114 198 21 32 0.58N9 4 6,437 17 3 4,629 15 106 134 7 118 0.71N10 5 4,153 17 2 2,000 22 115 207 43 - 0.68Nll 11 3,667 16 6 2,104 8 90 217 - 58 0.88N12 2 666 15 1 316 11 70 295 - - 0.69N13 1 700 15 1 700 9 38 286 41 - 0.43N14 5 9,087 14 4 6,124 10 98 142 13 112 0.62N15 5 1,520 14N16 8 12,718 14 2 2,508 10 99 226 30 10 0.81N17 3 2,200 15 1 1,300 6 44 85 31 205 1.00N18 6 2,610 15 1 500 8 112 211 - 42 0.96N19 11 25,461 16 8 21,461 . 12 104 202 34 25 0.67N20 10 21,708 16 11 27,646 12 130 209 8 18 0.69N21 3 3,640 16 1 1,620 7 62 151 152 - 0.84N22 1 2,805 12N23 1 1,987 12
~
co~
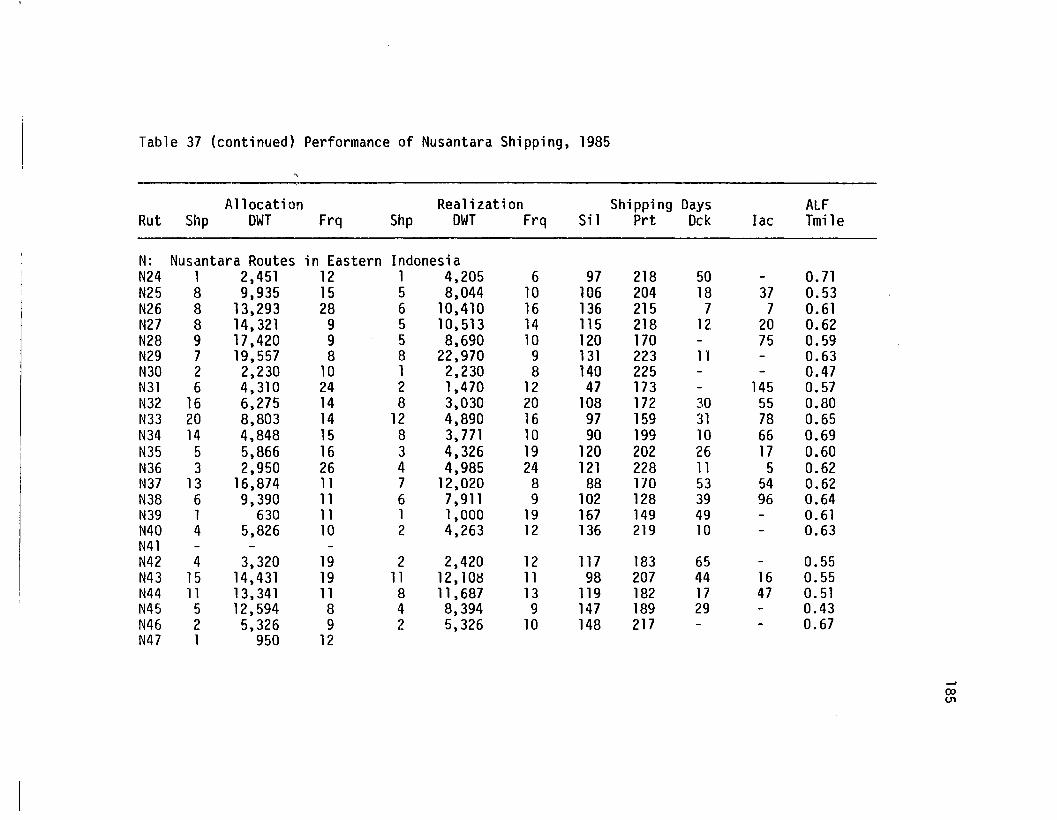
Table 37 (continued) Performance of Nusantara Shipping, 1985
Allocation Realization Shipping Days ALFRut Shp OWl Frq Shp OWl Frq Sil Prt Ock lac lmi1e
N: Nusantara Routes in Eastern IndonesiaN24 1 2,451 12 1 4,205 6 97 218 50 - 0.71N25 8 9,935 15 5 8,044 10 106 204 18 37 0.53N26 8 13,293 28 6 10,410 16 136 215 7 7 0.61N27 8 14,321 9 5 10,513 14 115 218 12 20 0.62N28 9 17,420 9 5 8,690 10 120 170 - 75 0.59N29 7 19,557 8 8 22,970 9 131 223 11 - 0.63N30 2 2,230 10 1 2,230 8 140 225 - - 0.47N31 6 4,310 24 2 1,470 12 47 173 - 145 0.57N32 16 6,275 14 8 3,030 20 108 172 30 55 0.80N33 20 8,803 14 12 4,890 16 97 159 31 78 0.65N34 14 4,848 15 8 3,771 10 90 199 10 66 0.69N35 5 5,866 16 3 4,326 19 120 202 26 17 0.60N36 3 2,950 26 4 4,985 24 121 228 11 5 0.62N37 13 16,874 11 7 12,020 8 88 170 53 54 0.62N38 6 9,390 11 6 7,911 9 102 128 39 96 0.64N39 1 630 11 1 1,000 19 167 149 49 - 0.61N40 4 5,826 10 2 4,263 12 136 219 10 - 0.63N41N42 4 3,320 19 2 2,420 12 117 183 65 - 0.55N43 15 14,431 19 11 12, 10t3 11 98 207 44 16 0.55N44 11 13,341 11 8 11 ,687 13 119 182 17 47 0.51N45 5 12,594 8 4 8,394 9 147 189 29 - 0.43N46 2 5,326 9 2 5,326 10 148 217 - - 0.67N47 1 950 12
ex>U1
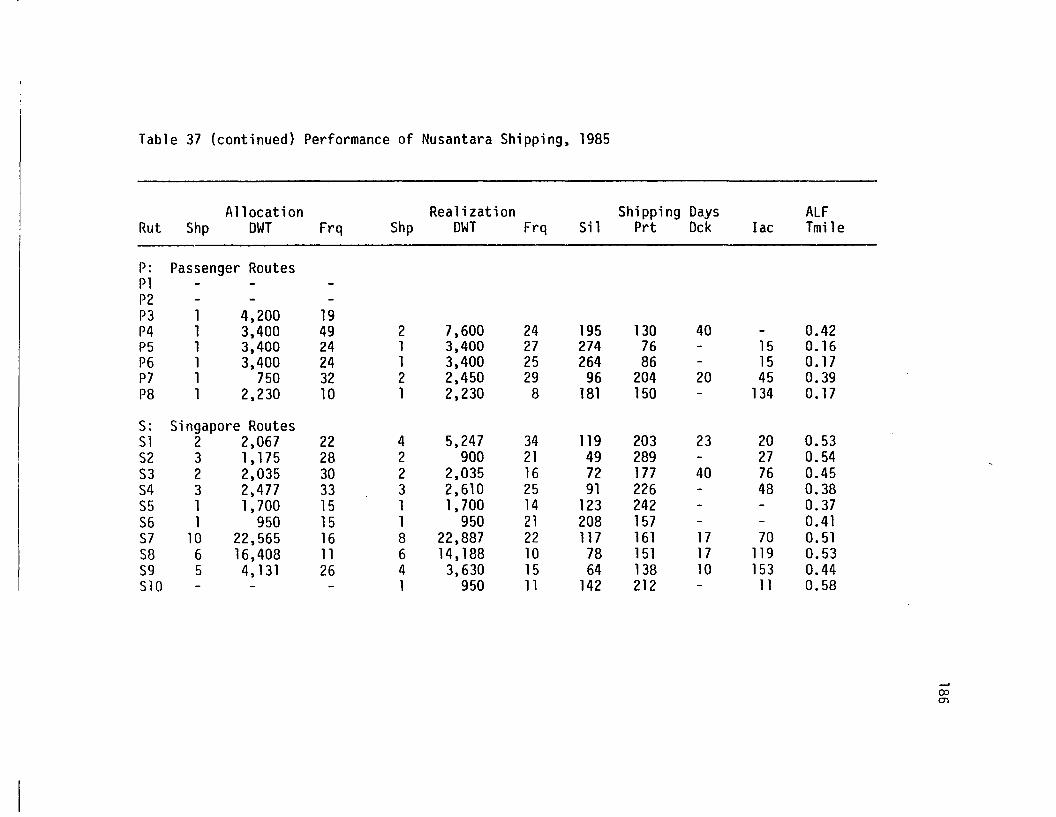
Table 37 (continued) Performance of Nusantara Shipping, 1985
Allocation Realization Shipping Days ALFRut Shp DWT Frq 5hp DWT Frq Sil Prt Dck lac Tmile
P: Passenger RoutesPlP2P3 1 4,200 19P4 1 3,400 49 2 7,600 24 195 130 40 - 0.42P5 1 3,400 24 1 3,400 27 274 76 - 15 0.16P6 1 3,400 24 1 3,400 25 264 86 - 15 0.17P7 1 750 32 2 2,450 29 96 204 20 45 0.39P8 1 2,230 10 1 2,230 8 181 150 - 134 0.17
5: Singapore Routes51 2 2,067 22 4 5,247 34 119 203 23 20 0.5352 3 1,175 28 2 900 21 49 289 - 27 0.5453 2 2,035 30 2 2,035 16 72 177 40 76 0.4554 3 2,477 33 3 2,610 25 91 226 - 48 0.38S5 1 1,700 15 1 1,700 14 123 242 - - 0.3756 1 950 15 1 950 21 208 157 - - 0.4157 10 22,565 16 8 22,887 22 117 161 17 70 0.5158 6 16,408 11 6 14, 188 10 78 151 17 119 0.5359 5 4,131 26 4 3,630 15 64 138 10 153 0.44510 - - - 1 950 11 142 212 - 11 0.58
coen
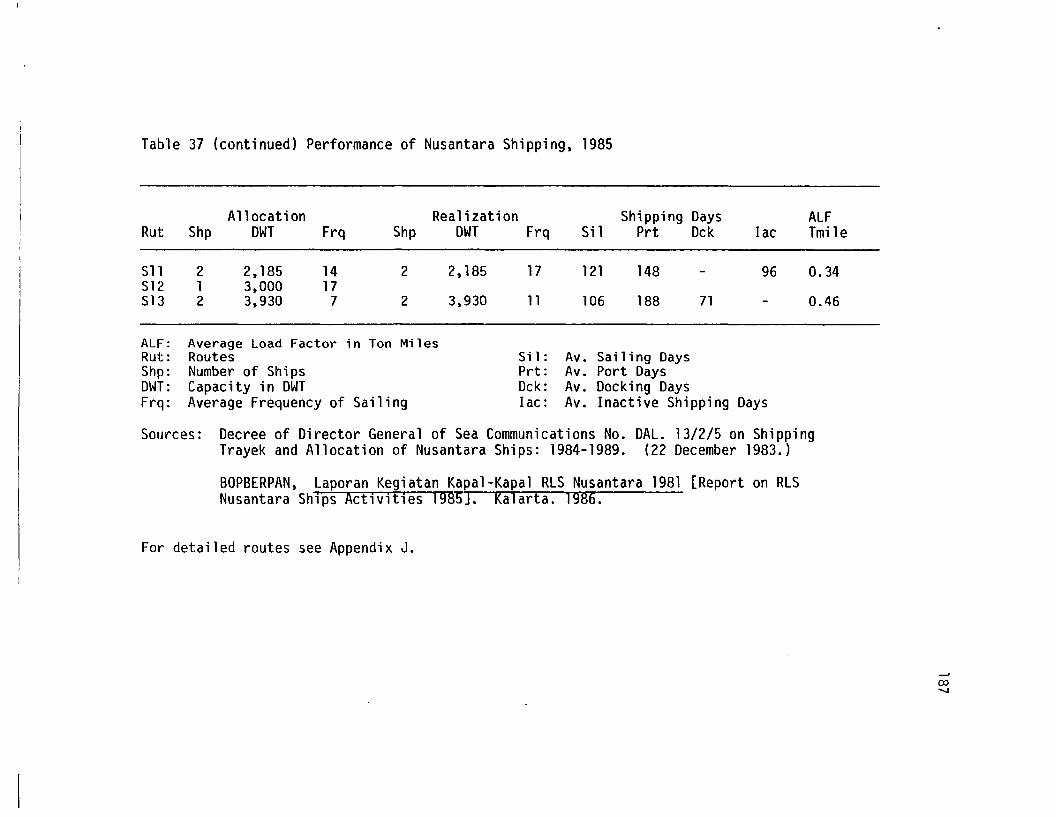
Table 37 (continued) Performance of Nusantara Shipping, 1985
Allocation Realization Shipping Days ALFRut Shp DWT Frq Shp DWT Frq Sil Prt Dck lac Tmi1e
Sl1 2 2,185 14 2 2,185 17 121 148 - 96 0.34S12 1 3.000 17S13 2 3.930 7 2 3.930 11 106 188 71 - 0.46
ALF: Average Load Factor in Ton MilesRut: Routes Sil : Av. Sailing DaysShp: Number of Ships Prt: Av. Port DaysOWl: Capacity in OWl Dck: Av. Docking DaysFrq: Average Frequency of Sailing lac: Av. Inactive Shipping Days
Sources: Decree of Director General of Sea Communications No. DAL. 13/2/5 on ShippingTrayek and Allocation of Nusantara Ships: 1984-1989. (22 December 1983.)
BOPBERPAN, Laporan Kegiatan Kapa1-Kapa1 RLS Nusantara 1981 [Report on RLSNusantara Ships Activities 1985J. Ka1arta. 1986.
For detailed routes see Appendix J.
co-....J
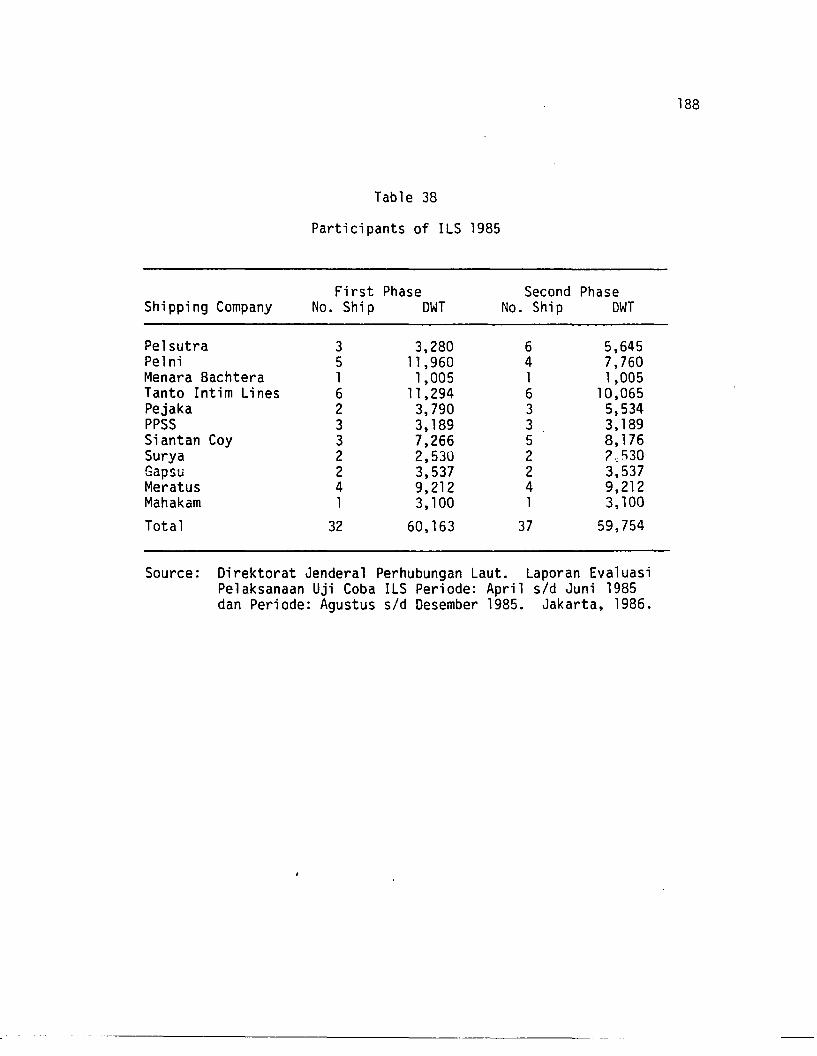
Table 38
Participants of ILS 1985
First Phase Second PhaseShipping Company No. Ship DWT No. Ship DWT
Pelsutra 3 3,280 6 5,645Pelni 5 11 ,960 4 7,760Menara Bachtera 1 1,005 1 1,005Tanto Intim Lines 6 11,294 6 10,065Pejaka 2 3,790 3 5,534PPSS 3 3,189 3 3,189Siantan Coy 3 7,266 5 8,176Surya 2 2,530 2 :',530Gapsli 2 3,537 2 3,537Meratus 4 9,212 4 9,212Mahakam 1 3,100 1 3,100
Total 32 60,163 37 59,754
Source: Direktorat Jenderal Perhubungan Laut. Laporan EvaluasiPelaksanaan Uji Coba ILS Peri ode: April sid Juni 1985dan Peri ode: Agustus sid Desember 1985. Jakarta, 1986.
188
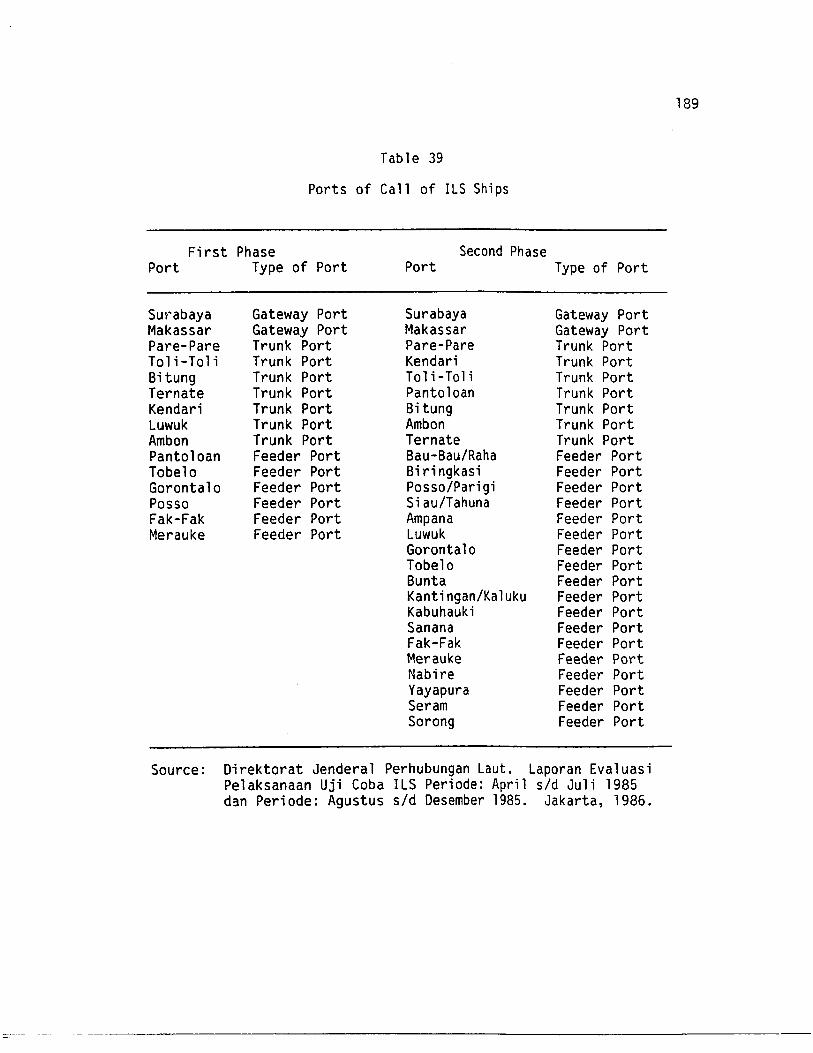
Table 39
Ports of Call of ILS Ships
First Phase Second PhasePort Type of Port Port Type of Port
Sur-abaya Gateway Port Surabaya Gateway PortMakassar Gateway Port Makassar Gateway PortPare-Pare Trunk Port Pare-Pare Trunk PortTali-Tali Trunk Port Kendari Trunk PortBitung Trunk Port Toli-Toli Trunk PortTernate Trunk Port Pantoloan Trunk PortKendari Trunk Port Bitung Trunk PortLuwuk Trunk Port Ambon Trunk PortAmbon Trunk Port Ternate Trunk PortPantoloan Feeder Port Bau-Bau/Raha Feeder PortTobe10 Feeder Port Bi ri ngkasi Feeder PortGoronta10 Feeder Port Passo/Pari gi Feeder PortPosso Feeder Port Si au/Tahuna Feeder PortFak-Fak Feeder Port Ampana Feeder PortMerauke Feeder Port Luwuk Feeder Port
Gorontalo Feeder PortTobelo Feeder PortBunta Feeder PortKantingan/Kaluku Feeder PortKabuhauki Feeder PortSanana Feeder PortFak-Fak Feeder PortMerauke Feeder PortNabire Feeder PortYayapura Feeder PortSeram Feeder PortSarong Feeder Port
Source: Direktorat Jendera1 Perhubungan Laut. Laporan Eva1uasiPe1aksanaan Uji Coba ILS Periode: April sid Ju1i 1985dan Peri ode: Agustus sid Desember 1985. Jakarta, 1986.
189
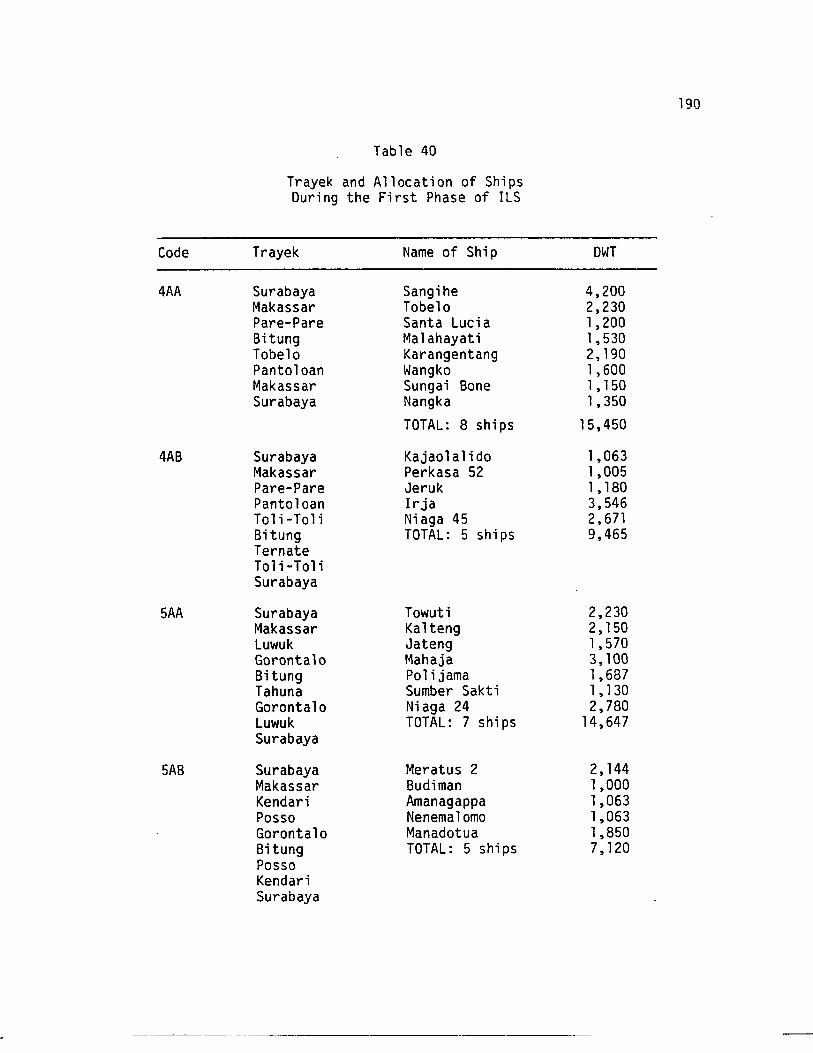
190
Table 40
Trayek and Allocation of ShipsDuring the First Phase of ILS
Code Trayek Name of Ship DWT
4AA Surabaya Sangihe 4,200Makassar Tobel0 2,230Pare-Pare Santa Lucia 1,200Bitung Malahayati 1,530Tobel0 Karangentang 2, 190Pantoloan Wangko 1,600Makassar Sungai Bone 1, 150Surabaya Nangka 1,350
TOTAL: 8 ships 15,450
4AB Surabaya Kajaolalido 1,063Makassar Perkasa 52 1,005Pare-Pare Jeruk 1, 180Pantoloan Irja 3,546Toli-Toli Niaga 45 2,671Bitung TOTAL: 5 ships 9,465TernateToli-ToliSurabaya
5AA Surabaya Towuti 2,230Makassar Kalteng 2,150Luwuk Jateng 1,570Gorontal0 Mahaja 3,100Bitung Polijama 1,687Tahuna Sumber Sakti 1, 130Gorontal0 Niaga 24 2,780Luwuk TOTAL: 7 ships 14,647Surabaya
5AB Surabaya Meratus 2 2,144Makassar Budiman 1,000Kendari Amanagappa 1,063Posso Nenemalomo 1,063Gorontal0 Manadotua 1,850Bitung TOTAL: 5 ships 7,120PossoKendariSurabaya
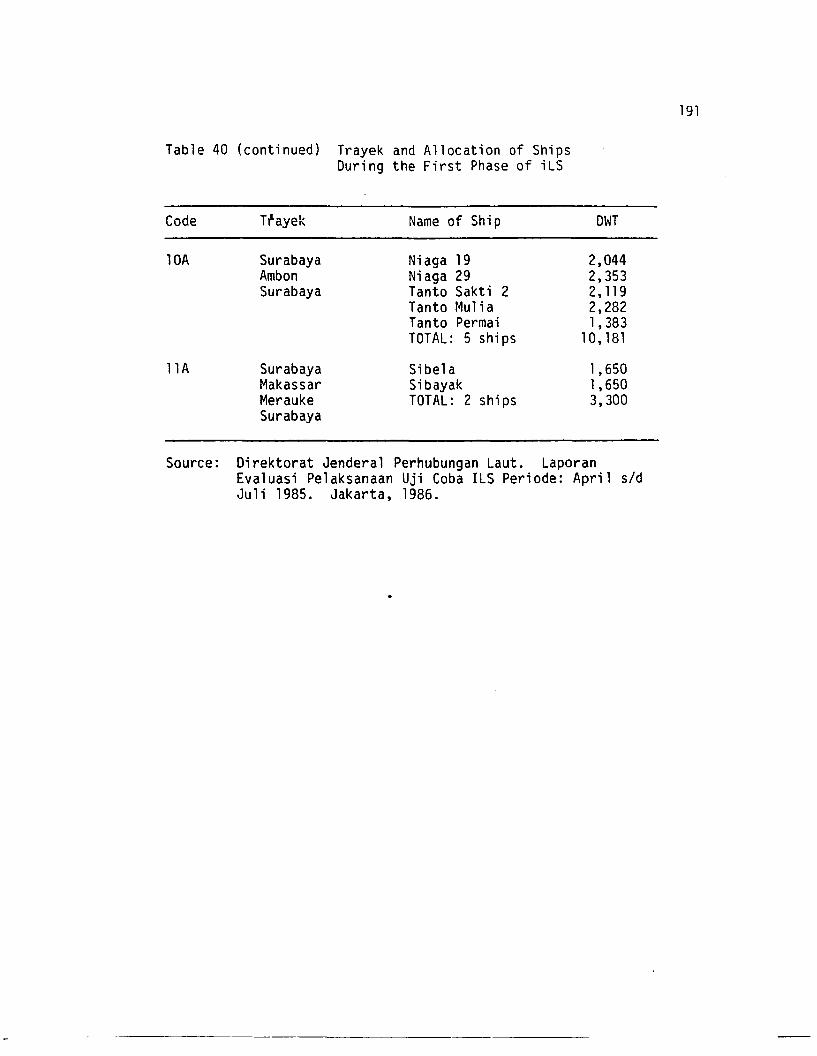
Table 40 (continued) Trayek and Allocation of ShipsDuring the First Phase of iLS
191
Code
lOA
llA
Tf'ayek
SurabayaAmbonSurabaya
SurabayaMakassarMeraukeSurabaya
Name of Ship
Niaga 19Niaga 29Tanto Sakti 2Tanto MuliaTanto PermaiTOTAL: 5 ships
SibelaSibayakTOTAL: 2 ships
DWT
2,0442,3532, 1192,2821,383
10,181
1,6501,6503,300
Source: Direktorat Jenderal Perhubungan Laut. LaporanEvaluasi Pelaksanaan Uji Coba ILS Periode: April sidJuli 1985. Jakarta, 1986.
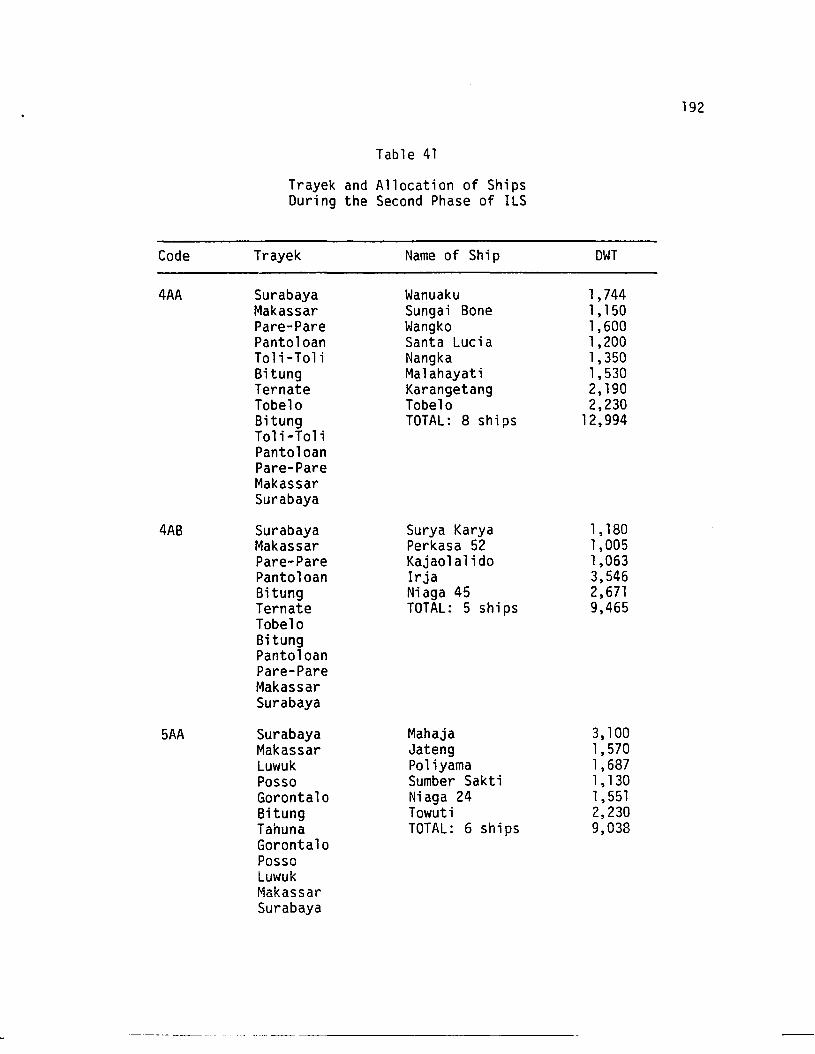
192
Table 41
Trayek and Allocation of ShipsDuring the Second Phase of ILS
Code Trayek Name of Ship OWT
4AA Surabaya Wanuaku 1,744Makassar Sungai Bone 1, 150Pare-Pare Wangko 1,600Panto10an Santa Lucia 1,200Toli-To1i Nangka 1,350Bitung Ma 1ahayat i 1,530Ternate Karangetang 2,190Tobe10 Tobe10 2,230Bitung TOTAL: 8 ships 12,994Toli-To1iPanto10anPare-PareMakassarSurabaya
4AB Surabaya Surya Karya 1,180Makassar Perkasa 52 1,005Pare-Pare Kajao1a1ido 1,063Panto10an Irja 3,546Bitung Niaga 45 2,671Ternate TOTAL: 5 ships 9,465Tobe10BitungPanto10anPare-PareMakassarSurabaya
5AA Surabaya Mahaja 3,100Makassar Jateng 1,570Luwuk Pol iyama 1,687Posso Sumber Sakti 1, 130Goronta10 Niaga 24 1,551Bitung Towuti 2,230Tahuna TOTAL: 6 ships 9,038Goronta10PossoLuwukMakassarSurabaya
~~ ~~~.~~-----------------
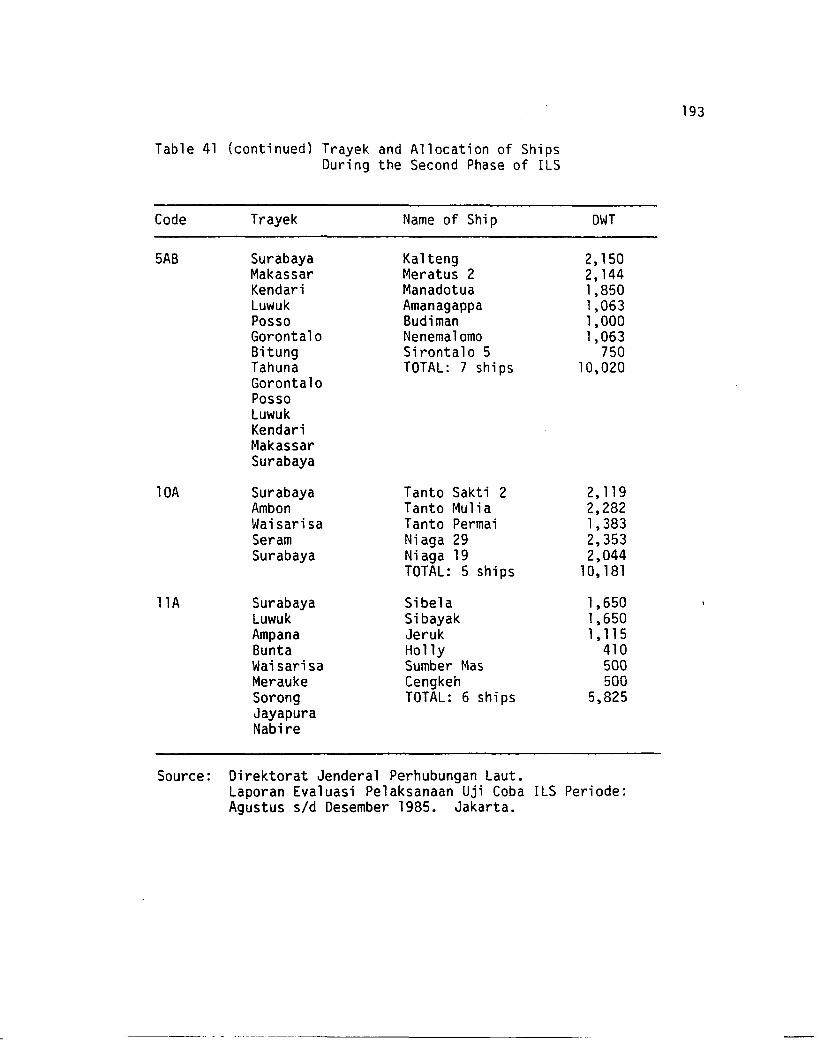
Table 41 (continued) Trayek and Allocation of ShipsDuring the Second Phase of ILS
193
Code
5AB
lOA
llA
Trayek
SurabayaMakassarKendariLuwukPossoGoronta10BitungTahunaGoronta10PossoLuwukKendariMakassarSurabaya
SurabayaAmbonWaisarisaSeramSurabaya
SurabayaLuwukAmpanaBuntaWaisarisaMeraukeSorongJayapuraNabire
Name of Ship
Ka1tengMeratus 2ManadotuaAmanagappaBudimanNenema1omoSironta10 5TOTAL: 7 ships
Tanto Sakti 2Tanto Mu1iaTanto PermaiNiaga 29Niaga 19TOTAL: 5 ships
Sibe1aSibayakJerukHollySumber MasCengkehTOTAL: 6 ships
DWT
2,1502, 1441,8501,0631,0001,063
75010,020
2, 1192,2821,3832,3532,044
10, 181
1,6501,6501,115
410500500
5,825
Source: Direktorat Jendera1 Perhubungan Laut.Laporan Eva1uasi Pe1aksanaan Uji Coba ILS Peri ode:Agustus sid Desember 1985. Jakarta.
--------- - - ----------- ---------------
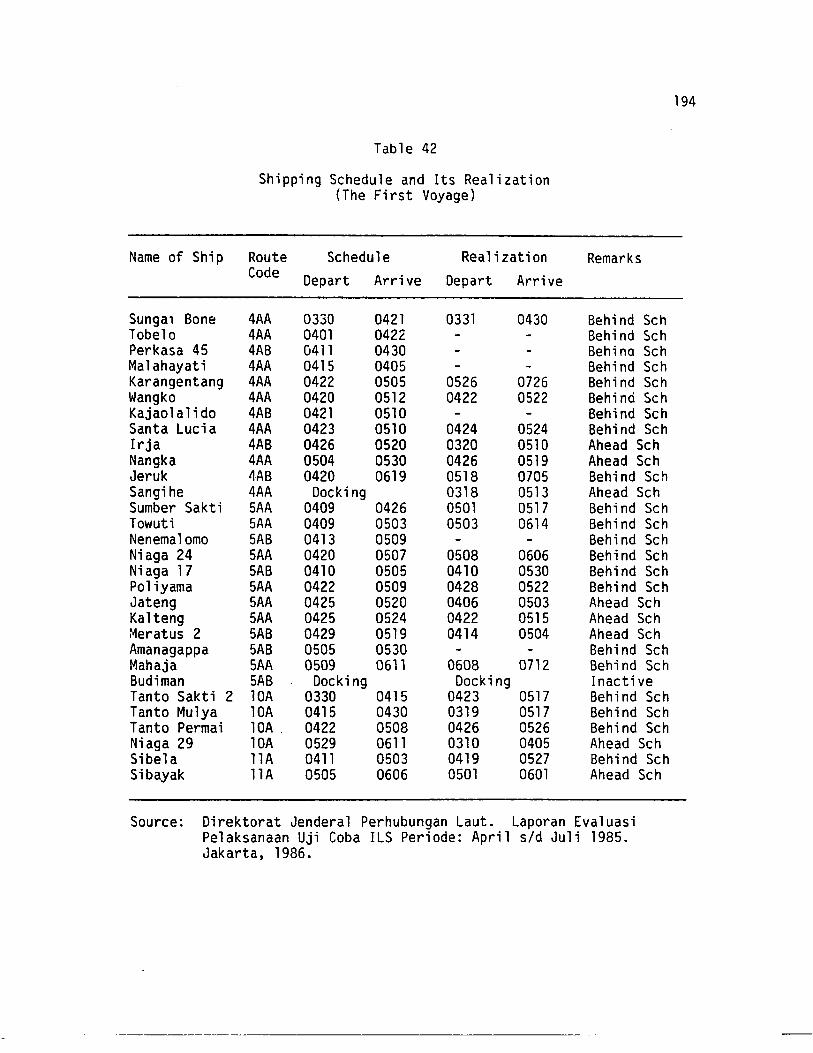
Table 42
Shipping Schedule and Its Realization(The First Voyage)
Name of Ship Route Schedule Realization RemarksCode Depart Arrive Depart Arrive
Sungai Bone 4AA 0330 0421 0331 0430 Behind SchTobel0 4AA 0401 0422 Behind SchPerkasa 45 4AB 0411 0430 Behina SchMalahayati 4AA 0415 0405 Behind SchKarangentang 4AA 0422 0505 0526 0726 Behind SchWangko 4AA 0420 0512 0422 0522 Behind SchKajaolalido 4AB 0421 0510 Behind SchSanta Lucia 4AA 0423 0510 0424 0524 Behind SchIrja 4AB 0426 0520 0320 0510 Ahead SchNangka 4AA 0504 0530 0426 0519 Ahead SchJeruk 4AB 0420 0619 0518 0705 Behind SchSangihe 4AA Docking 0318 0513 Ahead SchSumber Sakti 5AA 0409 0426 0501 0517 Behind SchTowuti 5AA 0409 0503 0503 0614 Behind SchNenema1omo 5AB 0413 0509 Behind SchNiaga 24 5AA 0420 0507 0508 0606 Behind SchNiaga 17 5AB 0410 0505 0410 0530 Behind SchPol iyama 5AA 0422 0509 0428 0522 Behind SchJateng 5AA 0425 0520 0406 0503 Ahead SchKalteng 5AA 0425 0524 0422 0515 Ahead Scht~eratus 2 5AB 0429 0519 0414 0504 Ahead SchAmanagappa 5AB 0505 0530 Behind SchMahaja 5AA 0509 0611 0608 0712 Behind SchBudiman 5AB Docking Docking InactiveTanto Sakti 2 lOA 0330 0415 0423 0517 Behind SchTanto Mulya lOA 0415 0430 0319 0517 Behind SchTanto Permai lOA. 0422 0508 0426 0526 Behind SchNiaga 29 lOA 0529 0611 0310 0405 Ahead SchSibela 11A 0411 0503 0419 0527 Behind SchSibayak 11A 0505 0606 0501 0601 Ahead Sch
Source: Direktorat Jenderal Perhubungan Laut. Laporan EvaluasiPelaksanaan Uji Coba ILS Periode: April sid Juli 1985.Jakarta, 1986.
194
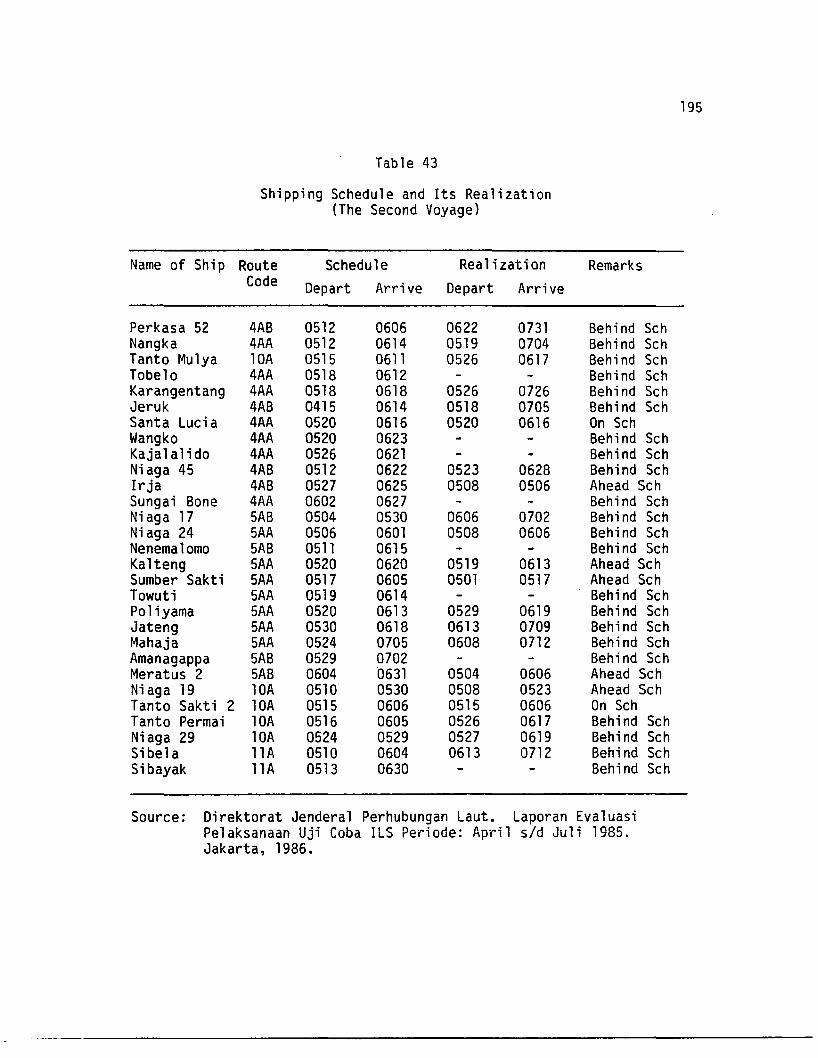
Table 43
Shipping Schedule and Its Realization(The Second Voyage)
Name of Ship Route Schedule Realization RemarksCode Depart Arrive Depart Arrive
Perkasa 52 4AB 0512 0606 0622 0731 Behind SchNangka 4AA 0512 0614 0519 0704 Behind SchTanto Mu1ya lOA 0515 0611 0526 0617 Behind SchTobe10 4AA 0518 0612 Behind SchKarangentang 4AA 0518 0618 0526 0726 Behind SchJeruk 4AB 0415 0614 0518 0705 Behind SchSanta Lucia 4AA 0520 0616 0520 0616 On SchWangko 4AA 0520 0623 Behind SchKaja1a1ido 4AA 0526 0621 Behind SchNiaga 45 4AB 0512 0622 0523 0628 Behind SchIrja 4AB 0527 0625 0508 0506 Ahead SchSungai Bone 4AA 0602 0627 Behi nd SchNi aga 17 5AB 0504 0530 0606 0702 Behind SchNiaga 24 5AA 0506 0601 0508 0606 Behind SchNenema1omo 5AB 0511 0615 Behind SchKa1teng 5AA 0520 0620 0519 0613 Ahead SchSumber Sakti 5AA 0517 0605 0501 0517 Ahead SchTowuti 5AA 0519 0614 Behind SchPoliyama 5AA 0520 0613 0529 0619 Behi nd SchJateng 5AA 0530 0618 0613 0709 Behind SchMahaja 5AA 0524 0705 0608 0712 Behi nd SchAmanagappa 5AB 0529 0702 Behi nd SchMeratus 2 5AB 0604 0631 0504 0606 Ahead SchNiaga 19 lOA 0510 0530 0508 0523 Ahead SchTanto Sakti 2 lOA 0515 0606 0515 0606 On SchTanto Permai lOA 0516 0605 0526 0617 Behind SchNiaga 29 lOA 0524 0529 0527 0619 Behind SchSibe1a 11A 0510 0604 0613 0712 Behind SchSibayak 11A 0513 0630 Behind Sch
Source: Direktorat Jendera1 Perhubungan Laut. Laporan Eva1uasiPe1aksanaan Uji Coba ILS Periode: April sId Ju1i 1985.Jakarta, 1986.
195
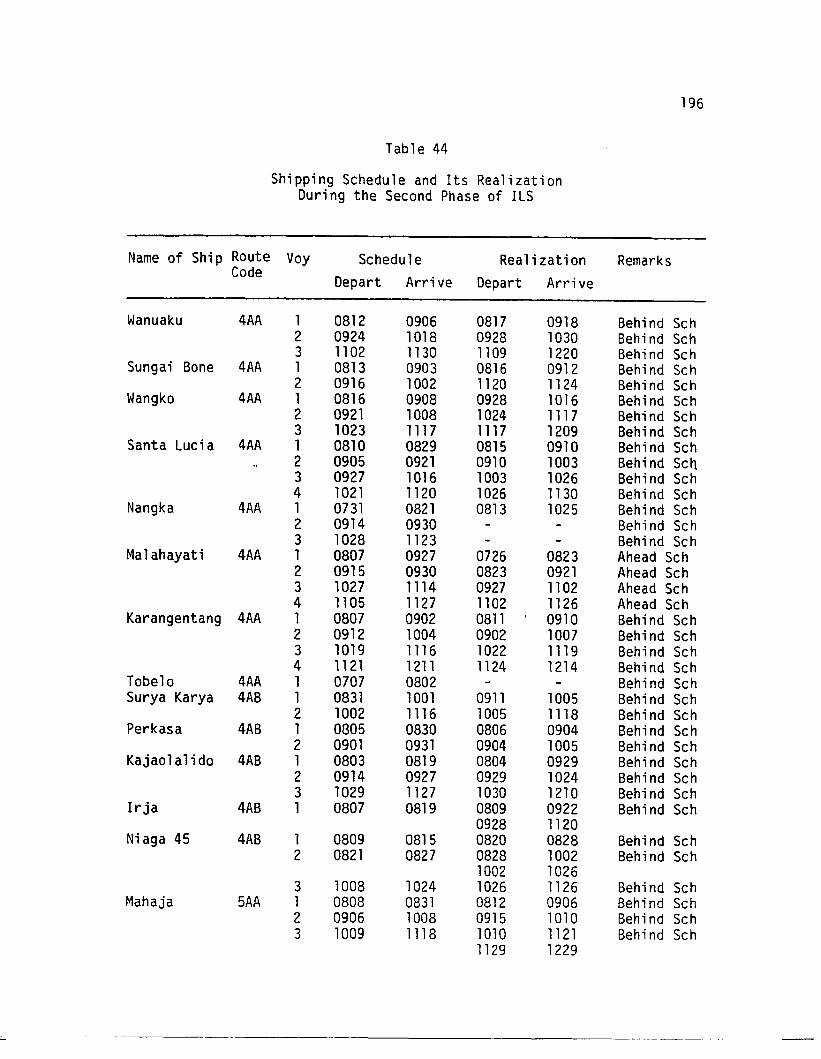
Table 44
Shipping Schedule and Its RealizationDuring the Second Phase of ILS
196
Name of Ship Route Voy Schedule Realization RemarksCode
Depart Arrive Depart Arrive
Wanuaku 4AA 1 0812 0906 0817 0918 Behi nd Sch2 0924 1018 0928 1030 Behind Sch3 1102 1130 1109 1220 Behind Sch
Sungai Bone 4AA 1 0813 0903 0816 0912 Behind Sch2 0916 1002 1120 1124 Behind Sch
Wangko 4AA 1 0816 0908 0928 1016 Behind Sch2 0921 1008 1024 1117 Behind Sch3 1023 1117 1117 1209 Behind Sch
Santa Lucia 4AA 1 0810 0829 0815 0910 Behind Sch2 0905 0921 0910 1003 Behind Sch.3 0927 1016 1003 1026 Behind Sch4 1021 1120 1026 1130 Behi nd Sch
Nangka 4AA 1 0731 0821 0813 1025 Behind Sch2 0914 0930 Behind Sch3 1028 1123 Behind Sch
Malahayati 4AA 1 0807 0927 0726 0823 Ahead Sch2 0915 0930 0823 0921 Ahead Sch3 1027 1114 0927 1102 Ahead Sch4 1105 1127 1102 1126 Ahead Sch
Karangentang 4AA 1 0807 0902 0811 0910 Behind Sch2 0912 1004 0902 1007 Behind Sch3 1019 1116 1022 1119 Behind Sch4 1121 1211 1124 1214 Behind Sch
Tobel0 4AA 1 0707 0802 Behind SchSurya Karya 4AB 1 0831 1001 0911 1005 Behind Sch
2 1002 1116 1005 1118 Behind SchPerkasa 4AB 1 0805 0830 0806 0904 Behind Sch
2 0901 0931 0904 1005 Behind SchKajaola1ido 4AB 1 0803 0819 0804 0929 Behind Sch
2 0914 0927 0929 1024 Behind Sch3 1029 1127 1030 1210 Behind Sch
Irja 4AB 1 0807 0819 0809 0922 Behind Sch0928 1120
Niaga 45 4AB 1 0809 0815 0820 0828 Behind Sch2 0821 0827 0828 1002 Behind Sch
1002 10263 1008 1024 1026 1126 Behind Sch
Mahaja 5AA 1 0808 0831 0812 0906 Behind Sch2 0906 1008 0915 1010 Behind Sch3 1009 1118 10lD 1121 Behind Sch
1129 1229
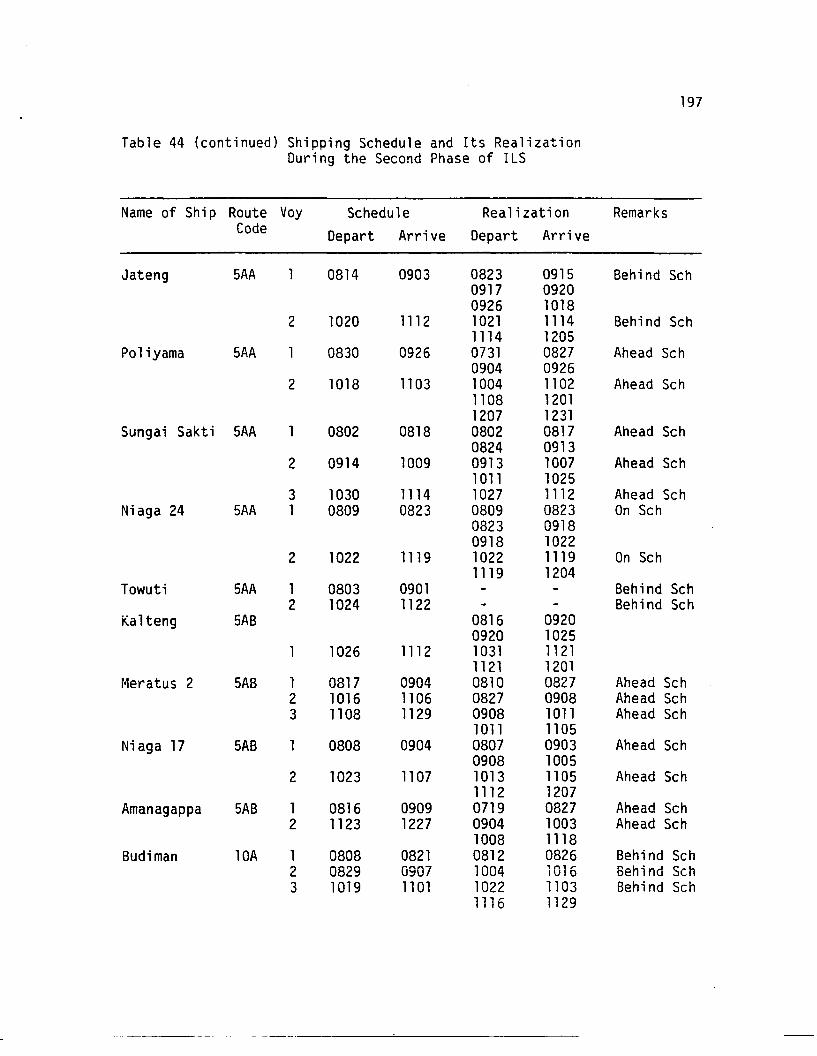
197
Table 44 (continued) Shipping Schedule and Its RealizationDuring the Second Phase of ILS
Name of Ship Route Voy Schedule Realization RemarksCode Depart Arrive Depart Arrive
Jateng 5AA 0814 0903 0823 0915 Behind Sch0917 09200926 1018
2 1020 1112 1021 1114 Behind Sch1114 1205
Poliyama 5AA 0830 0926 0731 0827 Ahead Sch0904 0926
2 1018 1103 1004 1102 Ahead Sch1108 12011207 1231
Sungai Sakti 5AA 0802 0818 0802 0817 Ahead Sch0824 0913
2 0914 1009 0913 1007 Ahead Sch1011 1025
3 1030 1114 1027 1112 Ahead SchNiaga 24 5AA 1 0809 0823 0809 0823 On Sch
0823 09180918 1022
2 1022 1119 1022 1119 On Sch1119 1204
Towuti 5AA 1 0803 0901 Behind Sch2 1024 1122 Behind Sch
Kalteng 5AB 0816 09200920 1025
1026 1112 1031 11211121 1201
r4eratus 2 5AB 1 0817 0904 0810 0827 Ahead Sch2 1016 1106 0827 0908 Ahead Sch3 1108 1129 0908 1011 Ahead Sch
1011 1105Niaga 17 5AB 0808 0904 0807 0903 Ahead Sch
0908 10052 1023 1107 1013 1105 Ahead Sch
1112 1207Amanagappa 5AB 1 0816 0909 0719 0827 Ahead Sch
2 1123 1227 0904 1003 Ahead Sch1008 1118
Budiman lOA 1 0808 0821 0812 0826 Behind Sch2 0829 0907 1004 1016 Behind Sch3 1019 11 01 1022 1103 Behind Sch
1116 1129
- ----------------'----------
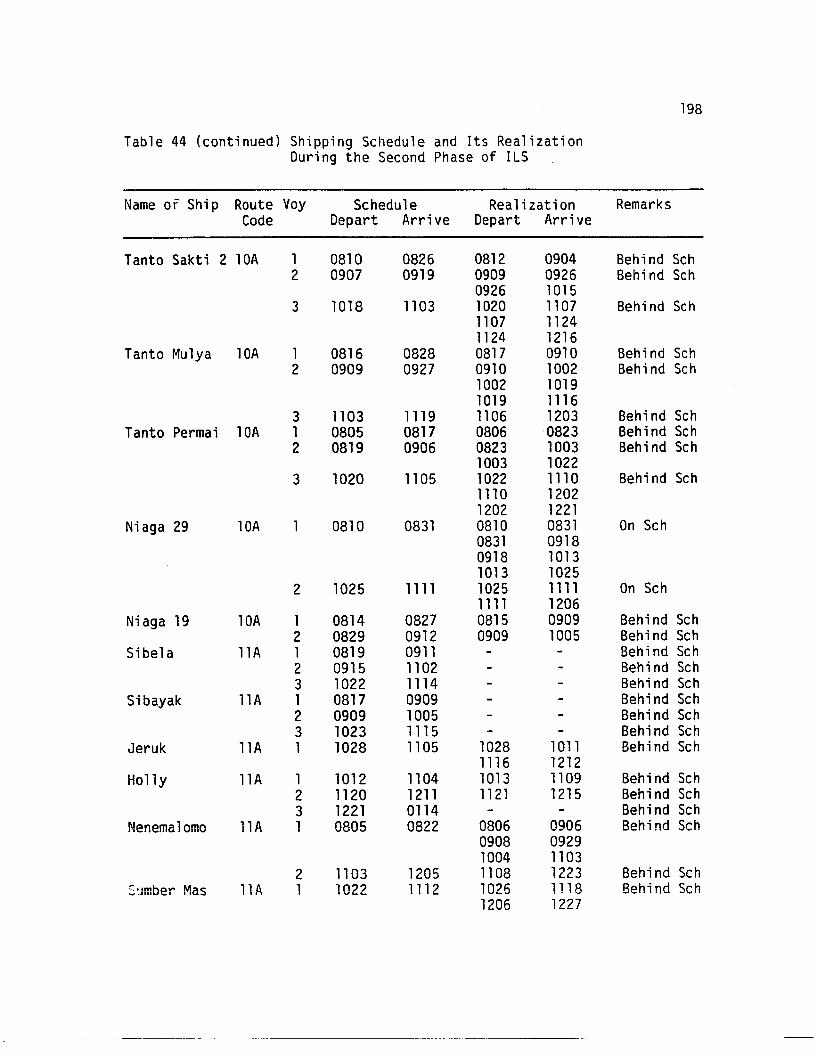
198
Table 44 (continued) Shipping Schedule and Its RealizationDuring the Second Phase of ILS
Name of Ship Route Voy Schedule Realization RemarksCode Depart Arrive Depart Arrive
Tanto Sakti 2 lOA 1 0810 0826 0812 0904 Behind Sch2 0907 0919 0909 0926 Behind Sch
0926 10153 1018 1103 1020 11 07 Behind Sch
1107 11241124 1216
Tanto Mu1ya lOA 1 0816 0828 0817 0910 Behind Sch2 0909 0927 0910 1002 Behind Sch
1002 10191019 1116
3 1103 1119 1106 1203 Behind SchTanto Permai lOA 1 0805 0817 0806 ·0823 Behind Sch
2 0819 0906 0823 1003 Behind Sch1003 1022
3 1020 1105 1022 1110 Behind Sch1110 12021202 1221
Niaga 29 lOA 0810 0831 0810 0831 On Sch0831 09180918 10131013 1025
2 1025 1111 1025 1111 On Sch1111 1206
Ni aga 19 lOA 1 0814 0827 0815 0909 Behind Sch2 0829 0912 0909 1005 Behi nd Sch
Sibe1a 11 A 1 0819 0911 Behind Sch2 0915 1102 Behind Sch3 1022 1114 Behind Sch
Sibayak 11A 1 0817 0909 Behind Sch2 0909 1005 Behind Sch3 1023 1115 Behind Sch
Jeruk llA 1 1028 1105 1028 1011 Behind Sch1116 1212
Holly 11A 1 1012 1104 1013 1109 Behind Sch2 1120 1211 1121 1215 Behind Sch3 1221 0114 Behind Sch
Nenema1omo 11A 1 0805 0822 0806 0906 Behind Sch0908 09291004 1103
2 1103 1205 1108 1223 Behind SchS~mber Mas llA 1 1022 1112 1026 1118 Behind Sch
1206 1227
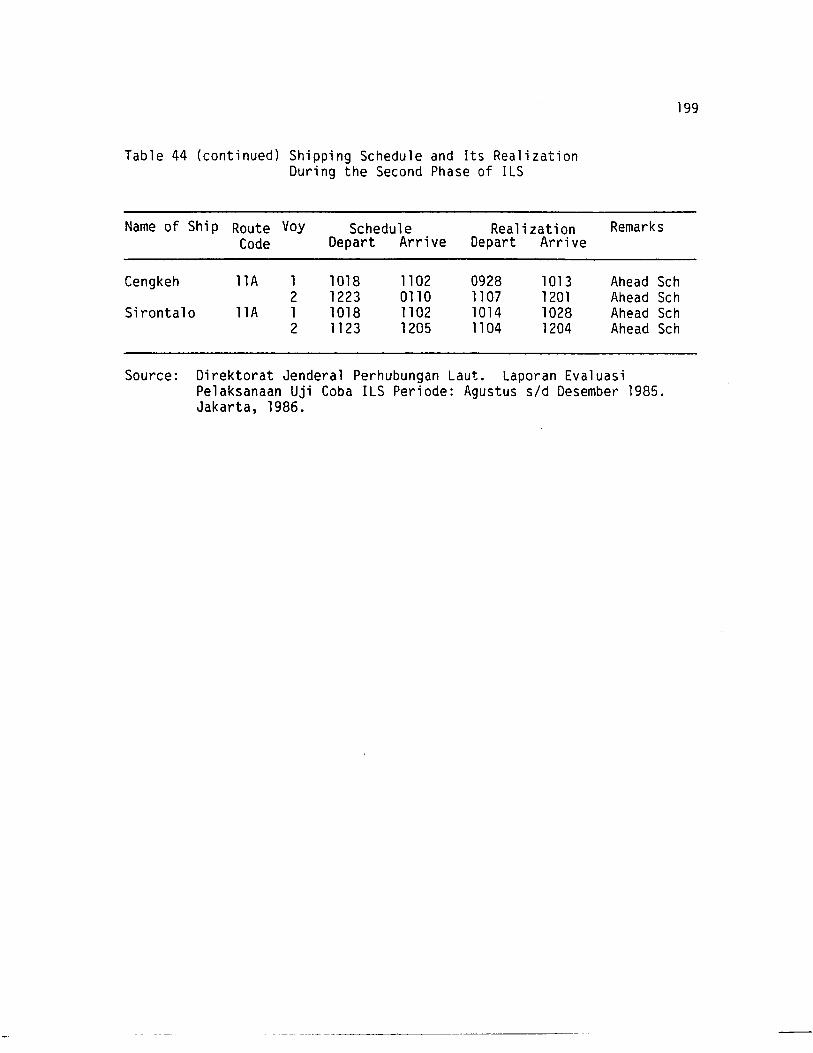
Table 44 (continued) Shipping Schedule and Its RealizationDuring the Second Phase of ILS
199
Name of Ship Route Voy Schedule Realization RemarksCode Depart Arrive Depart Arrive
Cengkeh 11A 1 1018 1102 0928 1013 Ahead Sch2 1223 0110 1107 1201 Ahead Sch
Sironta10 11A 1 1018 1102 1014 1028 Ahead Sch2 1123 1205 1104 1204 Ahead Sch
Source: Direktorat Jenderal Perhubungan Laut. Laporan EvaluasiPelaksanaan Uji Coba ILS Peri ode: Agustus sid Desember 1985.Jakarta, 1986.
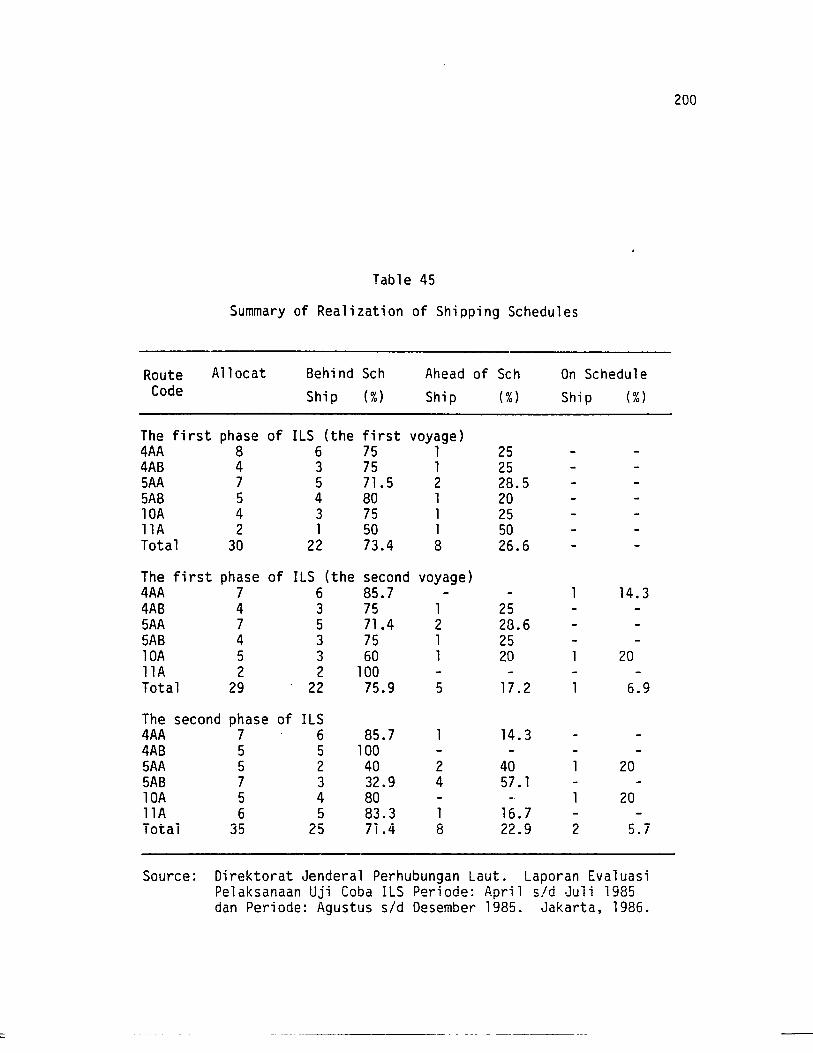
Table 45
Summary of Realization of Shipping Schedules
Route A11 ocat Behind Sch Ahead of Sch On ScheduleCode Ship (% ) Ship (% ) Ship (%)
The first phase of ILS (the first voyage)4AA 8 6 75 1 254AB 4 3 75 1 255AA 7 5 71.5 2 28.55AB 5 4 80 1 20lOA 4 3 75 1 25llA 2 1 50 1 50Total 30 22 73.4 8 26.6
The first phase of ILS (the second voyage)4AA 7 6 85.7 14.34AB 4 3 75 1 255AA 7 5 71.4 2 28.65AB 4 3 75 1 25lOA 5 3 60 1 20 20llA 2 2 100Total 29 22 75.9 5 17 .2 6.9
The second phase of ILS4AA 7 6 85.7 14.34AB 5 5 1005AA 5 2 40 2 40 205AB 7 3 32.9 4 57. 1lOA 5 4 80 20llA 6 5 83.3 1 16.7Total 35 25 71.4 8 22.9 2 5.7
Source: Direktorat Jenderal Perhubungan Laut. Laporan EvaluasiPelaksanaan Uji Coba ILS Periode: April sid Jul i 1985dan Periode: Agustus sid Desember 1985. Jakarta, 1986.
200
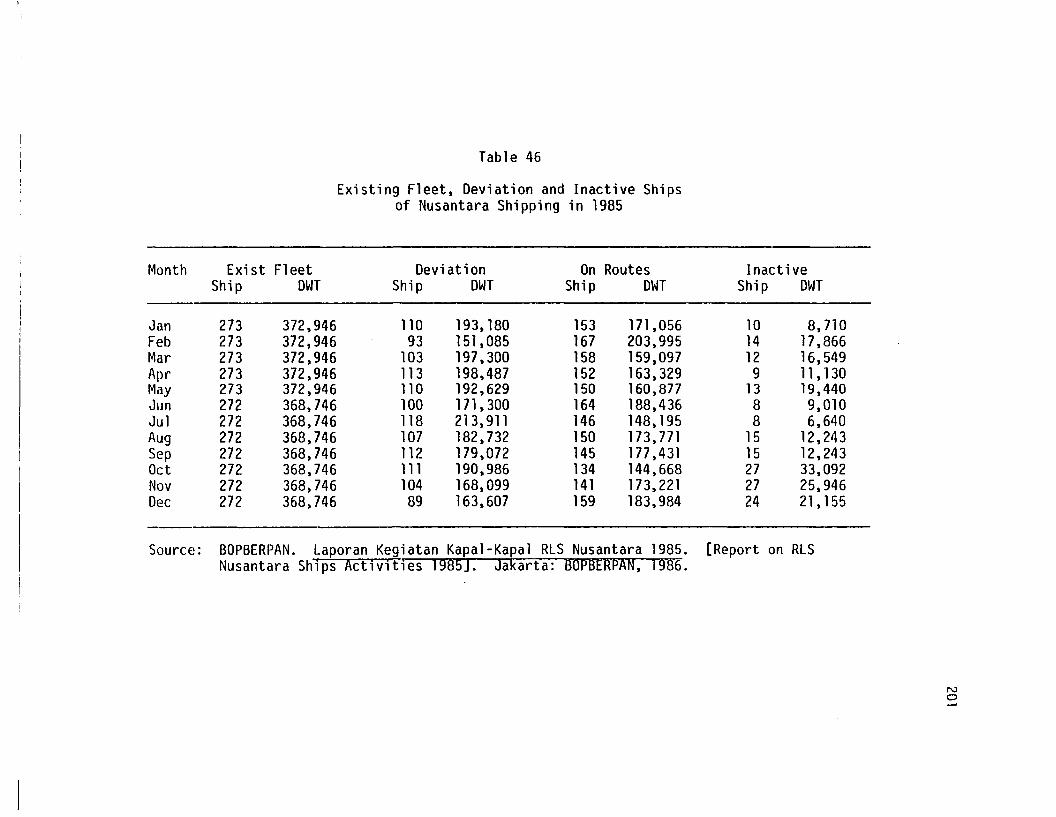
lable 46
Existing Fleets Deviation and Inactive Shipsof Nusantara Shipping in 1985
Month Exi st Fleet Deviation On Routes InactiveShip OWl Ship OWl Ship OWl Ship OWl
Jan 273 372 s946 110 193s180 153 171 s056 10 8s710Feb 273 372 s946 93 151 s085 167 203 s995 14 17 s866Mar 273 372 s946 103 197 s300 158 159 s097 12 16s549Apr 273 372 s946 113 198s487 152 163 s329 9 l1 s130May 273 372 s946 110 192 s629 150 160s877 13 19s440Jun 272 368s746 100 171 s300 164 188s436 8 9s010Ju1 272 368 s746 118 213 s911 146 148 s195 8 6s640Aug 272 368s746 107 182 s732 150 173s771 15 12 s243Sep 272 368s746 112 179 s072 145 177 s431 15 12 s243Oct 272 368s746 111 190s986 134 144 s668 27 33 s092Nov 272 368s746 104 168s099 141 173s221 27 25s946Dec 272 368s746 89 163s607 159 183s984 24 21 s155
Source: BOPBERPAN. Laporan Kegiatan Kapal-Kapa1 RLS Nusantara 1985. [Report on RLSNusantara Ships Activities 1985]. Jakarta: BOPBERPAN s 1986.
No~
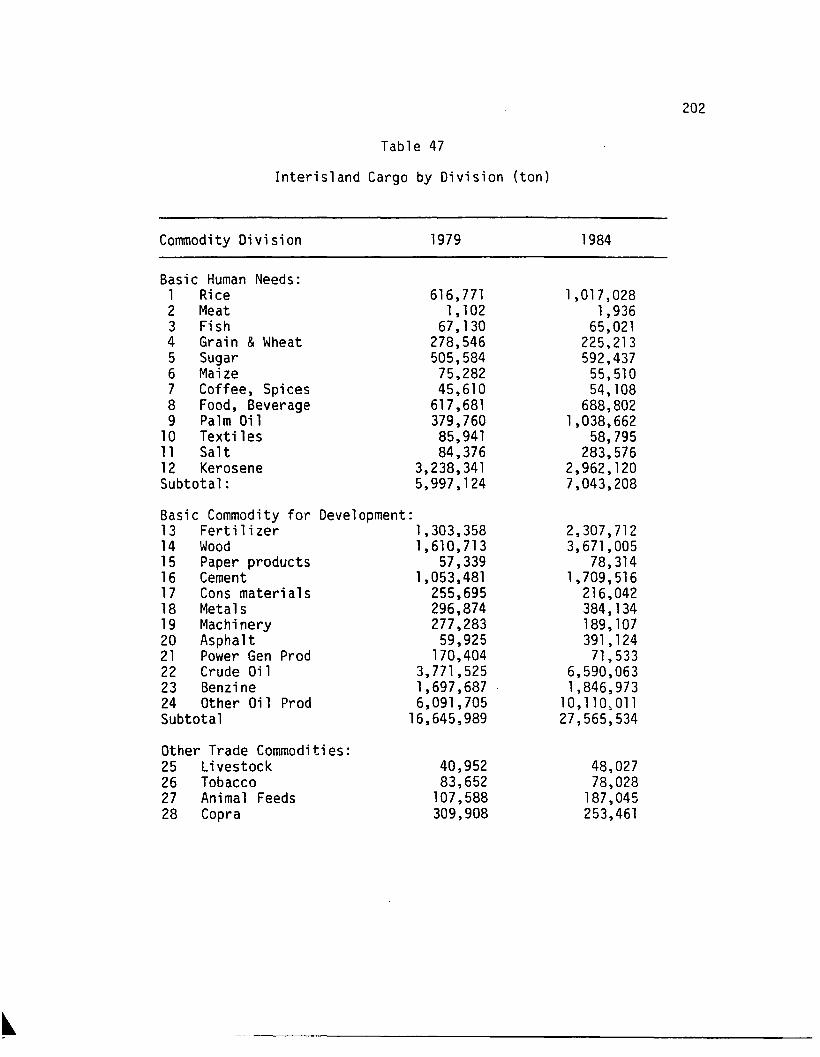
Table 47
Interisland Cargo by Division (ton)
Commodity Division 1979 1984
Basic Human Needs:1 Rice 616,771 1,017,0282 Meat 1,102 1,9363 Fish 67,130 65,0214 Grain &Wheat 278,546 225,2135 Sugar 505,584 592,4376 Maize 75,282 55,5107 Coffee, Spices 45,610 54, 1088 Food, Beverage 617,681 688,8029 Palm Oil 379,760 1,038,662
10 Textiles 85,941 58,79511 Salt 84,376 283,57612 Kerosene 3,238,341 2,962,120Subtotal: 5,997,124 7,043,208
Basic Commodity for Development:13 Fertilizer 1,303,358 2,307,71214 Wood 1,610,713 3,671,00515 Paper products 57,339 78,31416 Cement 1,053,481 1,709,51617 Cons materials 255,695 216,04218 Metals 296,874 384,13419 Machinery 277,283 189,10720 Asphalt 59,925 391,12421 Power Gen Prod 170,404 71,53322 Crude Oil 3,771,525 6,590,06323 Benzine 1,697,687 1,846,97324 Other Oil Prod 6,091,705 10,110,011Subtotal 16,645,989 27,565,534
Other Trade Commodities:25 livestock 40,952 48,02726 Tobacco 83,652 78,02827 Animal Feeds 107,588 187,04528 Copra 309,908 253,461
202
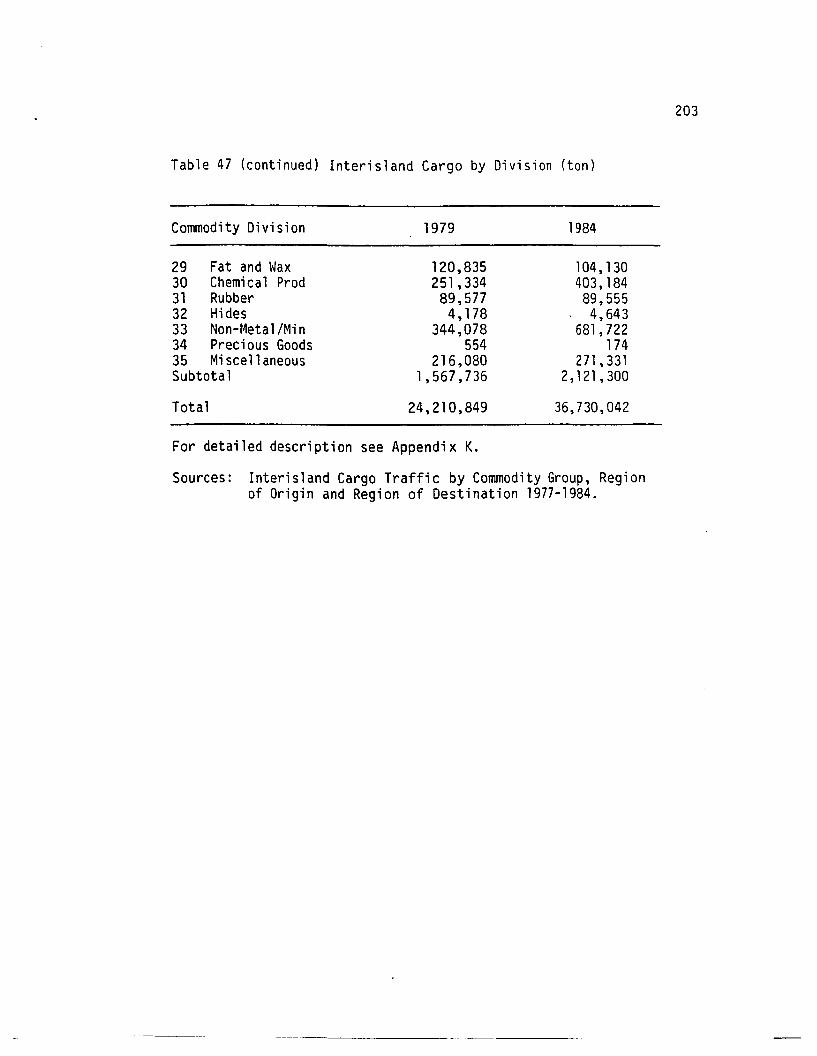
Table 47 (continued) Interisland Cargo by Division (ton)
Commodity Division 1979 1984
29 Fat and Wax 120,835 104,13030 Chemical Prod 251,334 403,18431 Rubber 89,577 89,55532 Hides 4,178 4,64333 Non-Metal/Min 344,078 681 ,72234 Precious Goods 554 17435 Miscellaneous 216,080 271,331Subtotal 1,567,736 2,121 ,300
Total 24,210,849 36,730,042
For detailed description see Appendix K.
Sources: Interisland Cargo Traffic by Commodity Group, Regionof Origin and Region of Destination 1977-1984.
203
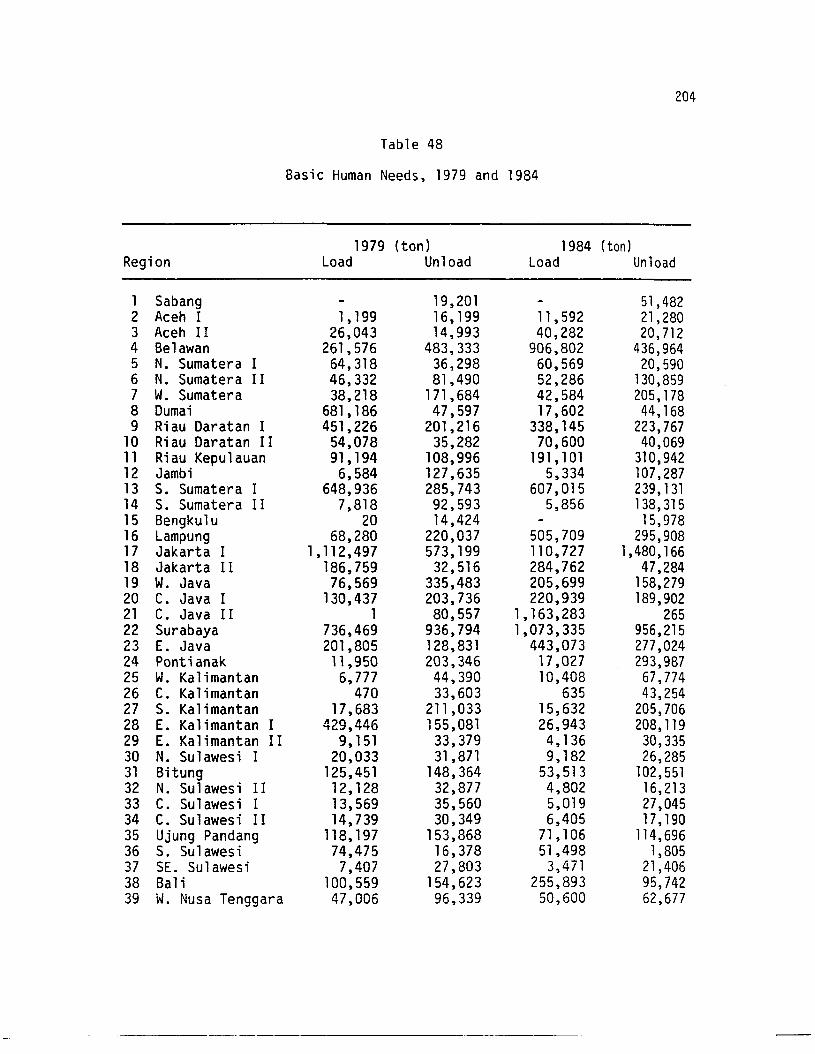
Table 48
Basic Human Needs, 1979 and 1984
204
1979 (ton) 1984 (ton)Region Load Unload Load Unload
1 Sabang 19,201 51,4822 Aceh I 1, 199 16,199 11 ,592 21,2803 Aceh II 26,043 14,993 40,282 20,7124 Belawan 261,576 483,333 906,802 436,9645 N. Sumatera I 64,318 36,298 60,569 20,5906 N. Sumatera I I 46,332 81,490 52,286 130,8597 W. Sumatera 38,218 171,684 42,584 205,1788 Dumai 681, 186 47,597 17,602 44,1689 Riau Daratan I 451,226 201,216 338,145 223,767
10 Riau Daratan II 54,078 35,282 70,600 40,06911 Riau Kepulauan 91,194 108,996 191,101 310,94212 Jambi 6,584 127,635 5,334 107,28713 S. Sumatera I 648,936 285,743 607,015 239,13114 S. Sumatera II 7,818 92,593 5,856 138,31515 Bengku1u 20 14,424 15,97816 Lampung 68,280 220,037 505,709 295,90817 Jakarta I 1,112,497 573,199 110,727 1,480,16618 Jakarta II 186,759 32,516 284,762 47,28419 W. Java 76,569 335,483 205,699 158,27920 C. Java I 130,437 203,736 220,939 189,90221 C. Java II 1 80,557 1,163,283 26522 Surabaya 736,469 936,794 1,073,335 956,21523 E. Java 201,805 128,831 443,073 277 ,02424 Pontianak 11,950 203,346 17,027 293,98725 W. Kalimantan 6,777 44,390 10,408 67,77426 C. Kalimantan 470 33,603 635 43,25427 S. Kalimantan 17,683 211 ,033 15,632 205,70628 E. Kalimantan I 429,446 155,081 26,943 208, 11929 E. Kalimantan II 9,151 33,379 4,136 30,33530 N. Sulawesi I 20,033 31,871 9,182 26,28531 Bitung 125,451 148,364 53,513 102,55132 N. Sulawesi II 12,128 32,877 4,802 16,21333 C. Sulawesi I 13,569 35,560 5,019 27,04534 C. Sulawes; II 14,739 30,349 6,405 17,19035 Ujung Pandang 118,197 153,868 71 ,106 114,69636 S. Sulawesi 74,475 16,378 51,498 1,80537 SEe Su1 awes; 7,407 27 , 803 3,471 21,40638 Bali 100,559 154,623 255,893 95,74239 W. Nusa Tenggara 47,006 96,339 50,600 62,677
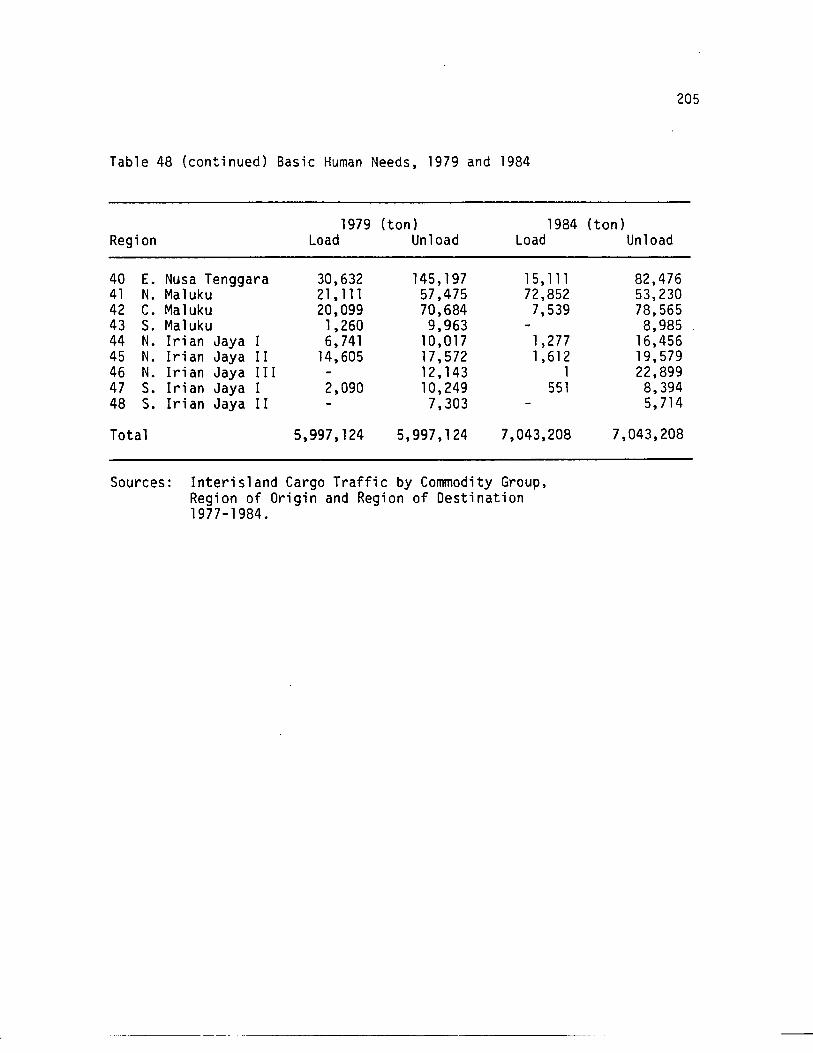
Table 48 (continued) Basic Human Needs, 1979 and 1984
205
1979 (ton) 1984 (ton)Region Load Unload Load Unload
40 E. Nusa Tenggara 30,632 145,197 15,111 82,47641 N. Ma1uku 21, 111 57,475 72,852 53,23042 C. Ma1uku 20,099 70,684 7,539 78,56543 S. Ma1uku 1,260 9,963 8,98544 N. Irian Jaya I 6,741 10,017 1,277 16,45645 N. Irian Jaya I! 14,605 17,572 1,612 19,57946 N. Irian Jaya II! 12, 143 1 22,89947 S. Irian Jaya I 2,090 10,249 551 8,39448 S. Irian Jaya I! 7,303 5,714
Total 5,997,124 5,997,124 7,043,208 7,043,208
Sources: Interisland Cargo Traffic by Commodity Group,Region of Origin and Region of Destination1977-1984.
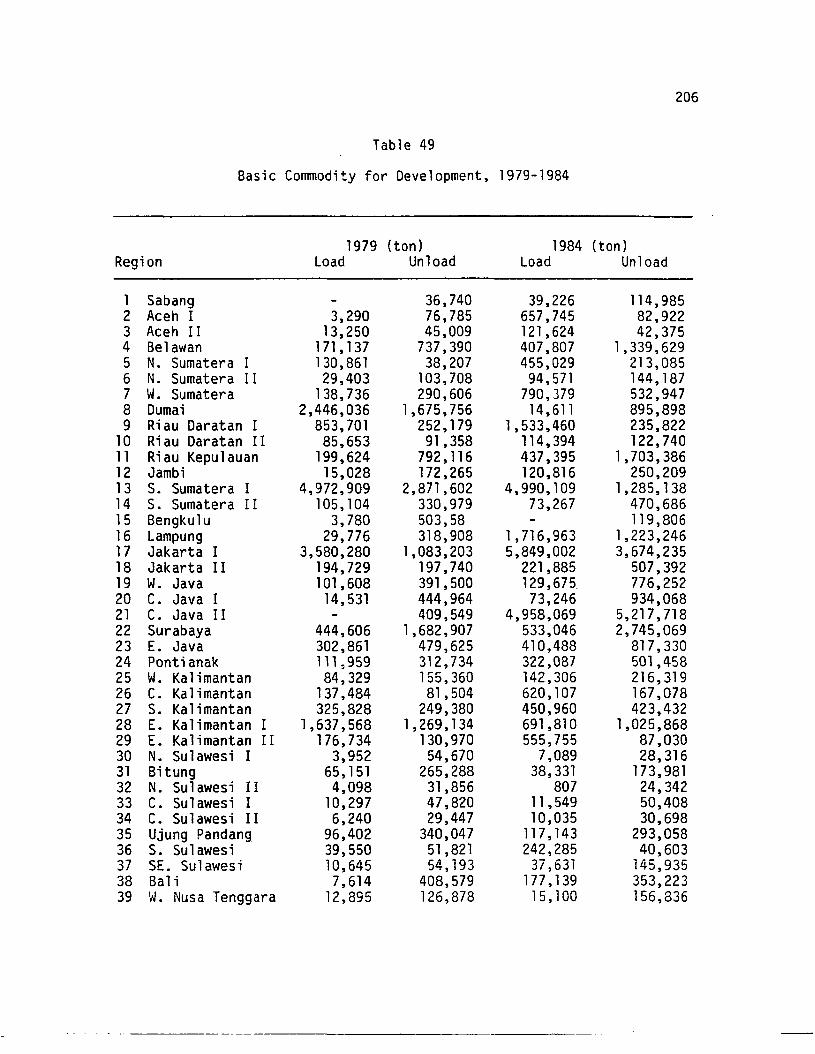
Table 49
Basic Commodity for Development, 1979-1984
206
1979 (ton) 1984 (ton)Region Load Unload Load Unload
1 Sabang 36,740 39,226 114,9852 Aceh I 3,290 76,785 657,745 82,9223 Aceh II 13,250 45,009 121,624 42,3754 Belawan 171,137 737,390 407,807 1,339,6295 N. Sumatera I 130,861 38,207 455,029 213,0856 N. Sumatera II 29,403 103,708 94,571 144,1877 W. Sumatera 138,736 290,606 790,379 532,9478 Dumai 2,446,036 1,675,756 14,611 895,8989 Riau Daratan I 853,701 252,179 1,533,460 235,822
10 Ri au Daratan II 85,653 91,358 114,394 122,74011 Riau Kepulauan 199,624 792,116 437,395 1,703,38612 Jambi 15,028 172,265 120,816 250,20913 S. Sumatera I 4,972,909 2,871,602 4,990,109 1,285,13814 S. Sumatera II 105,104 330,979 73,267 470,68615 Bengkulu 3,780 503,58 119,80616 Lampung 29,776 318,908 1,716,963 1,223,24617 Jakarta I 3,580,280 1,083,203 5,849,002 3,674,23518 Jakarta II 194,729 197,740 221,885 507,39219 W. Java 101 ,608 391,500 129,675. 776,25220 C. Java I 14,531 444,964 73,246 934,06821 C. Java II 409,549 4,958,069 5,217,71822 Surabaya 444,606 1,682,907 533,046 2,745,06923 E. Java 302,861 479,625 410,488 817,33024 Pontianak 111 .959 312,734 322,087 501,45825 W. Kalimantan 84,329 155,360 142,306 216,31926 C. Kalimantan 137,484 81,504 620,107 167,07827 S. Kal imantan 325,828 249,380 450,960 423,43228 E. Kalimantan I 1,637,568 1,269,134 691,810 1,025,86829 E. Ka1i mantan I I 176,734 130,970 555,755 87,03030 N. Sulawesi I 3,952 54,670 7,089 28,31631 Bitung 65,151 265,288 38,331 173,98132 N. Sulawesi I I 4,098 31,856 807 24,34233 C. Sulawesi I 10,297 47,820 11 ,549 50,40834 C. Sulawesi II 6,240 29,447 10,035 30,69835 Ujung Pandang 96,402 340,047 117,143 293,05836 S. Sulawesi 39,550 51,821 242,285 40,60337 SEe Su1 awes; 10,645 54, 193 37,631 145,93538 Bali 7,614 408,579 177,139 353,22339 W. Nusa Tenggara 12,895 126,878 15,100 156,836
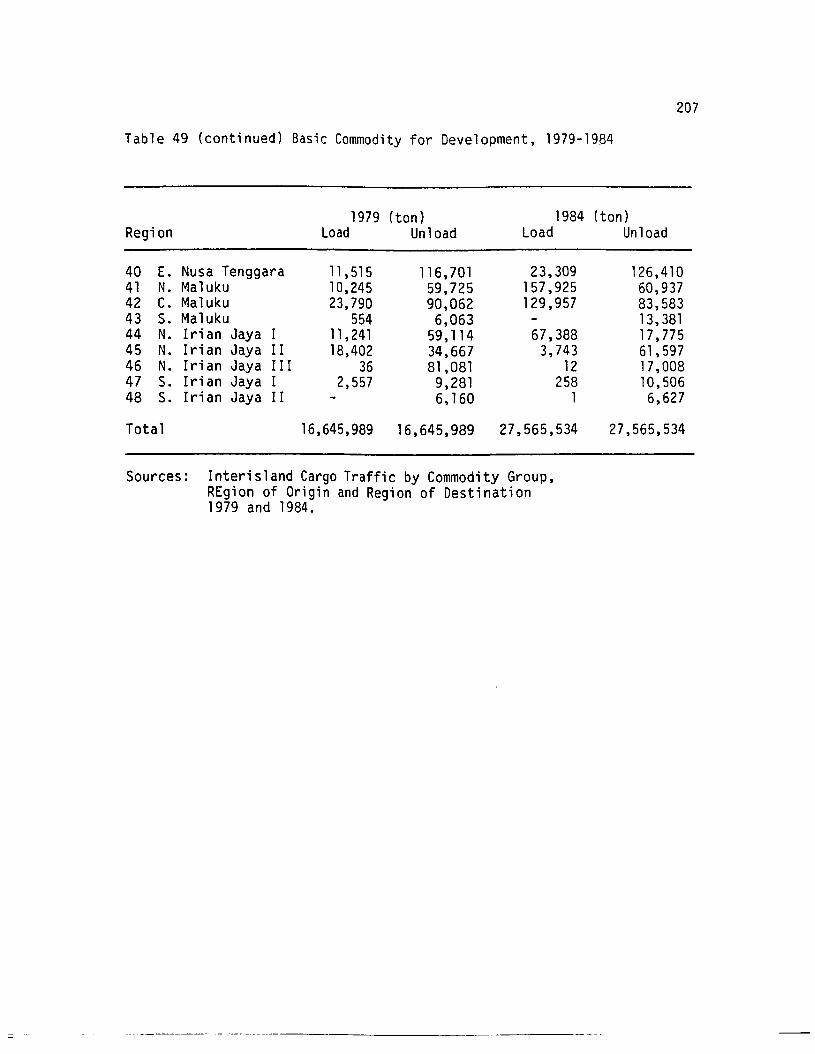
Table 49 (continued) Basic Commodity for Development, 1979-1984
207
1979 (ton) 1984 (ton)Region Load Unload Load Unload
40 E. Nusa Tenggara 11 ,515 116,701 23,309 126,41041 N. Ma1uku 10,245 59,725 157,925 60,93742 C. Ma1uku 23,790 90,062 129,957 83,58343 S. Ma1uku 554 6,063 13,38144 N. Irian Jaya I 11 ,241 59,114 67,388 17,77545 N. Irian Jaya I I 18,402 34,667 3,743 61,59746 N. Irian Jaya III 36 81,081 12 17,00847 S. Irian Jaya I 2,557 9,281 258 10,50648 S. Irian Jaya II 6,160 1 6,627
Total 16,645,989 16,645,989 27,565,534 27,565,534
Sources: Interisland Cargo Traffic by Commodity Group,REgion of Origin and Region of Destination1979 and 1984.
~----~---~------_._-----
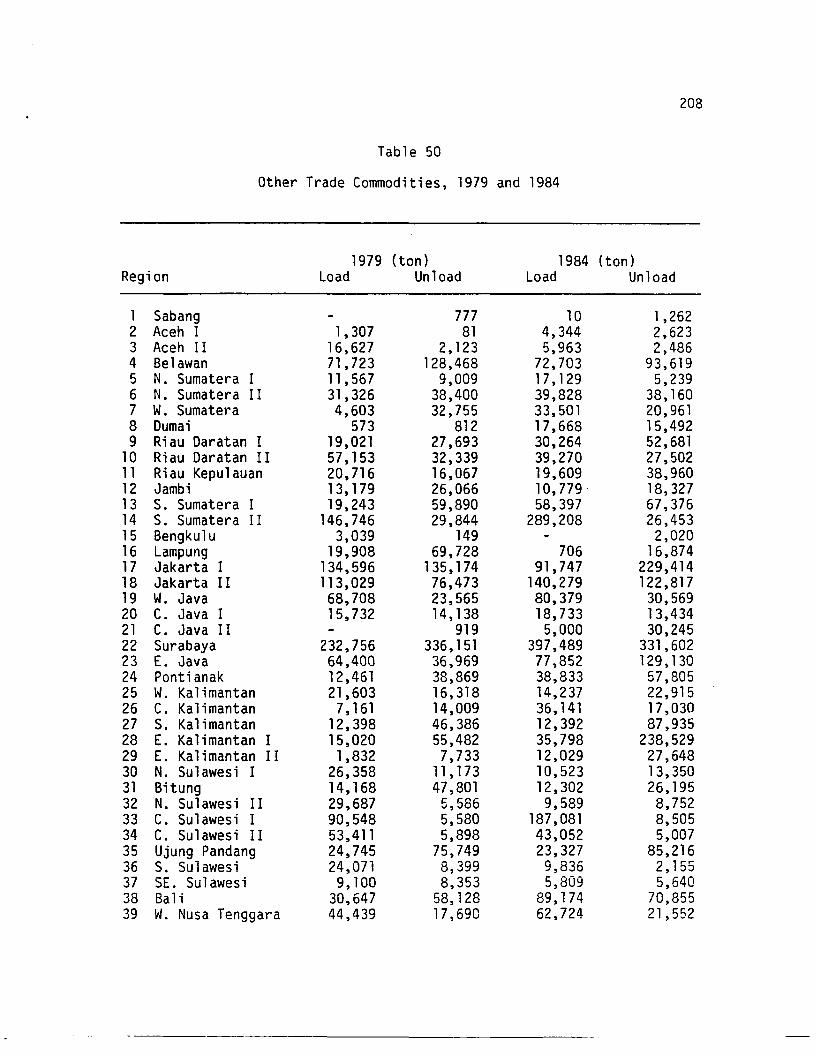
Table 50
Other Trade Commodities, 1979 and 1984
208
1979 (ton) 1984 (ton)Region Load Unload Load Unload
1 Sabang 777 10 1,2622 Aceh I 1,307 81 4,344 2,6233 Aceh II 16,627 2,123 5,963 2,4864 Belawan 71,723 128,468 72,703 93,6195 N. Sumatera I 11 ,567 9,009 17, 129 5,2396 N. Sumatera I I 31,326 38,400 39,828 38, 1607 W. Sumatera 4,603 32,755 33,501 20,9618 Dumai 573 812 17,668 15,4929 Riau Daratan I 19,021 27,693 30,264 52,681
10 Riau Daratan II 57,153 32,339 39,270 27,50211 Riau Kepulauan 20,716 16,067 19,609 38,96012 Jambi 13, 179 26,066 10,779 18,32713 S. Sumatera I 19,243 59,890 58,397 67,37614 S. Sumatera I I 146,746 29,844 289,208 26,45315 Bengkulu 3,039 149 2,02016 Lampung 19,908 69,728 706 16,87417 Jakarta I 134,596 135,174 91,747 229,41418 Jakarta II 113,029 76,473 140,279 122,81719 W. Java 68,708 23,565 80,379 30,56920 C. Java I 15,732 14,138 18,733 13,43421 C. Java II 919 5,000 30,24522 Surabaya 232,756 336,151 397,489 331,60223 E. Java 64,400 36,969 77,852 129,13024 Pontianak 12,461 38,869 38,833 57,80525 W. Kalimantan 21,603 16,318 14,237 22,91526 C. Kalimantan 7, 161 14,009 36,141 17,03027 S. Kalimantan 12,398 46,386 12,392 87,93528 E. Kalimantan I 15,020 55,482 35,798 238,52929 E. Kalimantan II 1,832 7,733 12,029 27,64830 N. Sulawesi I 26,358 11 ,173 10,523 13,35031 Bitung 14,168 47,801 12,302 26,19532 N. Sulawesi II 29,687 5,586 9,589 8,75233 C. Sulawesi I 90,548 5,580 187,081 8,50534 C. Sulawesi II 53,411 5,898 43,052 5,00735 Ujung Pandang 24,745 75,749 23,327 85,21636 S. Sulawesi 24,071 8,399 9,836 2,15537 SE. Su1awes i 9,100 8,353 5,809 5,64038 Bali 30,647 58,128 89,174 70,85539 W. Nusa Tenggara 44,439 17,690 62,724 21,552
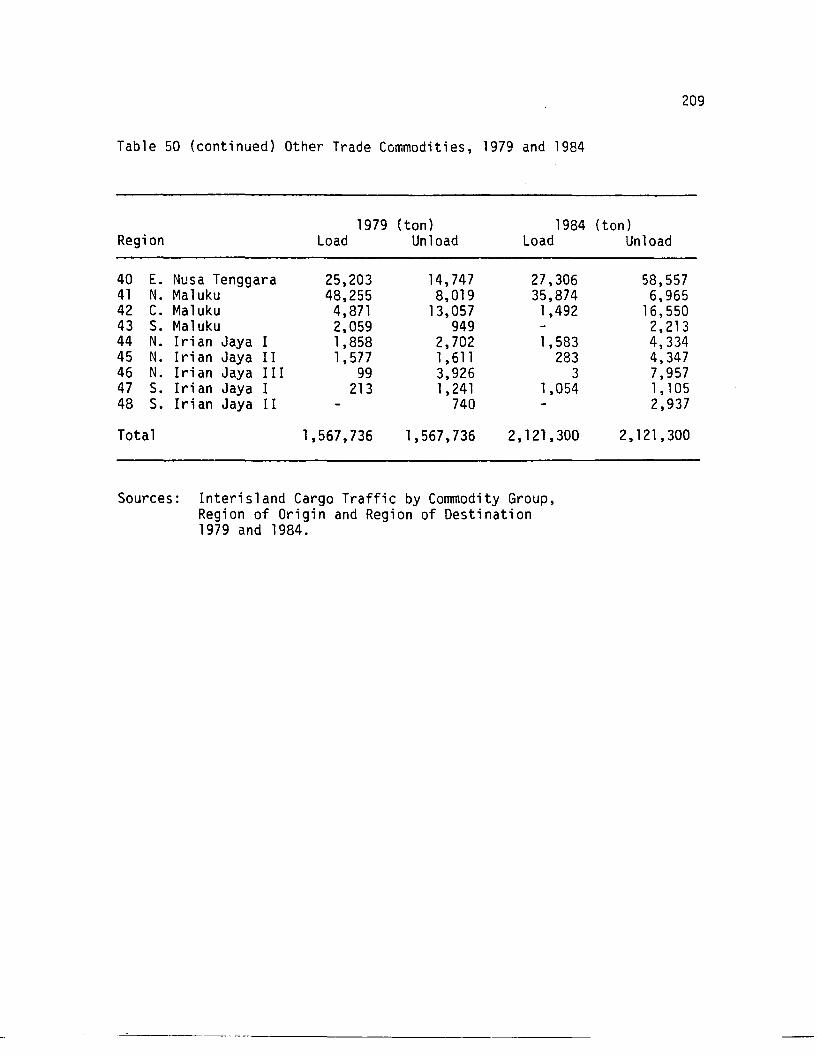
Table 50 (continued) Other Trade Commodities, 1979 and 1984
209
1979 (ton) 1984 (ton)Region Load Unload Load Unload
40 E. Nusa Tenggara 25,203 14,747 27,306 58,55741 N. Ma1uku 48,255 8,019 35,874 6,96542 C. Ma1uku 4,871 13,057 1,492 16,55043 S. Ma1uku 2,059 949 2,21344 N. Irian Jaya I 1,858 2,702 1,583 4,33445 N. Irian Jaya I I 1,577 1,611 283 4,34746 N. Irian Jaya I I I 99 3,926 3 7,95747 S. Irian Jaya I 213 1,241 1,054 1,10548 S. Irian Jaya I I 740 2,937
Total 1,567,736 1,567,736 2,121,300 2,121,300
Sources: Interisland Cargo Traffic by Commodity Group,Region of Origin and Region of Destination1979 and 1984.
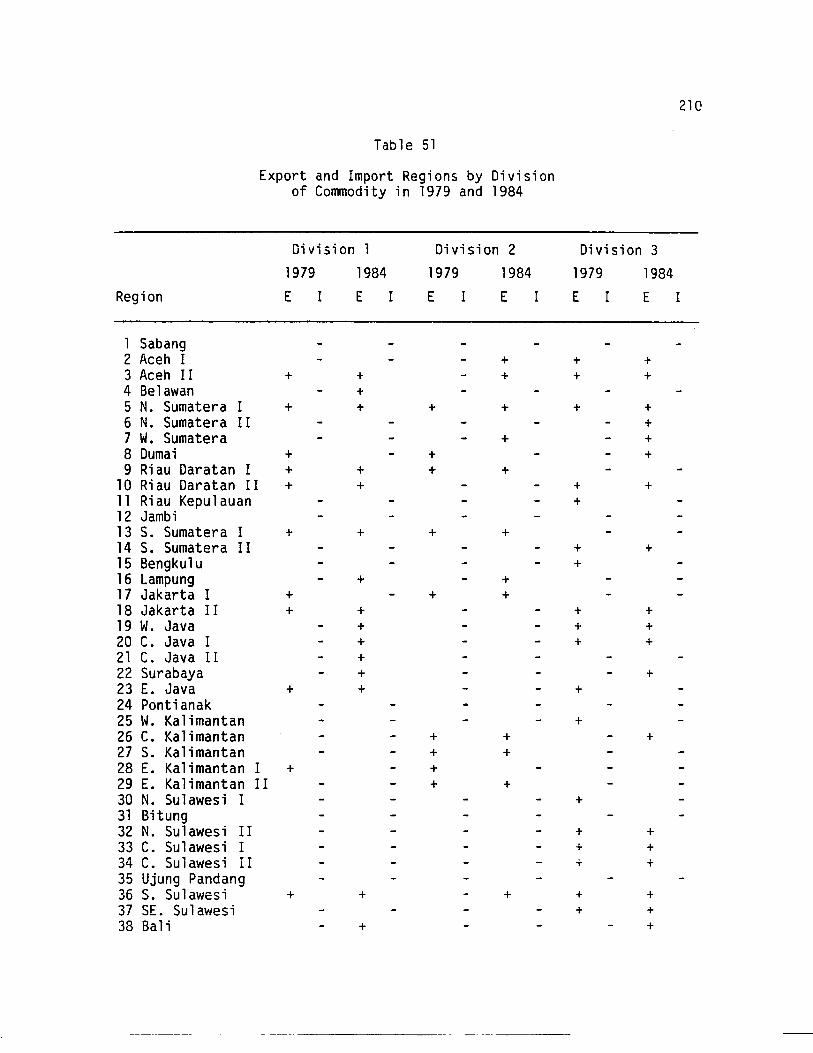
Table 51
Export and Import Regions by Divisionof Commodity in 1979 and 1984
210
Division 1 Division 2 Division 31979 1984 1979 1984 1979 1984
Region E I E I E I E I E I E I
1 Sabang2 Aceh I + + +3 Aceh II + + + + +4 Belawan +5 N. Sumatera I + + + + + +6 N. Sumatera II +7 W. Sumatera + +8 Dumai + + +9 Riau Daratan I + + + +
10 Riau Daratan II + + + +11 Riau Kepulauan +12 Jambi13 S. Sumatera I + + + +14 S. Sumatera II + +15 Bengku1u +16 Lampung + +17 Jakarta I + + +18 Jakarta II + + + +19 W. Java + + +20 C. Java I + + +21 C. Java II +22 Surabaya + +23 E. Java + + +24 Pontianak25 W. Kalimantan +26 C. Kalimantan + + +27 S. Kalimantan + +28 E. Kalimantan I + +29 E. Kalimantan II + +30 N. Sulawesi I +31 Bitung32 N. Sulawesi II + +33 C. Sulawesi I + +34 C. Sulawesi II + +35 Ujung Pandang36 S. Sulawesi + + + + +37 SE. Sul awesi + +38 Bali + +
~~~~~~~~--- -~--------
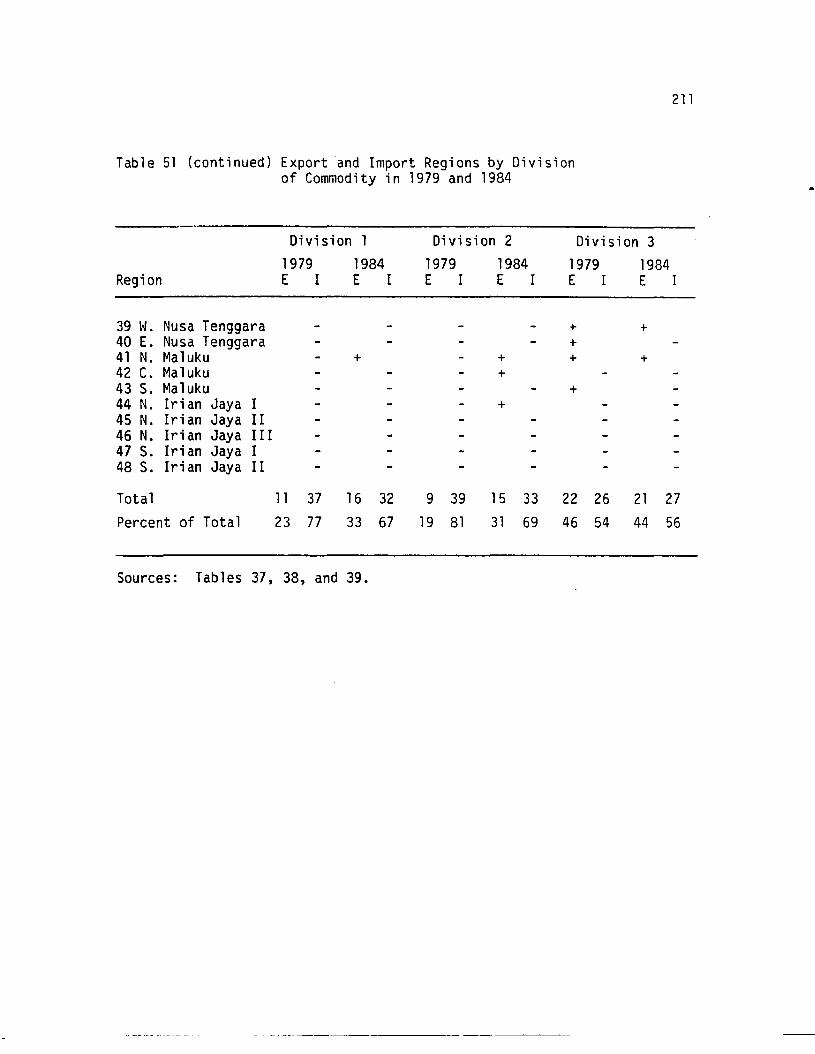
Table 51 (continued) Export and Import Regions by Divisionof Commodity in 1979 and 1984
211
Division 1 Division 2 Division 31979 1984 1979 1984 1979 1984
Region E I E I E I E I E I E I
39 w. Nusa Tenggara + +40 E. Nusa Tenggara +41 N. Maluku + + + +42 C. Maluku +43 S. Maluku +44 N. Iri an Jaya I +45 N. Iri an Jaya I I46 N. Iri an Jaya III47 S. Iri an Jaya I48 S. Irian Jaya II
Total 11 37 16 32 9 39 15 33 22 26 21 27Percent of Total 23 77 33 67 19 81 31 69 46 54 44 56
Sources: Tables 37, 38, and 39.
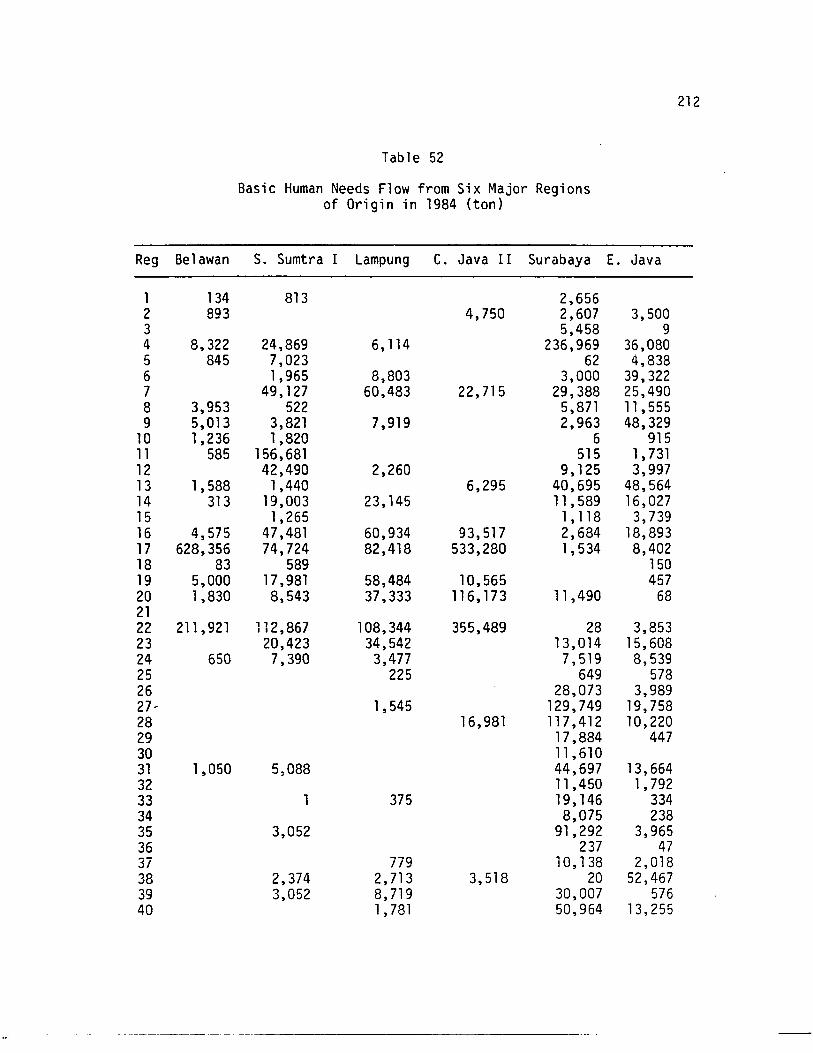
Table 52
Basic Human Needs Flow from Six Major Regionsof Origin in 1984 (ton)
Reg Belawan S. Sumtra I Lampung C. Java I I Surabaya E. Java
1 134 813 2,6562 893 4,750 2,607 3,5003 5,458 94 8,322 24,869 6,114 236,969 36,0805 845 7,023 62 4,8386 1,965 8,803 3,000 39,3227 49,127 60,483 22,715 29,388 25,4908 3,953 522 5,871 11 ,5559 5,013 3,821 7,919 2,963 48,329
10 1,236 1,820 6 91511 585 156,681 515 1,73112 42,490 2,260 9,125 3,99713 1,588 1,440 6,295 40,695 48,56414 313 19,003 23,145 11 ,589 16,02715 1,265 1, 118 3,73916 4,575 47,481 60,934 93,517 2,684 18,89317 628,356 74,724 82,418 533,280 1,534 8,40218 83 589 15019 5,000 17,981 58,484 10,565 45720 1,830 8,543 37,333 116, 173 11 ,490 682122 211 ,921 112,867 108,344 355,489 28 3,85323 20,423 34,542 13,014 15,60824 650 7,390 3,477 7,519 8,53925 225 649 57826 28,073 3,98927' 1,545 129,749 19,75828 16,981 117,412 10,22029 17,884 44730 11 ,61031 1,050 5,088 44,697 13,66432 11 ,450 1,79233 1 375 19,146 33434 8,075 23835 3,052 91,292 3,96536 237 4737 779 10, 138 2,01838 2,374 2,713 3,518 20 52,46739 3,052 8,719 30,007 57640 1,781 50,964 13,255
212
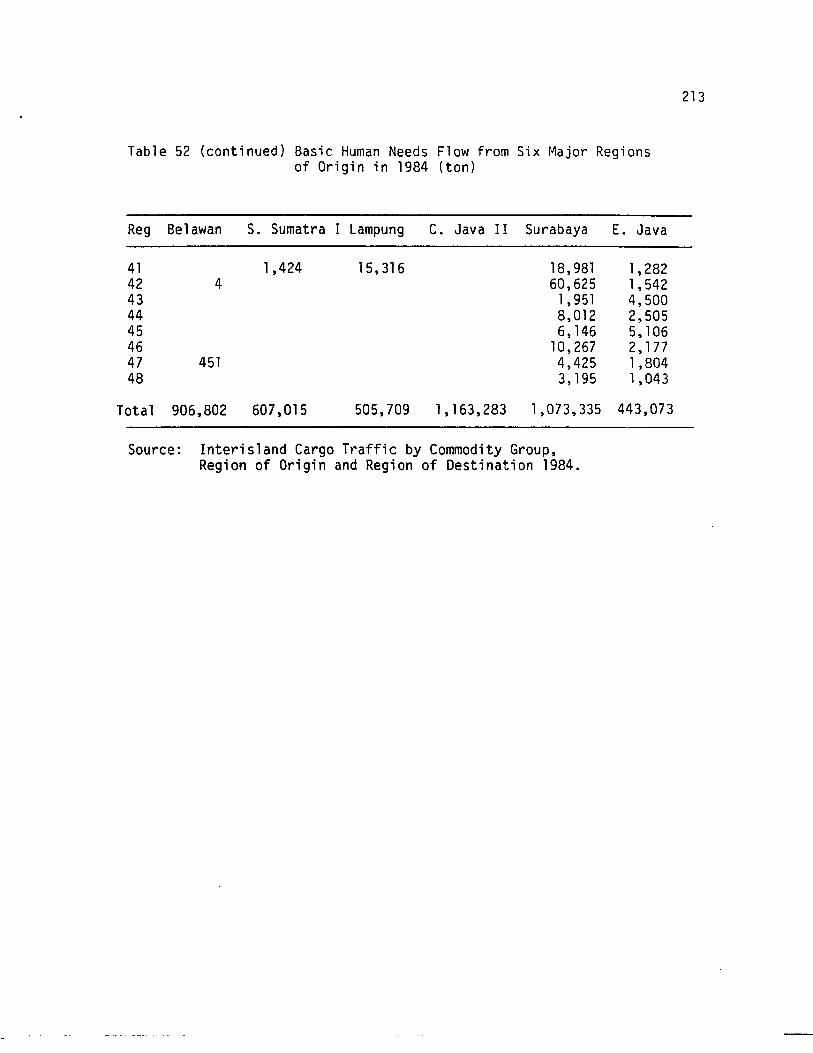
Table 52 (continued) Basic Human Needs Flow from Six Major Regionsof Origin in 1984 (ton)
Reg Belawan S. Sumatra Lampung C. Java II Surabaya E. Java
41 1,424 15,316 18,981 1,28242 4 60,625 1,54243 1,951 4,50044 8,012 2,50545 6,146 5,10646 10,267 2,17747 451 4,425 1,80448 3,195 1,043
Total 906,802 607,015 505,709 1,163,283 1,073,335 443,073
Source: Interisland Cargo Traffic by Commodity Group,Region of Origin and Region of Destination 1984.
213
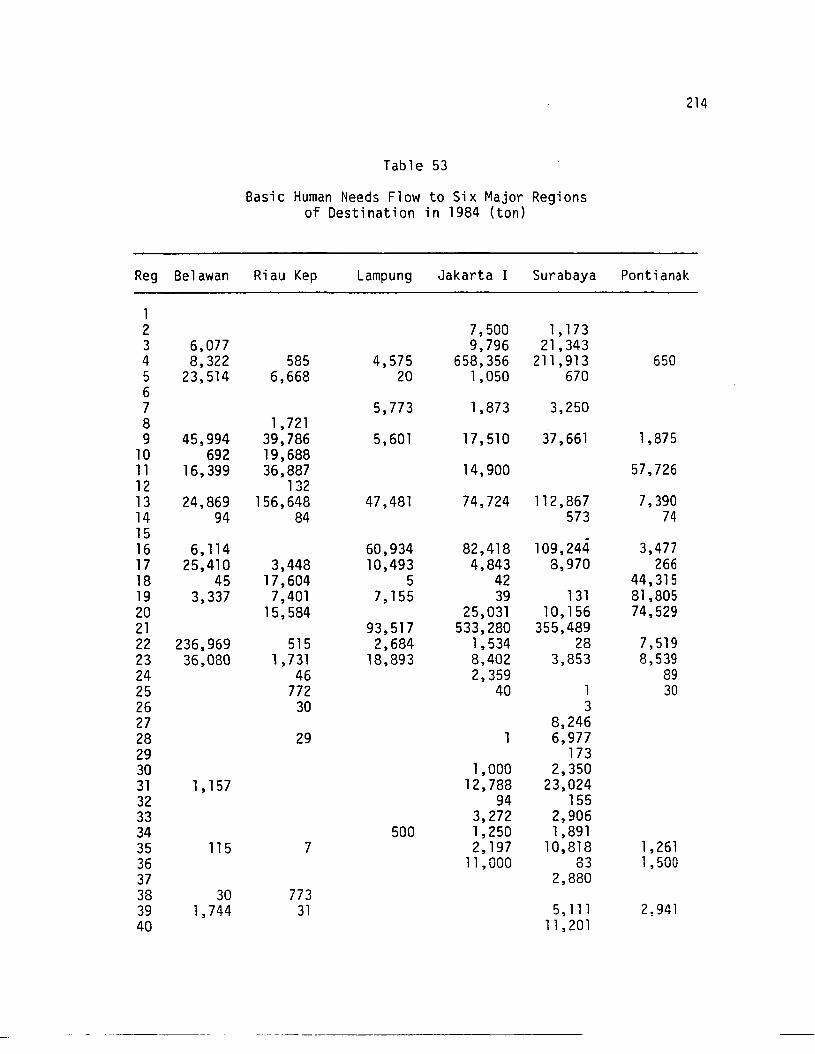
Table 53
Basic Human Needs Flow to Six Major Regionsof Destination in 1984 (ton)
214
Reg Belawan Riau Kep Lampung Jakarta I Surabaya Pontianak
12 7,500 1, 1733 6,077 9,796 21,3434 8,322 585 4,575 658,356 211,913 6505 23,514 6,668 20 1,050 67067 5,773 1,873 3,2508 1,7219 45,994 39,786 5,601 17,510 37,661 1,875
10 692 19,68811 16,399 36,887 14,900 57,72612 13213 24,869 156,648 47,481 74,724 112,867 7,39014 94 84 573 741516 6,114 60,934 82,418 109,244 3,47717 25,410 3,448 10,493 4,843 8,970 26618 45 17,604 5 42 44,31519 3,337 7,401 7,155 39 131 81,80520 15,584 25,031 10,156 74,52921 93,517 533,280 355,48922 236,969 515 2,684 1,534 28 7,51923 36,080 1,731 18,893 8,402 3,853 8,53924 46 2,359 8925 772 40 1 3026 30 327 8,24628 29 6,97729 17330 1,000 2,35031 1,157 12,788 23,02432 94 15533 3,272 2,90634 500 1,250 1,89135 115 7 2,197 10,818 1,26136 11, 000 83 1,50037 2,88038 30 77339 1,744 31 5, 111 2,94140 11 ,201
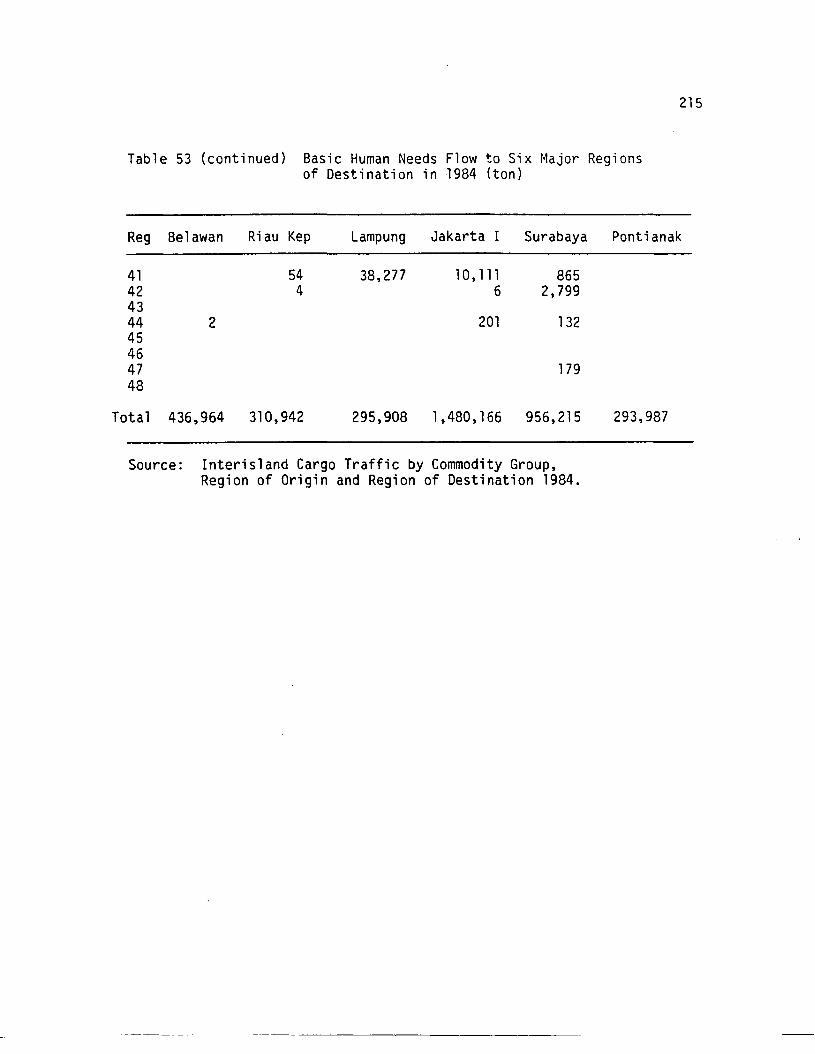
Table 53 (continued) Basic Human Needs Flow to Six Major Regionsof Destination in 1984 (ton)
215
Reg Be1awan Riau Kep Lampung Jakarta I Surabaya Pontianak
41 54 38,277 10,111 86542 4 6 2,7994344 2 201 132454647 17948
Total 436,964 310,942 295,908 1,480,166 956,215 293,987
Source: Interisland Cargo Traffic by Commodity Group,Region of Origin and Region of Destination 1984.
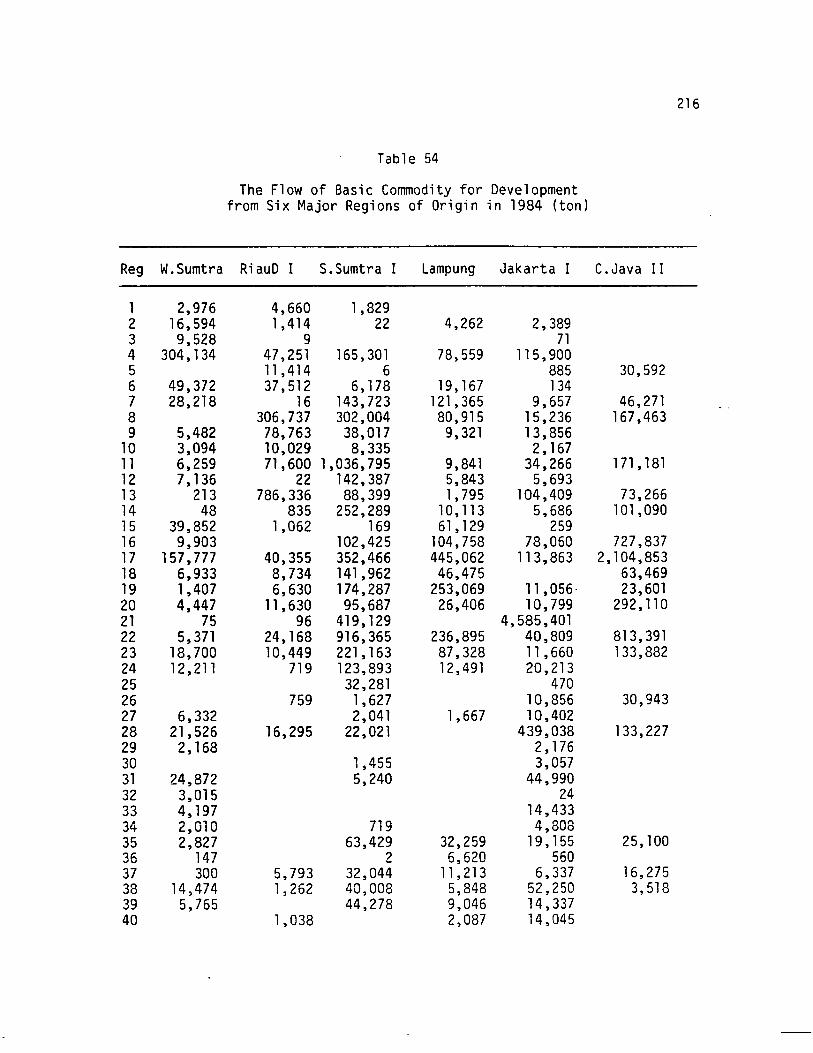
Table 54
The Flow of Basic Commodity for Developmentfrom Six Major Regions of Origin in 1984 (ton)
Reg W.Sumtra RiauD I S.Sumtra I Lampung Jakarta I C.Java II
1 2,976 4,660 1,8292 16,594 1,414 22 4,262 2,3893 9,528 9 714 304,134 47,251 165,301 78,559 115,9005 11 ,414 6 885 30,5926 49,372 37,512 6,178 19,167 1347 28,218 16 143,723 121,365 9,657 46,2718 306,737 302,004 80,915 15,236 167,4639 5,482 78,763 38,017 9,321 13,856
10 3,094 10,029 8,335 2,16711 6,259 71,600 1,036,795 9,841 34,266 171,18112 7,136 22 142,387 5,843 5,69313 213 786,336 88,399 1,795 104,409 73,26614 48 835 252,289 10,113 5,686 101,09015 39,852 1,062 169 61,129 25916 9,903 102,425 104,758 78,060 727,83717 157,777 40,355 352,466 445,062 113,863 2,104,85318 6,933 8,734 141,962 46,475 63,46919 1,407 6,630 174,287 253,069 11 ,056· 23,60120 4,447 11,630 95,687 26,406 10,799 292,11021 75 96 419,129 4,585,40122 5,371 24,168 916,365 236,895 40,809 813,39123 18,700 10,449 221,163 87,328 11 ,660 133,88224 12,211 719 123,893 12,491 20,21325 32,281 47026 759 1,627 10,856 30,94327 6,332 2,041 1,667 10,40228 21,526 16,295 22,021 439,038 133,22729 2,168 2,17630 1,455 3,05731 24,872 5,240 44,99032 3,015 2433 4,197 14,43334 2,010 719 4,80835 2,827 63,429 32,259 19, 155 25,10036 147 2 6,620 56037 300 5,793 32,044 11,213 6,337 16,27538 14,474 1,262 40,008 5,848 52,250 3,51839 5,765 44,278 9,046 14,33740 1,038 2,087 14,045
216
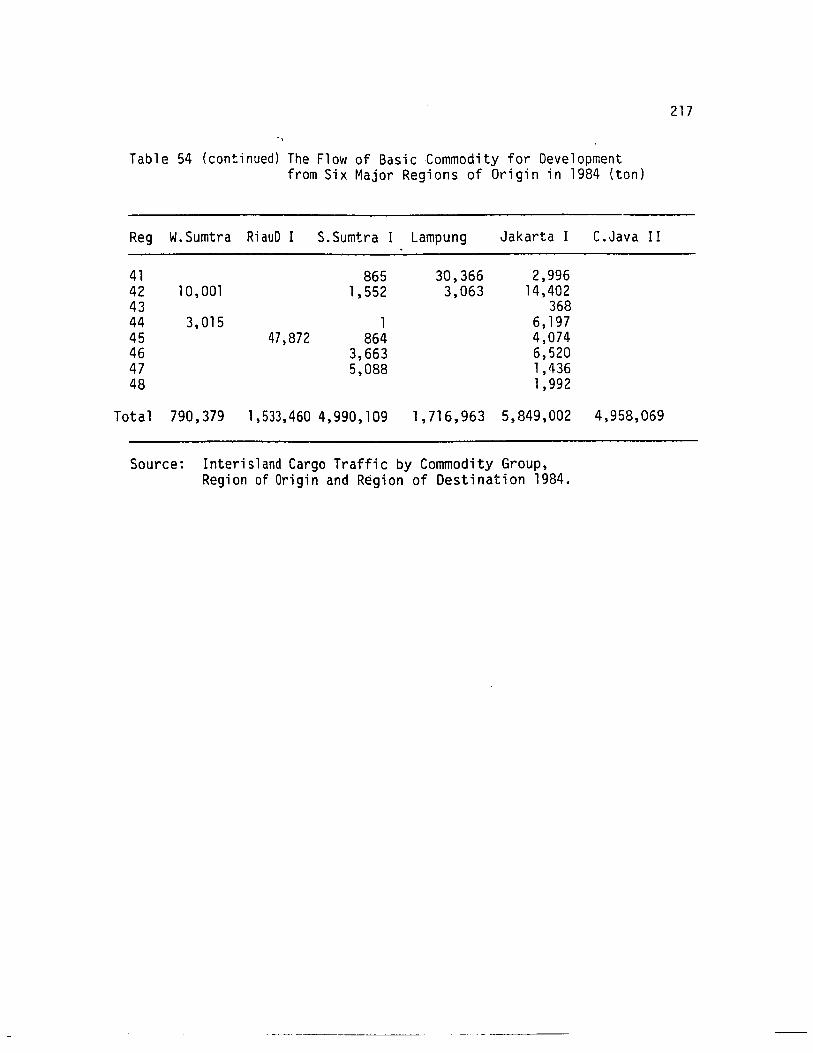
Table 54 (continued) The Flow of Basic Commodity for Developmentfrom Six Major Regions of Origin in 1984 (ton)
Reg W.Sumtra RiauD I S.Sumtra I Lampung Jakarta I C.Java II
41 865 30,366 2,99642 10,001 1,552 3,063 14,40243 36844 3,015 1 6,19745 47,872 864 4,07446 3,663 6,52047 5,088 1,43648 1,992
Total 790,379 1,533,460 4,990,109 1,716,963 5,849,002 4,958,069
Source: Interisland Cargo Traffic by Commodity Group,Region of Origin and Region of Destination 1984.
217
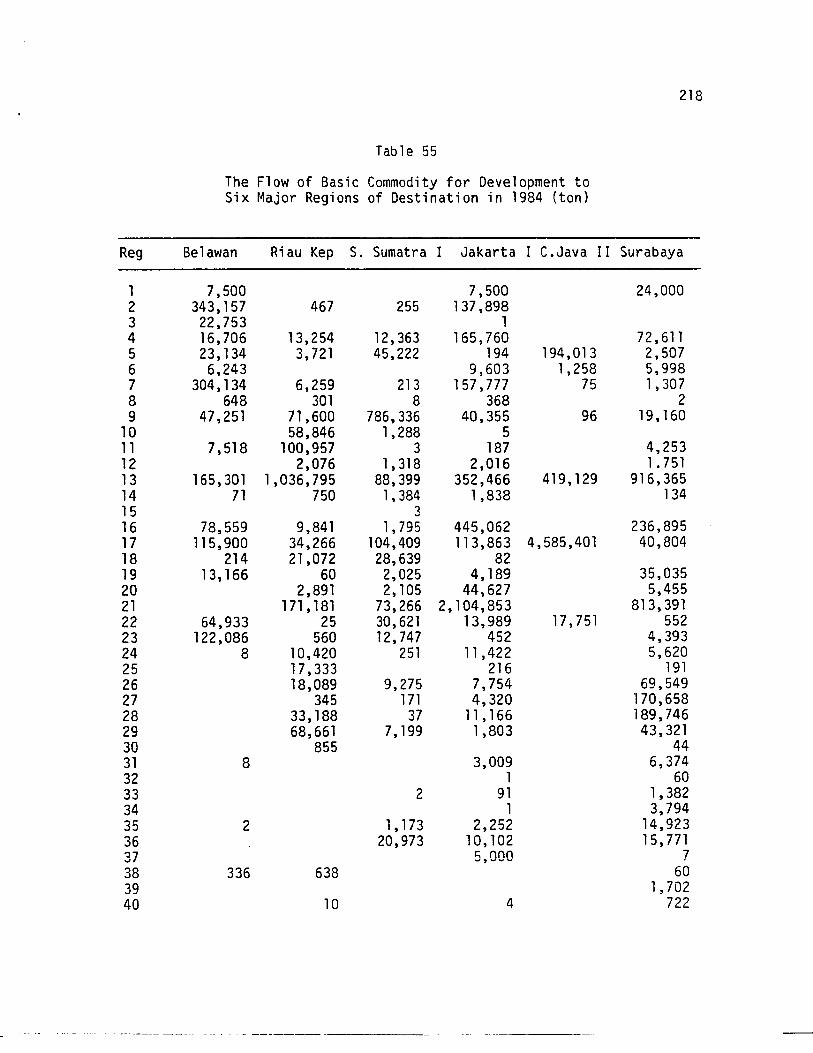
218
Table 55
The Flow of Basic Commodity for Development toSix Major Regions of Destination in 1984 (ton)
Reg Be1awan Riau Kep S. Sumatra I Jakarta I C.Java II Surabaya
1 7,500 7,500 24,0002 343,157 467 255 137,8983 22,753 14 16,706 13,254 12,363 165,760 72,6115 23,134 3,721 45,222 194 194,013 2,5076 6,243 9,603 1,258 5,9987 304,134 6,259 213 157,777 75 1,3078 648 301 8 368 29 47,251 71,600 786,336 40,355 96 19, 160
10 58,846 1,288 511 7,518 100,957 3 187 4,25312 2,076 1,318 2,016 1.75113 165,301 1,036,795 88,399 352,466 419,129 916,36514 71 750 1,384 1,838 13415 316 78,559 9,841 1,795 445,062 236,89517 115,900 34,266 104,409 113,863 4,585,401 40,80418 214 21,072 28,639 8219 13, 166 60 2,025 4,189 35,03520 2,891 2, 105 44,627 5,45521 171,181 73,266 2,104,853 813,39122 64,933 25 30,621 13,989 17,751 55223 122,086 560 12,747 452 4,39324 8 10,420 251 11 ,422 5,62025 17,333 216 19126 18,089 9,275 7,754 69,54927 345 171 4,320 170,65828 33, 188 37 11 , 166 189,74629 68,661 7,199 1,803 43,32130 855 4431 8 3,009 6,37432 1 6033 2 91 1,38234 1 3,79435 2 1,173 2,252 14,92336 20,973 10,102 15,77137 5,000 738 336 638 6039 1,70240 10 4 722
- -------- --- --- - -- - ------- -----
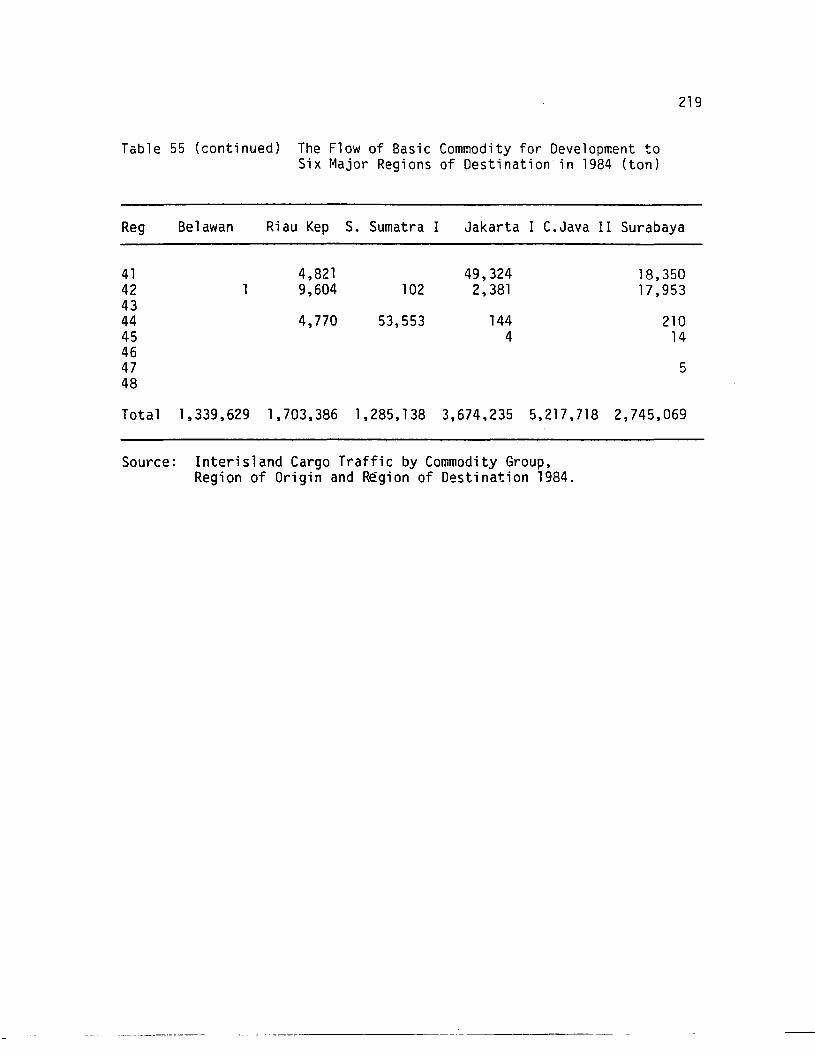
219
Table 55 (continued) The Flow of Basic Commodity for Development toSix Major Regions of Destination in 1984 (ton)
Reg Belawan Riau Kep S. Sumatra I Jakarta I C.Java II Surabaya
5
21014
18,35017,953
49,3242,381
1444
102
53,553
4,8219,604
4,770
4142434445464748
Total 1,339,629 1,703,386 1,285,138 3,674,235 5,217,718 2,745,069
Source: Interisland Cargo Traffic by Commodity Group,Region of Origin and Region of Destination 1984.
--------
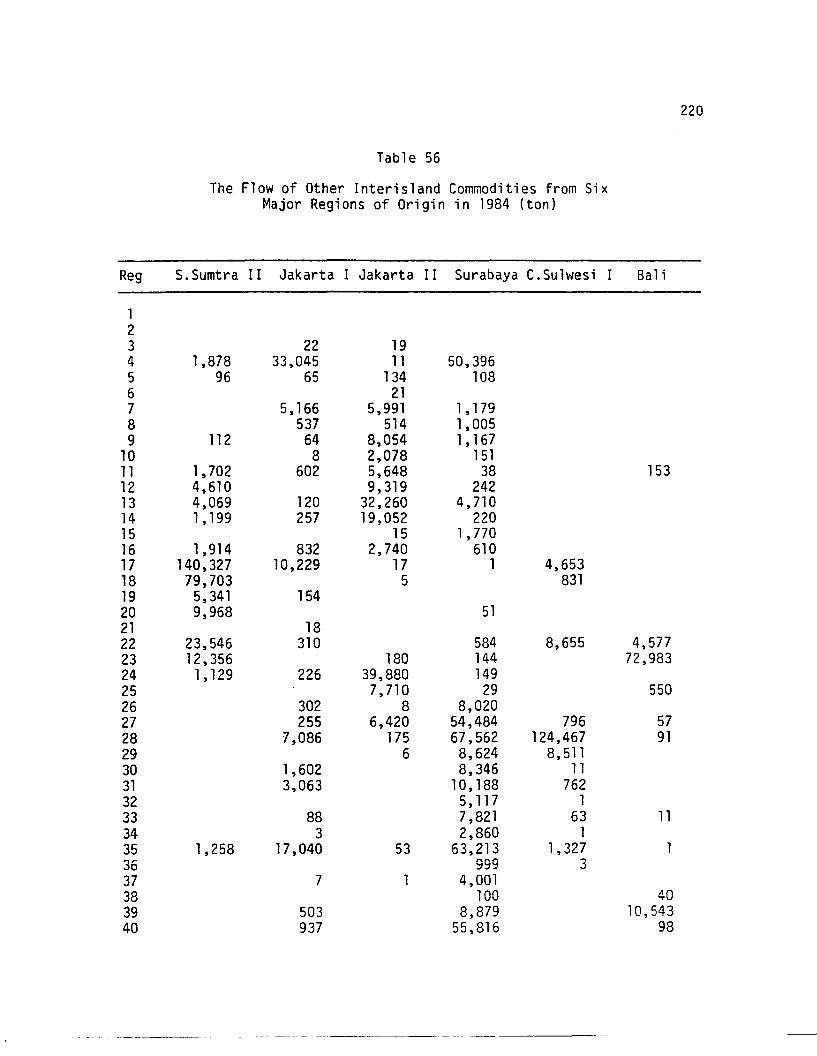
Table 56
The Flow of Other Interisland Commodities from SixMajor Regions of Origin in 1984 (ton)
Reg S.Sumtra II Jakarta I Jakarta II Surabaya C.Sulwesi I Bali
123 22 194 1,878 33,045 11 50,3965 96 65 134 1086 217 5,166 5,991 1, 1798 537 514 1,0059 112 64 8,054 1, 167
10 8 2,078 15111 1,702 602 5,648 38 15312 4,610 9,319 24213 4,069 120 32,260 4,71014 1,199 257 19,052 22015 15 1,77016 1,914 832 2,740 61017 140,327 10,229 17 1 4,65318 79,703 5 83119 5,341 15420 9,968 5121 1822 23,546 310 584 8,655 4,57723 12,356 180 144 72,98324 1,129 226 39,880 14925 7,710 29 55026 302 8 8,02027 255 6,420 54,484 796 5728 7,086 175 67,562 124,467 9129 6 8,624 8,51130 1,602 8,346 1131 3,063 10, 188 76232 5,117 133 88 7,821 63 1134 3 2,860 135 1,258 17,040 53 63,213 1,32736 999 337 7 4,00138 100 4039 503 8,879 10,54340 937 55,816 98
--- ------------- ----~----
220
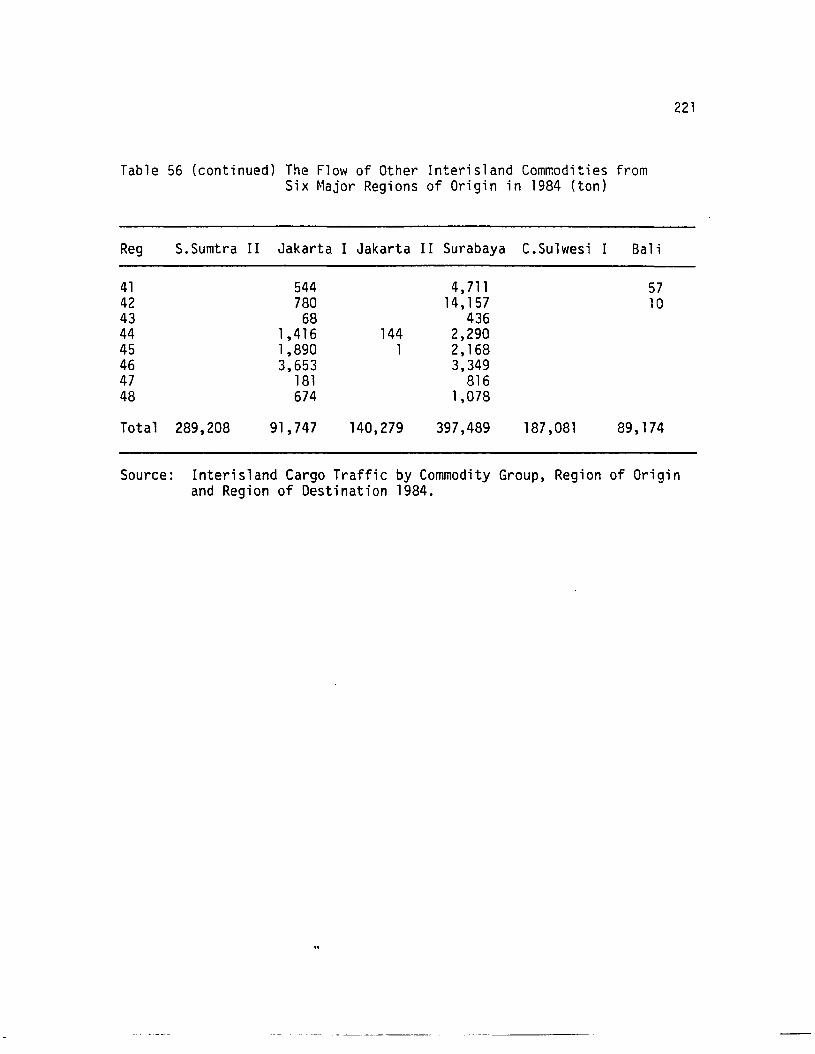
Table 56 (continued) The Flow of Other Interisland Com~odities fromSix Major Regions of Origin in 1984 (ton)
221
Reg S.Sumtra II Jakarta I Jakarta II Surabaya C.Sulwesi I Bali
41 544 4,711 5742 780 14,157 1043 68 43644 1,416 144 2,29045 1,890 1 2,16846 3,653 3,34947 181 81648 674 1,078
Total 289,208 91,747 140,279 397,489 187,081 89,174
Source: Interisland Cargo Traffic by Commodity Group, Region of Originand Region of Destination 1984.
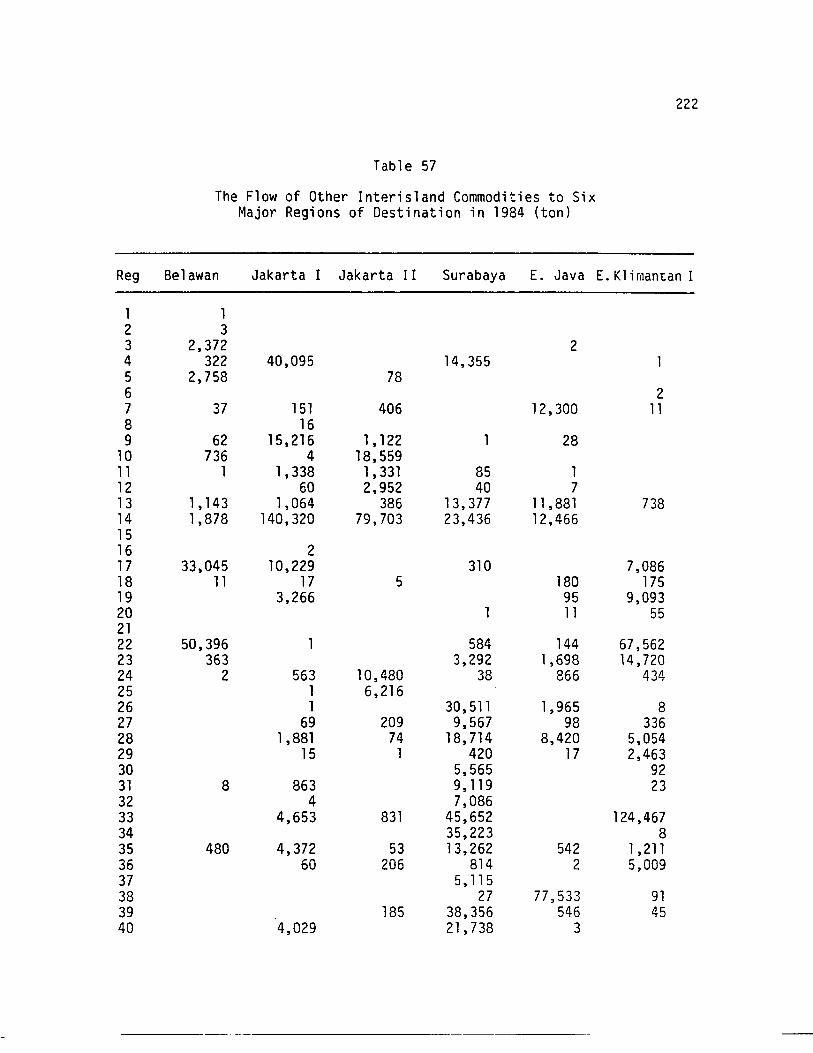
Table 57
The Flow of Other Interisland Commodities to SixMajor Regions of Destination in 1984 (ton)
222
Reg Belawan Jakarta I Jakarta II Surabaya L Java LKlimantanI
1 12 33 2,372 24 322 40,095 14,3555 2,758 786 27 37 151 406 12,300 118 169 62 15,216 1,122 28
10 736 4 18,55911 1 1,338 1,331 85 112 60 2,952 40 713 1, 143 1,064 386 13,377 11 ,881 73814 1,878 140,320 79,703 23,436 12,4661516 217 33,045 10,229 310 7,08618 11 17 5 180 17519 3,266 95 9,09320 11 552122 50,396 584 144 67,56223 363 3,292 1,698 14,72024 2 563 10,480 38 866 43425 1 6,21626 1 30,511 1,965 827 69 209 9,567 98 33628 1,881 74 18,714 8,420 5,05429 15 1 420 17 2,46330 5,565 9231 8 863 9,119 2332 4 7,08633 4,653 831 45,652 124,46734 35,223 835 480 4,372 53 13,262 542 1,21136 60 206 814 2 5,00937 5,11538 27 77,533 9139 185 38,356 546 4540 4,029 21,738 3
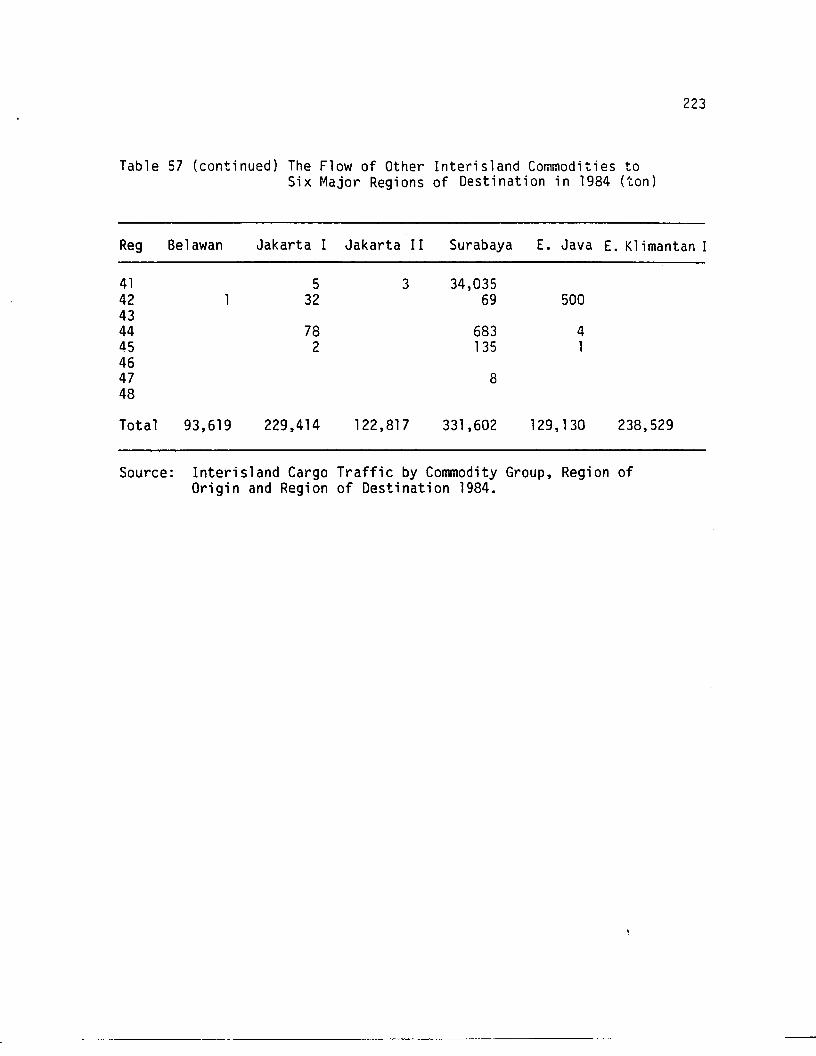
Table 57 (continued) The Flow of Other Interisland Commodities toSix Major Regions of Destination in 1984 (ton)
223
Reg Belawan Jakarta I Jakarta II Surabaya E. Java E. Klimantan I
41 5 3 34,03542 32 69 5004344 78 683 445 2 135 14647 848
Total 93,619 229,414 122,817 331,602 129,130 238,529
Source: Interisland Cargo Traffic by Commodity Group, Region ofOrigin and Region of Destination 1984.
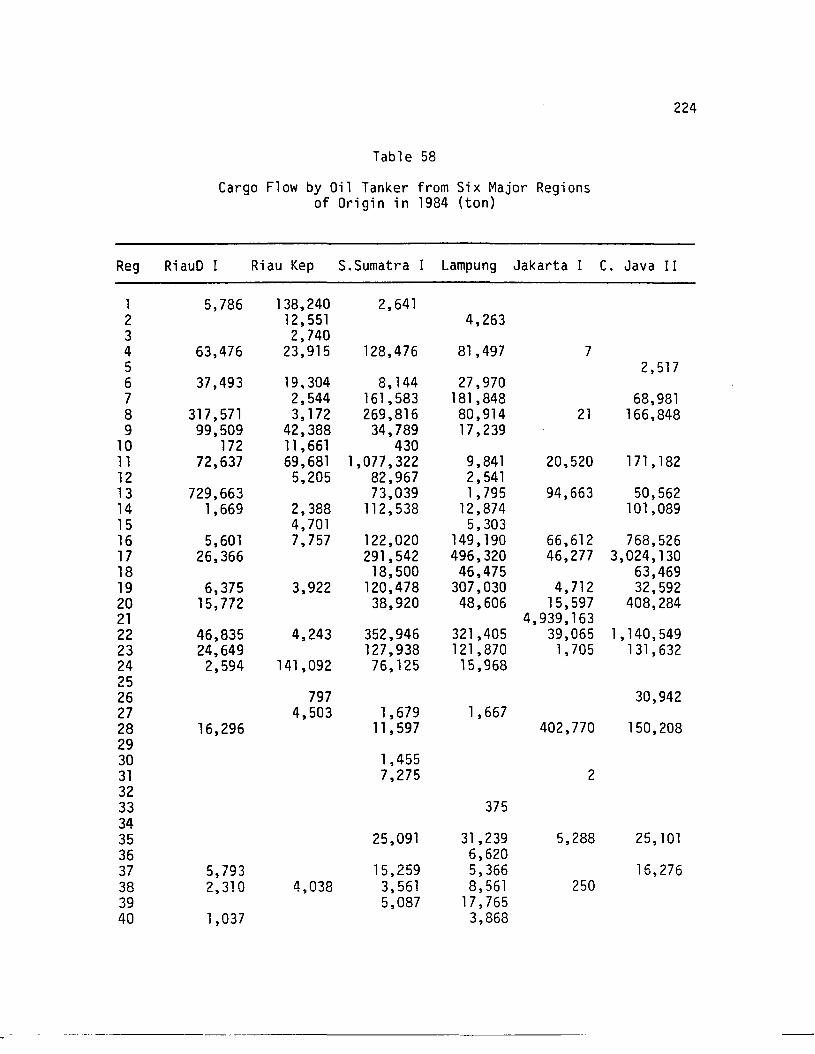
Table 58
Cargo Flow by Oil Tanker from Six Major Regionsof Origin in 1984 (ton)
224
Reg RiauD I Riau Kep S.Sumatra I Lampung Jakarta I C. Java II
1 5,786 138,240 2,6412 12,551 4,2633 2,7404 63,476 23,915 128,476 81,497 75 2,5176 37,493 19.304 8,144 27,9707 2,544 161,583 181,848 68,9818 317,571 3,172 269,816 80,914 21 166,8489 99,509 42,388 34,789 17,239
10 172 11 ,661 43011 72,637 69,681 1,077,322 9,841 20,520 171 , 18212 5,205 82,967 2,54113 729,663 73,039 1,795 94,663 50,56214 1,669 2,388 112,538 12,874 101,08915 4,701 5,30316 5,601 7,757 122,020 149, 190 66,612 768,52617 26,366 291,542 496,320 46,277 3,024,13018 18,500 46,475 63,46919 6,375 3,922 120,478 307,030 4,712 32,59220 15,772 38,920 48,606 15,597 408,28421 4,939,16322 46,835 4,243 352,946 321,405 39,065 1,140,54923 24,649 127,938 121,870 1,705 131,63224 2,594 141,092 76,125 15,9682526 797 30,94227 4,503 1,679 1,66728 16,296 11 ,597 402,770 150,2082930 1,45531 7,275 23233 3753435 25,091 31,239 5,288 25, 10136 6,62037 5,793 15,259 5,366 16,27638 2,310 4,038 3,561 8,561 25039 5,087 17,76540 1,037 3,868
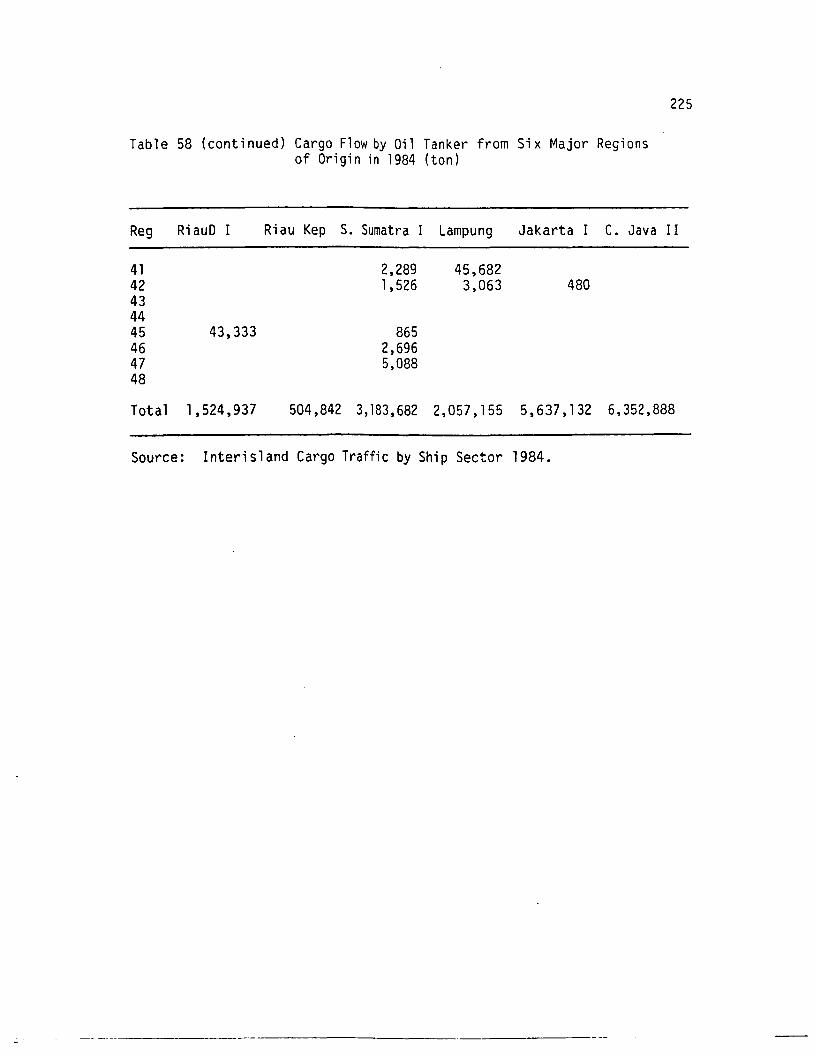
Table 58 (continued) Cargo Flow by Oil Tanker from Six Major Regionsof Origin in 1984 (ton)
225
Reg RiauD I Riau Kep S. Sumatra I Lampung Jakarta I C. Java II
41 2,289 45,68242 1,526 3,063 480434445 43,333 86546 2,69647 5,08848
Total 1,524,937 504,842 3,183,682 2,057,155 5,637,132 6,352,888
Source: Interisland Cargo Traffic by Ship Sector 1984.
- - --- ----------
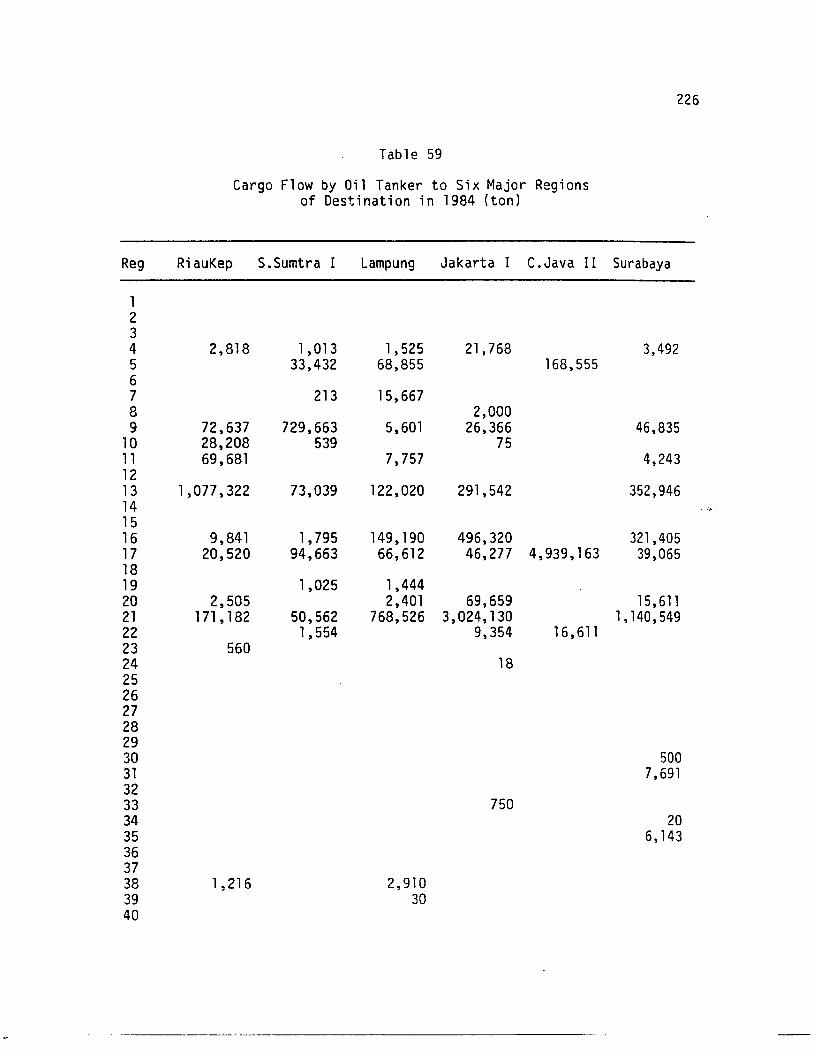
Table 59
Cargo Flow by Oil Tanker to Six Major Regionsof Destination in 1984 (ton)
226
Reg RiauKep S.Sumtra I Lampung Jakarta I C.Java II Surabaya
1234 2,818 1,013 1,525 21,768 3,4925 33,432 68,855 168,55567 213 15,6678 2,0009 72,637 729,663 5,601 26,366 46,835
10 28,208 539 7511 69,681 7,757 4,2431213 1,077,322 73,039 122,020 291,542 352,94614 • i,..'
1516 9,841 1,795 149,190 496,320 321,40517 20,520 94,663 66,612 46,277 4,939,163 39,0651819 1,025 1,44420 2,505 2,401 69,659 15,61121 171 , 182 50,562 768,526 3,024,130 1,140,54922 1,554 9,354 16,61123 56024 18252627282930 50031 7,6913233 75034 2035 6,143363738 1,216 2,91039 3040
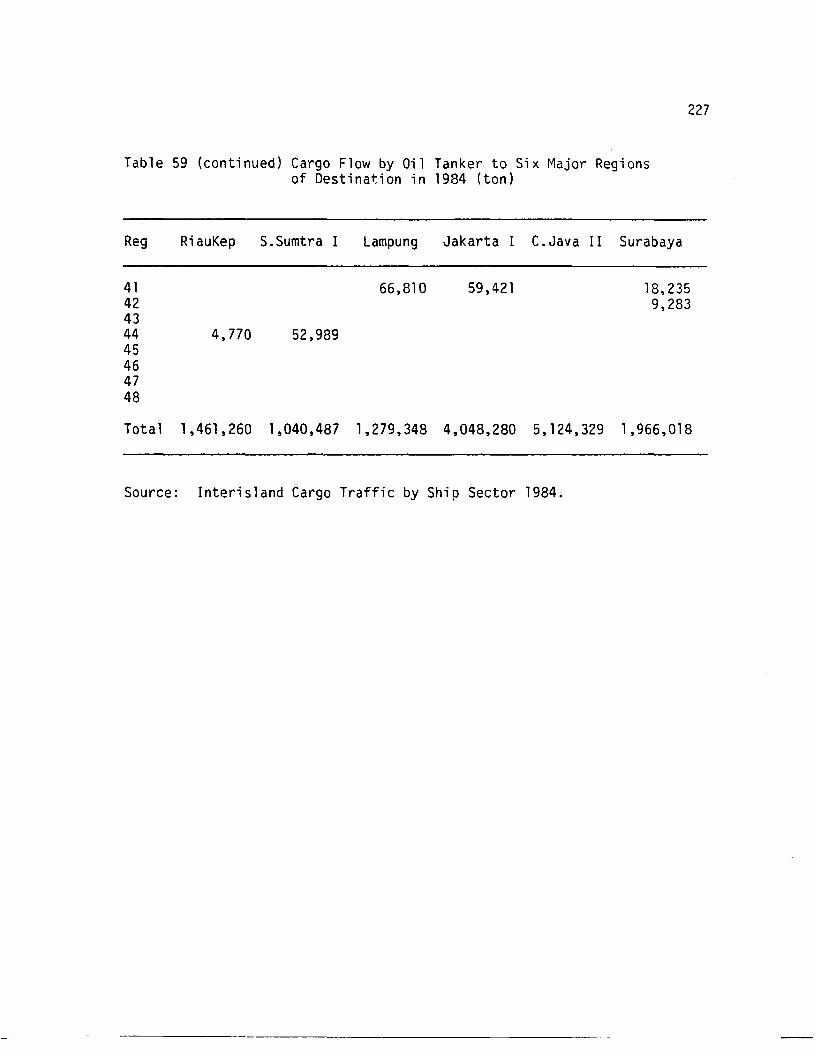
227
Table 59 (continued) Cargo Flow by Oil Tanker to Six Major Regionsof Destination in 1984 (ton)
Reg RiauKep S.Sumtra I Lampung Jakarta I C.Java II Surabaya
18,2359,283
59,42166,810
52,9894,770
4142434445464748
Total 1,461,260 1,040,487 1,279,348 4,048,280 5,124,329 1,966,018
Source: Interisland Cargo Traffic by Ship Sector 1984.
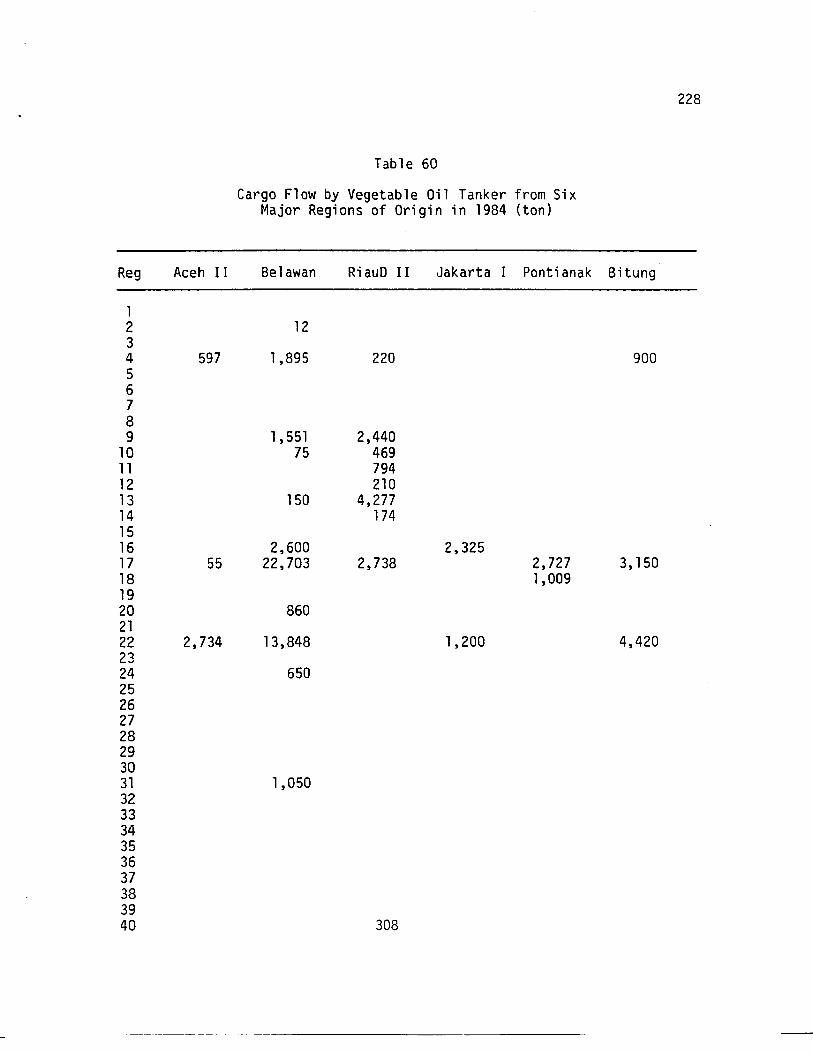
Table 60
Cargo Flow by Vegetable Oil Tanker from SixMajor Regions of Origin in 1984 (ton)
Reg Aceh II Belawan Ri auD II Jakarta I Pontianak Bitung
12 1234 597 1,895 220 90056789 1,551 2,440
10 75 46911 79412 21013 150 4,27714 1741516 2,600 2,32517 55 22,703 2,738 2,727 3,15018 1,0091920 8602122 2,734 13,848 1,200 4,4202324 65025262728293031 1,050323334353637383940 308
228
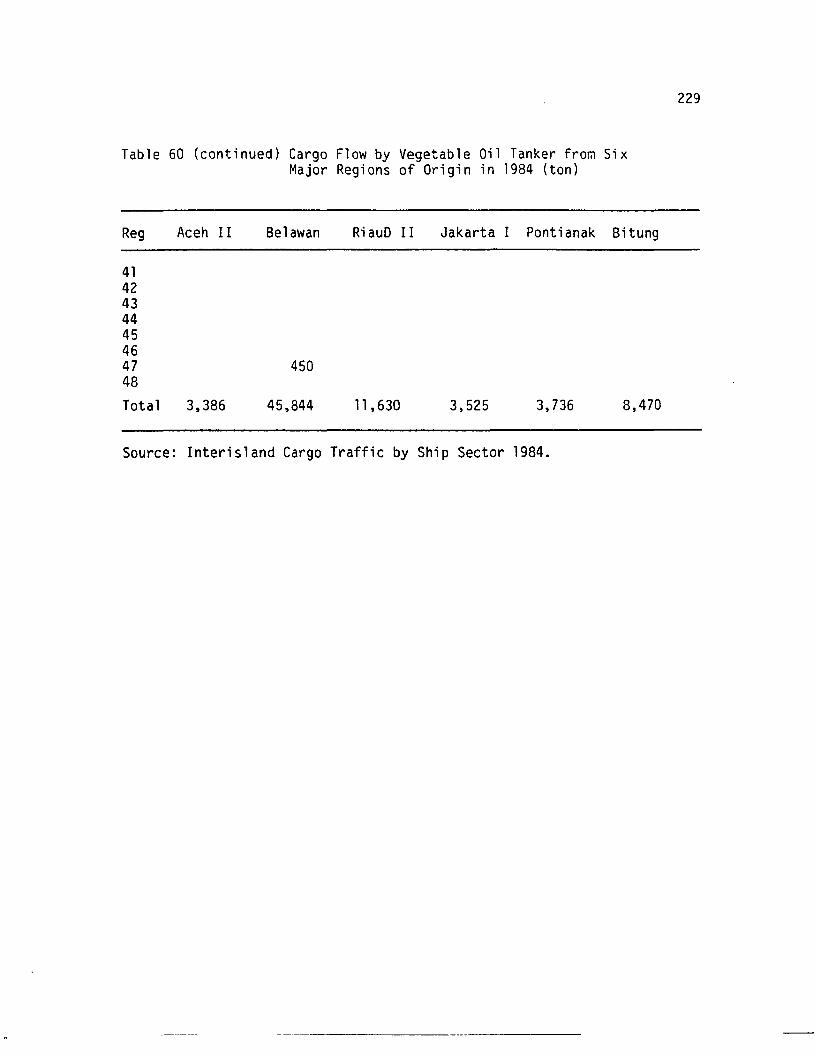
Table 60 (continued) Cargo Flow by Vegetable Oil Tanker fro~ SixMajor Regions of Origin in 1984 (ton)
Reg Aceh II Belawan Ri auD II Jakarta I Pontianak Bitung
41424344454647 45048Total 3,386 45,844 11 ,630 3,525 3,736 8,470
Source: Interisland Cargo Traffic by Ship Sector 1984.
229
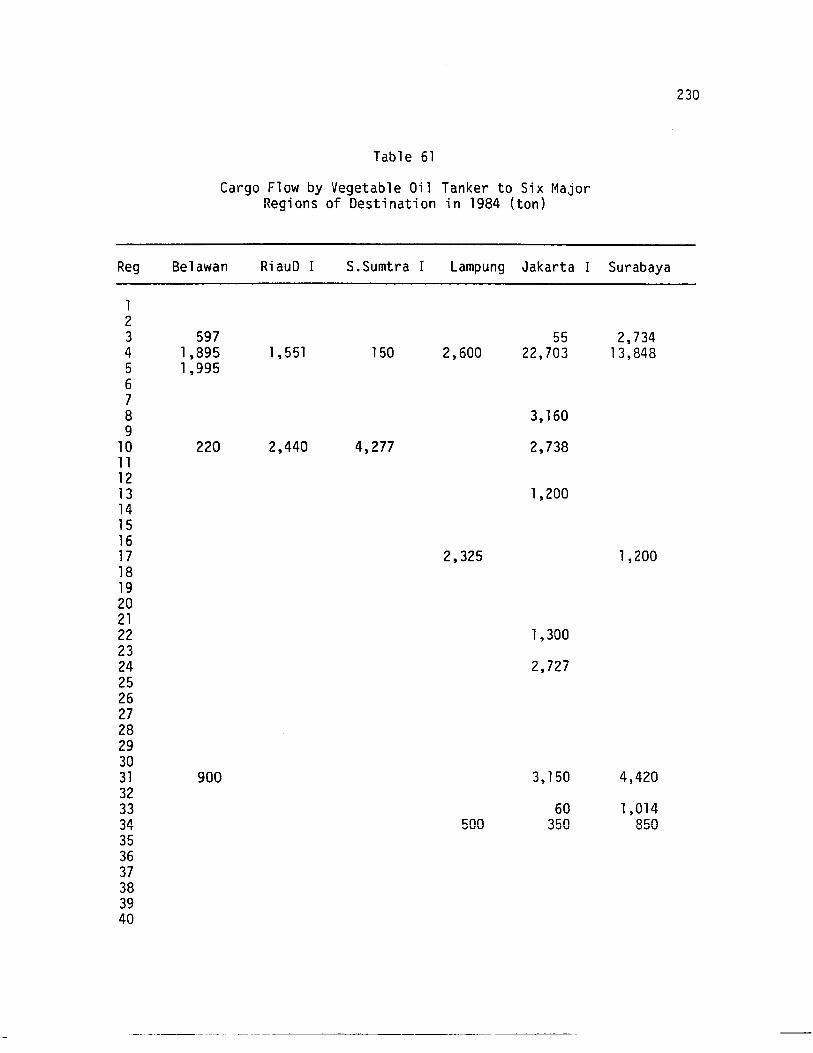
Table 61
Cargo Flow by Vegetable Oil Tanker to Six MajorRegions of Destination in 1984 (ton)
Reg Belawan RiauD I S.Sumtra I Lampung Jakarta I Surabaya
123 597 55 2,7344 1,895 1,551 150 2,600 22,703 13,8485 1,995678 3,1609
10 220 2,440 4,277 2,738111213 1,20014151617 2,325 1,2001819202122 1,3002324 2,72725262728293031 900 3,150 4,4203233 60 1,01434 500 350 850353637383940
230
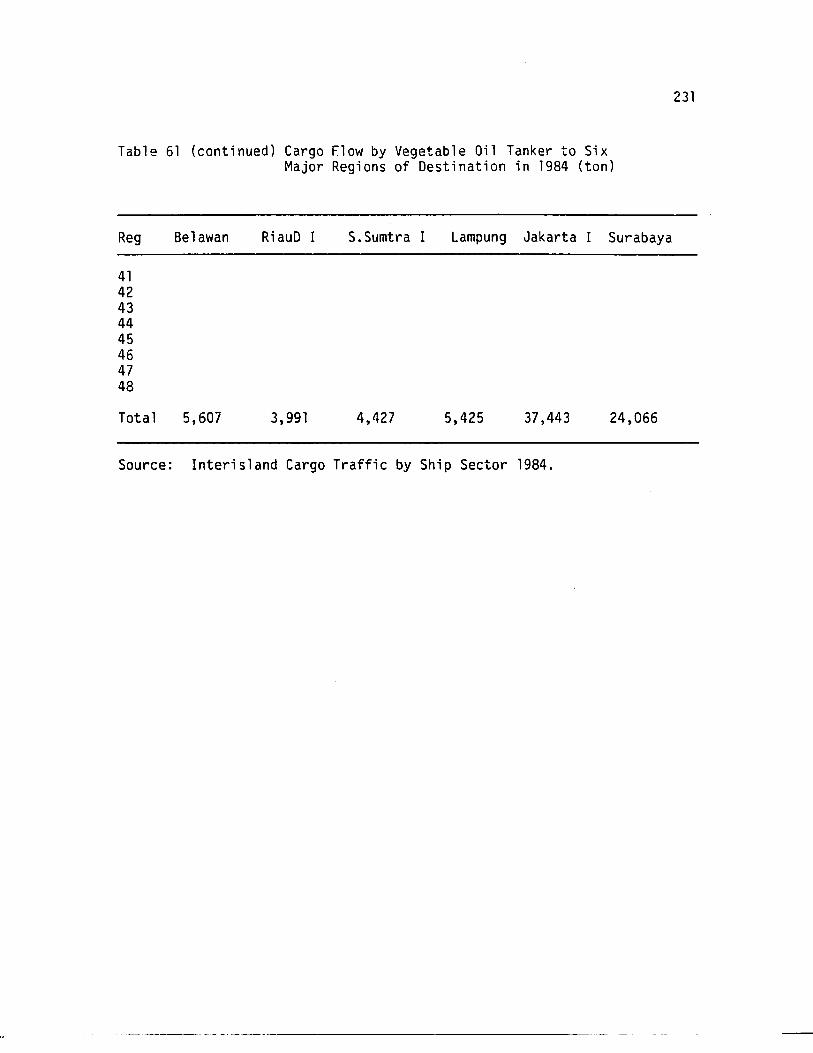
Table 61 (continued) Cargo Flow by Vegetable Oil Tanker to SixMajor Regions of Destination in 1984 (ton)
Reg Belawan RiauD I S.Sumtra I Lampung Jakarta I Surabaya
4142434445464748
Total 5,607 3,991 4,427 5,425 37,443 24,066
Source: Interisland Cargo Traffic by Ship Sector 1984.
231
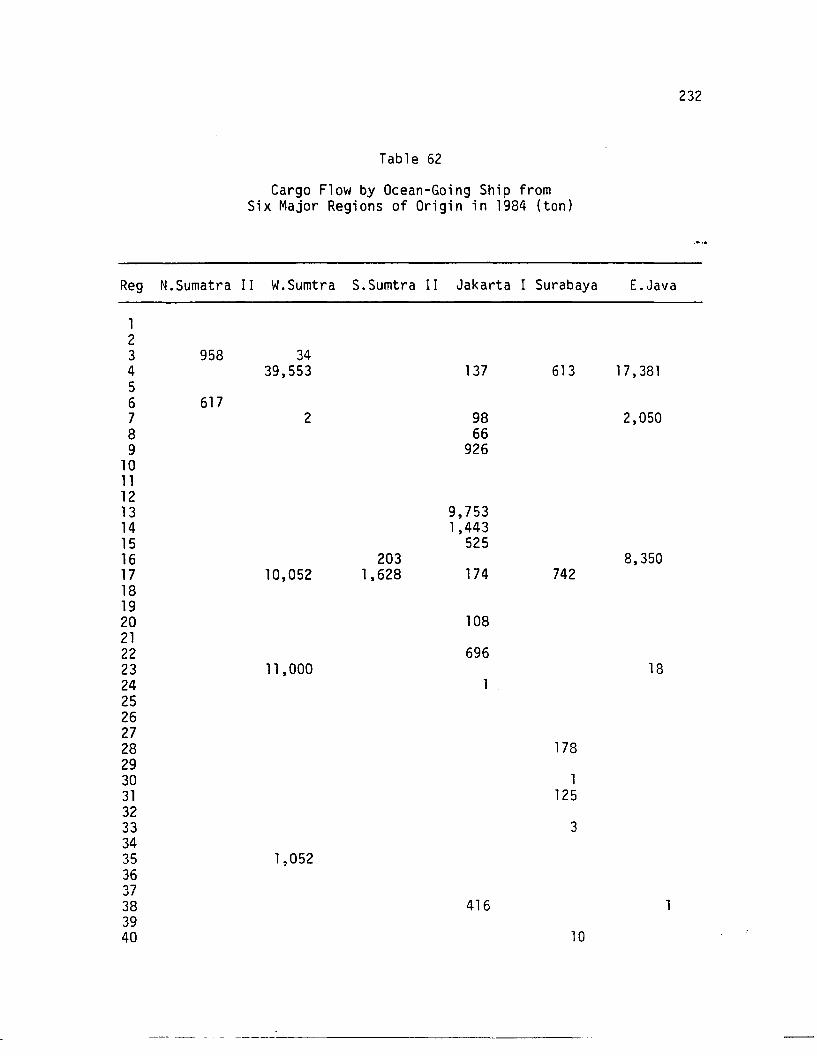
Table 62
Cargo Flow by Ocean-Going Ship fromSix Major Regions of Origin in 1984 (ton)
Reg N. Sumatra II W.Sumtra S.Sumtra II Jakarta I Surabaya E.Java
123 958 344 39,553 137 613 17,38156 6177 2 98 2,0508 669 926
10111213 9,75314 1,44315 52516 203 8,35017 10,052 1,628 174 742181920 1082122 69623 11 ,000 182425262728 1782930 131 1253233 33435 1,052363738 4163940 10
232
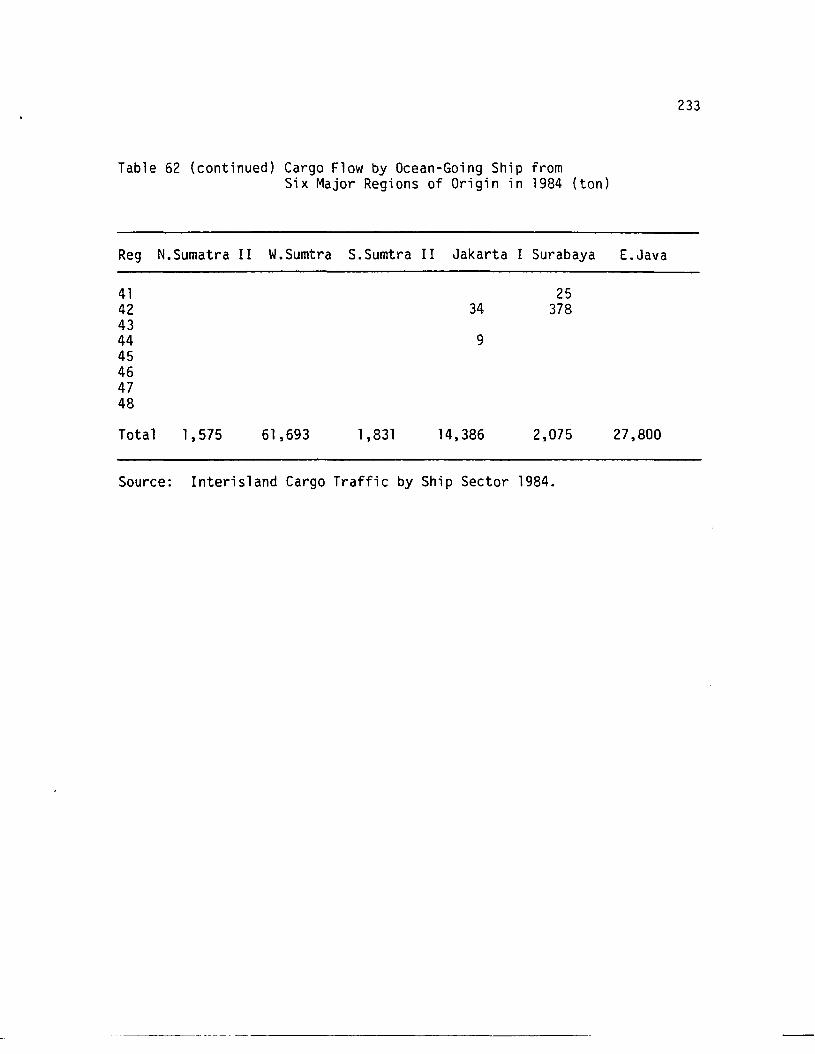
Table 62 (continued) Cargo Flow by Ocean-Going Ship fromSix Major Regions of Origin in 1984 (ton)
Reg N.Sumatra II W.Sumtra S.Sumtra II Jakarta I Surabaya E.Java
41 2542 34 3784344 945464748
Total 1,575 61,693 1,831 14,386 2,075 27,800
Source: Interisland Cargo Traffic by Ship Sector 1984.
----._---~ ~
233
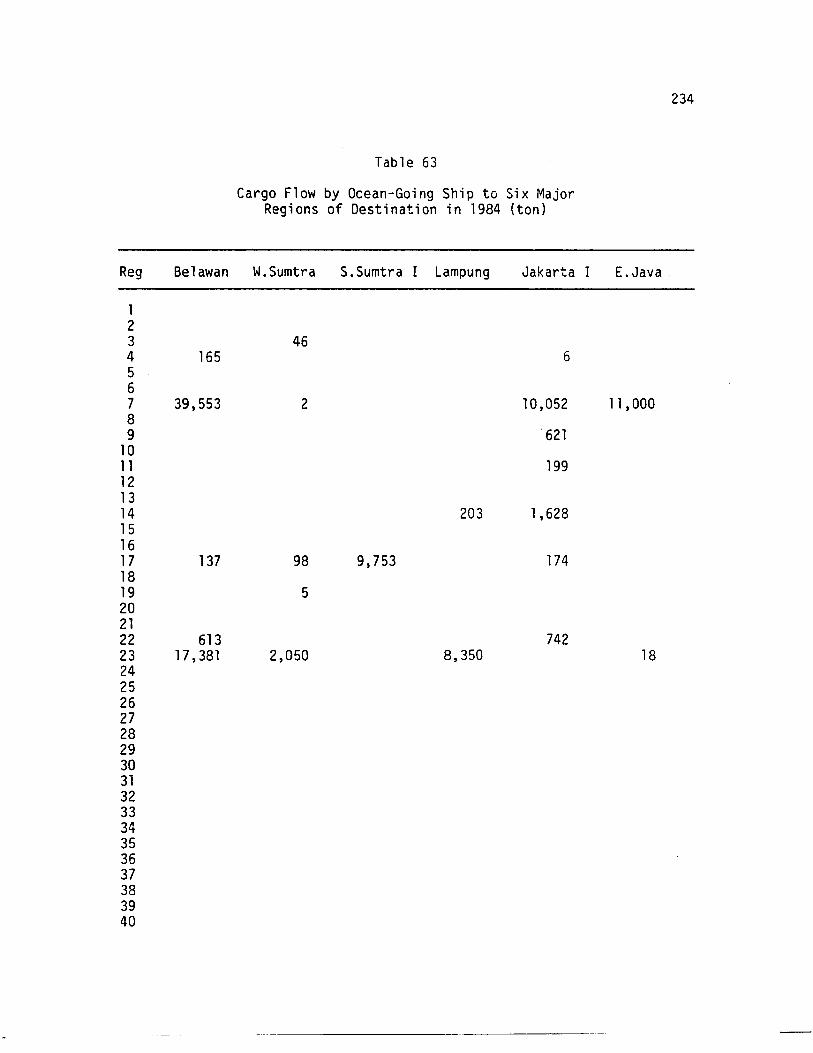
Table 63
Cargo Flow by Ocean-Going Ship to Six MajorRegions of Destination in 1984 (ton)
Reg Belawan W.Sumtra S.Sumtra I Lampung Jakarta I E.Java.
123 464 165 6567 39,553 2 10,052 11,00089 621
1011 199121314 203 1,628151617 137 98 9,753 1741819 5202122 613 74223 17,381 2,050 8,350 182425262728293031323334353637383940
234
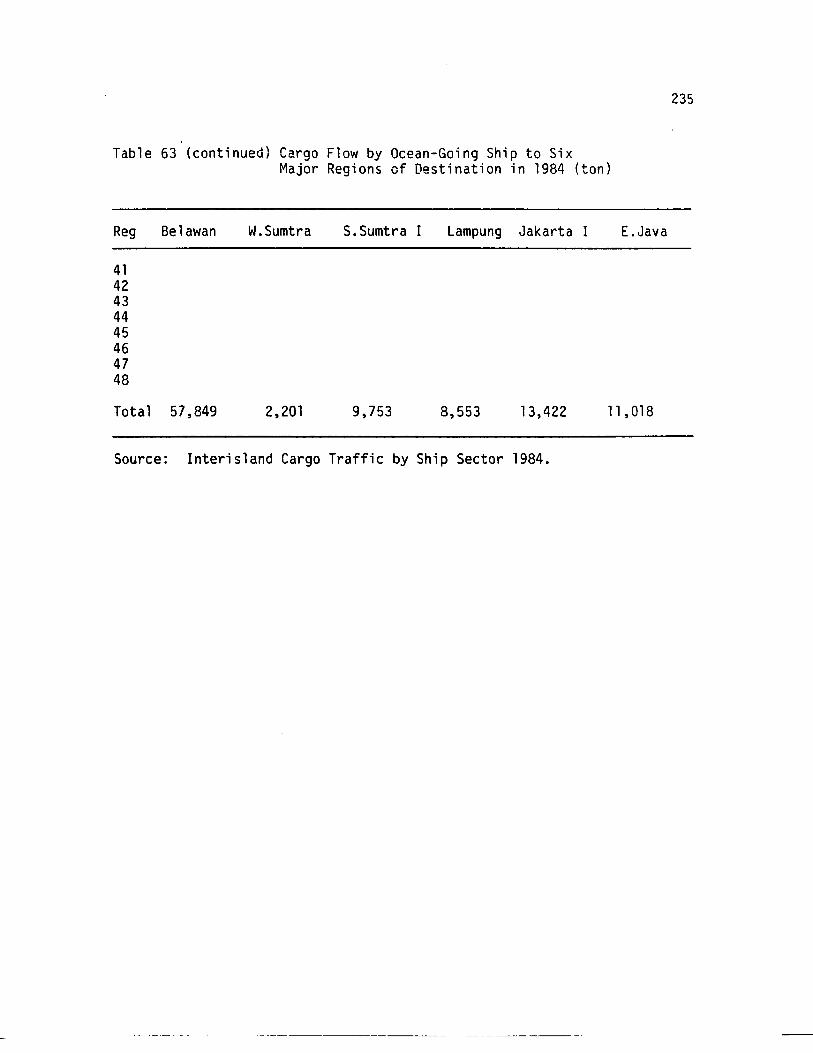
Table 63 (continued) Cargo Flow by Ocean-Going Ship to SixMajor Regions of Destination in 1984 (ton)
Reg Belawan W.Sumtra S.Sumtra I Lampung Jakarta I E.Java
4142434445464748
Total 57,849 2,201 9,753 8,553 13,422 11 ,018
Source: Interisland Cargo Traffic by Ship Sector 1984.
- ---------
235
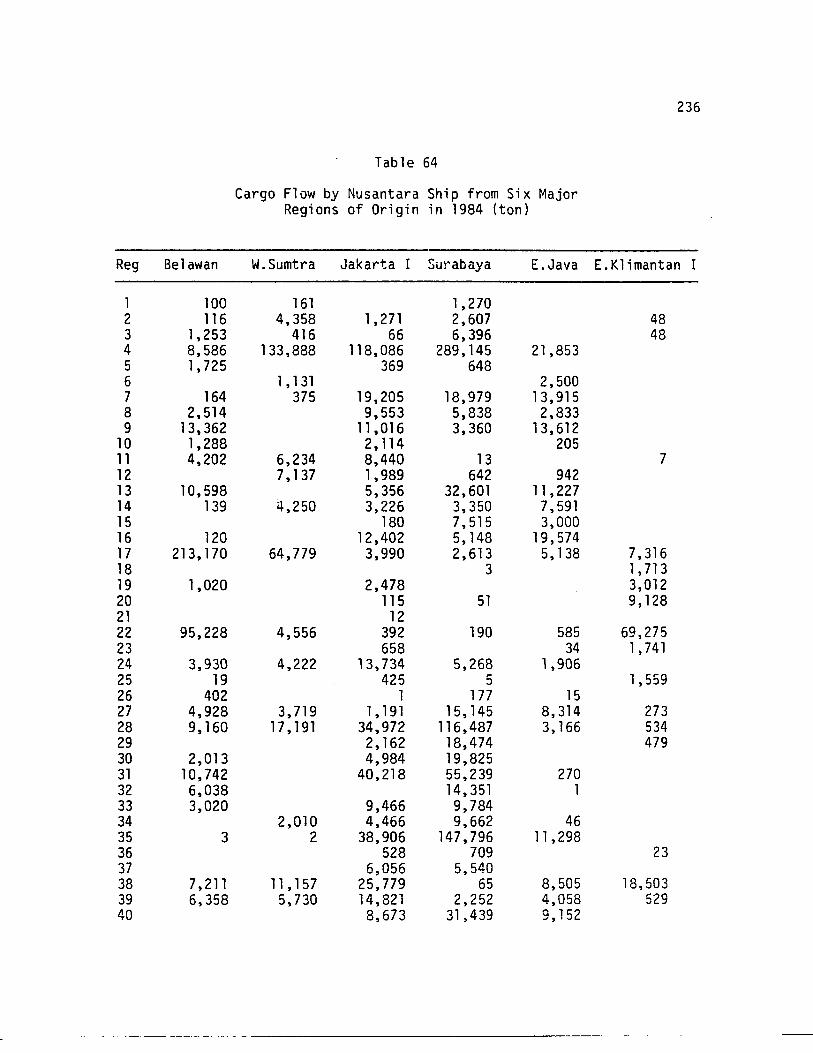
Table 64
Cargo Flow by Nusantara Ship from Six MajorRegions of Origin in 1984 (ton)
236
Reg Be1awan W.Sumtra Jakarta I Surabeya E.Java E.K1imantan I
1 100 161 1,2702 116 4,358 1,271 2,607 483 1,253 416 66 6,396 484 8,586 133,888 118,086 289,145 21,8535 1,725 369 6486 1, 131 2,5007 164 375 19,205 18,979 13,9158 2,514 9,553 5,838 2,8339 13,362 11,016 3,360 13,612
10 1,288 2,114 20511 4,202 6,234 8,440 13 712 7,137 1,989 642 94213 10,598 5,356 32,601 11 ,22714 139 4,250 3,226 3,350 7,59115 180 7,515 3,00016 120 12,402 5,148 19,57417 213,170 64,779 3,990 2,613 5,138 7,31618 3 1,71319 1,020 2,478 3,01220 115 51 9,12821 1222 95,228 4,556 392 190 585 69,27523 658 34 1,74124 3,930 4,222 13,734 5,268 1,90625 19 425 5 1,55926 402 1 177 1527 4,928 3,719 1, 191 15, 145 8,314 27328 9,160 17, 191 34,972 116,487 3,166 53429 2,162 18,474 47930 2,013 4,984 19,82531 10,742 40,218 55,239 27032 6,038 14,351 133 3,020 9,466 9,78434 2,010 4,466 9,662 4635 3 2 38,906 147,796 11 ,29836 528 709 2337 6,056 5,54038 7,211 11 , 157 25,779 65 8,505 18,50339 6,358 5,730 14,821 2,252 4,058 52940 8,673 31,439 9,152
-_._._-- --- -------------------
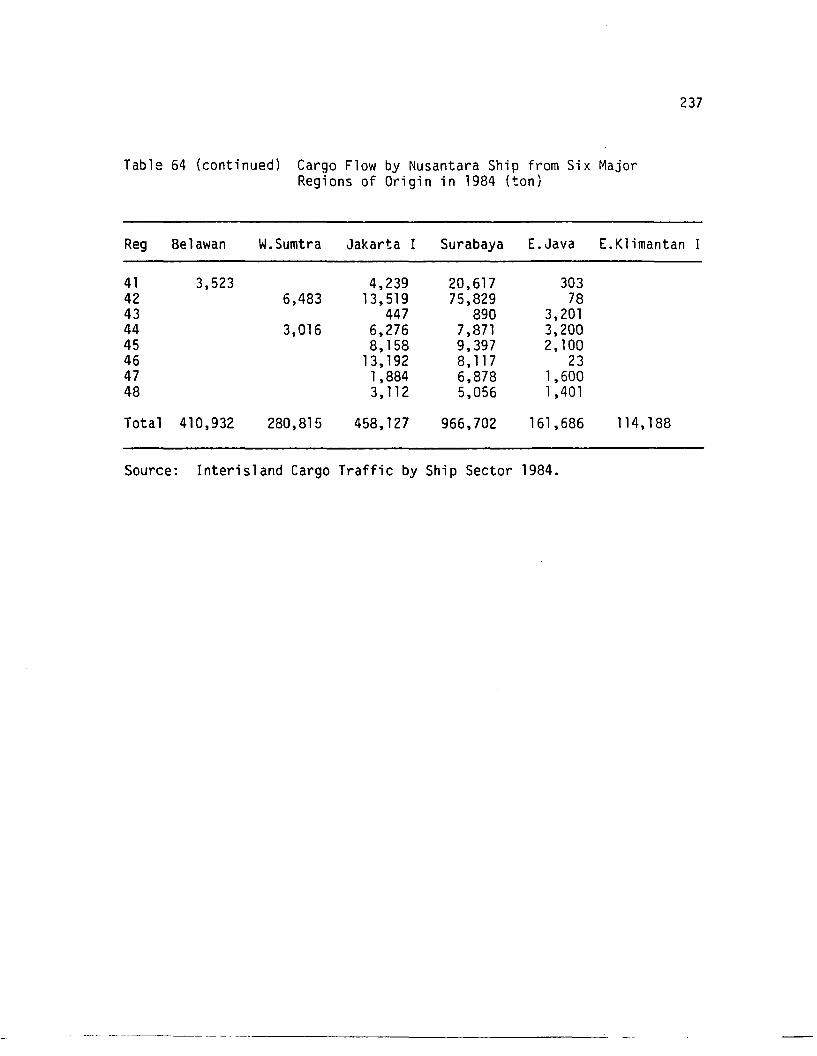
Table 64 (continued) Cargo Flow by Nusantara Ship from Six MajorRegions of Origin in 1984 (ton)
237
Reg Belawan W.Sumtra Jakarta I Surabaya E.Java E.Klimantan I
41 3,523 4,239 20,617 30342 6,483 13,519 75,829 7843 447 890 3,20144 3,016 6,276 7,871 3,20045 8,158 9,397 2,10046 13,192 8, 117 2347 1,884 6,878 1,60048 3, 112 5,056 1,401
Total 410,932 280,815 458~127 966,702 161,686 114,188
Source: Interisland Cargo Traffic by Ship Sector 1984.
--- -----._--_._- -------------------------~
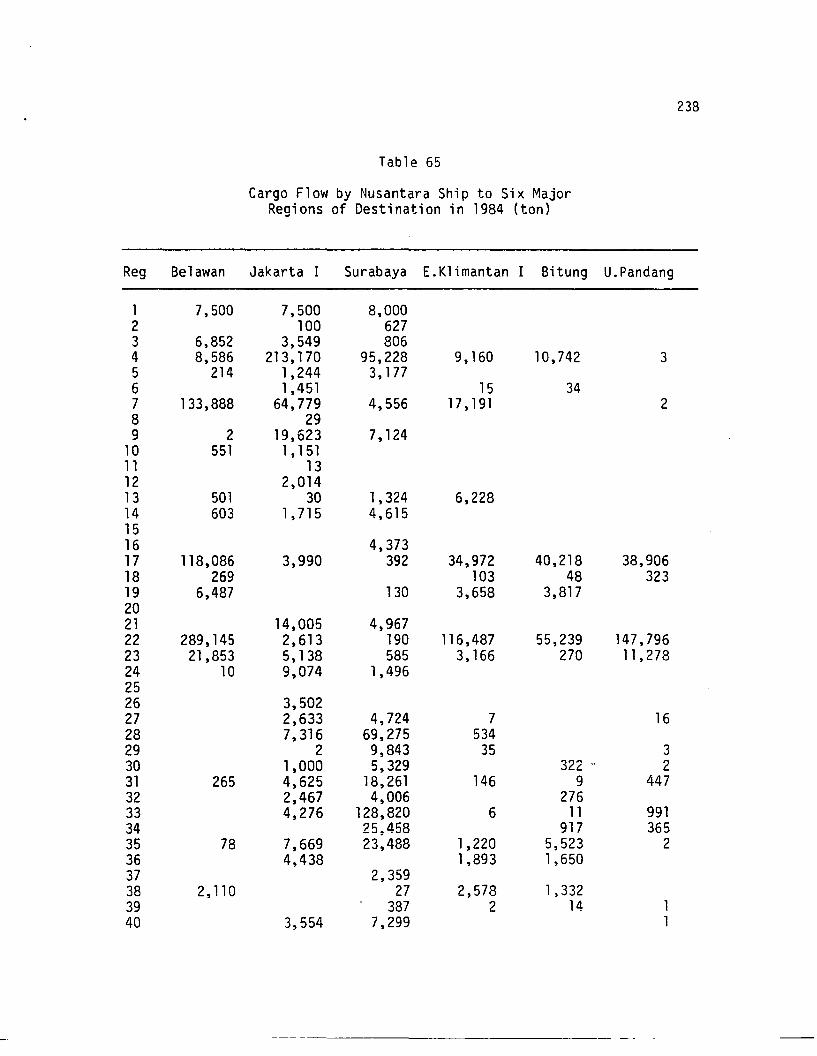
Table 65
Cargo Flow by Nusantara Ship to Six MajorRegions of Destination in 1984 (ton)
Reg Belawan Jakarta I Surabaya E.Klimantan I Bitung U.Pandang
1 7,500 7,500 8,0002 100 6273 6,852 3,549 8064 8,586 213,170 95,228 9,160 10,742 35 214 1,244 3, 1776 1,451 15 347 133,888 64,779 4,556 17,191 28 299 2 19,623 7,124
10 551 1, 15111 1312 2,01413 501 30 1,324 6,22814 603 1,715 4,6151516 4,37317 118,086 3,990 392 34,972 40,218 38,90618 269 103 48 32319 6,487 130 3,658 3,8172021 14,005 4,96722 289,145 2,613 190 116,487 55,239 147,79623 21,853 5,138 585 3,166 270 11 ,27824 10 9,074 1,4962526 3,50227 2,633 4,724 7 1628 7,316 69,275 53429 2 9,843 35 330 1,000 5,329 322 .. 231 265 4,625 18,261 146 9 44732 2,467 4,006 27633 4,276 128,820 6 11 99134 25~458 917 36535 78 7,669 23,488 1,220 5,523 236 4,438 1,893 1,65037 2,35938 2,110 27 2,578 1,33239 387 2 1440 3,554 7,299
238
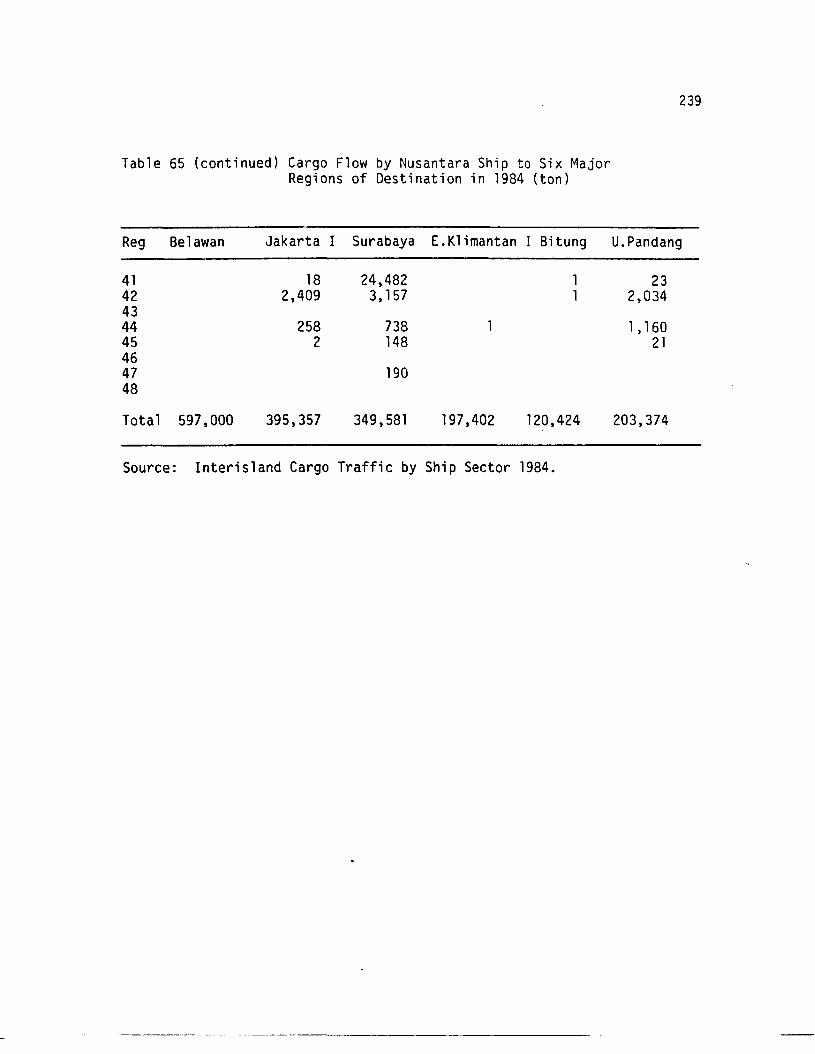
Table 65 (continued) Cargo Flow by Nusantara Ship to Six MajorRegions of Destination in 1984 (ton)
239
Reg Belawan Jakarta I Surabaya E.Klimantan I Bitung U.Pandang
41 18 24,482 2342 2,409 3,157 2,0344344 258 738 1, 16045 2 148 214647 19048
Total 597,000 395,357 349,581 197,402 120,424 203,374
Source: Interisland Cargo Traffic by Ship Sector 1984.
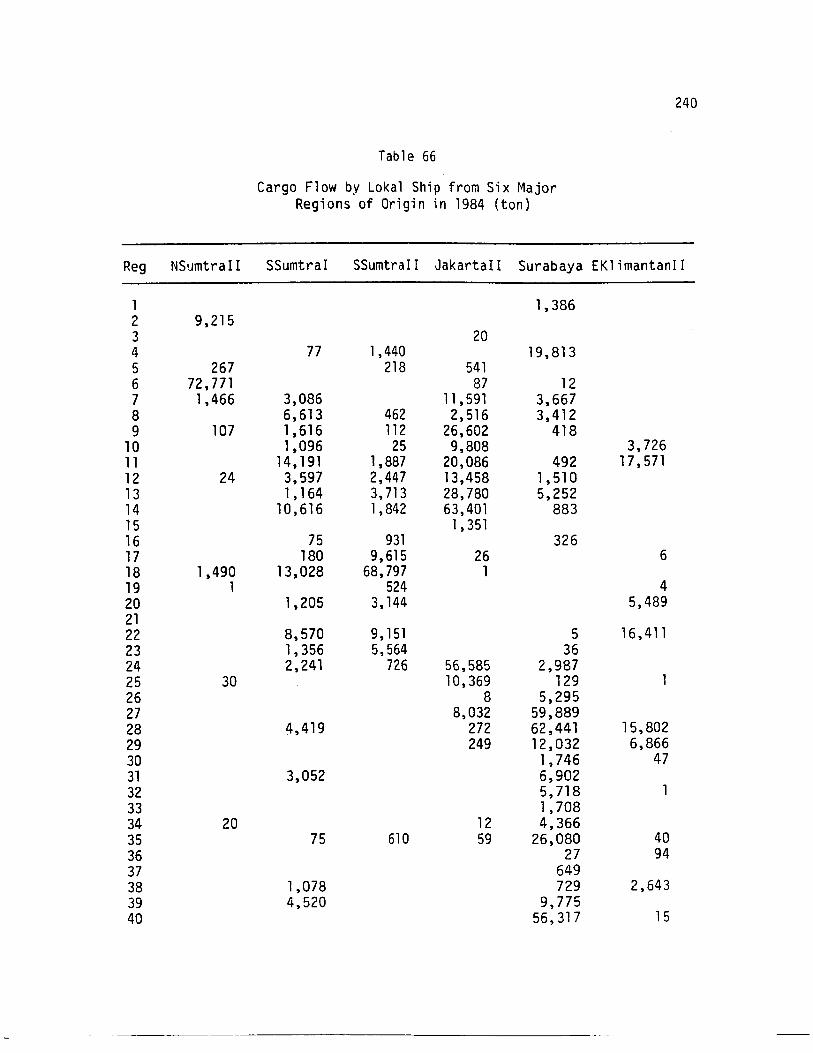
Table 66
Cargo Flow by Loka1 Ship from Six MajorRegions of Origin in 1984 (ton)
240
Reg NSumtraII SSumtraI SSumtraII JakartaII Surabaya EK1imantanII
1 1,3862 9,2153 204 77 1,440 19,8135 267 218 5416 72,771 87 127 1,466 3,086 11 ,591 3,6678 6,613 462 2,516 3,4129 107 1,616 112 26,602 418
10 1,096 25 9,808 3,72611 14,191 1,887 20,086 492 17,57112 24 3,597 2,447 13,458 1,51013 1,164 3,713 28,780 5,25214 10,616 1,842 63,401 88315 1,35116 75 931 32617 180 9,615 26 618 1,490 13,028 68,797 119 1 524 420 1,205 3,144 5,4892122 8,570 9, 151 5 16,41123 1,356 5,564 3624 2,241 726 56,585 2,98725 30 10,369 12926 8 5,29527 8,032 59,88928 4,419 272 62,441 15,80229 249 12,032 6,86630 1,746 4731 3,052 6,90232 5,71833 1,70834 20 12 4,36635 75 610 59 26,080 4036 27 9437 64938 1,078 729 2,64339 4,520 9,77540 56,317 15
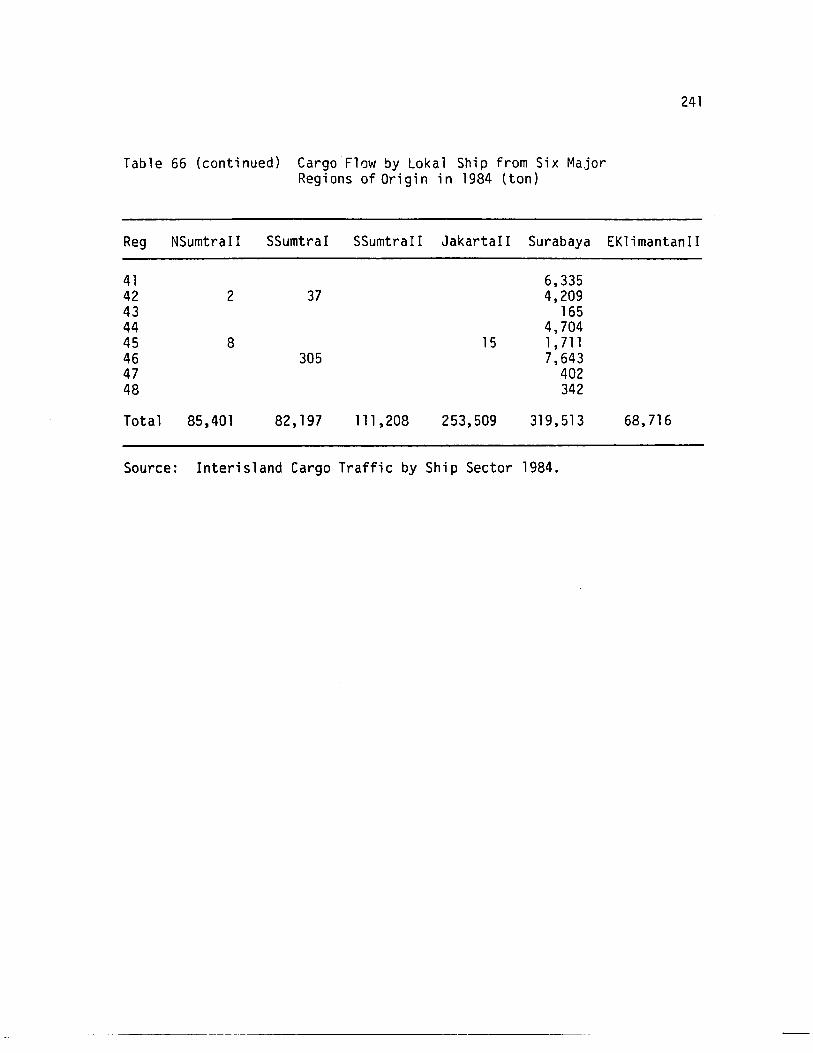
Table 66 (continued) Cargo Flow by Lokal Ship from Six MajorRegions of Origin in 1984 (ton)
241
Reg NSumtraII SSumtraI SSumtraII JakartaII Surabaya EKlimantanII
41 6,33542 2 37 4,20943 16544 4,70445 8 15 1,71146 305 7,64347 40248 342
Total 85,401 82,197 111 ,208 253,509 319,513 68,716
Source: Interisland Cargo Traffic by Ship Sector 1984.
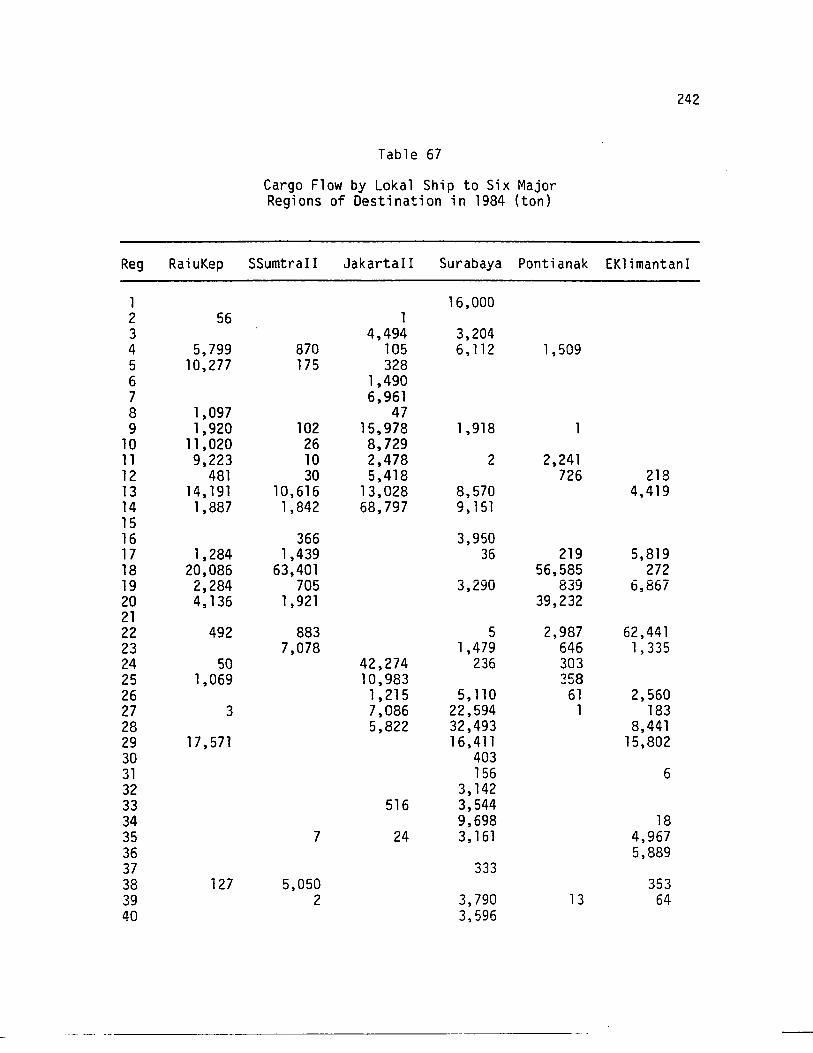
Table 67
Cargo Flow by Loka1 Ship to Six MajorRegions of Destination in 1984 (ton)
242
Reg RaiuKep SSumtraII JakartaII $urabaya Pontianak EK1imantanI
1 16,0002 56 13 4,494 3,2044 5,799 870 105 6,112 1,5095 10,277 175 3286 1,4907 6,9618 1,097 479 1,920 102 15,978 1,918
10 11 ,020 26 8,72911 9,223 10 2,478 2 2,24112 481 30 5,418 726 21813 14,191 10,616 13,028 8,570 4,41914 1,887 1,842 68,797 9, 1511516 366 3,95017 1,284 1,439 36 219 5,81918 20,086 63,401 56,585 27219 2,284 705 3,290 839 6,86720 4,136 1,921 39,2322122 492 883 5 2,987 62,44123 7,078 1,479 646 1,33524 50 42,274 236 30325 1,069 10,983 35826 1,215 5,110 61 2,56027 3 7,086 22,594 1 18328 5,822 32,493 8,44129 17,571 16,411 15,80230 40331 156 632 3,14233 516 3,54434 9,698 1835 7 24 3,161 4,96736 5,88937 33338 127 5,050 35339 2 3,790 13 6440 3,596
~- --~ ~_._---- -----------------
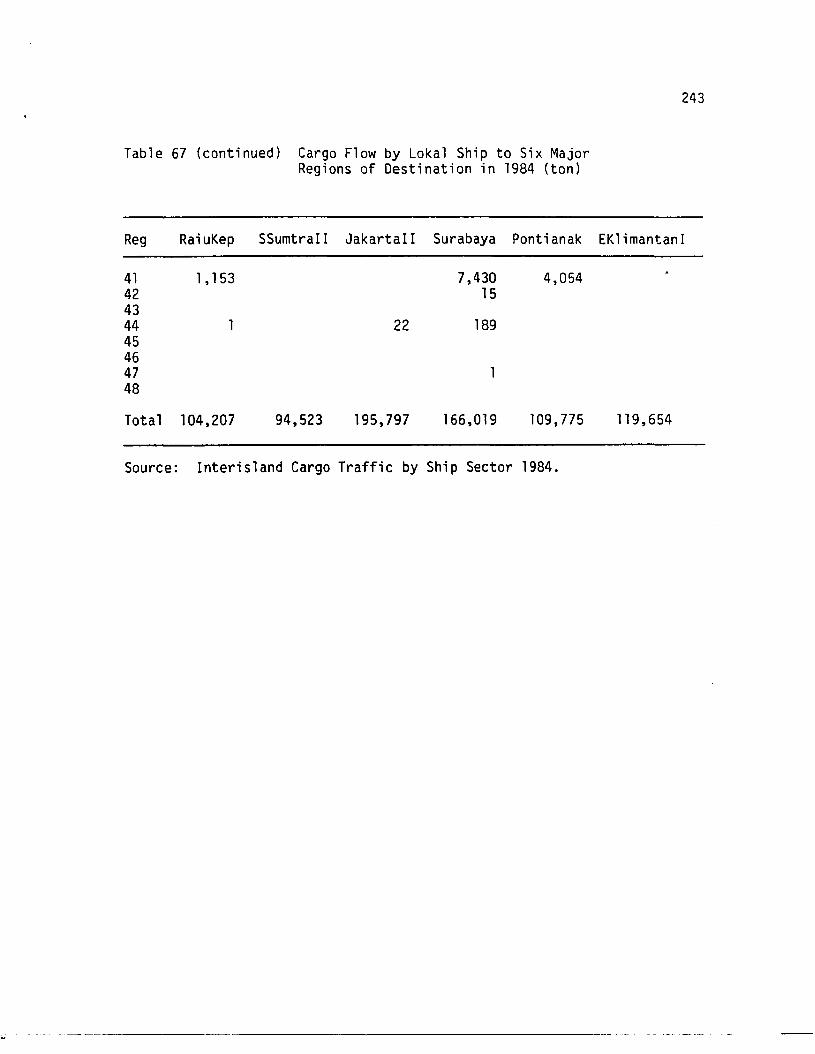
Table 67 (continued) Cargo Flow by Loka1 Ship to Six MajorRegions of Destination in 1984 (ton)
243
Reg RaiuKep SSumtraII JakartaI I Surabaya Pontianak EK1imantanI
41 1, 153 7,430 4,05442 154344 1 22 18945464748
Total 104,207 94,523 195,797 166,019 109,775 119,654
Source: Interisland Cargo Traffic by Ship Sector 1984.
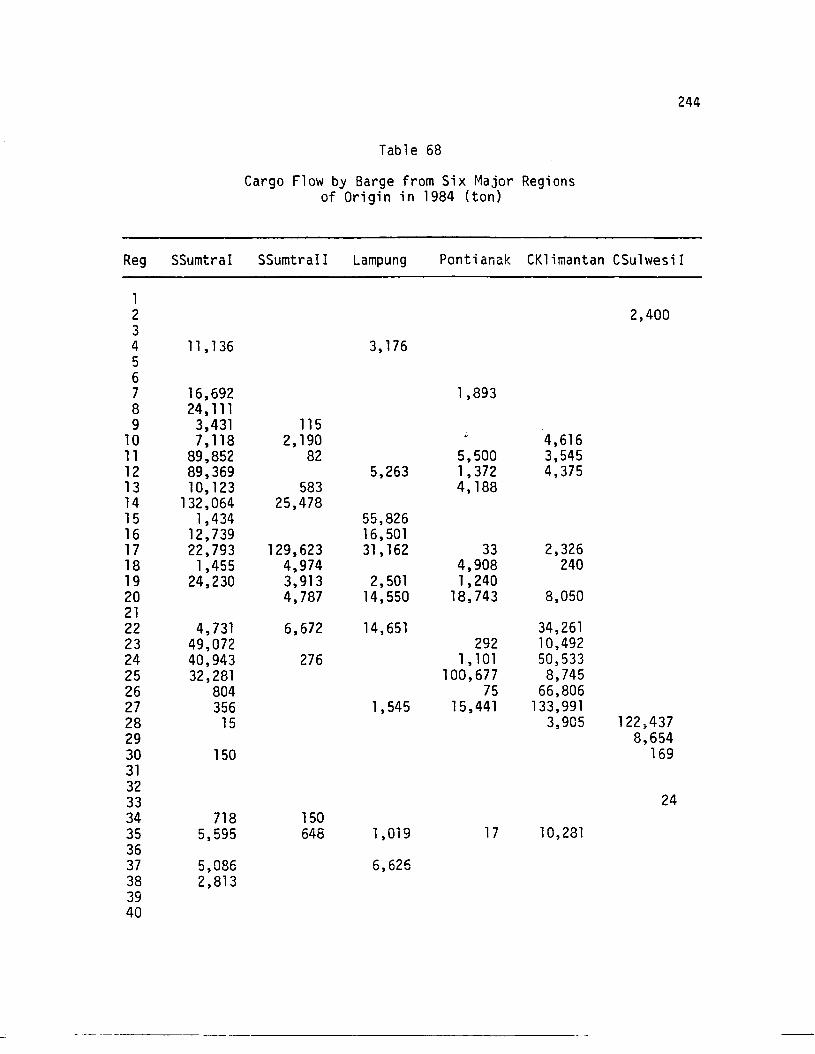
Table 68
Cargo Flow by Barge from Six Major Regionsof Origin in 1984 (ton)
244
Reg SSumtraI SSumtraII Lampung Pontianak CK1imantan CSu1wesiI
12 2,40034 11 ,136 3,176567 16,692 1,8938 24, 1119 3,431 115
10 7,118 2,190 4,61611 89,852 82 5,500 3,54512 89,369 5,263 1,372 4,37513 10,123 583 4,18814 132,064 25,47815 1,434 55,82616 12,739 16,50117 22,793 129,623 31 , 162 33 2,32618 1,455 4,974 4,908 24019 24,230 3,913 2,501 1,24020 4,787 14,550 18,743 8,0502122 4,731 6,672 14,651 34,26123 49,072 292 10,49224 40,943 276 1, 101 50,53325 32,281 100,677 8,74526 804 75 66,80627 356 1,545 15,441 133,99128 15 3,905 122,43729 8,65430 150 169313233 2434 718 15035 5,595 648 1,019 17 10,2813637 5,086 6,62638 2,8133940
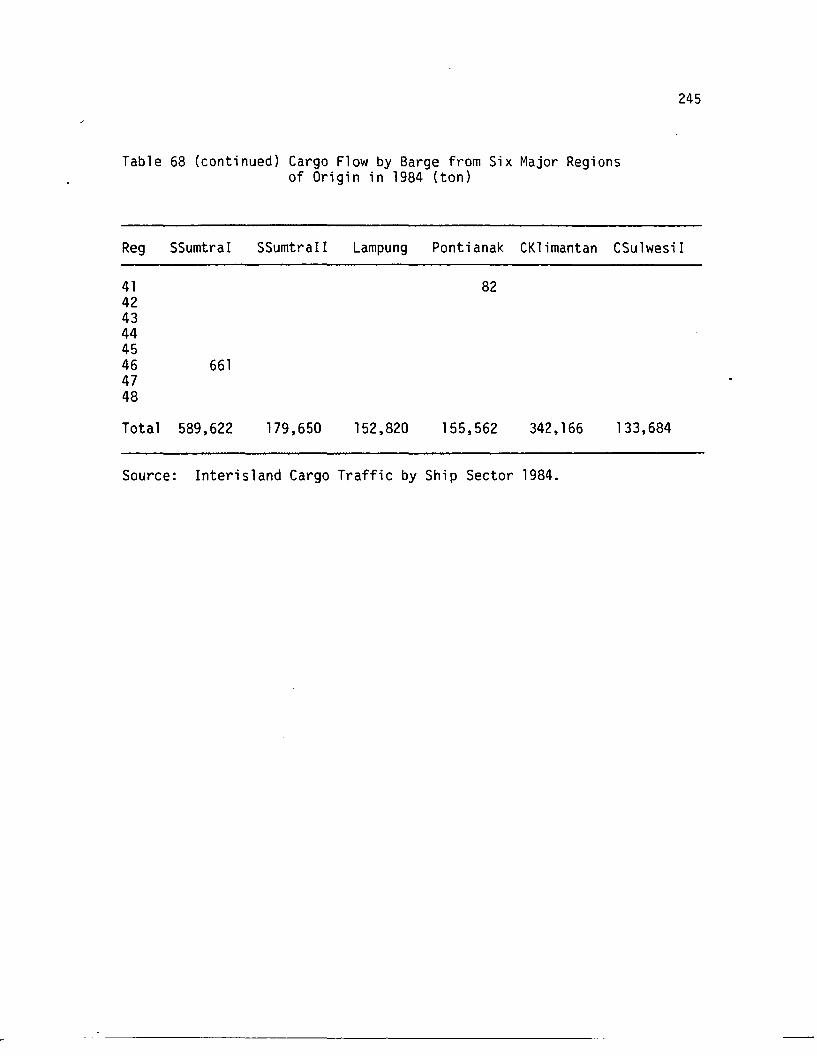
Table 68 (continued) Cargo Flow by Barge from Six Major Regionsof Origin in 1984 (ton)
245
Reg SSumtraI SSumtraII Lampung Pontianak CKlimantan CSulwesiI
41 824243444546 6614748
Total 589,622 179,650 152,820 155,562 342,166 133,684
Source: Interisland Cargo Traffic by Ship Sector 1984.
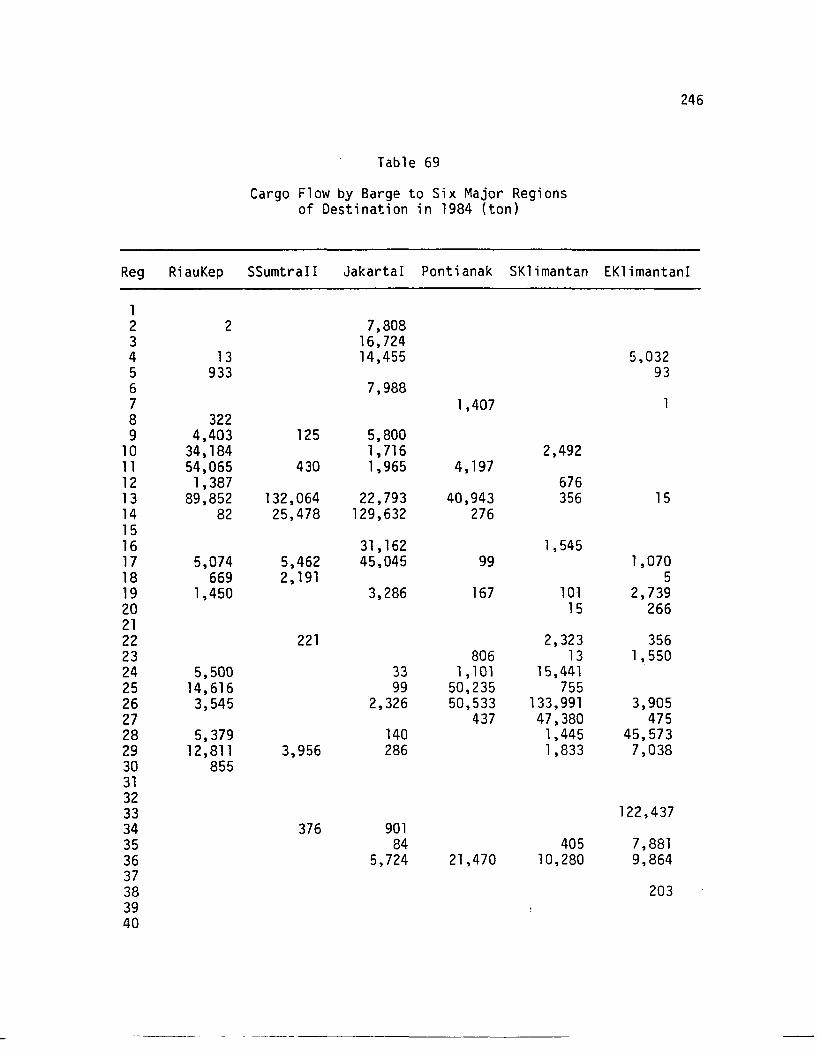
Table 69
Cargo Flow by Barge to Six Major Regionsof Destination in 1984 (ton)
246
Reg RiauKep SSumtraII Jakarta I Pontianak SKlimantan EKlimantanI
12 2 7,8083 16,7244 13 14,455 5,0325 933 936 7,9887 1,4078 3229 4,403 125 5,800
10 34,184 1,716 2,49211 54,065 430 1,965 4,19712 1,387 67613 89,852 132,064 22,793 40,943 356 1514 82 25,478 129,632 2761516 31,162 1,54517 5,074 5,462 45,045 99 1,07018 669 2,191 519 1,450 3,286 167 101 2,73920 15 2662122 221 2,323 35623 806 13 1,55024 5,500 33 1,101 15,44125 14,616 99 50,235 75526 3,545 2,326 50,533 133,991 3,90527 437 47,380 47528 5,379 140 1,445 45,57329 12,811 3,956 286 1,833 7,03830 855313233 122,43734 376 90135 84 405 7,88136 5,724 21,470 10,280 9,8643738 2033940
- ------------------
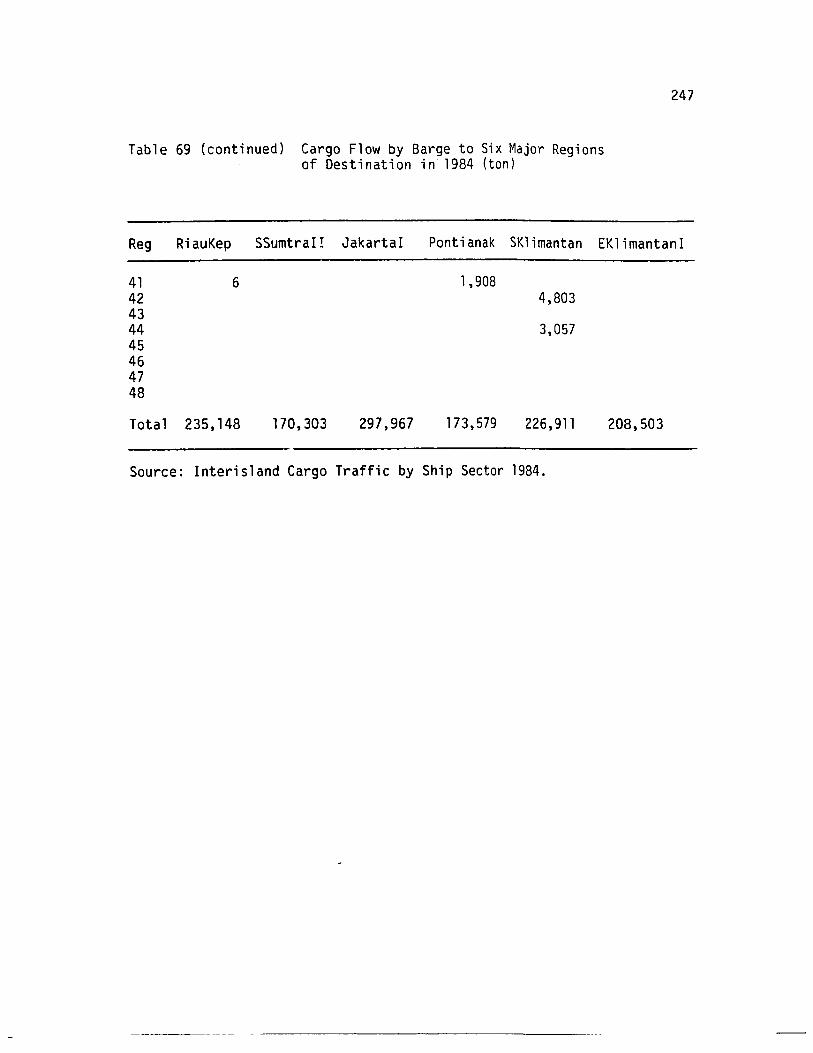
Table 69 (continued) Cargo Flow by Barge to Six Major Regionsof Destination in 1984 (ton)
247
Reg RiauKep SSumtraI! JakartaI Pontianak SKlimantan EKlimantanI
41 6 1,90842 4,8034344 3,05745464748
Total 235,148 170,303 297,967 173,579 226,911 208,503
Source: Interisland Cargo Traffic by Ship Sector 1984.
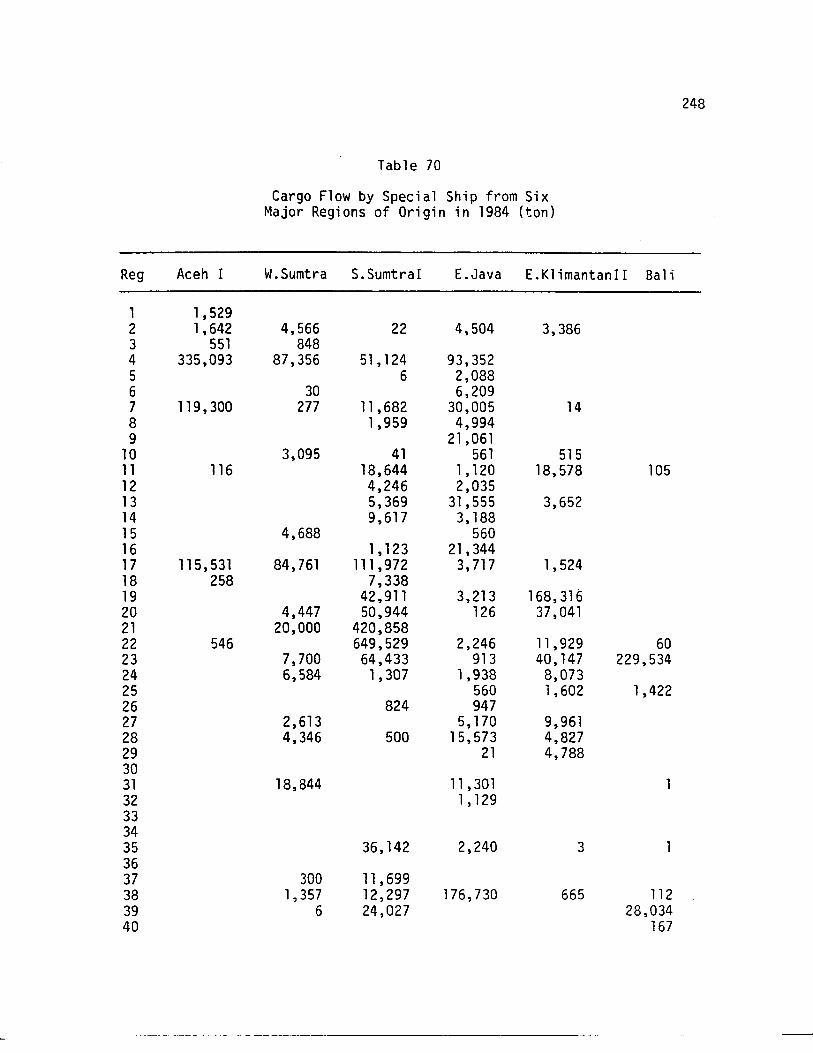
Table 70
Cargo Flow by Special Ship from SixMajor Regions of Origin in 1984 (ton)
Reg Aceh I W.Sumtra S.SumtraI E.Java LK1 imantanI I Bali
1 1,5292 1,642 4,566 22 4,504 3,3863 551 8484 335,093 87,356 51,124 93,3525 6 2,0886 30 6,2097 119,300 277 11 ,682 30,005 148 1,959 4,9949 21,061
10 3,095 41 561 51511 116 18,644 1, 120 18,578 10512 4,246 2,03513 5,369 31,555 3,65214 9,617 3,18815 4,688 56016 1,123 21,34417 115,531 84,761 111,972 3,717 1,52418 258 7,33819 42,911 3,213 168,31620 4,447 50,944 126 37,04121 20,000 420,85822 546 649,529 2,246 11,929 6023 7,700 64,433 913 40, 147 229,53424 6,584 1,307 1,938 8,07325 560 1,602 1,42226 824 94727 2,613 5,170 9,96128 4,346 500 15,573 4,82729 21 4,7883031 18,844 11 ,30132 1,129333435 36,142 2,240 33637 300 11 ,69938 1,357 12,297 176,730 665 11239 6 24,027 28,03440 167
248
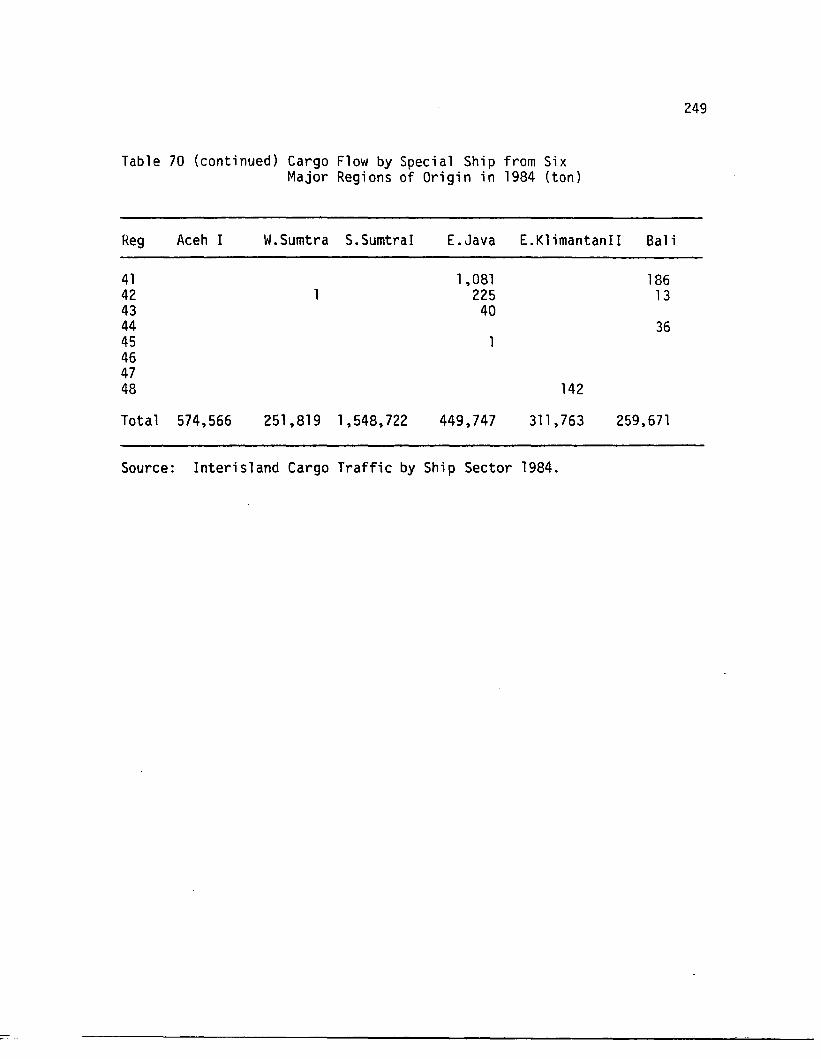
Table 70 (continued) Cargo Flow by Special Ship from SixMajor Regions of Origin in 1984 (ton)
Reg Aceh I W.Sumtra S.SumtraI E.Java E.Kl imantanII Bali
41 1,081 18642 225 1343 4044 3645464748 142
Total 574,566 251,819 1,548,722 449,747 311 ,763 259,671
Source: Interisland Cargo Traffic by Ship Sector 1984.
249
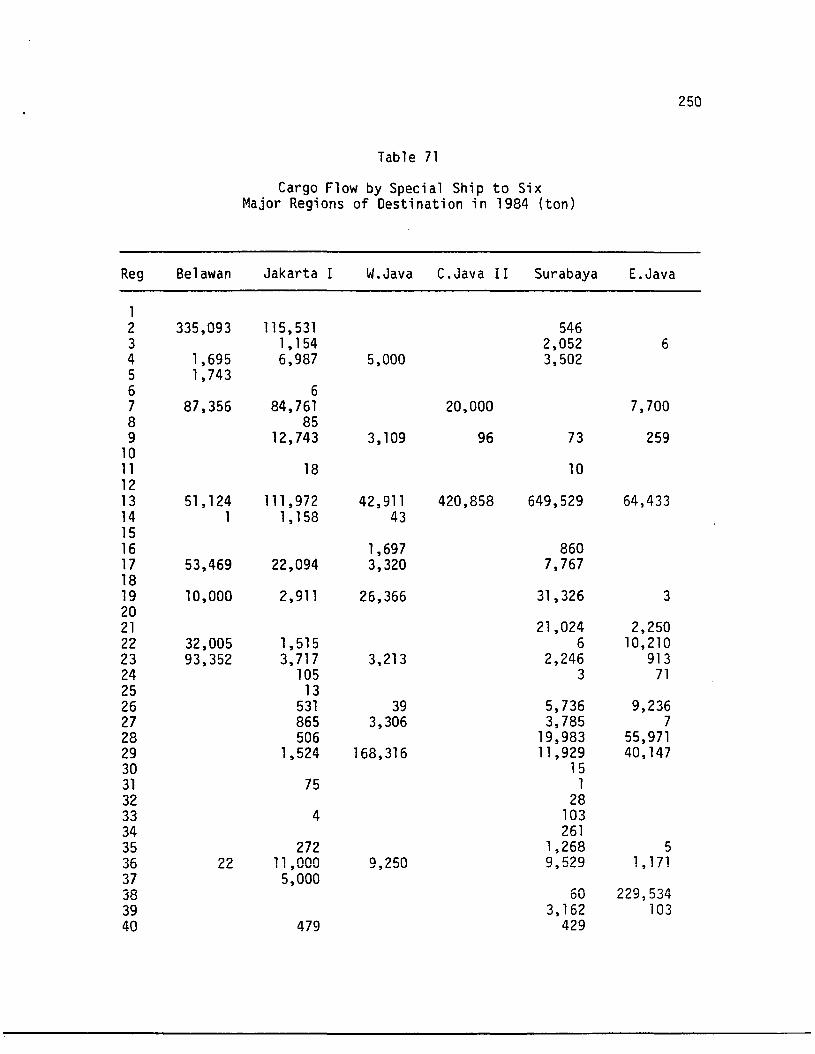
Table 71
Cargo Flow by Special Ship to SixMajor Regions of Destination in 1984 (ton)
Reg Belawan Jakarta I W.Java C.Java II Surabaya E.Java
12 335,093 115,531 5463 1, 154 2,052 64 1,695 6,987 5,000 3,5025 1,7436 67 87,356 84,761 20,000 7,7008 859 12,743 3,109 96 73 259
1011 18 101213 51,124 111,972 42,911 420,858 649,529 64,43314 1 1, 158 431516 1,697 86017 53,469 22,094 3,320 7,7671819 10,000 2,911 26,366 31,326 32021 21,024 2,25022 32,005 1,515 6 10,21023 93,352 3,717 3,213 2,246 91324 105 3 7125 1326 531 39 5,736 9,23627 865 3,306 3,785 728 506 19,983 55,97129 1,524 168,316 11 ,929 40,14730 1531 75 132 2833 4 10334 26135 272 1,268 536 22 11 ,000 9,250 9,529 1, 17137 5,00038 60 229,53439 3,162 10340 479 429
250
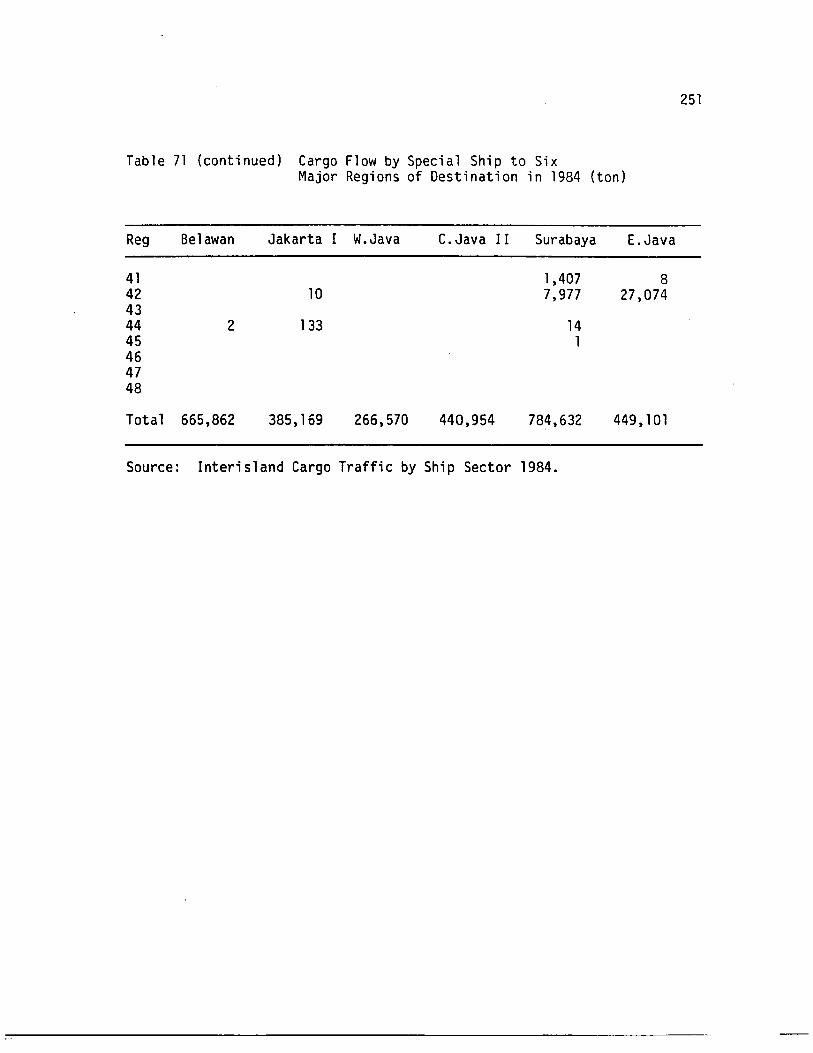
Table 71 (continued) Cargo Flow by Special Ship to SixMajor Regions of Destination in 1984 (ton)
Reg Belawan Jakarta I W.Java C.Java II Surabaya E.Java
41 1,407 842 10 7,977 27,0744344 2 133 1445 1464748
Total 665,862 385,169 266,570 440,954 784,632 449,101
Source: Interisland Cargo Traffic by Ship Sector 1984.
251
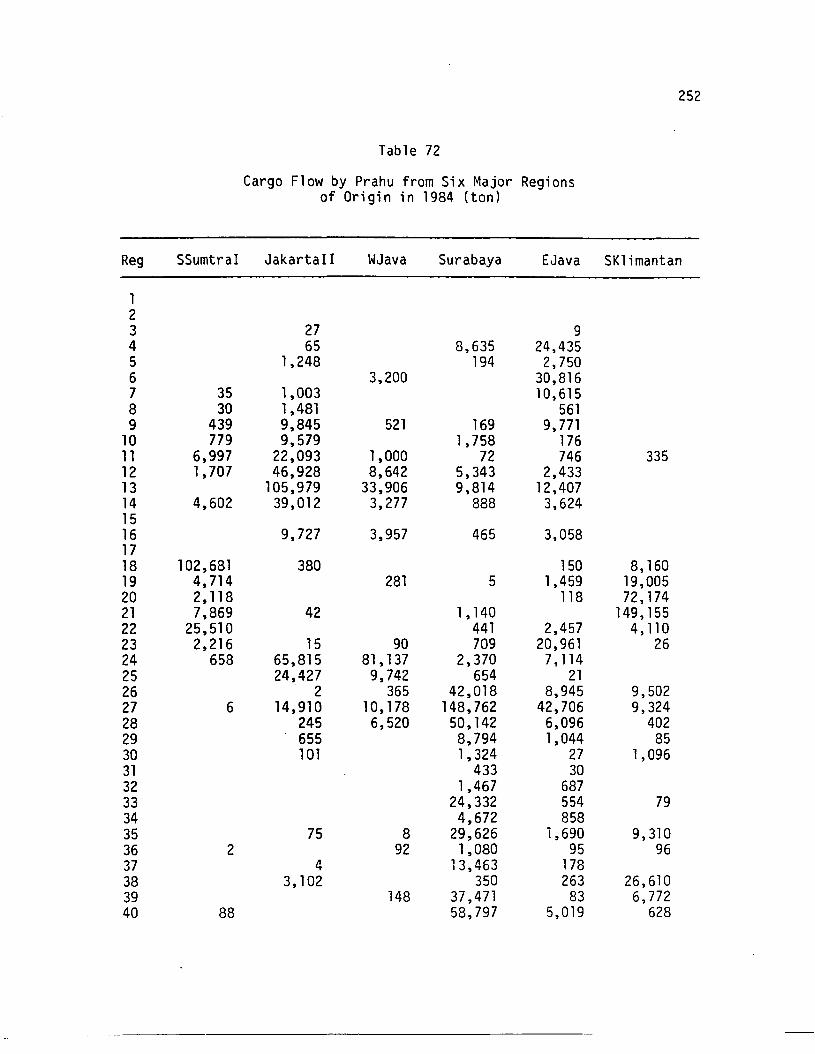
Tab 1e 72
Cargo Flow by Prahu from Six Major Regionsof Origin in 1984 (ton)
252
Reg SSumtraI JakartaII WJava Surabaya EJava SKlimantan
123 27 94 65 8,635 24,4355 1,248 194 2,7506 3,200 30,8167 35 1,003 10,6158 30 1,481 5619 439 9,845 521 169 9,771
10 779 9,579 1,758 17611 6,997 22,093 1,000 72 746 33512 1,707 46,928 8,642 5,343 2,43313 105,979 33,906 9,814 12,40714 4,602 39,012 3,277 888 3,6241516 9,727 3,957 465 3,0581718 102,681 380 150 8,16019 4,714 281 5 1,459 19,00520 2,118 118 72,17421 7,869 42 1,140 149,15522 25,510 441 2,457 4,11023 2,216 15 90 709 20,961 2624 658 65,815 81,137 2,370 7, 11425 24,427 9,742 654 2126 2 365 42,018 8,945 9,50227 6 14,910 10,178 148,762 42,706 9,32428 245 6,520 50,142 6,096 40229 655 8,794 1,044 8530 101 1,324 27 1,09631 433 3032 1,467 68733 24,332 554 7934 4,672 85835 75 8 29,626 1,690 9,31036 2 92 1,080 95 9637 4 13,463 17838 3,102 350 263 26,61039 148 37,471 83 6,77240 88 58,797 5,019 628
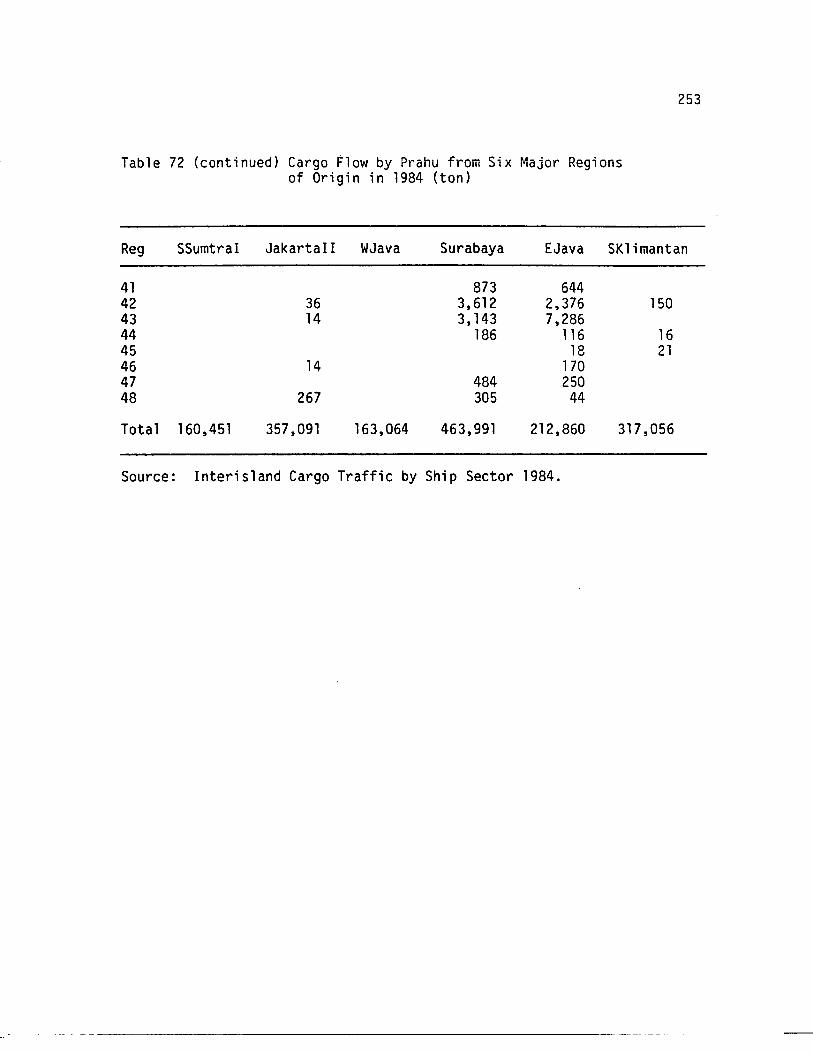
Table 72 (continued) Cargo Flow by Prahu from Six Major Regionsof Origin in 1984 (ton)
253
Reg SSumtraI Jakartall WJava Surabaya EJava SK1imantan
41 873 64442 36 3,612 2,376 15043 14 3,143 7,28644 186 116 1645 18 2146 14 17047 484 25048 267 305 44
Total 160,451 357,091 163,064 463,991 212,860 317,056
Source: Interisland Cargo Traffic by Ship Sector 1984.
------------------------------ ---
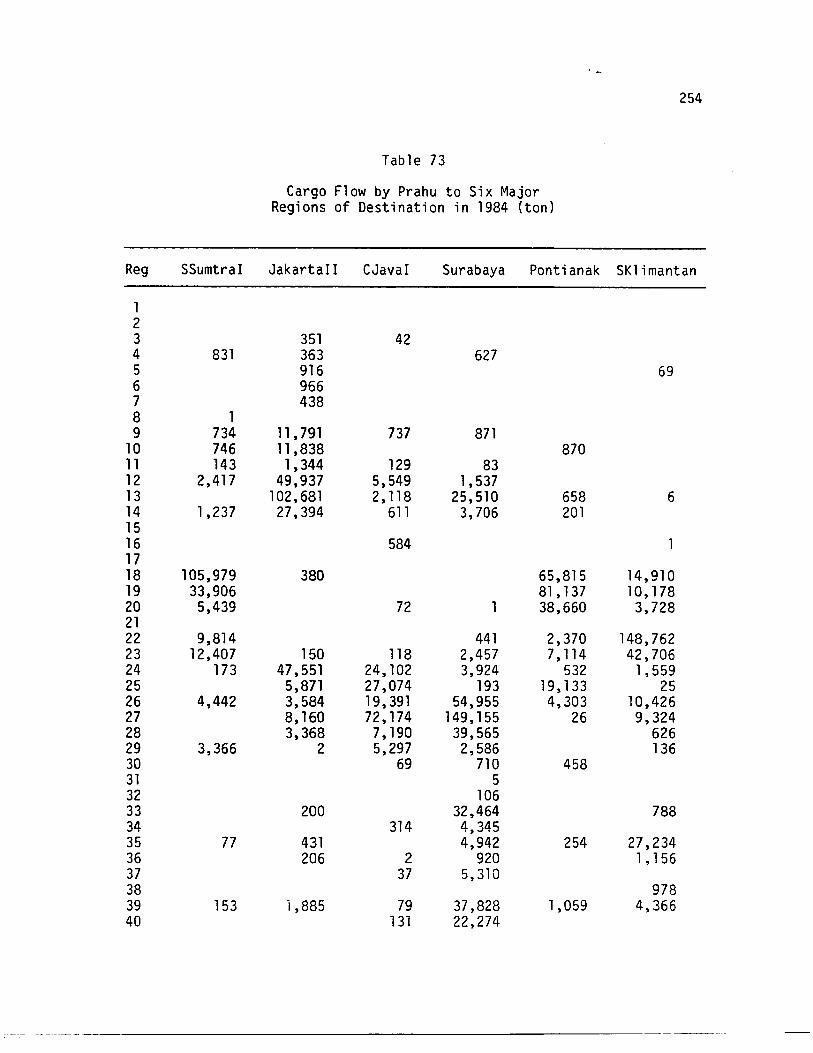
Table 73
Cargo Flow by Prahu to Six MajorRegions of Destination in 1984 (ton)
254
Reg SSumtraI JakartaII CJavaI Surabaya Pontianak SK1imantan
123 351 424 831 363 6275 916 696 9667 4388 19 734 11 ,791 737 871
10 746 11 ,838 87011 143 1,344 129 8312 2,417 49,937 5,549 1,53713 102,681 2,118 25,510 658 614 1,237 27,394 611 3,706 2011516 5841718 105,979 380 65,815 14,91019 33,906 81 , 137 10,17820 5,439 72 38,660 3,7282122 9,814 441 2,370 148,76223 12,407 150 118 2,457 7,114 42,70624 173 47,551 24,102 3,924 532 1,55925 5,871 27,074 193 19,133 2526 4,442 3,584 19,391 54,955 4,303 10,42627 8,160 72,174 149,155 26 9,32428 3,368 7,190 39,565 62629 3,366 2 5,297 2,586 13630 69 710 45831 532 10633 200 32,464 78834 314 4,34535 77 431 4,942 254 27,23436 206 2 920 1, 15637 37 5,31038 97839 153 i ,885 79 37,828 1,059 4,36640 131 22,274
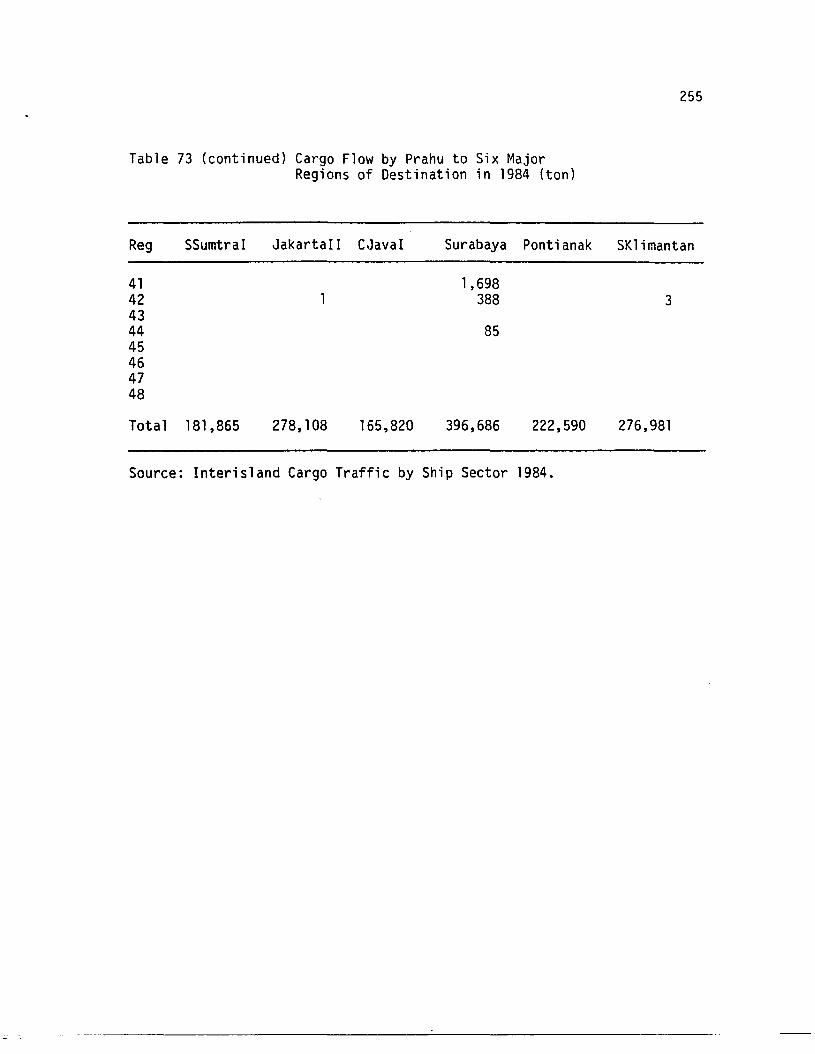
255
Table 73 (continued) Cargo Flow by Prahu to Six MajorRegions of Destination in 1984 (ton)
Reg SSumtraI JakartaII CJavaI Surabaya Pontianak SK1imantan
41 1,69842 388 34344 8545464748
Total 181,865 278,108 165,820 396,686 222,590 276,981
Source: Interisland Cargo Traffic by Ship Sector 1984.
---~-----------------------------------
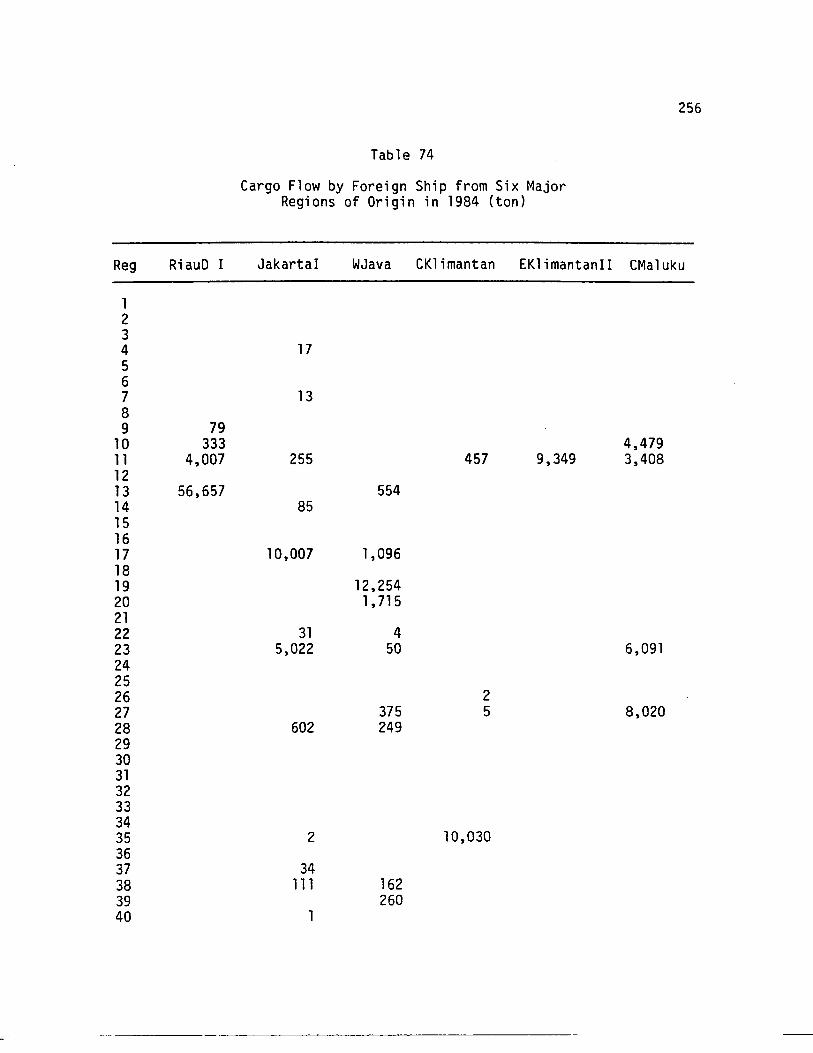
Table 74
Cargo Flow by Foreign Ship from Six MajorRegions of Origin in 1984 (ton)
256
Reg RiauD I Jakarta I WJava CK1imantan EK1imantanII CMa1uku
1234 17567 1389 79
10 333 4,47911 4,007 255 457 9,349 3,4081213 56,657 55414 85151617 10,007 1,0961819 12,25420 1,7152122 31 423 5,022 50 6,091242526 227 375 5 8,02028 602 24929303132333435 2 10,0303637 3438 111 16239 26040 1
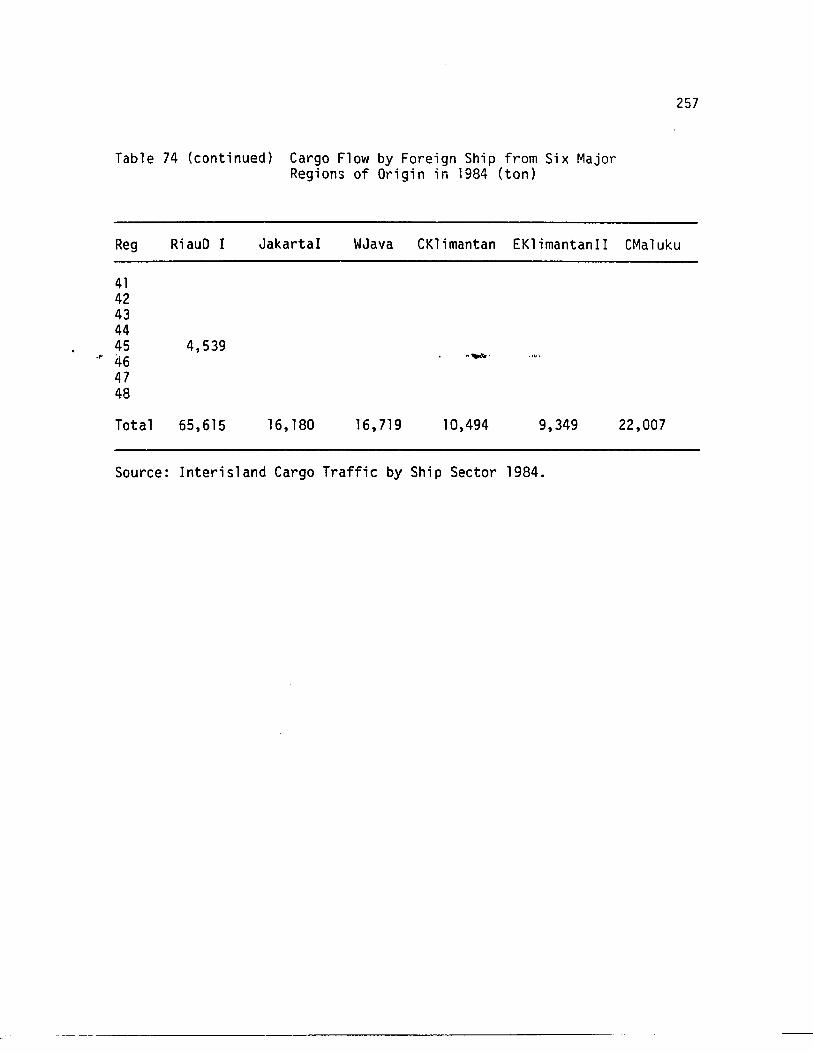
Table 74 (continued) Cargo Flow by Foreign Ship from Six MajorRegions of Origin in 1984 (ton)
257
Reg RiauD I Jakarta I WJava CK1 imantan EK1 imantanI I CMa1uku
4142434445 4,539
.,. 46 .-4748
Total 65,615 16,180 16,719 10,494 9,349 22,007
Source: Interisland Cargo Traffic by Ship Sector 1984.
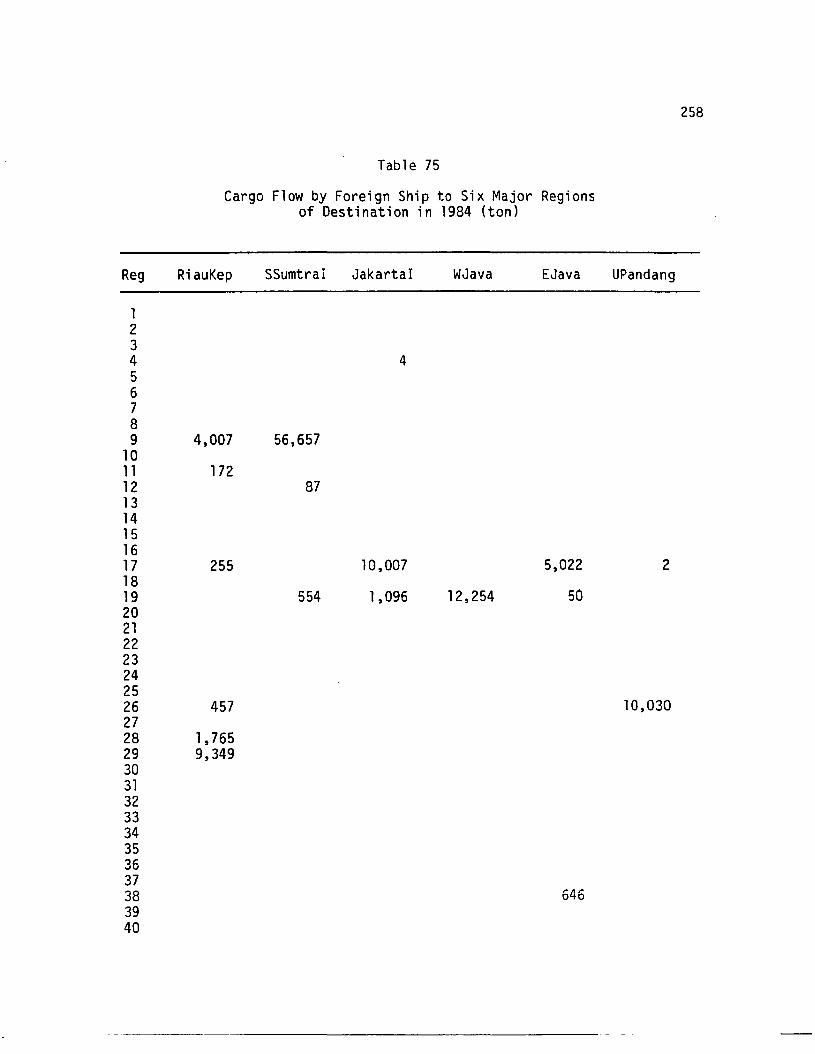
Table 75
Cargo Flow by Foreign Ship to Six Major Regionsof Destination in 1984 (ton)
Reg RiauKep SSumtraI Jakarta I WJava EJava UPandang
1234 456789 4,007 56,657
1011 17212 871314151617 255 10,007 5,022 21819 554 1,096 12,254 5020212223242526 457 10,0302728 1,76529 9,349303132333435363738 6463940
258
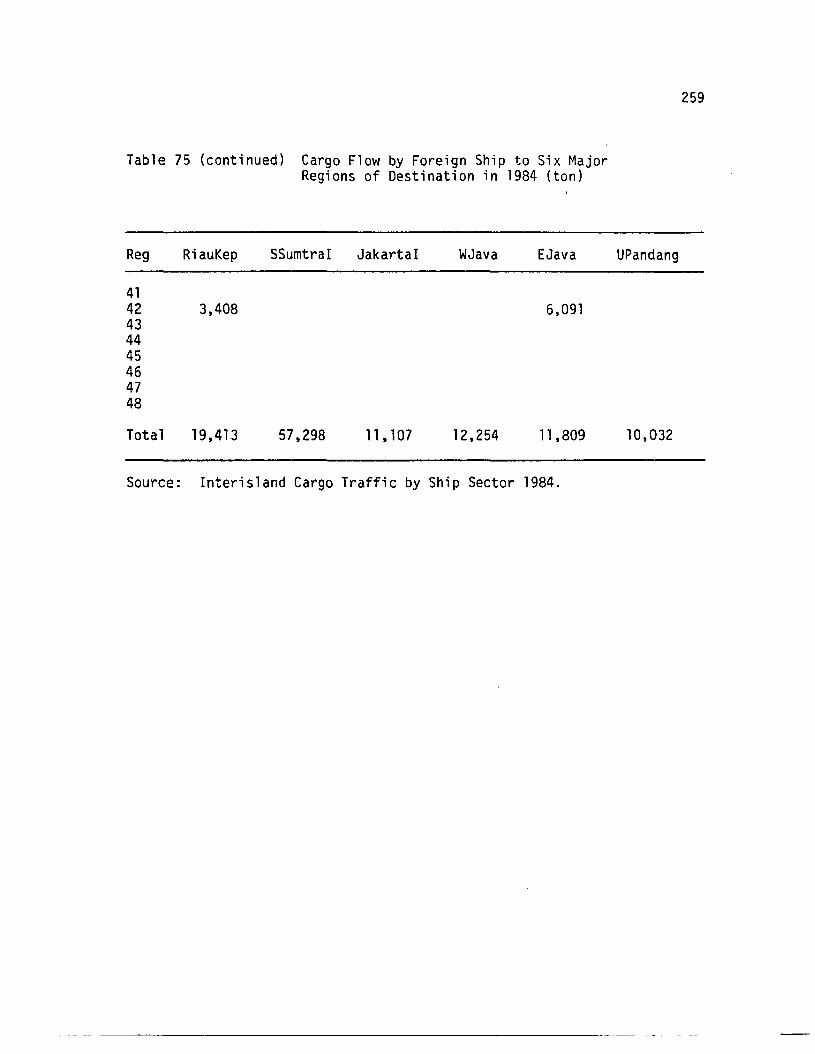
Table 75 (continued) Cargo Flow by Foreign Ship to Six MajorRegions of Destination in 1984 (ton)
Reg RiauKep SSumtraI Jakarta I WJava EJava UPandang
4142 3,408 6,091434445464748
Total 19,413 57,298 11 ,107 12,254 11 ,809 10,032
Source: Interisland Cargo Traffic by Ship Sector 1984.
259
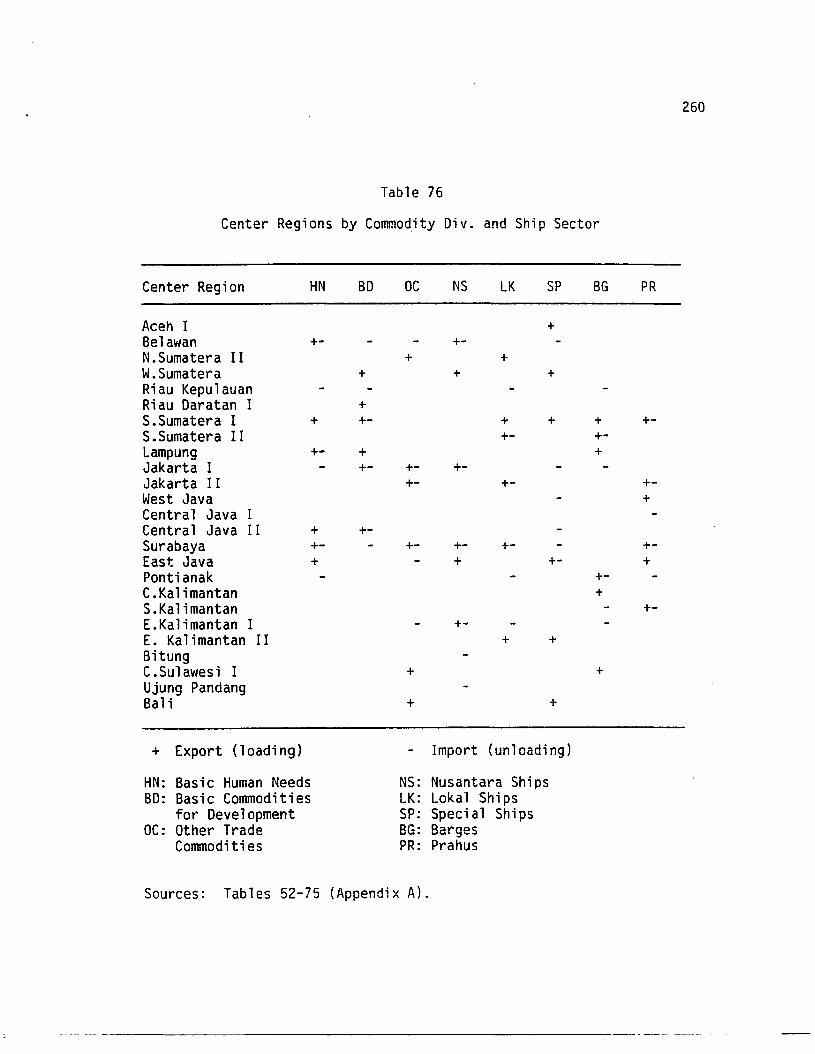
Table 76
Center Regions by Commodity Div. and Ship Sector
Center Region HN BD OC NS LK SP BG PR
Aceh I +Belawan +- +-N.Sumatera II + +W.Sumatera + + +Riau KepulauanRiau Daratan I +S.Sumatera I + +- + + + +-S.Sumatera II +- +-Lampung +- + +Jakarta I +- +- +-Jakarta II +- +- +-West Java +Central Java ICentral Java II + +-Surabaya +- +- +- +- +-East Java + + +- +Pontianak +-C.Kalimantan +S.Kalimantan +-E. Ka1i mantan I +-E. Kalimantan II + +BitungC.Sulawesi I + +Ujung PandangBali + +
+ Export (l oadi ng) Import (unloading)
HN: Basic Human Needs NS: Nusantara ShipsBD: Basic Commodities LK: Lokal Ships
for Development SP: Special ShipsOC: Other Trade BG: Barges
Commodities PR: Prahus
Sources: Tables 52-75 (Appendix A).
260
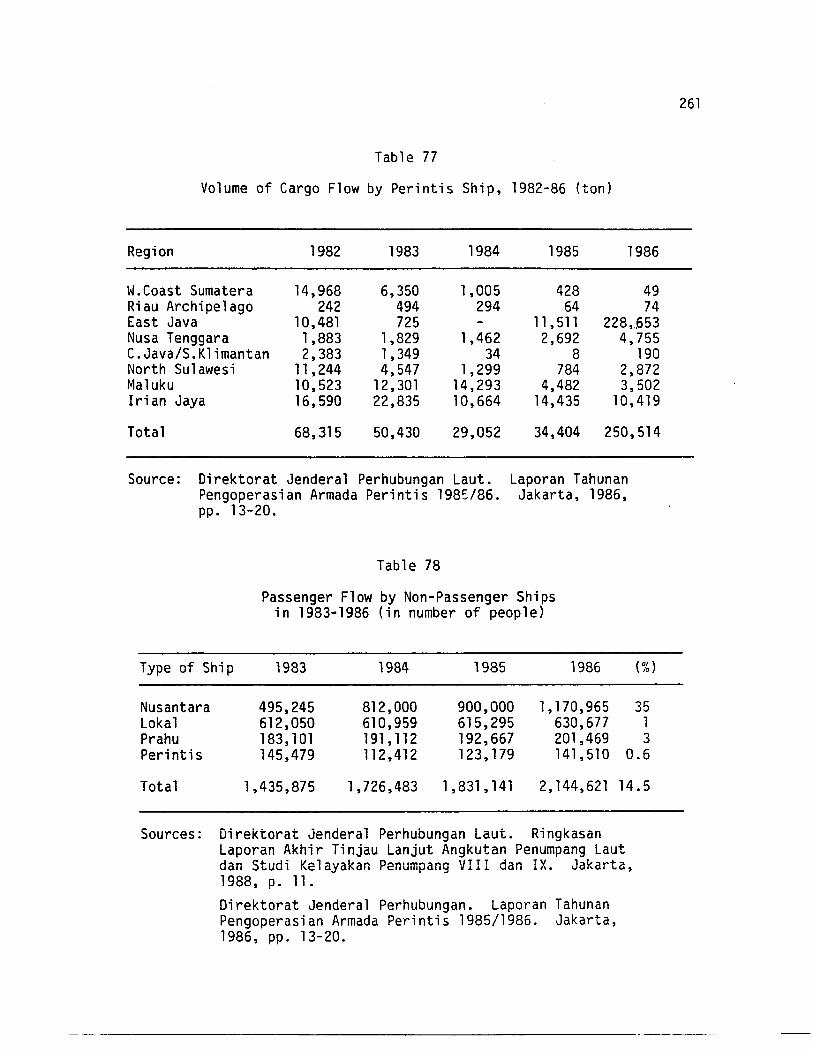
261
Table 77
Volume of Cargo Flow by Perintis Ship, 1982-86 (ton)
Region 1982 1983 1984 1985 1986
W.Coast Sumatera 14,968 6,350 1,005 428 49Riau Archipelago 242 494 294 64 74East Java 10,481 725 11 ,511 228,.653Nusa Tenggara 1,883 1,829 1,462 2,692 4,755C.Java/S.Klimantan 2,383 1,349 34 8 190North Sulawesi 11 ,244 4,547 1,299 784 2,872Maluku 10,523 12,301 14,293 4,482 3,502Irian Jaya 16,590 22,835 10,664 14,435 10,419
Total 68,315 50,430 29,052 34,404 250,514
Source: Direktorat Jenderal Perhubungan Laut. Laporan TahunanPengoperasian Armada Perintis 1985/86. Jakarta, 1986,pp.13-20.
Table 78
Passenger Flow by Non-Passenger Shipsin 1983-1986 (in number of people)
Type of Ship 1983 1984 1985 1986 (%)
Nusantara 495,245 812,000 900,000 1,170,965 35Loka1 612,050 610,959 615,295 630,677 1Prahu 183,101 191,112 192,667 201,469 3Perintis 145,479 112,412 123,179 141,510 0.6
Total 1,435,875 1,726,483 1,831,141 2,144,621 14.5
Sources: Direktorat jenderal Perhubungan Laut. RingkasanLaporan Akhir Tinjau Lanjut Angkutan Penumpang Lautdar. Studi Ke1ayakar. Penumpang VIII dan IX. Jakarta,1988, p, 11.
Direktorat Jendera1 Perhubungan. Laporan TahunanPengoperasian Armada Perintis 1985/1986. Jakarta,1986, pp. 13- 20.
----------------------------------
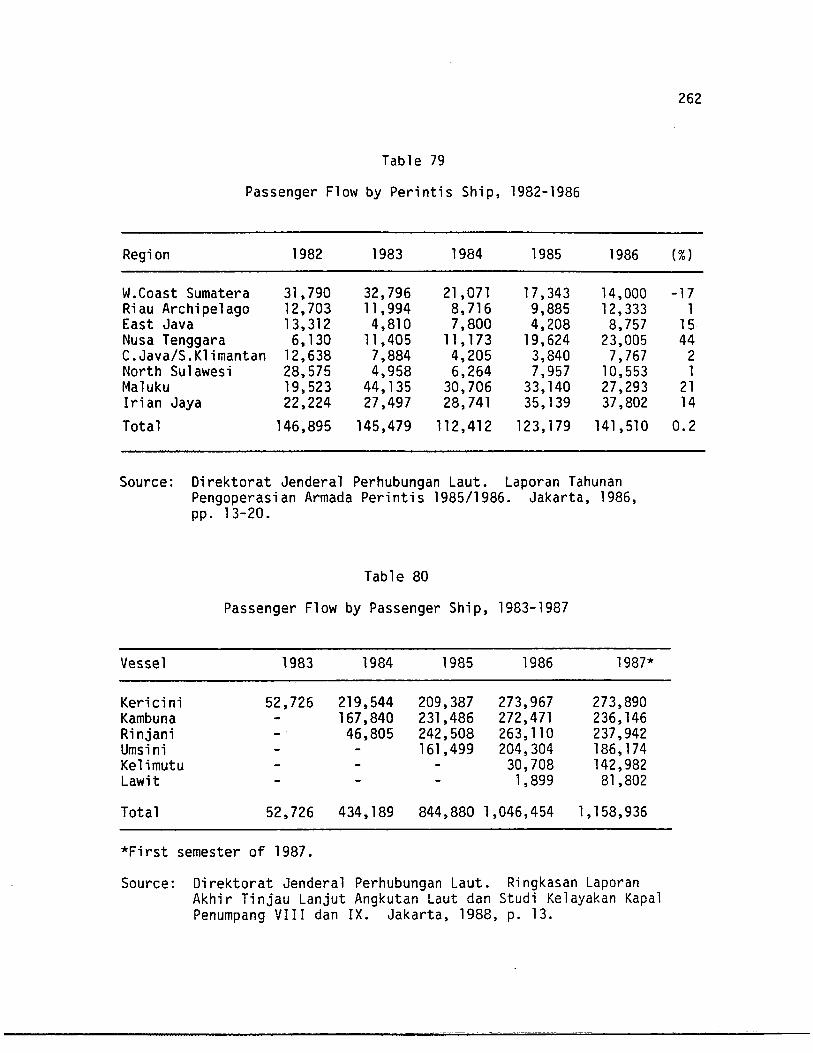
Table 79
Passenger Flow by Perintis Ship, 1982-1986
262
Region 1982 1983 1984 1985 1986 (%)
W.Coast Sumatera 31,790 32,796 21,071 17,343 14,000 -17Riau Archipelago 12,703 11 ,994 8,716 9,885 12,333 1East Java 13,312 4,810 7,800 4,208 8,757 15Nusa Tenggara 6,130 11,405 11 , 173 19,624 23,005 44C.Java/S.Klimantan 12,638 7,884 4,205 3,840 7,767 2North Sulawesi 28.575 4.958 6,264 7,957 10.553 1Ma1uku 19,523 44.135 30.706 33.140 27.293 21Irian Jaya 22.224 27,497 28,741 35.139 37.802 14
Total 146.895 145.479 112,412 123,179 141.510 0.2
Source: Direktorat Jenderal Perhubungan Laut. Laporan TahunanPengoperasian Armada Perintis 1985/1986. Jakarta. 1986,pp. 13-20.
Table 80
Passenger Flow by Passenger Ship. 1983-1987
Vessel 1983 1984 1985 1986 1987*
Kericini 52.726 219.544 209.387 273,967 273,890Kambuna 167,840 231.486 272,471 236,146Rinjani - 46,805 242,508 263,110 237,942Umsini 161,499 204,304 186, 174Kelimutu 30,708 142,982Lawit 1,899 81,802
Total 52,726 434,189 844,880 1,046,454 1,158,936
*First semester of 1987.
Source: Direktorat Jendera1 Perhubungan Laut. Ringkasan LaporanAkhir Tinjau Lanjut Angkutan Laut dan Studi Kelayakan Kapa1Penumpang VIII dan IX. Jakarta, 1988, p. 13.
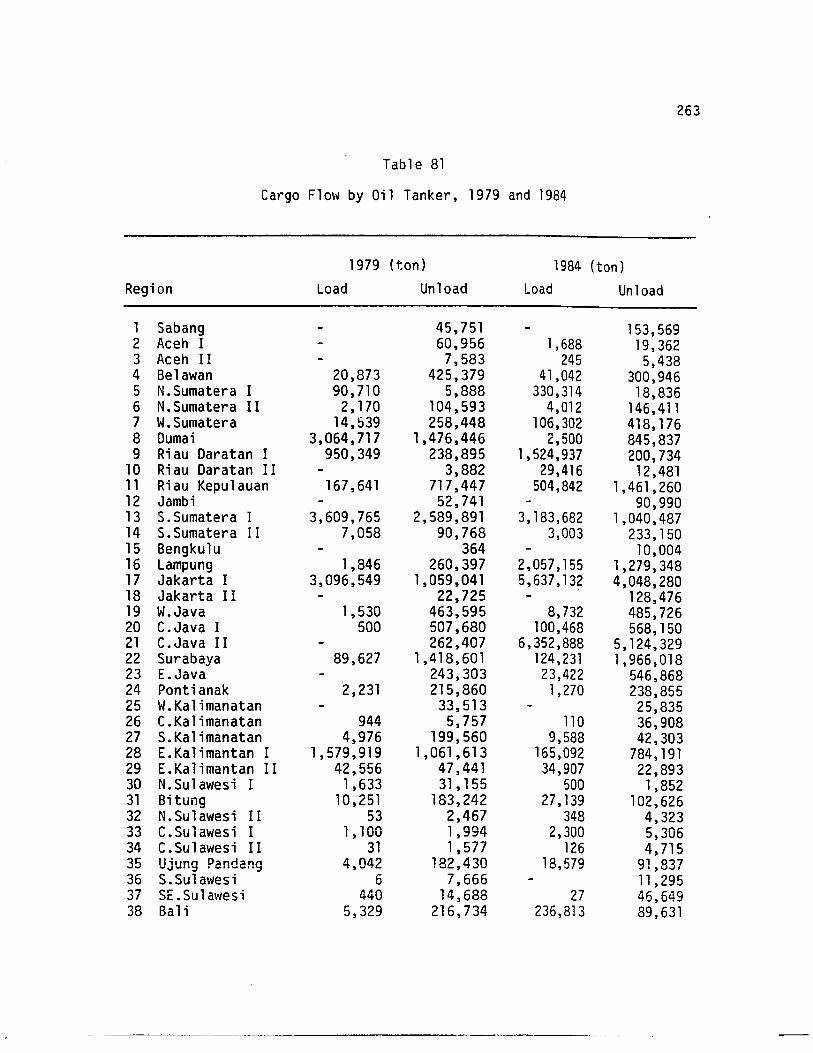
Table 81
Cargo Flow by Oil Tanker, 1979 and 1984
263
1979 (t.on) 1984 (ton)Region Load Unload Load Unload
1 Sabang 45,751 153,5692 Aceh I 60,956 1,688 19,3623 Aceh II 7,583 245 5,4384 Belawan 20,873 425,379 41,042 300,9465 N.Sumatera I 90,710 5,888 330,314 18,8366 N.Sumatera II 2,170 104,593 4,012 146,4117 W.Sumatera 14,!:>39 258,448 106,302 418,1768 Dumai 3,064,717 1,476,446 2,500 845,8379 Riau Daratan I 950,349 238,895 1,524,937 200,734
10 Riau Daratan II 3,882 29,416 12,48111 Riau Kepulauan 167,641 717,447 504,842 1,461,26012 Jambi 52,741 90,99013 S.Sumatera I 3,609,765 2,589,891 3,183,682 1,040,48714 S.Sumatera I I 7,058 90,768 3,003 233,15015 Bengkulu 364 10,00416 Lampung 1,846 260,397 2,057,155 1,279,34817 Jakarta I 3,096,549 1,059,041 5,637,132 4,048,28018 Jakarta II 22,725 128,47619 W.Java 1,530 463,595 8,732 485,72620 C.Java I 500 507,680 100,468 568,15021 C.Java II 262,407 6,352,888 5,124,32922 Surabaya 89,627 1,418,601 124,231 1,966,01823 E.Java 243,303 23,422 546,86824 Pontianak 2,231 215,860 1,270 238,85525 W.Kalimanatan 33,513 25,83526 C.Ka 1i manatan 944 5,757 110 36,90827 S.Kalimanatan 4,976 199,560 9,588 42,30328 E.Kalimantan I 1,579,919 1,061,613 165,092 784,19129 E.Ka1imantan II 42,556 47,441 34,907 22,89330 N.Sulawesi I 1,633 31 , 155 500 1,85231 Bitung 10,251 183,242 27,139 102,62632 N.Sulawesi II 53 2,467 348 4,32333 C.Su1awesi I 1,100 1,994 2,300 5,30634 C.Sulawesi II 31 1,577 126 4,71535 Ujung Pandang 4,042 182,430 18,579 91,83736 S.Sulawesi 6 7,666 11 ,29537 SE.Sulawesi 440 14,688 27 46,64938 Bali 5,329 216,734 236,813 89,631
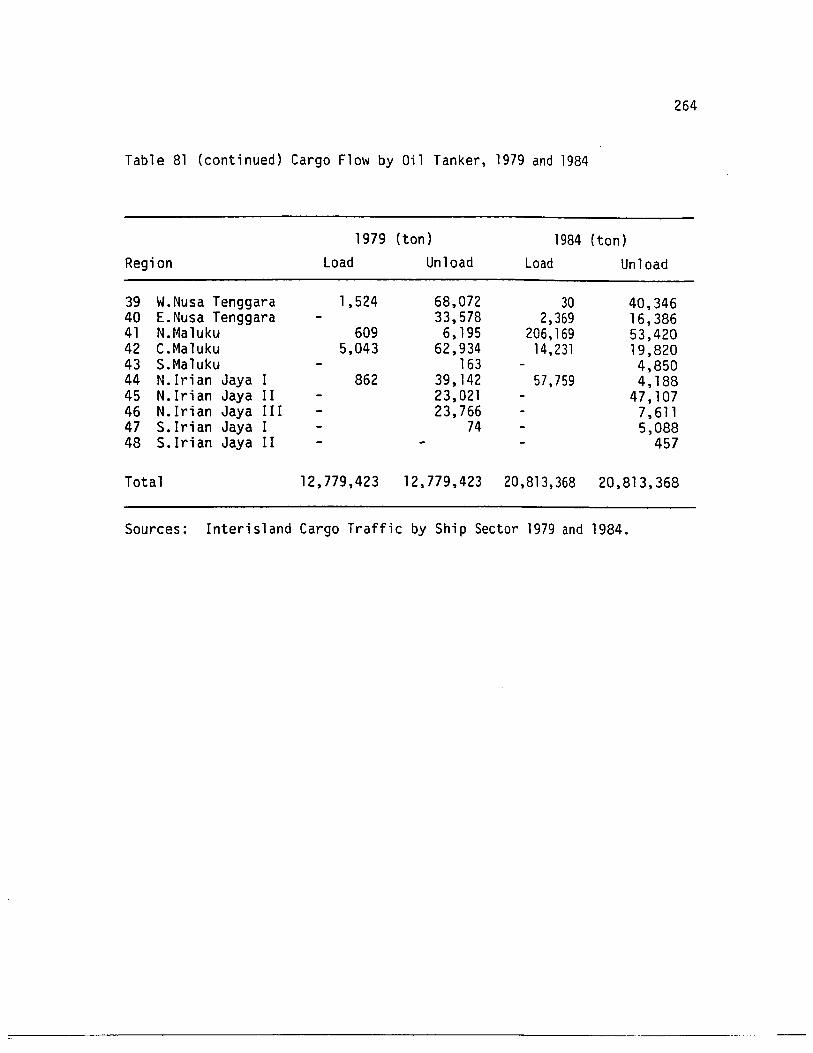
Table 81 (continued) Cargo F10\'1 by Oil Tanker, 1979 and 1984
264
1979 (ton) 1984 (ton)Region Load Unload Load Unload
39 W.Nusa Tenggara 1,524 68,072 30 40,34640 E.Nusa Tenggara 33,578 2,369 16,38641 N.Maluku 609 6,195 206,169 53,42042 C.Maluku 5,043 62,934 14,231 19,82043 S.Maluku 163 4,85044 N. Irian Jaya I 862 39, 142 57,759 4,18845 N.lrian Jaya I I 23,021 47,10746 N.lrian Jaya III 23,766 7,61147 S.lrian Jaya I 74 5,08848 S.lrian Jaya II 457
Total 12,779,423 12,779,423 20,813,368 20,813,368
Sources: Interisland Cargo Traffic by Ship Sector 1979 and 1984.
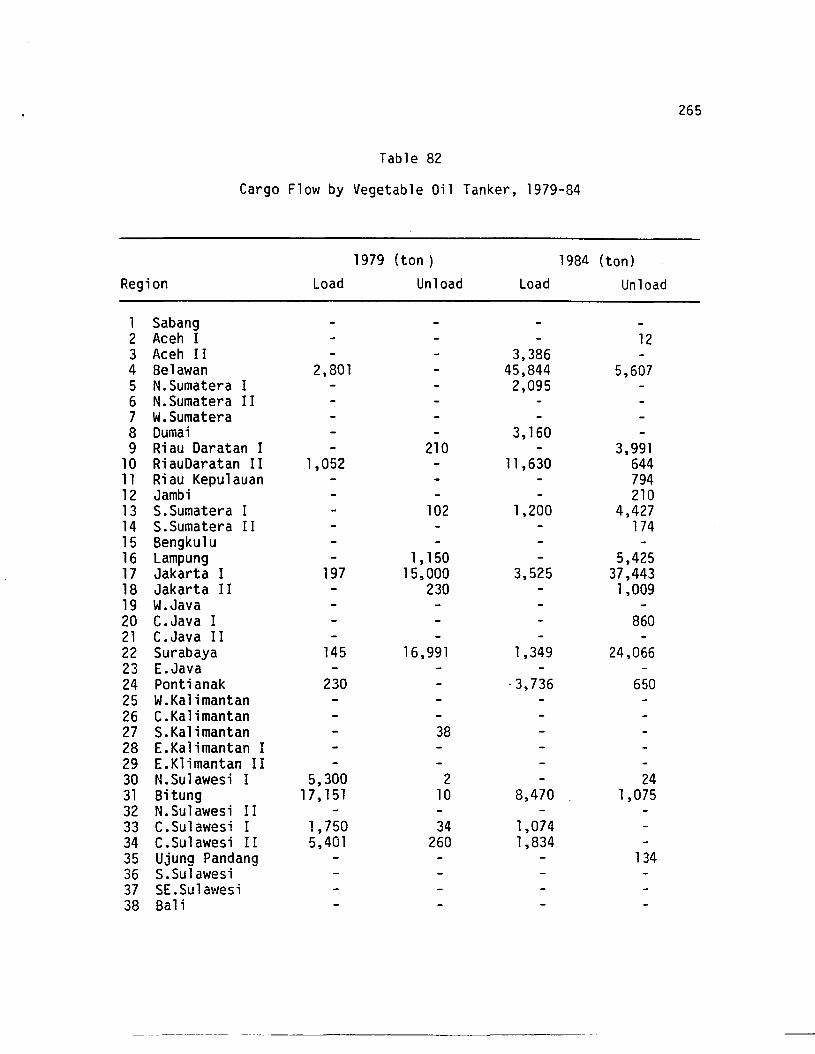
Table 82
Cargo Flow by Vegetable Oil Tanker, 1979-84
1979 (ton) 1984 (ton)Region Load Unload Load Unload
1 Sabang2 Aceh I 123 Aceh II 3,3864 Be1awan 2,801 45,844 5,6075 N.Sumatera I 2,0956 N.Sumatera I I7 W.Sumatera8 Dumai 3,1609 Riau Daratan I 210 3,991
10 RiauDaratan II 1,052 11,630 64411 Riau Kepulauan 79412 Jambi 21013 S.Sumatera I 102 1,200 4,42714 S.Sumatera II 17415 Bengkulu16 Lampung 1,150 5,42517 Jakarta I 197 15,000 3,525 37,44318 Jakarta II 230 1,00919 W.Java20 C.Java I 86021 C.Java II22 Surabaya 145 16,991 1,349 24,06623 E.Java24 Pontianak 230 '3,736 65025 W.Kalimantan26 C.Kalimantan27 S.Kalimantan 3828 E.Kalimantan I29 E.Kl imantan II30 N.Sulawesi I 5,300 2 2431 Bitung 17, 151 10 8,470 1,07532 N.Sulawesi I I33 C.Su1awesi I 1,750 34 1,07434 C.Su1 awesi II 5,401 260 1,83435 Ujung Pandang 13436 S.Su1awesi37 SE. Su1a\'/es;38 Bal i
--------------------------------
265
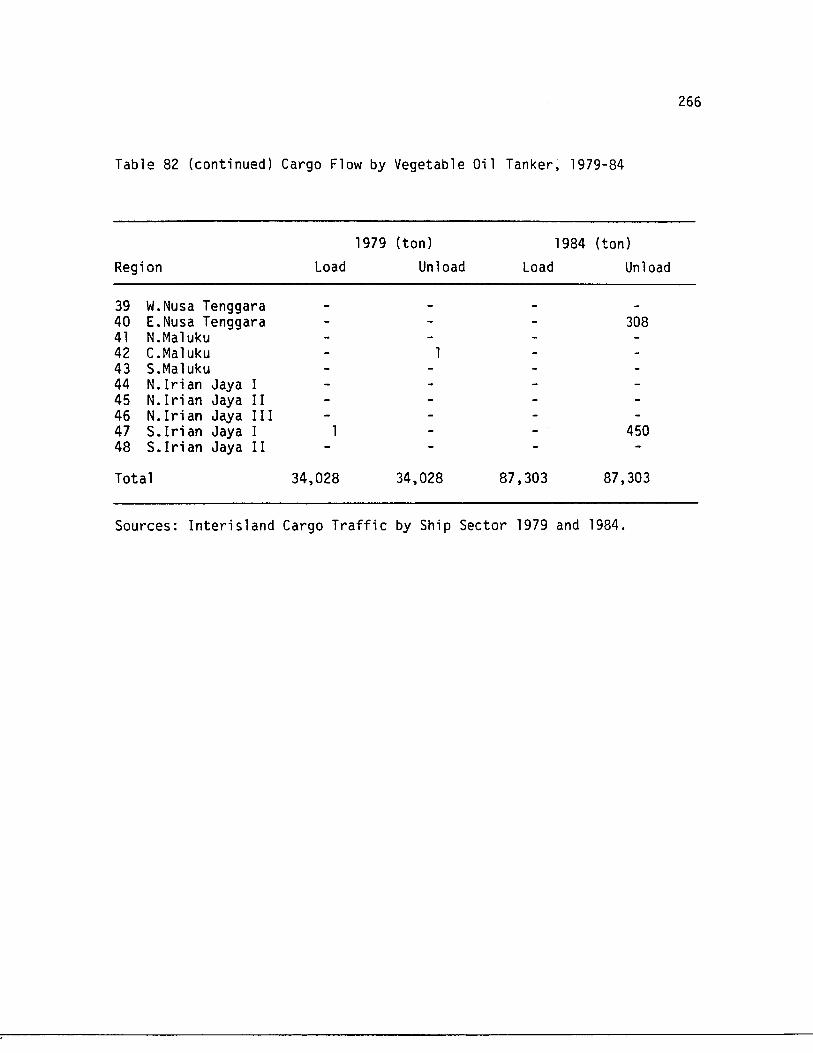
Table 82 (continued) Cargo Flow by Vegetable Oil Tanker, 1979-84
1979 (ton) 1984 (ton)Region Load Unload Load Unload
39 W.Nusa Tenggara40 E.Nusa Tenggara 30841 N.Ma1uku42 C.Ma1uku43 S.Ma1uku44 N.Irian Jaya I45 N.Irian Jaya II46 N.Irian Jaya I I I47 S. Iri an Jaya I 45048 S. Iri an Jaya II
Total 34,028 34,028 87,303 87,303
Sources: Interisland Cargo Traffic by Ship Sector 1979 and 1984.
266
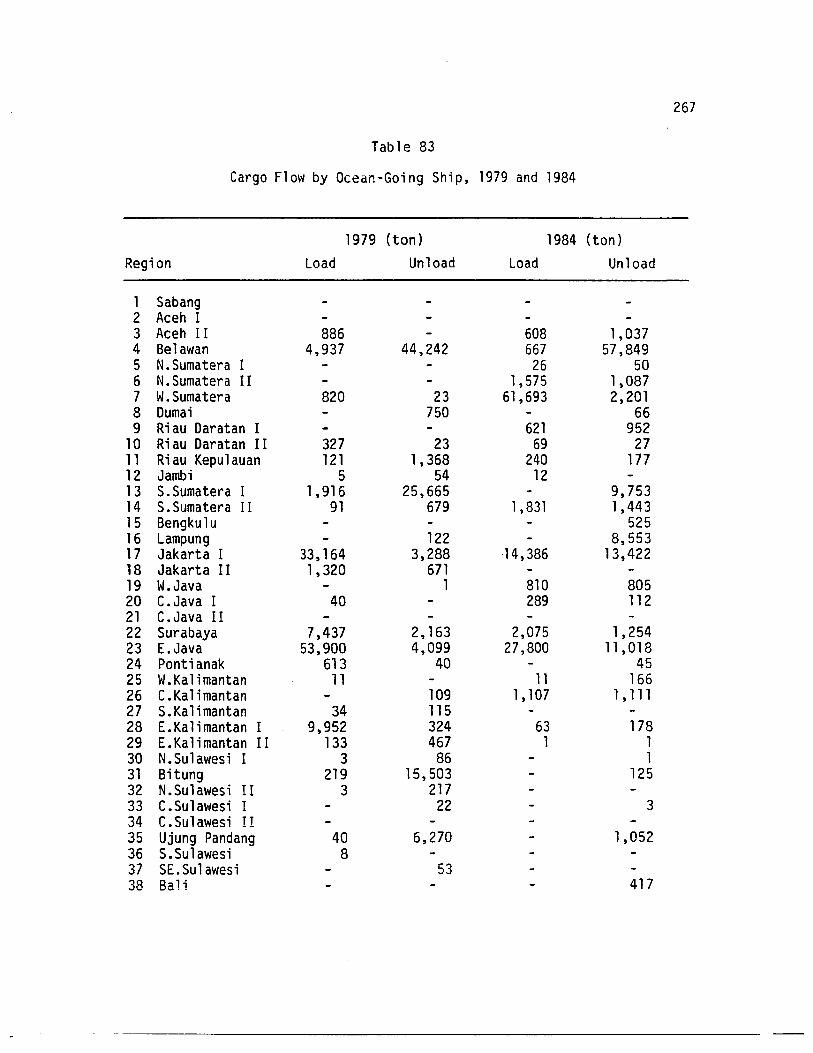
Table 83
Cargo Flow by Ocean-Going Ship, 1979 and 1984
1979 (ton) 1984 (ton)Region Load Unload Load Unload
1 Sabang2 Aceh I3 Aceh II 886 608 1,0374 Belawan 4,937 44,242 667 57,8495 N.Sumatera I 26 506 N.Sumatera II 1,575 1,0877 W.Sumatera 820 23 61,693 2,2018 Dumai 750 669 Riau Daratan I 621 952
10 Riau Daratan II 327 23 69 2711 Riau Kepulauan 121 1,368 240 17712 Jambi 5 54 1213 S.Sumatera I 1,916 25,665 9,75314 S.Sumatera II 91 679 1,831 1,44315 Bengkulu 52516 Lampung 122 8,55317 Jakarta I 33,164 3,288 ·14,386 13,42218 Jakarta II 1,320 67119 W.Java 1 810 80520 C.Java I 40 289 11221 C.Java II22 Surabaya 7,437 2,163 2,075 1,25423 E.Java 53,900 4,099 27,800 11 ,01824 Pontianak 613 40 4525 W.Kalimantan 11 11 16626 C.Kalimantan 109 1,107 1, 11127 S.Kalimantan 34 11528 E.Kalimantan I 9,952 324 63 17829 E.Kalimantan I I 133 467 1 130 N.Sulawesi I 3 86 131 Bitung 219 15,503 12532 N.Sulawesi II 3 21733 C.Sulawesi I 22 334 C.Sulawesi II35 Ujung Pandang 40 6,270 1,05236 S.Sulawesi 837 SEe Su1awes i 5338 Bal i 417
267
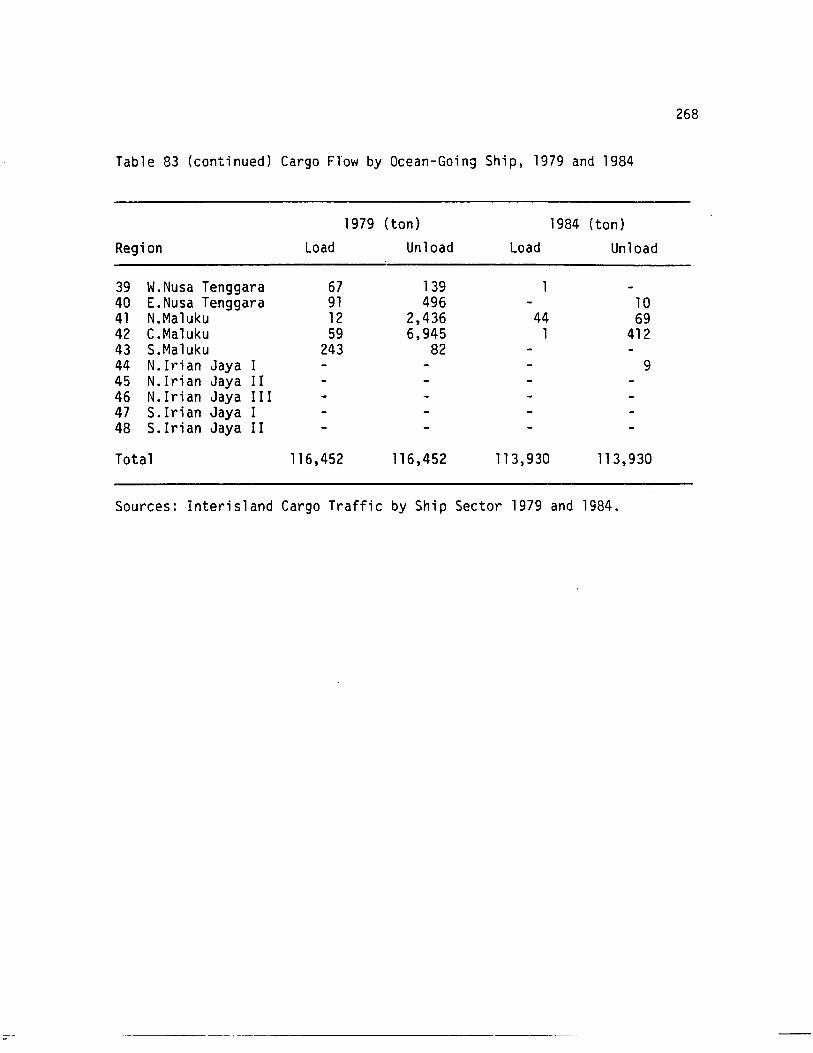
Table 83 (continued) Cargo Flow by Ocean-Going Ship, 1979 and 1984
1979 (ton) 1984 (ton)Region Load Unload Load Unload
39 W.Nusa Tenggara 67 13940 E.Nusa Tenggara 91 496 1041 N.Ma1uku 12 2,436 44 6942 C.Maluku 59 6,945 1 41243 S.Ma1uku 243 8244 N.lrian Jaya I 945 N. Iri an Jaya II46 N.lrian Jaya III47 S.lrian Jaya I48 S.lrian Jaya II
Total 116,452 116,452 113,930 113,930
Sources: Interisland Cargo Traffic by Ship Sector 1979 and 1984.
------- - ----
268
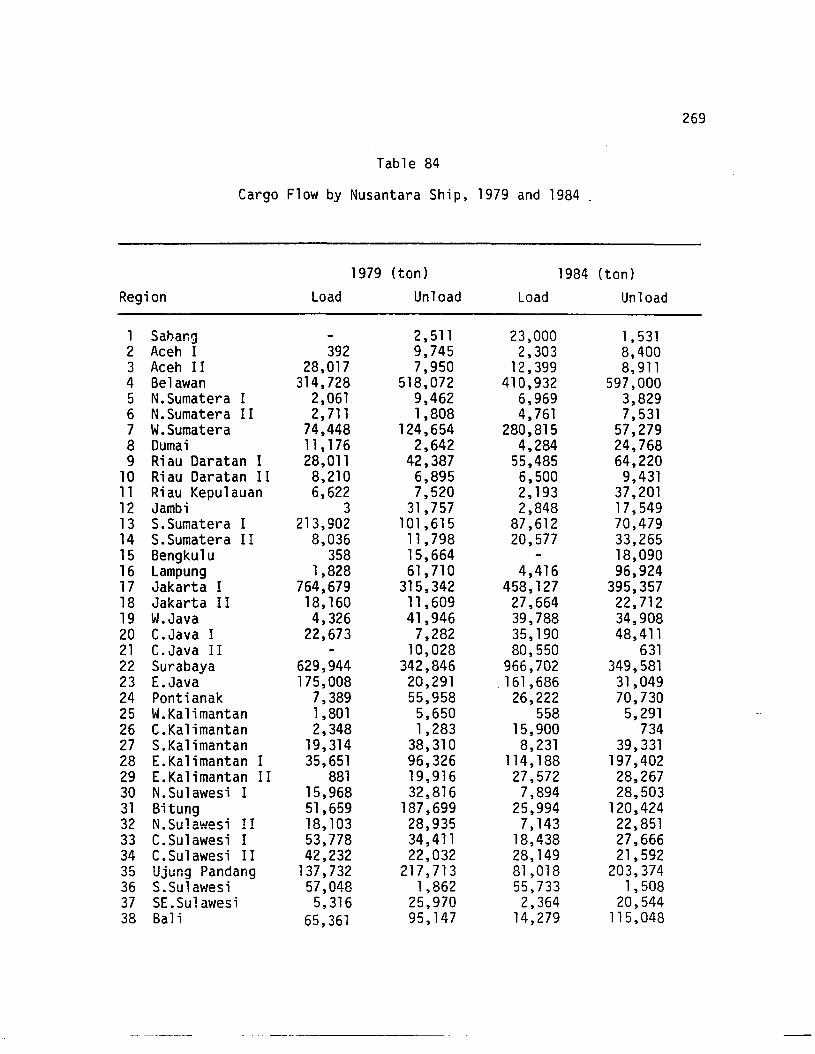
Table 84
Cargo Flow by Nusantara Ship, 1979 and 1984 .
1979 (ton) 1984 (ton)Region Load Unload Load Unload
1 Sabang 2,511 23,000 1,5312 Aceh I 392 9,745 2,303 8,4003 Aceh II 28,017 7,950 12,399 8,9114 Belawan 314,728 518,072 410,932 597,0005 N.Sumatera I 2,061 9,462 6,969 3,8296 N.Sumatera II 2,711 1,808 4,761 7,5317 W.Sumatera 74,448 124,654 280,815 57,2798 Dumai 11 , 176 2,642 4,284 24,7689 Riau Daratan I 28,011 42,387 55,485 64,220
10 Riau Daratan II 8,210 6,895 6,500 9,43111 Riau Kepulauan 6,622 7,520 2,193 37,20112 Jambi 3 31,757 2,848 17,54913 S.Sumatera I 213,902 101,615 87,612 70,47914 S.Sumatera I I 8,036 11,798 20,577 33,26515 Bengku1u 358 15,664 18,09016 Lampung 1,828 61,710 4,416 96,92417 Jakarta I 764,679 315,342 458,127 395,35718 Jakarta II 18,160 11,609 27,664 22,71219 W.Java 4,326 41,946 39,788 34,90820 C.Java I 22,673 7,282 35,190 48,41121 C.Java II 10,028 80,550 63122 Surabaya 629,944 342,846 966,702 349,58123 LJava 175,008 20,291 . 161,686 31,04924 Pontianak 7,389 55,958 26,222 70,73025 W.Kalimantan 1,801 5,650 558 5,29126 C.Kalimantan 2,348 1,283 15,900 73427 S.Kalimantan 19,314 38,310 8,231 39,33128 L Ka1i mantan I 35,651 96,326 114,188 197,40229 E.Kalimantan II 881 19,916 27,572 28,26730 N.Sulawesi I 15,968 32,816 7,894 28,50331 Bitung 51,659 187,699 25,994 120,42432 N.Su1awesi II 18,103 28,935 7,143 22,85133 C.Sulawesi I 53,778 34,411 18,438 27,66634 C.Sulawesi II 42,232 22,032 28,149 21,59235 Ujung Pandang 137,732 217,713 81,018 203,37436 S.Su1awesi 57,048 1,862 55,733 1,50837 SE.Sulawesi 5,316 25,970 2,364 20,54438 Bali 65,361 95,147 14,279 115,048
269
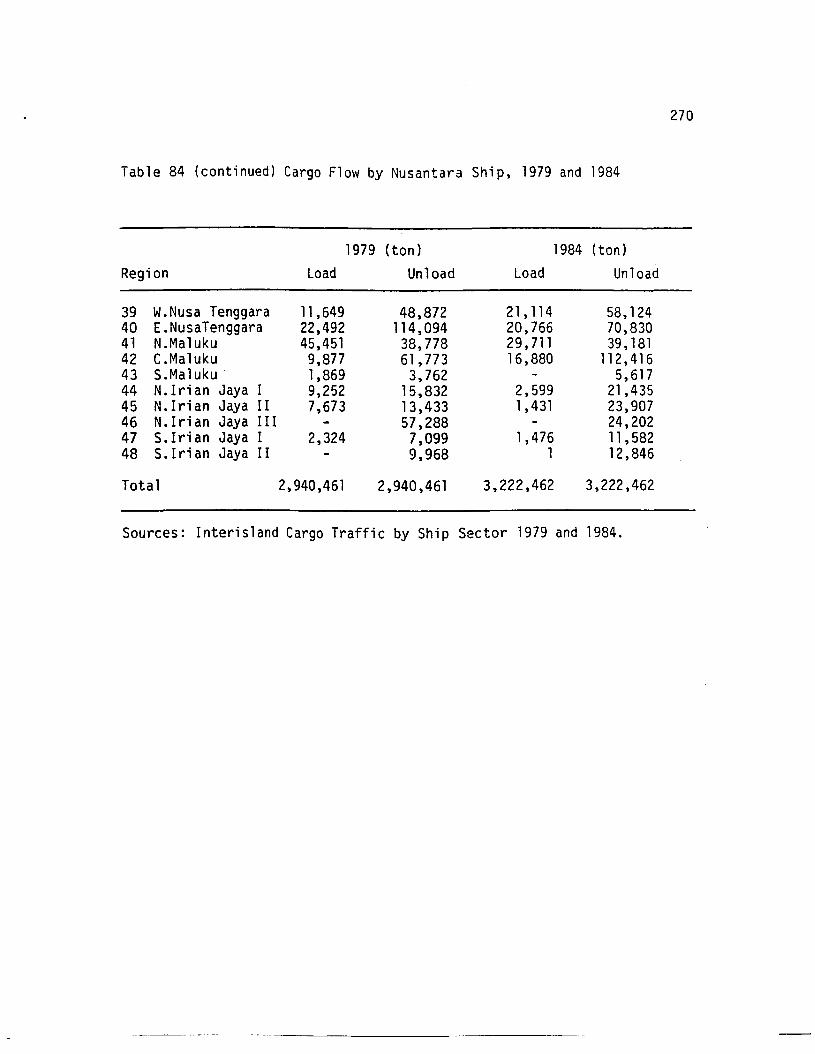
Table 84 (continued) Cargo Flow by Nusantara Ship, 1979 and 1984
1979 (ton) 1984 (ton)Region Load Unload Load Unload
39 W.Nusa Tenggara 11,649 48,872 21,114 58,12440 E.NusaTenggara 22,492 114,094 20,766 70,83041 N.Maluku 45,451 38,778 29,711 39,18142 C.Maluku 9,877 61,773 16,880 112,41643 S.Maluku· 1,869 3,762 5,61744 N.lrian Jaya I 9,252 15,832 2,599 21,43545 N.lrian Jaya II 7,673 13,433 1,431 23,90746 N.lrian Jaya I I I 57,288 24,20247 S.Irian Jaya I 2,324 7,099 1,476 11 ,58248 S. Iri an Jaya II 9,968 1 12,846
Total 2,940,461 2,940,461 3,222,462 3,222,462
Sources: Interisland Cargo Traffic by Ship Sector 1979 and 1984.
270
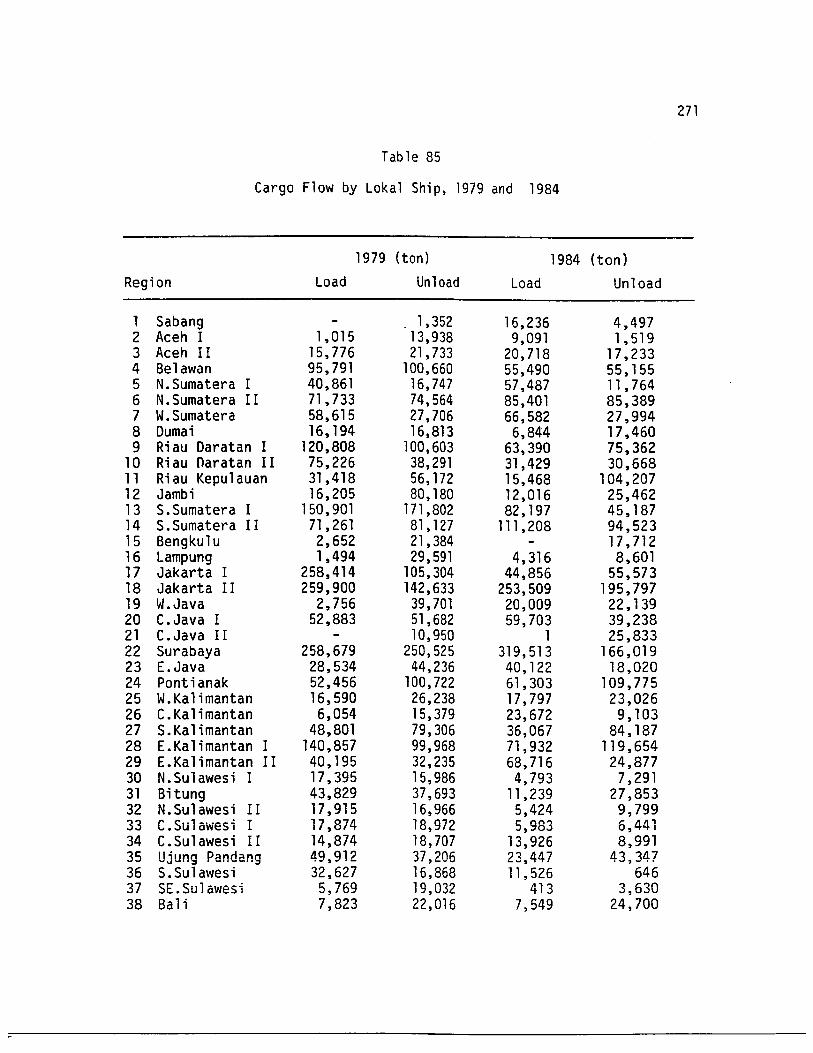
Table 85
Cargo Flow by Lokal Ship, 1979 and 1984
1979 (ton) 1984 (ton)Region Load Unload Load Unload
1 Sabang 1,352 16,236 4,4972 Aceh I 1,015 13,938 9,091 1,5193 Aceh II 15,776 21,733 20,718 17,2334 Belawan 95,791 100,660 55,490 55,1555 N.Sumatera I 40,861 16,747 57,487 11 ,7646 N.Sumatera II 71,733 74,564 85,401 85,3897 W.Sumatera 58,615 27,706 66,582 27,9948 Dumai 16,194 16,813 6,844 17,4609 Riau Daratan I 120,808 100,603 63,390 75,362
10 Riau Oaratan II 75,226 38,291 31,429 30,66811 Riau Kepulauan 31,418 56,172 15,468 104,20712 Jambi 16,205 80,180 12,016 25,46213 S.Sumatera I 150,901 171,802 82,197 45,18714 S.Sumatera II 71 ,261 81,127 111 ,208 94,52315 Bengkulu 2,652 21,384 17,71216 Lampung 1,494 29,591 4,316 8,60117 Jakarta I 258,414 105,304 44,856 55,57318 Jakarta II 259,900 142,633 253,509 195,79719 W.Java 2,756 39,701 20,009 22,13920 C.Java I 52,883 51,682 59,703 39,23821 C.Java II 10,950 1 25,83322 Surabaya 258,679 250,525 319,513 166,01923 E. Java 28,534 44,236 40,122 18,02024 Pontianak 52,456 100,722 61,303 109,77525 W.Ka1imantan 16,590 26,238 17,797 23,02626 C.Kalimantan 6,054 15,379 23,672 9,10327 S.Kalimantan 48,801 79,306 36,067 84,18728 E.Ka1imantan I 140,857 99,968 71,932 119,65429 E.Kalimantan II 40,195 32,235 68,716 24,87730 N.Sulawesi I 17,395 15,986 4,793 7,29131 Bitung 43,829 37,693 11 ,239 27,85332 N. Sulawesi II 17,915 16,966 5,424 9,79933 C.Su1awesi I 17,874 18,972 5,983 6,44134 C.Sulawesi II 14,874 18,707 13,926 8,99135 Ujung Pandang 49,912 37,206 23,447 43,34736 S.Sulawesi 32,627 16,868 11 ,526 64637 SLSulawesi 5,769 19,032 413 3,63038 Sal i 7,823 22,016 7,549 24,700
271
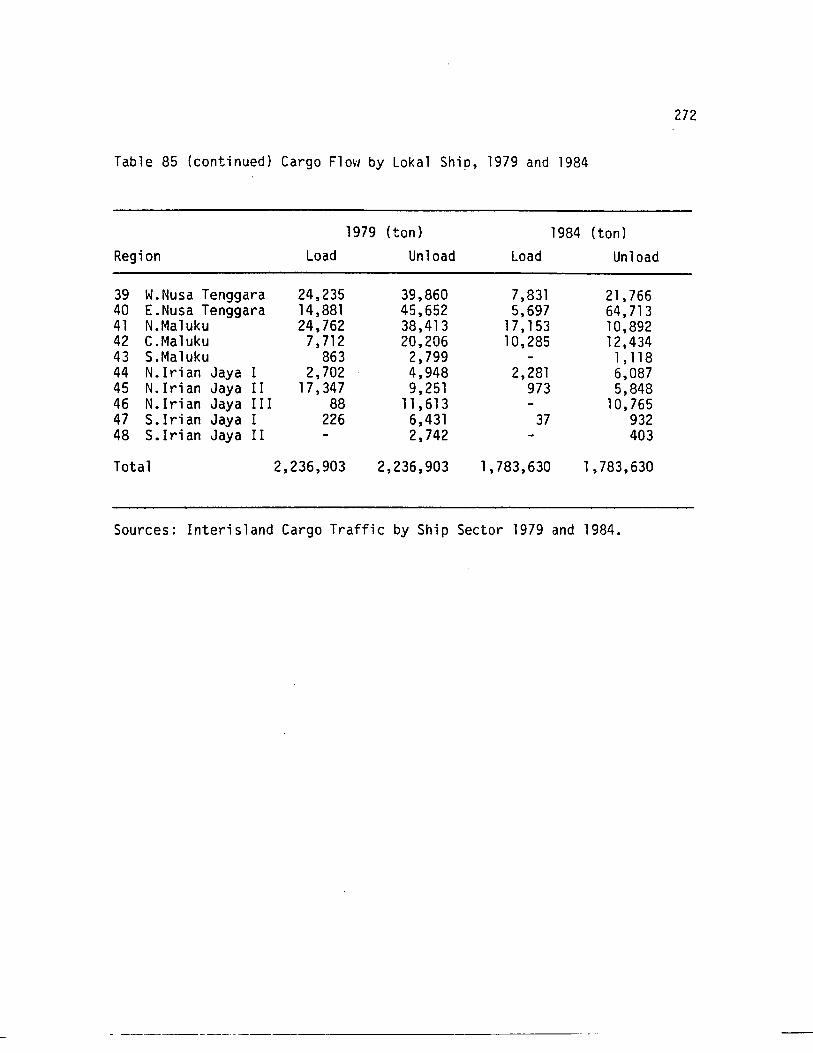
Table 85 (continued) Cargo F1o~ by Loka1 Ship, 1979 and 1984
1979 (ton) 1984 (ton)Region Load Unload Load Unload
39 W.Nusa Tenggara 24,235 39,860 7,831 21,76640 E.Nusa Tenggara 14,881 45,652 5,697 64,71341 N.Ma1uku 24,762 38,413 17, 153 10,89242 C.Ma1uku 7,712 20,206 10,285 12,43443 S.Ma1uku 863 2,799 1,11844 N.Irian Jaya I 2,702 4,948 2,281 6,08745 N.Irian Jaya II 17,347 9,251 973 5,84846 N. Iri an Jaya III 88 11,613 10,76547 S. Iri an Jaya I 226 6,431 37 93248 S.Irian Jaya II 2,742 403
Total 2,236,903 2,236,903 1,783,630 1,783,630
Sources: Interisland Cargo Traffic by Ship Sector 1979 and 1984.
272
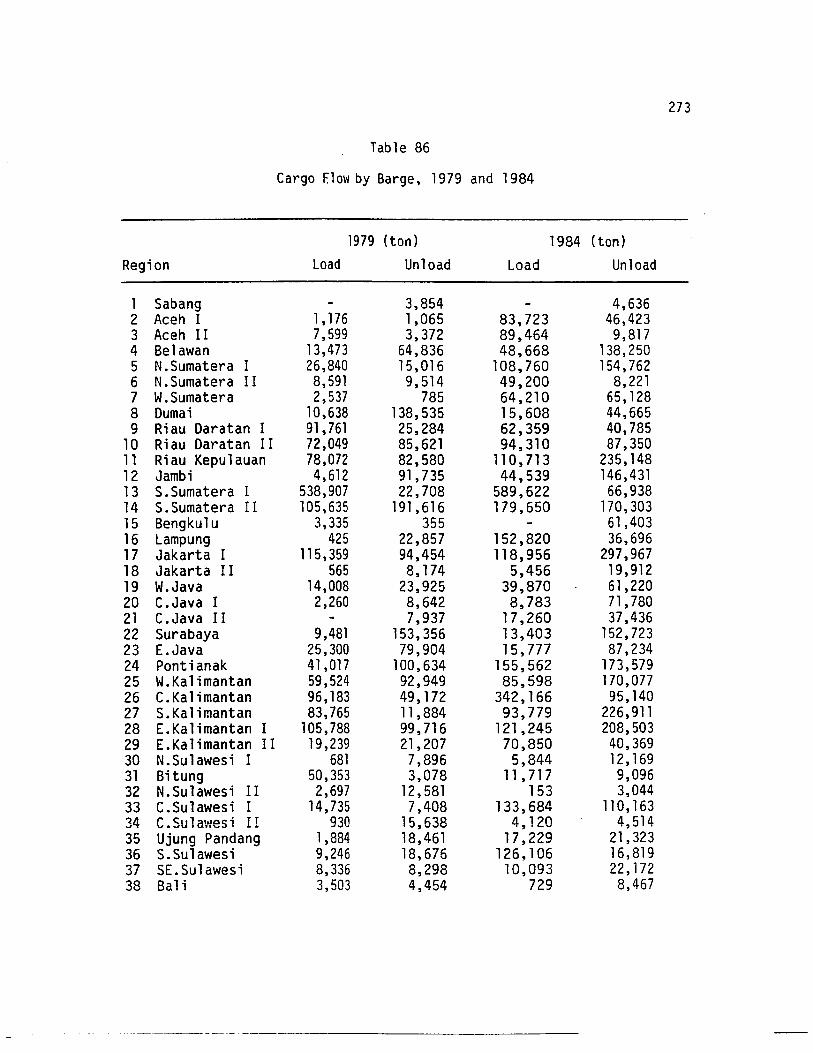
Table 86
Cargo Flow by Barge, 1979 and 1984
1979 (ton) 1984 (ton)
Region Load Unload Load Unload
1 Sabang 3,854 4,6362 Aceh I 1,176 1,065 83,723 46,4233 Aceh II 7,599 3,372 89,464 9,8174 Belawan 13,473 64,836 48,668 138,2505 N.Sumatera I 26,840 15,016 108,760 154,7626 N.Sumatera II 8,591 9,514 49,200 8,2217 W.Sumatera 2,537 785 64,210 65,1288 Dumai 10,638 138,535 15,608 44,6659 Riau Daratan I 91,761 25,284 62,359 40,785
10 Riau Daratan II 72,049 85,621 94,310 87,35011 Riau Kepu1auan 78,072 82,580 110,713 235,14812 Jambi 4,612 91,735 44,539 146,43113 S.Sumatera I 538,907 22,708 589,622 66,93814 S.Sumatera II 105,635 191,616 179,650 170,30315 Bengkulu 3,335 355 61,40316 Lampung 425 22,857 152,820 36,69617 Jakarta I 115,359 94,454 118,956 297,96718 Jakarta II 565 8,174 5,456 19,91219 W.Java 14,008 23,925 39,870 61,22020 C.Java I 2,260 8,642 8,783 71,78021 C.Java II 7,937 17,260 37,43622 Surabaya 9,481 153,356 13,403 152,72323 E. Java 25,300 79,904 15,777 87,23424 Pontianak 41,017 100,634 155,562 173,57925 W.Kalimantan 59,524 92,949 85,598 170,07726 C.Ka 1imantan 96,183 49,172 342,166 95,14027 S.Ka1imantan 83,765 11 ,884 93,779 226,91128 E.Kalimantan I 105,788 99,716 121,245 208,50329 E.Kalimantan II 19,239 21,207 70,850 40,36930 N.Sulawesi I 681 7,896 5,844 12,16931 Bitung 50,353 3,078 11,717 9,09632 N.Su1awesi II 2,697 12,581 153 3,04433 C.Su1awesi I 14,735 7,408 133,684 110,16334 C.Sulawesi II 930 15,638 4,120 4,51435 Ujung Pandang 1,884 18,461 17,229 21,32336 S.Sulawesi 9,246 18,676 126,106 16,81937 SEe Su1awes i 8,336 8,298 10,093 22,17238 Bali 3,503 4,454 729 8,467
273
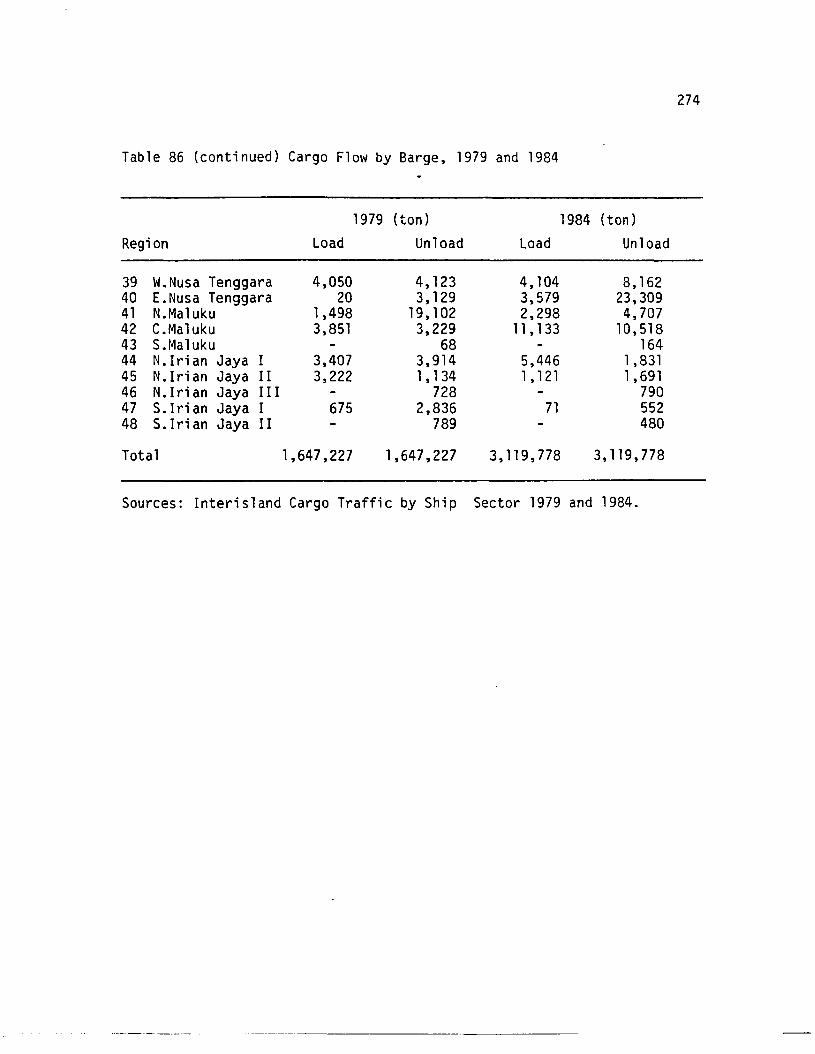
Table 86 (continued) Cargo Flow by Barge, 1979 and 1984
1979 (ton) 1984 (ton)
Region Load Unload Load Unload
39 W.Nusa Tenggara 4,050 4,123 4,104 8,16240 E.Nusa Tenggara 20 3,129 3,579 23,30941 N.Ma1uku 1,498 19,102 2,298 4,70742 C.Ma1uku 3,851 3,229 11 , 133 10,51843 S.Ma1uku 68 16444 N.Irian Jaya I 3,407 3,914 5,446 1,83145 N. Iri an Jaya II 3,222 1, 134 1, 121 1,69146 N. Iri an Jaya I I I 728 79047 S.Irian Jaya I 675 2,836 71 55248 S. Iri an Jaya I I 789 480
Total 1,647,227 1,647,227 3,119,778 3,119,778
Sources: Interisland Cargo Traffic by Ship Sector 1979 and 1984.
.. _.._------ - - ._----------------------
274

Table 87
Cargo Flow by Special Ship, 1979 and 1984
1979 (ton) 1984 (ton)Region Load Unload Load Unload
1 Sabang 312 1,5292 Aceh I 293 7,283 574,566 20,7493 Aceh II 276 12,461 8,708 6,9524 Belawan 46,191 180,722 36,848 665,8625 N.Sumatera I 9,578 3,278 2,783 29,2176 N.Sumatera II 2,840 16,149 19,298 13,0127 W.Sumatera 23,092 80,162 251,819 171 , 5458 Dumai 362 58,625 244 14,0939 Riau Daratan I 49,831 6,570 21,597 32,437
10 Riau Daratan II 13,600 5,048 2,673 12,18411 Riau Kepu1auan 6,445 14,359 1,339 97,47112 Jambi 2,563 5,809 474 10,20713 S.Sumatera I 1,019,236 65,768 1,548,722 107,20714 S.Sumatera I I 25,681 17,270 11 ,869 31,28015 Bengkulu 46 3,287 15,99516 Lampung 105,116 245,956 2,633 80,03817 Jakarta I 197,248 187,220 146,353 385,16918 Jakarta II 2,271 2,458 5,108 32,84019 W.Java 221,496 124,212 126,758 266,57020 C.Java I 6,847 11,490 8,869 241,32221 C.Java II 1 199,633 75,657 440,95422 Surabaya 84,913 433,912 109,038 784,63223 E.Java 227,938 199,468 449,747 449,10124 Pontianak 1,179 6,711 6,902 37,00725 W.Kalimantan 187 2,453 819 6,09526 C.Kalimantan 210 1,693 124,807 7,34427 S.Kalimantan 20,443 8,655 14,246 38,94428 E.Ka1imantan I 161,570 29,518 189,522 51,82429 LKal imantan II 63,708 34,681 311 ,763 6,75830 N.Su1awesi I 2,443 3,540 265 1,38831 Bitung 21,657 29,773 633 36,74132 N.Su1awesi II 4,243 6,098 812 3,24833 C.Sulawesi I 2,685 6,302 2,281 6,72534 C.Su1awesi II 4,728 1,432 2,062 4.03535 Ujung Pandang 11,771 57,563 6,018 70,47536 S.Sulawesi 10,651 7,596 90,403 7,56437 SE.Su1awesi 742 8,901 27,452 22,35338 Bali 54,951 267,686 259,671 236,962
275
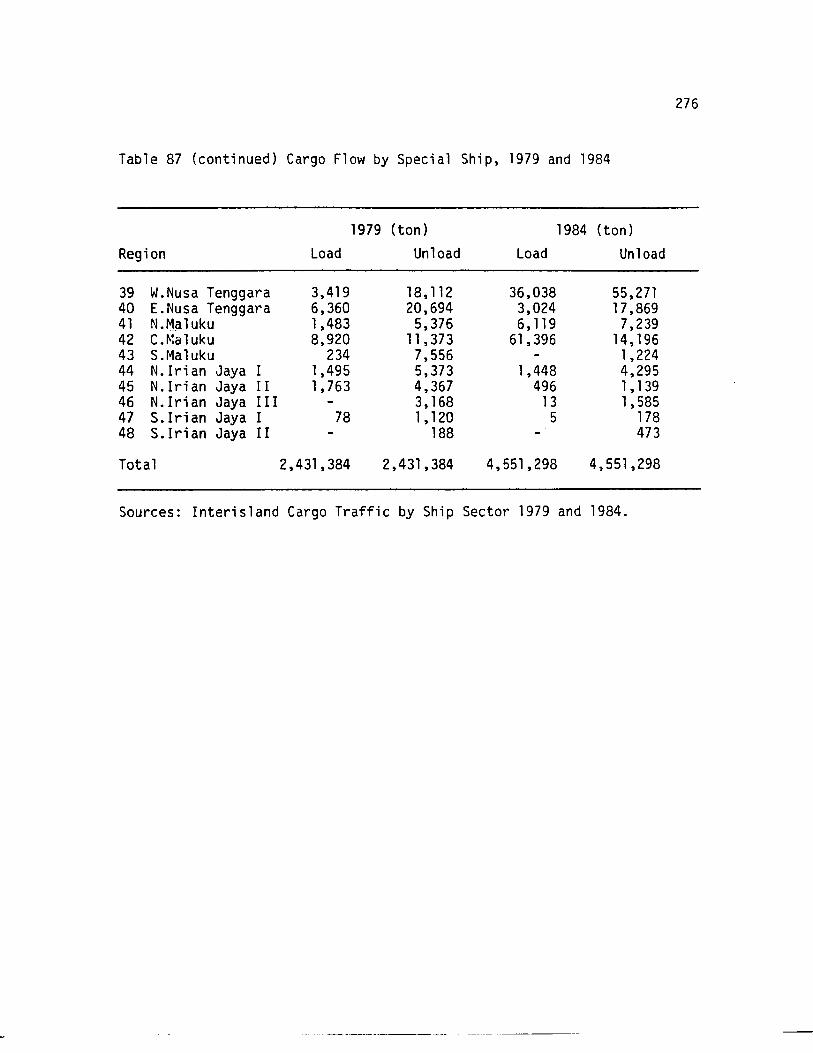
Table 87 (continued) Cargo Flow by Special Ship, 1979 and 1984
1979 (ton) 1984 (ton)
Region Load Unload Load Unload
39 W.Nusa Tenggara 3,419 18,112 36,038 55,27140 E.Nusa Tenggara 6,360 20,694 3,024 17,86941 N.M.~luku 1,483 5,376 6,119 7,23942 C. ~~a1uku 8,920 11 ,373 61,396 14, 19643 S.Maluku 234 7,556 1,22444 N.Irian Jaya I 1,495 5,373 1,448 4,29545 N. Iri an Jaya I I 1,763 4,367 496 1,13946 N.lrian Jaya III 3,168 13 1,58547 S.Irian Jaya I 78 1,120 5 17848 S.Irian Jaya II 188 473
Total 2,431,384 2,431,384 4,551,298 4,551,298
Sources: Interisland Cargo Traffic by Ship Sector 1979 and 1984.
--- -----------
276
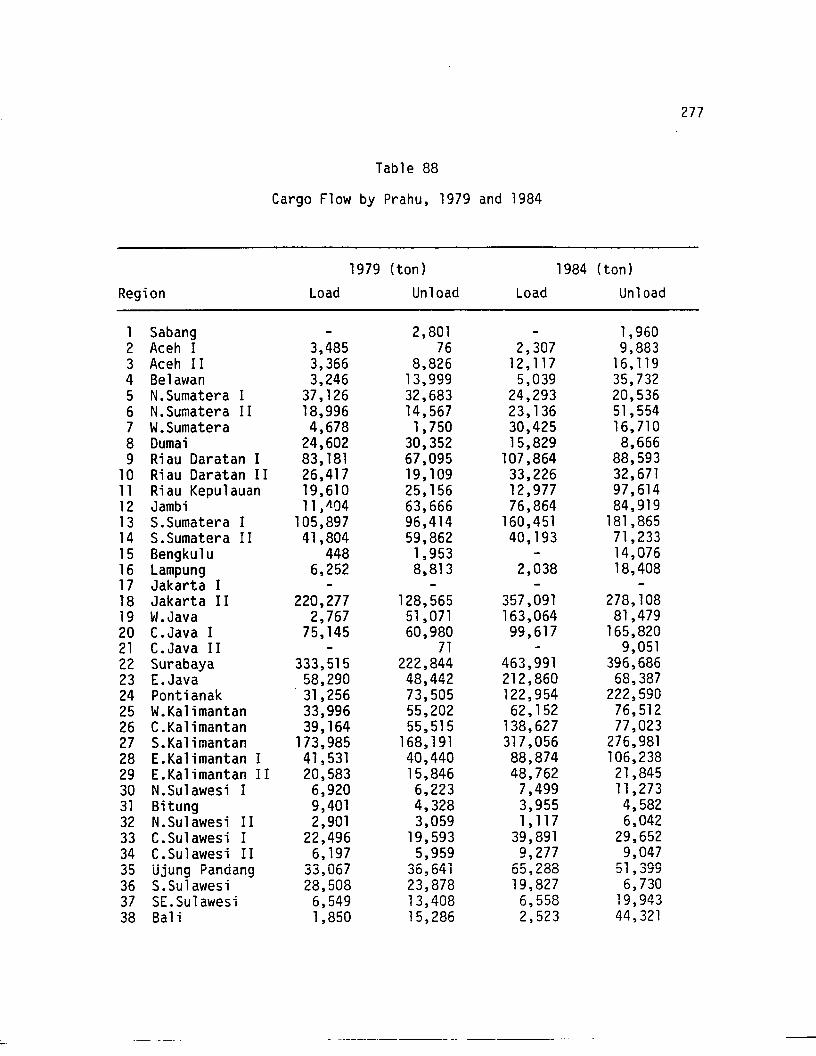
Table 88
Cargo Flow by Prahu, 1979 and 1984
1979 (ton) 1984 (ton)
Region Load Unload Load Unload
1 Sabang 2,801 1,9602 Aceh I 3,485 76 2,307 9,8833 Aceh II 3,366 8,826 12,117 16,1194 Belawan 3,246 13,999 5,039 35,7325 N.Sumatera I 37,126 32,683 24,293 20,5366 N.Sumatera I I 18,996 14,567 23,136 51,5547 W.Sumatera 4,678 1,750 30,425 16,7108 Dumai 24,602 30,352 15,829 8,6669 Riau Daratan I 83,181 67,095 107,864 88,593
10 Riau Daratan II 26,417 19,109 33,226 32,67111 Riau Kepulauan 19,610 25,156 12,977 97,61412 Jambi 11,Il1)4 63,666 76,864 84,91913 S.Sumatera I 105,897 96,414 160,451 181,86514 S.Sumatera I I 41,804 59,862 40,193 71,23315 Bengkulu 448 1,953 14,07616 Lampung 6,252 8,813 2,038 18,40817 Jakarta I18 Jakarta II 220,277 128,565 357,091 278,10819 W.Java 2,767 51,071 163,064 81,47920 C.Java I 75,145 60,980 99,617 165,82021 C.Java II 71 9,05122 Surabaya 333,515 222,844 463,991 396,68623 E. Java 58,290 48,442 212,860 68,38724 Pontianak 31,256 73,505 122,954 222,59025 W.Kalimantan 33,996 55,202 62,152 76,51226 C.Kalimantan 39,164 55,515 138,627 77,02327 S.Kalimantan 173,985 168,191 317,056 276,98128 E. Ka1i mantan I 41,531 40,440 88,874 106,23829 E. Ka1i mantan II 20,583 15,846 48,762 21,84530 N.Sulawesi I 6,920 6,223 7,499 11,27331 Bitung 9,401 4,328 3,955 4,58232 N.Sulawesi II 2,901 3,059 1,117 6,04233 C.Sulawesi I 22,496 19,593 39,891 29,65234 C.Sulawesi II 6,197 5,959 9,277 9,04735 Ujung Pandang 33,067 36,641 65,288 51,39936 S.Sulawesi 28,508 23,878 19,827 6,73037 SLSulawesi 6,549 13,408 6,558 19,94338 Bal i 1,850 15,286 2,523 44,321
--- - --------
277
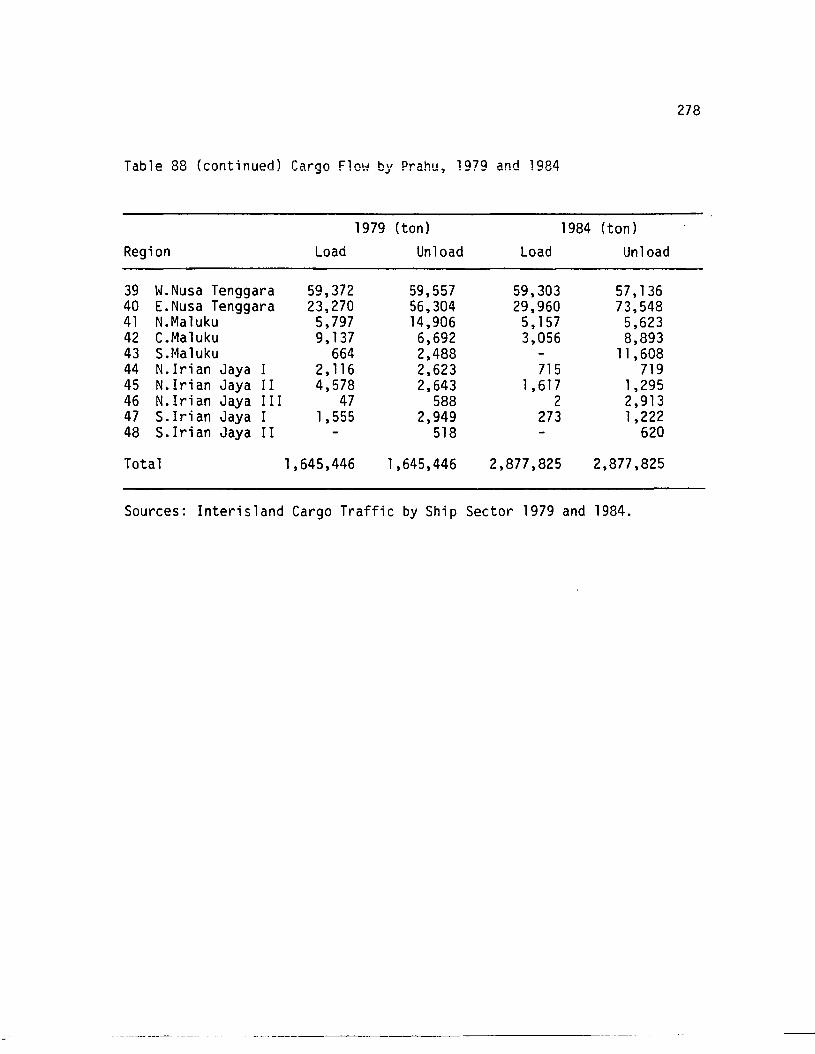
Table 88 (continued) Cargo Flow by Prahu, 1979 and 1984
1979 (ton) 1984 (ton)Region Load Unload Load Unload
39 W.Nusa Tenggara 59,372 59,557 59,303 57,13640 E.Nusa Tenggara 23,270 56,304 29,960 73,54841 N.Maluku 5,797 14,906 5,157 5,62342 C.Maluku 9,137 6,692 3,056 8,89343 S.Maluku 664 2,488 11 ,60844 N.lrian Jaya I 2,116 2,623 715 71945 N.lrian Jaya II 4,578 2,643 1,617 1,29546 N. Iri an Jaya III 47 588 2 2,91347 S.Irian Jaya I 1,555 2,949 273 1,22248 S.Irian Jaya II 518 620
Total 1,645,446 1,645,446 2,877 ,825 2,877 ,825
Sources: Interisland Cargo Traffic by Ship Sector 1979 and 1984.
278
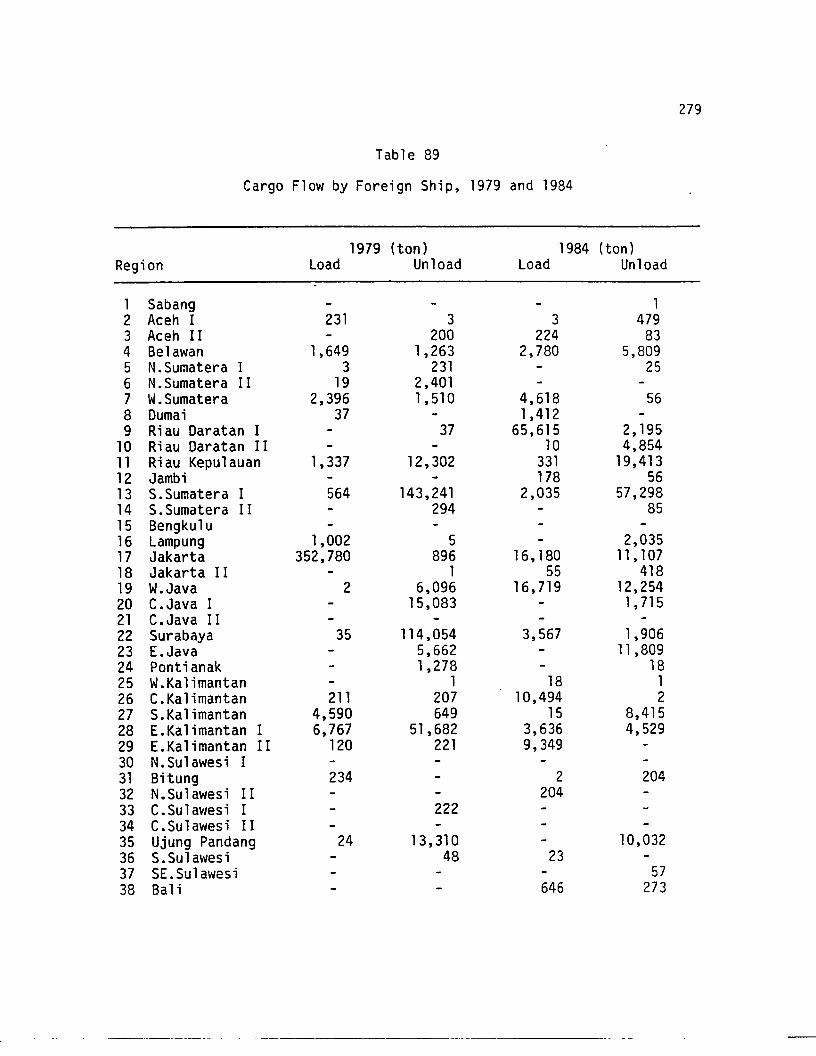
Table 89
Cargo Flow by Foreign Ship, 1979 and 1984
1979 (ton) 1984 (ton)Region Load Unload Load Unload
1 Sabang 12 Aceh I 231 3 3 4793 Aceh II 200 224 834 Belawan 1,649 1,263 2,780 5,8095 N.Sumatera I 3 231 256 N.Sumatera II 19 2,4017 W.Sumatera 2,396 1,510 4,618 568 Dumai 37 1,4129 Riau Daratan I 37 65,615 2,195
10 Riau Daratan II 10 4,85411 Riau Kepulauan 1,337 12,302 331 19,41312 Jambi 178 5613 S.Sumatera I 564 143,241 2,035 57,29814 S.Sumatera I I 294 8515 Bengkulu16 Lampung 1,002 5 2,03517 Jakarta 352,780 896 16, 180 11 ,10718 Jakarta II 1 55 41819 W.Java 2 6,096 16,719 12,25420 C.Java I 15,083 1,71521 C.Java II22 Surabaya 35 114,054 3,567 1,90623 L Java 5,662 11 ,80924 Pontianak 1,278 1825 W.Ka1imantan 1 18 126 C.Ka1imantan 211 207 10,494 227 S.Ka1imantan 4,590 649 15 8,41528 E.Kalimantan I 6,767 51,682 3,636 4,52929 LKa1imantan II 120 221 9,34930 N.Su1awesi I31 Bitung 234 2 20432 N.Sulawesi II 20433 C.Sula\'/esi I 22234 C. Su1awes i I I35 Ujung Pandang 24 13,310 10,03236 S.Sulawesi 48 2337 SLSulawesi 5738 Bal i 646 273
279
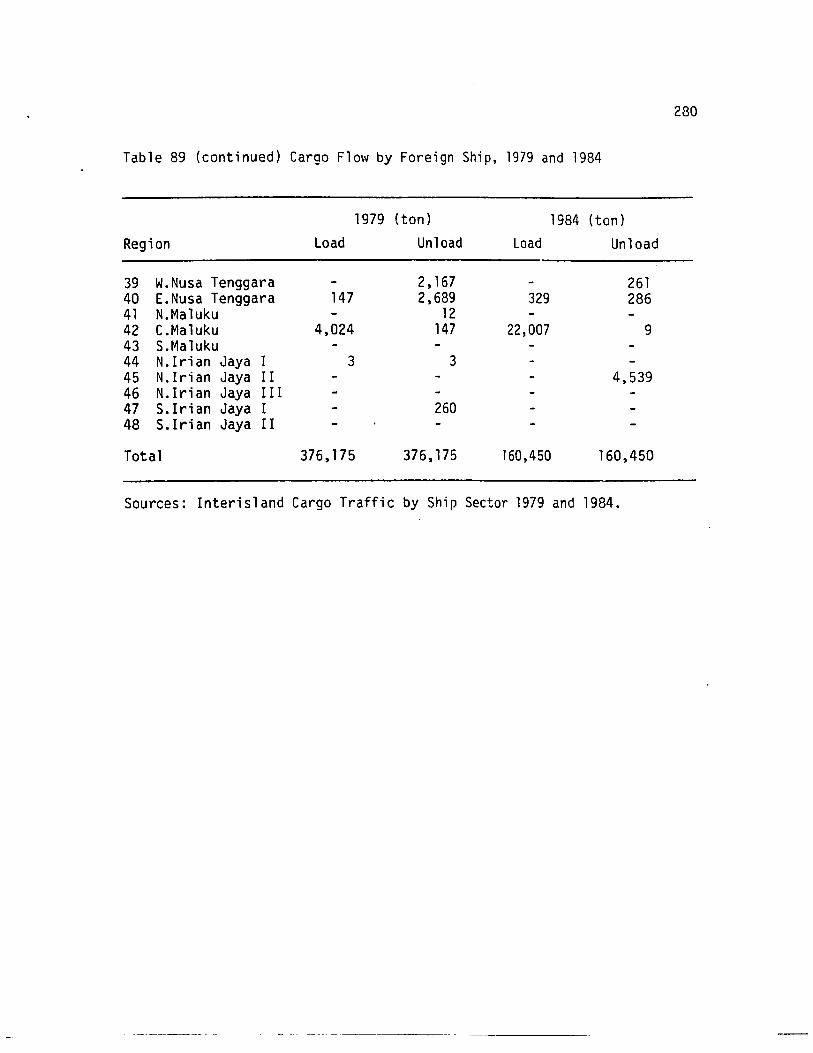
Table 89 (continued) Cargo Flow by Foreign Ship, 1979 and 1984
1979 (ton) 1984 (ton)
Region Load Unload Load Unload
39 W.Nusa Tenggara 2,167 26140 E.Nusa Tenggara 147 2,689 329 28641 N.Maluku 1242 C.Maluku 4,024 147 22,007 943 S.Ma1uku44 N.Irian Jaya I 3 345 N.Irian Jaya I! 4,53946 N.Irian Jaya II!47 S.Irian Jaya I 26048 S.Irian Jaya I!
Total 376,175 376,175 160,450 160,450
Sources: Interisland Cargo Traffic by Ship Sector 1979 and 1984.
280
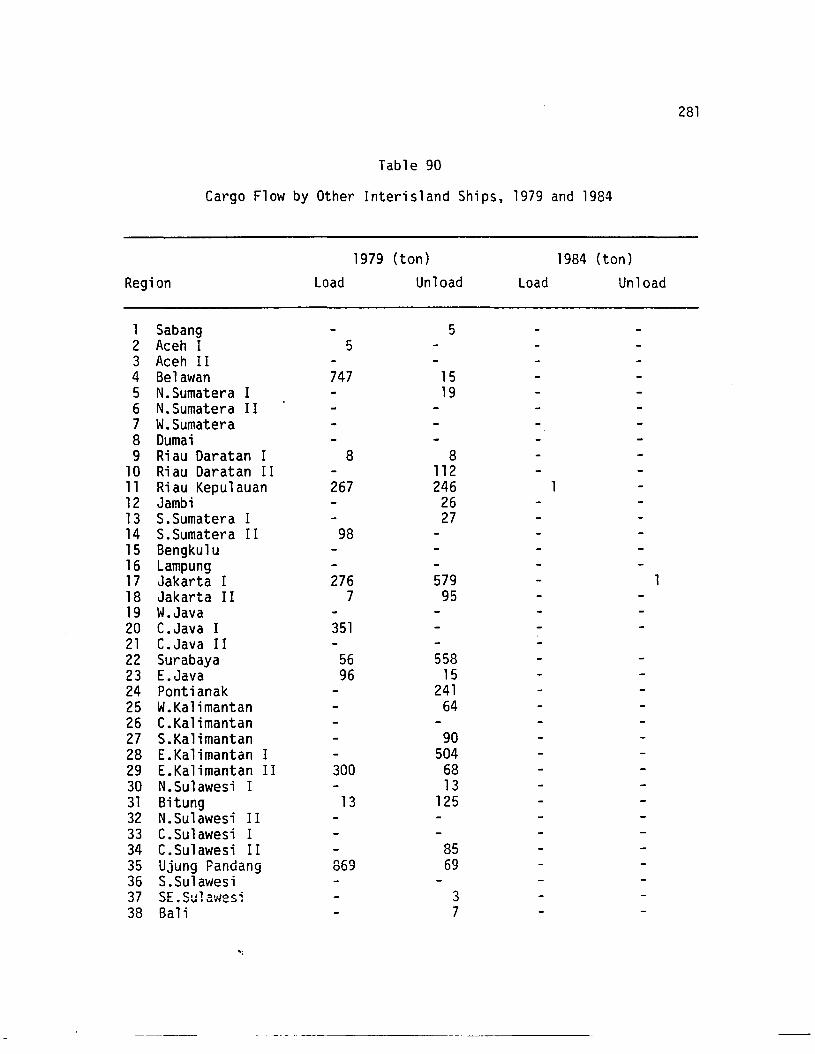
Table 90
Cargo Flow by Other Interisland Ships, 1979 and 1984
1979 (ton) 1984 (ton)
Region Load Unload Load Unload
1 Sabang 52 Aceh I 53 Aceh II4 Belawan 747 155 N.Sumatera I 196 N.Sumatera II7 W.Sumatera8 Dumai9 Riau Daratan I 8 8
10 Riau Daratan II 11211 Riau Kepulauan 267 24612 Jambi 2613 S.Sumatera I 2714 S.Sumatera I I 9815 Bengkulu16 Lampung17 Jakarta I 276 57918 Jakarta II 7 9519 W.Java20 C.Java I 35121 C.Java II22 Surabaya 56 55823 E.Java 96 1524 Pontianak 24125 W.Kalimantan 6426 C.Kalimantan27 S. Ka1imantan 9028 E.Kalimantan I 50429 E.Kalimantan II 300 6830 N.Sulawesi I 1331 Bitung 13 12532 N.Sulawesi II33 C.Sulawesi I34 C.Sulawesi II 8535 Ujung Pandang 869 6936 S.Sulawesi37 SE.Sulawesi 338 Bali 7
-,
281

282
Table 90 (continued) Cargo Flow by Other Interisland Ships, 1979 and 1984
1979 (ton) 1984 (ton)
Region Load Unload Load Unload
39 W.Nusa Tenggara 27 740 E. Nusa Tenggara 89 1041 N.Maluku42 C.Maluku 141 30443 S. Maluku 5444 N.lrian Jaya I45 N.lrian Jaya II46 N.lrian Jaya III47 S.lrian Jaya I48 S.lrian Jaya I I
Total 3,350 3,350
Sources: Interisland Cargo Traffic by Ship Sector 1979 and 1984.
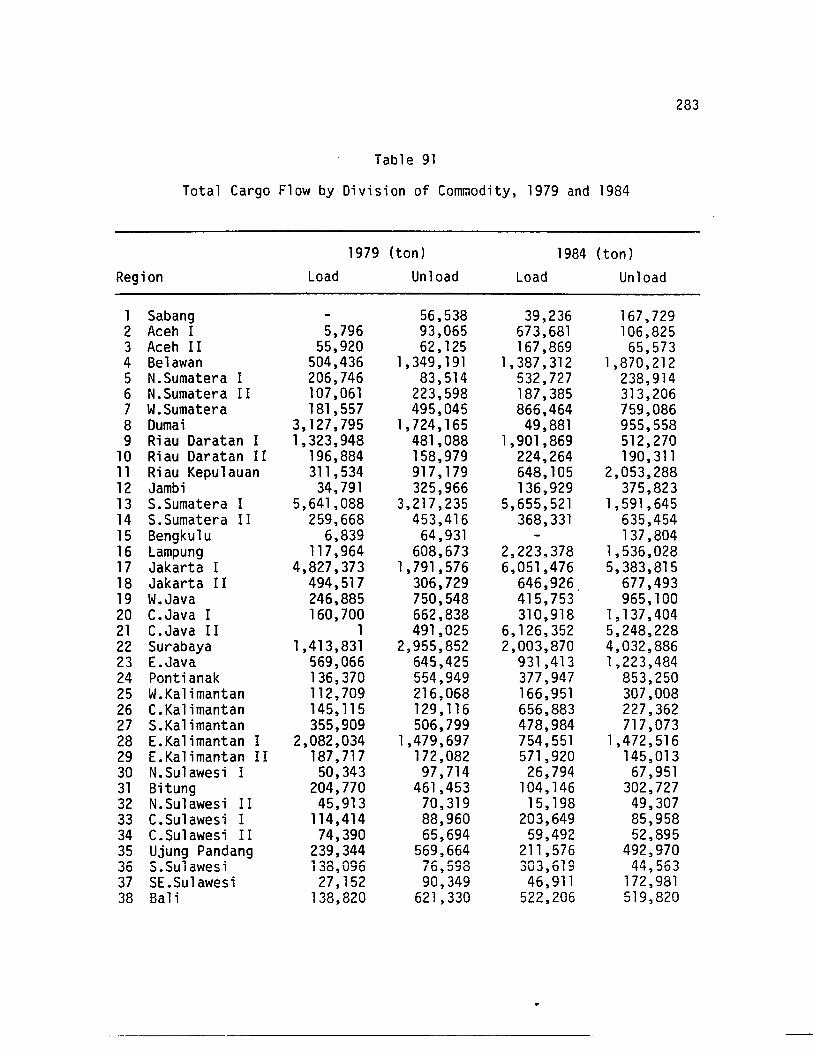
Table 91
Total Cargo Flow by Division of Commodity, 1979 and 1984
283
1979 (ton) 1984 (ton)Region Load Unload Load Unload
1 Sabang 56,538 39,236 167,7292 Aceh I 5,796 93,065 673,681 106,8253 Aceh II 55,920 62, 125 167,869 65,5734 Belawan 504,436 1,349, 191 1,387,312 1,870,2125 N.Sumatera I 206,746 83,514 532,727 238,9146 N.Sumatera II 107,061 223,598 187,385 313,2067 W.Sumatera 181,557 495,045 866,464 759,0868 Dumai 3,127,795 1,724, 165 49,881 955,5589 Riau Daratan I 1,323,948 481,088 1,901,869 512,270
10 Riau Daratan II 196,884 158,979 224,264 190,31111 Riau Kepulauan 311,534 917,179 648,105 2,053,28812 Jambi 34,791 325,966 136,929 375,82313 S.Sumatera I 5,641,088 3,217,235 5,655,521 1,591,64514 S.Sumatera II 259,668 453,416 368,331 635,45415 Bengkulu 6,839 64,931 137,80416 Lampung 117,964 608,673 2,223.378 1,536,02817 Jakarta I 4,827,373 1,791,576 6,051,476 5,383,81518 Jakarta II 494,517 306,729 646,926. 677,49319 W.Java 246,885 750,548 415,753 965,10020 C.Java I 160,700 662,838 310,918 1,137,40421 C.Java II 1 491,025 6,126,352 5,248,22822 Surabaya 1,413,831 2,955,852 2,003,870 4,032,88623 E.Java 569,066 645,425 931,413 1,223,48424 Pontianak 136,370 554,949 377,947 853,25025 W.Kalimantan 112,709 216,068 166,951 307,00826 C.Kalimantan 145,115 129, 116 656,883 227,36227 S.Kalimantan 355,909 506,799 478,984 717,07328 E.Kalimantan I 2,082,034 1,479,697 754,551 1,472,51629 E.Kalimantan II 187,717 172,082 571,920 145,01330 N.Sulawesi I 50,343 97,714 26,794 67,95131 Bitung 204,770 461,453 104,146 302,72732 N.Sulawesi II 45,913 70,319 15, 198 49,30733 C.Su1awesi I 114,414 88,960 203,649 85,95834 C.Su1awesi II 74,390 65,694 59,492 52,89535 Ujung Pandang 239,344 569,664 211 ,576 492,97036 S.Su1awesi 138,096 76,598 303,619 44,56337 SEe Su1awes i 27,152 90,349 46,911 172,98138 Bali 138,820 621,330 522,206 519,820
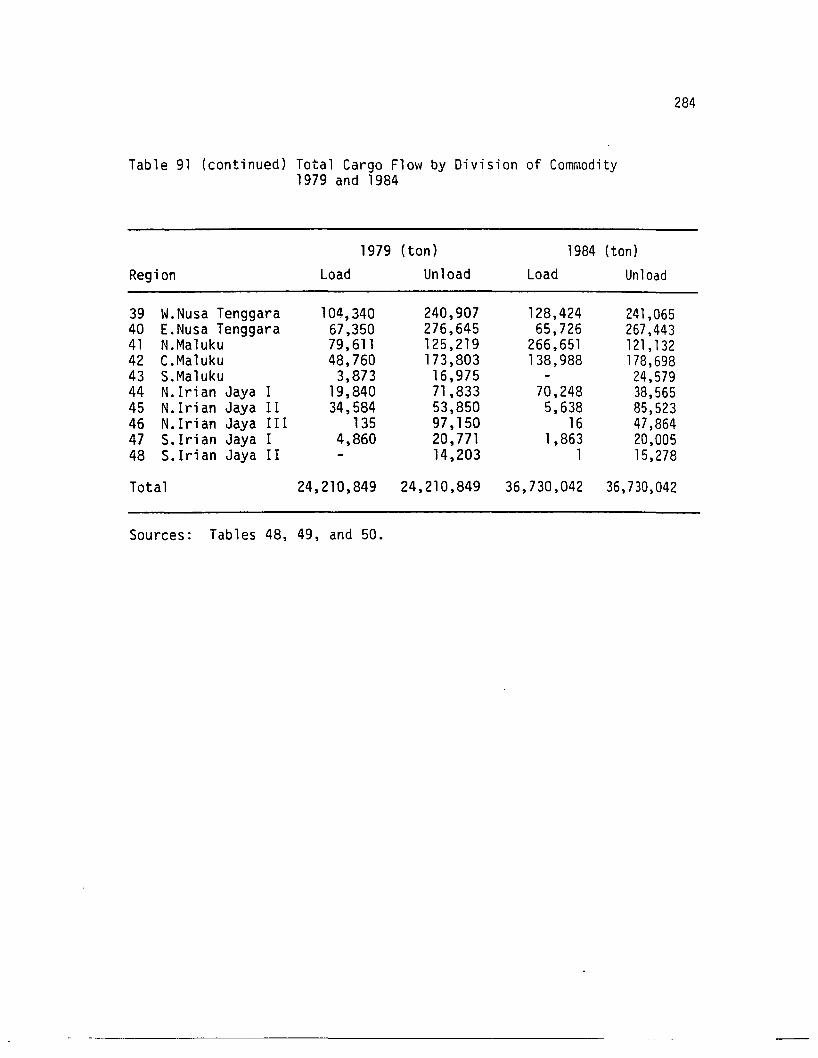
Table 91 (continued) Total Cargo Fl ow by Division of Commodity1979 and 1984
284
1979 (ton) 1984 (ton)
Region Load Unload Load Unload
39 W.Nusa Tenggara 104,340 240,907 128,424 241,06540 E.Nusa Tenggara 67,350 276,645 65,726 267,44341 N.Maluku 79,611 125,219 266,651 121,13242 C.Maluku 48,760 173,803 138,988 178,69843 S.Maluku 3,873 16,975 24,57944 N.lrian Jaya I 19,840 71,833 70,248 38,56545 N.lrian Jaya II 34,584 53,850 5,638 85,52346 N.lrian Jaya I I I 135 97,150 16 47,86447 S.Irian Jaya I 4,860 20,771 1,863 20,00548 S.Irian Jaya II 14,203 1 15,278
Total 24,210,849 24,210,849 36,730,042 36,730,042
Sources: Tables 48, 49, and 50.
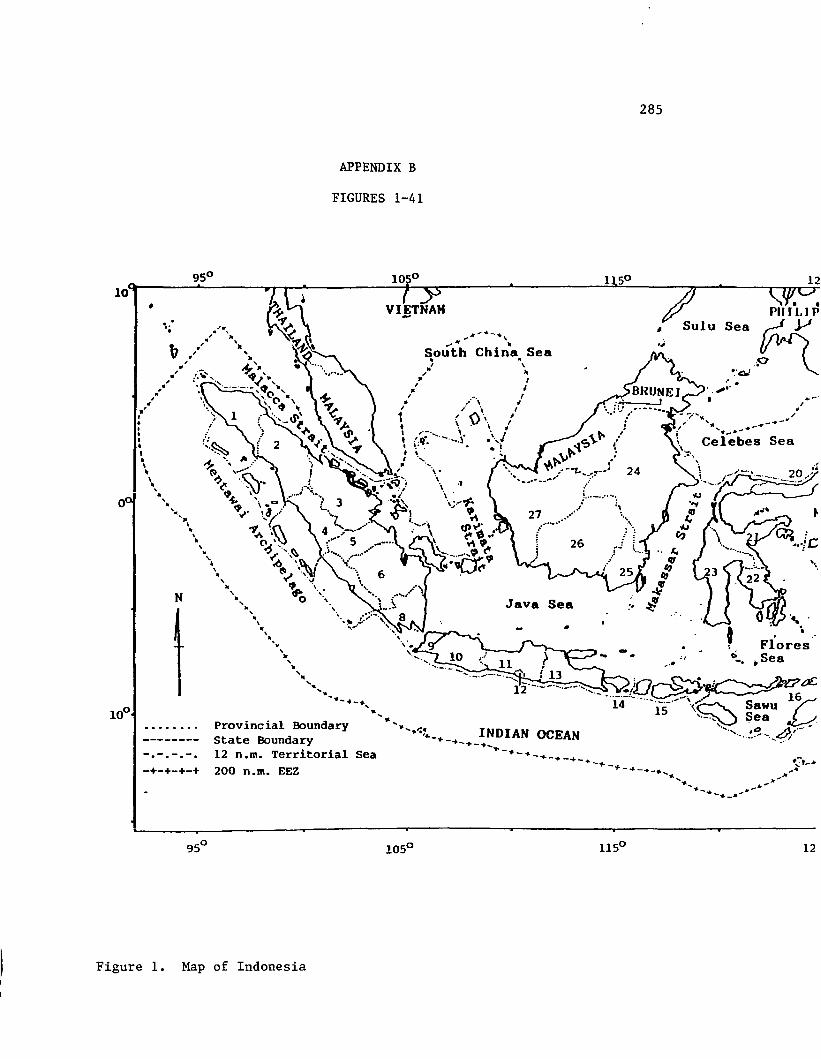
285
APPENDIX B
FIGURES 1-41
10 0
• •PllrLIPseaMp
~'oi
.......~* •
...~..I•/
" ..-~-"',,_.- •..Celebes Sea
.;
VI!TNAH
Sea
Provincial BoundaryState Boundary12 n.m. Territorial200 n.m. EEZ
'\•\
"\
""~\I
""""".\I
\
"\
",W
\
"..."...
"'- ......... -.-.,
" '"
N
\.•
•
- - - . . . .-+-+-+-+
o
12
Figure 1. Map of Indonesia

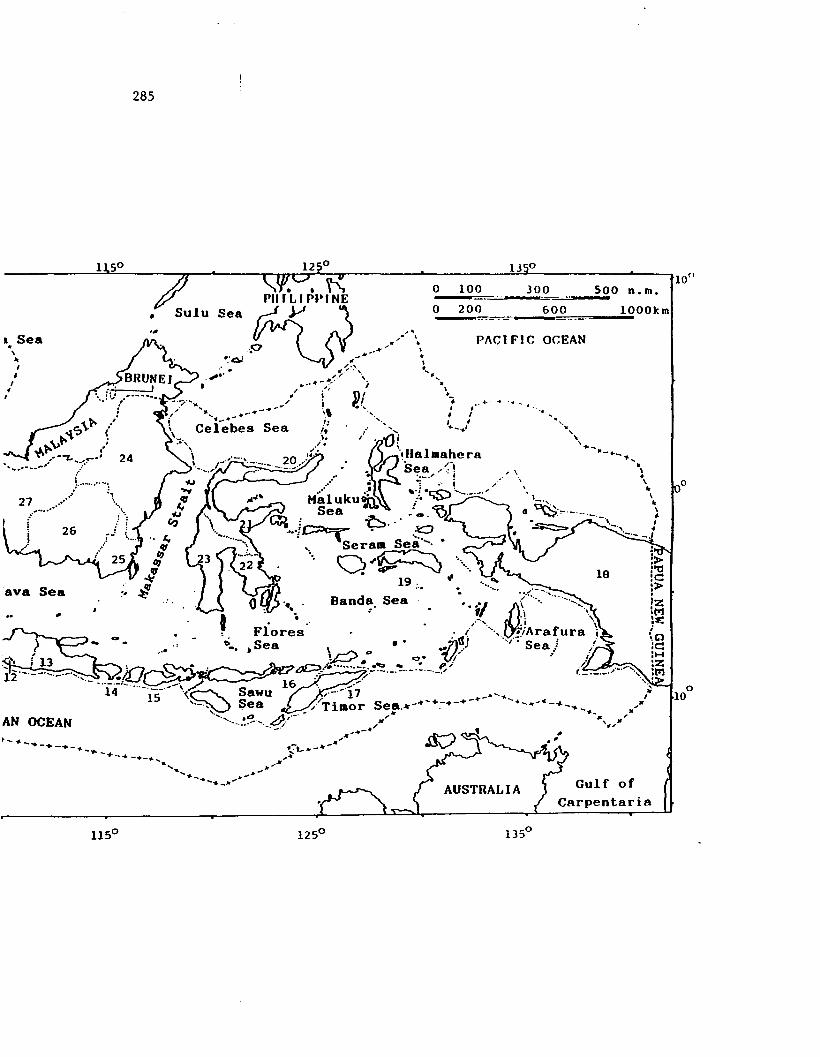
PACIFIC OCEAN
13 0
l Sea.\ ..
I~
I~
I,
ava Sea
285
•
o 100
200
AUSTRALIA
] 00 =':::300.-5..°.° n , m•600
Gulf ofCarpentaria
o
o10
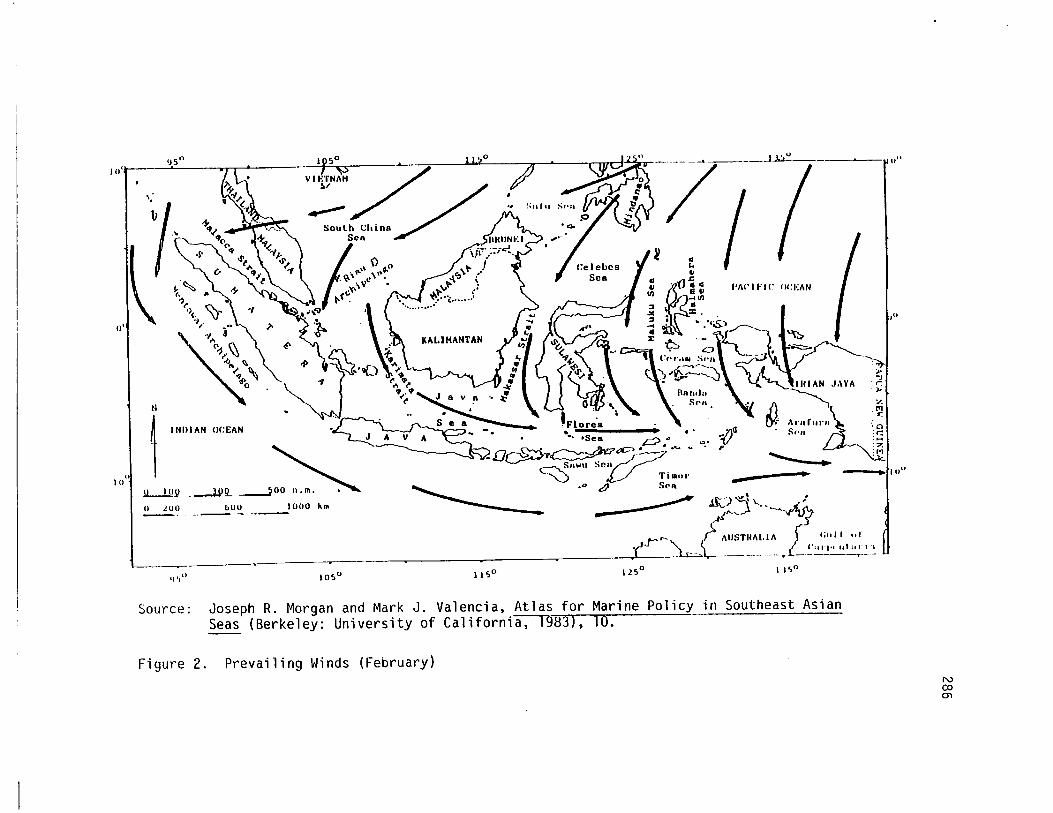
INllIAN OCEAN
~L~~"10
'JS"
N
1JL..l.!!pII lUll
1)1)°
6Ull 10llO km
10SO II SO 12S0
~
l'IIl" I I'll" OCIo;IIN
I IS"
--~~_-.. u"
,"
P""J.r:p
z.~
Source: Joseph R. Morgan and Mark J. Valencia, Atlas for Marine Policy in Southeast AsianSeas (Berkeley: University of California:-T983), 10.
Figure 2. Prevailing Winds (February)Ncom
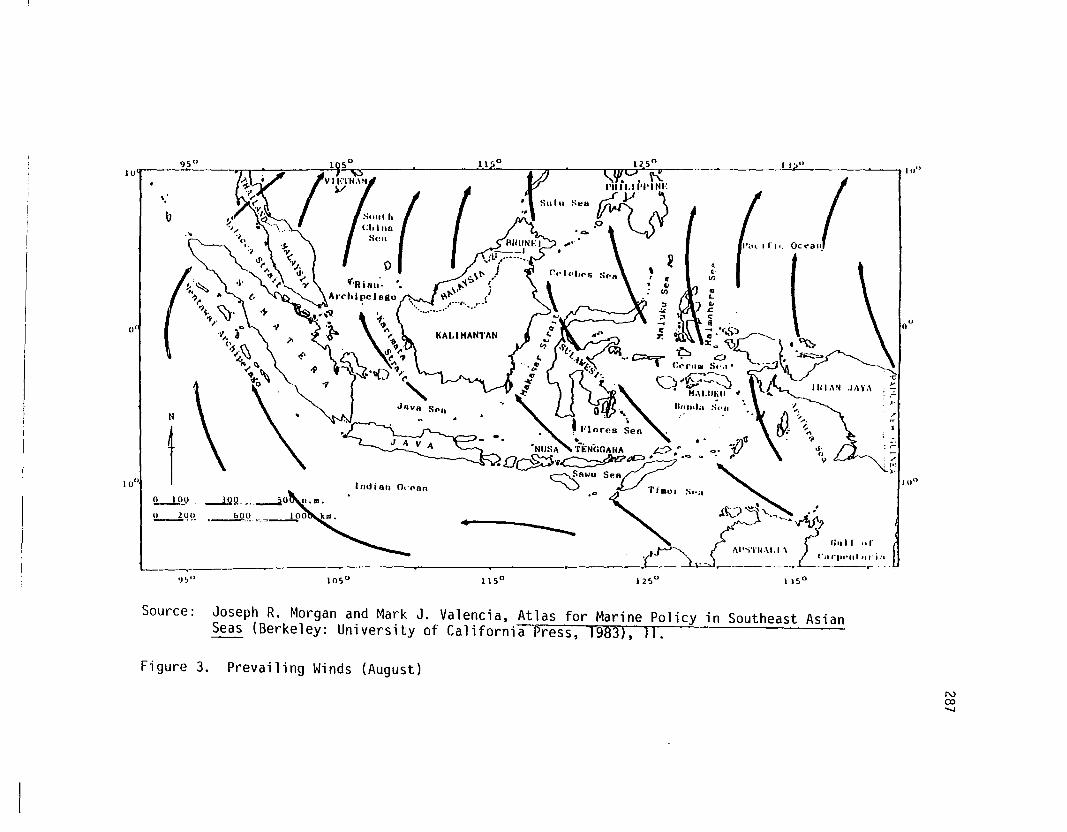
o
IUO
:.,.
.: rr:
).
:r
0"0,1
J J"u
I'ill I r II.
. . r I""
~ I ~
~.,
IIIr ... &>II)
s:'I
--<a::r.
t. ~__...! (p-,r.
lur
'.l.5" 1050
'.
llr.°
b
• <" ~\)~ ..... I "',i".';~ 'j.
H(~"
11' ~. ",. '1'.... oJi~ <, oJ. ~
~"..
..
'?~. ~.
0" I1'"
'i... ff'.~...6~
..... Il.~,
0
N - \ -. J
t
JRVR SPII
I u()~
IL..!.9J.l... I fill i all
\.!...-.l.ql~
')~() 105 0 115 0 125 0 1)50
Source: Joseph R. Morgan and Mark J. Valencia, Atlas for Marine Policy in Southeast AsianSeas (Berkeley: University of California Press, 1983), 11.
Figure 3. Prevail i ng Wi nds (August)
Nco'-I
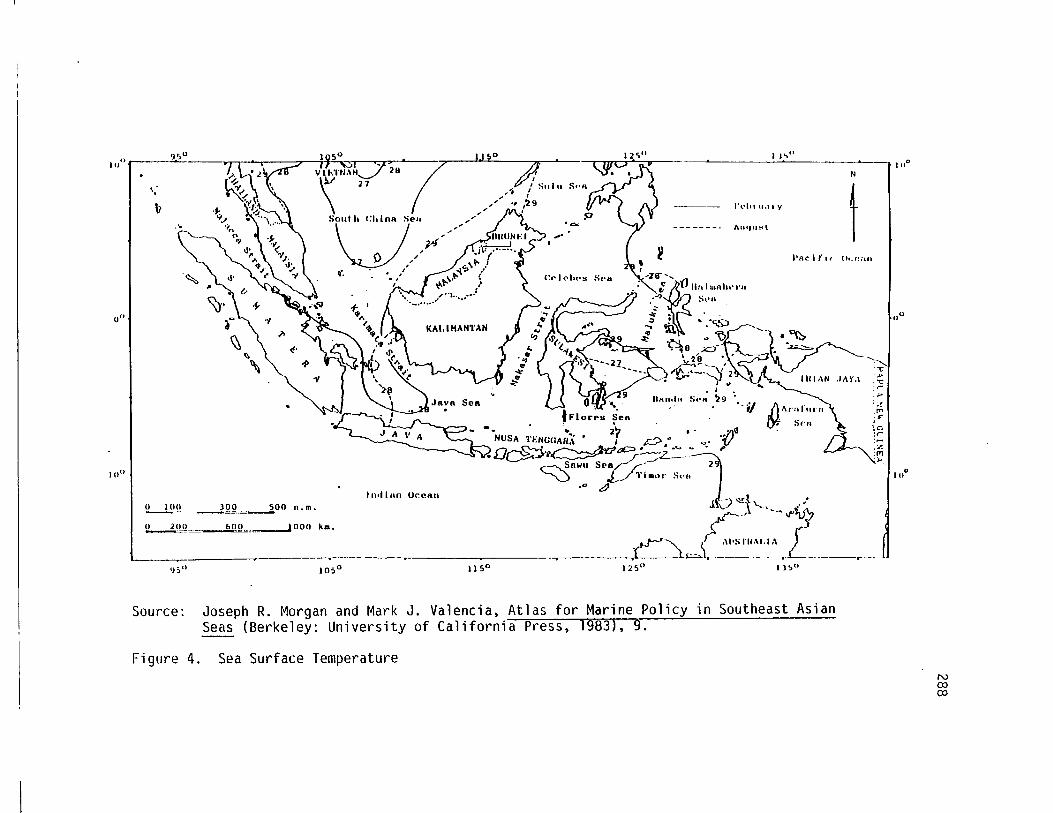
IUO
,,0
rn..0::r
. ~!
.-'\l' z:PI
':J,.
N
tI'ac i f at (lef::.n
---- 1'",11, la.' I Y
-------. AII(III:.-l• co...'
1.15 0
I
,.,- " Sui u
" I~' ., ,'29»" N'l.•
115°
,. ~f'" ~-7rr~II"IUlllht".a
".~}~~;~~~'-1.~~~ "?o\. 00••~~ ~,~
4:f!.:::~j'''-'l,( '-""".'" .M"":;...... ,,,,~• I,
~t''; ~9 '" ~J 61""""''''''n"nda • , ¥, S.,". .r/ .
"NUSA n~G~~tj;i'''-'~l'o.~:.O~· 5••" 5••/.::/,:; •••. ".. , ,
C:::S.L ~..... ,',..,." '" .i ,? l '0- ~Vr
.r:',."".,., l ~__-(r""'J <" ->~ -~~~ ._- I 'J5"
• 12'5"~-~--
Illltillll Ocean
105 0
___).2l!~__5_00 n v m ,
~_",,6;:,;0~0~,=•.~ 000 km.
\7
9.5 0
(J:'O
'.
~Q
o lllU
0"
IU"
Source: Joseph R. Morgan and Mark J. Valencia, Atlas for Marine Policy in Southeast AsianSeas (Berkeley: University of California Press, 1983), 9.
Figure 4. Sea Surface TemperatureN0:>0:>
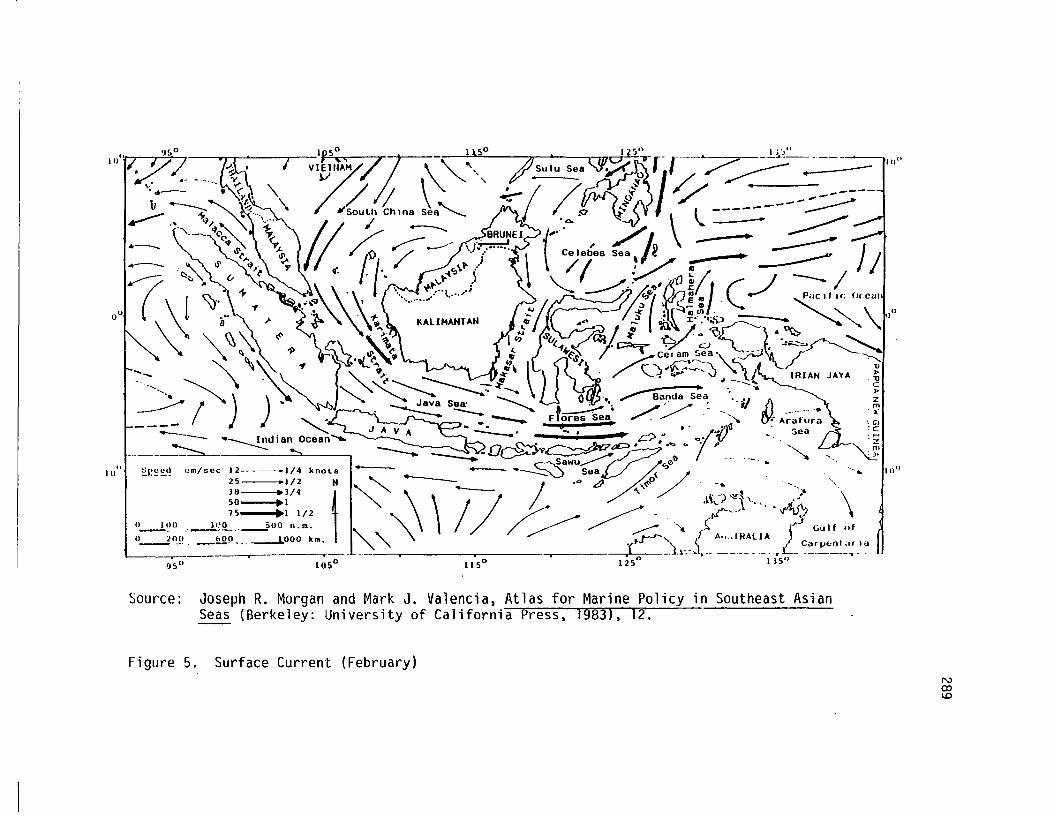
in Southeast Asian
105 0
'nC
J. ~., \ 0/.,c, "0 ...........--a..r:td a se~·.. .~J ... ~
~ Sea -......... --..~. /~ 'II) m
~. ---= __ Flores 'sea; . .- -'", ~ A;~'f~~~: ;:,
J .. •• • . ..JIll, . CA V A __ A -. • ,. t:::> u I'V ,5ea :____ -Dc§:::S.f~~...... .. 0: p .• . ~ ~~ sawu~c;;Ic::?: 0'1> - " ..- ~ - ---SS sea.{/ ~/e:; , 'a. ho"
~ ; ." ~ .~ . -. "-.',
"'\ \17<>//" f?j'·.. ··7:·? "0"\\ ~ AI •.• IHAllAI""" -(r"',) \..>\ .. .. _..L..~~~IJE:nt"r la
• ll'SO • ,; .... 0 1)5°
Joseph R. Morgan and Mark J. Valencia. Atlas for Marine PolicySeas (Berkeley: University of California Press. 1983). 12.
950-------y--
---
Source:
~l!~~'! <:m/scc 12--·-1/4 knots25 .1/2 H
3D .3/4 t50 ~ I75 .11/2
o lOll 11.10 " 500 n.m.--. ..-.,,;-:.....;:.--
0--2~(}. __~!l ... ---i000 km.
. .
___ .IU o
.. ----.. ........~
-- ~~~¥~ (II /10 /'2\)if\ t Celebes Sea,/~ '- ·~IJ/- ." IS' ~)' l' ~ J ~'\t- •.' / / : '/ III,... _,. • _. .,J I •• ,
"0,1~\
....-
o10
Figure 5. Surface Current (February)NCX)~
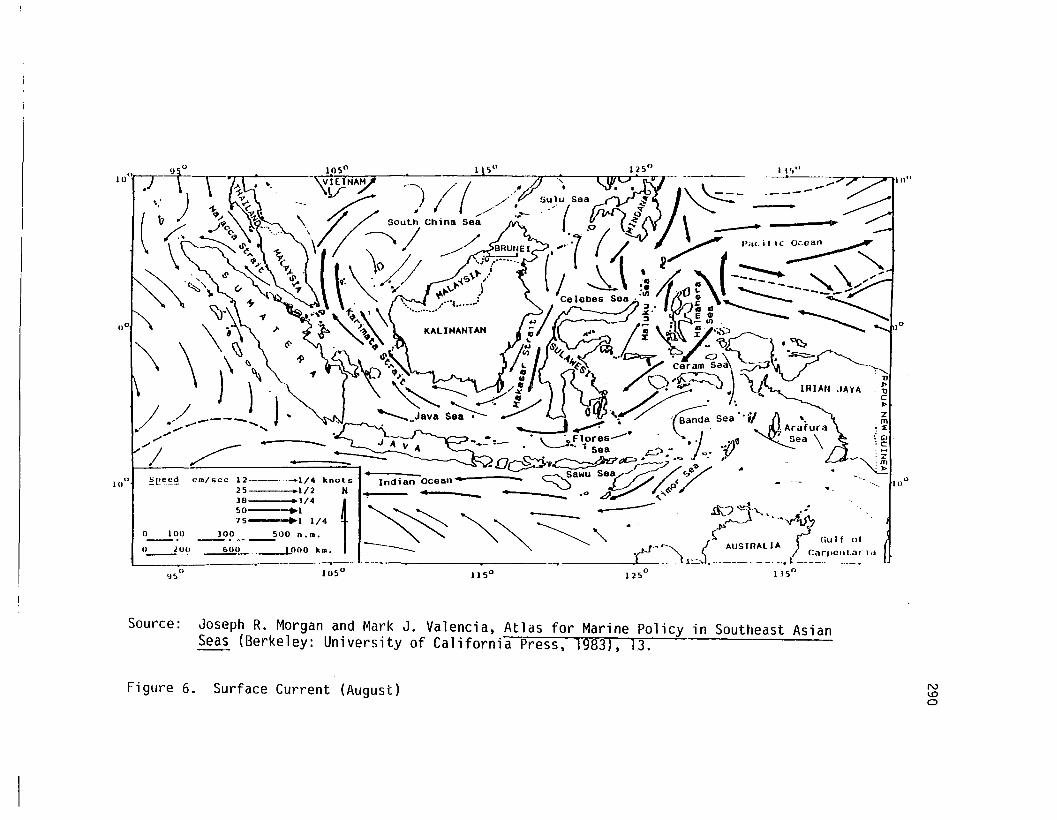
IUO
;'-"''''7---~
1250
.US OlOSO
lOS" • .,., --- ~__.• , i • \ ..;n...u • • 7J .'. CJJlO ~J
lJSO
o 100
n lU~
100'
1(J()~ ~e~.~~ em/scc 12-----1/4 knots_1/2 N 1.... _
Source: Joseph R. Morgan and Mark J. Valencia, Atlas for Marine Policy in Southeast AsianSeas (Berkeley: University of California Press, 1983), 13.
Figure 6. Surface Current (August) NIJ)
o
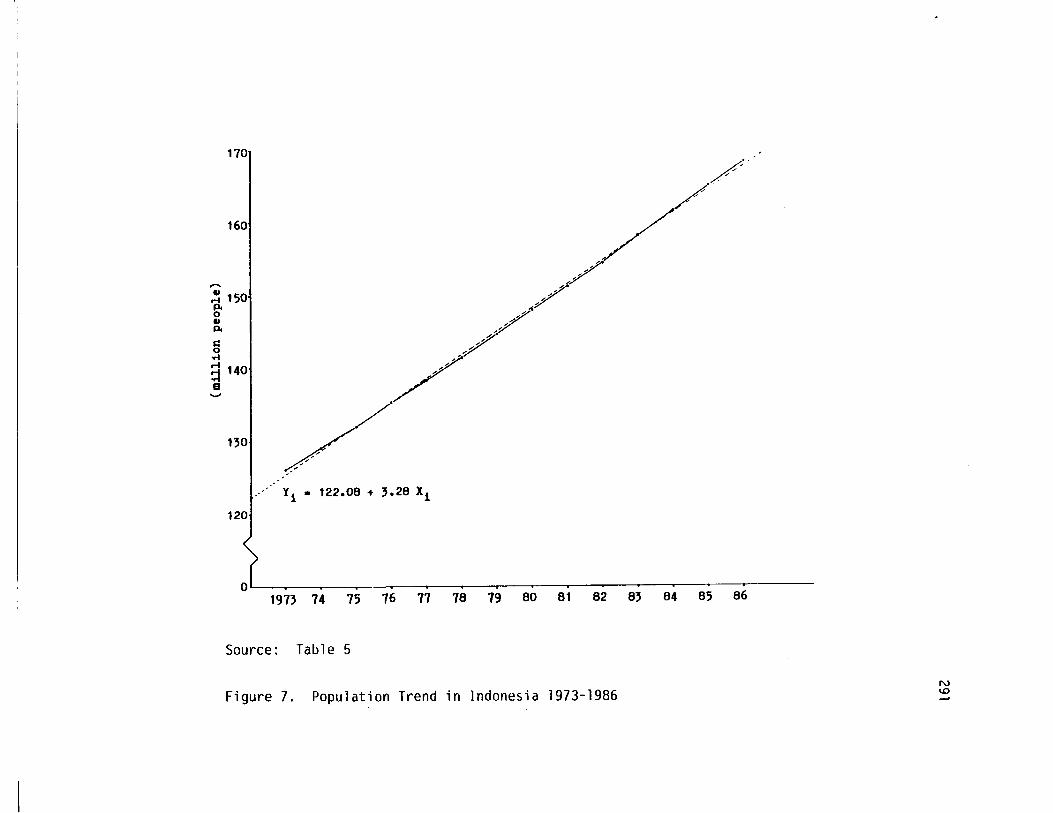
170
160
,.....
"r-t 150go"PI
J:looMr-t~ 140B......
130
120
.:./-:/:7
/////',-'
Ii • 122.08 + 3.28 Xi
1973 74 75 76 77 78 79 80 81 82 83 84 85 86
Source: Table 5
Figure 7. Population Trend in Indonesia 1973-1986N1.0
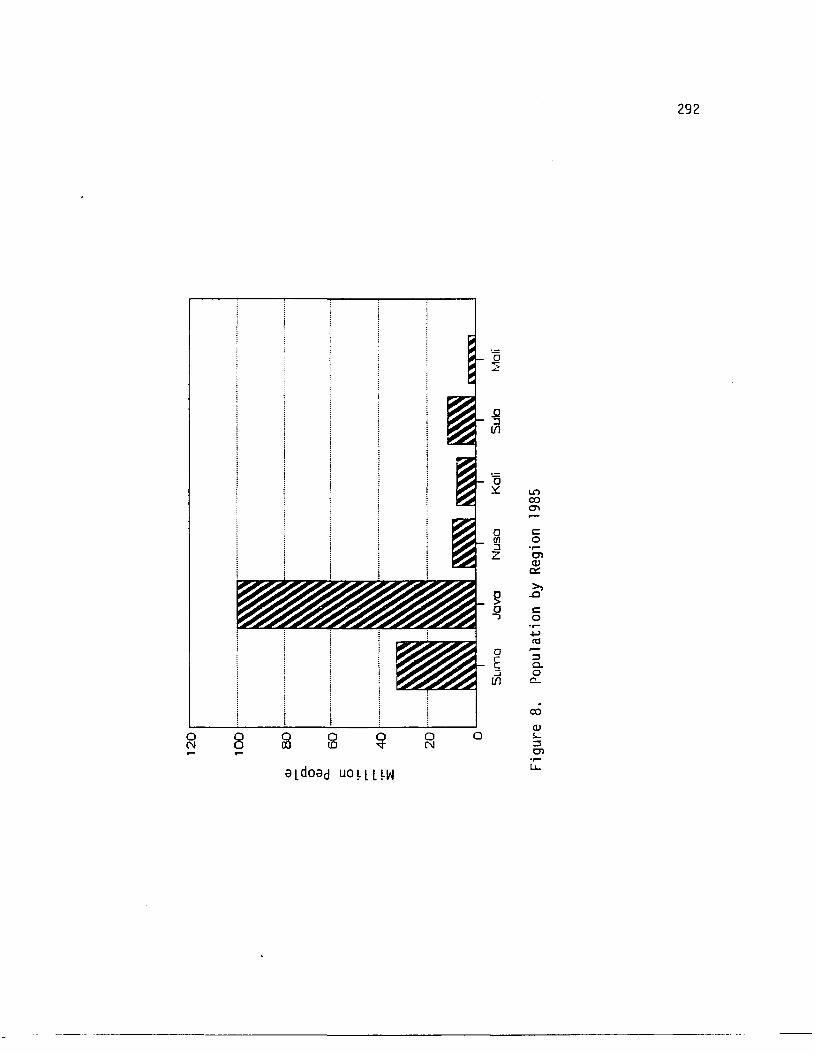
02
.Q:l(f)
0~ L.n
ex)O'l
a c:::(/J 0:l .~
Z en<Vc:::>,
~.0
0 c:::-:l 0
1-1ll:l
a ,.-
E ::sCl.
:::; 0(f) c,
.ex)
<V0 8 lij g ~
0 0 1-N N ::s
en
tlLdotld uo l l L~wu,
292
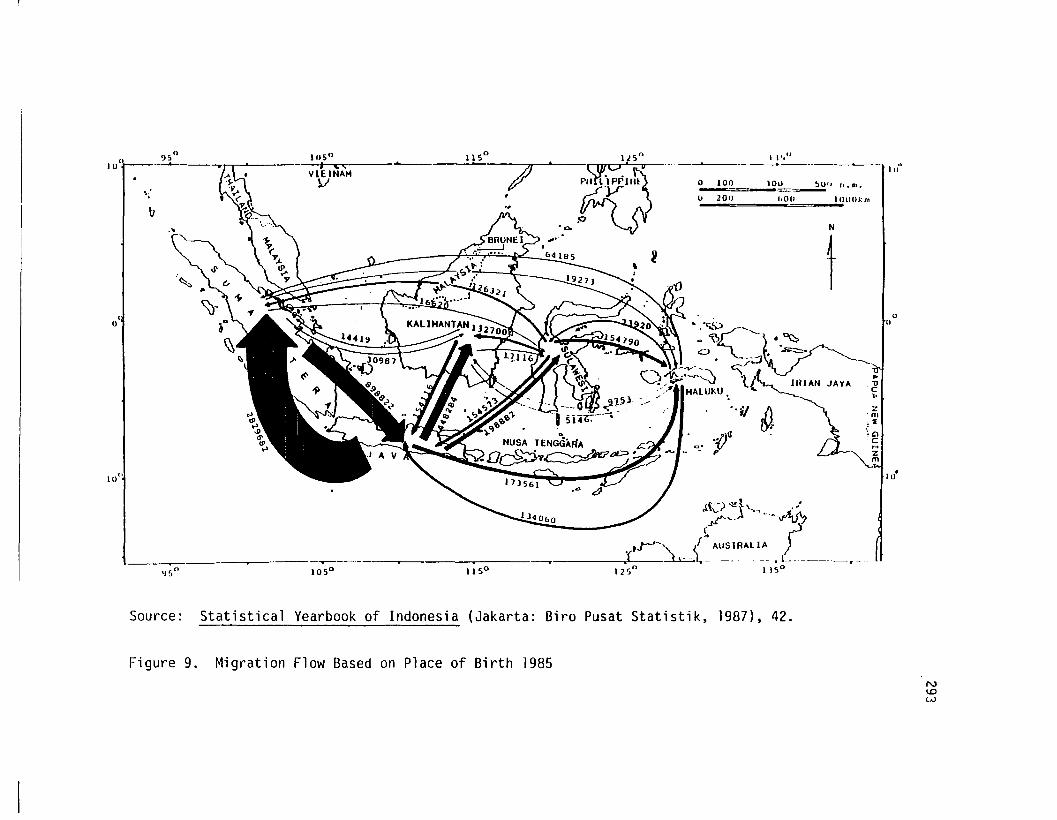
oIl
IUO
'-~---"'IIJQ
'.011 10UOkm-
II·...~
"~I
N
t
":{l',
o 100 lOO !JOI. 0.111.----==--- ~IJ 20.)
~
"00
«(··-)~t •..I\.. \-"\,... .»~.,l •.~.~
x,r--~{'..,"""" 5'------.LO
- - • . - -- "1. _125 115°
;/l
115°
1! SO111,5° ---~-,~,..-
VIEINAH!J
'.15°
\J'.
(
o
10°
Cl10
Source: Statistical Yearbook of Indonesia (Jakarta: Biro Pusat Statistik, 1987), 42.
Figure 9. Migration Flow Based on Place of Birth 1985NILlco.>
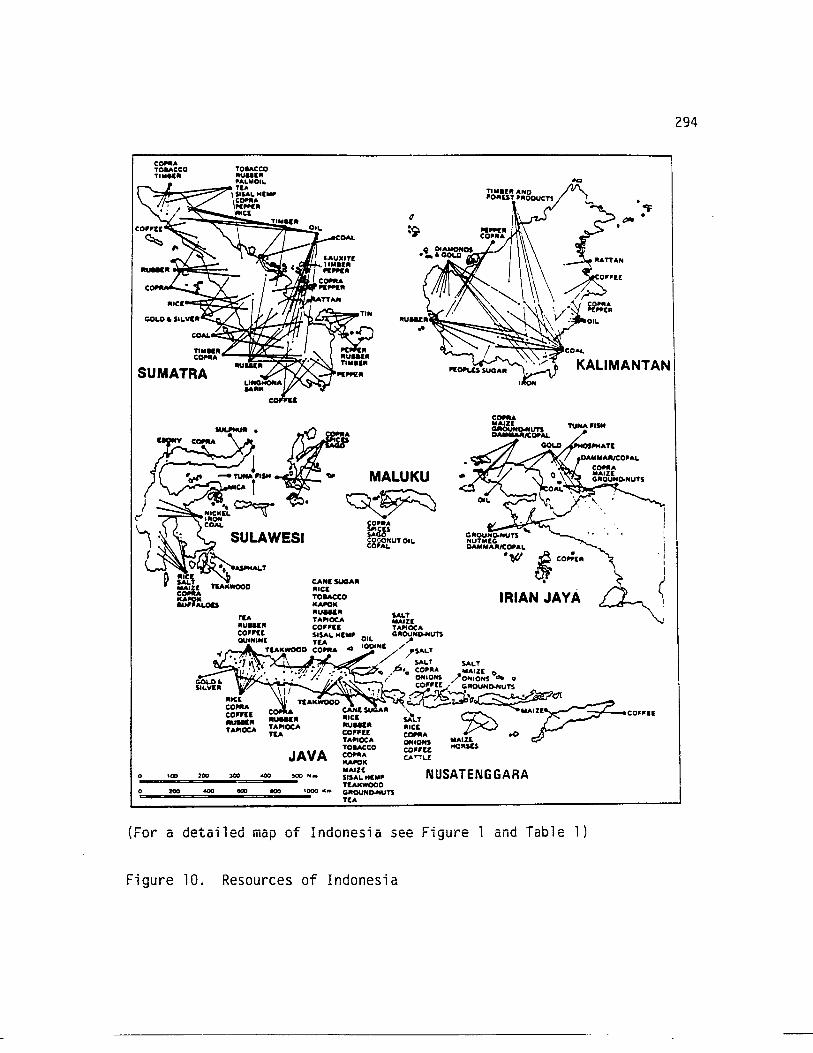
COI'OlATOIACCO'TIM."
SUMATRA
•~•
KALIMANTAN
294
o
'00 200 300
CA"ISUGAII"'CITOIlACCOKAOOKIIUUlIITAPIOCACOPPlES'SALHIMPTEACO",A ..
NUSATENGGARA
TU..... PI...
(For a detailed map of Indonesia see Figure 1 and Table 1)
Figure 10. Resources of Indonesia
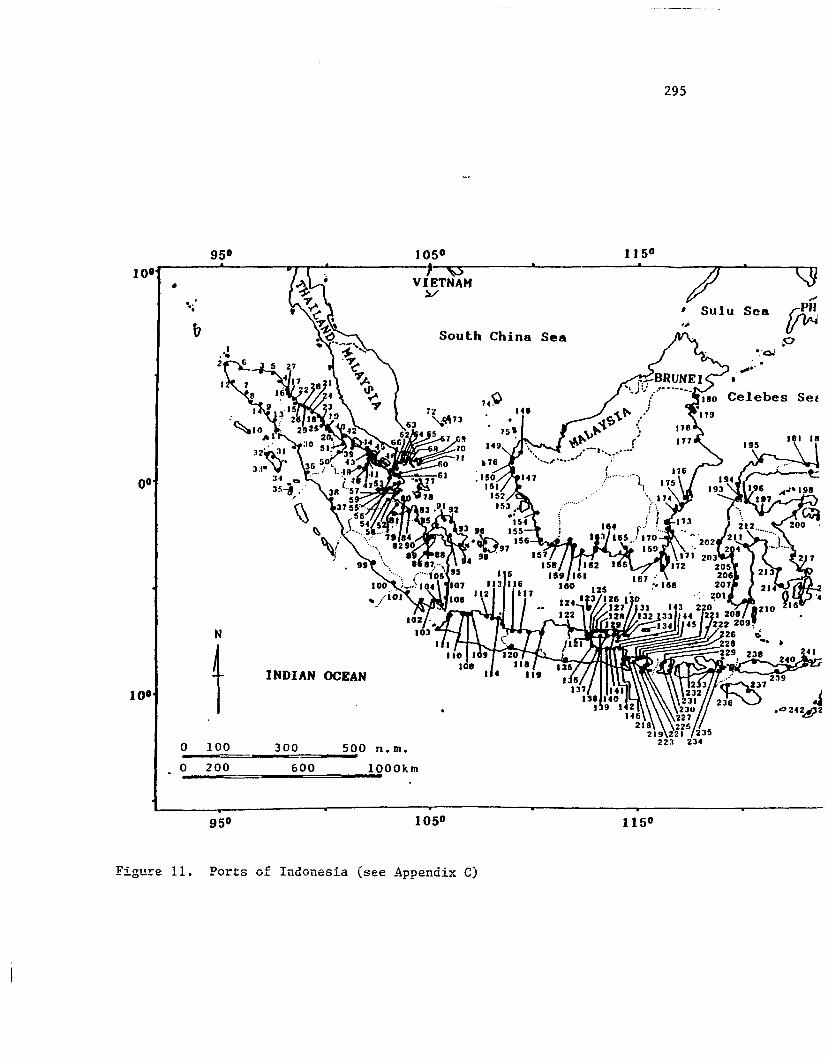
295
Sel
. fIIIII'.'
//, Sulu Sea
148
South China Sea
~VIETNAM~
95°
•
0°
10'
N
t INDIAN OCEAN10°
0 100 300 500 n s m,
0 200 600 1000km
105° 115°
Figure 11. Ports of Indonesia (see Appendix C)

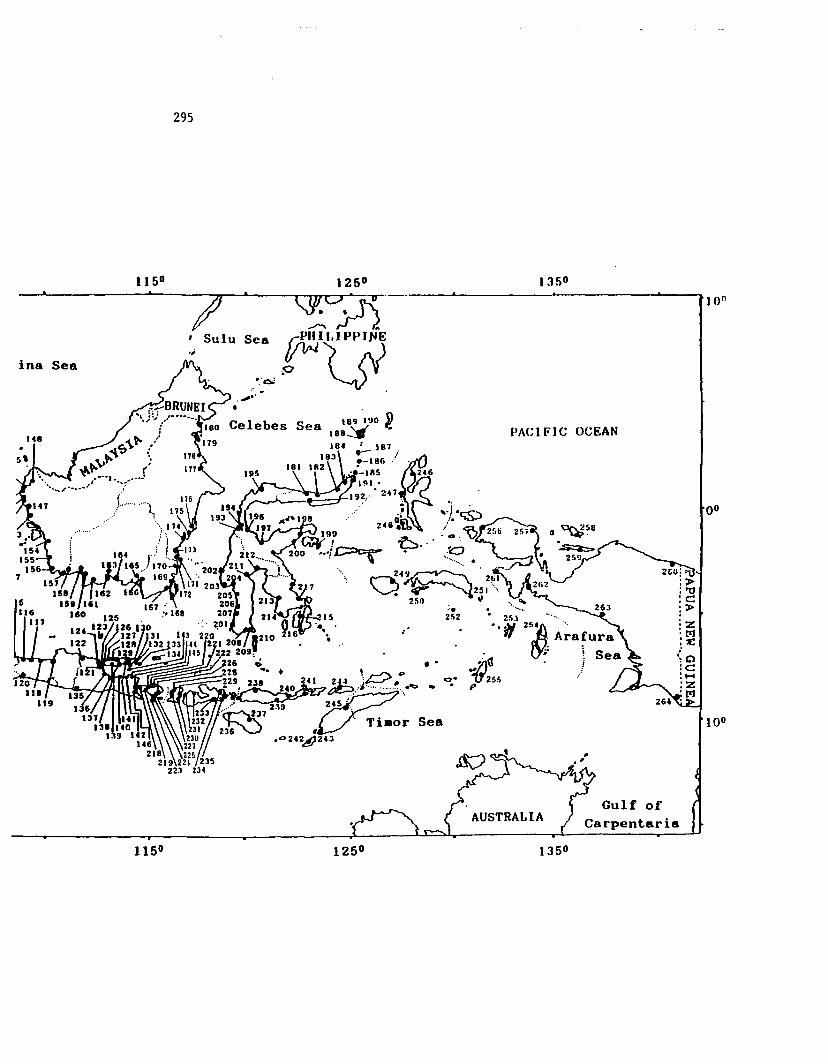
295
, flllll'6'
0°
Gulf ofCarpentaria
PACIFIC OCEAN
AUSTRALIA
Sea
189 '190 »Sea 188_'11' •
18~84 ::-. ~:'1/ft)182 • '-185 246
l!ll'---..::--,....,.....-. 192.... ' 247 -,
..... i.:" ci~
. 248.n:
.' .
1250
-----------~.a---------.--ll 0°"9!.0,' ~-~ ,r-P<I J.
s~:~'ry
Celebes
;;, Sulu
148
ina Sea

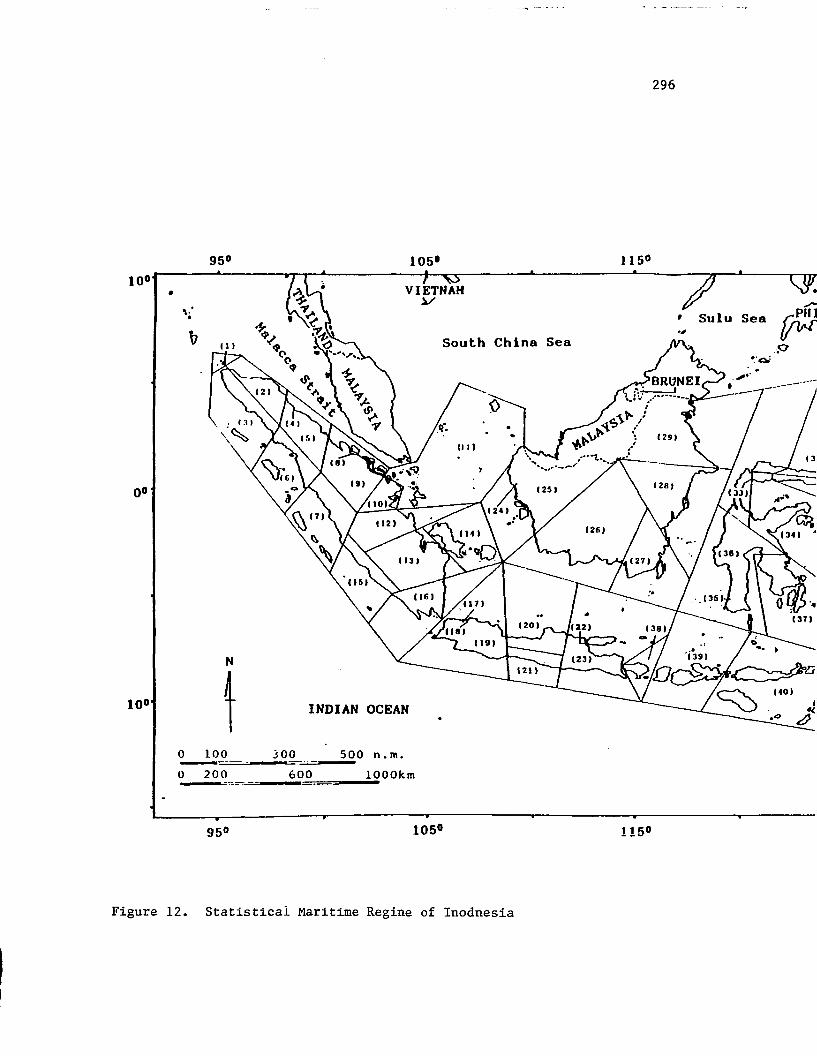
296
.:~:
Sulu Sea,
South China Sea
VIETNAHy
\.'•
•
N
10° t INDIAN OCEAN
0 100 300 500 n.m.--0 200 600 lOOOkm
10°
1050
Figure 12. Statistical Maritime Regine of Inodnesia

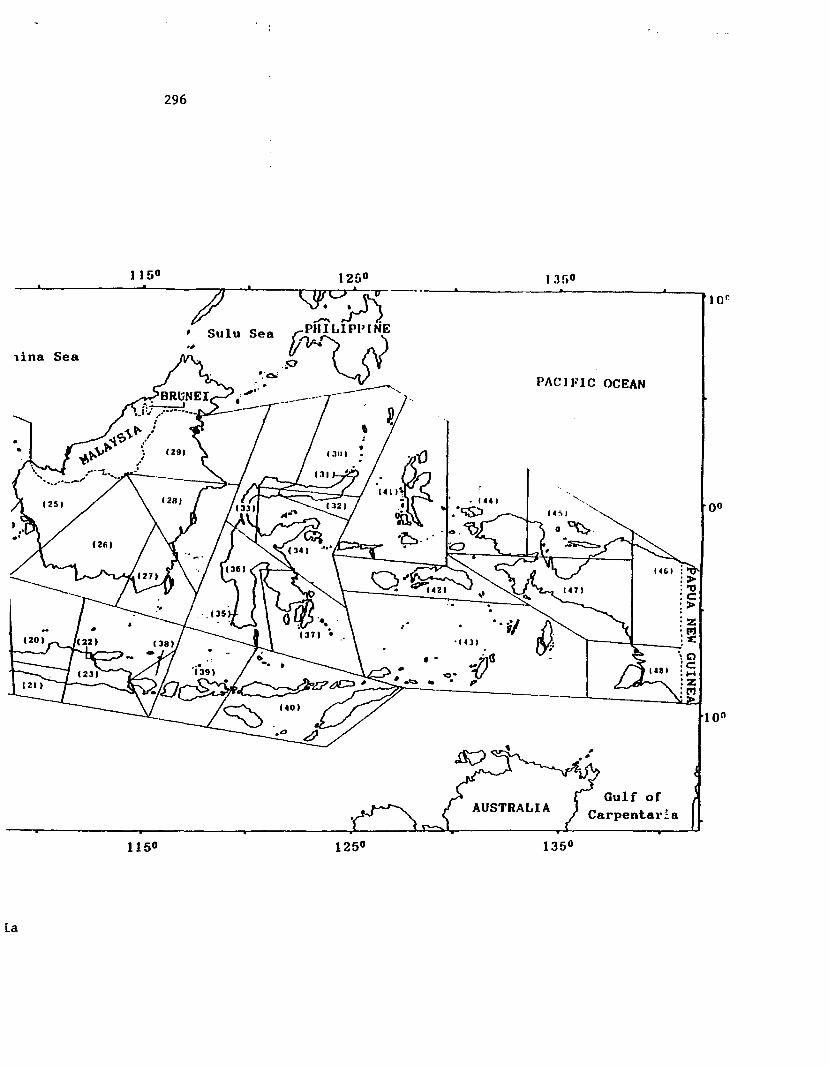
296
0°
10°
Gulf ofCarpentar!.a
I Jr-0
PACIFIC OCEAN
AUSTRALIA
t 25°7 ~oA-·--~-----------&--lOP.
~ SuIuS~~n?~.". --~ .....
•."'--,,----
lina Sea
La
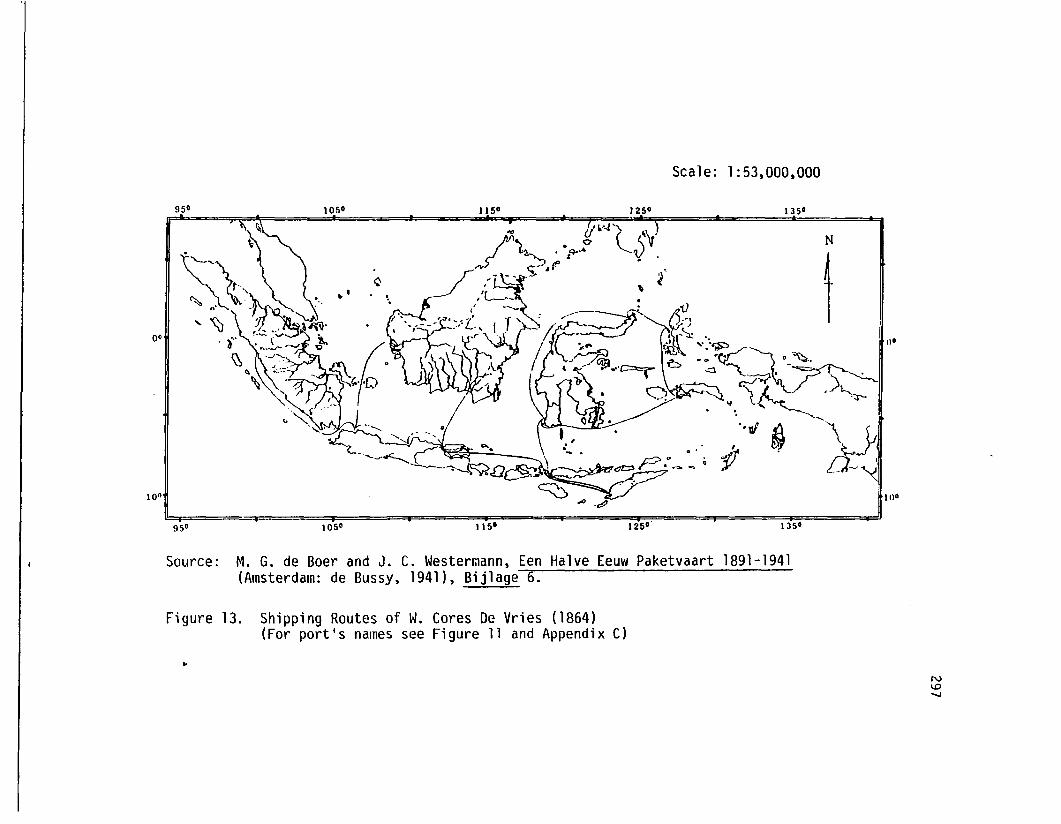
Scale: 1:53,000,000
0°
10°
95°
95 0 1050
~
115°
115'
:(,
125°·
135°
135°
N
1nO
10°
Source: M. G. de Boer and J. C. Wester~ann, [en Halve [euw Paketvaart 1891-1941(Amsterdam: de Bussy, 1941), Bijlage 6.
Figure 13. Shipping Routes of W. Cores De Vries (1864)(For port's names see Figure 11 and Appendix C)
..N\.0-..J
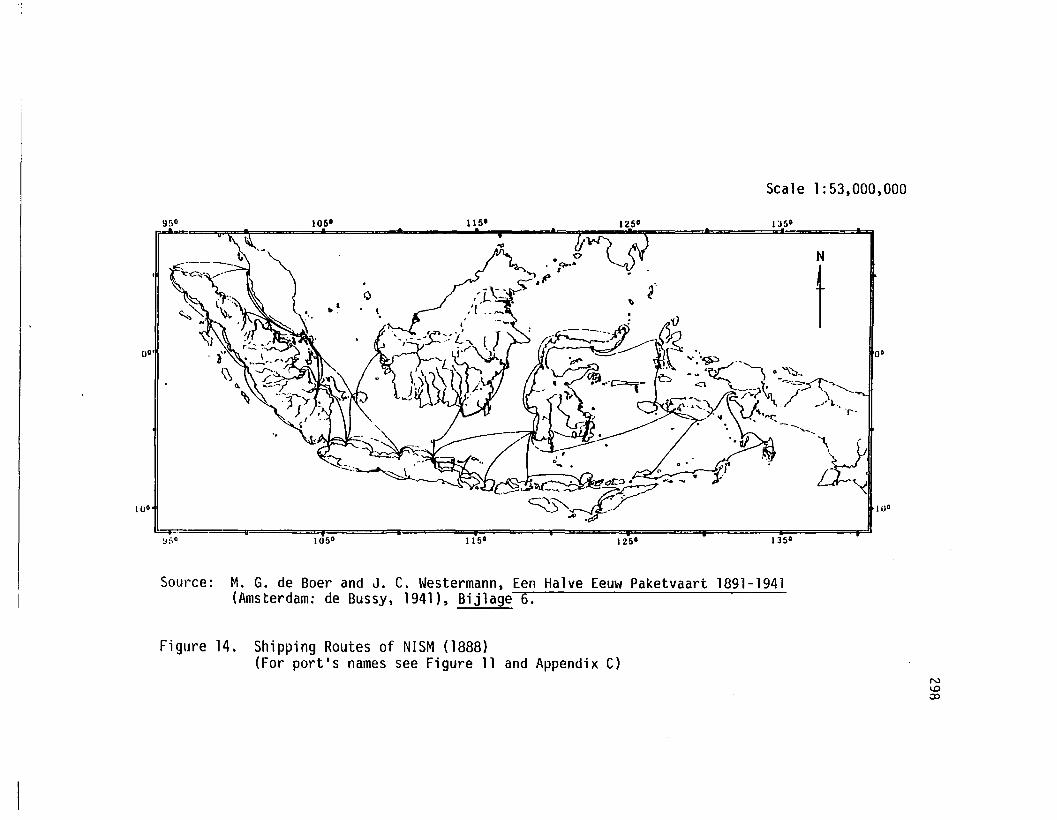
0°"
10°
gr,o
~:l0 105°
liS'
1150 1250
Scale 1:53,000,000
1350
N
to·
-'-'~"."- ,
~10°
135°
Source: M. G. de Boer and J. C. Westermann, Een Halve Eeuw Paketvaart 1891-1941(Amsterdam: de Bussy, 1941), Bijlage 6.
Figure 14. Shipping Routes of NISM (1888)(For port's names see Figure 11 and Appendix C)
N\.00:>
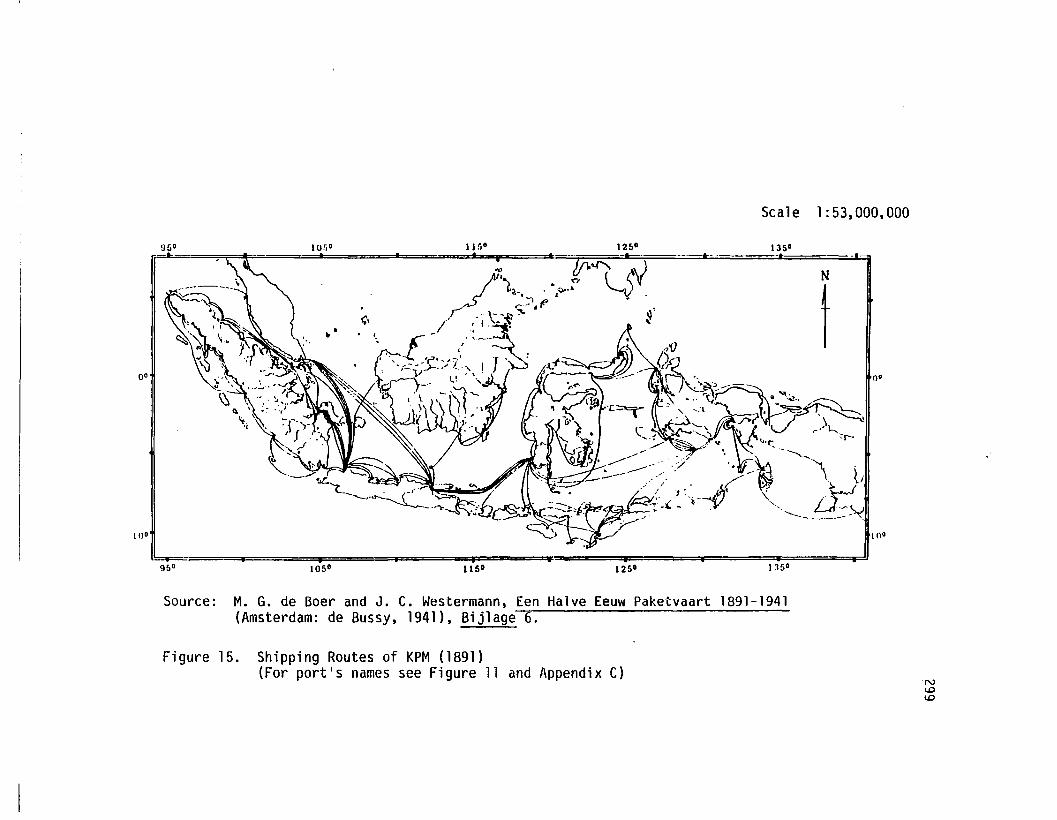
0°
1no
95° 10;,0 11 ;'0 125°
lj9"·~
Scale 1:53,000,000
1350
N
tO·
" i.~ \-1
"'____ LJ:'~._.---- "
10 0
95° Hi5 0 • li50 • 125° 1350
Source: M. G. de Boer and J. C. Westermann, Een Halve Eeuw Paketvaart 1891-1941(Amsterdam: de Bussy, 1941), Bij1age 6.
Figure 15. Shipping Routes of KPM (1891)(For port's names see Figure 11 and Appendix C)
"NI.DlO
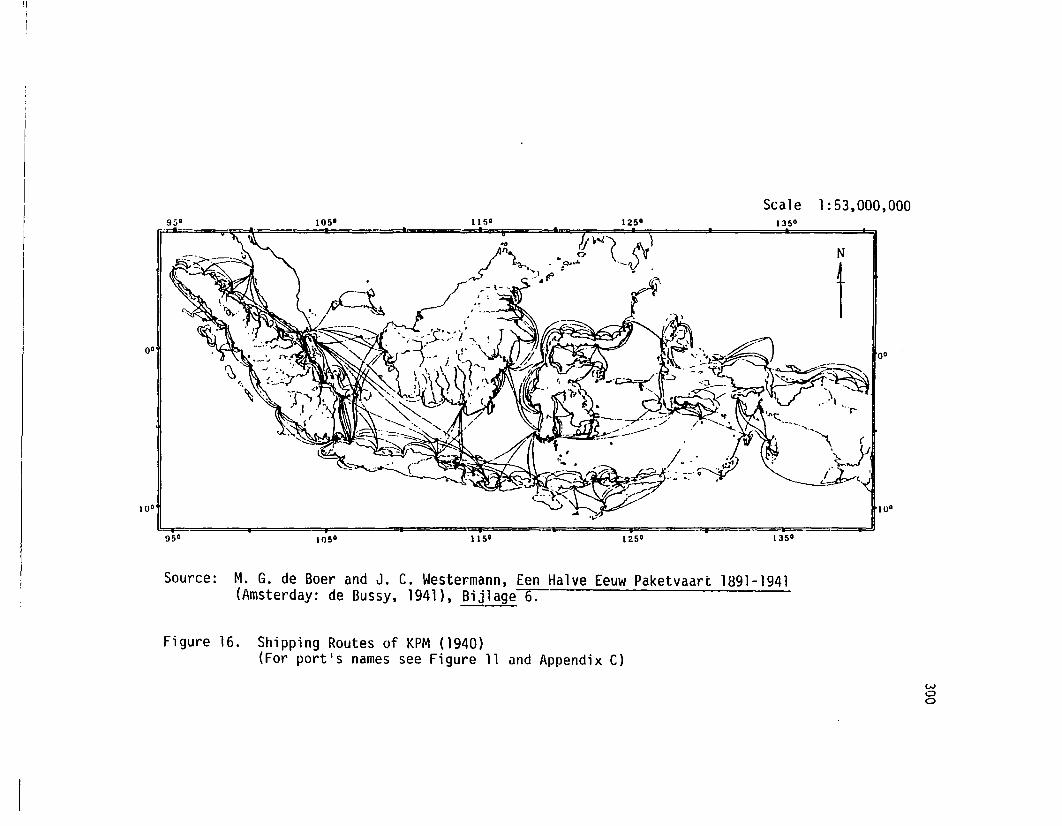
'I
0°
10°
95 0
105"
1050
11 SO
1150
1250
1250
Scale 1:53,000,0001350
N
t
10°
1350
Source: M. G. de Boer and J. C. Westermann, [en Halve [euw Paketvaart 1891-1941(Amsterday: de Bussy, 1941), Bij1age 6.
Figure 16. Shipping Routes of KPM (1940)(For portIs names see Figure 11 and Appendix C)
woo
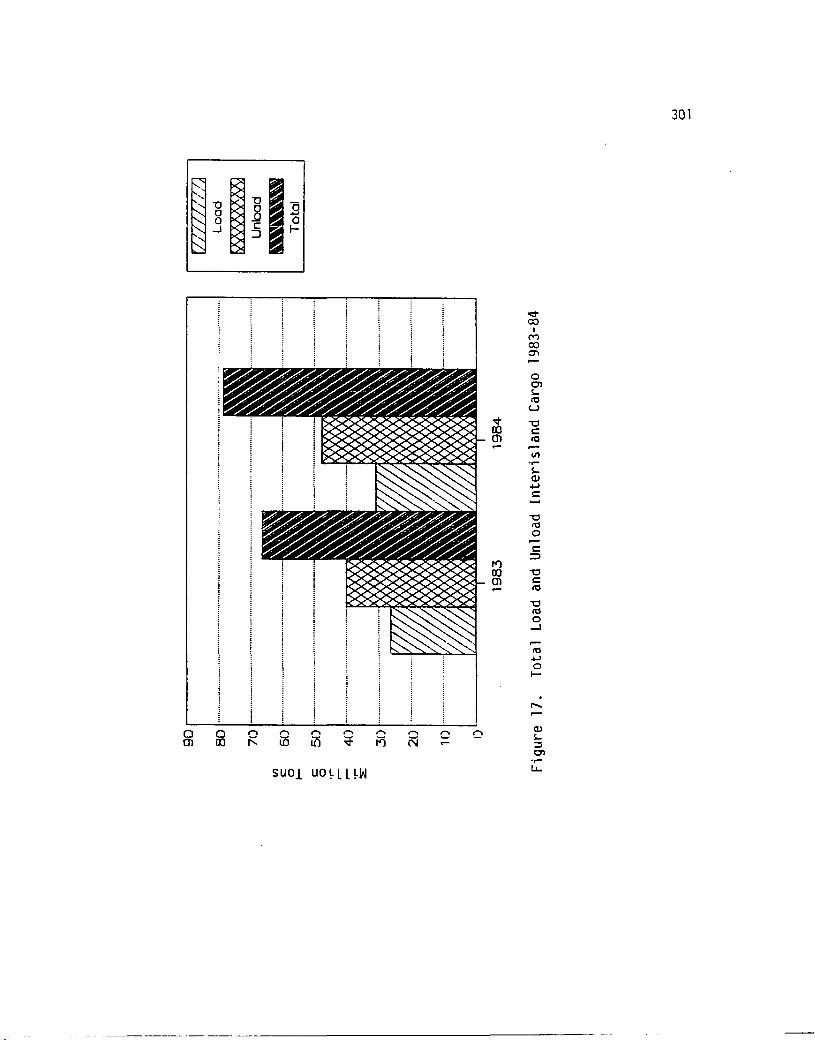
SUO! uoq L~w
-e-co
IMco0"1
00'1s,
"'U.;- -eIX) Cen "',...
VI.,..s,Q).j-)
C.......
\:l
"'0,...C
:;:)
:rl \:lm C
"'-e
"'0.....J
,...
"'~0l-
I'
Q)s,:::s0'1
u...
301
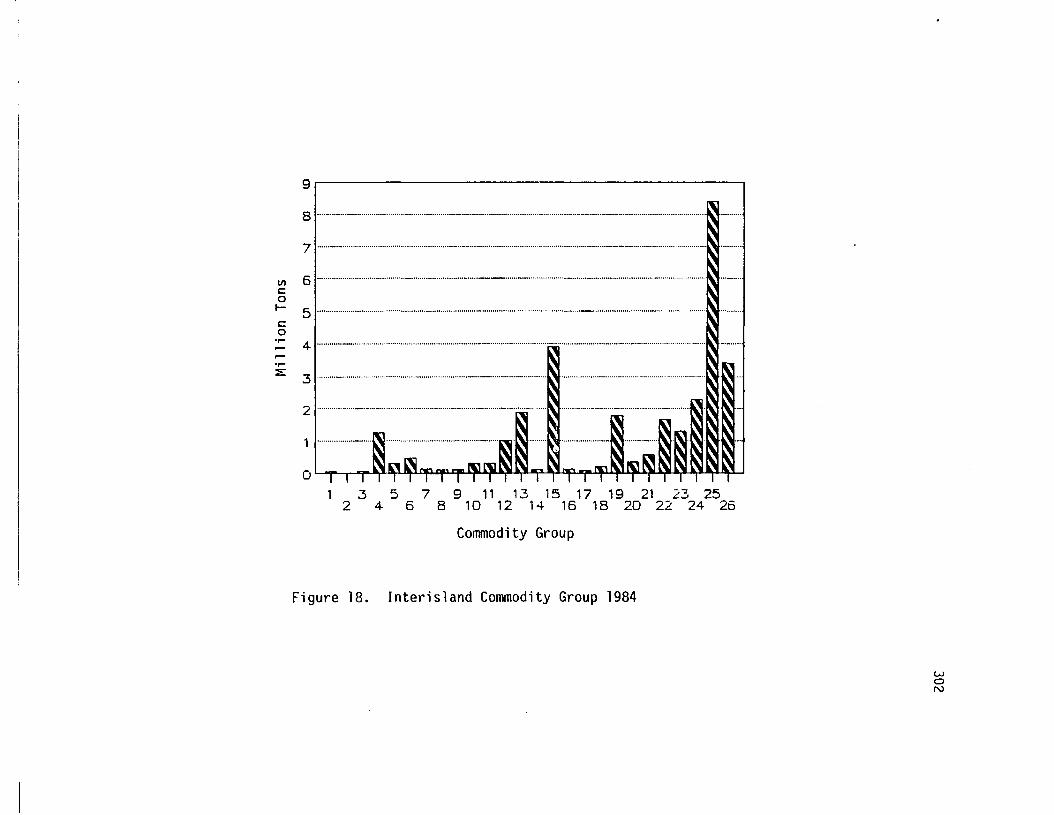
9· I
8 1····..·······-········································ -_ _ -.-..- -- Ilrr.,.
7 , _ - -..- ···········l"
5 , _ - _ _ .
j 6 - - __ __ _ .
co~ 4 1 ···..·.._······ ..····..·····..····..····..· · ·..····· _- = Ilrr..,r.....::E: 3 1· ·..·_..··..·..·..····..·· ··..· ···..····..··..·_·_..· - 1.." - - 1.."..'\1.
2 1··················..···..···-·························· = 1\., A,.".1\.'t\l
1 ,··················_····l"································-····················.,.,·N·
O'TiT~~~~T~~?~~~~~~~~~?~y~~~1
3 5 7 9 11 13 15 17 19 21 23 252 4 6 8 10 12 14 16 18 20 22 24 26
Commodity Group
Figure 18. Interisland Commodity Group 1984
woN
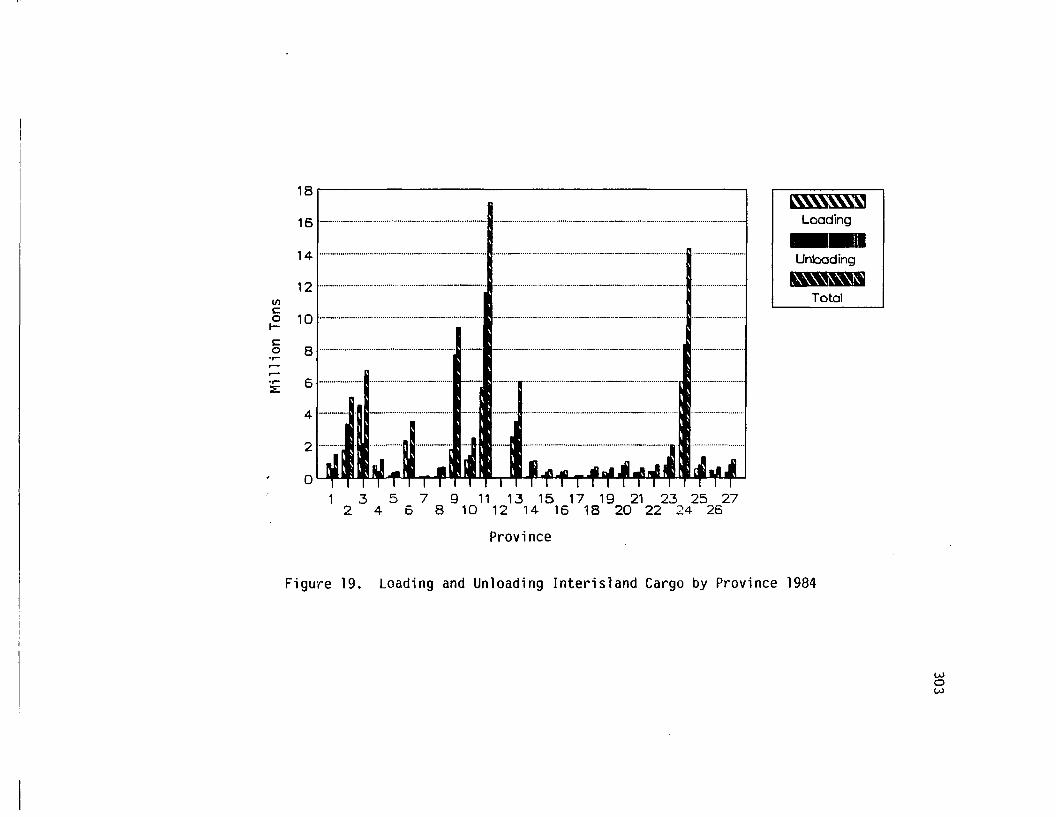
18. I
16 __ _ ,~
Loading
14 , _ ·n·..··.._·-······ ..···..···· ····· ··· ··..··· ., ~
12 1..········· · ··..··· ········· · ·..··..·_-_·-..· _ _ _ ~
VIc::ot-
c::o
10 '.-- _ ..
8 I _ · •• .. • •..• .. _ • .. ··u _
.._ _ ., ~
............................................................_ ·•·· ·..·..··..· ·..1
Unbcding
~Total
.,..rr-i: 6 , _ .
4···....-_....·
o3 5 7 9 11 1.3 15 17 19 21 23 25 27
2 4 6 8 10 12 14 16 18 20 22 24 26
Province
Figure 19. Loading and Unloading Interisland Cargo by Province 1984
wow
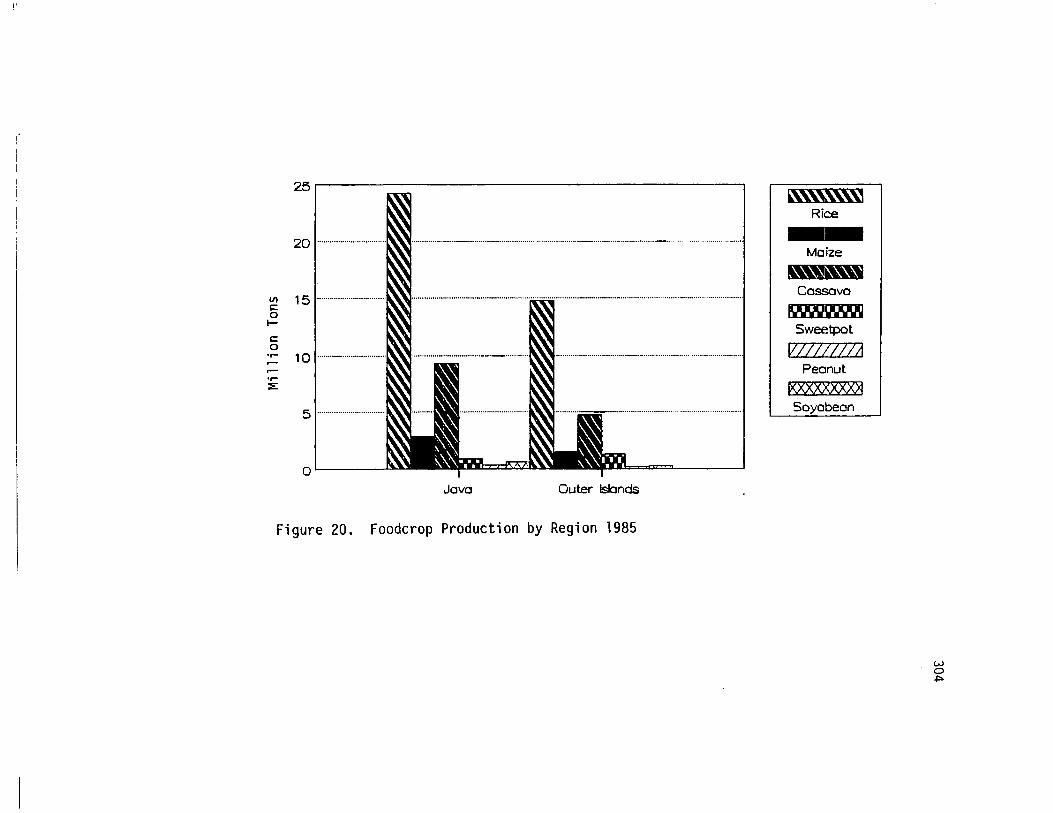
"
25 r-I---------------------------.,
Maize
~~Rice
~Cassava
PRN~Sweetpot
vvmmPeanut
KXXXXXXX>1Soyabean
.............................._._ · ·.. ·· .. •.. ·•· ·1
0' ,.... ,
51·..·..·..·.. ··......·..·.... ~,,'l
10·......·_..··......··....·....
15 1••.••••••••••••••••••••: ..
20 I·································l'."., _ __ __ _ _..~
IIIe:ol-
e:o
'rrror-::E
Java Outer Islands
Figure 20. Foodcrop Production by Region 1985
wo.,.
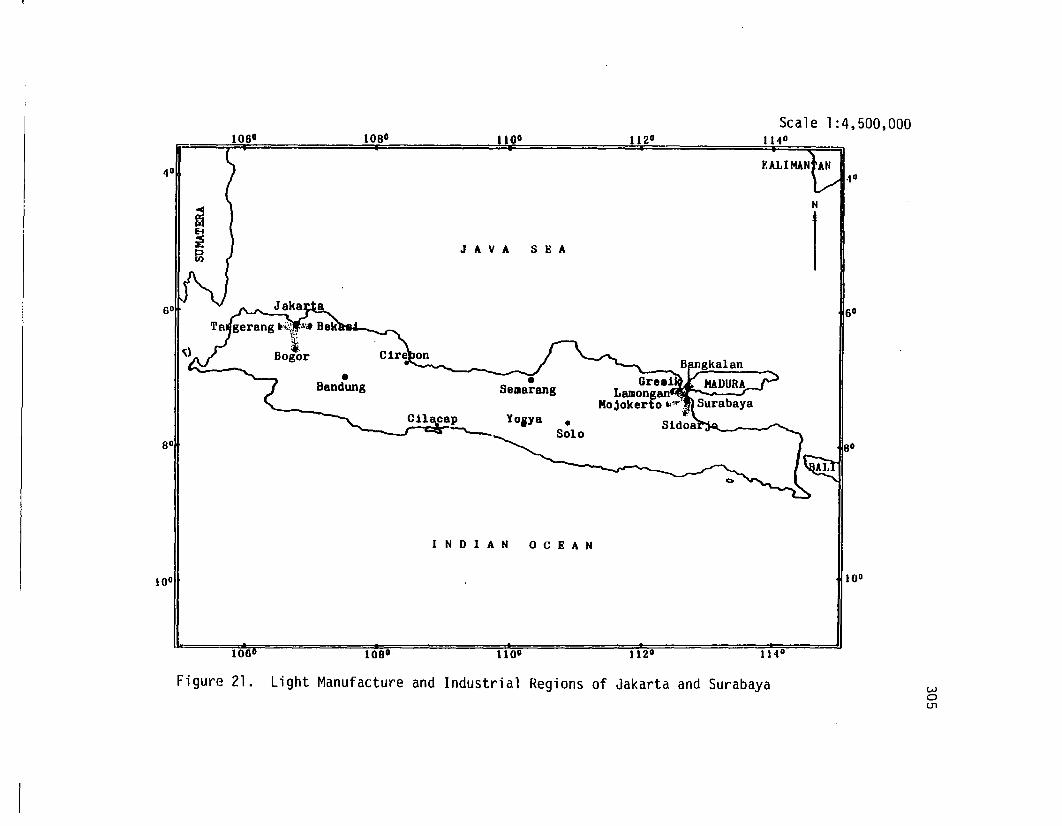
4°
80
a~~
1080
•Bandung
110·
J It. V It. S E It.
•SeID8rang
YOiya •Solo
112°Scale 1:4.500.000
114°
Y.ALlMANfAN·1°
N
1
6°
100
106 1000
I N D I It. N
1100
o C E A N
112 0
100
114 0
Figure 21. Light Manufacture and Industrial Regions of Jakarta and Surabaya waen
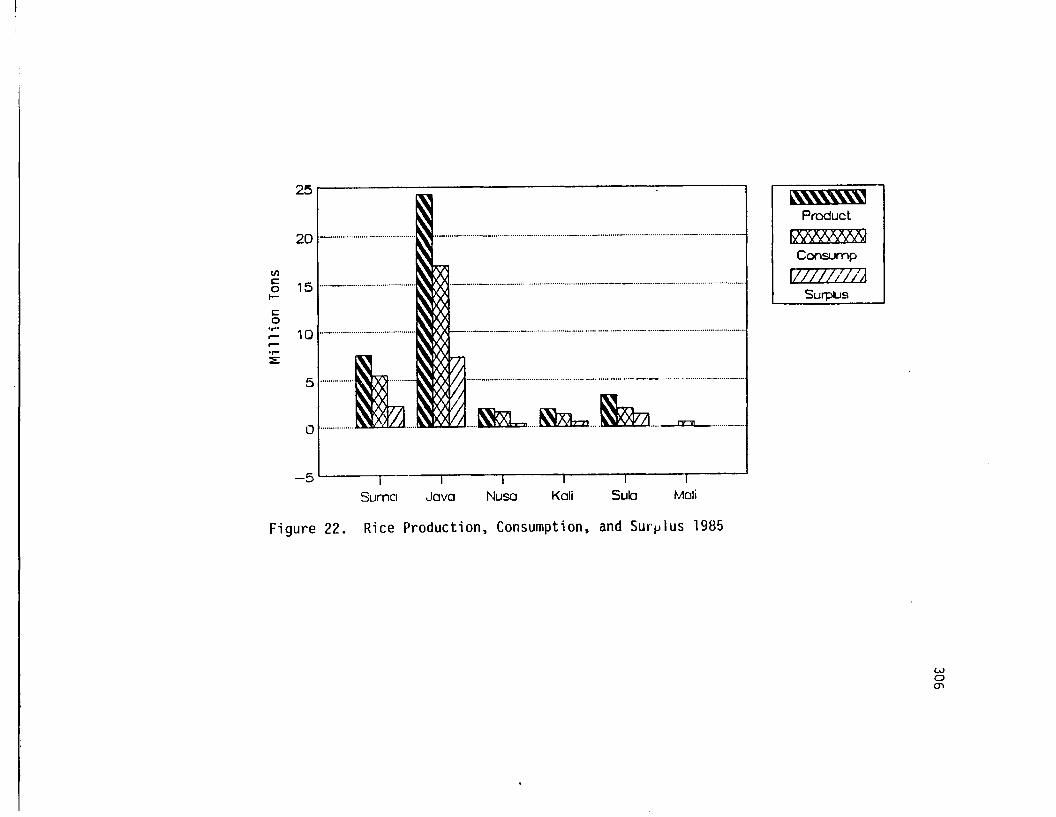
M"~Product
fllCl2S.I\W)()JConsump
vmltVJSurpUs
::~~~:t-D-~~-~_·····
10 I···_·..·..· ···· · ··..·..· · ,VI.)IJ-_···_-_..··_..·..·_ - _ ~
251r------------------~-----,
20 1-- ····..··..···..··..··, _ _ _ _ _ ..
Vlc:(3. 15 , __ .
c:o
,....,.....,...:E
....
-5' i
Sumci Java Nusa Kali Sula Mali
Figure 22. Rice Production, Consumption, and Surplus 1985
wo0'\
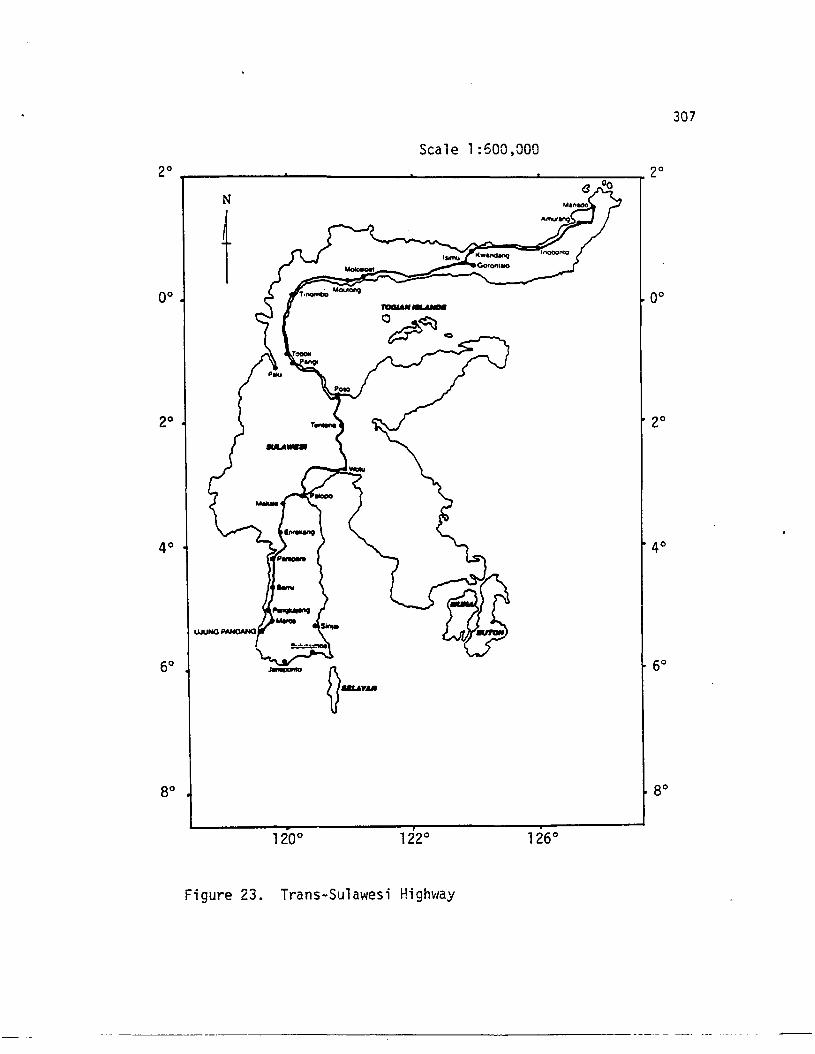
2°
307
Scale 1:600,0002° 2°
N
t IC_",,-- Gotonll~
0° 0°
8° 8°
Figure 23. Trans-Sulawesi Highway
-------------------------------------_.._- -_. ---_.
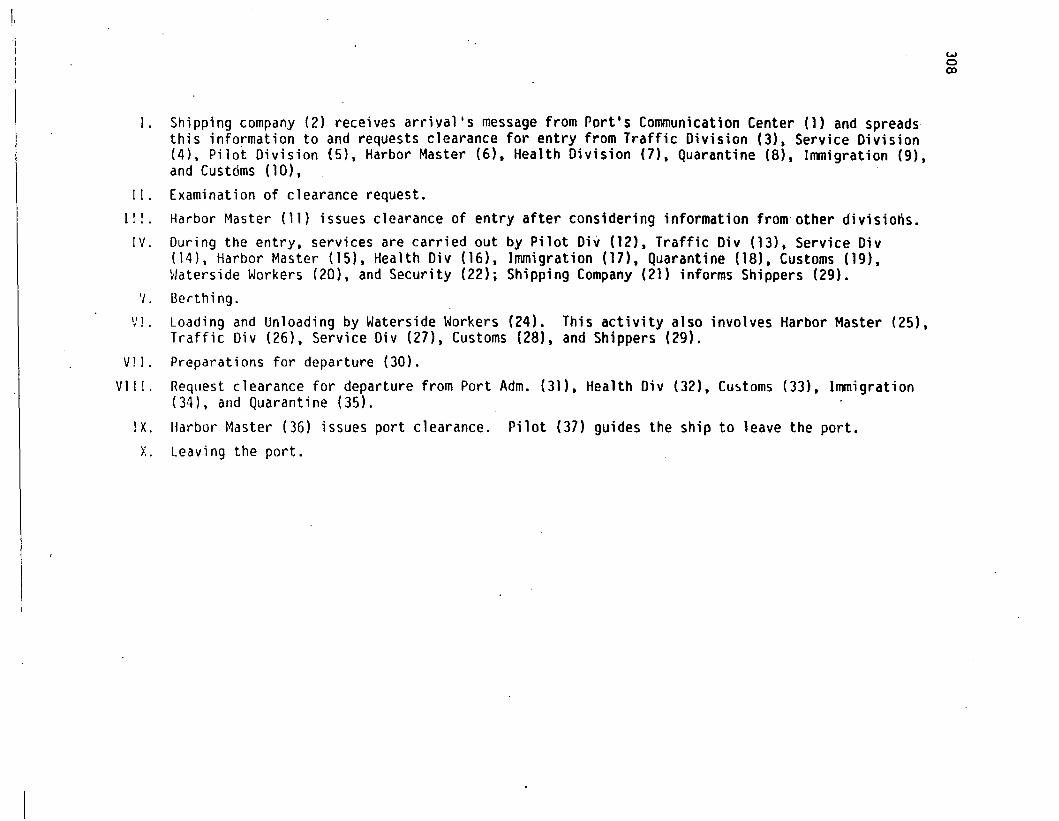
LIIII!
1.
II.
I I r •
IV.
'/ .VI.
VII.
VII I .
I X.
s:
Shipping company (2) receives arrival's message from Port's Communication Center (1) and spreadsthis information to and requests clearance for entry from Traffic Division (3). Service Division(4), Pilot Division (5), Harbor Master (6). Health Division (7). Quarantine (8). Immigration (9),and Customs (10).Examination of clearance request.
Harbor Master (11) issues clearance of entry after considering information from· other divisions.During the entry, services are carried out by Pilot Div (12). Traffic Div (13). Service Div(14), Harbor Master (15). Health Div (16). Immigration (17). Quarantine (18), Customs (19),~Jaterside Workers (20), and Security (22); Shipping Company (21) informs Shippers (29).Berthing.Loading and Unloading by Waterside Workers (24). This activity also involves Harbor Master (25),Traffic Div (26), Service Div (27). Customs (28). and Shippers (29).Preparations for departure (30).
Request clearance for departure from Port Adm. (31), Health Div (32). Cu~toms (33), Immigration(34), and Quarantine (35).
Harbor Master (36) issues port clearance. Pilot (37) guides the ship to leave the port.
Leaving the port.
woQ)
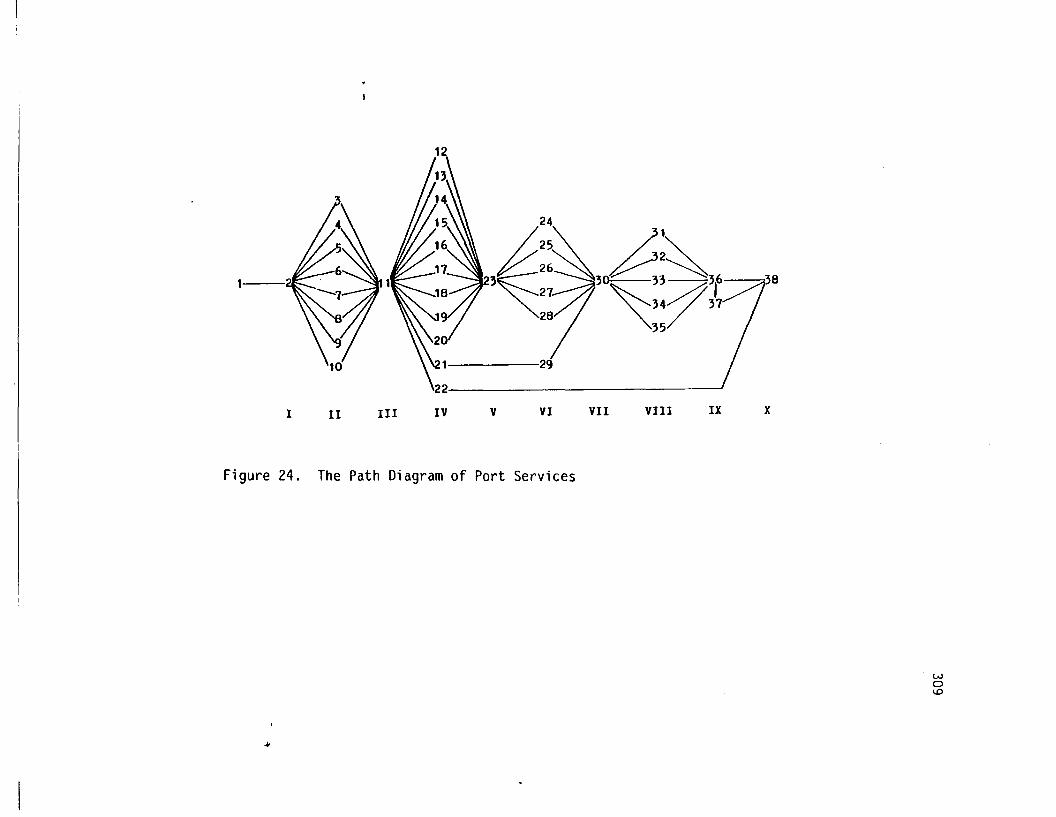
L;~;J30A~3r ,38'~27 ~34d37~28 "'35~
1-----29
I II III IV V VI VII VIII IX x
Figure 24. The Path Diagram of Port Services
.JI
wolO
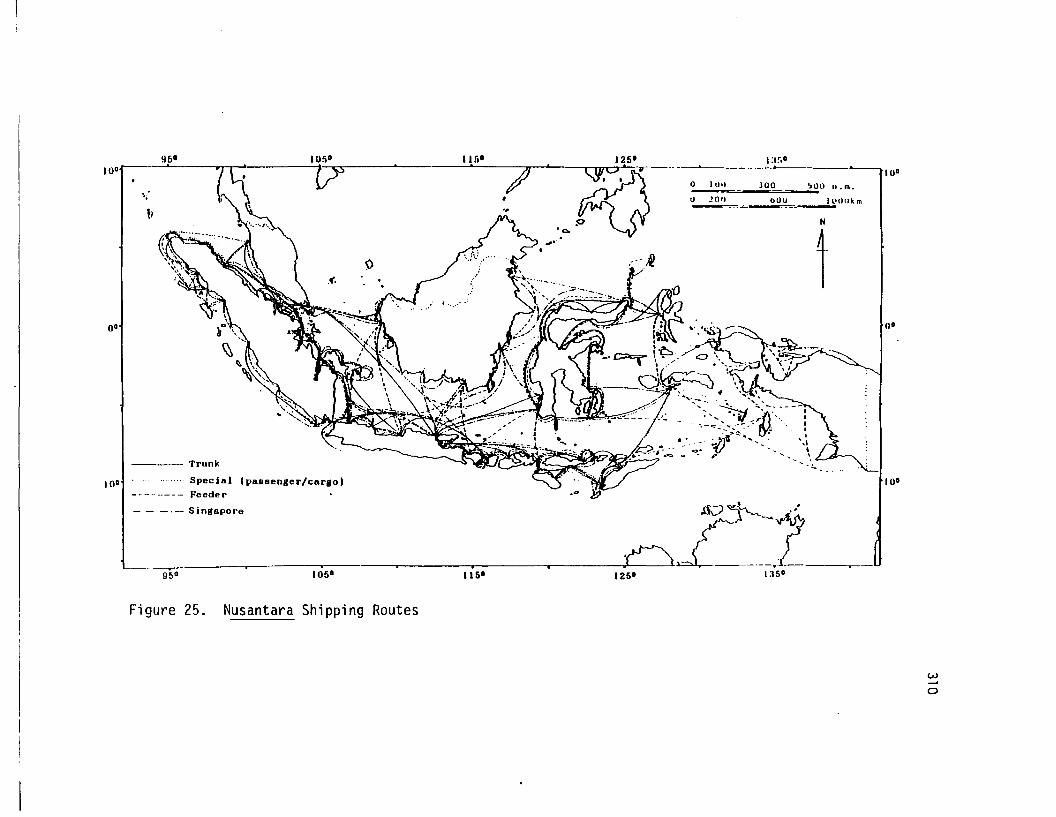
- - _.- Singapore
,950 • 1050
IUO
10°
00
N
tbO.~ __~()IJkm
1:1[.0
lOa ~110 n.m .Ill')
201)
ll!i' 125'~ 7' PQo.,.---... - .
I • •• 0 - -
!l
. PC>o
". .
I,U ~
!il~ ~I~'...--::::
~. c;:>c;- I'~ /": '_ , ~. -: 0 .'- ..
. r3J"\j'I ~-, ':(:"----~,~~ "
~. '~,.,-. ". ..~'.
_,/ . l' - _,__-"c -; - <:» '<-'- -- --,~~ I' ~-:~i~:'~~ . :
... '-';:'. . _......';.:-: -: y -'-< -.\." l'
~.
· ,i,. · ,p~~~ ~.1135 0 ---,-
1050
Trunk
SpecJal (passenger/cargo)Fee de r-
95 0
11
.'-;
00
100
100
Figure 25, Nusantara Shipping Routes
w-'
o
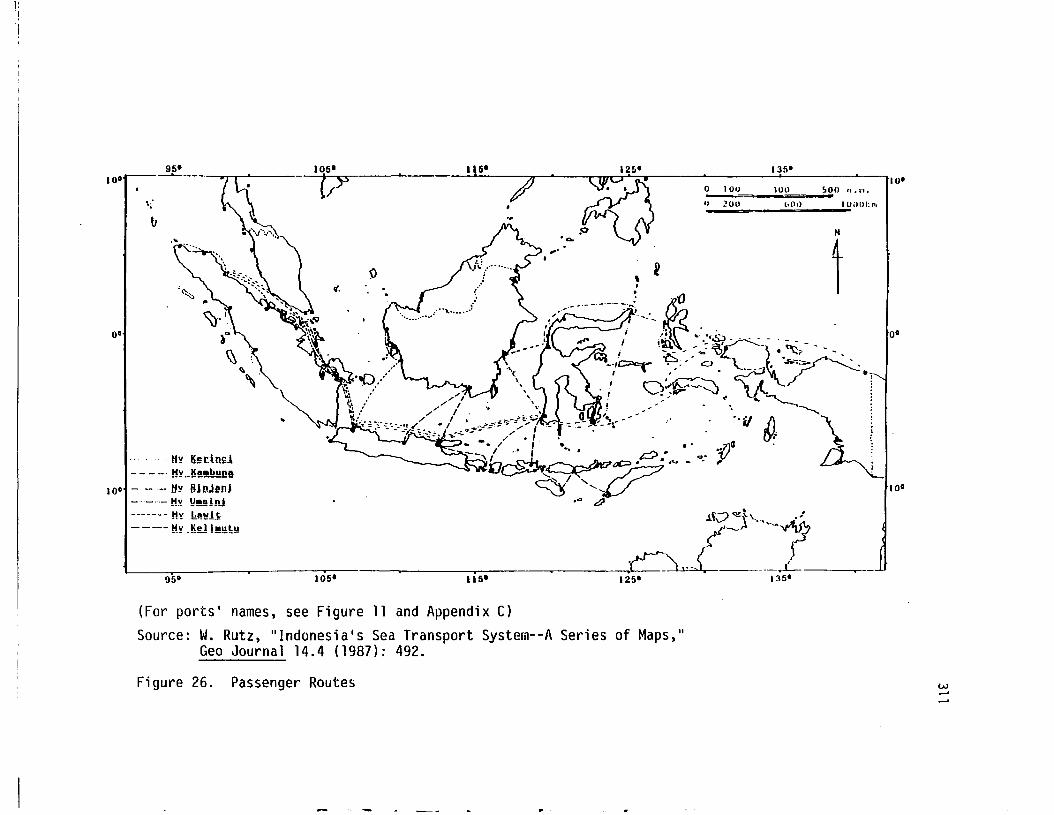
101
00
N
tbOl)
lUll
1358
, Of)o
1251
~.'-'..
p• Q,
, ~,
: ~tJ," .....-._.- _._._.- :--i.. ...:_
,'" .i;;.-". ":~.- ......' ,·oS;Ir-... - ----_.~(-_::~/ !ou., :a' -~--_• ~ . i - - - 'b U • l.i:? .....~_"~ ~;., 0 ~___. '.,;.-::::.. ' ,
,-' .~ ~.' O:;~ 1! ::- " ... :! • • . " --.......... :
..__~_-_Q.I't~.-_-_· ',~J ~ ~:.. ,- r- ..-'. . ., - ;~ - // .1. ; r ~.. ." , .. • ' ,.na · :
- I ..• , ... ~"·v :------8b~~£=>. ' ..,. 0: , i
~/',~.0 .cJo
QIf,
1051l7 ~
..
~f~ Il.,_
b
'to
It'::' Ke r: lnc1
~l!_!!!!!!!!m!!
- -- t!l!!UnJ!n!----- ttl! Y~!nJ
-----.- tl'::' h~!!ll
---- ~l! .!!!!J !!!!t!:!!
00
10 0
10 0
950 1051
(For ports' names, see Figure 11 and Appendix C)Source: W. Rutz, "Indonesia's Sea Transport Systern--A Series of Maps,"
Geo Journal 14.4 (1987): 492.
Figure 26. Passenger Routes w--'.....
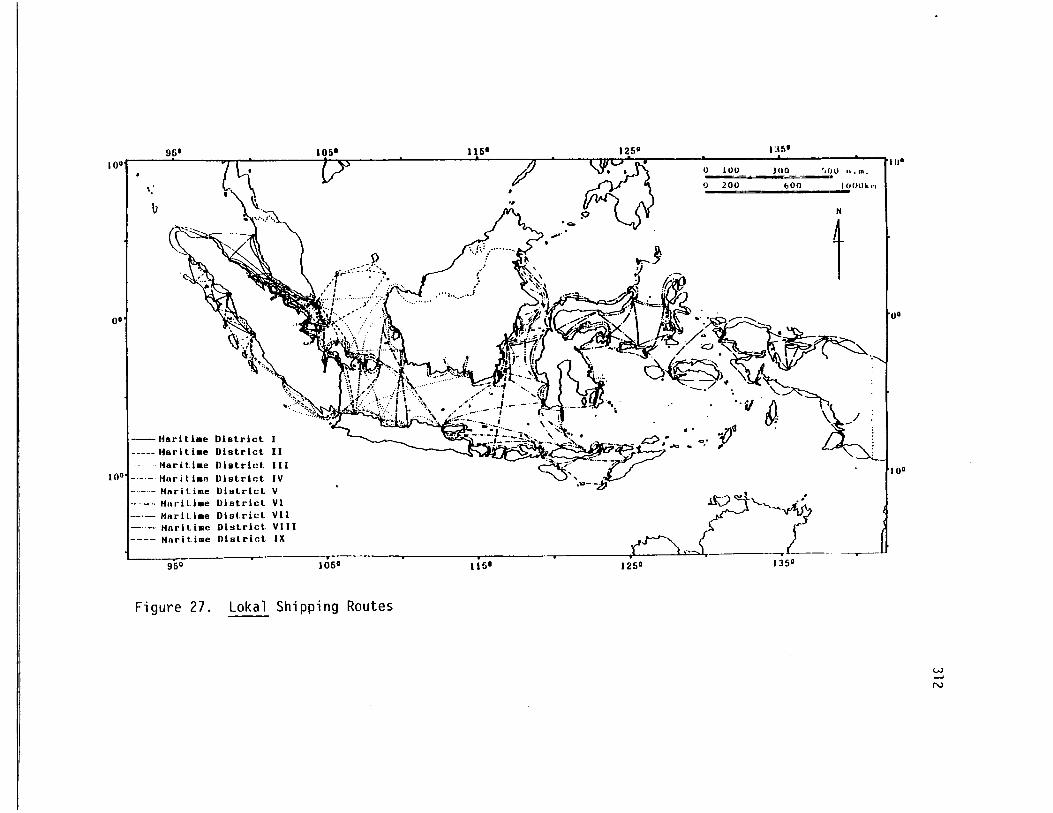
960 1051 1151 1250 1351
wi ' '7 \ . / y . . (). PO.o ,. . ~ 100 J:IO ~O lI.'m. pliO\ '" \ f) 200 baa I ()Utl~ 0"
'\ '. ~
b ~ M •.~p. t/ ~:-~:~~~!fJv.···1 ·.. .~~.._0. ..,.,A o.
~ , , '---=00. "g.- lIP:"'-" -.' -·A ,;j:',. _,~ ._. i. _~ t" ..»: __ ~OO
--fiariUae Dislricl 1..
----- Itar IUae Districl II-·Marltiae District 111 c;.::.'"';;;., tf/10°1_.___. Marl Uae 111slrict IV
tlOo
_ .._..- Harl t.lme District V_ ..._ .. H"dUae District VI-.- Haritiae District VII_ ..- Hnriliac District, VIII
Hnrltime Dislricl IX. •950 1050 I' ~. I ?I;,G J 350
Figure 27. Lokal Shipping Routes---
w-'N
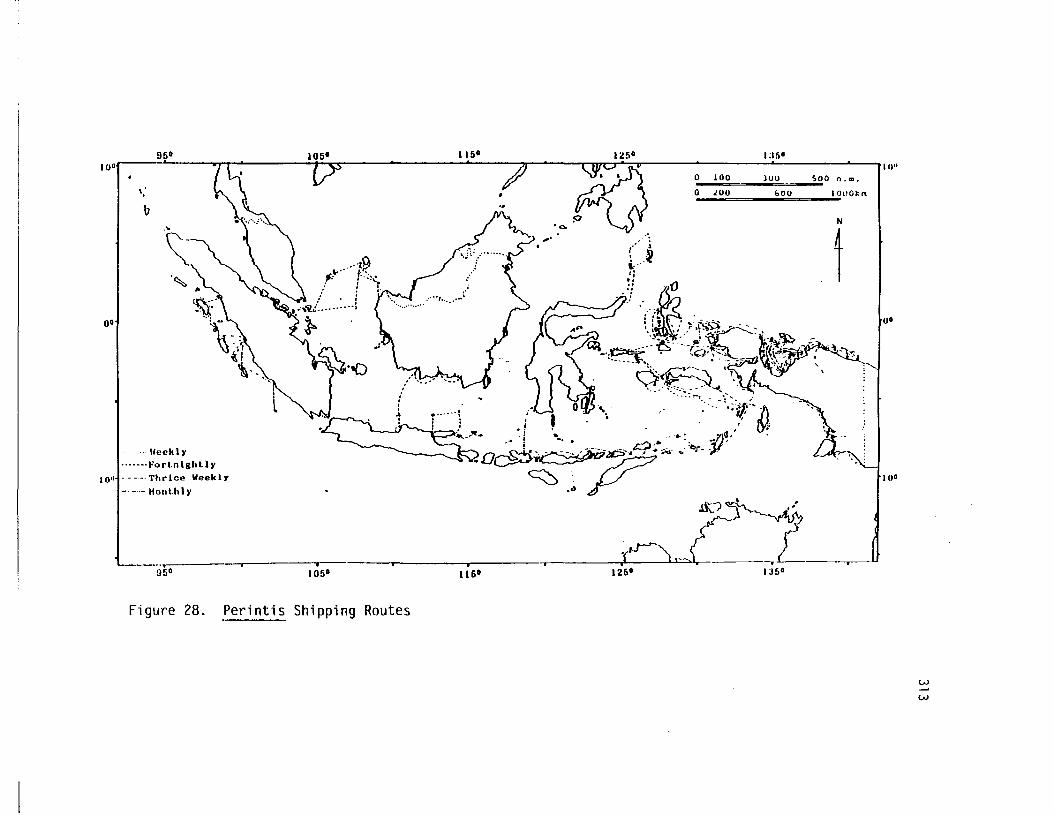
licck I)'
···••.....orln 19h1l)'IOu1 ....····Thrice Week17
_._ ..- HOlllhl)'
0 0
10·
N
t
I:Hi'
lUO
bOO
100
o '"''o
USo
" ~......... -
P'6. .'
,;0' ,.~ ~ i( ~,...."I
.:!
115'
1150
~tJ
.' ,
((l ...-:' ''''N~~- .. , >~\•.~~~.>;:'. , ~-, ~"',.! ( 'J;... I ._':"~····'r, .. :.~ '(S"" ,~ , .... , v> !.O': :,:~._"-'l>' , :-'~ . .::-:.. --,." -. ~~------. "
Q(~-~..., ',1
....' '::~':::'::... , ~';>w:_~'-. t.. I. , .
, :.- ~ . -II,' .I· . .... f)''."
./ ', 0:'''-;;". ~.~j•... , -. . .....~-'.-". ,. j ~/t:>.
------- £QDc:§;:\;:" . ~?7 '.:--V .• r J$;.?:"t'~
~,.L-o? ."• 125 0
105'
. -.105'
'~"". "
-'\J~"
'~
950
95 0
.~
~
v'.
00
Figure 28. Perintis Shipping Routes
W~
W
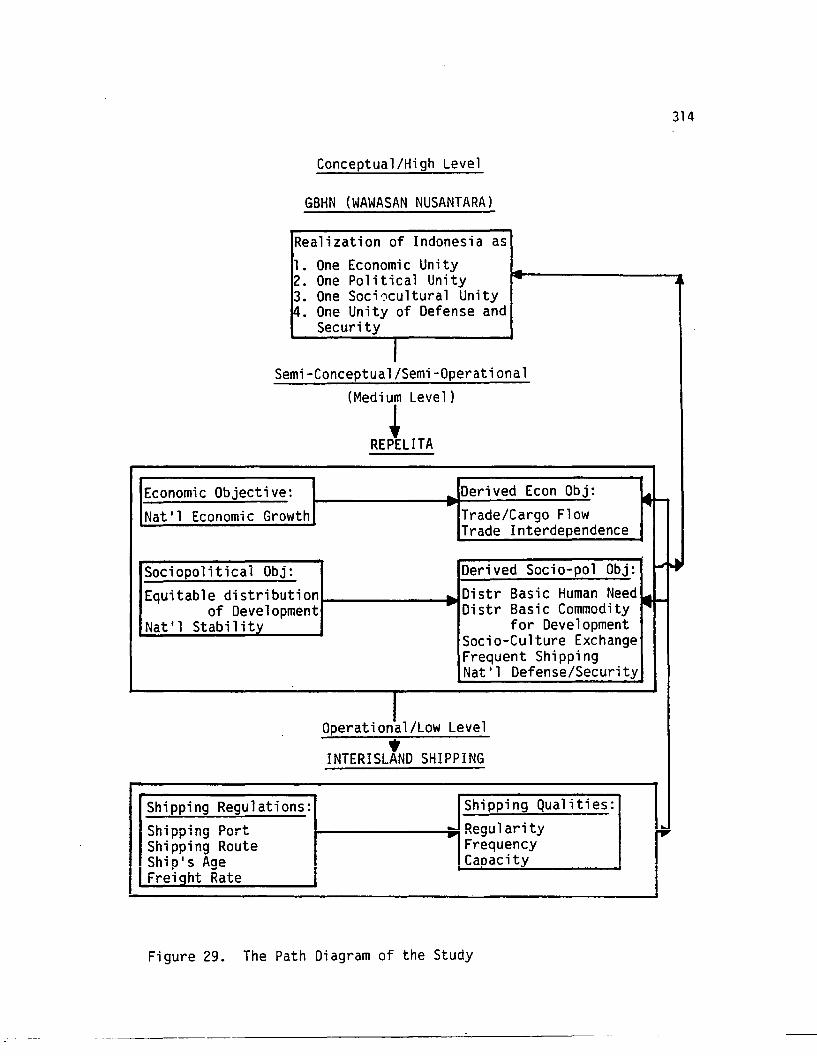
314
Conceptual/High Level
GBHN (WAWASAN NUSANTARA)
...-- Regu 1a.. tyFrequencyCaoacity
Realization of Indonesia as
l. One Economic Unity -2. One Po1i tic a1 Unity r- •3. One Soc;0cultural Unity4. One Unity of Defense and
Security
ISemi-Conceptua1/Semi-Operationa1
(Medium Level)
REluTA
Economic Objective: . Derived Econ Obj:~ ~~
Nat'l Economic Growth Trade/Cargo FlowTrade Interdependence
~Sociopolitical Obj: Derived Socio-po1 Obj: OJ
Equitable distribution ~ Distr Basic Human Need~of Development --- Distr Basic Commodity~
Nat f 1 Stabi 1ttv for DevelopmentSocio-Cu1ture ExchangeFrequent ShippingNat'l Defense/Security
QPerationll/Low Level
•INTERISLAND SHIPPING
Shipping Regulations: Shipping Qualities:. I r; I ..
Figure 29. The Path Diagram of the Study
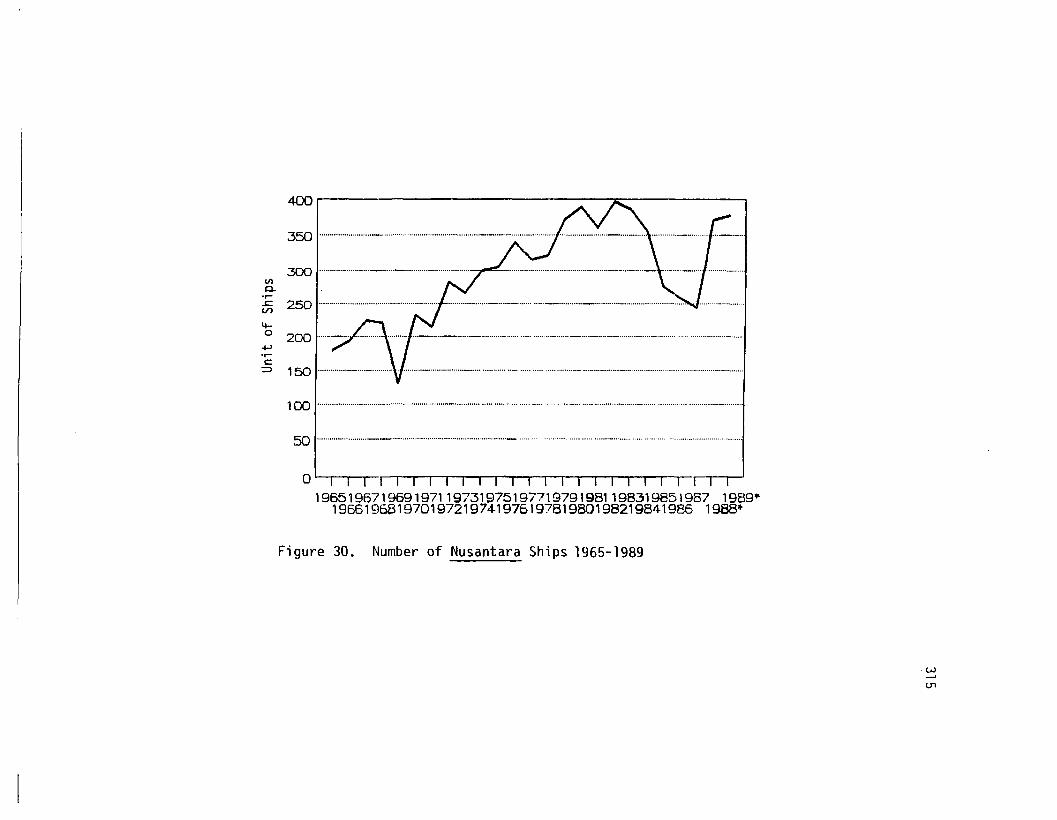
4001 ...... I
350 1·····..···········..·····_ ··..······..····..···..·..·..· · __ -/- _ \ _ ,.
300 , _ _ ..IIIc..
i5i 250
4o
-+->or-c:
::> 150 , _ ,-1- _ ·..· ·· · · ··..· 1
100 , _ .
50 1 ·..· · ·__ · ·..· · ·· ·..·..- (
o I I I I I I I I I I I I I I I I I I I , I I196519671969197119731975197719791981198319851987 1989·
19661968197019721974197619781980198219841986 19B8~
Figure 30. Number of Nusantara Ships 1965-1989
·w-"
en
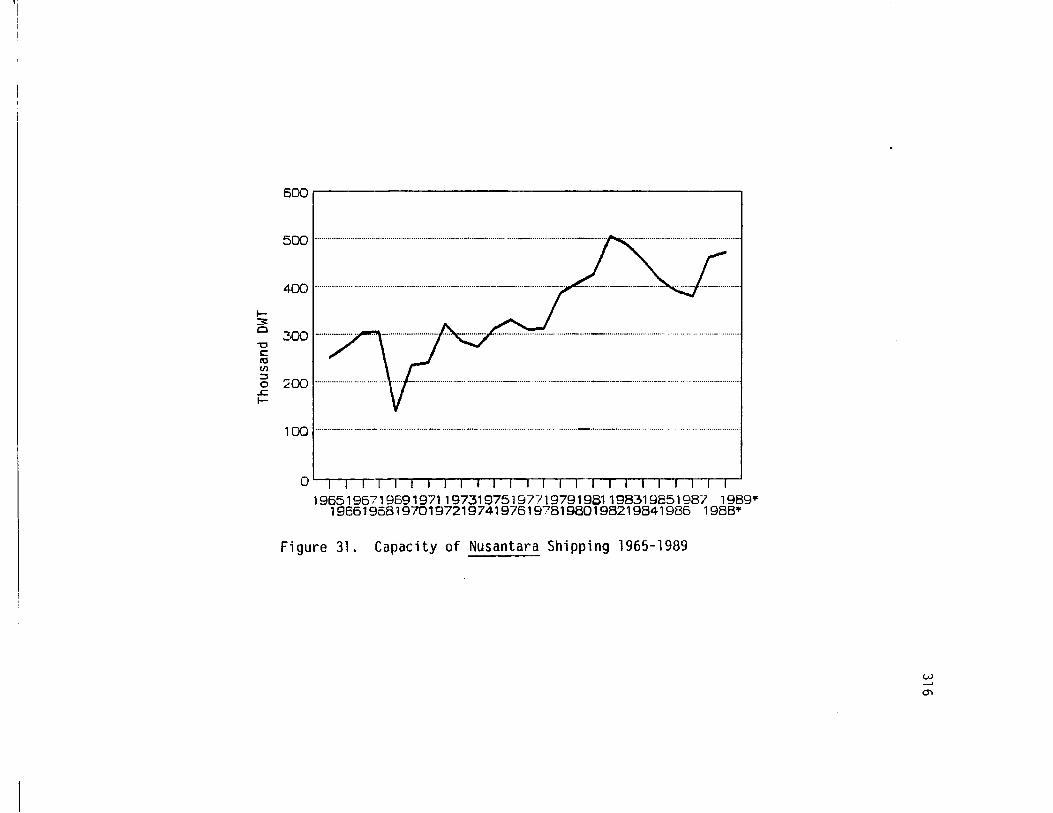
WO, I
500 I·····················································.......•.........._••__•............._ _ _ _~...•....•..................... ························1
400
~3:0
~
c:ItlVI:::l
:2000.c:~
100 1····_············ -- _._ _.."'- . _ -.__ .
L Io I I I I I I I I I I I I I I I I I I I I I I I I I196519671969197119731975197719791981198319851987 1989·
19661968197019721974197619781980198219841986 198B·
Figure 31. Capacity of Nusantara Shipping 1965-1989
w~
'"
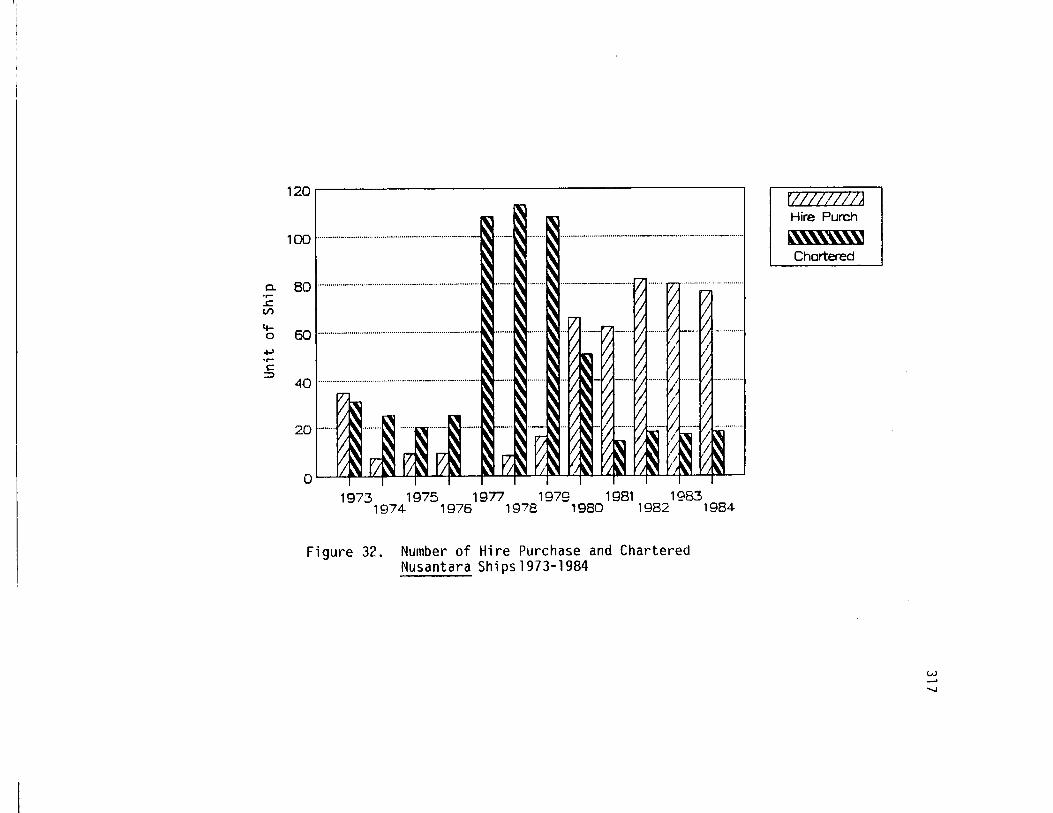
,;,
FZ77Z7Z77AHire Purch
~~Chartered
4D I..........·....·..·....·..·..·..........·......·...._..·....·..·........·..·\.~
100 1 · •.. • .. • • •.. ·-
20··_....
120· I
o I If~ 1/", 1/1l" 1/~ Il" I (It" I (I'l I '~' "t-" ! lj" r II" (/1'1
0. 80 I ·..··· · ··· ··.. ·· ..·· ·..· ······· ·· ·..A,.,....~Vl
4-o 50' ··..· ·.. ·· .. ···· ..···· · ·.. ·· ..· · ·
+->....e:
::::>
1973 1975 1977 1979 1981 19831974 1976 1978 1980 1982 1984
Figure 32. Number of Hire Purchase and CharteredNusantara Ships1973-1984
w............,
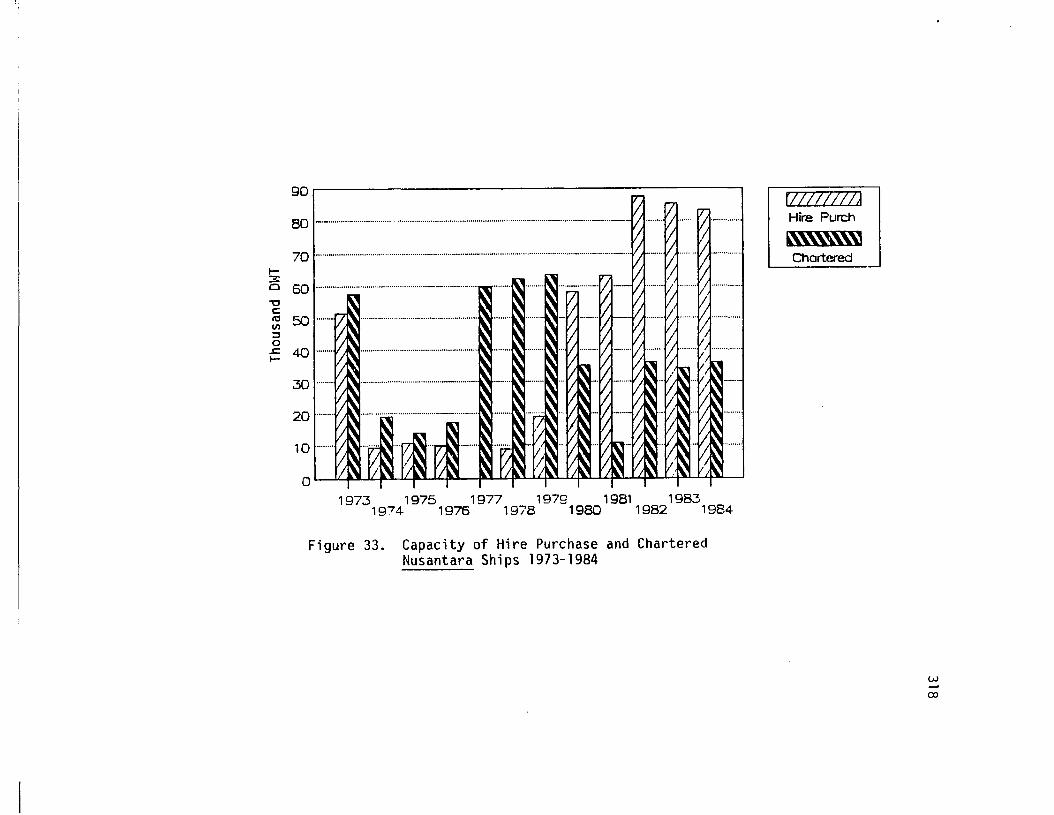
90, I
80 1-••••••••••• ·•······•·•················•···········•·.....•.•.•.........•.......•....•.......................•...•..........•...••....._ ••
70 1••••••_ ••••••••••••••.••.•· ••·•···••·•••·••·•·••••••• ••••••••.••••••••••••••••••••.•••••••••.•.•.•••...•...••.••••••••••••••••••.••••••••_ •.•
I3Cl
""0c:~ 50········::3of=. 40 .
30·········
20·········
10 .
o I lip 1/~ II~ I/~ I" !II" I'!,,' II!"] I I!"] I q" r .pt.! r It" !
1973 1975 1977 1979 1981 19831974 1976 1978 1980 1982 1984
Figure 33. Capacity of Hire Purchase and CharteredNusantara Ships 1973-1984
rIIIIO'IIAHire Purch
~"'\\.m\."\1Chartered
w--"
co
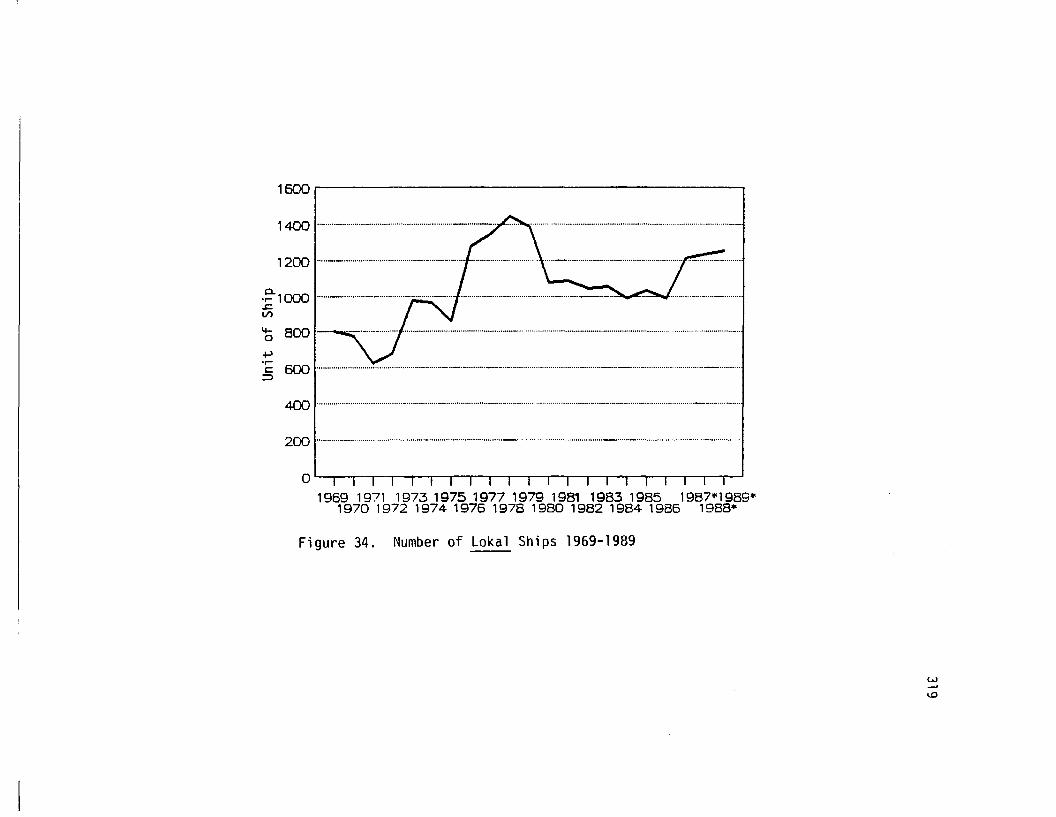
1600 i I
1400 _ __..
1200 \ _ _ 1- \
c..~ 1000 _ _ _ _ __.._..
(/)
b 800 1-·--.,,-·_..· ·· ·/-· · · ·· · · ·..· ·.._..· -- ~
+.J.,...:5 600 _.._ _ _ _ .
400 _ _ _ _ ..
200 - _ _ __ --.. --
0' I I I I I I I I I I I I I I I I I I I I I '1969 1971 1973 1975 1977 1979 1981 1983 1985 1987·1989·
1970 1972 1974 1976 1978 1980 1982 1984 1986 1988·
Figure 34. Number of Loka1 Ships 1969-1989
LV......U)
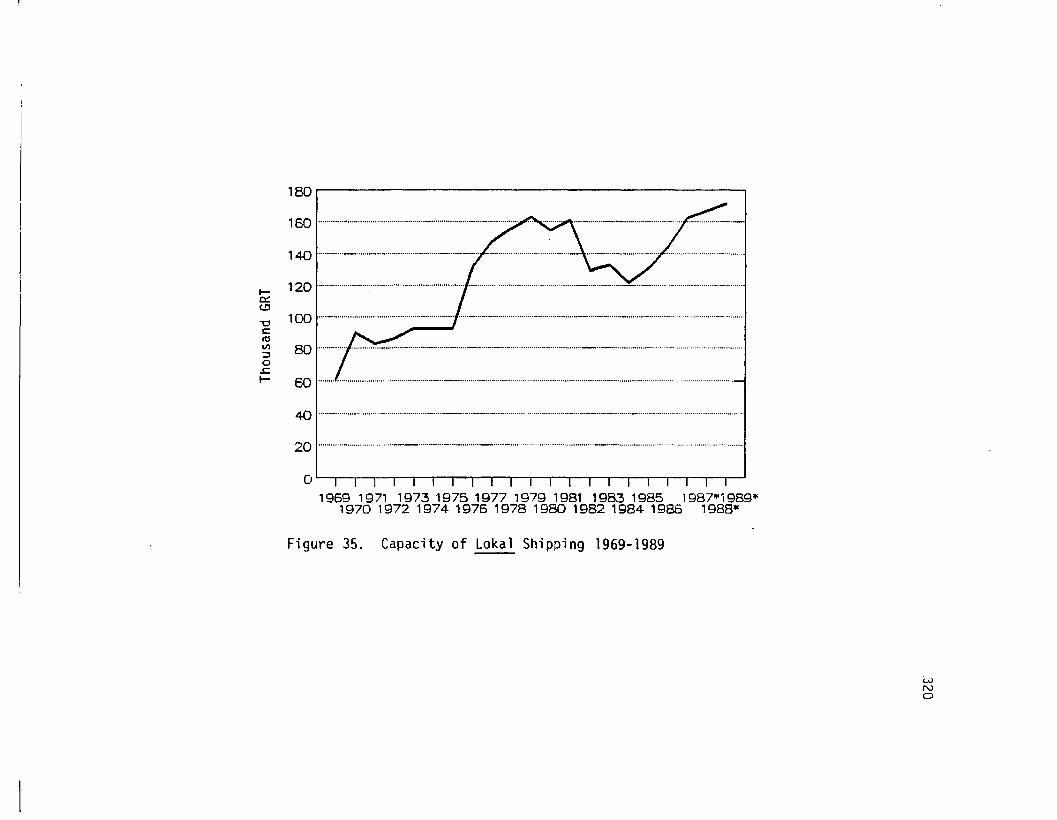
I~
C.!I
"0t:ttlVl::los:I-
180 i ,
160 , - _ .
140 1.•..........- ..· ·.·..· ·.•.•..•........·•...- •...•.~...•...•...............................-\
120 I"'"······················.. ·······················•..···· -/ ::'!"••.••............•......................•.........~
100 , t ..·· ··..· ·······..·· ·..······..···..·..·· · ·····._ .~
BO I············-I··········~·__······•······•············ _ - ·····················..·········1
60 , 1.•...•.........••...........•........••••.•..••••.._ ~
40 I····················································· _ _ (
20 I············..············· __ - ........•...........................- --- - .
0' I I I I I I I I I I I I I I I I I I I I I I
1969 1971 1973 1975 '977 1979 1981 1983 1985 1987·j 989·1970 1972 1974 1976 1978 1980 1982 1984 '986 1988*
Figure 35. Capacity of Loka1 Shipping 1969-1989
LvNo
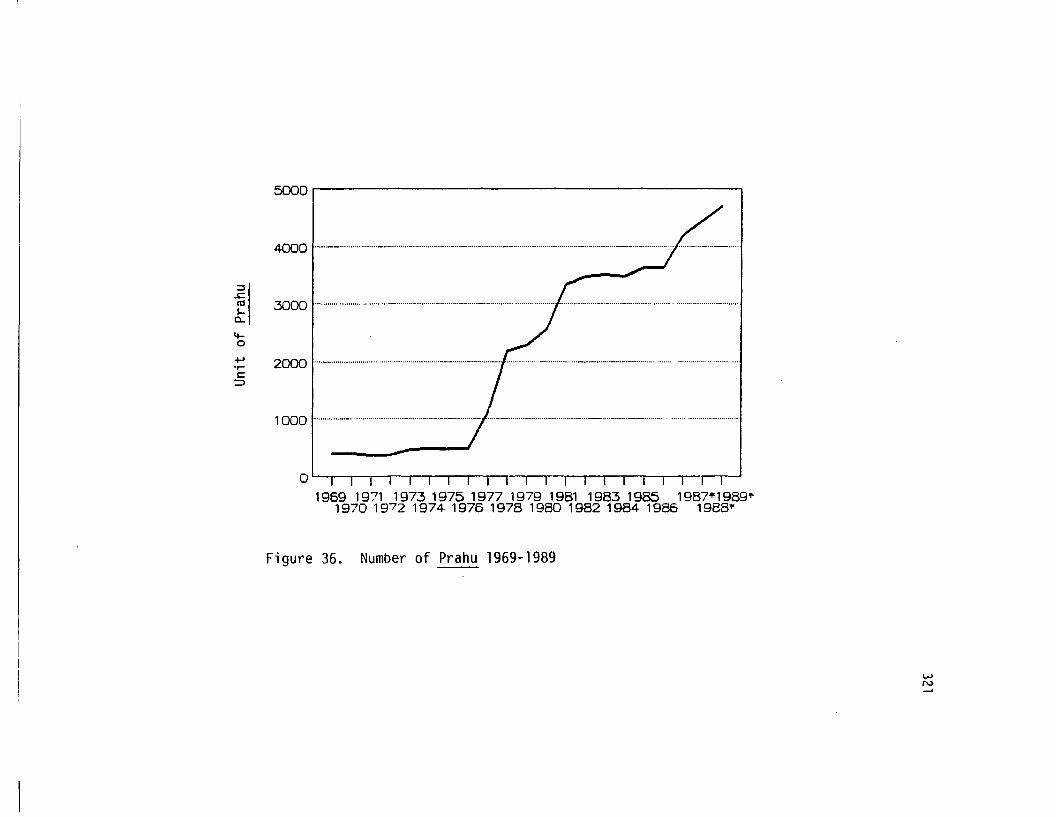
~' ,
4000 , _ _ _ _ ·······F·····..···_·..·_..···~
;:,..c:10 1 3000s,a..4-0
+> 2000'r-s::
::>
1000
0' I I I I I I I I I I I I I I I I I I I I I I
1969 1971 1973 1975 1977 1979 1981 1983 1985 1987"'1989'"1970 1972 1974 1976 1978 1980 1982 1984 1986 1985'"
Figure 36. Number of Prahu 1969-1989
WN
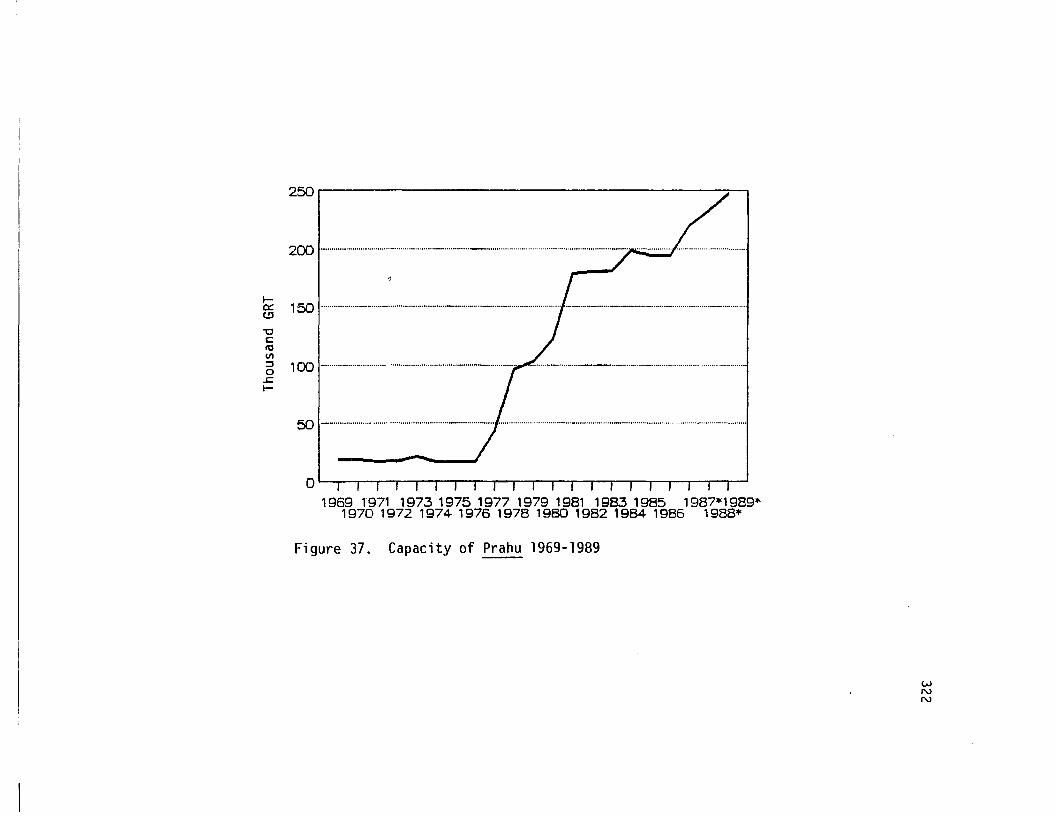
250 r'--.----------------,....-..,I
200 , _ _ ·· · ····· ..· ·· ·..· ·· ·_..~· ·..···I··· ··· ..·..· · ·1
t-o:: 150 , _ _.._ - .c.!l
"0c:ItlVIg 100 I ··• .. •• • •.. • • • _ _-_ ..
.ct-
50 1 •·• •..••·•..·••·•..·· ..·..•·..·••••..•••..•·•..·_· •..• ,. _ _ ~
0' 1 I I J I I I I I I J I J I I I J I J J J I
1969 1971 1973 1975 1977 1979 1981 1983 1985 1987*1989~1970 1972 1974 1976 1978 1980 1982 1984 1986 1988*
Figure 37. Capacity of Prahu 1969-1989
WNN
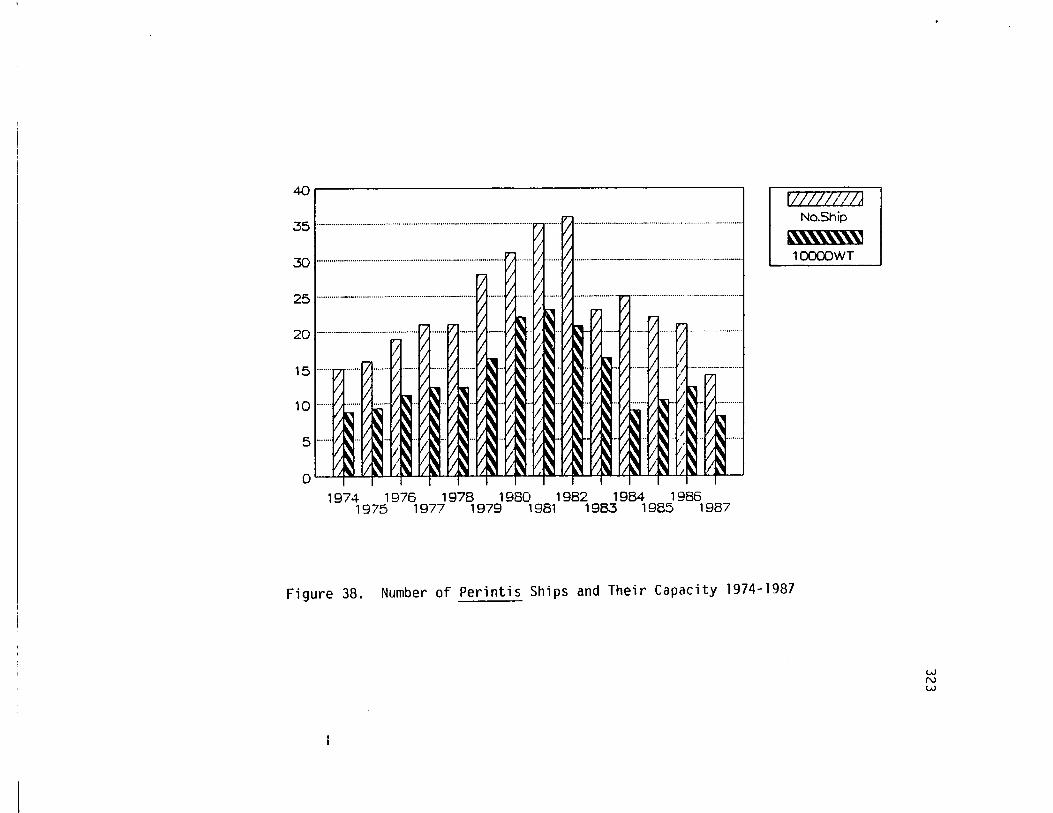
40
35
30
25
20
15
10
5
o
.._...................-........... ................•...................._...._....•............
.........................................
....-- ....•......
1974 1976 1978 1980 1982 1984 19861975 1977 1979 1981 1983 1985 1987
f77771lllJNo.Ship
~~10000WT
Figure 38. Number of Perintis Ships and Their Capacity 1974-1987
LVNLV
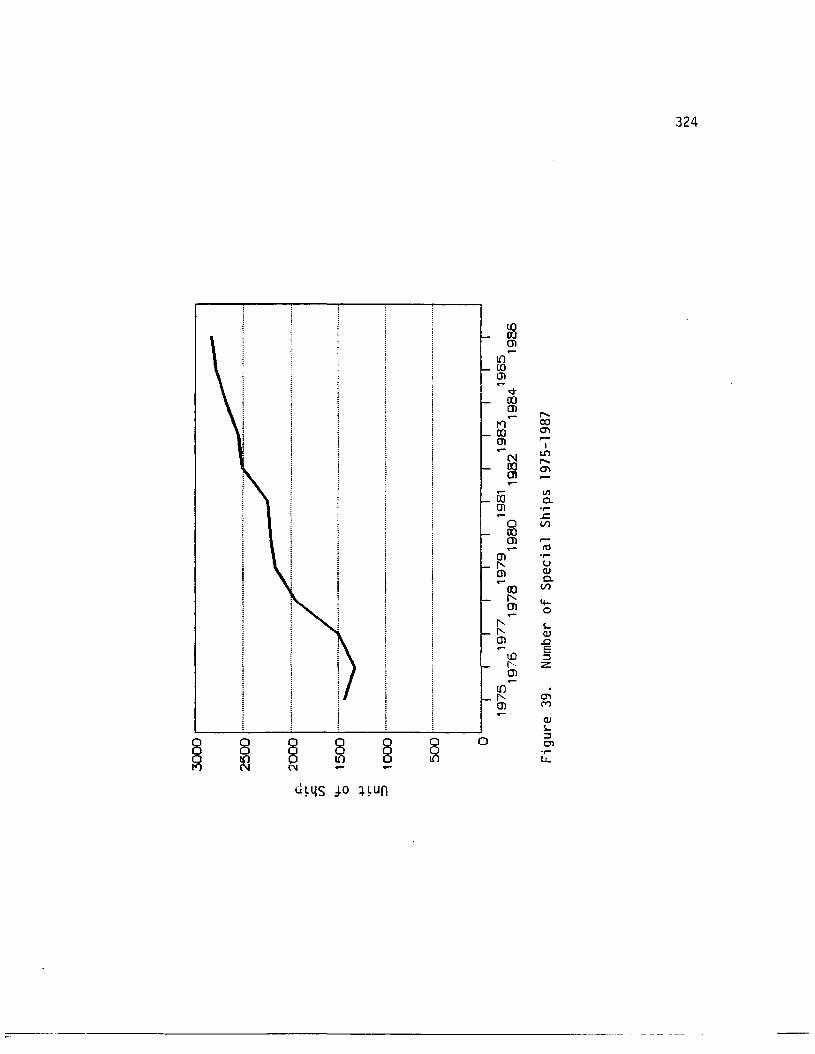
324
lSm.....UltoiJl....
q-l1Jrn
I'-.....r<l 00IX) CTlm ~
I
('II U"lI'-m CTl
....0Ci
Vl0-m 'r-
.I:.0 VIl1Jen ~.... to
m 'r-I' um llJ.... 0-
~VI
m 4-.... 0
I' s,I' llJm .D.... E
io ::::l1'" zen.....
toI' CTlm C"1
llJI-
8 § 8 § 0 ::::lOl'r-
~10 u,
(~
d~4S ]0 Hun
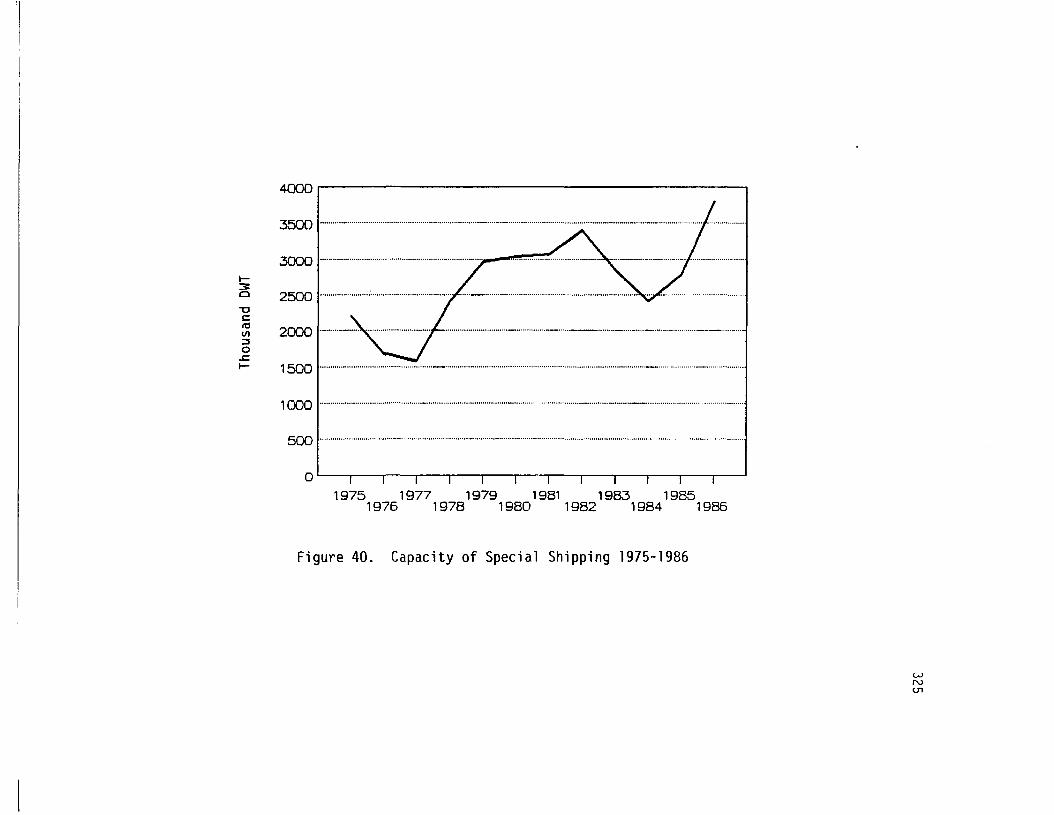
'II
I
~Oi i
3000 /._._ _ :::7:" ~.
3500 ,._ _ _ __ _ _ .
I3:Cl 2500 I..· ·..·_ · ; ··· ·· · · ···~ _· ··· _ _ ~.,....r: ~
"0c:~ 2000 _ _ _ _- _ __ _ _ _-_ .;::,o.cI- 1500 _ __ _ .
1000 , _ _ _ _ ..
500 I..· ·..· · ·..·· ··· ··..·· · ·..·..· · _ ,
0' i I I iii Iii iii I
1975 1977 1979 1981 1983 19851976 1978 1980 1982 1984 1986
Figure 40. Capacity of Special Shipping 1975-1986
lAJNc..n
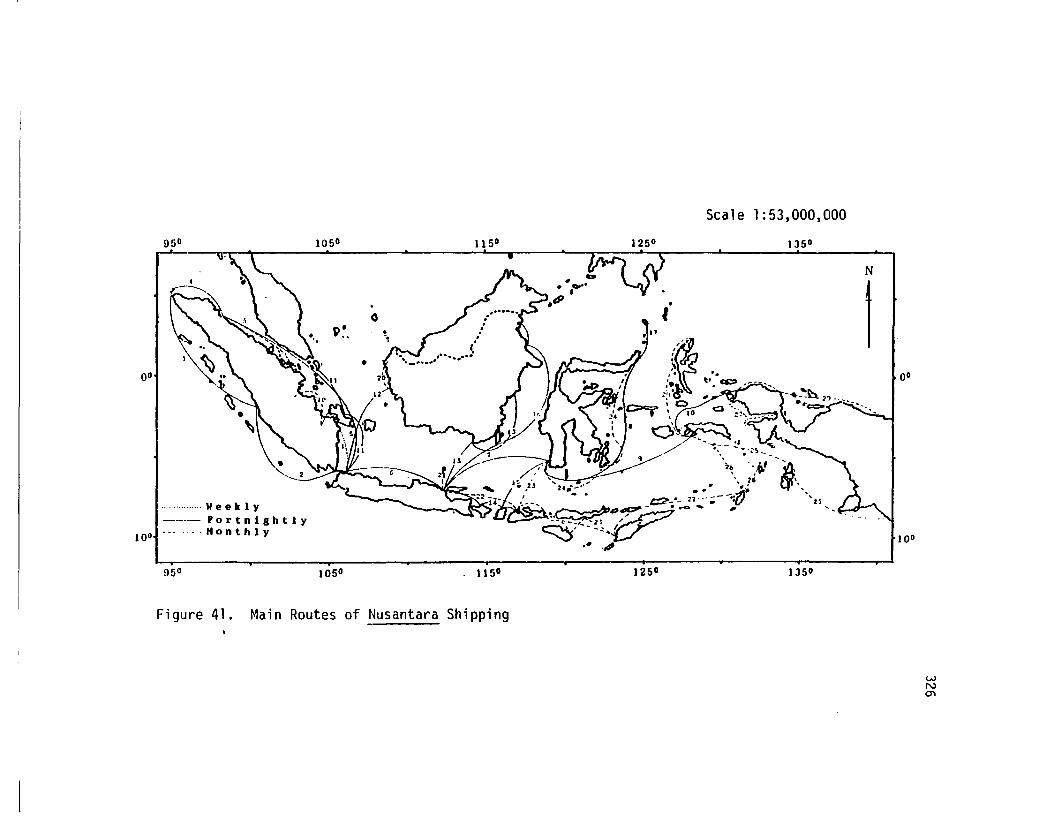
00
10°
······.········Weeltly-_..- For t n 1 8 h t 1 Y
·-Honthly
95°
1050
p."
1050
o
115°
1150
1250
1250
Scale 1:53,000,000
135 0
,.
~' ;,,.
;\,. '.'. ,.! .~ • ec> .---';~I .I~... ~. ..Ie:::>\/10
~\,'zs
135°
N
10°
10°
Figure 41. Main Routes of Nusantara Shipping
WNO'l
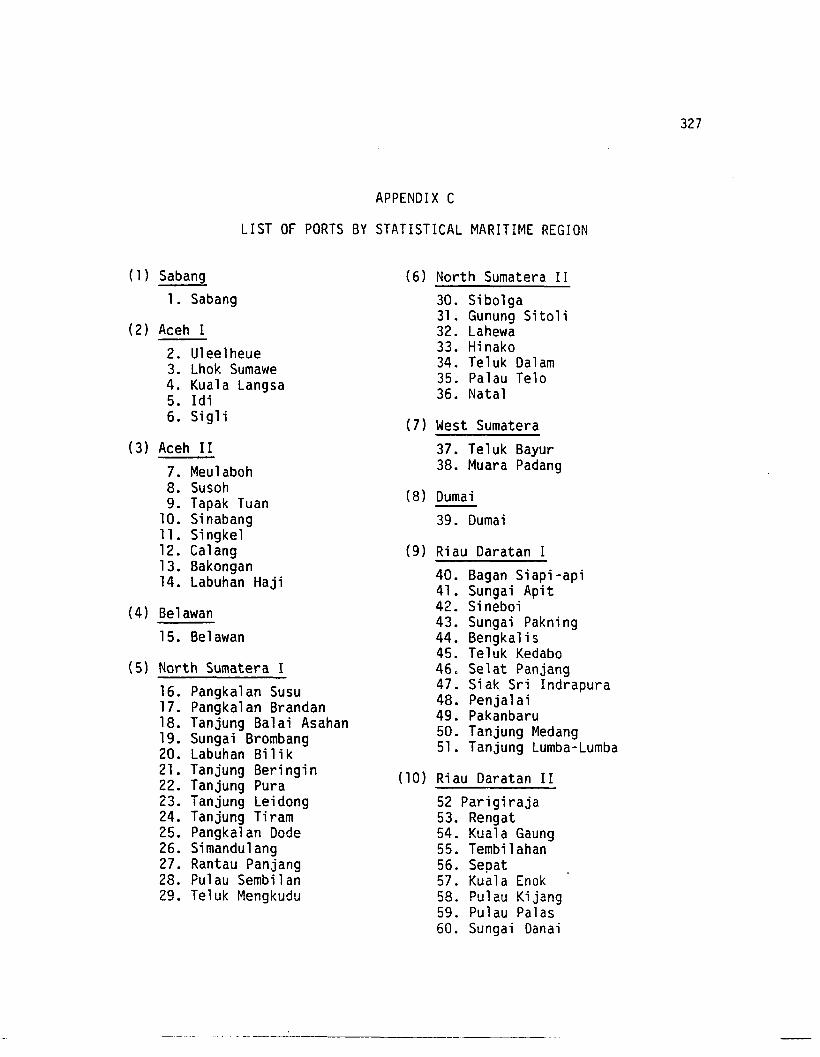
APPENDIX C
LIST OF PORTS BY STATISTICAL MARITIME REGION
(1) Sabang (6) North Sumatera II1. Sabang 30. Sibo1ga
31. Gunung Sito 1i(2) Aceh I 32. Lahewa
2. Uleelheue 33. Hinako3. Lhok Sumawe 34. Teluk Dalam4. Kuala Langsa 35. Palau Telo5. Idi 36. Natal6. Sig1i (7) West Sumatera
(3) Aceh II 37. Te1uk Bayur7. Meu1aboh 38. Muara Padang8. Susoh (8) Dumai9. Tapak Tuan
10. Sinabang 39. Dumai11. Singke112. Cal ang (9) Riau Daratan I13. Bakongan 40. Bagan Siapi-api14. Labuhan Haji 41. Sungai Apit
(4) Be1awan 42. Sineboi43. Sungai Pakning
15. Be1awan 44. Bengka1is45. Te1uk Kedabo
(5) North Sumatera I 46. Se1at Panjang16. Pangka1an Susu 47. St ak Sri Indrapura
48. Penja1ai17. Pangka1an Brandan 49. Pakanbaru18. Tanjung Ba1ai Asahan 50. Tanjung Medang19. Sungai Brombang 51. Tanjung Lumba-Lumba20. Labuhan Bil i k21. Tanjung Beringin (10) Ri au Daratan II22. Tanjung Pura23. Tanjung Leidong 52 Parigiraja24. Tanjung Tiram 53. Rengat25. Pangka1an Dode 54. Kuala Gaung26. Simandu1ang 55. Tembil ahan27. Rantau Panjang 56. Sepat28. Pulau Sembi1an 57. Kuala Enok29. Teluk Mengkudu 58. Pu1au Kijang
59. Pulau Palas60. Sungai Danai
327
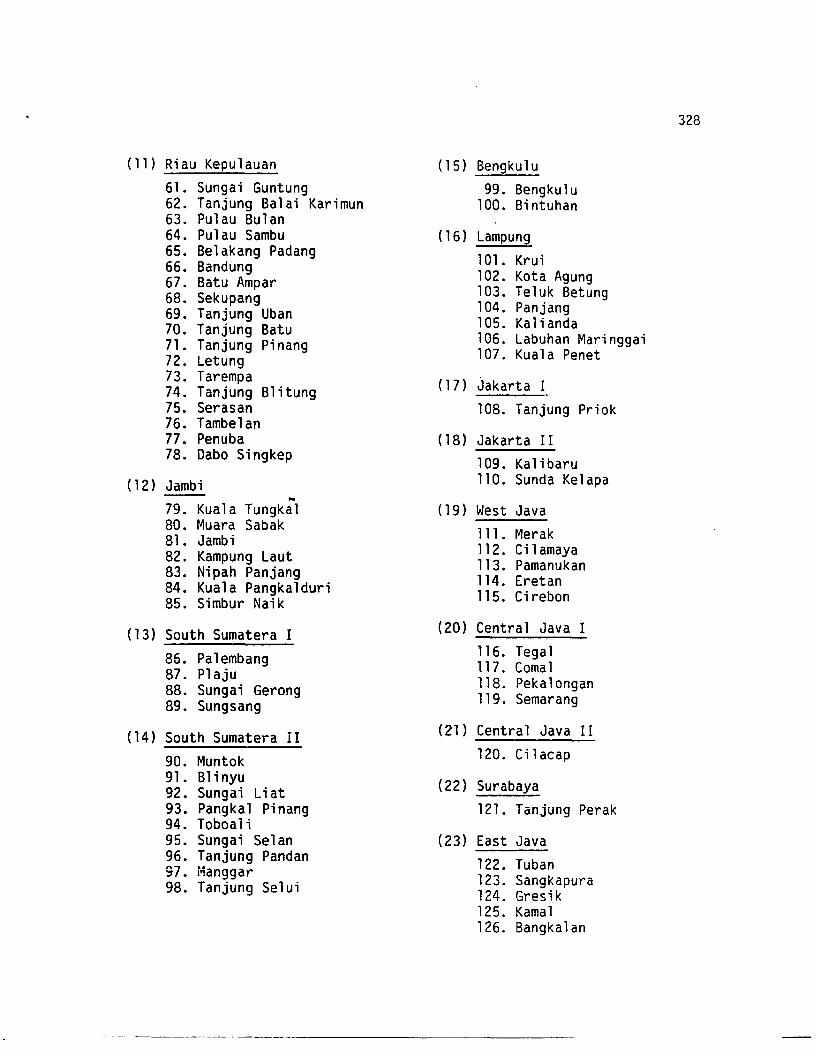
(11 ) Riau Kepulauan6l. Sungai Guntung62. Tanjung Balai Karimun63. Pulau Bulan64. Pulau Sambu65. Belakang Padang66. Bandung67. Batu Ampar68. Sekupang69. Tanjung Uban70. Tanjung Batu7l. Tanjung Pinang72. Letung73. Tarempa74. Tanjung Blitung75. Serasan76. Tambe1an77. Penuba78. Dabo Singkep
(12) Jambi ..79. Kuala Tungka180. Muara Sabak8l. Jambi82. Kampung Laut83. Nipah Panjang84. Kuala Pangka1duri85. Simbur Naik
( 13) South Sumatera I
86. Pa1embang87. Plaju88. Sungai Gerong89. Sungsang
(14) South Sumatera II
90. Muntok9l. B1inyu92. Sungai Liat93. Pangkal Pinang94. Toboa1i95. Sungai Selan96. Tanjung Pandan97. r'ianggar98. Tanjung Se1ui
(15) Bengkulu
99. Bengkulu100. Bintuhan
(16) Lampung
101. Krui102. Kota Agung103. Te1uk Betung104. Panjang105. Kalianda106. Labuhan Maringgai107. Kuala Penet
(17) Jakarta I108. Tanjung Priok
(18) Jakarta I I109. Ka1ibaru110. Sunda Ke1apa
(19) West Java11l. Merak112. Cil amaya113. Pamanukan114. Eretan115. Ci rebon
(20) Central Java I
116. Tegal117. Coma1118. Peka lcnqan119. Semarang
(21) Central Java II
120. Cil acap
(22) Surabaya121. Tanjung Perak
(23) East Java122. Tuban123. Sangkapura124. Gresik125. Kamal126. Bangkalan
328
-----~---- -------------
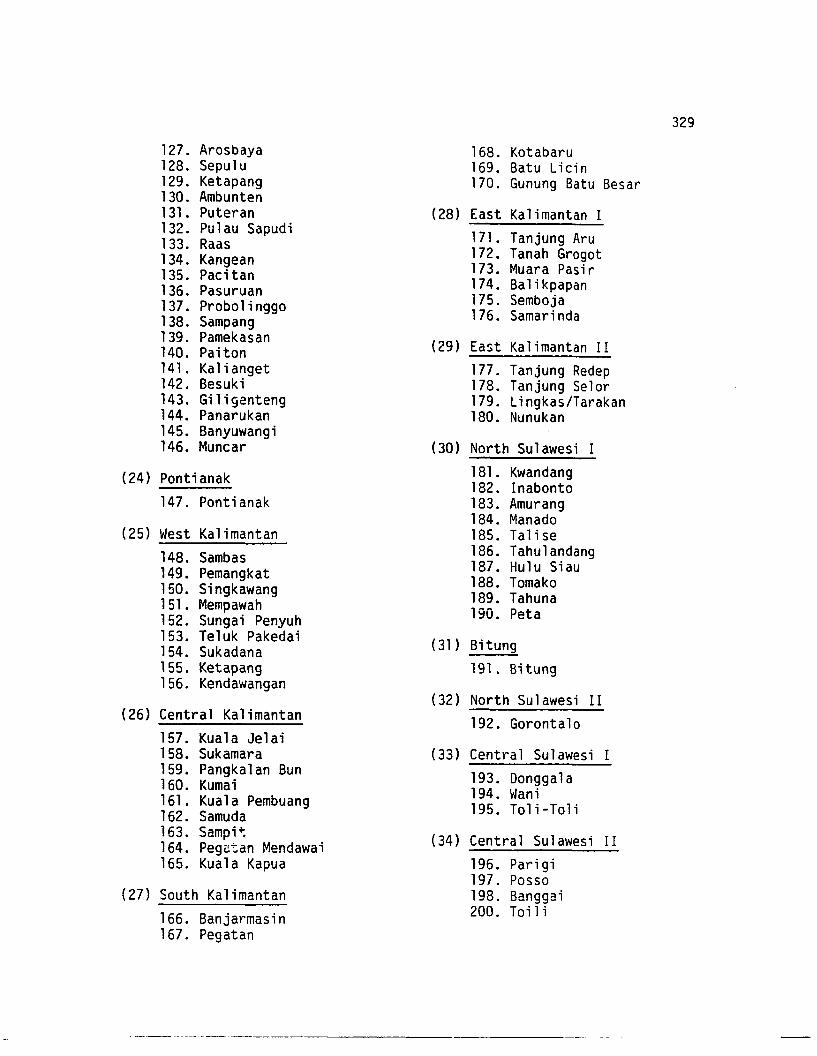
329
127. Arosbaya 168. Kotabaru128. Sepu1u 169. Batu Liein129. Ketapang 170. Gunung Batu Besar130. Ambunten13l. Puteran (28) East Kalimantan I132. Pu1au Sapudi 17l. Tanjung Aru133. Raas134. Kangean 172 • Tanah Grogot
173. Muara Pasir135. Paeitan 174. Ba1ikpapan136. Pasuruan137. Probolinggo 175. Semboja138. Sampang 176. Samarinda139. Pamekasan (29) East Kalimantan I I140. Paiton14l. Ka1ianget 177 . Tanjung Redep142. Besuki 178. Tanjung Selor143. Gi1igenteng 179. Lingkas/Tarakan144. Panarukan 180. Nunukan145. Banyuwangi146. Muncar (30) North Sulawesi I
(24) Pontianak 18l. Kwandang182. Inabonto
147. Pontianak 183. Amurang184. Manado
(25) West Kalimantan 185. Tali se148. Sambas 186. Tahu1andang149. Pemangkat 187. Hu1u Siau
188. Tomako150. Singkawang 189. Tahuna15l. Mempawah 190. Peta152. Sungai Penyuh153. Te1uk Pakedai (31) Bitung154. Sukadana155. Ketapang 191. Bitung156. Kendawangan
(32) North Sulawesi II(26) Central Kalimantan 192. Gorontalo
157. Kuala Jelai158. Sukamara (33) Central Sulawesi I159. Pangkalan Bun 193. Donggala160. Kumai 194. Wani16l. Kuala Pembuang 195. Toli-Toli162. Samuda163. Sampi~ (34) Central Sulawesi II164. Pegatan Mendawai165. Kuala Kapua 196. Parigi
197. Posso(27) South Kalimantan 198. Banggai
166. Banjarmasin 200. Toil i167. Pegatan
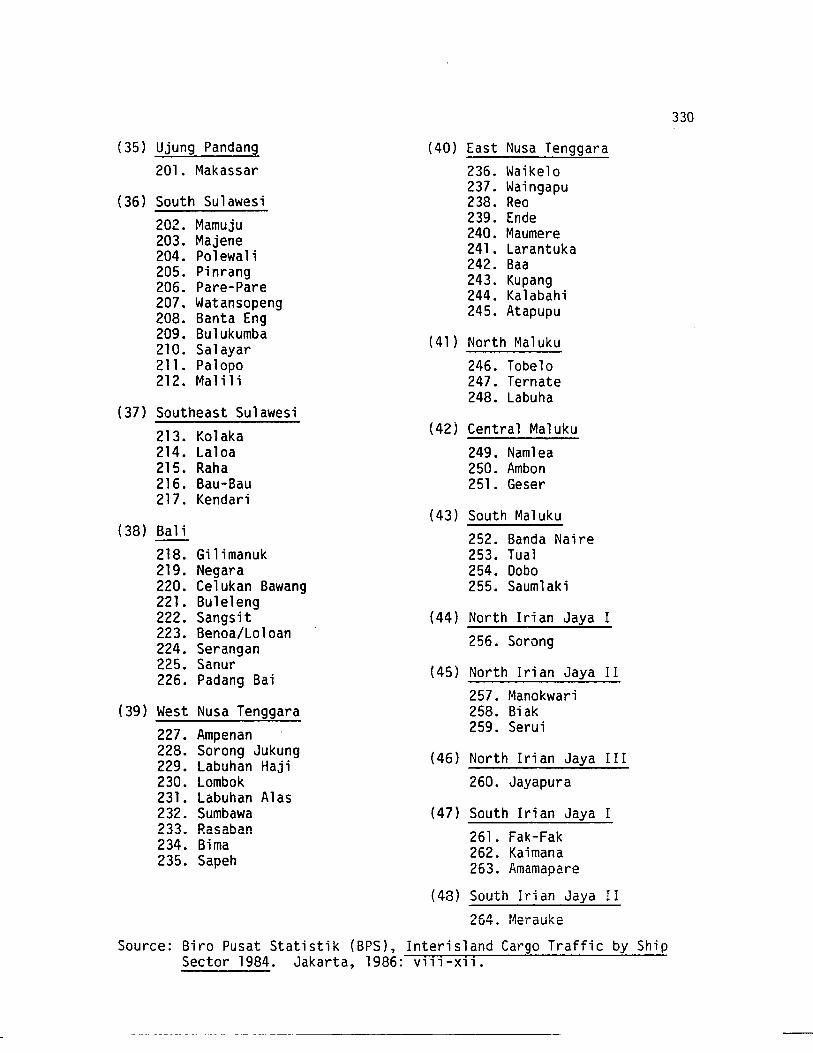
(35) Ujung Pandang201. Makassar
(36) South Sulawesi202. Mamuju203. Majene204. Po1ewa1i205. Pinrang206. Pare-Pare207. Watansopeng208. Banta Eng209. Bulukumba210. Salayar211. Palopo212 . Mal il i
(37) Southeast Sulawesi
213. Kolaka214. La10a215. Raha216. Bau-Bau217. Kendari
(38) Bal i
218. Gilimanuk219. Negara220. Celukan Bawang221. Bu1e1eng222. Sangsit223. Benoa/Lo1oan224. Serangan225. Sanur226. Padang Bai
(39) West Nusa Tenggara227. Ampenan228. Sorong Jukung229. Labuhan Haji230. Lombok231. Labuhan Alas232. Sumbawa233. Rasaban234. Bima235. Sapeh
(40) East Nusa Tenggara236. Waikelo237. Waingapu238. Reo239. Ende240. Maumere241. Larantuka242. Baa243. Kupang244. Kalabahi245. Atapupu
(41) North Maluku
246. Tobelo247. Ternate248. Labuha
(42) Central Maluku
249. Namlea250. Ambon251. Geser
(43) South Maluku252. Banda Naire253. Tua1254. Dobo255. Saum1aki
(44) North Irian Jaya256. Sorong
(45) North Irian Jaya II257. Manokwari258. Biak259. Serui
(46) North Irian Jaya III260. Jayapura
(47) South Irian Jaya I261. Fak-Fak262. Kaimana263. Amamapare
(48) South Irian Jaya II
264. t·1erauke
330
Source: Biro Pusat Statistik (BPS), Interisland Cargo Traffic by ShipSector 1984. Jakarta, 1986: Vlll-Xll.
---~---_._~. ~-~~_. -- ~-------------------
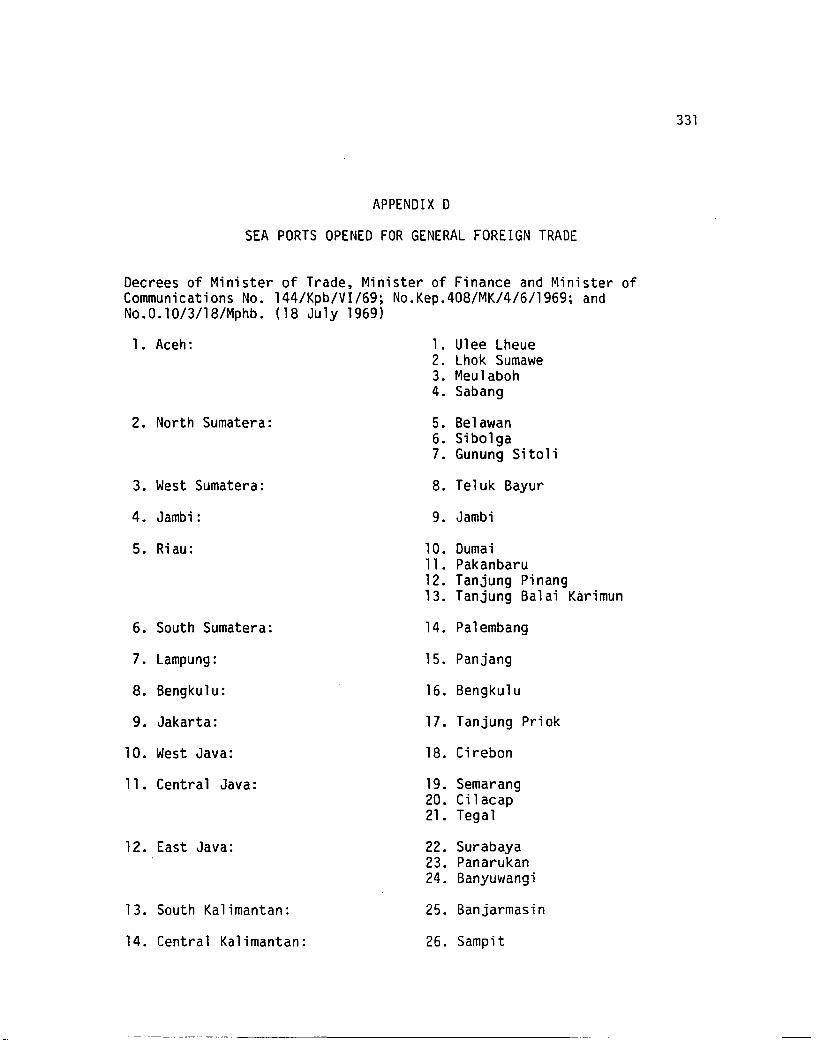
APPENDIX D
SEA PORTS OPENED FOR GENERAL FOREIGN TRADE
Decrees of Minister of Trade, Minister of Finance and Minister ofCommunications No. 144/Kpb/VI/69; No.Kep.408/MK/4/6/1969; andNo.0.10/3/18/Mphb. (18 July 1969)
331
1. Aceh:
2. North Sumatera:
3. West Sumatera:
4. Jambi:
5. Riau:
6. South Sumatera:
7. Lampung:
8. Bengku1u:
9. Jakarta:
10. West Java:
11. Central Java:
12. East Java:
13. South Kalimantan:
14. Central Kalimantan:
1. U1ee Lheue2. Lhok Sumawe3. Meu1aboh4. Sabang
5. Be1awan6. Sibo1ga7. Gunung Sito1i
8. Te1uk Bayur
9. Jambi
10. Dumai11. Pakanbaru12. Tanjung Pinang13. Tanjung Ba1ai Karimun
14. Pa1embang
15. Panjang
16. Bengku1u
17. Tanjung Priok
18. Cirebon
19. Semarang20. Cilacap21. Tega1
22. Surabaya23. Panarukan24. Banyuwangi
25. Banjarmasin
26. Sampit
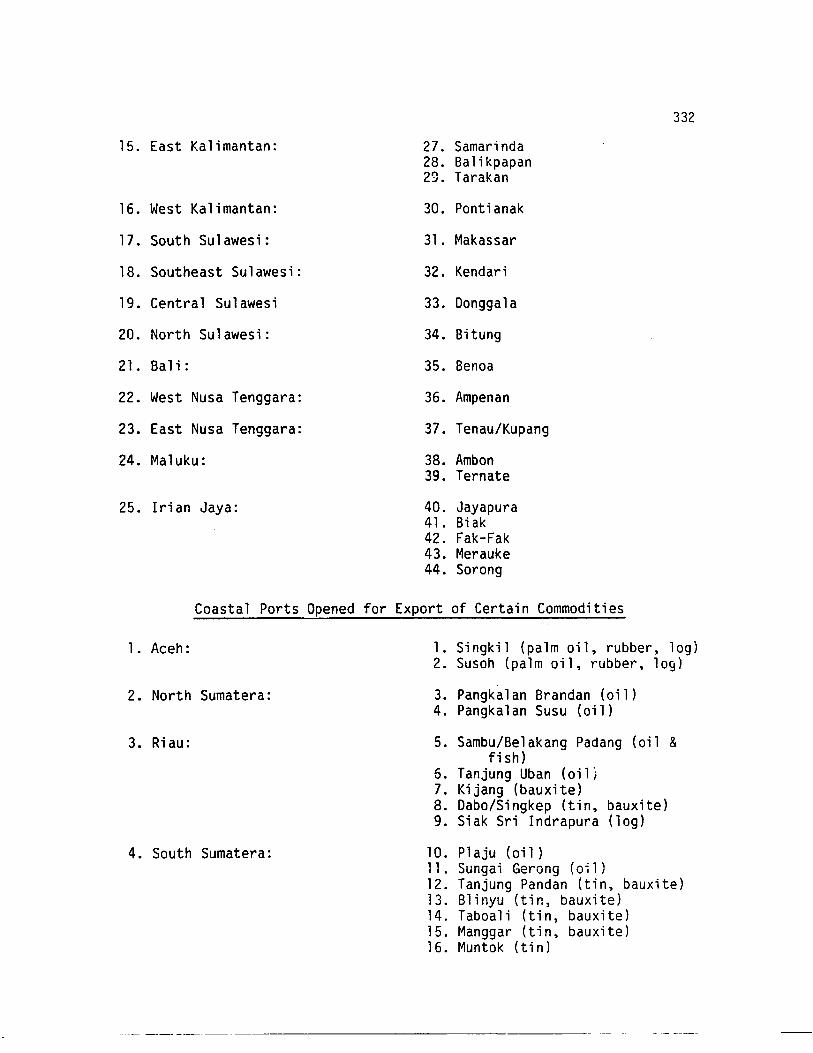
15. East Kalimantan:
16. West Kalimantan:
17. South Sulawesi:
18. Southeast Sulawesi:
19. Central Sulawesi
20. North Sulawesi:
21. Ba1i :
22. West Nusa Tenggara:
23. East Nusa Tenggara:
24. Ma1uku:
25. Irian Jaya:
332
27. Samarinda28. Ba1ikpapan29. Tarakan
30. Pontianak
3l. Makassar
32. Kendari
33. Dongga1a
34. Bitung
35. Benoa
36. Ampenan
37. Tenau/Kupang
38. Ambon39. Ternate
40. Jayapura4l. Biak42. Fak-Fak43. Merauke44. Sorong
Coastal Ports Opened for Export of Certain Commodities
1. Aceh:
2. North Sumatera:
3. Riau:
4. South Sumatera:
1. Singki1 (palm oil, rubber, log)2. Susoh (palm oil, rubber, log)
3. Pangka1an Brandan (oil)4. Pangka1an Susu (oil)
5. Sambu/Be1akang Padang (oil &fish)
6. Tanjung Uban (oi1j7. Kijang (bauxite)8. Dabo/Singkep (tin, bauxite)9. Siak Sri Indrapura (jog)
10. P1aju (oil)11. Sungai Gerong (oil)12. Tanjung Pandan (tin, bauxite)13. 81inyu (tin, bauxite)14. Taboa1i (tin, bauxite)15. Manggar (tin, bauxite)16. Muntok (t in)
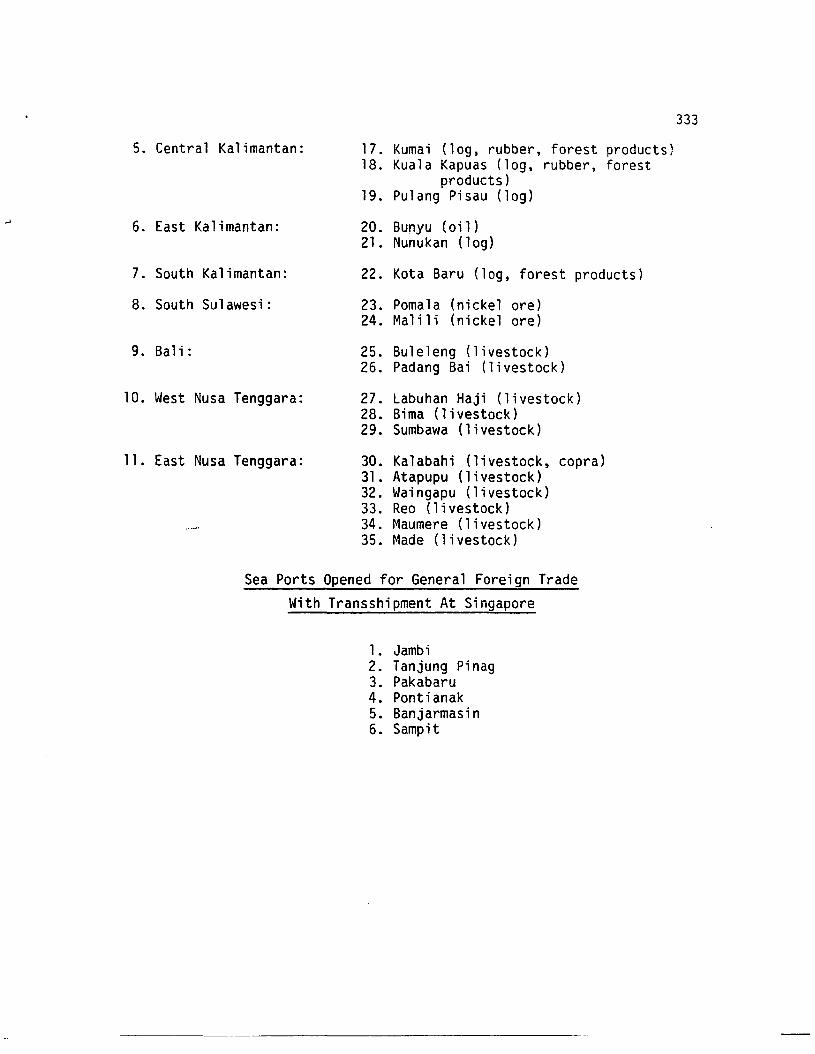
5. Central Kalimantan:
6. East Ka 1i mantan:
7. South Kalimantan:
8. South Sulawesi:
9. Bali:
10. West Nusa Tenggara:
11. East Nusa Tenggara:
333
17. Kuma i (log, rubber , forest product s )18. Kuala Kapuas (log, rubber, forest
products)19. Pulang Pisau (log)
20. Bunyu (oi 1)21. Nunukan (log)
22. Kota Baru (log, forest products)
23. Pomala (nickel ore)24. Ma1ili (nickel ore)
25. Bu1eleng (livestock)26. Padang Bai (livestock)
27. Labuhan Haji (livestock)28. Bima (livestock)29. Sumbawa (livestock)
30. Kalabahi (livestock, copra)31. Atapupu (livestock)32. Waingapu (livestock)33. Reo (livestock)34. Maumere (livestock)35. Made (livestock)
Sea Ports Opened for General Foreign TradeWith Transshipment At Singapore
1. Jambi2. Tanjung Pinag3. Pakabaru4. Ponti anak5. Banjarmasin6. Sampit
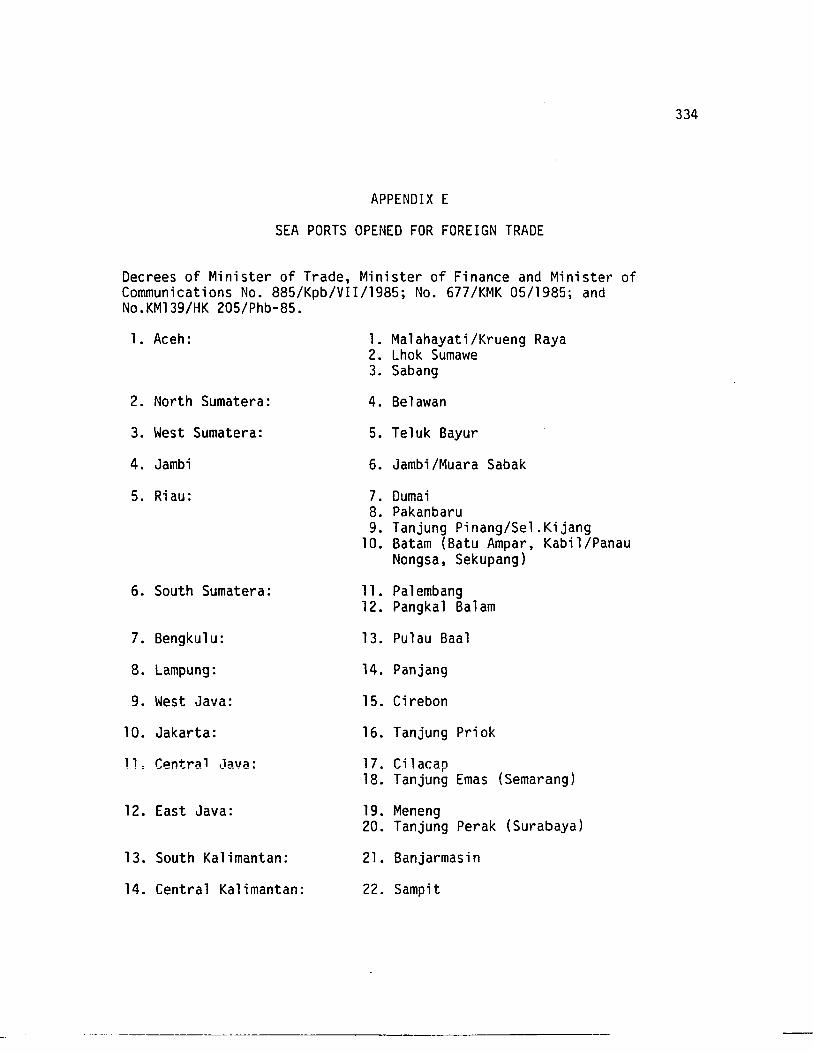
APPENDIX E
SEA PORTS OPENED FOR FOREIGN TRADE
Decrees of Minister of Trade, Minister of Finance and Minister ofCommunications No. 885/Kpb/VII/1985; No. 677/KMK 05/1985; andNo.KM139/HK 205/Phb-85.
334
1. Aceh:
2. North Sumatera:
3. West Sumatera:
4. Jambi
5. Riau:
6. South Sumatera:
7. Bengku1u:
8. lampung:
9. West Java:
10. Jakarta:
11, Central .lava:
12. East Java:
13. South Kalimantan:
14. Central Kalimantan:
1. Ma1ahayati/Krueng Raya2. Lhok Sumawe3. Sabang
4. Be1awan
5. Te1uk Bayur
6. Jambi/Muara Sabak
7. Dumai8. Pakanbaru9. Tanjung Pinang/Se1.Kijang
10. Batam (Batu Ampar, Kabi1/PanauNongsa, Sekupang)
11. Palembang12. Pangka1 Balam
13. Pu1au Baal
14. Panjang
15. Cirebon
16. Tanjung Priok
17. Cilacap18. Tanjung Emas (Semarang)
19. Meneng20. Tanjung Perak (Surabaya)
21. Banjarmasin
22. Sampit
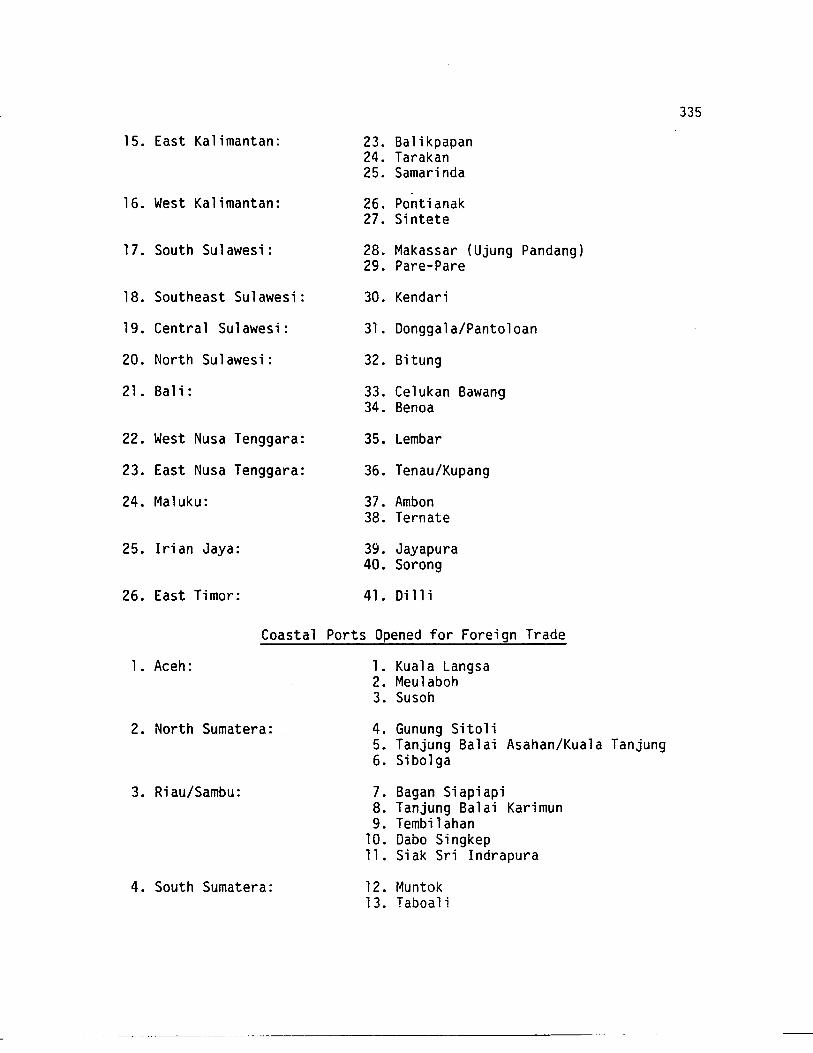
15. East Kalimantan:
16. West Kalimantan:
17. South Sulawesi:
18. Southeast Sulawesi:
19. Central Sulawesi:
20. North Sulawesi:
21. Ba1i :
22. West Nusa Tenggara:
23. East Nusa Tenggara:
24. Maluku:
25. Irian Jaya:
26. East Timor:
23. Balikpapan24. Tarakan25. Samarinda
26. Pontianak27. Sintete
28. Makassar (Ujung Pandang)29. Pare-Pare
30. Kendari
31. Donggala/Pantoloan
32. Bitung
33. Celukan Bawang34. Benoa
35. Lembar
36. Tenau/Kupang
37. Ambon38. Ternate
39. Jayapura40. Sorong
41. Di 11 i
335
1. Aceh:
Coastal Ports Opened for Foreign Trade
1. Kuala Langsa2. Meu1aboh3. Susoh
2. North Sumatera:
3. Riau/Sambu:
4. South Sumatera:
4. Gunung Sitoli5. Tanjung Balai Asahan/Kuala Tanjung6. Sibolga
7. Bagan Siapiapi8. Tanjung Ba1ai Karimun9. Tembi1ahan
10. Dabo Singkep11. Siak Sri Indrapura
12. Muntok13. Taboali
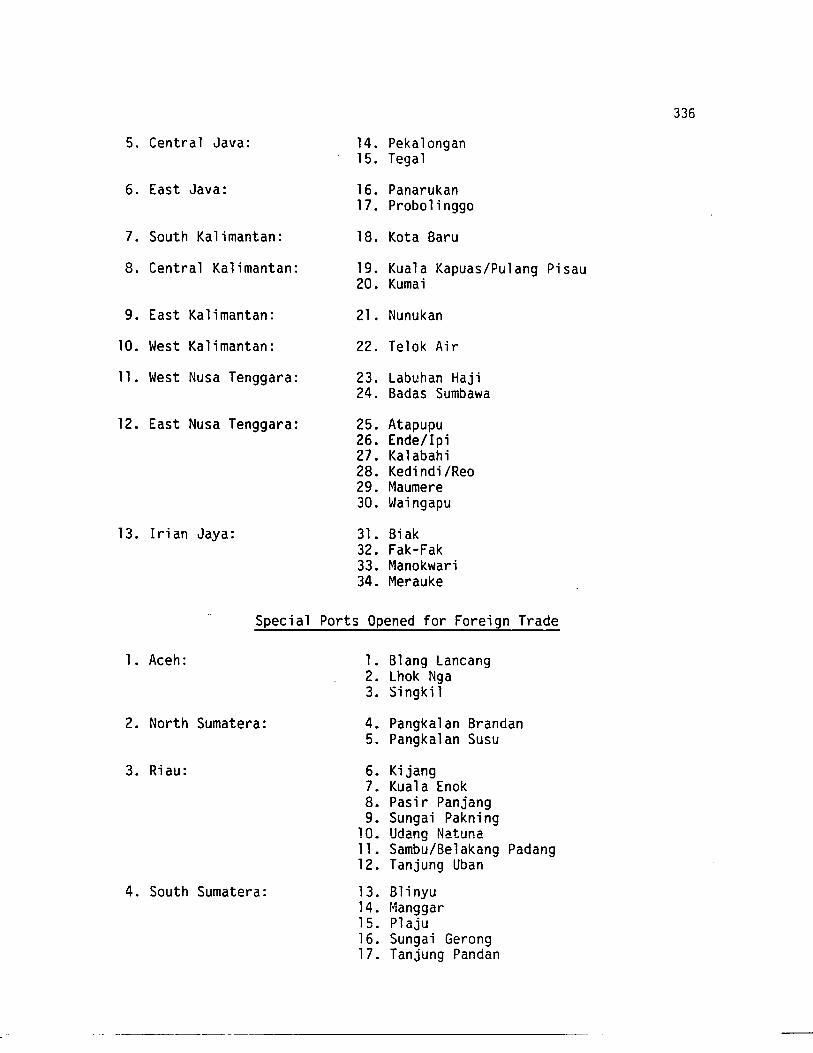
5. Central Java:
6. East Java:
7. South Kalimantan:
8. Central Kalimantan:
9. East Kalimantan:
10. West Ka 1i mantan:
ll. West Nusa Tenggara:
12. East Nusa Tenggara:
13. Irian Jaya:
336
14. Pekalongan15. Tegal
16. Panarukan17. Probolinggo
18. Kota Baru
19. Kuala Kapuas/Pulang Pisau20. Kumai
2l. Nunukan
22. Telok Air
23. Labuhan Haji24. Badas Sumbawa
25. Atapupu26. Ende/Ipi27. Kalabahi28. Kedindi/Reo29. Maumere30. Waingapu
3l. Biak32. Fak-Fak33. Manokwari34. Merauke
Special Ports Opened for Foreign Trade
1. Aceh: l. Blang Lancang2. Lhok Nga3. Singkil
2. North Sumatera: 4. Pangkalan Brandan5. Pangkalan Susu
3. Riau: 6. Kijang7. Kuala Enok8. Pasir Panjang9. Sungai Pakning
10. Udang Natunall. Sambu/Belakang Padang12. Tanjung Uban
4. South Sumatera: 13. Blinyu14. r~anggar
15. Plaju16. Sungai Gerong17. Tanjung Pandan
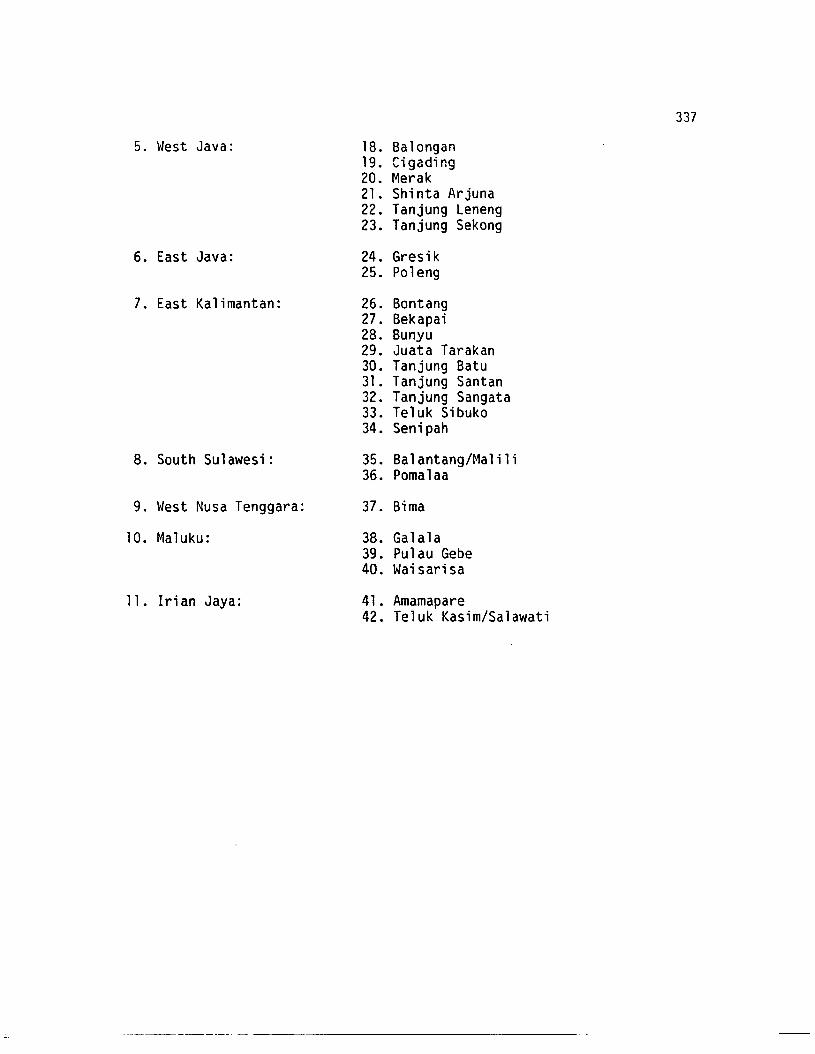
337
5. West Java: 18. Balongan19. Cigading20. Merak2l. Shinta Arjuna22. Tanjung Leneng23. Tanjung Sekong
6. East Java: 24. Gresik25. Pol eng
7. East Kalimantan: 26. Bontang27. Bekapai28. Bunyu29. Juata Tarakan30. Tanjung Batu3l. Tanjung Santan32. Tanjung Sangata33. Te1uk Sibuko34. Senipah
8. South Sulawesi: 35. Balantang/Malili36. Pomalaa
9. West Nusa Tenggara: 37. Bima
10. Maluku: 38. Galala39. Pulau Gebe40. Waisarisa
1l. Irian Jaya: 4l. Amamapare42. Teluk Kasim/Salawati
----------- ~ -------------------
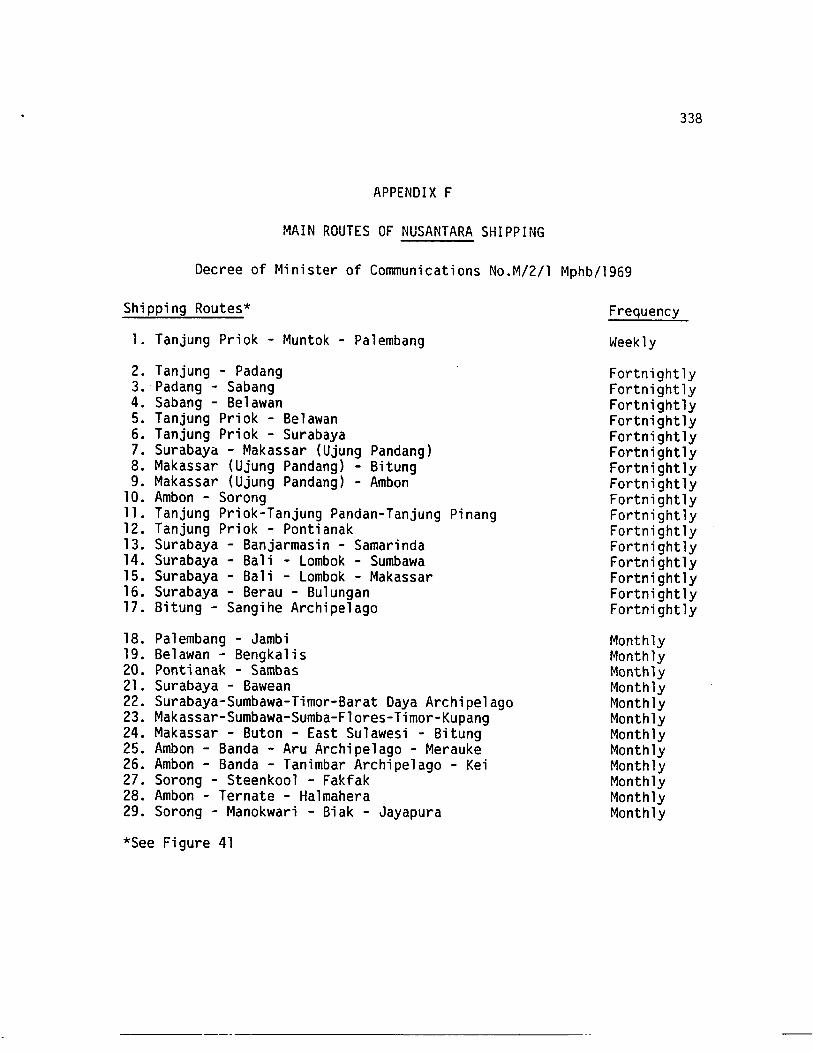
338
APPENDIX F
MAIN ROUTES OF NUSANTARA SHIPPING
Decree of Minister of Communications No.M/2/1 Mphb/1969
Shipping Routes*
1. Tanjung Priok - Muntok - Palembang
2. Tanjung - Padang3. Padang - Sabang4. Sabang - Belawan5. Tanjung Priok - Belawan6. Tanjung Priok - Surabaya7. Surabaya - Makassar (Ujung Pandang)8. Makassar (Ujung Pandang) - Bitung9. Makassar (Ujung Pandang) - Ambon
10. Ambon - Sorong11. Tanjung Priok-Tanjung Pandan-Tanjung Pinang12. Tanjung Priok - Pontianak13. Surabaya - Banjarmasin - Samarinda14. Surabaya - Bali - Lombok - Sumbawa15. Surabaya - Bali - Lombok - Makassar16. Surabaya - Berau - Bulungan17. Bitung - Sangihe Archipelago
18. Palembang - Jambi19. Belawan - Bengkalis20. Pontianak - Sambas21. Surabaya - Bawean22. Surabaya-Sumbawa-Timor-Barat Daya Archipelago23. Makassar-Sumbawa-Sumba-Flores-Timor-Kupang24. Makassar - Buton - East Sulawesi - Bitung25. Ambon - Banda - Aru Archipelago - Merauke26. Ambon - Banda - Tanimbar Archipelago - Kei27. Sorong - Steenkool - Fakfak28. Ambon - Ternate - Halmahera29. Sorong - Manokwari - Biak - Jayapura
*See Figure 41
Frequency
Weekly
FortnightlyFortnightlyFortnightlyFortnightlyFortnightlyFortnightlyFortnightlyFortnightlyFortnightlyFortnightlyFortnightlyFortnightlyFortnightlyFortnightlyFortnightlyFortnightly
MonthlyMonthlyMonthlyr40nth lyMonthlyMonthlyMonthlyMonthlyMonthlyMonthlyMonthlyMonthly
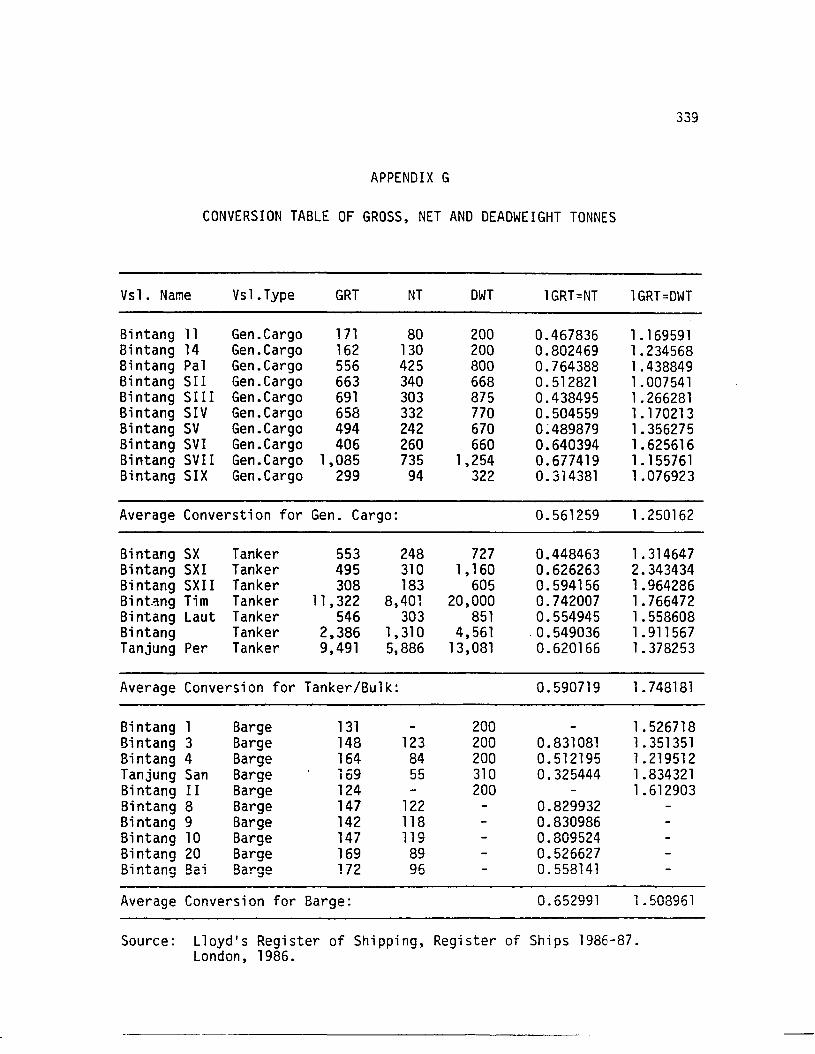
APPENDIX G
CONVERSION TABLE OF GROSS, NET AND DEADWEIGHT TONNES
339
Vs1. Name Vs1.Type GRT NT DWT 1GRT=NT 1GRT=DWT
Bintang 11 Gen.Cargo 171 80 200 0.467836 1. 169591Bintang 14 Gen.Cargo 162 130 200 0.802469 1.234568Bintang Pal Gen.Cargo 556 425 800 0.764388 1.438849Bintang SII Gen.Cargo 663 340 668 0.512821 1.007541Bintang SIll Gen.Cargo 691 303 875 0.438495 1.266281Bintang SIV Gen.Cargo 658 332 770 0.504559 1. 170213Bintang SV Gen.Cargo 494 242 670 0~489879 1.356275Bintang SVI Gen.Cargo 406 260 660 0.640394 1.625616Bi ntang SVII Gen.Cargo 1,085 735 1,254 0.677419 1.155761Bintang SIX Gen.Cargo 299 94 322 0.314381 1.076923
Average Converstion for Gen. Cargo: 0.561259 1.250162
Bintang SX Tanker 553 248 727 0.448463 1.314647Bintang SXI Tanker 495 310 1,160 0.626263 2.343434Bintang SXII Tanker 308 183 605 0.594156 1.964286Bint.~ng Tim Tanker 11,322 8,401 20,000 0.742007 1.766472Bintang Laut Tanker 546 303 851 0.554945 1.558608Bintang Tanker 2,386 1,310 4,561 0.549036 1. 911567Tanjung Per Tanker 9,491 5,886 13,081 0.620166 1.378253
Average Conversion for Tanker/Bulk: 0.590719 1. 748181
Bintang 1 Barge 131 200 1.526718Bintang 3 Barge 148 123 200 0.831081 1.351351Bintang 4 Barge 164 84 200 0.512195 1.219512Tanjung San Barge 169 55 310 0.325444 1.834321Bintang II Barge 124 200 1.612903Bintang 8 Barge 147 122 0.829932Bintang 9 Barge 142 118 0.830986Bintang 10 Barge 147 119 0.809524Bintang 20 Barge 169 89 0.526627Bintang Bai Barge 172 96 0.558141
Average Conversion for Barge: 0.652991 1.508961
Source: LloydIS Register of Shipping, Register of Ships 1986-87.London, 1986.
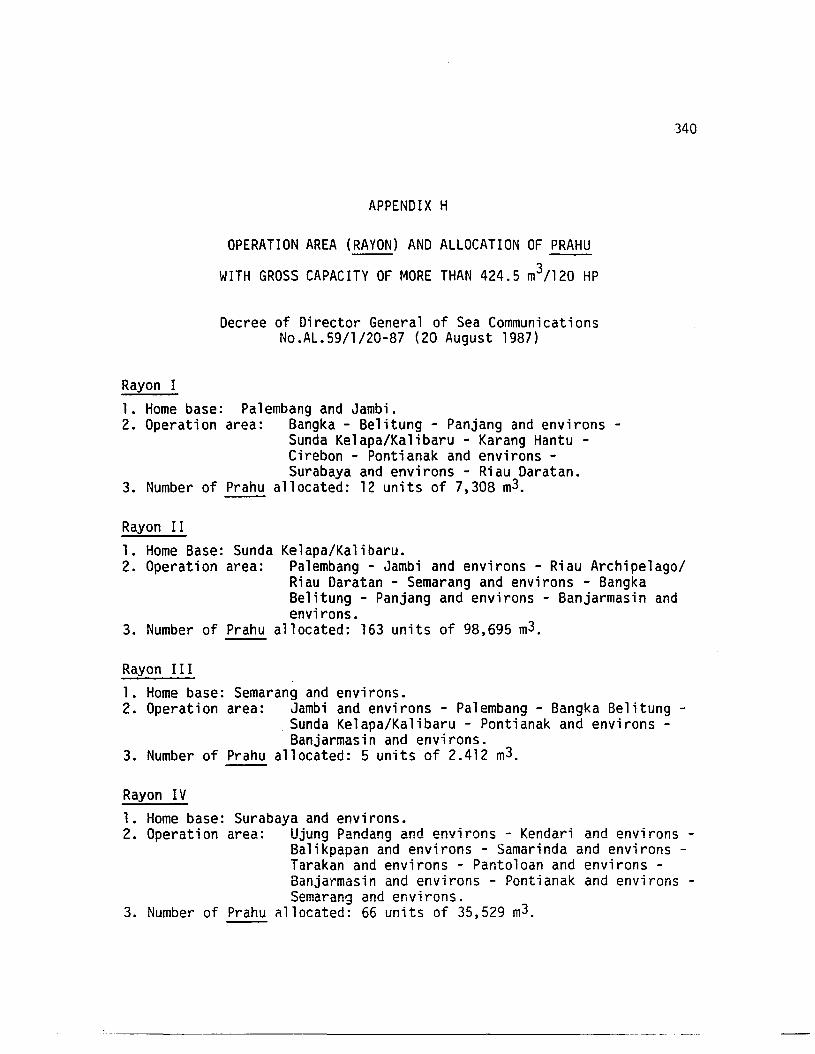
340
APPENDIX H
OPERATION AREA (RAYON) AND ALLOCATION OF PRAHU
WITH GROSS CAPACITY OF MORE THAN 424.5 m3/120 HP
Decree of Director General of Sea CommunicationsNo.AL.59/1/20-87 (20 August 1987)
Rayon I1. Home base: Pa1embang and Jambi.2. Operation area: Bangka - Be1itung - Panjang and environs
Sunda Kelapa/Kalibaru - Karang Hantu Cirebon - Pontianak and environs Surabaya a~d environs - Riau Daratan.
3. Number of Prahu allocated: 12 units of 7,308 m3.
Rayon II1. Home Base: Sunda2. Operation area:
3. Number of Prahu
Ke1apa/Kalibaru.Palembang - Jambi and environs - Riau Archipelago/Riau Daratan - Semarang and environs - BangkaBelitung - Panjang and environs - Banjarmasin andenvirons.
allocated: 163 units of 98,695 m3.
Rayon III1. Home base: Semarang and environs.2. Operation area: Jambi and environs - Pa1embang - Bangka Be1itung
. Sunda Ke1apa/Ka1ibaru - Pontianak and environs Banjarmasin and environs.
3. Number of Prahu allocated: 5 units of 2.412 m3.
Rayon IV1. Home base: Surabaya and environs.2. Operation area: Ujung Pandang and environs - Kendari and environs
Balikpapan and environs - Samarinda and environs Tarakan and environs - Panto1oan and environs Banjarmasin and environs - Pontianak and environs Semarang and environs.
3. Number of Prahu n11ocated: 66 units of 35,529 m3.
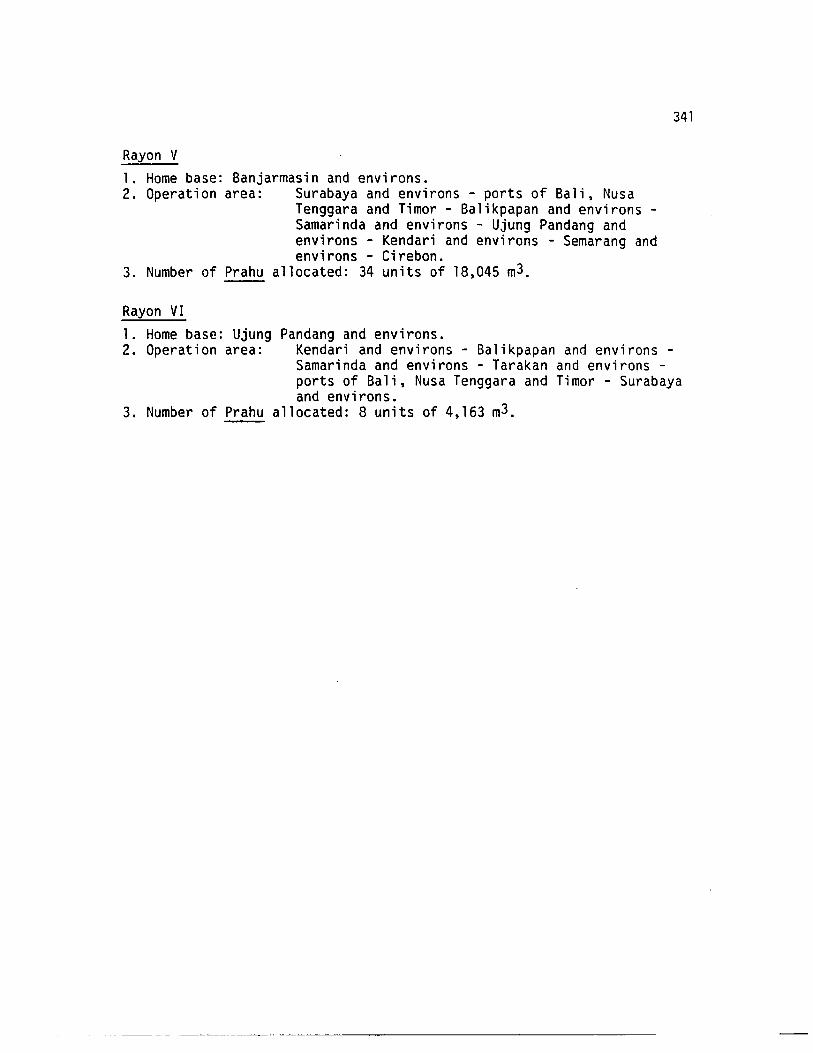
341
Rayon V1. Home base: Banjarmasin and environs.2. Operation area: Surabaya and environs - ports of Bali, Nusa
Tenggara and Timor - Balikpapan and environs Samarinda and environs - Ujung Pandang andenvirons - Kendari and environs - Semarang andenvirons - Cirebon.
3. Number of Prahu allocated: 34 units of 18,045 m3.
Rayon VI1. Home base: Ujung2. Operation area:
3. Number of Prahu
Pandang and environs.Kendari and environs - Balikpapan and environs Samarinda and environs - Tarakan and environs ports of Bali, Nusa Tenggara and Timor - Surabayaand environs.
allocated: 8 units of 4,163 m3.
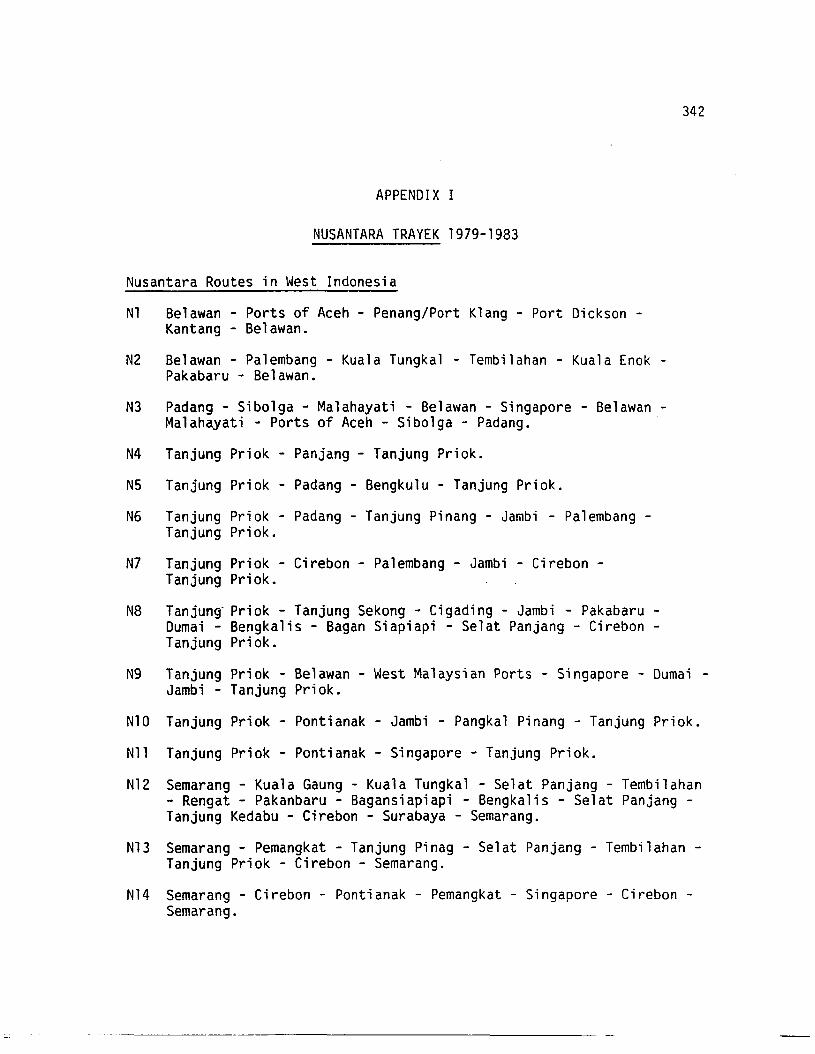
342
APPENDIX I
NUSANTARA TRAYEK 1979-1983
Nusantara Routes in West Indonesia
Nl Belawan - Ports of Aceh - Penang/Port Klang - Port Dickson Kantang - Belawan.
N2 Belawan - Palembang - Kuala Tungkal - Tembilahan - Kuala Enok Pakabaru - Belawan.
N3 Padang - Sibolga - Malahayati - Belawan - Singapore - Belawan Malahayati - Ports of Aceh - Sibolga - Padang.
N4 Tanjung Priok - Panjang - Tanjung Priok.
N5 Tanjung Priok - Padang - Bengkulu - Tanjung Priok.
N6 Tanjung Priok - Padang - Tanjung Pinang - Jambi - Palembang -Tanjung Priok.
N7 Tanjung Priok - Cirebon - Palembang - Jambi - Cirebon -Tanjung Priok.
N8 Tanjunf Priok - Tanjung Sekong - Cigading - Jambi - Pakabaru Dumai - Bengkalis - Bagan Siapiapi - Selat Panjang - Cirebon Tanjung Priok.
N9 Tanjung Priok - Belawan - West Malaysian Ports - Singapore - Dumai -Jambi - Tanjung Priok.
N10 Tanjung Priok - Pontianak - Jambi - Pangkal Pinang - Tanjung Priok.
Nll Tanjung Priok - Pontianak - Singapore - Tanjung Priok.
N12 Semarang - Kuala Gaung - Kuala Tungkal - Selat Panjang - Tembilahan- Rengat - Pakanbaru - Bagansiapiapi - Bengkalis - Selat Panjang Tanjung Kedabu - Cirebon - Surabaya - Semarang.
N13 Semarang - Pemangkat - Tanjung Pinag - Selat Panjang - Tembilahan Tanjung Priok - Cirebon - Semarang.
N14 Semarang - Cirebon - Pontianak - Pemangkat - Singapore - Cirebon Semarang.
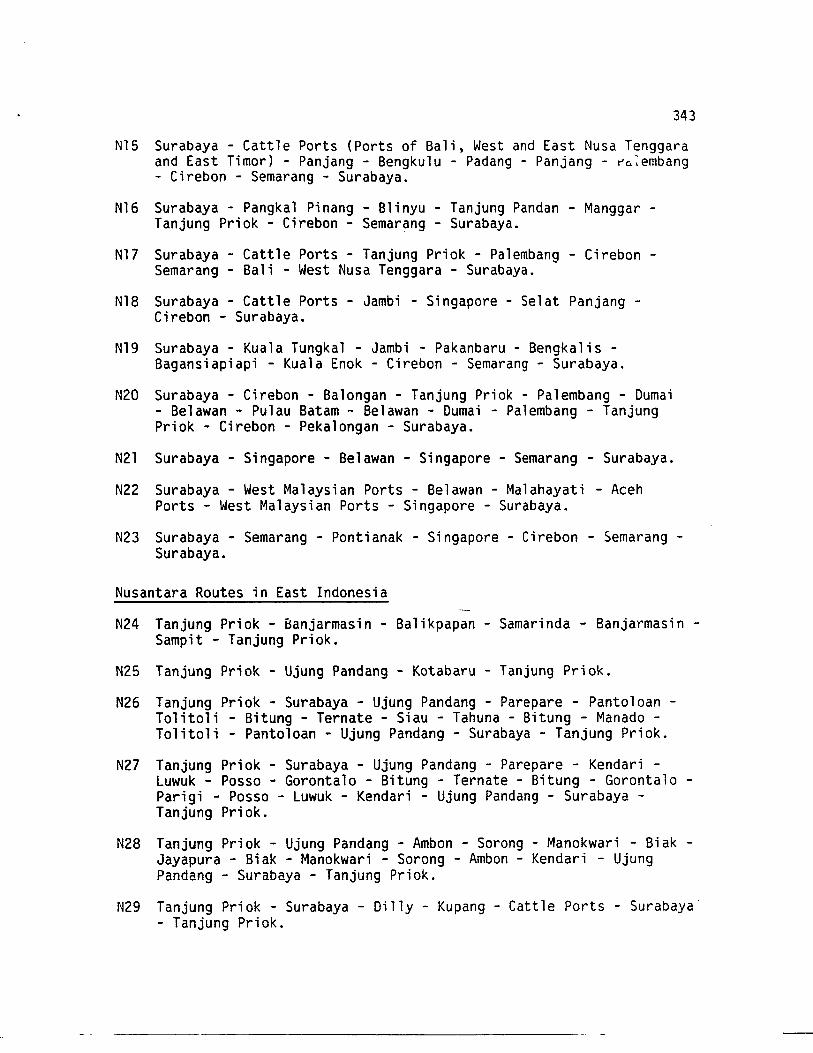
343
N15 Surabaya - Cattle Ports (Ports of Bali, West and East Nusa Tenggaraand East Timor) - Panjang - Bengkulu - Padang - Panjang - ~u~embang
- Cirebon - Semarang - Surabaya.
N16 Surabaya - Pangkal Pinang - Blinyu - Tanjung Pandan - Manggar Tanjung Priok - Cirebon - Semarang - Surabaya.
N17 Surabaya - Cattle Ports - Tanjung Priok - Palembang - Cirebon Semarang - Bali - West Nusa Tenggara - Surabaya.
N18 Surabaya - Cattle Ports - Jambi - Singapore - Selat Panjang Cirebon - Surabaya.
N19 Surabaya - Kuala Tungkal - Jambi - Pakanbaru - Bengkalis Bagansiapiapi - Kuala Enok - Cirebon - Semarang - Surabaya.
N20 Surabaya - Cirebon - Balongan - Tanjung Priok - Palembang - Duma;- Belawan - Pulau Batam - Belawan - Dumai - Palembang - TanjungPriok - Cirebon - Pekalongan - Surabaya.
N2l Surabaya - Singapore - Belawan - Singapore - Semarang - Surabaya.
N22 Surabaya - West Malaysian Ports - Belawan - Malahayati - AcehPorts - West Malaysian Ports - Singapore - Surabaya.
N23 Surabaya - Semarang - Pontianak - Singapore - Cirebon - Semarang Surabaya.
Nusantara Routes in East Indonesia
N24 Tanjung Priok - Banjarmasin - Balikpapan - Samarinda - Banjarmas;n Sampit - Tanjung Priok.
N25 Tanjung Priok - Ujung Pandang - Kotabaru - Tanjung Priok.
N26 Tanjung Priok - Surabaya - Ujung Pandang - Parepare - Pantoloan Tolitoli - Bitung - Ternate - Siau - Tahuna - Bitung - Manado Tolitoli - Pantoloan - Ujung Pandang - Surabaya - Tanjung Priok.
N27 Tanjung Priok - Surabaya - Ujung Pandang - Parepare - Kendari Luwuk - Posso - Gorontalo - Bitung - Ternate - Bitung - Gorontalo Parigi - Posso - Luwuk - Kendari - Ujung Pandang - Surabaya Tanjung Priok.
N28 Tanjung Priok - Ujung Pandang - Ambon - Sorong - Manokwari - Biak Jayapura - Biak - Manokwari - Sorong - Ambon - Kendari - UjungPandang - Surabaya - Tanjung Priok.
N29 Tanjung Priok - Surabaya - Dilly - Kupang - Cattle Ports - Surabaya"- Tanjung Priok.
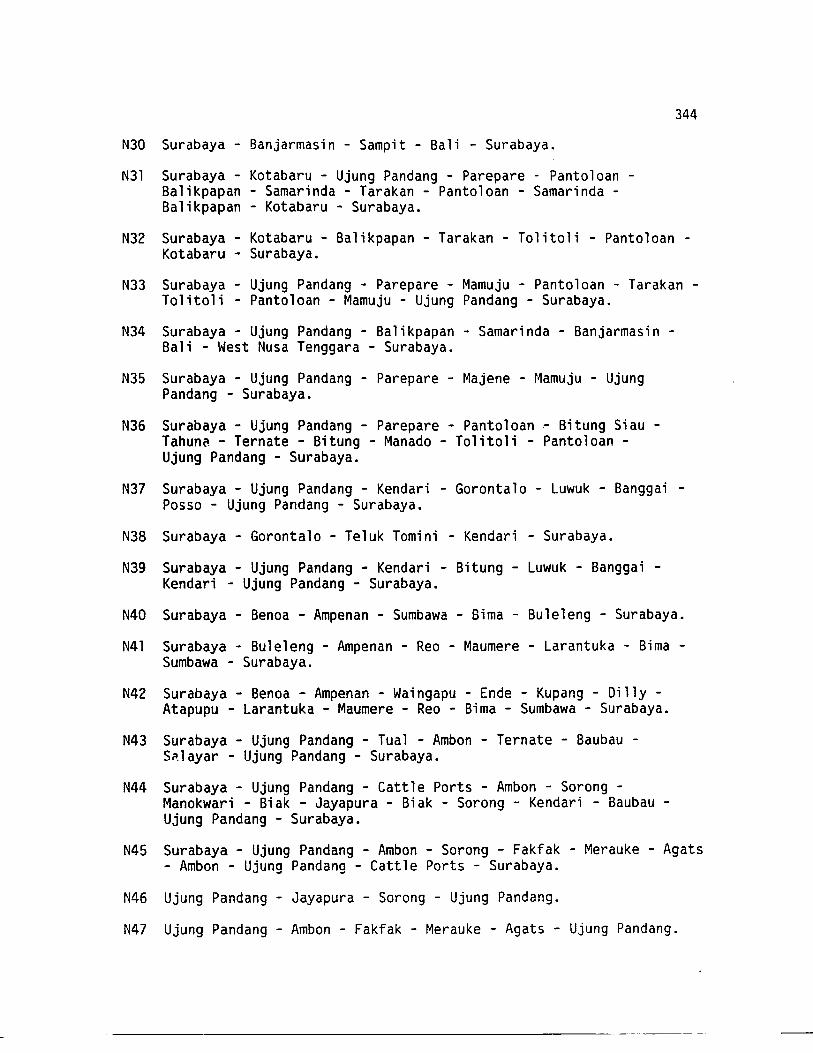
344
N30 Surabaya - Banjarmasin - Sampit - Bali - Surabaya.
N31 Surabaya - Kotabaru - Ujung Pandang - Parepare - Pantoloan Balikpapan - Samarinda - Tarakan - Pantoloan - Samarinda Balikpapan - Kotabaru - Surabaya.
N32 Surabaya - Kotabaru - Balikpapan - Tarakan - Tolitoli - Pantoloan Kotabaru - Surabaya.
N33 Surabaya - Ujung Pandang - Parepare - Mamuju - Pantoloan - Tarakan Tolitoli - Panto1oan - Mamuju - Ujung Pandang - Surabaya.
N34 Surabaya - Ujung Pandang - Ba1ikpapan - Samarinda - Banjarmasin Bali - West Nusa Tenggara - Surabaya.
N35 Surabaya - Ujung Pandang - Parepare - Majene - Mamuju - UjungPandang - Surabaya.
N36 Surabaya - Ujung Pandang - Parepare - Panto1oan ~ Bitung Siau Tahun~ ~ Ternate ~ Bitung - Manado - To1itoli - Panto1oan Ujung Pandang - Surabaya.
N37 Surabaya - Ujung Pandang - Kendari - Goronta10 - Luwuk - Banggai Posso - Ujung Pandang - Surabaya.
N38 Surabaya - Goronta10 - Te1uk Tomini - Kendari - Surabaya.
N39 Surabaya - Ujung Pandang - Kendari - Bitung - Luwuk - Banggai Kendari - Ujung Pandang - Surabaya.
N40 Surabaya - Benoa - Ampenan - Sumbawa - Sima - Bu1eleng - Surabaya.
N41 Surabaya - Buleleng - Ampenan - Reo - Maumere - Larantuka - Bima Sumbawa - Surabaya.
N42 Surabaya - Benoa - Ampenan - Waingapu - Ende - Kupang - Dilly Atapupu - Larantuka - Maumere - Reo - Bima - Sumbawa - Surabaya.
N43 Surabaya - Ujung Pandang - Tua1 - Ambon - Ternate - Baubau S~layar - Ujung Pandang - Surabaya.
N44 Surabaya - Ujung Pandang - Cattle Ports - Ambon - Sorong Manokwari - Biak - Jayapura - Biak - Sorong - Kendari - Baubau Ujung Pandang - Surabaya.
N45 Surabaya - Ujung Pandang - Ambon - Sorong - Fakfak - Merauke - Agats- Ambon - Ujung Pandang - Cattle Ports - Surabaya.
N46 Ujung Pandang - Jayapura - Sorong - Ujung Pandang.
N47 Ujung Pandang - Ambon - Fakfak - Merauke - Agats - Ujung Pandang.
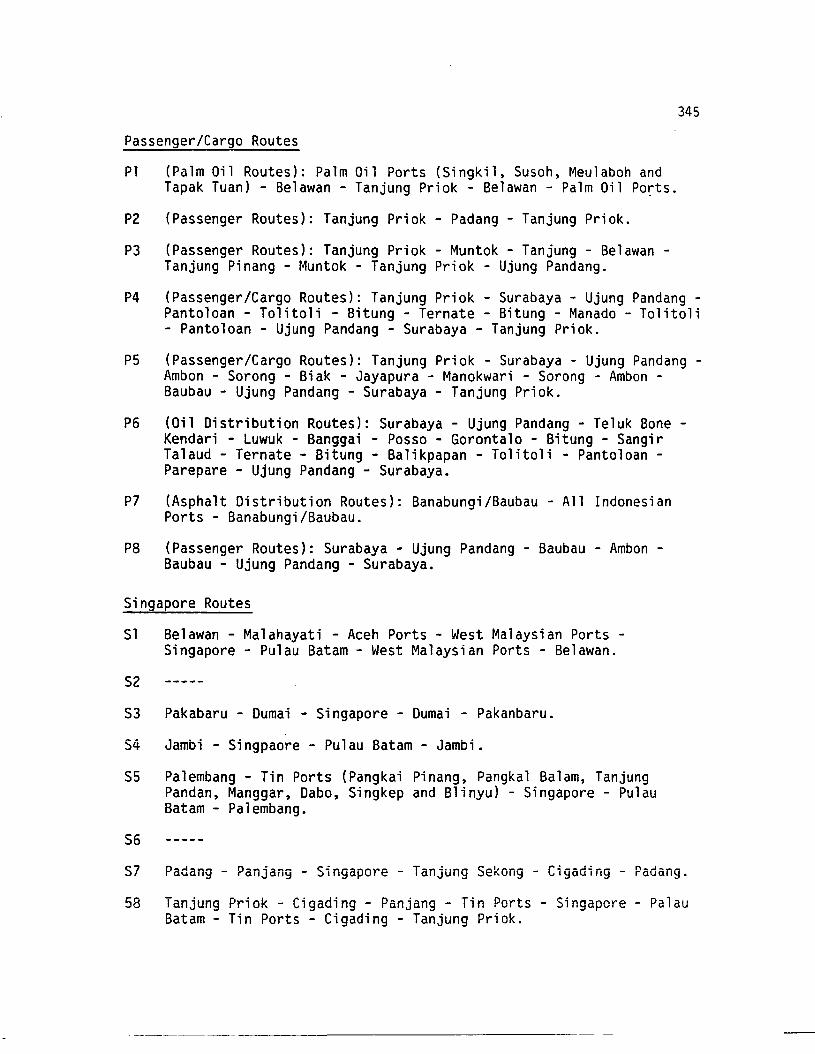
345
Passenger/Cargo Routes
Pl (Palm Oil Routes): Palm Oil Ports (Singkil, Susoh, Meulaboh andTapak Tuan) - Belawan - Tanjung Priok - Belawan - Palm Oil Ports.
P2 (Passenger Routes): Tanjung Priok - Padang - Tanjung Priok.
P3 (Passenger Routes): Tanjung Priok - Muntok - Tanjung - Belawan Tanjung Pinang - Muntok - Tanjung Priok - Ujung Pandang.
P4 (Passenger/Cargo Routes): Tanjung Priok - Surabaya - Ujung Pandang Pantoloan - Tolitoli - Bitung - Ternate - Bitung - Manado - Tolitoli- Pantoloan - Ujung Pandang - Surabaya - Tanjung Priok.
P5 (Passenger/Cargo Routes): Tanjung Priok - Surabaya - Ujung Pandang Ambon - Sorong - Biak - Jayapura - Manokwari - Sorong - Ambon Baubau - Ujung Pandang - Surabaya - Tanjung Priok.
P6 (Oil Distribution Routes): Surabaya - Ujung Pandang - Teluk Bone Kendari - Luwuk - Banggai - Posso - Gorontalo - Bitung - SangirTalaud - Ternate - Bitung - Balikpapan - Tolitoli - Pantoloan Parepare - Ujung Pandang - Surabaya.
P7 (Asphalt Distribution Routes): Banabungi/Baubau - All IndonesianPorts - Banabungi/Baubau.
P8 (Passenger Routes): Surabaya - Ujung Pandang - Baubau - Ambon Baubau - Ujung Pandang - Surabaya.
Singapore Routes
Sl Belawan - Malahayati - Aceh Ports - West Malaysian Ports Singapore - Pulau Batam - West Malaysian Ports - Belawan.
S2
S3 Pakabaru - Dumai - Singapore - Dumai - Pakanbaru.
S4 Jambi - Singpaore - Pulau Batam - Jambi.
S5 Palembang - Tin Ports (Pangkai Pinang, Pangkal Balam, TanjungPandan, Manggar, Dabo, Singkep and Blinyu) - Singapore - PulauBatam - Palembang.
S6
S7 Padang - Panjang - Singapore - Tanjung Sekong - Cigading - Padang.
58 Tanjung Priok - Cigading - Panjang - Tin Ports - Singapore - PalauBatam - Tin Ports - Cigading - Tanjung Priok.
-~-~----------------------
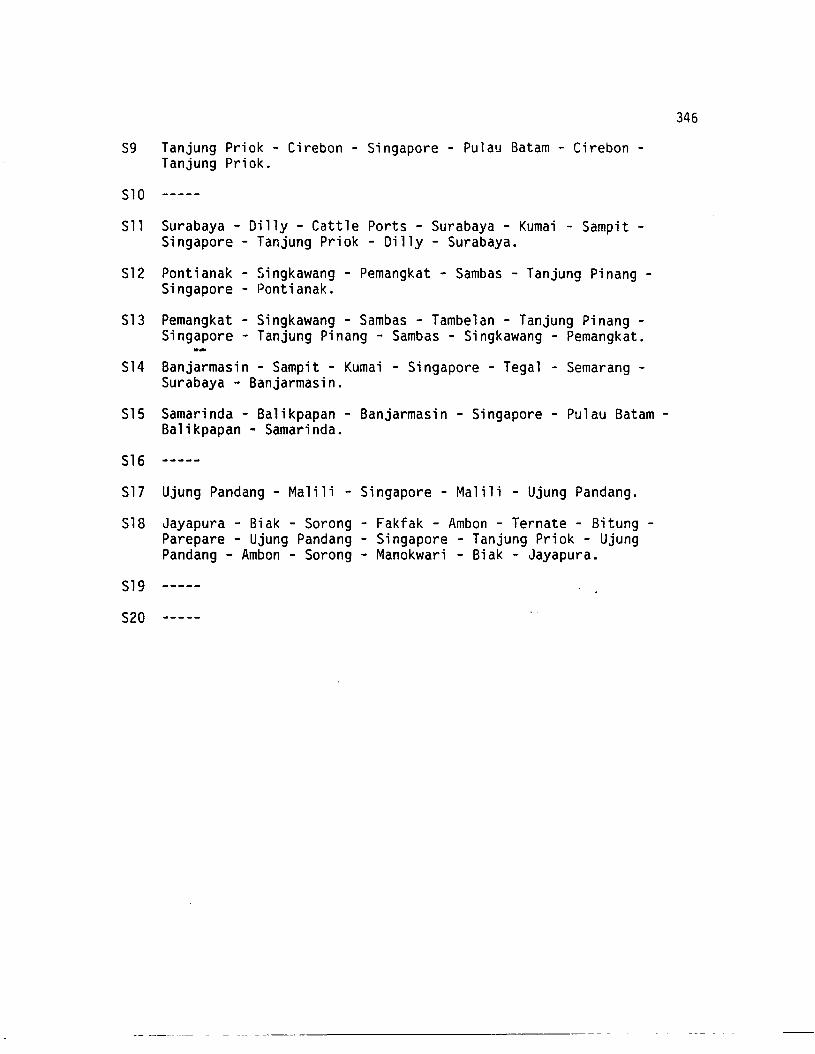
S9 Tanjung Priok - Cirebon - Singapore - Pulau Batam - Cirebon Tanjung Priok.
SlO
Sll Surabaya - Dilly - Cattle Ports - Surabaya - Kumai - Sampit Singapore - Tanjung Priok - Dilly - Surabaya.
S12 Pontianak - Singkawang - Pemangkat - Sambas - Tanjung Pinang Singapore - Pontianak.
S13 Pemangkat - Singkawang - Sambas - Tambelan - Tanjung Pinang Singapore - Tanjung Pinang - Sambas - Singkawang - Pemangkat.
S14 Banjarmasin - Sampit - Kumai - Singapore - Tega1 - Semarang Surabaya.- Banjarmasin.
S15 Samarinda - Ba1ikpapan - Banjarmasin - Singapore - Pu1au Batam Ba1ikpapan - Samarinda.
S16
S17 Ujung Pandang - Ma1i1i - Singapore - Ma1i1i - Ujung Pandang.
S18 Jayapura - Biak - Sorong - Fakfak - Ambon - Ternate - Bitung Parepare - Ujung Pandang - Singapore - Tanjung Priok - UjungPandang - Ambon - Sarong - Manokwari - Biak - Jayapura.
S19
S20
346
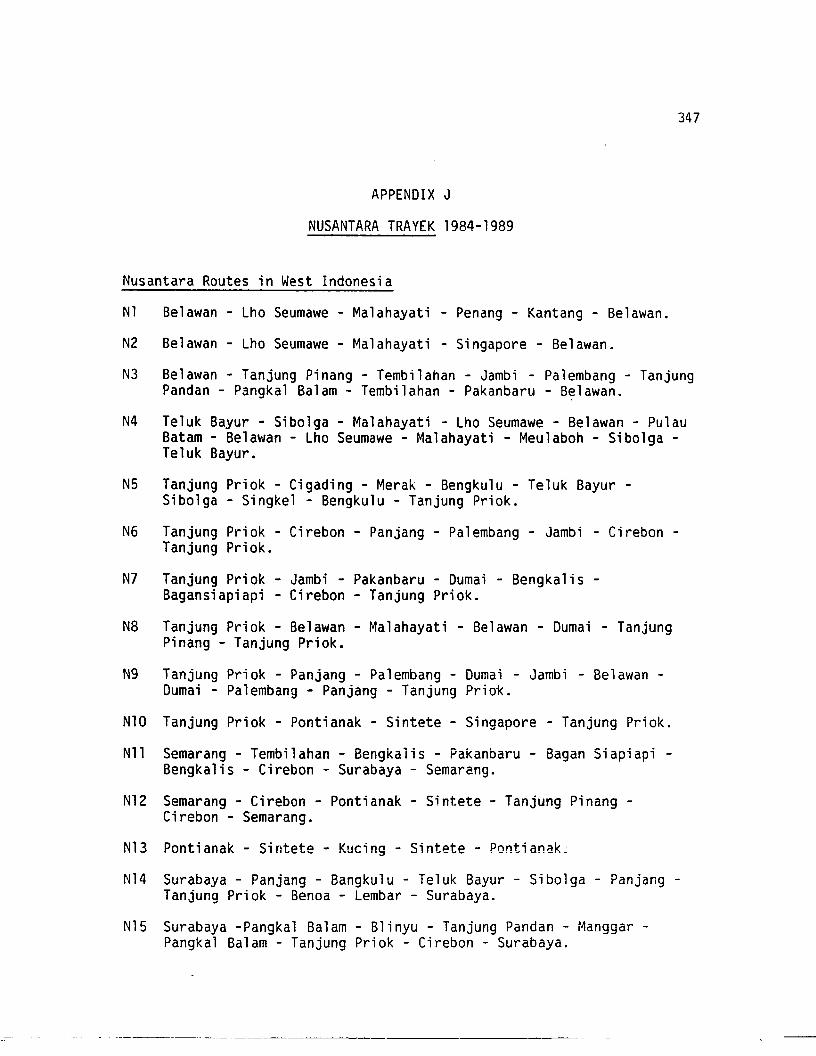
347
APPENDIX J
NUSANTARA TRAYEK 1984-1989
Nusantara Routes in West Indonesia
N1 Be1awan - Lho Seumawe - Ma1ahayati - Penang - Kantang - Be1awan.
N2 Be1awan - Lho Seumawe - Ma1ahayati - Singapore - Be1awan.
N3 Be1awan - Tanjung Pinang - Tembi1ahan - Jambi - Pa1embang - TanjungPandan - Pangka1 Balam - Tembi1ahan - Pakanbaru - Belawan.
N4 Te1uk Bayur - Sibolga - Malahayati - Lho Seumawe - Be1awan - PulauBatam - Belawan - Lho Seumawe - Malahayati - Meulaboh - Sibo1ga Teluk Bayur.
N5 Tanjung Priok - Cigading - Mera~ - Bengku1u - Teluk Bayur Sibo1ga - Singke1 - Bengku1u - Tanjung Priok.
N6 Tanjung Priok - Cirebon - Panjang - Pa1embang - Jambi - Cirebon Tanjung Priok.
N7 Tanjung Priok - Jambi - Pakanbaru - Dumai - Bengka1is Bagansiapiapi - Cirebon - Tanjung Priok.
N8 Tanjung Priok - Belawan - Malahayati - Belawan - Dumai - TanjungPinang - Tanjung Priok.
N9 Tanjung Priok - Panjang - Palembang - Dumai - Jambi - Belawan Dumai - Palembang - Panjang - Tanjung Priok.
N10 Tanjung Priok - Pontianak - Sintete - Singapore - Tanjung Priok.
Nil Semarang - Tembilahan - Bengkalis - Pakanbaru - Bagan SiapiapiBengkalis - Cirebon - Surabaya - Semarang.
N12 Semarang - Cirebon - Pontianak - Sintete - Tanjung Pinang Cirebon - Semarang.
N13 Pontianak - Sintete - Kucing - Sintete - Pontianak~
N14 Surabaya - Panjang - Bangkulu - Teluk Bayur - Sibo1ga - Panjang Tanjung Priok - Benoa - Lembar - Surabaya.
N15 Surabaya -Pangkal Ba1am - Blinyu - Tanjung Pandan - Manggar Pangkal Balam - Tanjung Priok - Cirebon - Surabaya.
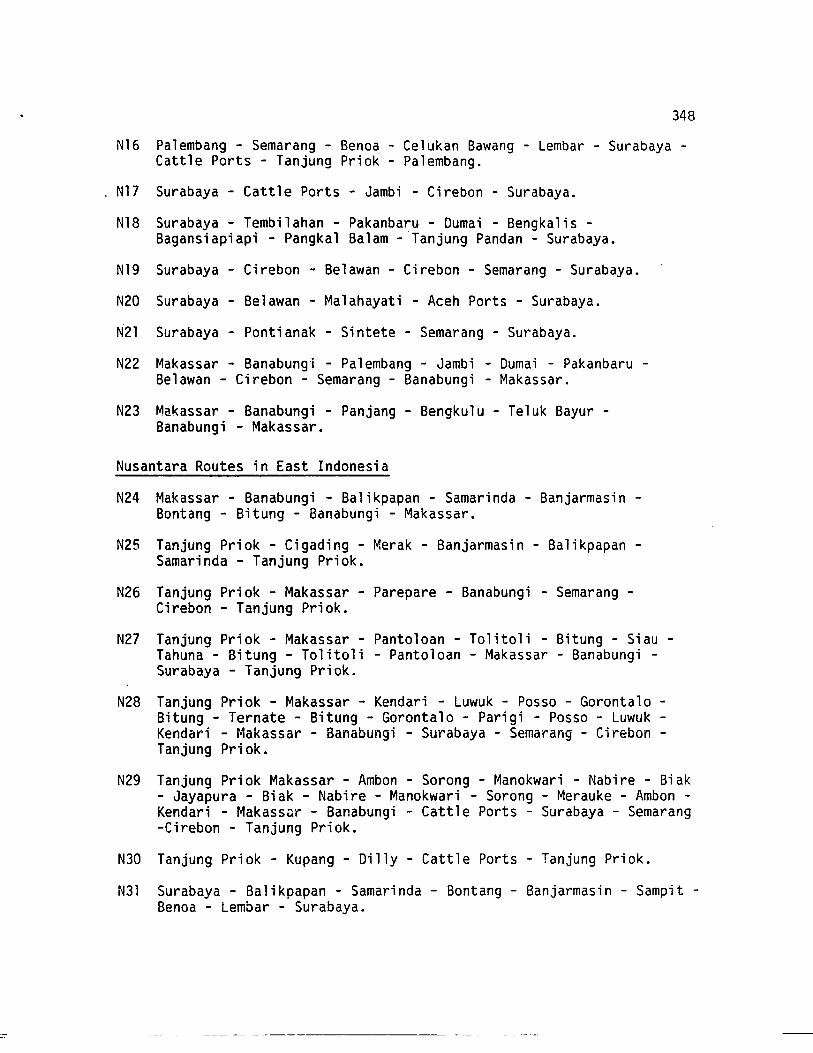
348
N16 Palembang - Semarang - Benoa - Celukan Bawang - Lembar - Surabaya Cattle Ports - Tanjung Priok - Palembang.
N17 Surabaya - Cattle Ports - Jambi - Cirebon - Surabaya.
N18 Surabaya - Tembilahan - Pakanbaru - Dumai - Bengkalis Bagansiapiapi - Pangkal Balam -Tanjung Pandan - Surabaya.
N19 Surabaya - Cirebon - Belawan - Cirebon - Semarang - Surabaya.
N20 Surabaya - Belawan - Malahayati - Aceh Ports - Surabaya.
N21 Surabaya - Pontianak - Sintete - Semarang - Surabaya.
N22 Makassar - Banabungi - Palembang - Jambi - Dumai - Pakanbaru Belawan - Cirebon - Semarang - Banabungi - Makassar.
N23 Makassar - Banabungi - Panjang - Bengkulu - Teluk Bayur Banabungi - Makassar.
Nusantara Routes in East Indonesia
N24 Makassar - Banabungi - Balikpapan - Samarinda - Banjarmasin Bontang - Bitung - Banabungi - Makassar.
N25 Tanjung Priok - Cigading - Merak - Banjarmasin - Balikpapan Samarinda - Tanjung Priok.
N26 Tanjung Priok - Makassar - Parepare - Banabungi - Semarang Cirebon - Tanjung Priok.
N27 Tanjung Priok - Makassar - Pantoloan - Tolitoli - Bitung - Siau Tahuna - Bitung - Tolitoli - Pantoloan - Makassar - Banabungi Surabaya - Tanjung Priok.
N28 Tanjung Priok - Makassar - Kendari - Luwuk - Posso - Gorontalo Bitung - Ternate - Bitung - Gorontalo - Parigi - Posso - Luwuk Kendari - Makassar - Banabungi - Surabaya - Semarang - Cirebon Tanjung Priok.
N29 Tanjung Priok Makassar - Ambon - Sorong - Manokwari - Nabire - Biak- Jayapura - Biak - Nabire - Manokwari - Sorong - Merauke - Ambon Kendari - Makass~r - Banabungi - Cattle Ports - Surabaya - Semarang-Cirebon - Tanjung Priok.
N30 Tanjung Priok - Kupang - Dilly - Cattle Ports - Tanjung Priok.
N3l Surabaya - Balikpapan - Samarinda - Bontang - Banjarmasin - Sampit Benoa - Lembar - Surabaya.
------------ -----. ---
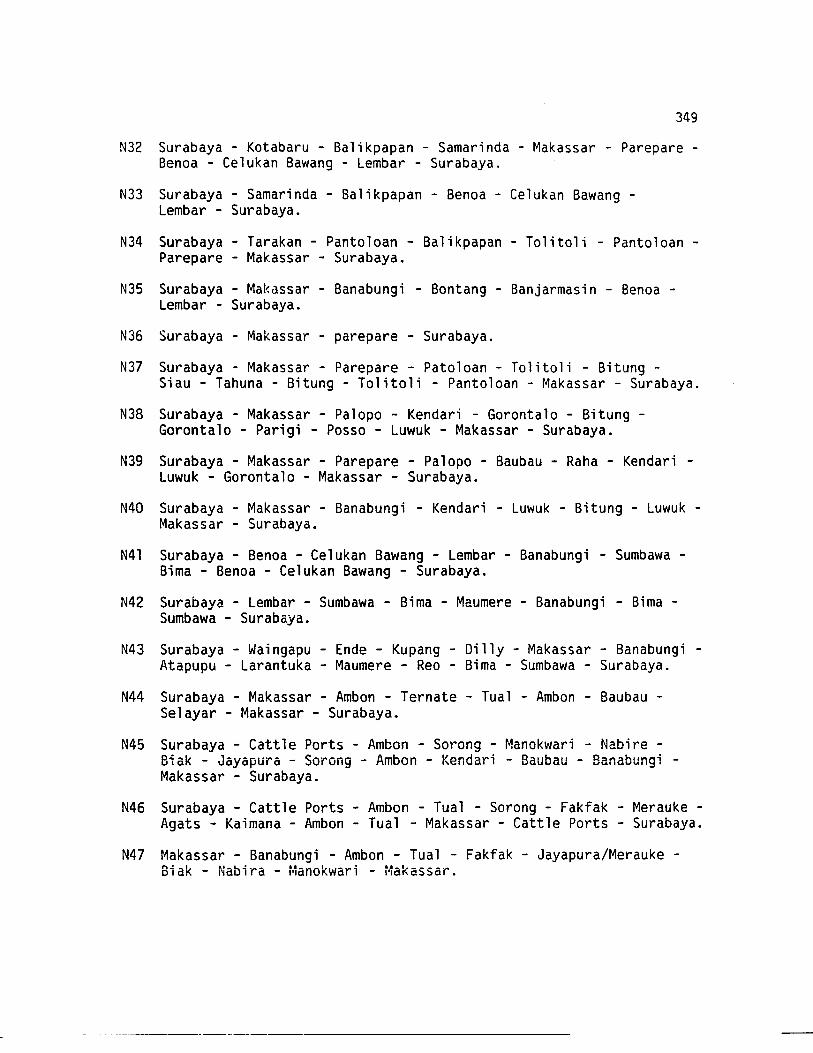
349
N32 Surabaya - Kotabaru - Balikpapan - Samarinda - Makassar - Parepare Benoa - Celukan Bawang - Lembar - Surabaya.
N33 Surabaya - Samarinda - Balikpapan - Benoa - Celukan Bawang Lembar - Surabaya.
N34 Surabaya - Tarakan - Pantoloan - Balikpapan - Tolitoli - Pantoloan Parepare - Makassar - Surabaya.
N35 Surabaya - Makassar - Banabungi - Bontang - Banjarmasin - Benoa Lembar - Surabaya.
N36 Surabaya - Makassar - parepare - Surabaya.
N37 Surabaya - Makassar - Parepare - Patoloan - Tolitoli - Bitung -Siau - Tahuna - Bitung - Tolitoli - Pantoloan - Makassar - Surabaya.
N38 Surabaya - Makassar - Palopo - Kendari - Gorontalo - Bitung Gorontalo - Parigi - Posso - Luwuk - Makassar - Surabaya.
N39 Surabaya - Makassar - Parepare - Palopo - Baubau - Raha - Kendari Luwuk - Gorontalo - Makassar - Surabaya.
N40 Surabaya - Makassar - Banabungi - Kendari - Luwuk - Bitung - Luwuk Makassar - Surabaya.
N4l Surabaya - Benoa - Celukan Bawang - Lembar - Banabungi - Sumbawa Bima - Benoa - Celukan Bawang - Surabaya.
N42 Surabaya - Lembar - Sumbawa - Bima - Maumere - Banabungi - Bima Sumbawa - Surabaya.
N43 Surabaya - Waingapu - Ende - Kupang - Dilly - Makassar - Banabungi Atapupu - Larantuka - Maumere - Reo - Bima - Sumbawa - Surabaya.
N44 Surabaya - Makassar - Ambon - Ternate - Tual - Ambon - Baubau Selayar - Makassar - Surabaya.
N45 Surabaya - Cattle Ports - Ambon - Sorong - Manokwari - Nabire Biak - Jayapura - Sorong - Ambon - Kendari - Baubau - Banabungi Makassar - Surabaya.
N46 Surabaya - Cattle Ports - Ambon - Tual - Sorong - Fakfak - Merauke Agats - Kaimana - Ambon - Tual - Makassar - Cattle Ports - Surabaya.
N47 Makassar - Banabungi - Ambon - Tual - Fakfak - Jayapura/Merauke Biak - Nabira - Manokwari - Makassar.
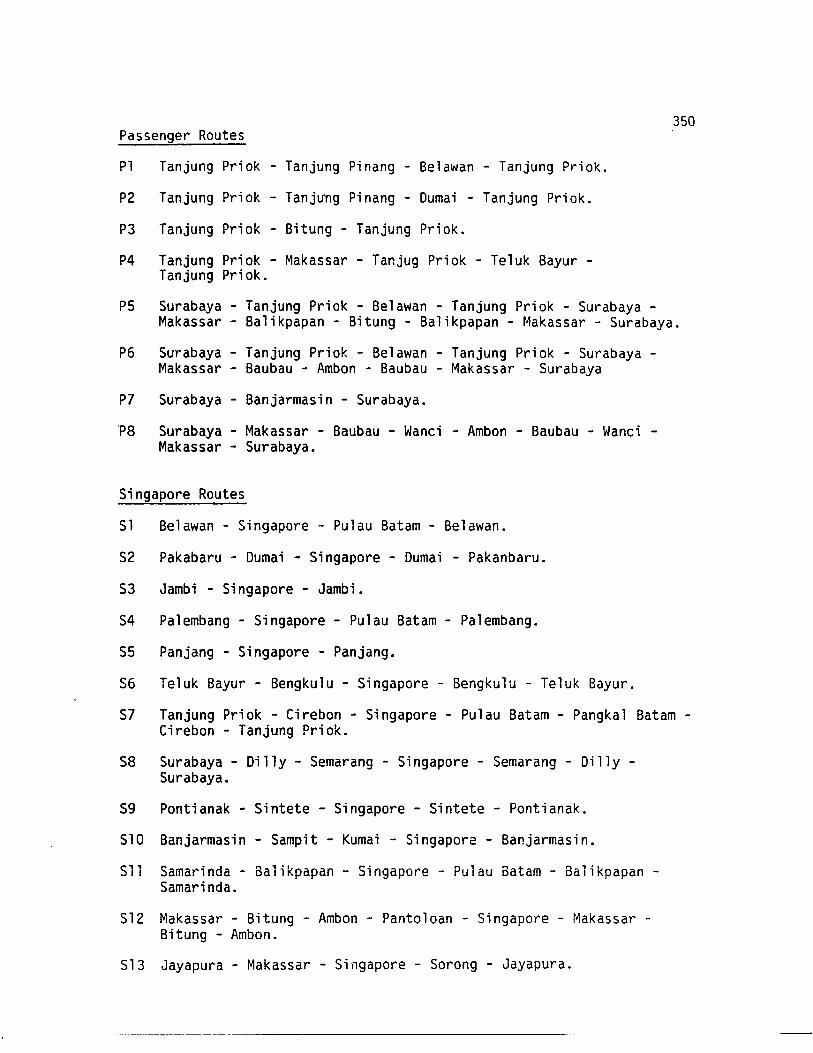
350Passenger Routes
P1 Tanjung Priok - Tanjung Pinang - Belawan - Tanjung Priok.
P2 Tanjung Priok - Tanjvng Pinang - Dumai - Tanjung Priok.
P3 Tanjung Priok - Bitung - Tanjung Priok.
P4 Tanjung Priok - Makassar - Tanjug Priok - Te1uk Bayur -Tanjung Priok.
P5 Surabaya - Tanjung Priok - Be1awan - Tanjung Priok - Surabaya Makassar - Ba1ikpapan - Bitung - Balikpapan - Makassar - Surabaya.
P6 Surabaya - Tanjung Priok - Be1awan - Tanjung Priok - Surabaya Makassar - Baubau - Ambon - Baubau - Makassar - Surabaya
P7 Surabaya - Banjarmasin - Surabaya.
P8 Surabaya - Makassar - Baubau - Wanei - Ambon - Baubau - Wanei Makassar - Surabaya.
Singapore Routes
Sl Belawan - Singapore - Pulau Batam - Belawan.
S2 Pakabaru - Dumai - Singapore - Dumai - Pakanbaru.
S3 Jambi - Singapore - Jambi.
S4 Palembang - Singapore - Pu1au Batam - Pa1embang.
S5 Panjang - Singapore - Panjang.
S6 Teluk Bayur - Bengku1u - Singapore - Bengkulu - Teluk Bayur.
S7 Tanjung Priok - Cirebon - Singapore - Pulau Batam - Pangkal Batam Cirebon - Tanjung Priok.
S8 Surabaya - Dilly - Semarang - Singapore - Semarang - Dilly Surabaya.
S9 Pontianak - Sintete - Singapore - Sintete - Pontianak.
S10 Banjarmasin - Sampit - Kumai - Singapore - Banjarmasin.
S11 Samarinda - Ba1ikpapan - Singapore - Pulau Batam - Balikpapan Samarinda.
S12 Makassar - Bitung - Ambon - Panto1oan - Singapore - Makassar Bitung - Ambon.
S13 Jayapura - Makassar - Singapore - Sorong - Jayapura.
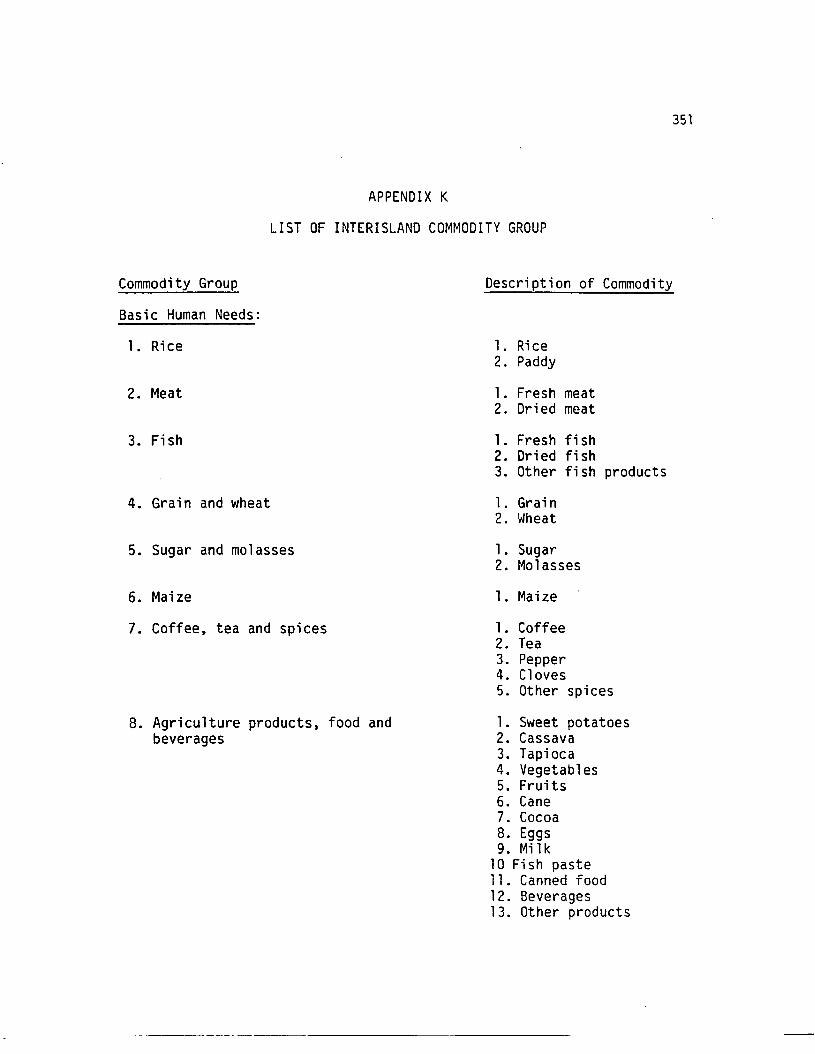
APPENDIX K
LIST OF INTERISLAND COMMODITY GROUP
351
Commodity Group
Basic Human Needs:
1. Ri ce
2. Meat
3. Fish
4. Grain and wheat
5. Sugar and molasses
6. Maize
7. Coffee, tea and spices
8. Agriculture products, food andbeverages
Description of Commodity
l. Rice2. Paddy
l. Fresh meat2. Dried meat
l. Fresh fish2. Dried fish3. Other fish products
l. Grain2. Wheat
l. Sugar2. Molasses
l. Maize
1. Coffee2. Tea3. Pepper4. Cloves5. Other spices
1. Sweet potatoes2. Cassava3. Tapioca4. Vegetables5. Fruits6. Cane7. Cocoa8. Eggs9. Mil k
10 Fish paste11. Canned food12. Beverages13. Other products
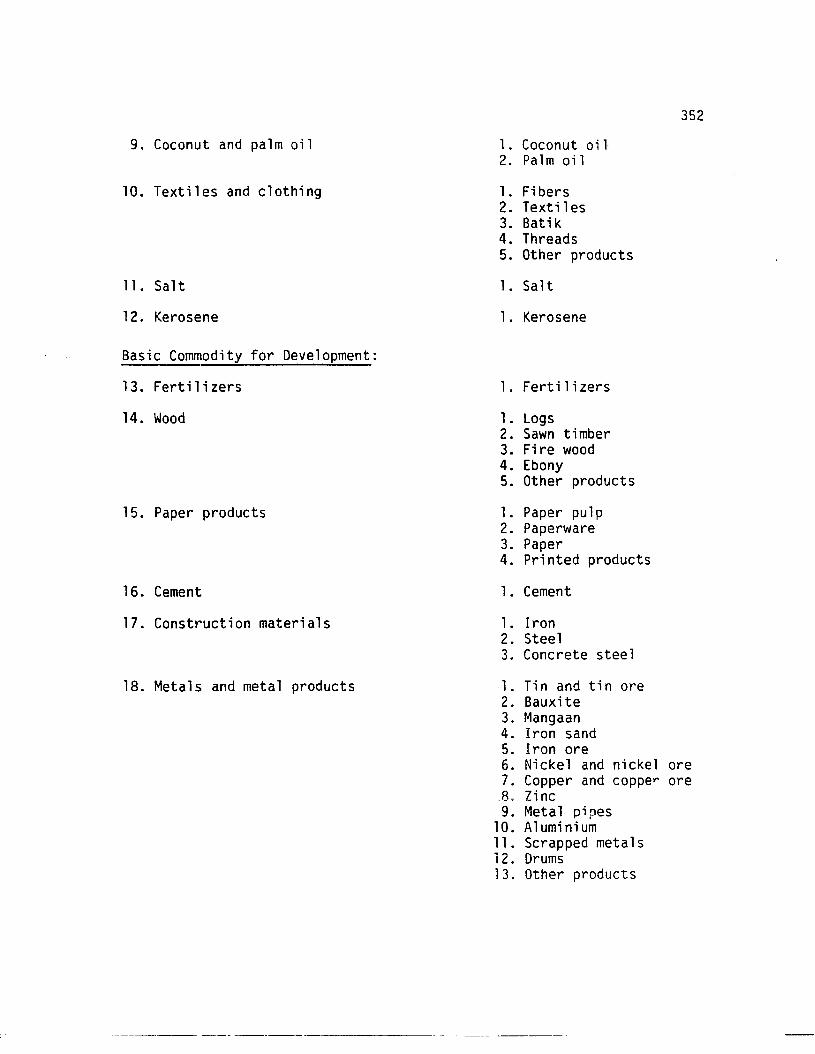
352
9. Coconut and palm oil l. Coconut oil2. Palm oil
10. Textiles and clothing l. Fibers2. Textiles3. Batik4. Threads5. Other products
ll. Salt l. Salt
12. Kerosene l. Kerosene
Basic Commodity for Development:
13. Fertilizers l. Fertilizers
14. Wood l. Logs2. Sawn timber3. Fire wood4. Ebony5. Other products
15. Paper products l. Paper pulp2. Paperware3. Paper4. Printed products
16. Cement l. Cement
17. Construction materials l. Iron2. Steel3. Concrete steel
18. Metals and metal products l. Tin and tin ore2. Bauxite3. Mangaan4. Iron sand5. Iron ore6. Nickel and nickel ore7. Copper and coppeV' ore8, Zinc9. Metal pipes
10. Aluminiumll. Scrapped metals12. Drums13. Other products
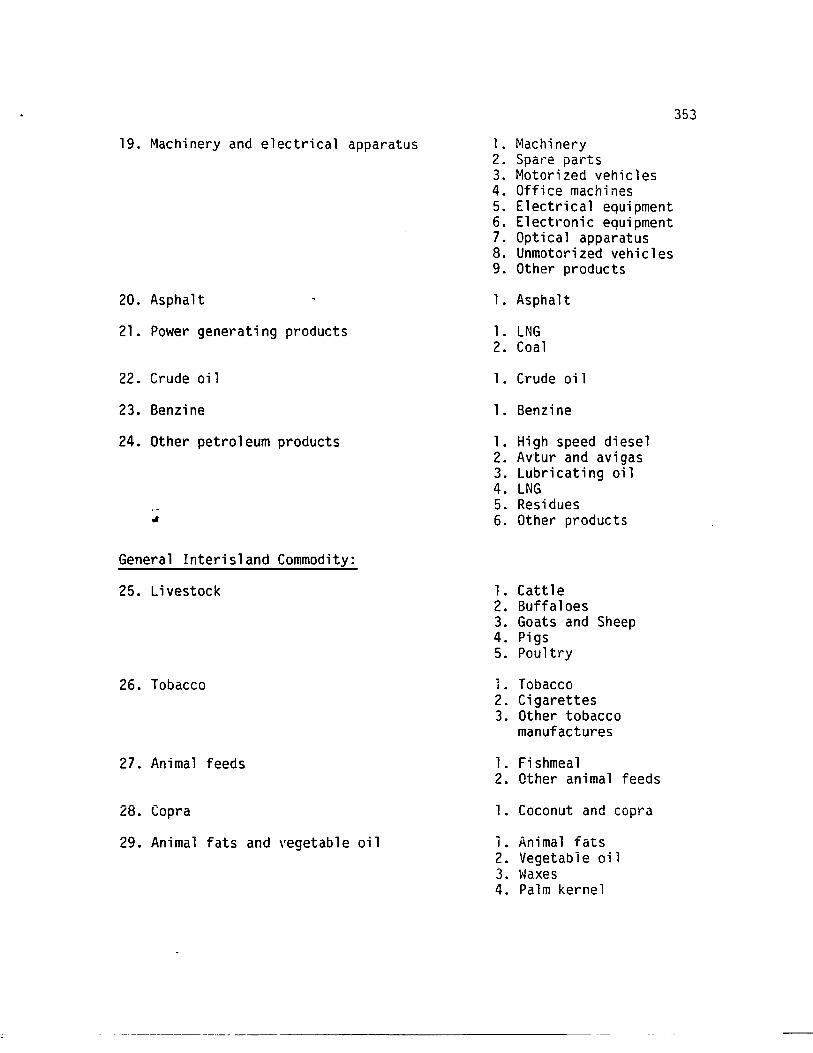
19. Machinery and electrical apparatus
20. Asphalt
21. Power generating products
22. Crude oil
23. Benzine
24. Other petroleum products
General Interisland Commodity:
25. Livestock
26. Tobacco
27. Animal feeds
28. Copra
29. Animal fats and vegetable oil
353
1. Machinery2. Spare parts3. Motorized vehicles4. Office machines5. Electrical equipment6. Electronic equipment7. Optical apparatus8. Unmotorized vehicles9. Other products
1. Asphalt
1. LNG2. Coal
1. Crude oil
1. Benzine
1. High speed diesel2. Avtur and avigas3. Lubricating oil4. LNG5. Residues6. Other products
l. Cattle2. Buffaloes3. Goats and Sheep4. Pigs5. Poultry
1- Tobacco2. Cigarettes3. Other tobacco
manufactures
l. Fishmea12. Other animal feeds
l. Coconut and copra
L Animal fats2. Vegetabie oil3. Waxes4. Palm kernel
- ---------------------------------
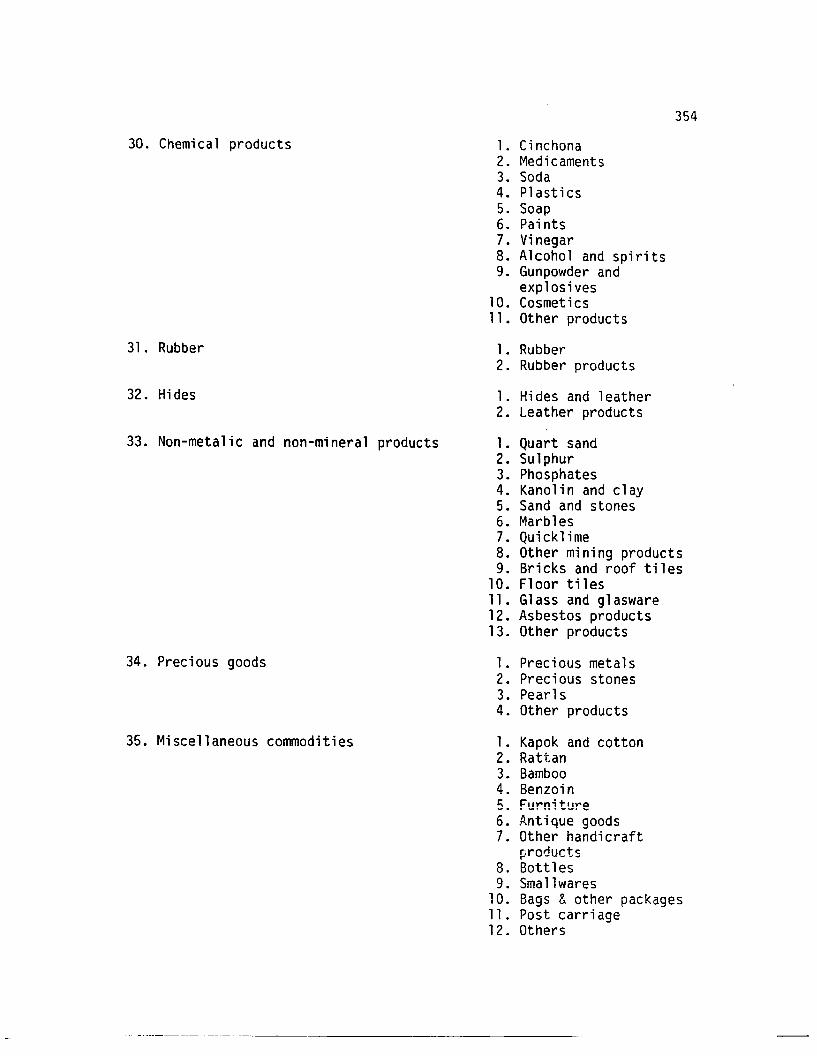
30. Chemical products
31. Rubber
32. Hides
33. Non-metalic and non-mineral products
34. Precious goods
35. Miscellaneous commodities
354
1. Cinchona2. Medicaments3. Soda4. Plastics5. Soap6. Paints7. Vinegar8. Alcohol and spirits9. Gunpowder and
explosives10. Cosmetics11. Other products
1. Rubber2. Rubber products
1. Hides and leather2. Leather products
1. Quart sand2. Sulphur3. Phosphates4. Kanolin and clay5. Sand and stones6. Marbles7. Quicklime8. Other mining products9. Bricks and roof tiles
10. Floor tiles11. Glass and glasware12. Asbestos products13. Other products
1. Precious metals2. Precious stones3. Pearls4. Other products
1. Kapok and cotton2. Rattan3. Bamboo4. Benzoin5. Fl.!~!"!itl.!~e
6. Antique goods7. Other handicraft
products8. Bottles9. Smallwares
10. Bags &other packages11. Post carriage12. Others
---------- ----------------------------
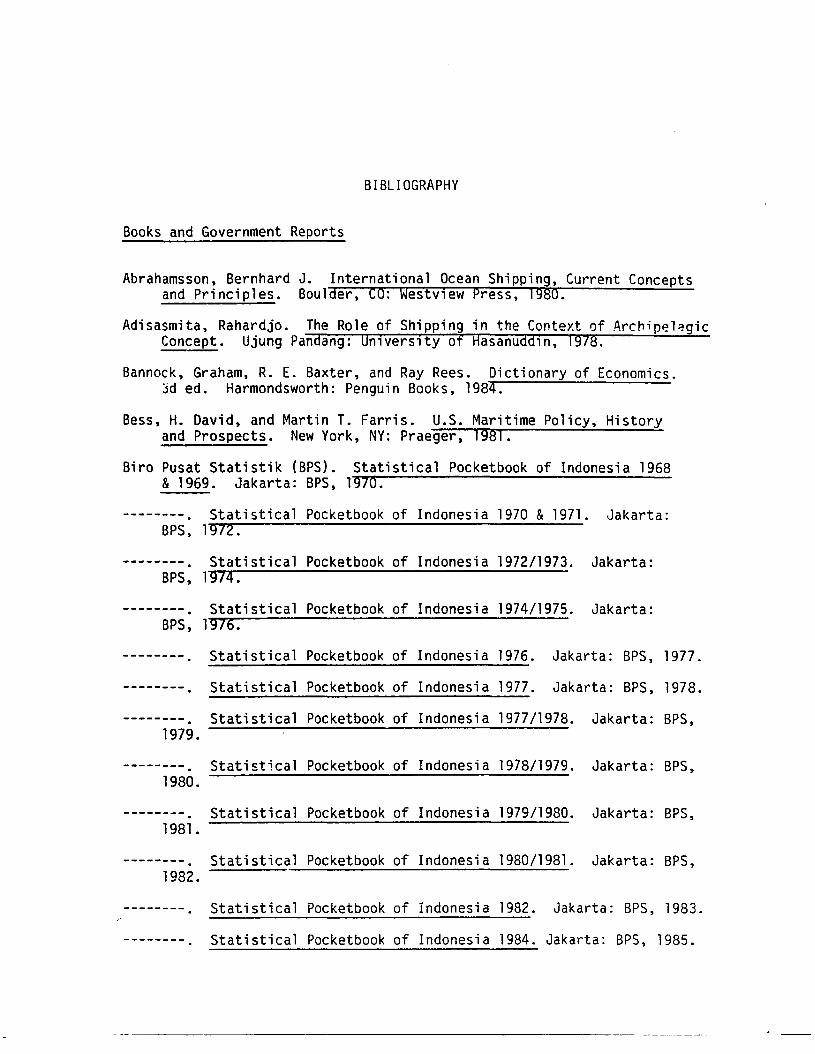
BIBLIOGRAPHY
Books and Government Reports
Abrahamsson, Bernhard J. International Ocean Shipping, Current Conceptsand Principles. Boulder, CO: Westvlew Press, 1980.
Adisasmita, Rahardjo. The Role of Shipping in the Context of Arch;pe1~gic
Concept. Ujung Pandang: Onlverslty of Hasanudd,n, 1978.
Bannock, Graham, R. E. Baxter, and Ray Rees. Dictionary of Economics.jd ed. Harmondsworth: Penguin Books, 1984.
Bess, H. David, and Martin T. Farris. U.S. Maritime Policy, Historyand Prospects. New York, NY: Praeger, 1981.
Biro Pusat Statistik (BPS). Statistical Pocketbook of Indonesia 1968& 1969. Jakarta: BPS, 1970.
-------- Statistical Pocketbook of Indonesia 1970 &1971. Jakarta:BPS, 1972.
-------- Statistical Pocketbook of Indonesia 1972/1973. Jakarta:BPS, 1974.
-------- Statistical Pocketbook of Indonesia 1974/1975. Jakarta:BPS, 1976.
-------- Statistical Pocketbook of Indonesia 1976. Jakarta: BPS, 1977.
-------- Statistical Pocketbook of Indonesia 1977. Jakarta: BPS, 1978.
-------- Statistical Pocketbook of Indonesia 1977/1978. Jakarta: BPS,1979.
-------- Statistical Pocketbook of Indonesia 1978/1979. Jakarta: BPS,1980.
-------- Statistical Pocketbook of Indonesia 1979/1980. Jakarta: BPS,1981.
-------- Statistical Pocketbook of Indonesia 1980/1981. Jakarta: BPS,1982.
-------- Statistical Pocketbook of Indonesia 1982. Jakarta: BPS, 1983.
-------- Statistical Pocketbook of Indonesia 1984. Jakarta: BPS, 1985.
356
Biro Pusat Statistik (BPS). Statistical Pocketbook of Indonesia 1985.Jakarta: BPS, 1986.
-------- Statistical Yearbook of Indonesia 1986. Jakarta: BPS, 1987.
--------. Interisland Cargo Traffic by Commodity Group, Region of Originand Region of Destination 1977. Jakarta: BPS, 1980.
--------. Interisland Cargo Traffic by Commodity Group, Region of Originand Reglon of Destlnatlon 1978. Jakarta: BPS, 1981.
--------. Interisland Cargo Traffic by Commodity Group, Region of Originand Reglon of Destinatlon 1979. Jakarta: BPS, 1982.
--------. Interisland Cargo Traffic by Commodity Group, Region of Originand Reglon of Destlnatlon 1980. Jakarta: BPS, 1982.
--------. Interisland Cargo Traffic by Commodity Group, Region of Originand Reglon of Destlnatlon 1981. Jakarta: BPS, 1982.
--------. Interisland carIo Traffic by Commodity Group, Region of Originand Reglon of Destlna lon 1982. Jakarta: BPS, 1983.
--------. Interisland Cargo Traffic by Commodity Group, Region of Originand Reglon of Destlnatlon 1983. Jakarta: BPS, 1985.
--------. Interisland Cargo Traffic by Commodity Group, Region of Originand Reglon of Destlnatlon 1984. Jakarta: BPS, 1986.
--------- Interisland Cargo Flows by Shipping Sector 1976. Jakarta:BPS, 197~.
-------- Interisland Cargo Traffic by Shipping Sector 1977. Jakarta:BPS, 1980.
---------. Interisland Cargo Traffic by Shipping Sector 1978. Jakarta:BPS, 1981.
--------- Interisland Cargo Traffic by Ship Sector 1979. Jakarta:BPS, 1982.
-------- Interisland Cargo Traffic by Ship Sector 1980. Jakarta:BPS, 1982.
---------. Interisland Cargo Traffic by Ship Sector 1981. Jakarta:BPS, 1982.
---------. Interisland Cargo Traffic by Ship Sector 1983. Jakarta:BPS, 1985.
Interisland Cargo Traffic by Ship Sector 1984. Jakarta: BPS,1986.
357
Booth, Anne. "Indonesia's Economy: Performance and Policy Options inPost-OPEC World." In Southeast Asian Affairs 1986, ed. Kernia1 S.Sandhu and Mohammed Ayoob, 122-38. Slngapore: Institute of Southeast Asian Studies, 1986.
BOPBERPAN. Laporan Kegiatan Kapa1-Kapa1 RLS Nusantara 1981 [Report onRLS Nusantara ShlPS Activities 1981]. Jakarta: BOPBERPAN, 1982.
--------- Laporan Kegiatan Kapa1-Kapa1 RLS Nusantara 1982 [Report onRLS Nusantara ShlPS Activltles 1982]. Jakarta: BOPBERPAN, 1983.
-------- Laporan Kegiatan Kapai-Kapal RLS Nusantara 1983 [Report onRLS Nusantara ShlPS Actlvltles 1983]. Jakarta: BOPBERPAN. 1984.
-------- Laporan Kegiatan Kapal-Kapal RLS Nusantara 1984 [Report onRLS Nusantara ShlPS Activltles 1984]. Jakarta: BOPBERPAN, 1985.
-------- Laporan Kegiatan Kapal-Kapa1 RLS Nusantara 1985 [Report onRLS Nusantara ShlPS Actlvltles 1985]. Jakarta: BOPBERPAN, 1986.
Brooks, Mary R. Fleet Development and the Control of Shipping in Southeast Asia. Slngapore: Instltute of Southeast Asian Studles, 1985.
Bullock III, Charles S., James E. Anderson, and David W. Brady. PublicPolicy in the Eighties. Belmont, CA: Brooks/Cole, 1983.
Comitini, Salvatore, and Sutanto Hardjo1ukito. Indonesian MarineFisheries Development and Strategy Under Extended Maritlme Jurisdlctlon. Aono1u1u, AI: Envlronment and POllCY Instltute, East-WestCenter, 1983.
Considine, Douglas M., and Glenn D. Considine, eds. Food and FoodEncyclopedia. New York, NY: Van Nostrand Reinhold, 1982.
Couper, A. D. The Geography of Sea Transport. London: HutchinsonUniversity Llbrary, 1912.
Darby, H. C. Netherlands East Indies. Geographical Handbook Series.Cambridge: Naval Inte11lgence Dlvision, 1944.
De Boer, M. G., and J. C. Westermann. [en Halve Eeuw Paketvaart, 18911941 [A Half Century of Royal Packet Navlgatlon Company].~erdam: De Bussy, 1941.
Departemen Maritim. Laporan Fase Rahabilitasi Bulan Djanuari - Djuni1967 [Report on Rehabi1ltatlon Phase, January - June 1961J.Jakarta: Departemen Maritim, 1967.
Departemen Perhubungan. Rencana Pembangunan Lima Tahun KeempatDepartemen Perhubungan 1984/85-1988/89 [The Fourth Flve YearDevelopment Plan of the Depa~tment of Communications 1984/851988/89]. Jakarta: Departemen Perhubugan, 1984.
358
Departemen Perhubungan. Uraian Singkat Penyesuiaian Tarip JasaPerhubungan Sebagai AKlbat Turunnya Rarga BBM Tangga1 10 Ju1i 1986[Transportation Rate Adjustments Due to the Decrease of Oil Priceson July 10, 1986]. Jakarta: Departemen Perhubungan, 1986.
--------. Data dan Informasi Sektor Perhubungan 1984 [Data andInformatlon of Communication Sector 1984]. Jakarta: DepartemenPerhubungan, 1984.
--------. Bahan Nota Keuangan dan RAPBN 1983/1984 [Budgeting forCommunications Development 1983784]. Jakarta: DepartemenPerhubungan, 1983.
--------. Bahan Nota Keuangan dan PAPBN 1985/1986 [Budgeting forCommunlcatlons Development 1985/86]. Jakarta: DepartemenPerhubungan, 1985.
--------. Bahan Nota Keuangan dan RAPBN 1988/1989 [Budgeting forCommunlcatlons Development 1988/89]. Jakarta: DepartemenPerhubungan, 1988.
Department of Communications. Indonesian Communications in Brief.Jakarta: TOY, 1984.
Department of Information. indonesia 1988, An Official Handbook.Jakarta: Percetakan Negara R.I., 1988.
--------. Rencana Pembangunan Lima Tahun Pertama 1969/70-1973/74. [TheFirst Flve Year Development Plan 1969/70-1973/74]. Jakarta:Percetakan Negara R.I., 1969.
--------. Rencana Pembangunan Lima Tahun Kedua 1974/75-1978/79 [TheSecond Flve Year Development Plan 1974/75-1978/79]. Jakarta:Percetakan Negara R.I., 1974.
--------. Rencana Pembangunan Lima Tahun Ketiga 1979/80-1983-84 [TheThird Five Year Development Plan 1979/80-1983/84]. Jakarta:Percetakan Negara R.I., 1979.
--------. Rencana Pembangunan Lima Tahun Keempat 1984/85-1988/89[The Fourth Flve Year Development Plan 1984/85-1988/89]. Jakarta:Percetakan Negara R.I., 1984.
--------. Pe1ayaran National dan Penyatuan Wi1ayah [National Shippingand Terrltorlal Integratlon]. Jakarta: Direktorat Publikasi, 1980.
Dick, Howard W. The Indonesian Interisland Shipping Industry: AnAnalysis of Competltlon and Regulatlon. Slngapore: Instltute ofSoutheast ASlan Studles, 1987.
359
Direktorat Jenderal Perhubungan Laut. Petunjuk Angkutan Laut Indonesia1986 [Indonesian Shipping Directory 1986]. Jakarta: C. v. Sandaan,Tm.
--------. Ringkasan Laporan Akhir Tinjau Lanjut Angkutan Penumpang Lautdan Studl Relayakan Rapal Penumpang VIII dan Ix [A Summary of Flna1Reports on the Eva1uatlon of Passenger Flows and Feasibility Studyof Passenger Ships VIII and IX]. Jakarta: Direktorat JenderalPerhubungan Laut, 1988.
--------. Susunan Trayek Pelayaran Nusantara Tetap dan Teratur 1979-1983Shipping Routes for Nusantara Regular Llner Services, 1979-1983].Jakarta: Direktorat Jenderal Perhubungan Laut, 1979.
--------. Pola Trayek Pelayaran Lokal dan Penempatan Kapalnya [LocalShipping Routes and Allocation of Local ShlpS] Jakarta: DirektoratJendera1 Perhubungan Laut, 1983.
--------. Konsep Penataan Trayek 1988 [Organizing the 1988 Routes].Jakarta: Olrektorat Jendera1 Perhubungan Laut, 1988.
--------. Data &Statistik Angkutan Laut Indonesia 1972 [IndonesianSea Transport Statistlca1 Data 1972]. Jakarta: Dlrektorat JenderalPerhubungan Laut, 1973.
Direktorat Lalu Lintas Angkutan Laut. Himpunan Peraturan Angkutan Laut1969-1975 [A Collection of Shipping Regu1atlons 1969-1975].Jakarta: Direktorat Jendera1 Perhubungan Laut, 1986.
--------. Himpunan Peraturan Angkutan Laut 1975-1983 [A Collection ofShipping Regu1atlons 1975-1983]. Jakarta: Direktorat Jendera1Perhubungan Laut, 1986.
--------. Himpunan Peraturan Angkutan Laut 1983-1985 [A Collection ofShipping ~egulatlons 1983-1985]. Jakarta: Olrektorat JenderalPerhubungan Laut, 1986.
--------. Angkutan Laut Indonesia [Indonesian Sea Transport]. Jakarta:Direktorat Jemdera1 Perhubungan Laut, 1973.
Direktorat Perkapa1an dan Pe1ayaran. Laporan Tahunan 1974/1975 [AnnualReport 1974/1975]. Jakarta: Direktorat Jenderal Perhubungan laut,1975.
Economic Office of ADB. Key Indicators of Developing Member Countl~ies
of ADB. Manila: Asian Development Bank, 1987.
--------. Key Indicators of Developing Member Countries of ADS. ~lani1a:
Asian Development Bank, 1988.
360
Fryer, Donald W. World Economic Development. New York, NY: McGraw-Hill,1965.
---------. Emerging Southeast Asia: A Study in Growth and Stagnation.London: George Ph1 11p and Son, 1970.
Gabungan Importir Seluruh Indonesia. Buku Tarif Angkutan Laut danKepelabuhanan Tahun 1973 [Freight Rates and Port Fees 1973].Jakarta: GINsI, 1973.
Goodal, Brian. Dictionary of Human Geography. Harmondsworth:Penguin Books, 1987.
Hartshorne, Richard. "Political Geography." In American GeographyInventory and Prospect, ed. Preston E. James and Clarence F. Jones,167-225. Syracuse: Syracuse University Press, 1954.
Indonesian Shipowners Association. The Outlook of Inter-Island SeaTransportation. Jakarta: INSA, 1968.
Kendal, Lane C. The Business of Shipping. Centreville, MD: CornellMariti me Press, 1979.
Koentjaraningrat. Bunga Rampai Kebudayaan, Mentalitet dan Pembangunan[The Anthology of Culture, Menta11ty and Development]. Jakarta:Gramedia, 1974.
Lauriat, George. "Shipping." In Marine Policy in Southeast Asia, ed.George Kent and Mark J. Valenc1a, 188-299. Berkeley, CA:University of California Press, 1985.
Lawrence, Samuel A. International Sea Transport: The Years Ahead.Lexington, MA: D. C. Heath, 1972.
Pusat Pene1itian dan Pengembangan Perhubungan Laut. Suatu TanggapanTerhadap Pengadaan Kapa1-Kapal Caraka Jaya [An Evaluation of theBU11d1ng of caraka Jaya ships]. Jakarta: Badan LITBANG DepartemenPerhubungan, 1985.
Lloyd's Register of Shipping. Register of Ships 1986-87. London:Lloyd's Register of Shipping, 1986.
Marine Research Institute Netherlands and P. T. Po1iteknik Jakarta.General Aspects of Cargo Unitization and Finding and Recommendations1n Relatlon to Cargo Unitizat10n. Jakarta: Directorate Generalof Sea Communications, 1987.
Morgan, Joseph R. Navigation in Southeast Asian Waters: Physical andPolitical Hazards. Honolulu, HI: Env1ronment and Pollcy Instltute,East-West Center, 1981.
361
Morgan, Joseph R. Marine Region and Regionalism in Southeast Asia.Honolulu, HI: Envlronment and P011CY Institute, East-West Center,1984.
---------, and Mark J. Valencia. Atlas for Marine Policy in SoutheastAsian Seas. Berkeley, CA: Un;verslty of california Press, 1983.
--------, and Donald W. Fryer. "The Marine Geography of Southeast Asia."In Marine Policy in Southeast Asia, ed. George Kent and Mark J.Valencla, 9-32. Berkeley, CA: University of California Press, 1985.
Munby, Denys L. Transport: Selected Readings. Hardmondsworth: PenguinBooks, 1968.
Proyek Armada Perintis. Laporan Tahunan Pengoperasian Armada Perintis1985/1986 [Annual Report on the Operatlon of Ploneer Fleet 1985786].Jakarta: Direktorat Jenderal Perhubungan Laut, 1986.
Rimmer, Peter J. "Government Influence on Transport Decision-makingin Thailand." In Transportation Geography: Comments and Readings,ed. Michael E. Eliot Hurst, 292-313. New York, Ny: McGraw-AlI1,1974.
Sampson, Roy J., Martin T. Farris, and David L. Shrock. DomesticTransportation: Practice, Theory, and Policy. 5th ed. Boston,MA: Houghton Mlff1ln, 1985.
Sandy, I Made. Atlas Indonesia. 4th ed. Jakarta: Geografi, FIPIA UI,1979.
Savaes, Jan. Communication and Development. Netherlands: ACCO, 1983.
Schumer, Leslie A. Elements of Transport. 3d ed. Sydney: Butterworths,1974.
Team Pengendali dan Pengawas Uji Coba ILS. Laporan Evaluasi PelaksanaanUji Coba ILS [Report on Evaluation of ILS Trla1s]. Jakarta:Olrektorat Jenderal Perhubungan Laut, 1986.
Thomson, Frederick, and L. R. Jones. Regulatory Policy and Practices:Regulating Better and Regulating Less. New York, Ny: Praeger, 1982.
Ullman, Edward L. "Geography as Spatial Interaction." In TransportationGeography: Comments and Readings, ed. Michael E. Eliot Aurst, 29-40.New YorK, NY: McGraw-A"" 1974.
U.S. Defense Mapping Agency (DMA). Sailing Directions (Enroute) fer theStrait of Malacca and Sumatera. DMA Stock No. sDPGe 174, 2d ed.Wash,ngton, D.C.: DMA Hydrographic/Topographic Center, 1982.
362
Wernstedt, Frederick L. The Role and Importance of Philippines Interisland Shipping and trade. Ithaca, Ny: Southeast ASla Program,Department of Far Eastern Studies, Cornell University, 1957.
Whitaker, J. Russell. "The Geography of Resources." In AmericanGeography Inventory and Prospect, ed. Preston E. James andClarence F. Jones, 226-39. Syracuse: Syracuse University Press,1954.
Zainu'ddin. A Short History of Indonesia. Sydney: Cassel, 1968.
Journals, Bulletins, and Magazines
Ali, Shamser. "Inter-Island Shipping." Bulletin of IndonesianEconomic Studies 3 (February 1966): 27-51.
Biro Pusat Statistik (BPS). Indikator Ekonomi [Economic Indicator](December 1985).
-------- Indikator Ekonomi [Economic Indicator] (December 1986) .
-------- Indikator Ekonomi [Economic Indicator] (December 1987) .
-------- Indikator Ekonomi [Economic Indicator] (April 1988) .
-------- Indikator Ekonomi [Economic Indicator] (July 1988).
Chinnery, Kevin. "Trade First, Again." Lloyd's Maritime Asia(March 1989): 17-21.
Dick, Howard W. "Prahu Shipping in Eastern Indonesia Part 1."Bulletin of Indonesian Economic Studies 11 (July 1975): 69-107.
--------. "Prahu Shipping in Eastern Indonesia' Part II."Bulletin of Indonesian Economic Studies 11 (November 1975): 81-103.
--------. "Interisland Shipping: Progress, Problems and Prospects."Bulletin of Indonesian Economic Studies 21 (August 1985): 95-114.
--------. "Prahu Shipping in Eastern Indonesia in the Interwar Period."Bulletin of Indonesian Economic Studies 23 (April 1987): 104-21.
Dja1a1, Hasjim. "The 1982 Law of the Sea Convention: A Southeast AsianPerspective." The Indonesian Quarterly 13 (January 1985): 59-73.
Djiwandono, A. Sudiharto. "The General Election and PoliticalEducation." The Indonesian Quarterly 10 (October 1982): 27-38.
Hadad, Toriq, and Linda Djalil. "Tua-Tua Layarkan Saja" [Oid ShipsSail Again]. Tempo, 13 February 1988, 94.
363
Hughes, David. "The Prahu and Unrecorded Inter-Island Trade."Bulletin of Indonesian Economic Studies 22 (August 1986): 103-13.
Kusumaatmadja, Mochtar. "HIe Concept of the Indonesl an Archipelago."The Indonesian Quarterly 10 (October 1982): 12-26.
National Development Information Office. "Repel ita IV Plans MajorExpansion of Transport and Communication Sectors." IndonesiaDevelopment News 8 (September 1984): 4-8.
--------- "Post-Devaluation Package: New Measures Aimed at StimulatingEconomy." Indonesia Development News 10 (September/October 1986):1-2.
Pelni. "Improvement of Sea Transport Services." Warta Ekonomi Maritim(December 1985/January 1986): 15-17.
Rutz, W. "Indonesia's Sea Transport System--A Series of Maps."Geo Journal 14.4 (1987): 491-502.
Sugiarto, April ani . "The Indonesian Environment Problems and Prospectsfor National Development." Prisma 39 (March 1986): 14-26.
Soehoed, A. R. "Reflection on Industrialization and Industrial Policyin Indonesia." Bulletin of Indonesian Economic Studies 24 (August1988): 43-57.
The Economist Intelligence Unit. "Country Profile: Indonesia."Quarterly Economic Review of Indonesia (Annual Supplement 1987-88).
Newspapers
Kompas (Jakarta). Sabtu, 9 July; Selasa, 22 November; Rabu, 23 November;Minggu, 27 November; Senin, 26 December 1988.
--------. Senin, 2 January; Selasa, 31 January; Kamis, 2 February;Sabtu, 4 February 1989.
Suara Pembaruan (Jakarta). Kamis, 9 February 1989.
Unpublished Materials
Director General of Sea Communications. Perhubungan Laut [SeaCommunicationsJ. Paper presented at the Workshop of the Departmentof Communications, Jakarta, December 16-18, 1985.
364
Jafaar, Abu Bakar. "Prospects for Marine Regionalism in the Malaccaand Singapore Straits." Ph.D. Diss., University of Hawaii,May 1984.
Hikam, Muhammad A. S. "Conmunication and Rural Development in Indonesia:A Framework for Policy." M.A. Thesis, University of Hawaii,August 1987.