Embed Size (px)
Citation preview
Contamination and galvanic corrosion inmetal chemical-mechanical planarization
Item Type text; Dissertation-Reproduction (electronic)
Authors Zhang, Liming, 1966-
Publisher The University of Arizona.
Rights Copyright © is held by the author. Digital access to this materialis made possible by the University Libraries, University of Arizona.Further transmission, reproduction or presentation (such aspublic display or performance) of protected items is prohibitedexcept with permission of the author.
Download date 31/05/2018 07:25:10
Link to Item http://hdl.handle.net/10150/282840

INFORMATION TO USERS
This manuscript has been reproduced from the microfihn master. UMI
films the text directly from the original or copy submitted. Thus, some
thesis and dissertation copies are in typewriter face, while others may be
from any type of computer printer.
The quality of this reproduction is dependent upon the quality of the
copy submitted. Broken or indistinct print, colored or poor quality
illustrations and photographs, print bleedthrough, substandard margins,
and improper alignment can adversely affect reproduction.
In the unlikely event that the author did not send UMI a complete
manuscript and there are missing pages, these will be noted. Also, if
unauthorized copyright material had to be removed, a note will indicate
the deletion.
Oversize materials (e.g., maps, drawings, charts) are reproduced by
sectioning the original, beginning at the upper left-hand comer and
continuing from left to right in equal sections with small overlaps. Each
original is also photographed in one exposure and is included in reduced
form at the back of the book.
Photographs included in the original manuscript have been reproduced
xerographically in this copy. Higher quality 6" x 9" black and white
photographic prints are available for any photographs or illustrations
appearing in this copy for an additional charge. Contact UMI directly to
order.
UMI A Bell & Howell Infonnalion Company
300 North Zeeb Road, Ann Aibor MI 48106-1346 USA 313^761-4700 800/521-0600

CONTAMINATION AND GALVANIC CORROSION IN METAL
CHEMICAL-MECHANICAL PLANARIZATION
by
Liming Zhang
Copyright® Liming Zhang 1998
A Dissertation Submitted to the Faculty of the
DEPARTMENT OF MATERL^ULS SCIENCE AND ENGINEERING
In Partial Fulfillment of the Requirements
For the Degree of
DOCTOR OF PHILOSOPHY
In the Graduate College
THE UMVERSITY OF ARIZONA
1998
DMI Number: 9912147
Copyright 1998 by Zhang, Liming
All rights reserved.
UMI Microform 9912147 Copyright 1999, by UMI Company. All rights reserved.
This microform edition is protected against unauthorized copying under Title 17, United States Code.
UMI 300 North Zeeb Road Ann Arbor, MI 48103
THE UNIVERSITY OF ARIZONA ® GRADUATE COLLEGE
As members of the Final Examination Committee, we certify that we have
read the dissertation prepared by Liming Zhang
entitled CONTAMINATION AND GALVANIC CORROSION IN METAL
CHEMICAL-MECHANICAL PLANARIZATION
and recommend that it be accepted as fulfilling the dissertation
requirement for the Degree of Doctor of Philosophy
L£1
^ Date
Palusinski Date
£er Date
^ — \ Y
J . I F . O'Hanlon Date
Final approval and acceptance of this dissertation is contingent upon the candidate's submission of the final copy of the dissertation to the Graduate College.
I hereby certify that I have read this dissertation prepared under my direction and recommend that it be accepted as fulfilling the dissertation requirement.
//• Dissertation Director s. Raghavan
y ^ j y
Date /
3
STATEMENT BY AUTHOR
This dissertation has been submitted in partial fulfillment of requirements for an
advanced degree at The University of Arizona and is deposited in ths University Library
to be made available to borrowers imder rules of the Library.
Brief quotation from this dissertation are allowable without special permission,
provided that accurate acknowledgement of source is made. Requests for permission for
extended quotation from or reproduction of this manuscript in whole or in part may be
granted by the copyright holder.
SIGNED:

4
Acknowledgements
First of all, I am deeply indebted to my advisor. Professor Srini Raghavan, for his
support and guidance. Without Dr. Raghavan's help and encouragement, it is impossible
for this research to be in the present form. Dr. Raghavan always gives his students
guidance and support I feel privileged to have worked with him.
I would like to thank Professors K.A. Jackson, P. Deymier, O.A. Palusinski, J.F.
O'Hanlon for serving on my dissertation committee. I would also like to thank my
fellows in the group, whose helps not only make my experiments proceed smoothly but
also bring me more memorable and invaluable experiences. Many supports from Dr. C.
Raghunath especially during the initial stage of my program are acknowledged. My
thanks also go to Ms. Yuxia Sun, who joined me in several contamination experiments
and helped me with the modeling of copper contamination, and to Dr. J. Jeon, who
generously provided analyses for many samples. Mr. B. Vermeire's help with the use of a
wet bench has made many of my experiments more productive. I am also grateful to Drs.
D. Hymes and E. Zhao at Lam Research Corp. for providing an opportunity for me to
gain a lot of practical experiences during a simimer program. Ms. Jennifer Huang
proofread the first draft of my dissertation. The present study resulted from several
projects supported by Micron Technology, Inc., Sandia National Lab., and Sematech.
Most of all, I want to thank my wife, Yan, and my son, Michael. With your love, I
have an enjoyable and meaningful family life and our bright future becomes possible. I
also want to thank all my family members in China- Especially, I am indebted to my
parents for their unconditional love and support. Finally, I would like to dedicate this
work to my Mom, Ms. M. Yao (1926-1995).
5
TABLE OF CONTENTS
Page
List of Illustrations 9
List of Tables 15
Abstract 17
1. Introduction 19
1.1. Introduction 19
1.2. Objectives of Study 25
2. CMP and Post-CMP Cleaning 26
2.1. CMP for Metal Interconnect Structures 26
2.1.1. Metal Interconnect Structures 26 2.1.2. CMP processing 30 2.1.3. Models and Mechanisms of CMP 35
2.1.3.1. Mechanical 35 2.1.3.2. Chemical 37
2.2. Post-CMP Cleaning 41
2.2.1. Chemical Cleaning 44 2.2.1.1. SC1 Solutions 44 2.2.1.2. Organic Complexants 48
2.2.2. Megasonic Cleaning 49 2.2.3. Scrubbing 52
3. Contamination and Galvanic Corrosion in CMP 55
3.1. Particulate Contamination 57
3.1.1. Double Layer and Zeta Potential 57 3.1.2. Interaction Energies 62 3.1.3. Particle Embedding 67 3.1.4. Modeling of Particle Deposition in Solutions 70
3.2. Metallic Contamination 74
3.2.1. General Aspects 74 3.2.2. Surface Complexation 75
6
TABLE OF CONTENTS — Continued
Page
3,3. Galvanic Corrosion 78
3.3.1. Electrochemistry 78 3.3.2. Galvanic Coupling 85
4. Experimental 88
4.1. Materials 88
4.1.1. Wafers 88 4.1.2. Chemicals and Slurries 88 4.1.3. Polishing Pads 89
4.2. Methods 90
4.2.1. Pretreatment of Wafer Samples 90 4.2.2. Electrokinetic Measurements 90
4.2.2.1. Electrophoresis 90 4.2.2.2. Streaming Potential 91
4.2.3. Uptake Measurements of Organic Acids by Particles 91 4.2.4. Contamination Experiments 93
4.2.4.1. Particle Deposition 93 4.2.4.2. Metal Contamination 93
4.2.5. Wafer Polishing 94 4.2.6. Surface Cleanliness Analyses 94
4.2.6.1. Particulate Contamination 94 4.2.6.2. Metal Contamination 95
4.2.7. Electrochemical Tests 95 4.2.8. Others 97
4.2.8.1. Determination of Dissolution of Alumina 97 4.2.8.2. Film Removal Rate Measurements 98 4.2.8.3. Surface Area Measurements of Particles 98 4.2.8.4. Surface Complexation Modeling 98
5. Use of Citric Acid during Tungsten CMP 100
5.1. Chemistry of Citric Acid Solutions 100
5.2. Interaction between Citric Acid and Alumina Particles 101
5.2.1. Uptake Measurements 101 5.2.2. Maintaining pH 103
7
TABLE OF CONTENTS — Continued
Page
5.2.3, Alumina Dissolution 105 5.2.4. Mechanism 107
5.3. Effect of Citric Acid on Alumina Particulate Contamination 114
5.3.1. Immersion Deposition 114 5.3.2. Polishing Experiments 121 5.3.3. Citric Acid as Cleaning Solution 123 5.3.4. Interaction Energy between Particles and Wafer Surfaces 126
5.4. Electrochemical Tests of Tungsten in Citric Acid Solutions 132
5.5. Concltisions 134
6. Use of Malonic Acid during Tungsten CMP 136
6.1. Chemistry of Malonic Acid Solutions 136
6.2. Interaction between Malonic Acid and Alumina Particles 137
6.2.1. Uptake Measurements 137 6.2.2. Maintaining pH 143 6.2.3. Alumina Dissolution 145
6.3. Polishing Experiments 145
6.3.1. Alumina Contamination 145 6.3.2. Removal Rates 150
6.4. Electrochemical Tests of Tungsten in Malonic Acid Solutions 152
6.5. Discussion 156
7. Copper Contamination of Silicon Dioxide Surfaces 160
7.1. Streaming Potential Measurements 160
7.2. Immersion Contamination 164
7.3. Surface Complexation Modeling 173
7.4. Conclusions and Discussion 175
7.4.1. Copper Contamination 175 7.4.2. Electrokinetics 178
8
TABLE OF CONTENTS — Continued
Page
7.4.3. Effect of Additives 179
8. Galvanic Corrosion in Metal CMP 181
8.1. Galvanic Contact between Tungsten and TiN 181
8.2. Galvanic Contact between Copper and Tantalum 192
8.2.1. Acidic Solutions 195 8.2.2. Alkaline Solutions 198
8.3. Conclusions and Discussion 201
9. Concluding Remarks 204
Appendix 1. Stability Constants of Some Metal Ion Complexes of Organic Compounds 206
References 207

9
LIST OF ILLUSTRATIONS
Page
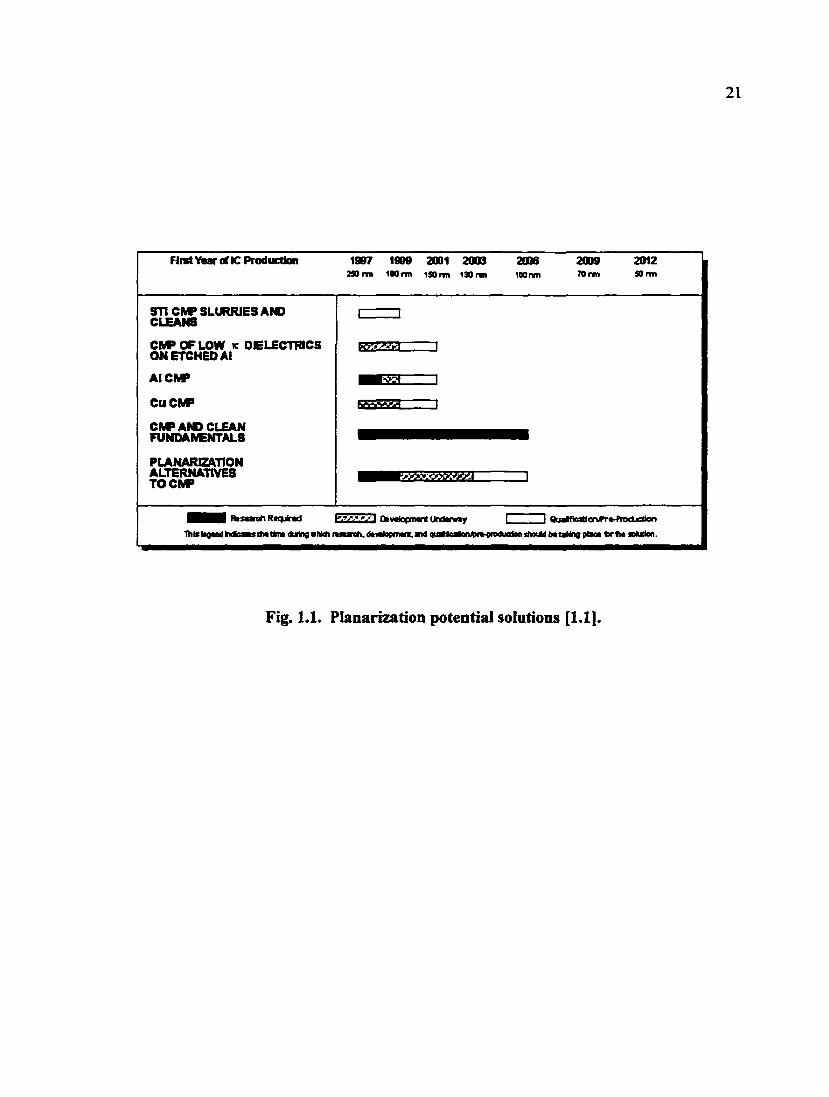
Fig. 1.1. Planarization potential solutions 21
Fig. 1.2. Calculated gate and interconnect delay vs. technology generation 23
Fig. 2.1. Schematic of CMP of tungsten structures 27
Fig. 2.2. Schematic of copper metallization structure 29
Fig. 2.3. Measurement of planarity 31
Fig. 2.4. Schematic of a CMP machine 33
Fig. 2.5. Reaction sequence for oxide CMP 38
Fig. 2.6. A model for metal CMP 40
Fig. 2.7. Speciation in SCI solutions as a function of NH4OH content 47
Fig. 2.8. A comparison between megasonic forces and van der Waals forces as a function of particle diameter 51
Fig. 2.9. A comparison between megasonic forces and van der Waals forces as a fimction of particle-siuface separation 51
Fig. 3.1. Schematic of the electrostatic double layer around a positively charged particle in solutions 58
Fig. 3.2. Zeta potential measurement using electrophoretic technique 61
Fig. 3.3. Zeta potential measurement using streaming potential technique 61
Fig. 3.4. Zeta potential measurements of alumina particles, TOX film, CVD tungsten film, and PVD copper film film in lO' M KNO3 solutions 63
Fig. 3.5. Schematic plot of interaction energy (W) vs. separation (D) 66
Fig. 3.6. Geometiy of an embedded particle into the wafer surface during CMP 68
Fig. 3.7. Modified model for particle deposition 73
Fig. 3.8. Eh-pH diagram of silicon - water system at 298 K 80
Fig. 3.9. Eh-pH diagram of aluminum - water system at 298 K 80
Fig. 3.10. Schematic of polarization curves 82
10
LIST OF ILLUSTRATIONS - Continued
Page
Fig. 4.1. A schematic sketch of the streaming potential cell for wafer samples 92
Fig. 4.2. Experimental set-up for 3-electrode cell electrochemical tests 96
Fig. 5.1. Calculated dissociation of citric acid 102
Fig. 5.2. Uptake kinetics of citric acid by alimiina (20.0 g/1 Cerac alumina in 0.001 M KNOj at pH=4.0. Initial citric acid concentration: 400 ppm) 102
Fig. 5.3. Uptake of citric acid by alumina (20.0 g/1 alumina in 0.001 MKNO^ solution at pH=4.0). Also shown are zeta potentials of alumina under the same conditions and the fit of the uptake data to the Langmuir isotherm 104
Fig. 5.4. Effect of pH on uptake of citric acid by alumina (20.0 g/1 alimiina in 0.001 M KNOj solution at pH=4.0. Initial concentration if citric acid: 100 ppm.). Also shown are zeta potentials of alumina in the presence and absence of 100 ppm citric acid 104
Fig. 5.5. pH measurements of citric acid solutions and alumina (20.0 g/1) slurries containing citric acid. Also shown is calculated curve for solution pH based on pKa values of citric acid 106
Fig. 5.6. Effect of citric acid concentration on the amount of dissolved aluminum (20.0 g/1 alumina in 0.001 M KNOj at pH=4.0) 106
Fig. 5.7. Calculated speciation in the slurry of amorphous A1(0H)3 113
Fig. 5.8. Distribution of major species as a function of pH for a 1:1 molar ratio of citric acid to Al^"^ (total analytical concentration of each component 0.002 ^ 113
Fig. 5.9. Schematic of citric acid adsorption onto alimiina surface 115
Fig. 5.10. SEM micrographs of thin oxide (100 A) samples contaminated in 0.025 g/1 alumina slurries with different bias conditions after 2 cycle immersion/emersion cleaning in DI water, (a) Cathodic lOV; (b) no bais; (c) anodic lOV 115
11
LIST OF ILLUSTRATIONS - Continued
Page
Fig. 5.11. SEM micrographs of thin oxide (100 A) samples contaminated in 2.0 g/1 alumina slurries (pH=4.0) containing citric acid followed by cleaning in DI water. Citric acid concentration (in ppm): (a) 0, (b) 5, (c) 200, (d) 2000 117
Fig. 5.12. Distribution of particles on wafers contaminated in 2.0 g/1 alumina slurries containing different amounts of citric acid. Samples were cleaned in DI water aiter a 10 min inunersion in the slurry 118
Fig. 5.13. SEM micrographs of tungsten samples and BPSG siirfaces patterned with tungsten plugs contaminated in 2.0 g/1 alumina slurry without and with 2000 ppm of citric acid followed by DI rinsing 120
Fig. 5,14. SEM micrographs of oxide samples polished on a Minimet® polisher with citric acid in 20.0g/l alimiina slurries, (a) 100 ppm, pH=4.0; (b) 50 ppm, pH=4.0; (c) 20 ppm, pH=4.0; (d) 100 ppm, pH=2.5 122
Fig. 5.15. SEM micrographs of tungsten samples polished on a Minimet* polisher with citric acid in 20.0g/l alumina slurries, (a) 100 ppm, pH=4.0; (b) 50 ppm, pH=4.0; (c) 20 ppm, pH=4.0; (d) 100 ppm, pH=2.5 122
Fig. 5.16. SEM micrographs of oxide samples polished on a Minimet® polisher with 20.0g/l alimiina slurries with 4.5% H2O2 at pH=4.0 without (a) and with (b) 100 ppm citric acid 124
Fig. 5.17. SEM micrographs of thin oxide (100 A) samples contaminated in 2.0 g/1 alximina slurries (pH=4.0) followed by cleaning in different concentration citric acid solutions 124
Fig. 5.18. SEM microgr^hs of thin oxide (100 A) samples contaminated in 2.0 g/1 alumina slurries (pH=4.0) followed by cleaning in citric acid solutions and then in DI water 127
Fig. 5.19. Calciilated interaction energy between alumina particle (0.2 {im in radius) and wafer surface in 0.01 M KNO3 (+ 20.0 g/1 Cerac alumina) at pH=4 with and without citric acid, (a) Silica surface, (b) tungsten surface 129
12
LIST OF ILLUSTRATIONS - Continued
Page
Fig. 5.20. Potentiodynamic polarization of tungsten films in the presence of citric acid with and without hydrogen peroxide 133
Fig. 6.1. Calculated speciation in malonic acid solution 138
Fig. 6.2. Uptake kinetics of malonic acid by alumina (20.0 g/1 alumina in 0.001 M KNO3 at pH=4.0. Initial malonic acid concentration; 100 ppm.) 138
Fig. 6.3. Uptake of malonic acid by alumina (20.0 g/I alumina in 0.001 M KNOj solution at pH = 4.0). Also shown are zeta potentials of alimiina under the same conditions and the fit of the uptake data to the Langmuir isotherm 140
Fig. 6.4. Effect of slurry pH on uptake of malonic acid and zeta potential of alumina (100 ppm malonic acid in 20.0 g/1 alumina slurry) 142
Fig. 6.5. pH measurements of malonic acid solutions and alimiina (20.0 g/1) slurries containing malonic acid. Also shown is a calculated curve for solution pH based on pKa values of malonic acid 144
Fig. 6.6. Effect of malonic acid concentration on the amount of dissolved aiiiminum (20.0 g/1 alumina in 0.001 M KNO3 at pH=4.0) 146
Fig. 6.7. SEM micrographs of CVD tungsten and oxide samples polished with 20.0 g/1 alumina slurries containing different concentrations of malonic acid at pH=4.0 148
Fig. 6.8. SEM micrographs of CVD timgsten and oxide samples polished with 20.0 g/1 alumina slurries containing 100 ppm malonic acid at different pH values 148
Fig. 6.9. SEM micrographs of CVD tungsten and oxide samples polished with 20.0 g/1 alumina slurries containing 15% hydrogen peroxide and different amounts of malonic acid at pH=4.0 149
Fig. 6.10. Effect of malonic acid on removal rate of tungsten during polishing with alumina slurries (20.0 g/1 Cerac alumina powder in 0.001 M KNO3 solution, pH=4.0) 151
Fig. 6.11. OCP vs. time of tungsten in the presence of malonic acid and 0.01 M KNO3 at pH = 4.0 153
13
LIST OF ILLUSTRATIONS - Continued
Page
Fig. 6.12. Potentiodynamic polarization of tungsten films in the presence of malonic acid with and without hydrogen peroxide 155
Fig. 6.13. Schematic of the charge reversal of alumina surface due to malonic acid adsorption 157
Fig. 7.1. Streaming potential measurements on TOX wafers in 0.001 M KNO3 at different concentrations of Cu^* 161
Fig. 7.2. Streaming potential measurements of TOX wafers in 0.001 M KNO3 in the presence of Cu^* at pH=7.1 163
Fig. 7.3. Streaming potential measurements of TOX wafers in 10 ppm Cu^* + 0.001 M KNO3 with different amounts of citric acid at pH=7.1 165
Fig. 7.4. Copper concentration on TEOS wafers contaminated in Cu^* containing solutions 165
Fig. 7.5. Calculated speciation in the slurry of Cu(0H)2 168
Fig. 7.6. Copper concentration on TEOS wafers contaminated in 20 ppm Cu^" (pH=6.0) solutions with hydrogen peroxide after rinsing and drying 171
Fig. 7.7. Copper concentration on TEOS wafers contaminated in Cu^"^ + 5% H2O2 solutions after rinsing and drying 171
Fig. 7.8. Copper concentration on TEOS wafers contaminated in 100 ppm Cu^^ + 2% H2O2 solutions with citric acid after rinsing and drying 172
Fig. 7.9. Copper concentration on TEOS wafers contaminated in Cu^"^ solutions at pH=4.0 after drying 176
Fig. 7.10. Schematic of the adsorption of hydrated cupric ions onto silica surface 176
Fig. 8.1. OCP vs. time of TiN and tungsten films in 0.0IM KNO3 solutions with and without oxidants 183
Fig. 8.2. Potentiodjoiamic curves of TiN and tungsten films in O.OIM KNO3 solutions with and without oxidants 185
Fig. 8.3. Galvanic corrosion current density between TiN and tungsten 189
14
LIST OF ILLUSTRATIONS - Continued
Page
Fig. 8.4. Galvanic corrosion potential between TiN and tungsten 190
Fig. 8.5. SEM micrographs of tungsten films after galvanic contact with TiN in O.OIM KNOj solutions with and without oxidants for 30 min 193
Fig. 8.6. Eh-pH diagram of copper - water system at 298 K 193
Fig. 8.7. Eh-pH diagram of copper - ammonium - water system at 298 K 194
Fig. 8.8. Eh-pH diagram of tantalum - water system at 298 K 194
Fig. 8.9. Potentiodynamic curves of tantalum and copper films in O.OIM KNOj solutions with and without additives at pH = 4.0 196
Fig. 8.10. Potentiodynamic curves of tantalum and copper films in 1% NH4OH + O.OIM KNO3 solutions with and without additives 199
15
LIST OF TABLES
Page
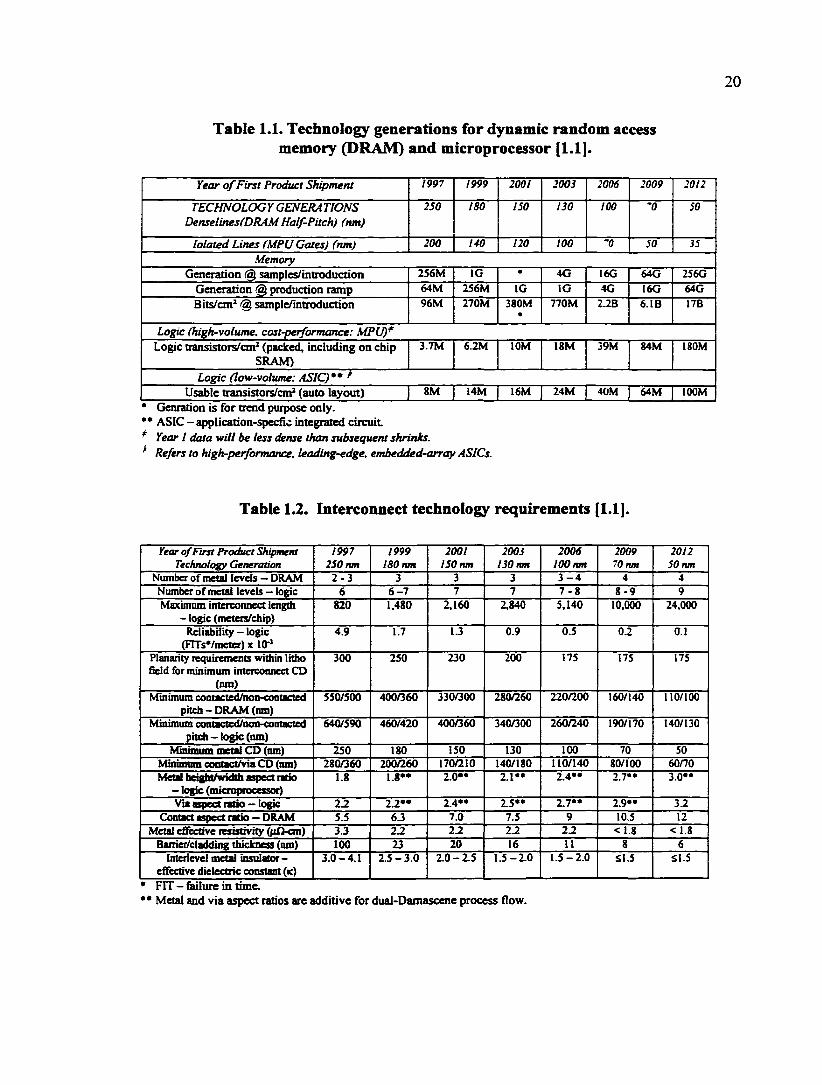
Table 1.1. Technology generations for dynamic random access memory (DRAM) and microprocessor 20
Table 1.2. Interconnect technology requirements 20
Table 1.3. Surface preparation technology requirements 24
Table 2.1. Degrees of planarity 32
Table 2.2. Standard RCA cleaning method for silicon wafers 42
Table 2.3. Cleaning solutions for silicon wafers 43
Table 2.4. A simplified cleaning recipe 49
Table 3.1. Contamination after CMP 55
Table 3.2. Effects of contaminants on semiconductor manufacturing 56
Table 3.3. Reported PZC values of some materials 59
Table 3.4. Some parameters of tungsten, copper, and tantalum 83
Table 5.1. Calculation of AG based on the Stem-Grahame equation 110 spec.
Table 5.2. Image analyses of oxide surfaces contaminated in citric acid containing slurries (pH = 4.C) and rinsed with DI water after contamination 119
Table 5.3. Image analyses of contaminated oxide smfaces cleaned using citric acid solutions 125
Table 5.4. Hamaker constants of interest to tungsten CMP 128
Table 5.5. Zeta potentials used in the calculation of the electrostatic interaction energy (at pH=4) 130
Table 6.1. Calculation of AC/® based on Stem-Grahame equation 143 spec.
Table 6.2. Comparison between citric acid and malonic acid 158
Table 7.1. Copper concentration on TEOS wafers contaminated in 5 ppm Cu^"^ + 5% H2O2 solutions (in atoms/cm^ 169
16
LIST OF TABLES — Continued
Page
Table 7.2. Copper concentration on TEOS wafers contaminated in 5 ppm Cu^^ soliitions after rinsing and drying (in atoms/cm^ 169
Table 7.3. Copper concentration on TEOS wafers contaminated in Cu^^ solutions at pH =9.0 after rinsing and drying (in atoms/cm^ 173
Table 7.4. Parameters used in surface complexation modeling 174
Table 7.5. Complexation reactions between cupric - citric acid and cupric -silica surface 180
Table 8.1. Reduction reactions and standard potentials of the oxidants 182
Table 8.2. Driving force for galvanic corrosion between tungsten and TiN in O.OIM KNOj solutions containing oxidants 184
Table 8.3. Corrosion data for tungsten films in O.OIM KNO3 solutions containing oxidants 188
Table 8.4. Corrosion data for tungsten films coupled with TiN in O.OIM KNOj solutions containing oxidants 191
Table 8.5. Driving force for galvanic corrosion between tantalum and copper 198
Table A-1. Stability Constants of Some Metal Ion Complexes of Organic Compounds 206
17
ABSTRACT
Chemical mechanical pianarization (CMP) of metals is a critical process in the
manufacturing of ultra-large scale integrated (ULSI) circuit devices. The overall success
of a CMP process requires minimal particulate and metallic contamination of the
structures subjected to CMP. The objective of this study was to investigate alumina
particle contamination during tungsten CMP, copper contamination in copper CMP, and
galvanic corrosion between metal films and adhesion layers during the final stages of
tungsten and copper CMP. Particular attention was paid to the use of short chain organic
carboxylic acids in reducing the contamination.
Both electrokinetic and uptake measurements showed that citric acid and malonic
acid interact with alumina particles by electrostatic as well as specific adsorption forces.
Systematic immersion contamination and polishing experiments were carried out to
demonstrate the effectiveness of the acids in controlling alumina particulate
contamination on wafer surfaces. The difference in the surface cleanliness was interpreted
using the electrokinetic data and the calculated interaction energy between alumina
particles and the wafer surface. Electrochemical tests showed no severe attack on
tungsten films by the acids.
Copper ions were found to adsorb onto the silicon dioxide surface, leading to
copper contamination levels of upto 10" atoms/cm^. The extent of copper contamination
was found to depend on the solution pH and the presence of additives such as hydrogen
peroxide. Both electrokinetic measurements and immersion contamination experiments
18
showed that citric acid can reduce the copper contamination on the silicon dioxide
surface.
TiN is more noble than tungsten in the solutions containing oxidants used in
tungsten CMP slurries. The most significant corrosion of tungsten was found in the
presence of hydrogen peroxide. Copper was found to be more noble than tantalum in
acidic solutions. However, in alkaline ammonium hydroxide solutions, the relative
nobility of copper and tantalum can be reversed by adding hydrogen peroxide. The
corrosion of tungsten and copper appears to be very minimally affected by coupling with
TiN and tantalum, respectively.

19
Chapter I
INTRODUCTION
l.l. Introduction
The continual shrinkage of the feature size and the increase of interconnect levels
in ultra-large scale integrated (ULSI) circuit devices, as indicated by the Semiconductor
Industry Association (SIA) Roadmaps [1.1] (Tables 1.1 and 1.2), require sophisticated
methods to planarize the surface of wafers for the subsequent process. In sub-0.25 {im
integrated circuit (IC) processes, a lack of planarity causes severe problems for
lithography using very short depth of focus.
Several methods have been used to achieve a high level of planarization on a
wafer surface. Conventional planarization methods include etchback, polishing, laser
reflow, spin-on coating [1.2]. However, these methods do not give the required planarity
across the entire wafer surface area for advanced processes of ULSI devices. Currently,
although there are researches on alternative planarization solutions, chemical-mechanical
planarization (CMP) is accepted as the only viable method for achieving global planarity
for ULSI devices with a feature size of 0.25 jun and below (Fig. 1.1).
Metallization is one of the key processes in making ULSI devices [1.3]. Metal
conductors in IC devices can be deposited through chemical vapor deposition (CVD),
20
Table 1.1. Technology generations for dynamic random access memory (DRAM) and microprocessor [1.1].
Year of First Product Shipment 1997 1999 2001 2003 2006 2009 2012
TECHNOLOGY GENERA TIONS Denselines(DRAM Half-Pitch) (nm)
250 180 150 130 too •0 50
lolated Lines (MPU Gates) (nm) 200 140 120 100 '0 50 35
Memory Generation @ samples/introduction 256M IG • 4G I6G 64G 256G
Generation @ production ramp 64M 2S6M IG IG 4G I6G 64G
Bits/cm' @ sample/introduction 96M 270M 380M «
770M 2JB 6.1B 17B
Logic (high-volume, cost-performance: MPU)' Logic transistors/cm' (packed, including on chip
SRAM) 3.7M 6.2M lOM ISM 39M g4M UOM
Logic (low-volume: ASIC)** Usable transistors/cm' (auto layout) 8M 14M 16M 24M 40M 64M lOOM
* Genration is for trend purpose only. ** ASIC - application-specfic integrated circuit Year I data will be less dense than subsequent shrinks. Refers to high-performance, leading-edge, embedded-array ASICs.
Table 1.2. Interconnect technology requirements [1.1].
Year of First Product Shipment Technology Generation
1997 250 nm
1999 180 nm
2001 150 nm
2003 130 nm
2006 100 nm
2009 70 nm
2012 50 nm
Number of metal levels — DRAM 2 - 3 3 3 3 3 - 4 4 4 Number of metal levels — logic 6 6-7 7 7 7 - 8 8 - 9 9 Maximum interconnea length
- logic (meters/chip) 820 1.480 2,160 2,840 5,140 10,000 24,000
Reliability - logic (FITsVmeter) x lO"'
4.9 1.7 IJ 0.9 0.5 0.2 0.1
Planarity lequirements within lithe field for minimum interconnect CD
(nm)
300 250 230 200 175 175 175
Minimum contacted/non-contacted pitch - DRAM (nm)
550/500 400/360 330/300 280/260 220/200 160/140 110/100
Minimum comacted/non-contacted pitch-logic (nm)
640/590 460/420 400/360 340/300 260/240 190/170 140/130
Minimum metal CD (nm) 250 180 150 130 100 70 50 Minurami oontact/via CD (nm) 280/360 200/260 170/210 140/180 110/140 80/100 60/70 Metal heightAndth aspect ratio - logic (microprocessor)
1.8 I.8** 2.0** 2.1" 2.4»* 2.7** 3.0»*
Via aspect ntio — logic 2.2 2.2»* 2.4** 2.5*» 2.7** 2.9** 3.2 Contact aspect ratio — DRAM 5.5 6J 7.0 7.5 9 10.5 12
Metal effective resistivity ((iA-cm) 33 22 2.2 2.2 2.2 <1.8 < 1.8 Bairier/cladding thickness (nm) 100 23 20 16 II 8 6
Interlevel metal insulator-effective dielectric constant (k)
3.0-4.1 2.5-3.0 2.0-2.5 1.5-2.0 1.5-2.0 Sl,5 Sl.5
• nr - failure in time. ** Metal and via aspect ratios are additive for dual-Damascene process flow.
21
FintYur OTIC Productian 1997 19B9 2001 2003 2006 2009 2012 2S0 rm 110 rm 130 rm 130 rm lOOnm 70 rm 30 rm
Sn CNP SLURRIES AND CLEANS
CM* OF LOW K DELECTRICS ON ETCHED Al
Al ChP
eucM>
CWAND CLEAN FUNDAMENTALS
1 1 Sn CNP SLURRIES AND CLEANS
CM* OF LOW K DELECTRICS ON ETCHED Al
Al ChP
eucM>
CWAND CLEAN FUNDAMENTALS
1
Sn CNP SLURRIES AND CLEANS
CM* OF LOW K DELECTRICS ON ETCHED Al
Al ChP
eucM>
CWAND CLEAN FUNDAMENTALS
1
Sn CNP SLURRIES AND CLEANS
CM* OF LOW K DELECTRICS ON ETCHED Al
Al ChP
eucM>
CWAND CLEAN FUNDAMENTALS
PLANARIZATTON ALTERNATIVES TO CM* 1
RtstareH Rtojirtd r^urnhjcnttr* IMmrmanf 1 1 Oui«ii Cn«r«.»nX> 1 IhtelaQtndiiwfciiiilxiiiiii during»NchfU»Dh.d>i<topnwnt»dquilfcjiiun<frn-piDdiittlon<lw<db«tJiHnqp<»e»fcrtw ipmon.
Fig. 1.1. Planarization potential solutions [1.1].
22
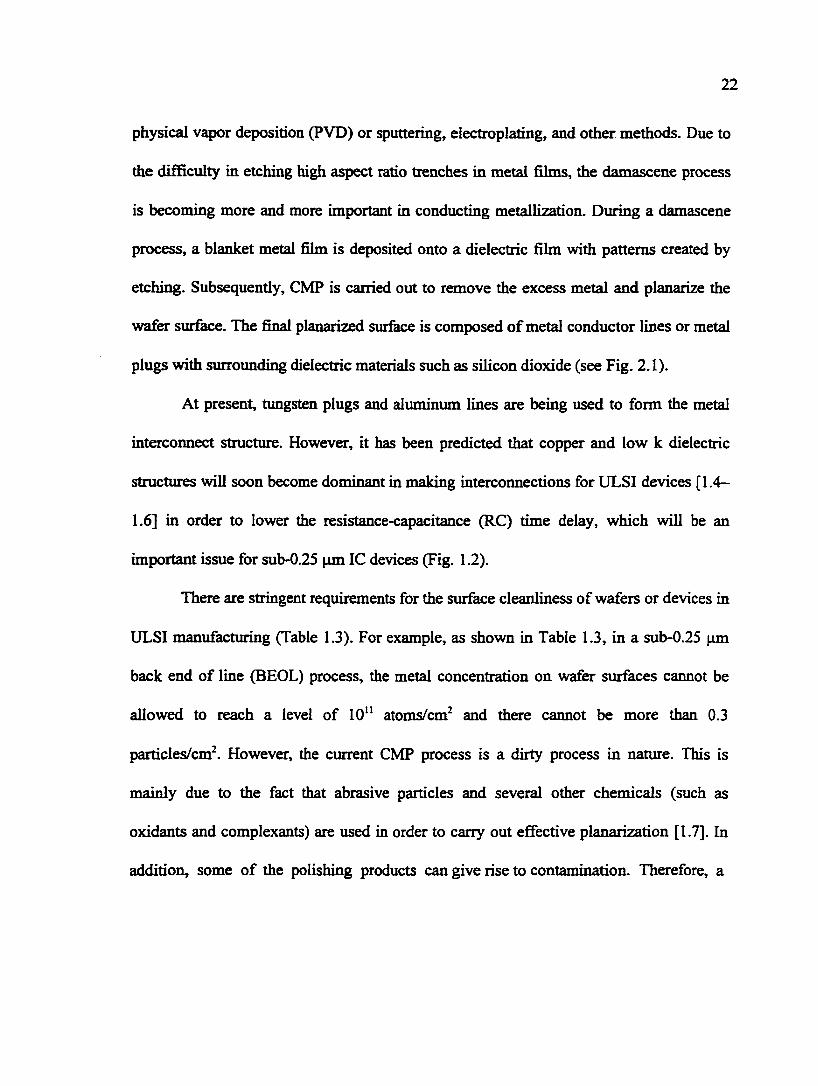
physical vapor deposition (PVD) or sputtering, electroplating, and other methods. Due to
the difficulty in etching high aspect ratio trenches in metal films, the damascene process
is becoming more and more important in conducting metallization. During a damascene
process, a blanket metal film is deposited onto a dielectric film with patterns created by
etching. Subsequently, CMP is carried out to remove the excess metal and planarize the
wafer surface. The final planarized surface is composed of metal conductor lines or metal
plugs with surroimding dielectric materials such as silicon dioxide (see Fig. 2.1).
At present, tungsten plugs and aluminum lines are being used to form the metal
interconnect structure. However, it has been predicted that copper and low k dielectric
structures will soon become dominant in making interconnections for ULSI devices [1.4-
1.6] in order to lower the resistance-capacitance (RC) time delay, which will be an
important issue for sub-0.25 ^m IC devices (Fig. 1.2).
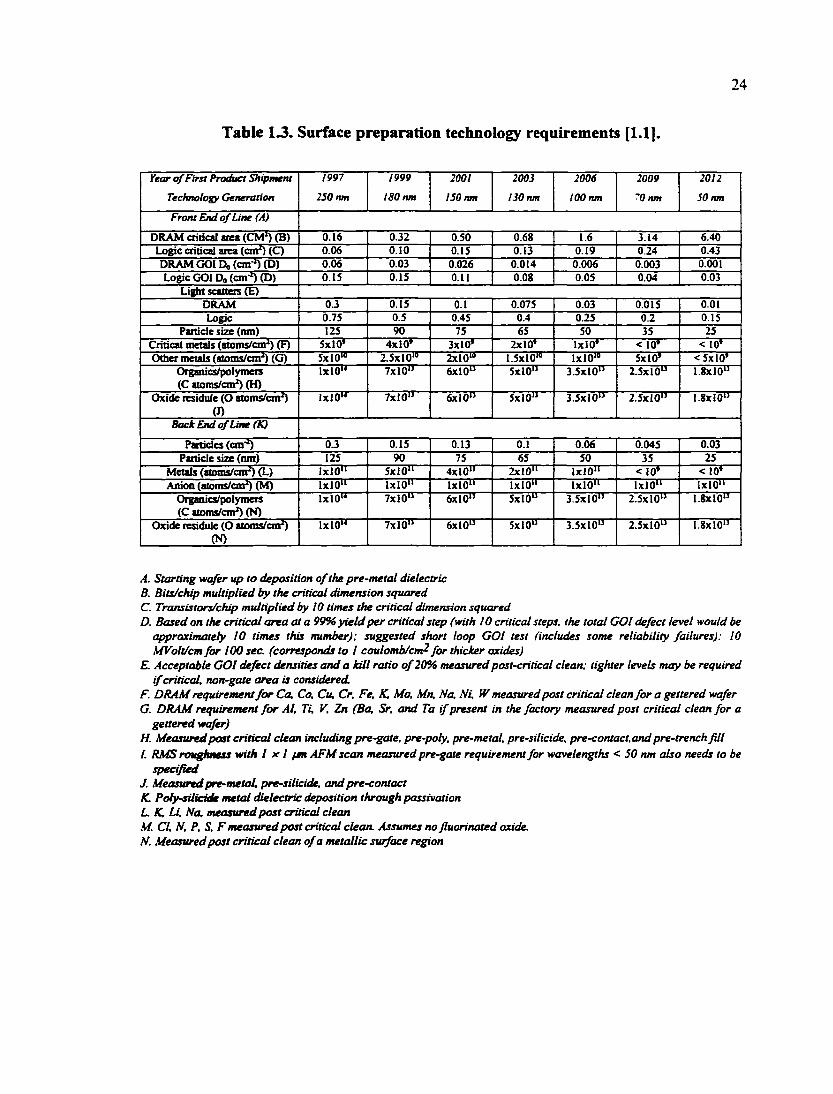
There are stringent requirements for the surface cleanliness of wafers or devices in
ULSI manufacturing (Table 1.3). For example, as shown in Table 1.3, in a sub-0.25 jim
back end of line (BEOL) process, the metal concentration on wafer surfaces cannot be
allowed to reach a level of 10" atoms/cm^ and there cannot be more than 0.3
particles/cm^. However, the current CMP process is a dirty process in nature. This is
mainly due to the fact that abrasive particles and several other chemicals (such as
oxidants and complexants) are used in order to carry out effective planarization [1.7]. In
addition, some of the polishing products can give rise to contamination. Therefore, a

23
(ps)
Sit* wru/ ttiotut
Gate May
-A- SumofCMays.AI «SiO,
Sum of 0«iays. Cu A Lo'vr«
Irttrconntct CMay.M & SO]
ktcrcormect Delay, Cu i Lav k
At Cu soz Lonfye AI&Cu Al&CuiJn*
3.0jtS2-CM I.TjtH-cf It* 4.0 It* 2.0 .8)t TMck 43ft long
3S0 250 183
GwMnrtion (nm)
100
Fig. 1.2. Calculated gate and interconnect delay vs. technology generation [1.1].
24
Table 13. Surface preparation technology requirements [1.1].
Year of First Product Shipment 1997 1999 2001 2003 2006 2009 2012
Technology Generation 250 nm 180 nm 150 nm 130 nm too nm '0 nm SO nm
Front End of Line (A)
DRAM critical area (CM') (B) 0.16 0J2 0.50 0.68 1.6 3.14 6.40 Logic critical area (cm') (Q 0.06 0.10 0.15 0.13 0.19 0.24 0.43 DRAM GOl Do (cm ') (D) 0.06 0.03 0.026 0.014 0.006 0.003 0.001 Logic GOl Do (on'') (D) 0.15 0.15 0.11 0.08 0.05 0.04 0.03
Light scatteis (E) DRAM OJ 0.15 0.1 0.075 0.03 0.015 0.01 Logic 0.75 0.5 0.45 0.4 0.25 0.2 0.15
Panicle size (nm) 125 90 75 65 SO 35 25 Critical metals (atoms/cm') (F) SxlO' 4x10' 3x10' 2x10' 1x10' < 10' < 10' Other rnetak (aioms/cmO (G) 5x10" 2.5xl0'» 2x10"" 1.5x10'" 1x10'" 5x10' <5x10'
Organics/polytneis (C atoms/cn^ (H)
1x10" 7x10" 6x10" 5x10" 3.5x10" 2.5x10" 1.8x10"
Oxide residule (O atoms/cm') (J)
IxIO" 7x10" 6x10" 5x10" 3.5x10" 2.5x10" 1.8x10"
Back End of Line (K)
Particles (cm'') OJ 0.15 0.13 0.1 0.06 0.045 0.03 Panicle size (mn) 125 90 75 65 50 35 25
Metals (atoms/cm') (L) IxlO" SxlO" 4x10" 2x10" 1x10" < 10' < 10' Anion (aloms/cm') (M) 1x10" 1x10" 1x10" 1x10" 1x10" 1x10" IxlO"
Organics/polymeis (C aioms/cmh (N)
1x10" 7x10" 6x10" 5x10" 3.5x10" 2.5x10" 1.8x10"
Oxide residule (O atoms/cm') (N)
IxlO" 7x10" 6x10" SxlO" 3.5x10" 2.5x10" 1.8x10"
A. Starting -wafer up to deposition of the pre-metal dielectric B. Bits/chip multiplied by the critical dimension squared C. Transistors/chip multiplied by 10 times the critical dimension squared D. Based on the critical area at a 99% yield per critical step (with 10 critical steps, the total GOl defect level would be
approximately 10 times this number): suggested short loop GOl test (includes some reliability failures): 10 KfVolt/cm for 100 sec. (corresponds to I coulomb/cm for thicker oxides)
E. Acceptable GOl defect densities and a kill ratio of 20% measured post-critical clean: tighter levels may be required if critical, non-gate area is considered.
F. DRAM requirement for Ca, Co, Cu, Cr, Fe, K, Mo, Mn, No, Ni. W measured post critical clean for a gettered wafer G. DRAM requirement for Al, Ti, V, Zn (Ba, Sr, and Ta if present in the factory measured post critical clean for a
gettered vnafer) H. Measured post critical clean including pre-gate, pre-poly, pre-metal, pre-silicide, pre-contact.and pre-trench fill I. RMS rou^OKSs with I x I fsn AFM scan measured pre-gate requirement for wavelengths < 50 nm also needs to be
specified J. Measured pre-metal, pre-silicide, and pre-contact K. Poty-silicide metal dielectric deposition through passivation L K, Li, ffa, measured post critical clean M. CI, M, P. S, F measured post critical clean. Assumes no fluorinated oxide. N. Measured post critical clean of a metallic surface region
25
post-CMP cleaning step is necessary, where the polishing residues deposited on the wafer
surfaces as a result of CMP are removed. A good post-CMP cleaning process will
produce wafer surfaces ready for the next process after CMP.
1.2. Objectives of Study
In this study, some fundamental aspects of CMP and post-CMP cleaning of
tungsten and copper structures were investigated; the particulate contamination during
tungsten CMP, metallic contamination during copper CMP, and galvanic corrosion in
both tungsten and copper CMP. The objectives of this study are as follows:
(1) To understand the interactions between some additives and abrasive particles
and those between metal ions and oxide wafer surfaces during metal CMP and post-CMP
cleaning;
(2) To explore the use of the additives for minimization of contamination during
metal CMP; and
(3) To study the effect of galvanic coupling on corrosion of metal films during
metal CMP and post-CMP cleaning.
26
Chapter 2
CMP AND POST-CMP CLEANING
In this chapter, some flmdamentals of CMP and cleaning after CMP are discussed
following a brief introduction to metal interconnection.
2.1. CMP for Metal Interconnect Structures
2.1.1. Metal Interconnect Structures
A tungsten structure is shown in Fig. 2.1 as an example of tjqjical metal
interconnect structure. For the deposition of a tungsten metal film, CVD has already been
recognized as a successful process. Many chemistries are available to deposit tungsten
[2.1]. One of the most firequently used chemistries is WFg + Hj, where tungsten is
produced through the following reaction:
WF6 + H2^W + 6HF (2.1)
Underlying layers such as titanium and titanimn nitride (TiN), as shown in Fig. 2.1, are
deposited mainly for two purposes: (i) to enhance the adhesion between metal and silica.
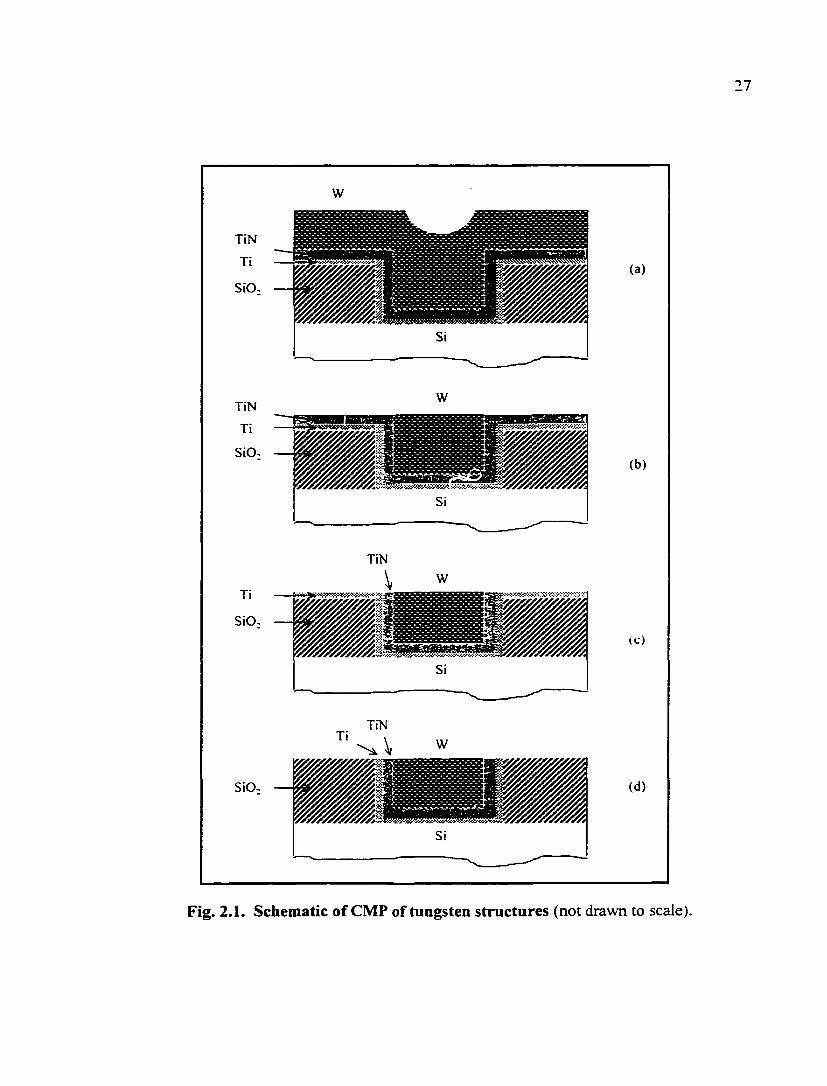
Fig. 2.1. Schematic of CMP of tungsten structures (not drawn to scale)
28
and (ii) to provide a diffusion barrier between metal and silicon. In practice, TiN is also
used to provide an anti-reflection layer for helping optical measurements in the
photolithography process. The deposition of TiN has been discussed widely in the
literature [2.2]. As shown in Fig. 2.1, the final interconnect structure can be achieved
through a Damascene process, in which the metal is deposited into the recessed areas in
oxide and the surplus metal is removed by CMP.
Copper can be deposited by PVD, CVD, laser-induced reflow and plating
including electroplating and electroless plating [2.3]. For copper CVD, copper (I)
hexafluoroacetylacetonate trimethylvinylsilane [Cu(hfac)(tmvs)] is one of the most
promising copper precursors. It reacts via bimolecular disproportionation reaction to
produce solid copper and gaseous by-products as follows [2.4]:
2 Cu' '(hfac)(tmvs) (g) —> Cu (s) + Cu^^Chfac)! (g) + 2 tmvs (g) (2.2)
Copper films can also be formed by electroplating, where copper sulfate, fluoborate, and
cynaide baths are commonly used with additives such as gelatin to improve the quality of
deposits [2.5]. An electroless copper plating bath may contain cupric sulfate,
ethylendiaminetetraacetic acid (EDTA), and formaldehyde with a stabilizer and
surfactant. Currently electroplating appears to have taken the leading role in deposition of
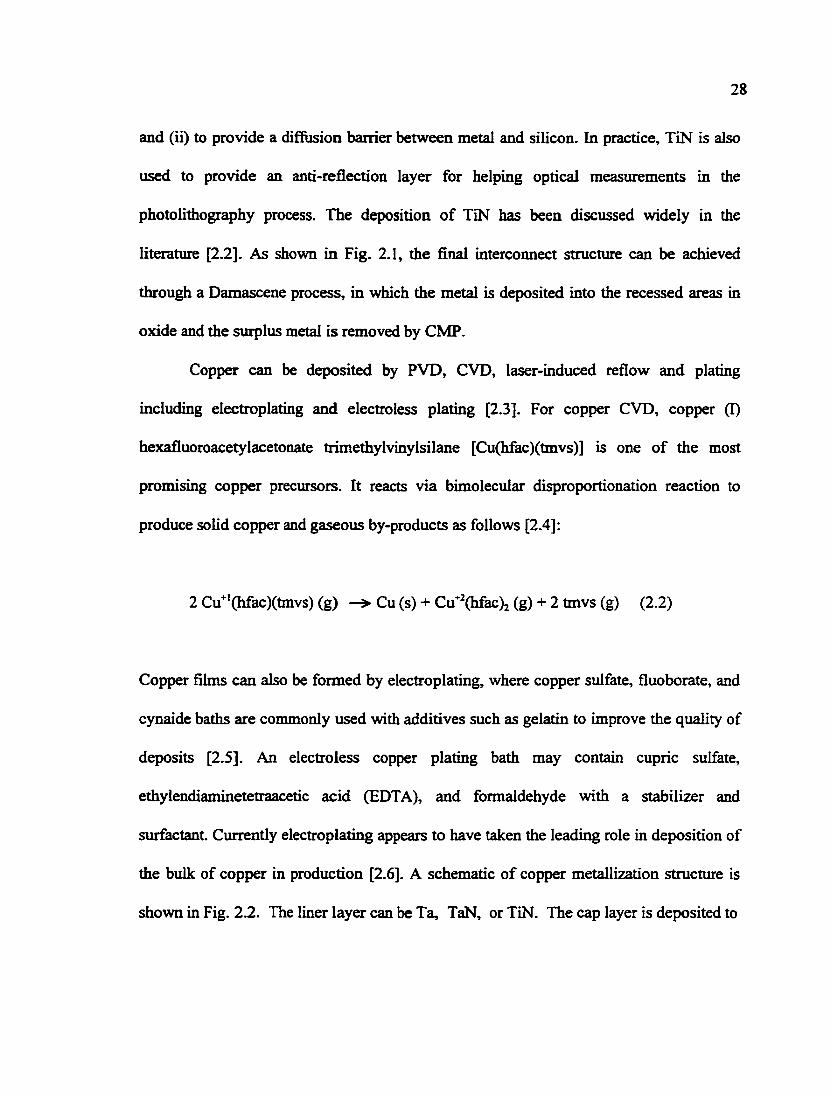
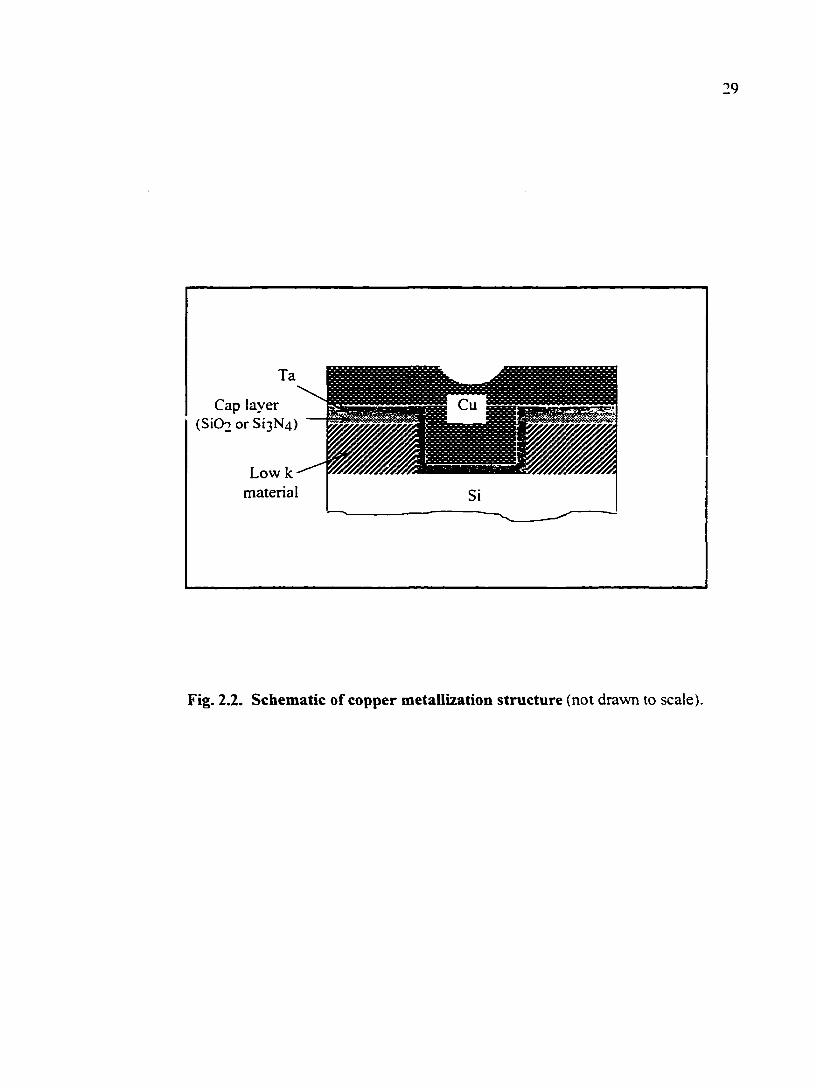
the bulk of copper in production [2.6]. A schematic of copper metallization structure is
shown in Fig. 2.2. The liner layer can be Ta, TaN, or TiN. The cap layer is deposited to
29
Cap layer (SiOo or Si3N4)
Low k material Si
Fig. 2.2. Schematic of copper metallization structure (not drawn to scale).
30
protect the low k material. It should be pointed out that, at present, oxide is still being
used as the dielectric for the copper structure because low K materials are still in the stage
of development [2.6].
2.1.2. CMP Processing
CMP is a technology that has been used for optical finishing of glass and Si
surfaces for many decades [2.7, 2.8]. The application of CMP for the planarization of
interlevel dielectric (ILD) as well as for polysilicon and tungsten metal studs was
pioneered by IBM and has been used in the fabrication of very large scale integrated
(VLSI) circuits since the early 1980s [2.9]. The current state of CMP is the result of the
semiconductor industry's need to fabricate multilevel interconnections for increasingly
complex, dense, and miniaturized devices and circuits [2.10]. At present, CMP has
become one of the fastest growing segments of the semiconductor equipment and
materials market [2.7, 2.8,2.11-2.13].
The unique advantage of CMP is that it achieves global planarization which is
essential in building multilevel interconnections. Measurement of planarity and degrees
of planarity are shown in Fig. 2.3 and Table 2.1, respectively. The planarization
relaxation distance (R) is defined as the distance traveled over a step, whereupon the
original step height (i.e., T) returns [2.14]. The planarization angle (0) is given by
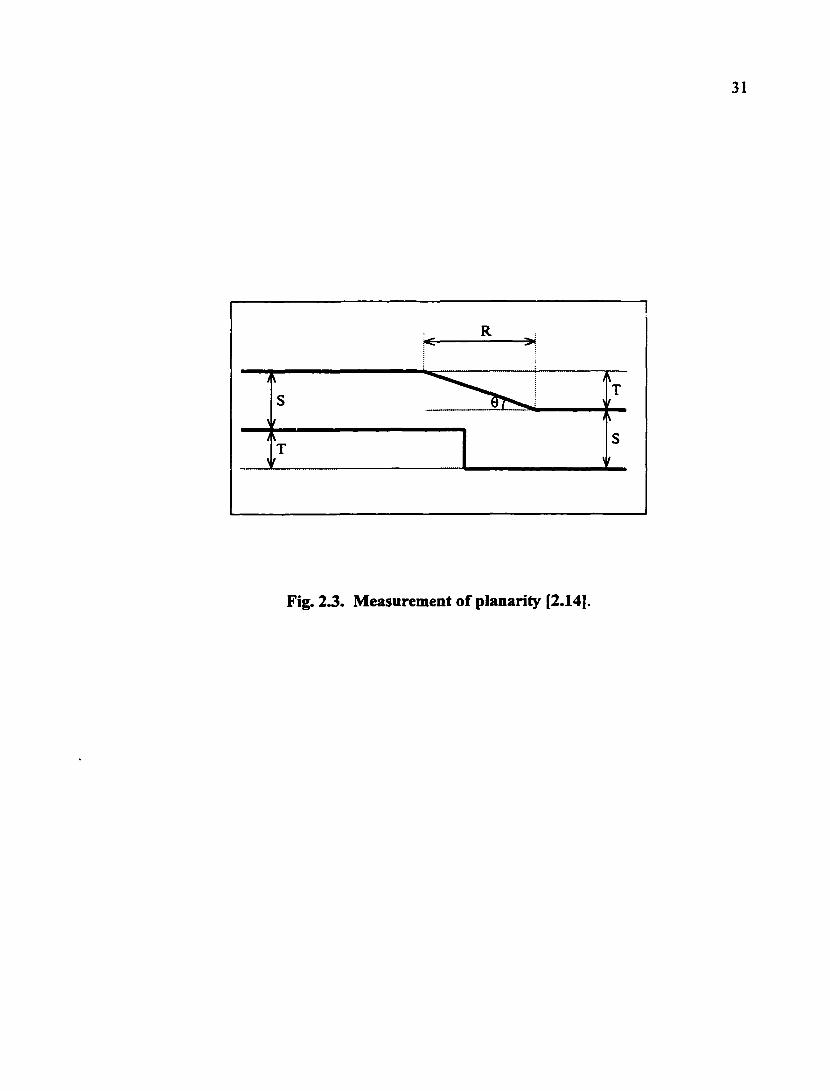
31
Fig. 23. Measurement of planarity [2.14].

32
9 = arctan (T/R) (2.3)
As indicated in Table 2.1, a CMP process should yield the global planarity characterized
by R > 100 and 0 < 0.5°. The so-called step height reduction (SHR) is defined as
SHR=1-Tp^p„ (2.4)
where Tp^^ and Tp„ are the step height after and before the planarization process,
respectively. The rate of planarization can be expressed as the difference between the
polish rates of the high and low features [2.10], where the polish rate is obviously defined
as the thickness reduction per unit time.
Table 2.1. Degrees of planarity [2.14] *
Planarity R(nm) 0(°)
Surface smoothing
d
d >30
Local planarity 2.0 - 100 30 - 0.5
Global planarity > 100 <0.5
* See the text and Fig. 2.3 for definitions of R and 0.
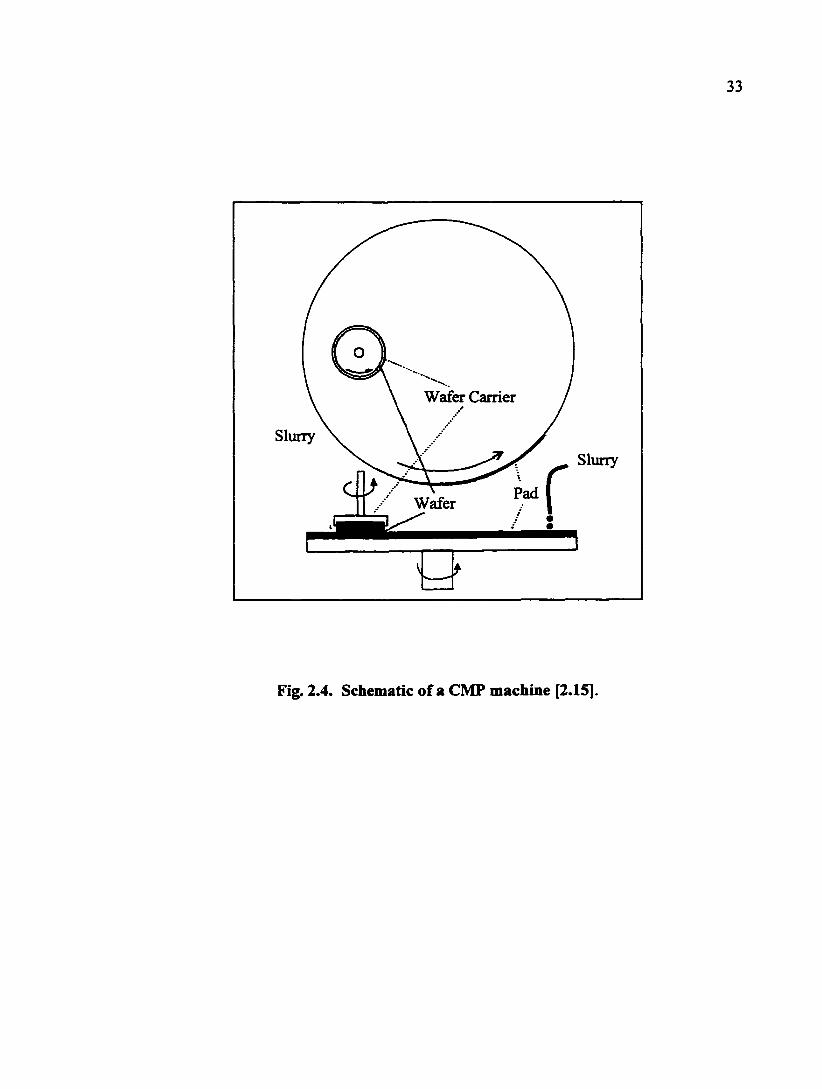
A CMP machine uses orbital, circular, and lapping motions. As schematically
shown in Fig. 2.4, the wafer is held on a rotating carrier while being polished against a
resilient polishing pad attached to a rotating platen. The polishing slurry is carried to the
wafer by the porosity or fibers on the pad. A CMP process involves many input and
Wafer
Fig. 2.4. Schematic of a CMP machine [2.15].
34
output variables [2.10]. Planarization depends on the chemical reactions and mechanical
interactions among all the input variables. Three main players in the CMP process are the
surface to be polished, the pad, and the slurry. The polishing pad is the key media
enabling the transfer of mechanical forces to the surface being polished. The slurry
provides both chemical and mechanical effects [2.10]. A list of CMP suppliers can be
found in an article by Burggraaf [2.16], although it is still growing in recognition of the
potential market and increasing applications.
Even though there have been efforts in developing abrasive-free CMP processes
[2.17, 2.18], or even pad and abrasive-free planarization [2.19], the most effective and
practical CMP process needs the involvement of abrasive particles. The most often used
abrasives in CMP of microelectronic materials are alumina and silica. Silica is mostly
used for CMP of dielectric and silicon while alumina (either a or y phase) is more often
used for metal-related CMP processes. The typical size of abrasive particles is in the
range of 150 ~ 300 nm and the solid concentration can vary from 6% to 13% [2.20]. A
search for alternative abrasives such as oxides of cesiimi and manganese is currently
ongoing.
Some of the issues and trends in CMP consimiables were summarized by
Moinpour and Philipossian [2.21]. Similar to abrasive particles, different pads have
different properties and choices have to be made to polish different films. The hardness of
pads is one of most important properties to be taken into account. A pad that is too soft
will actually smooth the surface instead of achieving the critical global planarity. If a pad

35
is too hard, the extruding asperities will cause more mechanical defects on the film than
are desirable.
2.1.3. Models and Mechanisms of CMP
The CMP process relies on the inseparable chemical and mechanical interactions
between the stuface being polished, the pad, and the slurry. This distinguishes it from
chemical etching (i.e., solid-liquid interaction) or grinding (i.e., solid-solid interaction).
The following discussion is divided into two sections dealing with mechanical and
chemical aspects of CMP.
2.1.3.1. Mechanical
The first wafer-scale mechanical model for CMP was proposed by Preston in
1927. It relates the removal rate to the work done by the tangential frictional force exerted
by the pad on the wafer. The removal rate in CMP is defined as the average change in the
thickness per unit time. Based on the often cited Preston's equation, the removal rate (R)
is given by
R=KvP (2.5)
36
where K is a constant proportional to the coefficient of friction, v is the relative velocity
between the pad and the wafer, and P is the pressure arising from the load applied to the
wafer. In reality, K is a function of a number of parameters, such as the elastic properties
of the abrasive oxide and the pad, contact area between the pad and the wafer, viscosity
of the slurry, applied load, and the relative speed of the wafer. There have been several
new models developed for the CMP process [2.7, 2.22, 2.23]. They describe specific
mechanical aspects of CMP, such as bending of pad, slurry flow, surface morphology,
and patterning. A review of these models can be found in articles by Nanz and Camilletti
[2.15] and Ruimels [2.24]. Tseng and Wang [2.25] re-examined the Preston equation by
considering a combination of the particle indentation and slurry flow. An equation similar
to the Preston equation was derived as follows
R = (2.6)
where M is a constant associated with material properties.
It should be pointed out that one simple philosophy for planarization is as follows:
The recessed area is relatively protected while the other area is removed. Because
abrasive particles, asperities on the pad, and features on the surface to be polished are in
micrometer or fractions of micrometer in size, this principle can be extended to
microscale in CMP of microelectronic materials. Therefore, the key to develop a CMP
model or to understand the mechanism of CMP is to find out how the microscale high
37
spots on the wafer surface, which can be grains or clusters of atoms, are produced and
removed and how new recessed areas are created. Mechanically, the mechanism of CMP
can be considered a subject of micro/nano tribology [2.26]. The distribution of the actual
pressure at the surface of the film being polished is important [2.27]. In addition to the
applied load or the average overall pressure, the distribution of the actual pressure results
from the surface morphology of the pad and the wafer, the pattern of the wafer, the
distribution of abrasive particles during polishing, and the liquid flow pattern. The
mechanisms of erosion due to particle impingement have been discmsed by researchers
such as Finnic [2.28] and Mehrotra et al. [2.29].
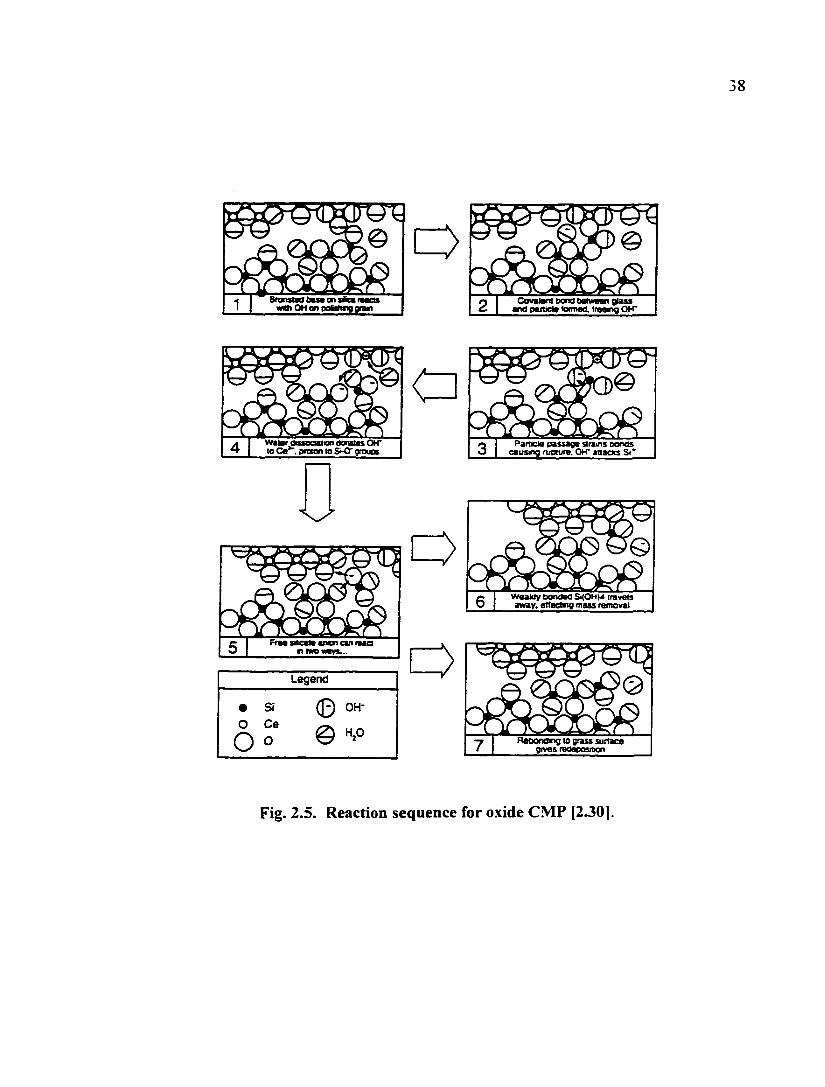
2.1.3.2. Chemical
CMP chemistry contributes to the overall success of both dielectric and metal
CMP processes by promoting the material removal and maintaining the surface quality of
the film to be polished. In CMP of silicon dioxide films, alkaline slurries are employed
which can etch the oxide films while polishing. Cook proposed a reaction sequence that
accounts for the role of both water and a chemically active abrasive in oxide CMP [2.30]
(Fig. 2.5). Tomozawa et al. further confirmed the importance of water entry into the oxide
during oxide CMP [2.31]. They concluded that water entry is the operating mechanism of
oxide CMP, which makes the mechanical removal of an oxide by an abrasive easier.
38
Covalani txxid beiwaan glass «nd oaiMm toimaa. trae«ig OH"
10 Ce . procon to groucs
>
Pamela passage strains Donos causing runure. OH* anaocs St*
Legend
• Si © OH-O
o Ce
O ©
Weakly Bondea SKOHM travels away. eftect«ig mass removal
Reoondng to grass surface gives taoeposition
Fig. 2.5. Reaction sequence for oxide CMP (2301-
39
Moreover, through Fourier transform infrared spectroscopy (FllK), the interaction of
hydrogen ions with oxide thin fihns subjected to CMP has been assessed [2.32]. It was
found that the diffusion of hydrogen ions near the surface is a rate controlling parameter
in the polishing behavior of oxide films. It appears that the environmentally assisted
fracture mechanism may be associated with oxide CMP. However, more research is still
needed considering the fact that the diffusion speed of hydrogen or water may be
negligible compared to the typical polishing rate, which is around 3000 A/min.
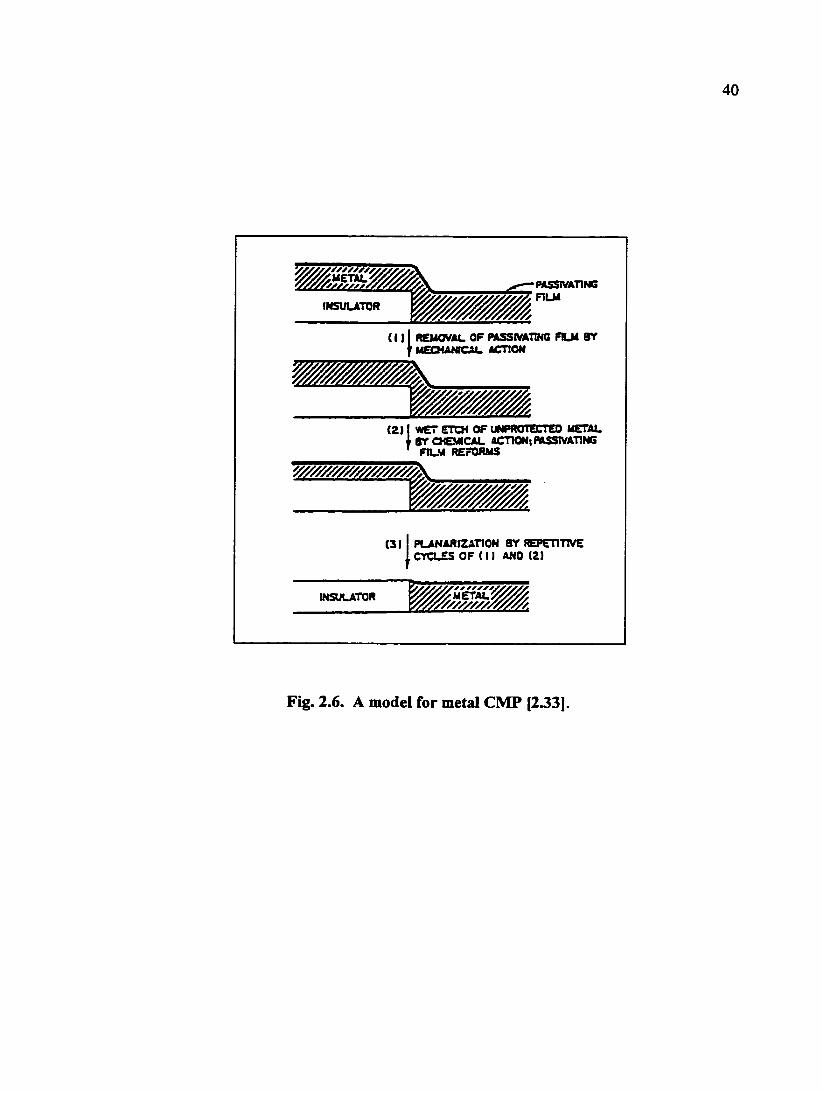
With regard to metal CMP, the corrosion and/or passivation issues of metal films
have to be addressed. The chemistry required for metal CMP is very complex. Ideally, the
slurry chemistry should allow fast corrosion or dissolution of higher spots while leaving
the recessed area passivated. Kaufinan proposed a model for metal CMP which is based
on a sequence of steps involving the formation of the passive layer, removal of the
passive layer, and reformation of passive layer at the higher spots [2.33] (Fig. 2.6).
Formation of metal oxide on top of the metal films during some CMP processes has been
experimentally detected [2.10]. Similar to the removal mechanism previously mentioned
for oxide CMP, mechanical cracking of the metal film under corrosion conditions should
be considered as one of the mechanisms for metal CMP [2.34]. Metal CMP can be
viewed as an erosion-corrosion process. Discussion about the interaction between erosion
and corrosion of metallic materials in slurries can be seen in [2.35].
REMOVAL OF PASSIVATWC FLX 8Y MEOUNICAI. ACTION
(2) I wer ETCH OF UNPROTECTED METAL t ar CHEMICAL ACTION; MSStVATING ' FILM REFORMS
(31 PLANARIZAT10N ST REPETITIVE 1 CrCL£5 OF (11 ANO (2)
INSULATOR METAL V/y/P/Ay/.
Fig. 2.6. A model for metal CMP [233].
41
Finally, it should be re-emphasized that, for both oxide and metal CMP, the effect
of chemical reactions can be magnified when incorporated with defects existing or
produced in the films being polished, such as dislocations and grain boundaries.
2.2. Post-CMP Cleaning
As mentioned earlier, there are stringent requirements for defect levels on the
wafer or device surfaces (Table 1.3). Consequently, surface cleaning plays a critical role
in semiconductor manufacturing. A general cleaning process can be carried out by wet or
dry methods. However, as stated by the SLA Roadmap [2.36], "Wet chemical cleaning
technologies are favored because of the many inherent properties of aqueous solutions,
such as the high solubility of metals, zeta potential control, and efficient sonic energy
transfer for megasonic particle removal. Hence, wet chemical surface preparation
methods are likely to continue to find wide application in the foreseeable future." A
complete CMP sequence has to end with an effective post-CMP cleaning process, which
leaves the planarized surface defect fi'ee and ready for the subsequent step in the
fabrication sequence. Since CMP is a wet process, a wet post-CMP cleaning will be more
desirable than other methods. In the following discussion, only wet cleaning will be
covered. The details about contamination during CMP will be discussed later in Chapter
3.
42
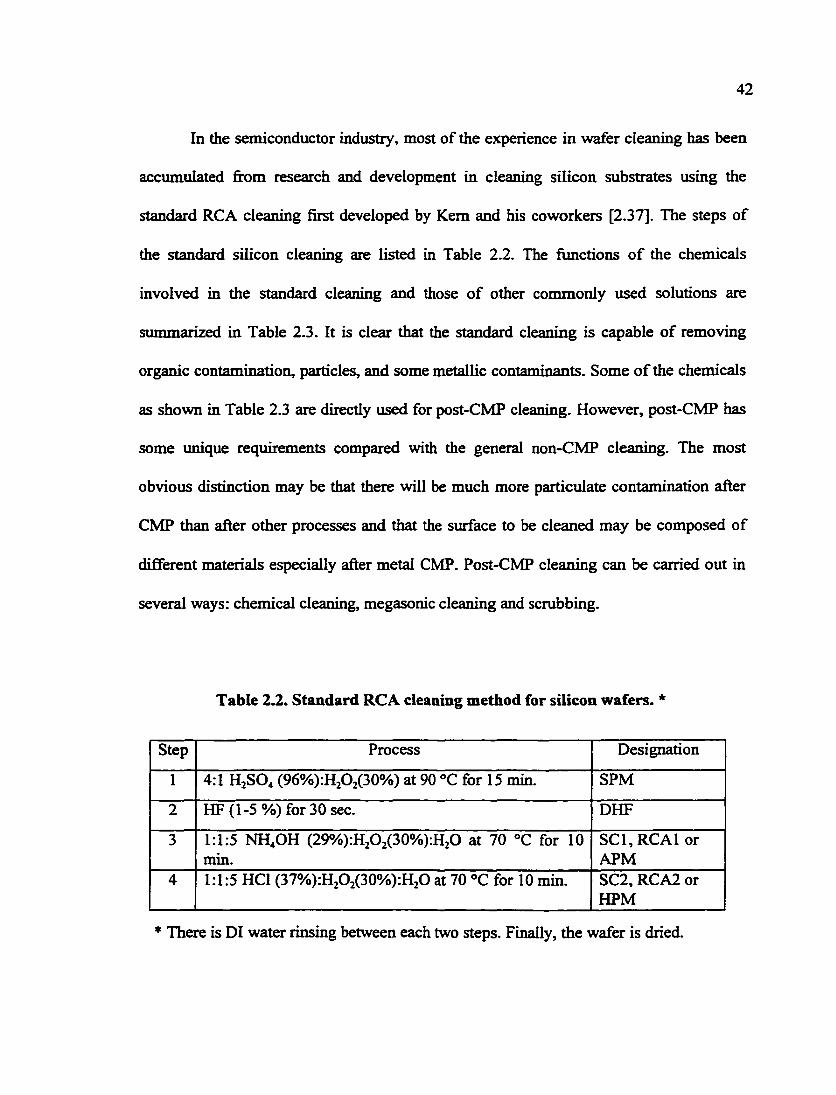
In the semiconductor industry, most of the experience in wafer cleaning has been
accimiulated from research and development in cleaning silicon substrates using the
standard RCA cleaning first developed by Kem and his coworkers [2.37]. The steps of
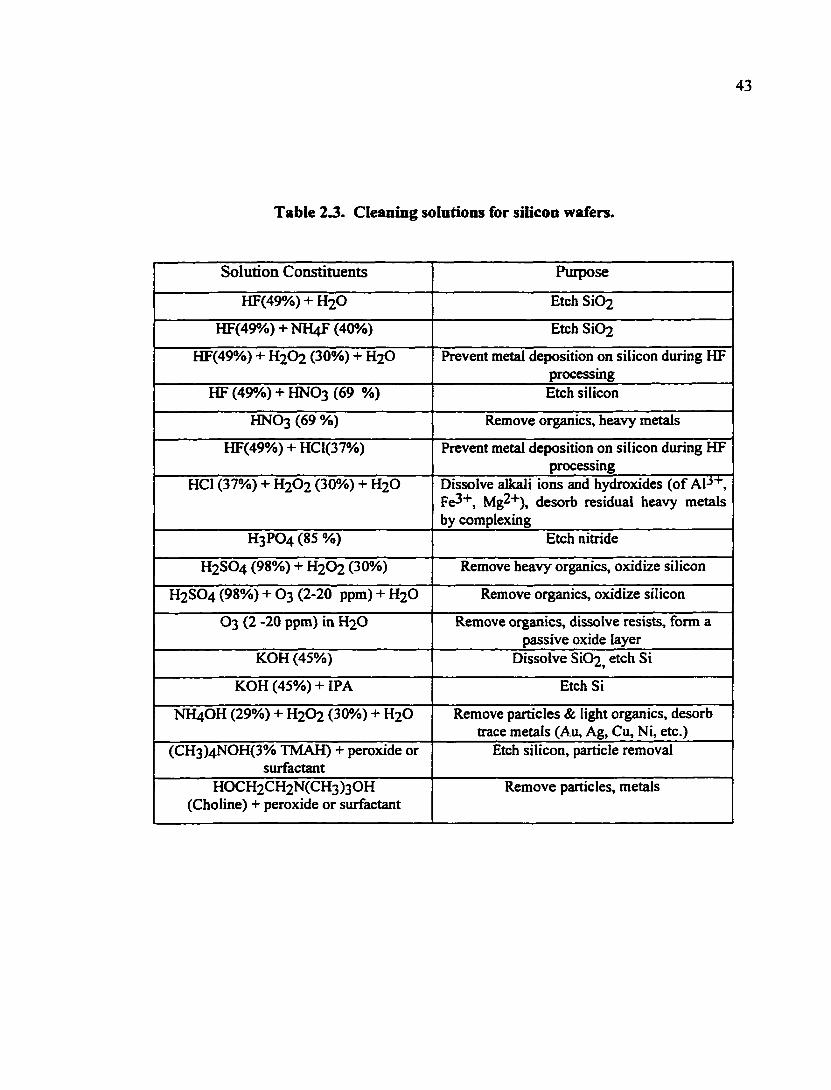
the standard silicon cleaning are listed in Table 2.2. The functions of the chemicals
involved in the standard cleaning and those of other commonly used solutions are
sijmmarized in Table 2.3. It is clear that the standard cleaning is capable of removing
organic contamination, particles, and some metallic contaminants. Some of the chemicals
as shown in Table 2.3 are directly used for post-CMP cleaning. However, post-CMP has
some unique requirements compared with the general non-CMP cleaning. The most
obvious distinction may be that there will be much more particulate contamination after
CMP than after other processes and that the surface to be cleaned may be composed of
different materials especially after metal CMP. Post-CMP cleaning can be carried out in
several ways: chemical cleaning, megasonic cleaning and scrubbing.
Table 2.2. Standard RCA cleaning method for silicon wafers. *
Step Process Designation
1 4:1 H2SO4 (96%):HA(30%) at 90 °C for 15 min. SPM
2 HF (1-5 %) for 30 sec. DHF
3 1:1:5 NH4OH (29%):H202(30%):H20 at 70 °C for 10 min.
SC1,RCA1 or APM
4 1:1:5 HCl (37%):HA(30%):H2O at 70 «C for 10 min. SC2, RCA2 or HPM
* There is DI water rinsing between each two steps. Finally, the wafer is dried.
43
Table 23, Cleaning solutions for silicon wafers.
Soliition Constituents Purpose
HF(49%) + H2O Etch Si02
HF(49%) + NH4F (40%) Etch SiC)2
HF(49%) + H2O2 (30%) + H2O Prevent metal deposition on silicon during HF processing
HF (49%) + HNO3 (69 %) Etch silicon
HNO3 (69 %) Remove organics, heavy metals
HF(49%) + HC1(37%) Prevent metal deposition on silicon during HF processing
HCl (37%) + H2O2 (30%) + H2O Dissolve alkali ions and hydroxides (of AM"*", Fe3+, Mg2+), desorb residual heavy metals by complexing
H3PO4 (85 %) Etch nitride
H2SO4 (98%) + H2O2 (30%) Remove heavy organics, oxidize silicon
H2SO4 (98%) + O3 (2-20 ppm) + H2O Remove organics, oxidize silicon
O3 (2 -20 ppm) in H2O Remove organics, dissolve resists, form a passive oxide layer
KOH (45%) Dissolve SiC)2, etch Si
KOH (45%) + IPA Etch Si
NH4OH (29%) + H2O2 (30%) + H2O Remove particles & light organics, desorb trace metals (Au, Ag, Co, Ni, etc.)
(CH3)4N0H(3% TMAH) + peroxide or surfactant
Etch silicon, particle removal
H0CH2CH2N(CH3)30H (Choline) + peroxide or surfactant
Remove particles, metals
44
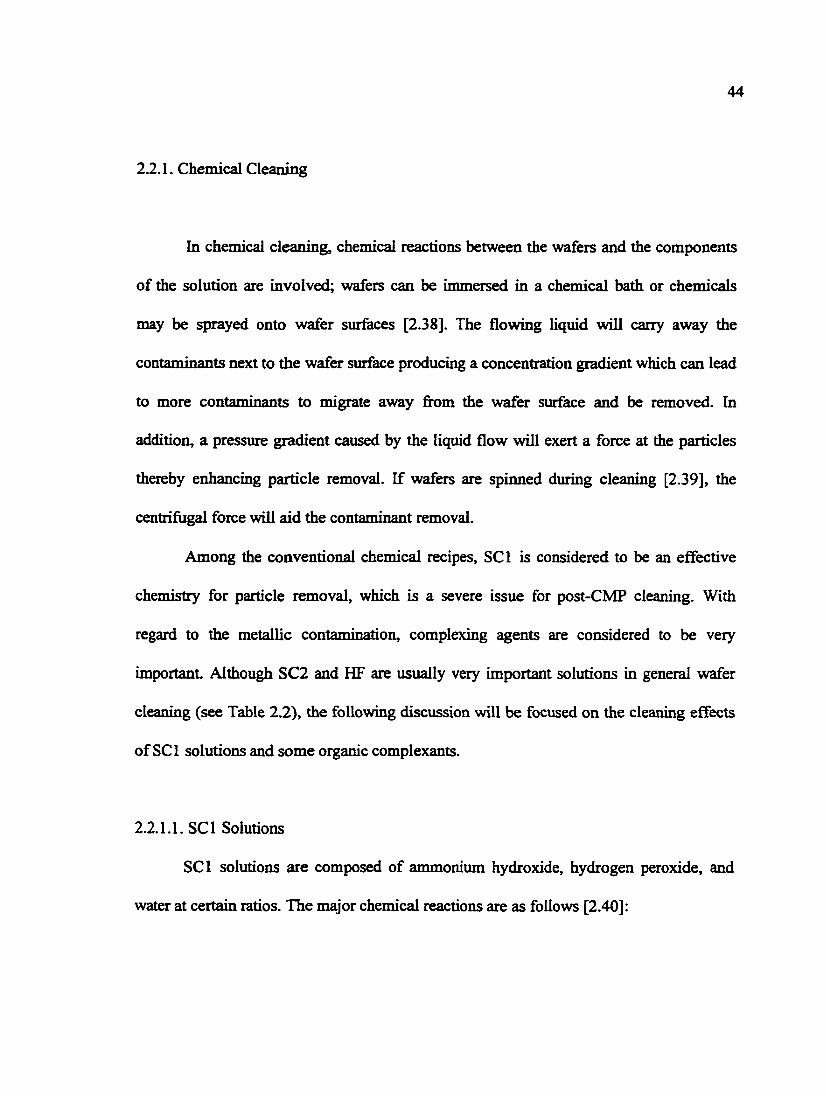
2.2.1. Chemical Cleaning
In chemical cleaning, chemical reactions between the wafers and the components
of the solution are involved; wafers can be immersed in a chemical bath or chemicals
may be sprayed onto wafer surfaces [2.38]. The flowing liquid will carry away the
contaminants next to the wafer surface producing a concentration gradient which can lead
to more contaminants to migrate away from the wafer surface and be removed. In
addition, a pressure gradient caused by the liquid flow will exert a force at the particles
thereby enhancing particle removal. If wafers are spinned during cleaning [2.39], the
centrifugal force will aid the contaminant removal.
Among the conventional chemical recipes, SCI is considered to be an effective
chemistry for particle removal, which is a severe issue for post-CMP cleaning. With
regard to the metallic contamination, complexing agents are considered to be very
important. Although SC2 and HF are usually very important solutions in general wafer
cleaning (see Table 2.2), the following discussion will be focused on the cleaning effects
of SCI solutions and some organic complexants.
2.2.1.1. SCI Solutions
SCI solutions are composed of ammonium hydroxide, hydrogen peroxide, and
water at certain ratios. The major chemical reactions are as follows [2.40]:
45
NH«OH = NH/ + OH- Kb (2.7)
HA = HOj+tr Ka (2.8)
HjO = H* + OH- Kyv (2.9)
where K^, K„ and are the equilibrium constants of these reactions, respectively. The
most commonly cited SCI chemistry is 1:1:5 NH40H:H202;H20 at ~75°C. However,
depending on the interaction between the three components and the solid surface to be
cleaned, the exact speciation of SCI solutions can be different It should be pointed out
that all three equilibrium constants are temperature dependent.
Hydrogen peroxide is an oxidant which can oxidize silicon into oxide. The species
responsible for oxidation of silicon is claimed to be HOj" [2.40]. It is well known that a
basic solution can etch a silicon wafer surface. The etch rate of SiOj in an alkaline
solution may be represented by the following equation [2.40]
E r = A- [OH~ ] • exp( 2.) (2.10)
® kT
where the concentration of OH* ions (when there is hydrogen peroxide in the solution)
can be calculated according to
46
[OH-] = 0 w NH^
K '"2°2
(2.11)
In Eqs. (2.10) and (2.11), is etch rate in nm/min, A is a constant = 5.21x10" nm/min, E,
is the etching activation energy (~ 14.6 kcal/mol), T is the temperature in K, C^nD is the
molar concentration of ammonia hydroxide initially added to SCI, and Chzoz is the molar
concentration of hydrogen peroxide initially added to SCl.
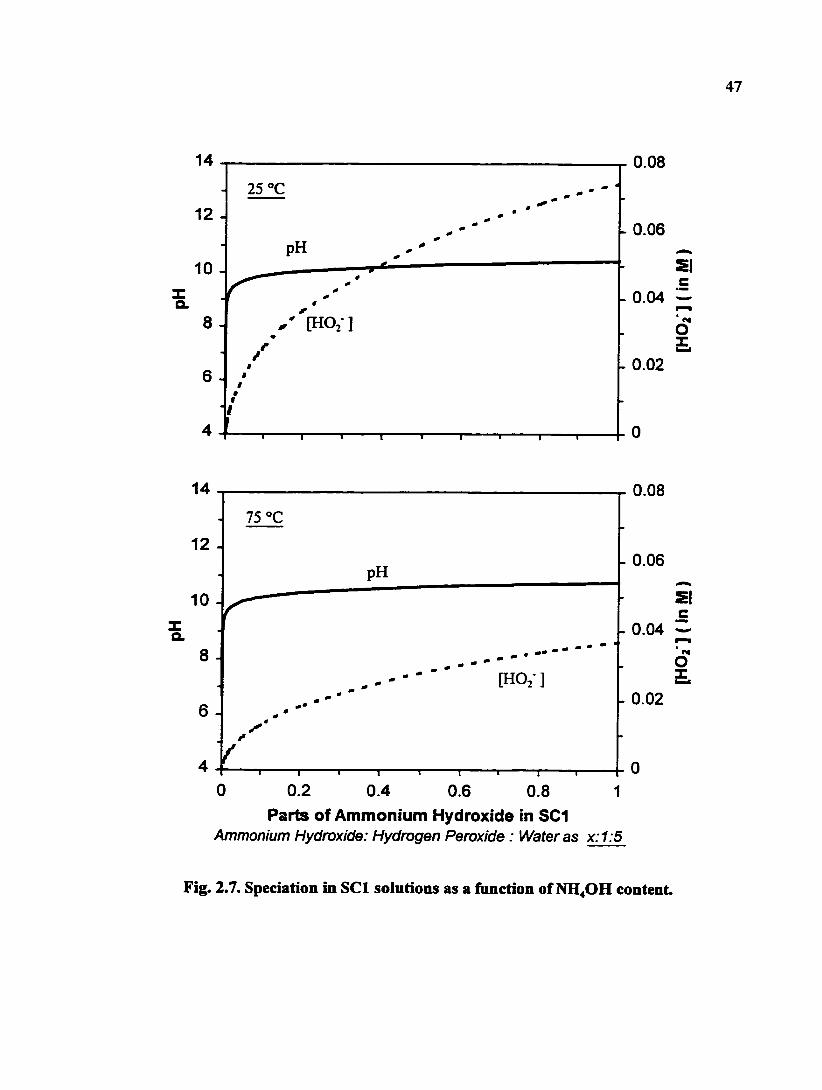
OH' and HOj" are two important species for etching and oxidation, respectively
[2.40]. Fig. 2.7 shows the calculated concentrations of OH" and HOj" as a fimction of the
ammonia content in the solution at two temperatures. It is interesting to note that the
concentration of HO2" increases as the solution temperature increases from 25 to 75°C,
but the effect of the temperature on the solution pH is not significant.
It has been found that the particle removal efficiency of SCI solution depends on
the amount of ammonia hydroxide. For example, Wang et al. showed that the silica
particle removal ratio (%) of x:l:5 SCI solutions increased as x increased from 0 to 1 and
that, when x > 1, the removal ratio was almost constant [2.38]. As shown in Fig. 2.7,
except for the region where x is very small, the pH of the solutions is mostly around or
greater than 10. As will be discussed later, at this pH range, the zeta potential of both
silica and alumina should be negative and the electrostatic repulsion prevents particle re-
deposition. The difference in particle removal efficiency is also related to the etching rate.
47
14
12 -
10 -
8
6
4
25 "C
[HO,-]
0.08
- 0.06
1-0.04 t
o
0.02
T r -1 1 r
14
12
10 -
8 -
75 "C
pH
[HO,- ]
0 0 Y
0.08
- 0.06
SI c
- 0.04 * ot 0 1
[. 0.02
0 0.2 0.4 0.6 0.8 1
Parts of Ammonium Hydroxide in SCI Ammonium Hydroxide: Hydrogen Peroxide: Water as x:1:5
Fig. 2.7. Speciation in SCI solutions as a function of NH4OH content.
48
which is linearly proportional to [OH*].
Etching is one of the many important steps in ULSI device manufacturing. It also
plays a critical role in cleaning. The cleaning sequence with an HF dip prior to SCI
cleaning is more effective in defect reduction than the sequence which involves SCI
cleaning followed by an HF dip [2.38].
2.2.1.2. Organic Complexants
Some organic compounds such as citric acid and EDTA have been used in the
cleaning industry. They can form stable complexes with certain metal ions (Appendix 1)
and help in removing metal ions adsorbed on surfaces.
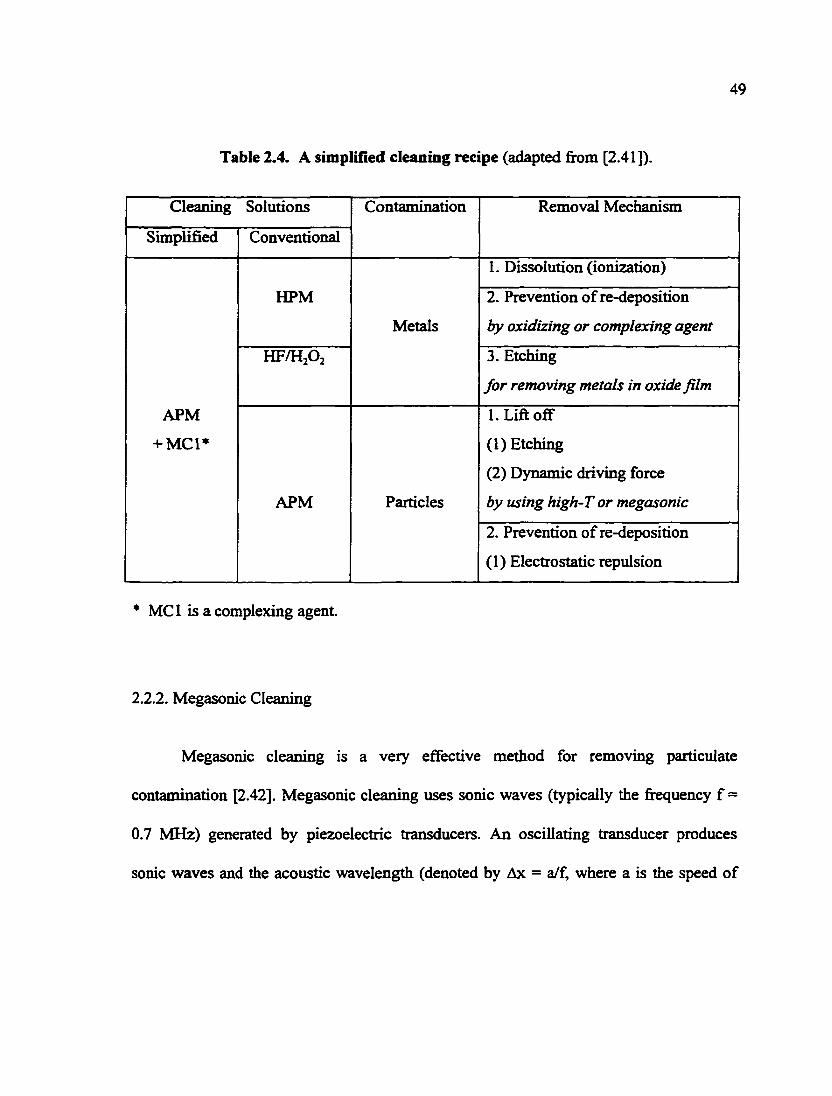
A simplified alkali cleaning solution reported by Morinaga et al. was actually
based on the concept that the addition of a chelating £^ent to the conventional SCI
cleaning solution can remove particle and metallic impurity simultaneously [2.41] (Table
2.4). Although this chemistry will not work for all cleaning applications, it should be
pointed out that this simplification of the cleaning method (i.e., replace the standard SCI
and SC2 solutions with one solution) is of practical importance because it obviously
decreases the cost and helps address the environmental issues. The mechanisms for the
removal of the major CMP contaminants (i.e., particulate and metallic) are also included
in Table 2.4.
49
Table 2.4. A simpUlied cleaning recipe (adapted from [2.41]).
Cleaning Solutions Contamination Removal Mechanism
Simplified Conventional
Contamination Removal Mechanism
APM
+ MC1*
HPM
Metals
1. Dissolution (ionization)
APM
+ MC1*
HPM
Metals
2. Prevention of re-deposition
by oxidizing or complexing agent
APM
+ MC1*
HF/HA
Metals
3. Etching
for removing metals in oxide film
APM
+ MC1*
APM Particles
l.Lifl off
(1) Etching
(2) Dynamic driving force
by using high-T or megasonic
APM
+ MC1*
APM Particles
2. Prevention of re-deposition
(1) Electrostatic repulsion
* MCI is a complexing agent.
2.2.2. Megasonic Cleaning
Megasonic cleaning is a very effective method for removing particulate
contamination [2.42]. Megasonic cleaning uses sonic waves (typically the frequency f =
0.7 MHz) generated by piezoelectric transducers. An oscillating transducer produces
sonic waves and the acoustic wavelength (denoted by Ax = a/f, where a is the speed of
50
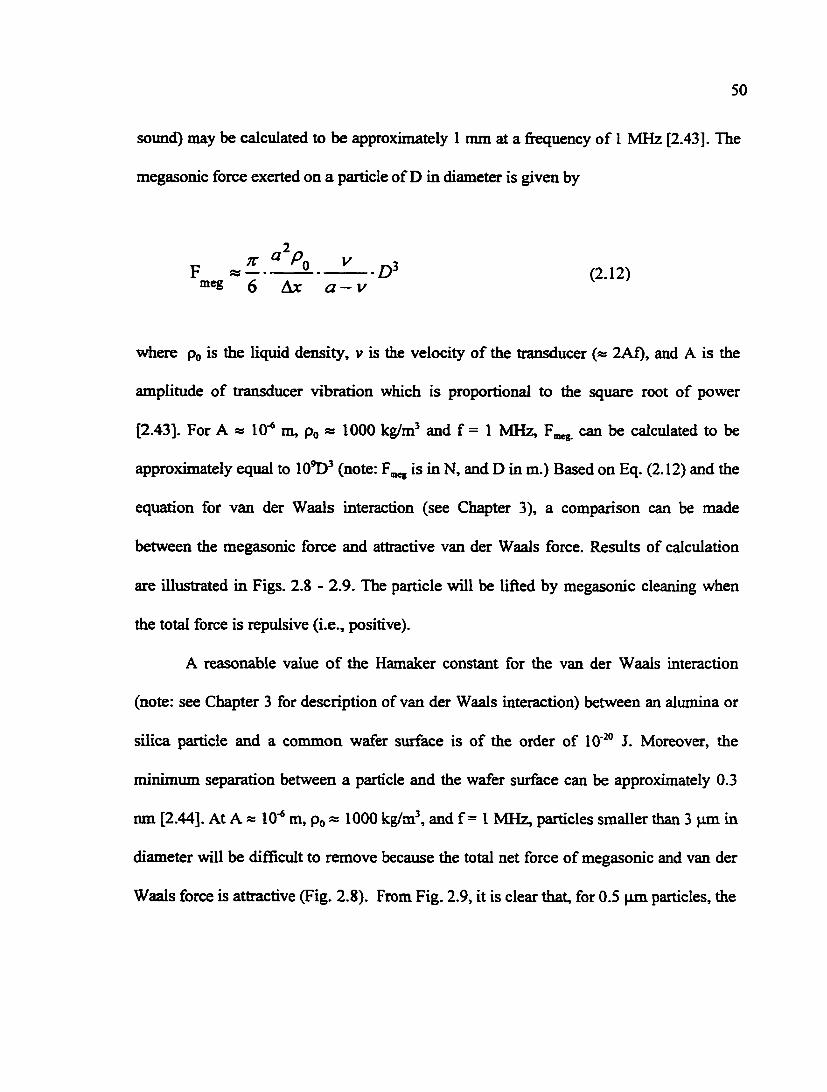
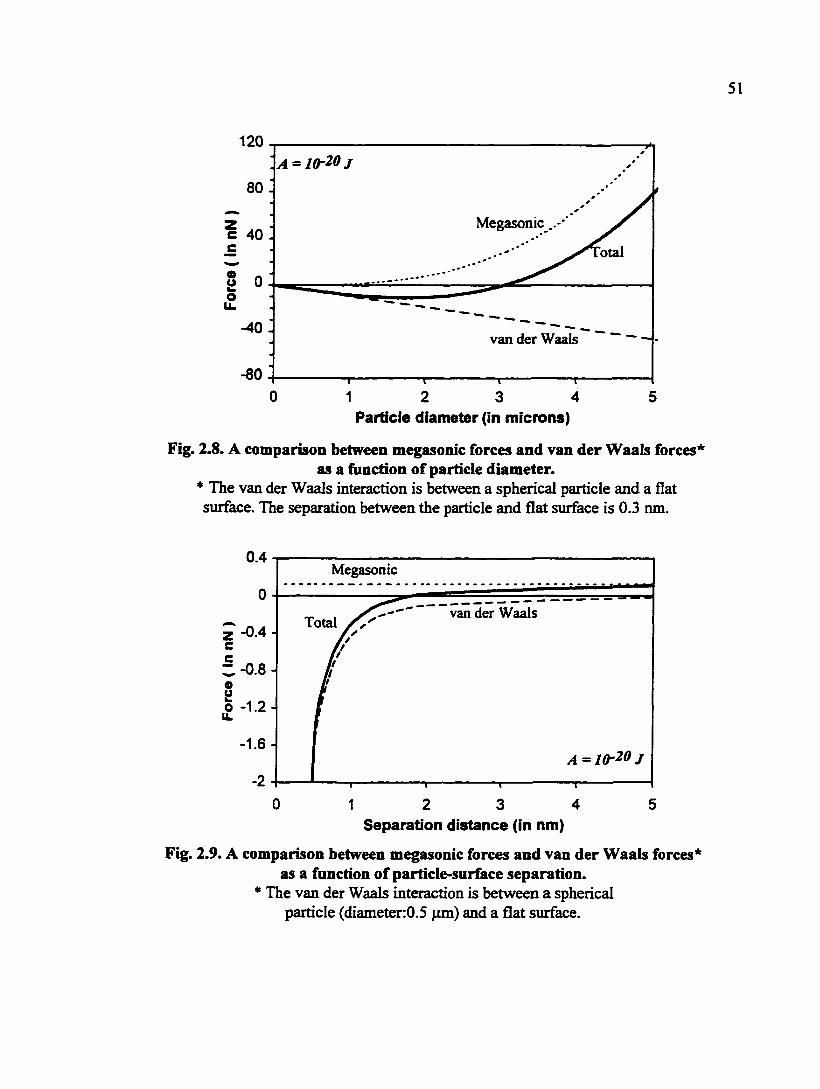
sound) may be calculated to be approximately 1 mm at a frequency of 1 MHz [2.43]. The
megasonic force exerted on a particle of D in diameter is given by
TV ^ Pn V' 3 F « ^ (2.12)
6 Ax a — V
where Po is the liquid density, v is the velocity of the transducer (« 2Af), and A is the
amplitude of transducer vibration which is proportional to the squiare root of power
[2.43]. For A « 10"® m, Po « 1000 kg/m^ and f = 1 MHz, can be calculated to be
approximately equal to lO'D^ (note: is in N, and D in m.) Based on Eq. (2.12) and the
equation for van der Waals interaction (see Chapter 3), a comparison can be made
between the megasonic force and attractive van der Waals force. Residts of calculation
are illustrated in Figs. 2.8 - 2.9. The particle will be lifted by megasonic cleaning when
the total force is repulsive (i.e., positive).
A reasonable value of the Hamaker constant for the van der Waals interaction
(note: see Chapter 3 for description of van der Waals interaction) between an alumina or
silica particle and a common wafer surface is of the order of 10"^° J. Moreover, the
minimum separation between a particle and the wafer surface can be approximately 0.3
nm [2.44]. At A « 10"® m, po « 1000 kg/m^, and f = 1 MHz, particles smaller than 3 jim in
diameter will be difficult to remove because the total net force of megasonic and van der
Waals force is attractive (Fig. 2.8). From Fig. 2.9, it is clear that, for 0.5 pm particles, the
51
120
Megasonic
btal
-40 van der Waals
-80
0 1 2 3 5 4 Particle diameter (in microns)
Fig. 2.8. A comparison between megasonic forces and van der Waals forces* as a function of particle diameter.
* The van der Waals interaction is between a spherical particle and a flat surface. The separation between the particle and flat surface is 0.3 nm.
0.4 Megasonic
van der Waals Total -0.4-z c
c -0.8-
o u o -1.2-u.
-1.6 -
0 2 3 5 1 4 Separation distance (in nm)
Fig. 2.9. A comparison between megasonic forces and van der Waals forces* as a function of particle-surface separation.
* The van der Waals interaction is between a spherical particle (diameter:0.5 (im) and a flat surface.
52
larger the separation between particles and the wafer surface, the less attractive or more
repulsive the net force between particles and the wafer surface will be; the megasonic
force is greater than the van der Waals force when the separation distance is greater than
1.8 nm. This value of the separation is greater than the minimum separation of 0.3 nm as
mentioned above, indicating the difficulty in removing such particles using only the
magasonic force (as calculated).
Many researchers believe that acoustic streaming, the motion of fluid in a soimd
field, is responsible for particle removal in a megasonic field. At a frequency of 900 kHz,
the thickness of the acoustic boundary layer, is calculated to be 0.59 nm. In contrast,
the hydrodynamic boundary layer is of 3000 (im in thickness at a flow velocity of 3 m/sec
[2.45]. The thin acoustic boundary layer in the megasonic field will help in the removal
of small particles near the wafer surface. Cavitation, which is the violent collapse of
bubbles which generates shock waves, is considered another possible particle removal
mechanism in megasonic cleaning. As Ohmi et al. reported, megasonic irradiation can
induce chemical reactions in solutions. These occur through the formation of H- and OH
radicals [2.46]. Therefore, it is likely that megasonic irradiation also has a chemical effect
on contaminant removal under certain circumstances.
2.2.3. Scrubbing
The complexity of post-CMP cleaning increases as newer materials are being
introduced. At present, post-CMP cleaning is mostly carried out using scrubbing. For
53
example, the double-sided scrubbing system has shown effectiveness for removing both
particulate and metallic contaminants in post-CMP applications [2.47, 2.48]. During this
process, DI water and certain chemicals flow through the brushes onto the surface of
spiiming wafers. The key feature of scrubbing is the addition of direct wiping action of
brushes for cleaning. The brushes, which are soaked with cleaning solutions, spin and can
be in direct contact with the wafer siirface, providing wiping action. Particles adhered to
the wafer surface can be easily removed by the lateral wiping force, which is more
effective than the centrifugal force and the vertical lifting force caused by a pressure
gradient. In addition to the solution introduction, the porous structure of the brushes may
serve as a temporary carrier for the particulate contaminants. This is the main reason why
scrubbing is a very effective and practical technique for post-CMP cleaning.
The pressure that the brushes apply onto the wafers should be well controlled,
otherwise mechanical interaction between the brushes and the wafer surface can cause
further removal of the film itself during the cleaning step. This is especially critical for
some metal films that are not mechanically strong in the presence of corrosive chemicals.
For example, it has been shown that when ammonium hydroxide is used for scrubbing of
copper films, the mechanical interaction from the brushes and the chemical reaction due
to ammonium hydroxide will strip some of the copper film during the cleaning process.
During brush cleaning, contaminants removed &om wafer surfaces may load on
the brushes. These loaded contaminants can re-deposit onto the wafer surface supposedly
being cleaned. Therefore, the brush loading has to be avoided in scrubbing. Finally, it

should be pointed out that chemical cleaning and megasonic cleaning can be easily
incorporated into a scrubbing system if necessary.
In the short history of scrubbing for post-CMP cleaning, the first cleaning solution
used was DI water. However, the complexity of the solution chemistry in post-CMP
scrubbing increases with the use of new materials [2.49]. For some scrubbing
applications, an SC-1 or HF containing solution shows effective cleaning. However, the
most frequently used chemicals in scrubbing are ammonium hydroxide and citric acid.
Ammonium hydroxide can serve as an etching solution for several materials such as
silicon dioxide and provide high pH values where surfaces of most materials develop a
negative surface charge and thus repel each other. Citric acid can complex some metal
ions and help to remove metallic contaminants.
Secondary platen bufGng serves to reduce the level of particulate contamination
on the wafer prior to post-CMP cleaning. The critical component of buf&ng is similar to
scrubbing because in both processes wiping is involved. Buffing is usually carried out in
DI water, although there are reports of using chemicals such as tetramethyl ammonium
hydroxide (TMAH) and a siufactant [2.50].
55
Chapter 3
CONTAMINATION AND GALVANIC CORROSION IN CMP
CMP is inherently a dirty process because abrasive particles are used in the
polishing sluny, and the slurry chemistry is a mixture of many components, both organic
and inorganic chemicals. In addition, the reaction products of the film during polishing
can also contribute to contamination on wafer surfaces after CMP. For example, the
dissolved copper species produced during polishing of copper can deposit onto the
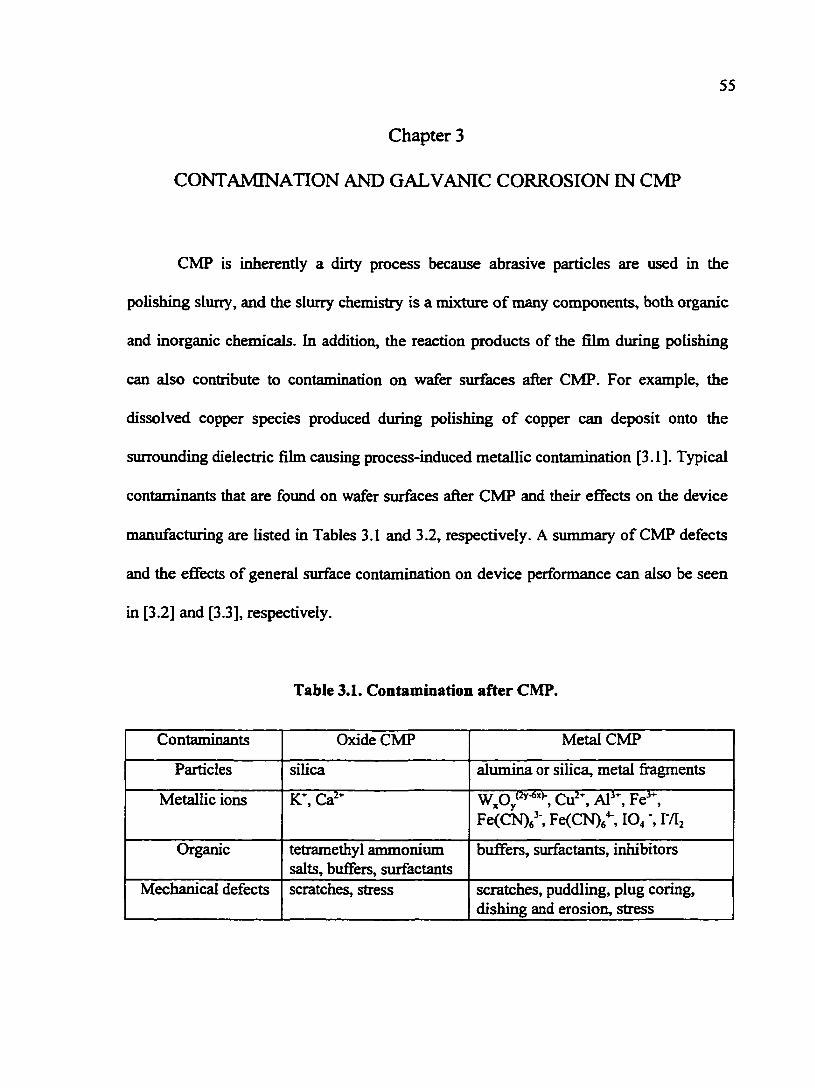
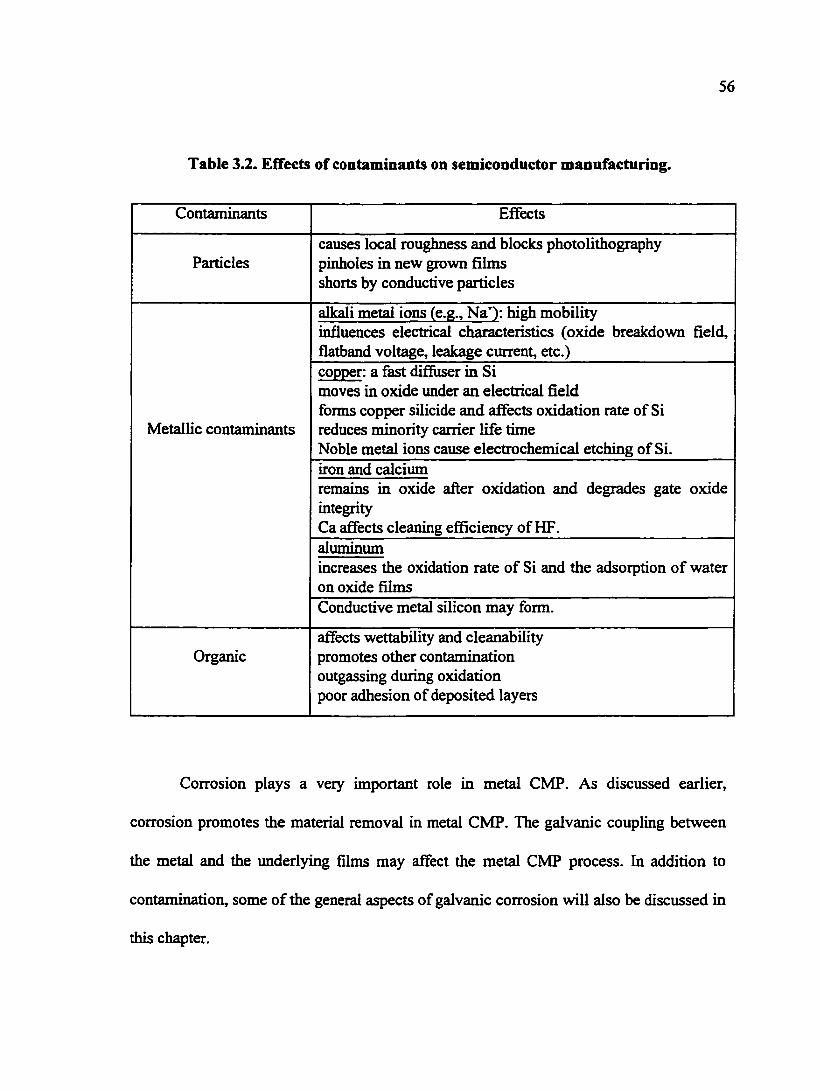
surrounding dielectric film causing process-induced metallic contamination [3.1]. Typical
contaminants that are found on wafer surfaces after CMP and their effects on the device
manufacturing are listed in Tables 3.1 and 3.2, respectively. A summary of CMP defects
and the effects of general surface contamination on device perfonnance can also be seen
in [3.2] and [3.3], respectively.
Table 3.1. Contaminatioii after CMP.
Contaminants Oxide CMP Metal CMP
Particles silica alumina or silica, metal firagments
Metallic ions K*, Ca'" Cu'*, Al'", Fe'*, Fe(CN)e\ FeCCN)^*-, 10 ', I'/I^
Organic tetramethyl ammonium salts, buffers, surfactants
buffers, surfactants, inhibitors
Mechanical defects scratches, stress scratches, puddling, plug coring, dishing and erosion, stress
56
Table 3.2. EfTects of contaminants on semiconductor manufacturing.
Contaminants Effects
Particles causes local roughness and blocks photolithography pinholes in new grown films shorts by conductive particles
alkali metal ions (e.g., Na"^): high mobility influences electrical characteristics (oxide breakdown field, flatband voltage, leakage current, etc.)
Metallic contaminants
copper: a fast difiuser in Si moves in oxide under an electrical field forms copper silicide and afTects oxidation rate of Si reduces minority carrier life time Noble metal ions cause electrochemical etching of Si. iron and calcium remains in oxide after oxidation and degrades gate oxide integrity Ca affects cleaning efficiency of HF. aluminum increases the oxidation rate of Si and the adsorption of water on oxide films Conductive metal silicon may form.
Organic affects wettability and cleanability promotes other contamination outgassing during oxidation poor adhesion of deposited layers
Corrosion plays a very important role in metal CMP. As discussed earlier,
corrosion promotes the material removal in metal CMP. The galvanic coupling between
the metal and the underlying films may affect the metal CMP process. In addition to
contamination, some of the general aspects of galvanic corrosion will also be discussed in
this chapter.
57
3.1. Particulate Contamination
One of the major problems in the semiconductor industry today is the removal of
slurry residue and other particles from the wafer surface after CMP [3.4, 3.5]. Particulate
contamination results from the interaction between the particles and the wafer surface.
3.1.1. Double Layer and Zeta Potential
It is well known that solid surfaces can develop surface charges in an aqueous
medium by many mechanisms; these include (i) adsorption of and OH" ions, (ii)
selective adsorption of positive or negative ions, (iii) ionization of surface groups, and
(iv) fixed charges in the matrix structure exposed due to counter ion release. Regardless
of the actual charging mechanism, the surface charge has to be balanced by the counter
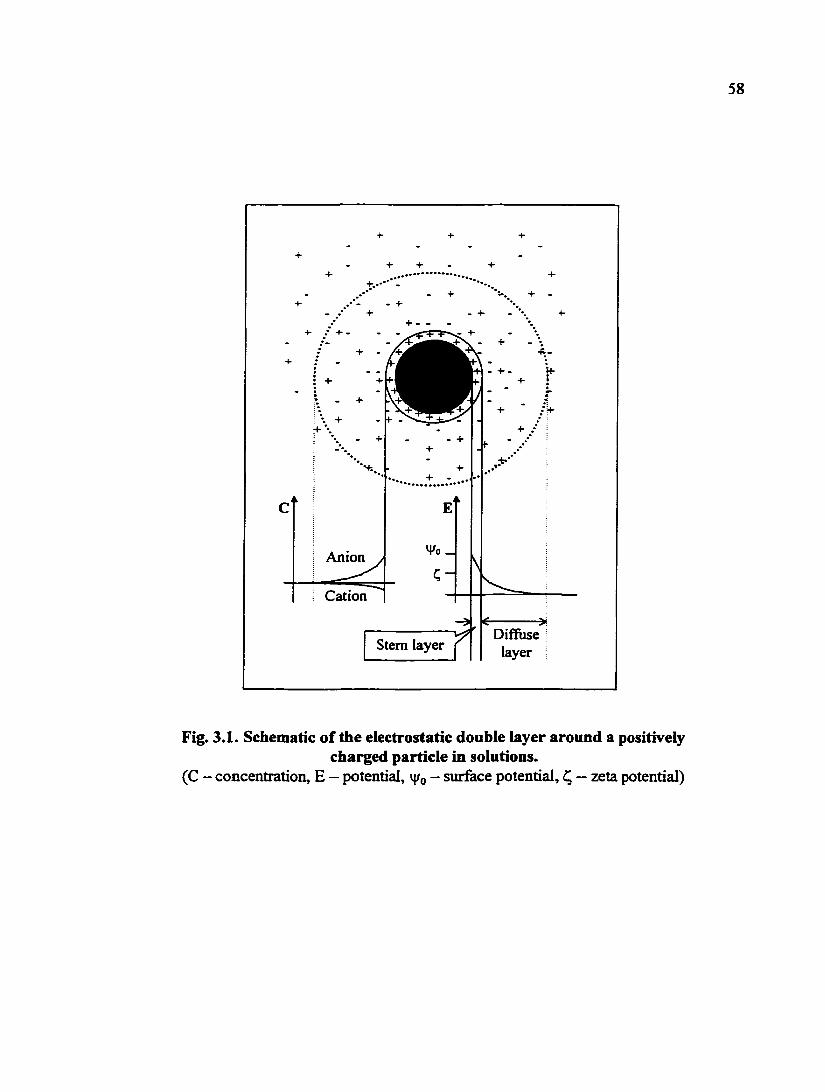
ions with opposite sign, and the so-called electric double layer is formed (Fig. 3.1, or
[3.6]). Cmdely, the distance from the surface when the surface potential drops to l/e"" its
value (i.e. v|/o/e) is called the "double layer thickness"(= 1/k). The double layer thickness
is closely related to the ionic strength of the solution, as will be discussed in the next
section.
The surface potential is not experimentally measvirable. A more commonly used
and experimentally measurable quantity is the zeta potential (Q. As illustrated in Fig. 3.1,
58
+ +
Anion
Cation
Stem layer rf Diffuse
layer
Fig. 3.1. Schematic of the electrostatic double layer around a positively charged particle in solutions.
(C - concentration, E — potential, v|/o - surface potential, — zeta potential)
59
zeta potential is the potential in the double layer at a short distance (i. e., typically of the
order of a diameter of a hydrated counter ion) from the surface of the solid. Both surface
charge (or surface potential) and zeta potential are a flmction of the solution pH.
Development of positive or negative charge at a given pH depends on the nature of the
metal-oxygen bond and the acid/base character of surface MOH groups (note: M denotes
metal atom.) The solution pH at which the surface bears no net charge is called the point
of zero charge (PZC); the solution pH at which the zeta potential ^ = 0 is called the
isoelectric point (lEP). lEP is equal to PZC if adsorption of ions occurs completely by
electrostatic forces. Some of the reported PZC values for materials of interest to
semiconductor industry are tabulated in Table 3.3.
Table 33. Reported PZC values of some materials.
Material PZC
Si 3 - 4 SiOj 2 - 4 SisN, 3-5.5 AlA 8 - 9 TiOz 5 - 6 PVA ~2
Nylon ~6
There are three major electrokinetic techniques to determine the zeta potential (or
electrokinetic potential) of solid surfaces: electrophoresis, streaming potential, and electro-
60
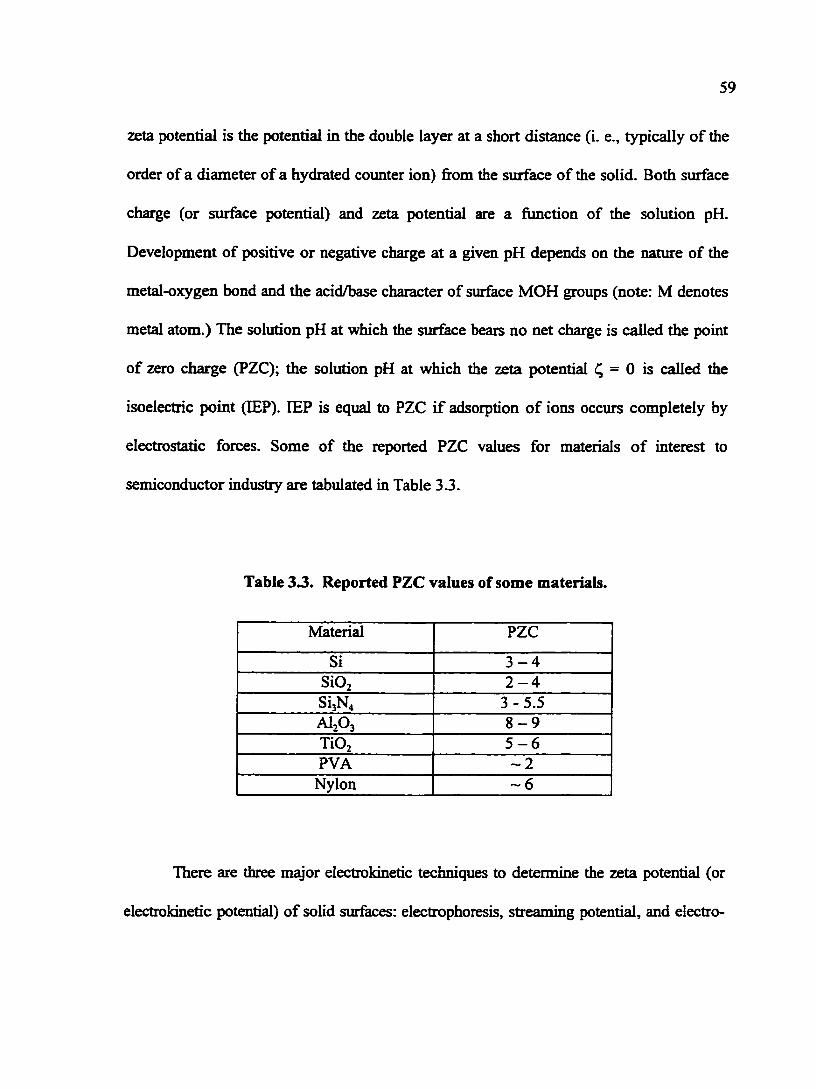
osmosis [3.7]. The electrophoretic method has been widely used in measuring the zeta
potential of abrasive particles used in CMP. The principle of the electrophoretic
measurement is schematically shown in Fig. 3.2. Particles move in an electrical field and
their mobility is direcdy related to the zeta potential as indicated by the following equation:
V eC - = — (3.1) E Krj
where v is the velocity of particles, E is the potential gradient, e is the dielectric constant
of the liquid, r| is the viscosity of the liquid, and K is the constant that has a value of 1 or
1.5 depending on whether particle size » double layer thickness or « double layer
thickness.
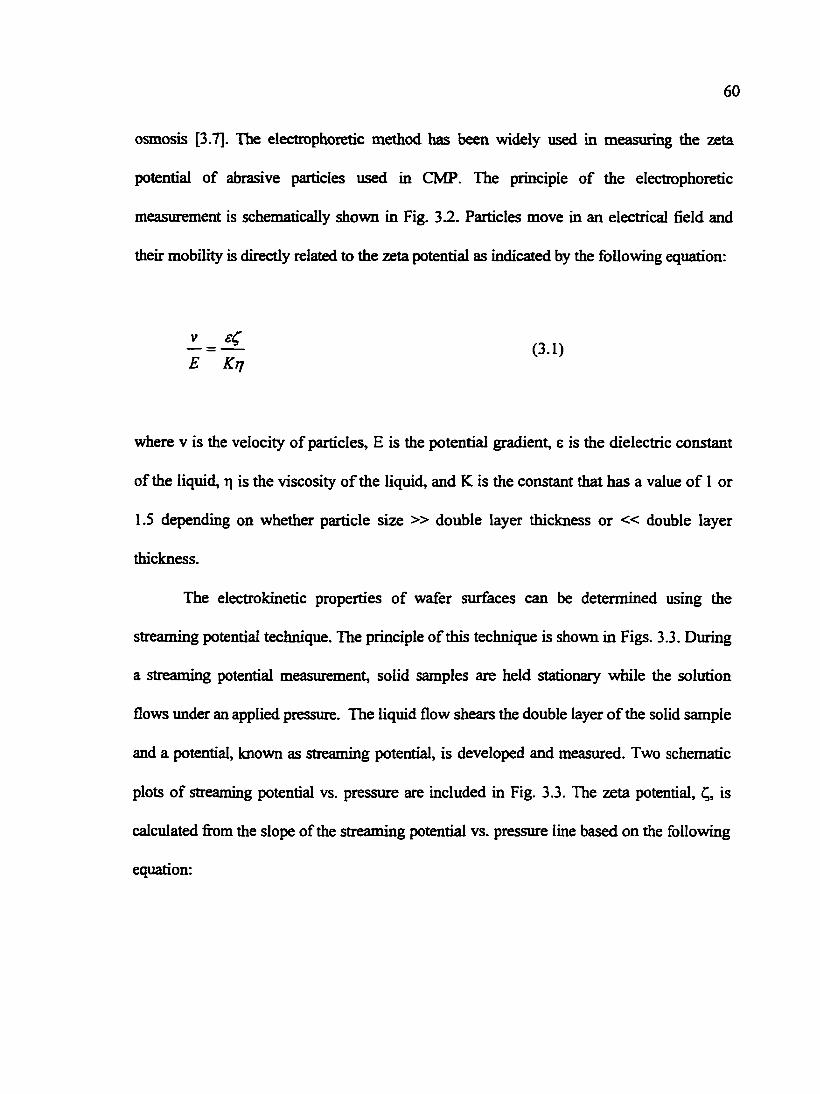
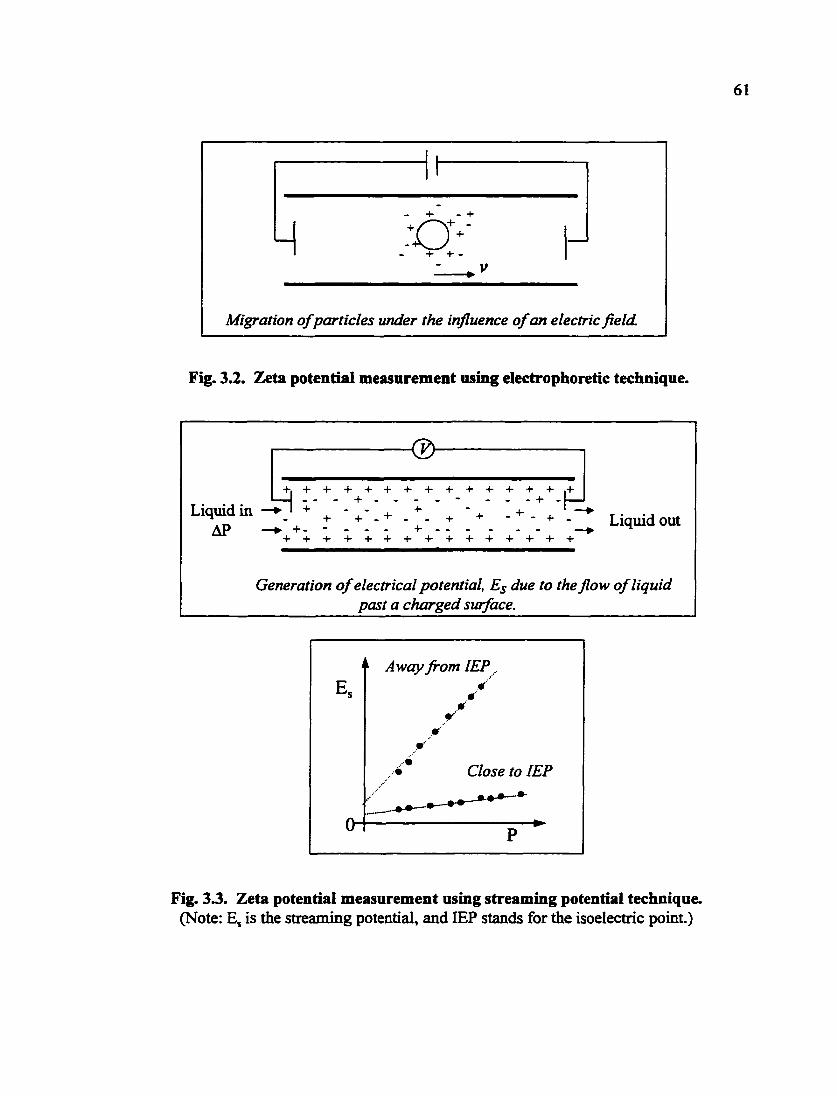
The electrokinetic properties of wafer surfaces can be determined using the
streaming potential technique. The principle of this technique is shown in Figs. 3.3. During
a streaming potential measurement, solid samples are held stationary while the solution
flows under an applied pressure. The liquid flow shears the double layer of the solid sample
and a potential, known as streaming potential, is developed and measured. Two schematic
plots of streaming potential vs. pressure are included in Fig. 3.3. The zeta potential, is
calculated fi-om the slope of the streaming potential vs. pressure line based on the following
equation:
Migration of particles under the influence of an electric field.
Fig. 3.2. Zetsi potential measurement using electrophoretic technique.
Liquid in AP —• +-
+ , + + + + + - » -y-:-
+ + + + , +
- - - + Fd + + - Liquid out + + + + + + + + + + + + +
Generation of electrical potential, Es due to the flow of liquid past a charged surface.
Away from lEP
Close to lEP
Fig. 33. Zeta potential measurement using streaming potential technique. (Note: E, is the streaming potential, and lEP stands for the isoelectric point.)
62
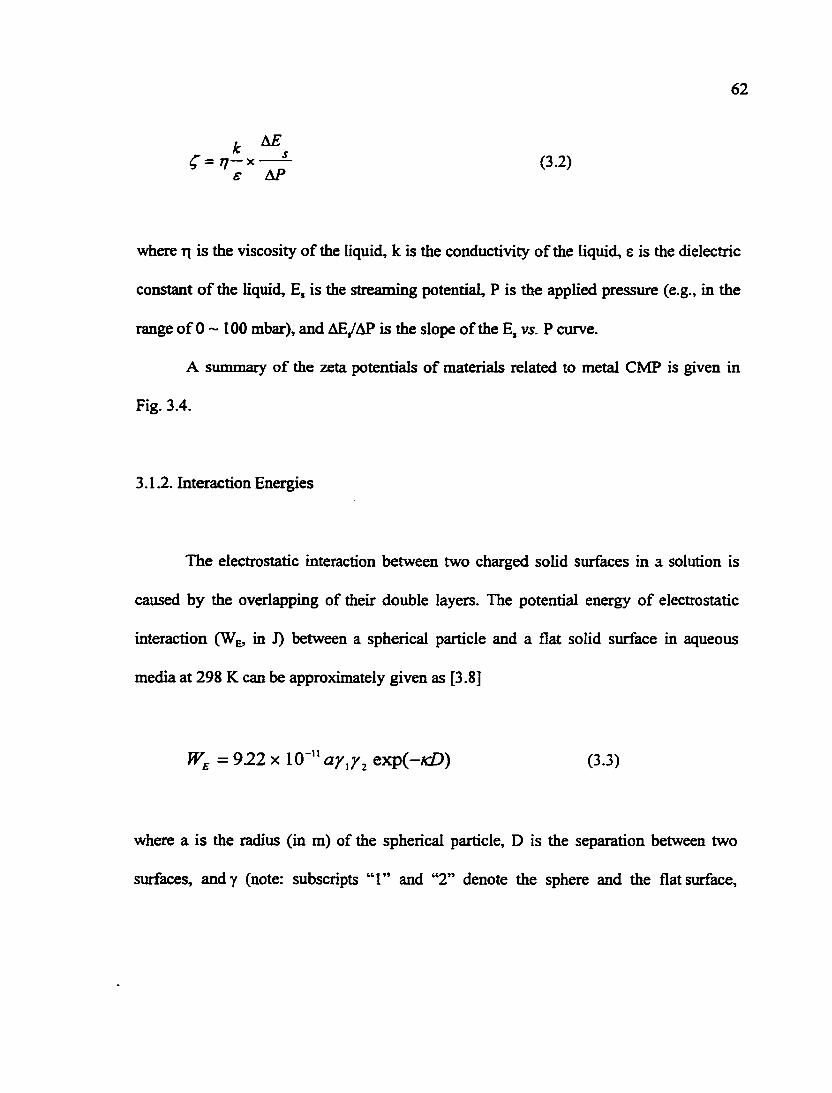
(3.2)
where ti is the viscosity of the liquid, k is the conductivity of the liquid, e is the dielectric
constant of the liquid, E, is the streaming potential, P is the applied pressure (e.g., in the
range of 0 ~ 100 mbar), and AE/AP is the slope of the E, vs. P curve.
A summary of the zeta potentials of materials related to metal CMP is given in
Fig. 3.4.
3.1.2. Interaction Energies
The electrostatic interaction between two charged solid surfaces in a solution is
caused by the overlapping of their double layers. The potential energy of electrostatic
interaction (Wg, in J) between a spherical particle and a flat solid surface in aqueous
media at 298 K can be approximately given as [3.8]
where a is the radius (in m) of the spherical particle, D is the separation between two
siufaces, andy (note: subscripts "1" and "2" denote the sphere and the flat surface.
= 922 X 10 " exp(-KD) (3.3)

63
• TOX
- -X- - CVD W
—o—PVDCu
—A—alumina 40
0 - - -
X T
-80
2 6 8 10 4
Fig. 3.4. Zeta potential measurements of alumina particles, TOX film, CVD
tungsten film, and PVD copper film in 10*^ M KNO, solutions. (* L. Zhang and S.
Raghavan, unpublished data)
64
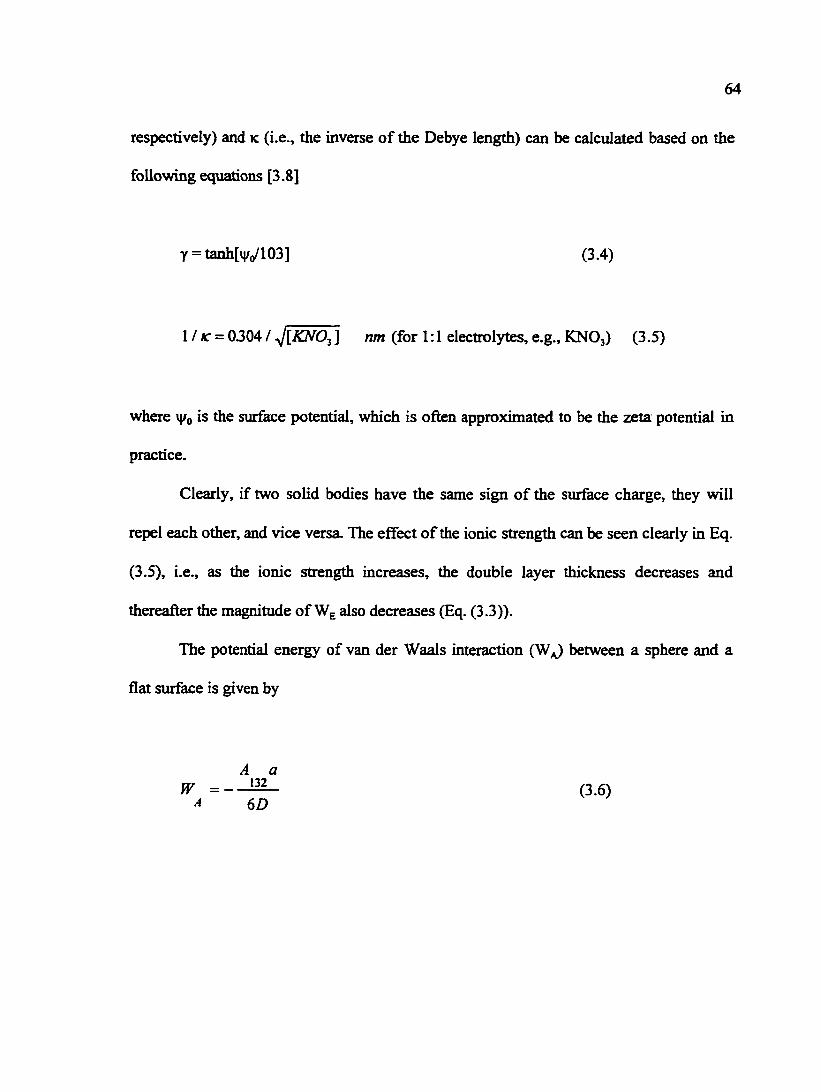
respectively) and k (i.e., the inverse of the Debye length) can be calctilated based on the
following equations [3.8]
y = tanh[n/o/103] (3.4)
1 / AC = 0304 / ^[KNO-^] nm (for 1:1 electrolytes, e.g., BCNO3) (3.5)
where vj/Q is the sxirface potential, which is often approximated to be the zeta potential in
practice.
Clearly, if two solid bodies have the same sign of the surface charge, they will
repel each other, and vice versa. The effect of the ionic strength can be seen clearly in Eq.
(3.5), i.e., as the ionic strength increases, the double layer thickness decreases and
thereafter the magnitude of also decreases (Eq. (3.3)).
The potential energy of van der Waals interaction (W^ between a sphere and a
flat surface is given by
W
A a 132 (3.6)
A 6D
65
where A,32 is the Hamaker constant (~ 10'" - 10*^° J) for siirface 1-surface 2 interaction in
a medium 3. The negative sign of the van der Waals energy shows that it is attractive in
nature.
According to the well known DLVO [3.8], the interaction between two charged
solid surfaces consists of electrostatic and van der Waals components. Fig. 3.5 shows one
plot of the interaction energy as a flmction of the separation between surfaces for the case
where the charges of the two interacting surfaces bear the same sign (otherwise, both the
van der Waals and the electrostatic interaction will be attractive.) The DLVO theory has
been used to interpret and explain particulate contamination during wet processing of
semiconductors [3.8-3.10].
Based on the DLVO theory, particle deposition on surfaces immersed in liquid
media is likely to occur if the total interaction energy is attractive. The van der Waals
interaction depends on the Hamaker constant of a certain combination of interacting
surfaces and the liquid medium, but it is always attractive. The most effective way of
controlling the particle deposition is to modify the surface potentials of the wafer surface
and particles. The goal is to make them electrostatically repel each other and thus the
attractive van der Waals interaction can be overcome. A variety of chemicals have been
shown to be effective in controlling particle contamination based on the modification of
zeta potentials [3.11, 3.12].
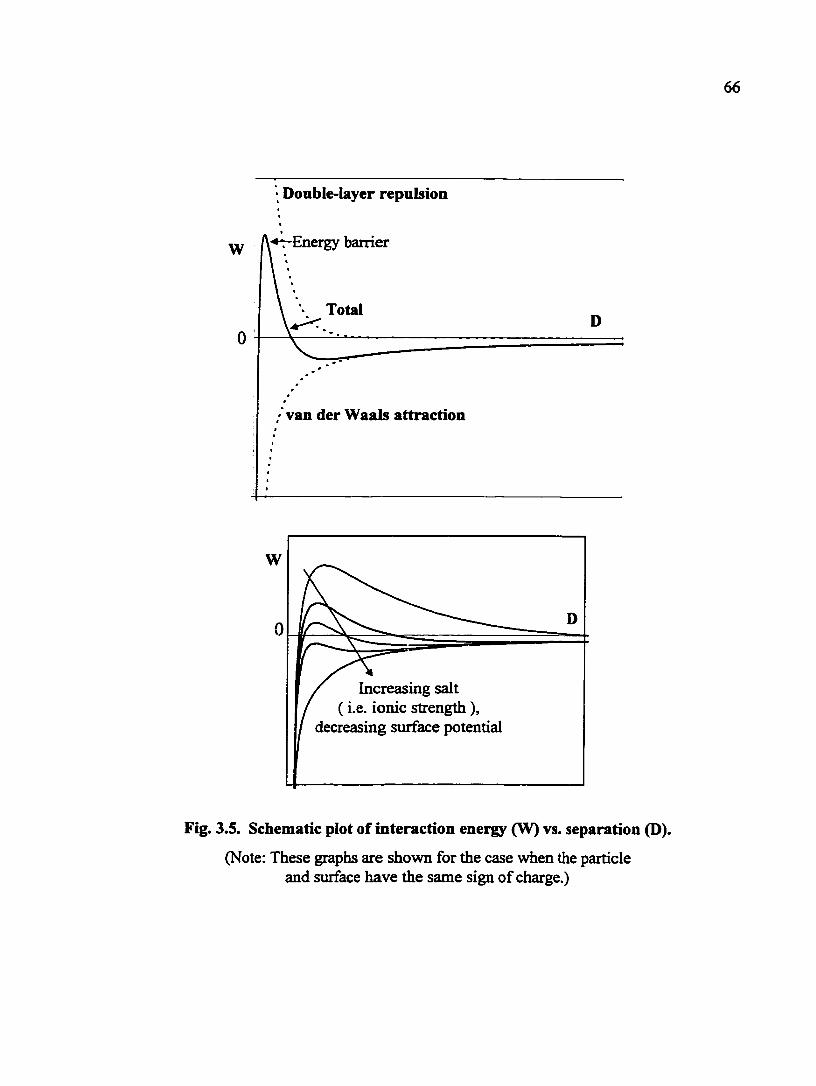
66
Double-layer repulsion
r-Energy barrier W
Total
0
van der Waals attraction
W
0
/ Increasing salt (i.e. ionic strength),
decreasing surface potential
Fig. 3.5. Schematic plot of interaction energy (W) vs. separation (D).
(Note: These graphs are shown for the case when the particle and surface have the same sign of charge.)
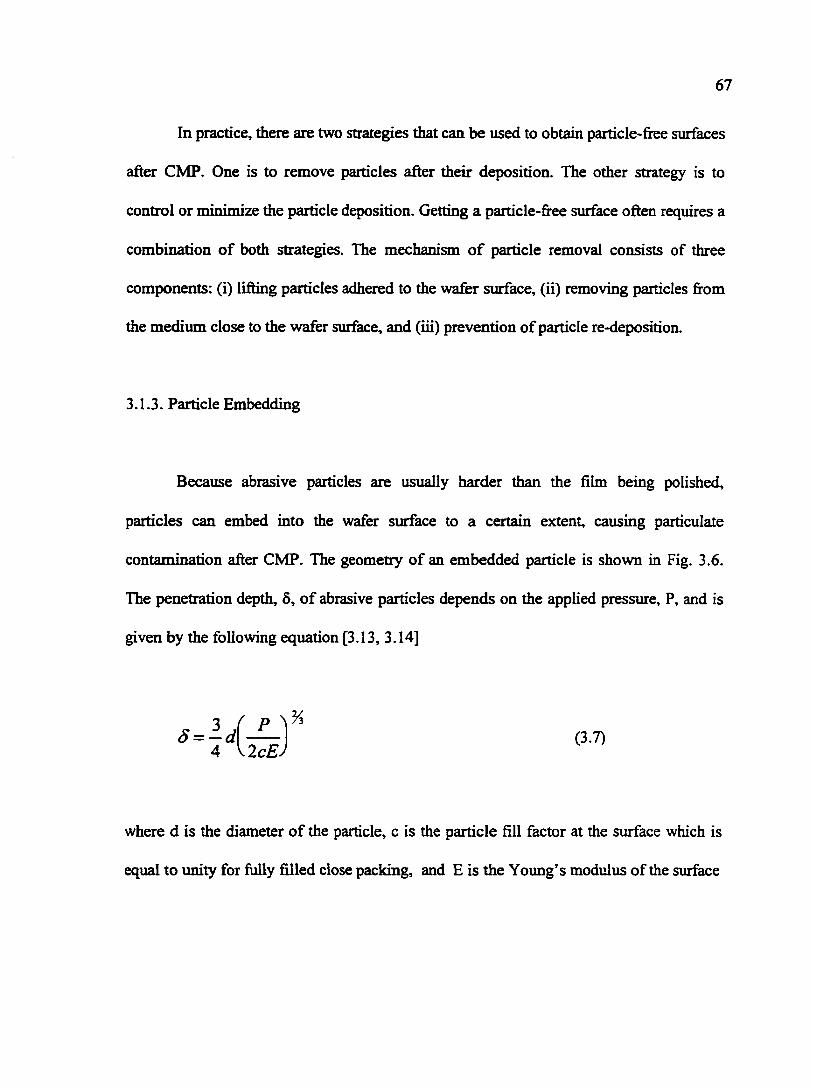
In practice, there are two strategies that can be used to obtain particle-free surfaces
after CMP. One is to remove particles after their deposition. The other strategy is to
control or minimize the particle deposition. Getting a particle-free siirface often requires a
combination of both strategies. The mechanism of particle removal consists of three
components: (i) lifting particles adhered to the wafer surface, (ii) removing particles from
the medium close to the wafer surface, and (iii) prevention of particle re-deposition.
3.1.3. Particle Embedding
Because abrasive particles are usually harder than the film being polished,
particles can embed into the wafer siuface to a certain extent, causing particulate
contamination after CMP. The geometry of an embedded particle is shown in Fig. 3.6.
The penetration depth, 6, of abrasive particles depends on the applied pressure, P, and is
given by the following equation [3.13, 3.14]
(3.7)
where d is the diameter of the particle, c is the particle fill factor at the surface which is
equal to unity for fully filled close packing, and E is the Young's modulus of the surface

68
Particle
p Wafer p
Fig. 3.6. Geometry of an embedded particle into the wafer surface during CMP
(adapted from [3.14]).
69
being polished. A similar discussion aix)ut indentation can be seen in an article by Tseng
and Wang, where the mechanical properties of the particle were also included and an
equation of the contact radius (r^, see Fig. 3.6) was derived from theories of contact
mechanics as follows [3.16]
<1) 1/3
1 - v ' 1 - v H (3.8)
In the above equation, F is the downforce, v and v are the Poisson's ratios of sample
surface and the particle, and E and E are the elastic moduli of the sample and particles,
respectively.
The typical value of the penetration depth of abrasive particles during metal CMP
ranges approximately from a couple of angstroms to several hundred angstroms. Particle
embedding serves as one of the major mechanism of material removal during CMP
[3.16]. Nanometer scale scratches are often seen in practice indicating the frequent
embedding of and subsequently scratching by particles on the wafer surface being
polished. With regard to particulate contamination, it seems that not all the embedded
particles stay on the surface after CMP. It has been reported that the embedding of
particles depend on the shape of the particle and the impact angle [3.17]. It is noteworthy
that embedded particles are very difficult to remove due to a large contact area between
70
the particles and the wafer surface, compared to other particles with a point contact with
the wafer surface.
3.1.4. Modeling of Particle Deposition in Solutions
In general, particles can deposit from solutions onto wafer surfaces by "in-
solution" mechanism and interface mechanism. According to the "in-solution"
mechanism, particles close to the wafer deposit on its surface; this deposition creates a
concentration gradient triggering particle dif^usion to the wafer. Contanunation by this
mechanism is proportional to particle concentration in solution and immersion time. In
the interface mechanism, contamination is considered to occur during the movement of
the wafers from liquid to air. Without considering the siuface tension based forces and
interface mechanism [3.17, 3.18], the in-solution particle deposition can be modeled
based on the interaction energy between the particles and the wafer surface and the one-
dimensional diffusion theory [3.11].
The one-dimensional steady state diffusion equation in a force field can be
expressed as
j = -D— + v« (3.9)
71
where j is the flux of particles, D the diffusion coefficient of particles, n the number
concentration of particles, x the distance &om the wafer surface, and v the velocity of
particles. The velocity of particles is related to the interaction energy as shown below:
\ 3V DM v = (3.10)
f dc kT 3c
where / is the friction coe£5cient which is equal to kT/D according to the Einstein
Equation, W is the total interaction energy, k is the Boltzmnann constant, and T is the
absolute temperature. Combining Eqs. (3.9) and (3.10), the equation of particle diffusion
can be written as
ch \ M j — + n + —= 0 (3.11) dm kT dn D
The boundary conditions aren = 0atx = 0 and n = n^ at x = d, where d is the thickness of
the diffusion layer and n^ is the number concentration of particles at x = d, which is
considered to be representative of the number concentration of particles in the processing
bath. The solution to Eq. (3.11) is
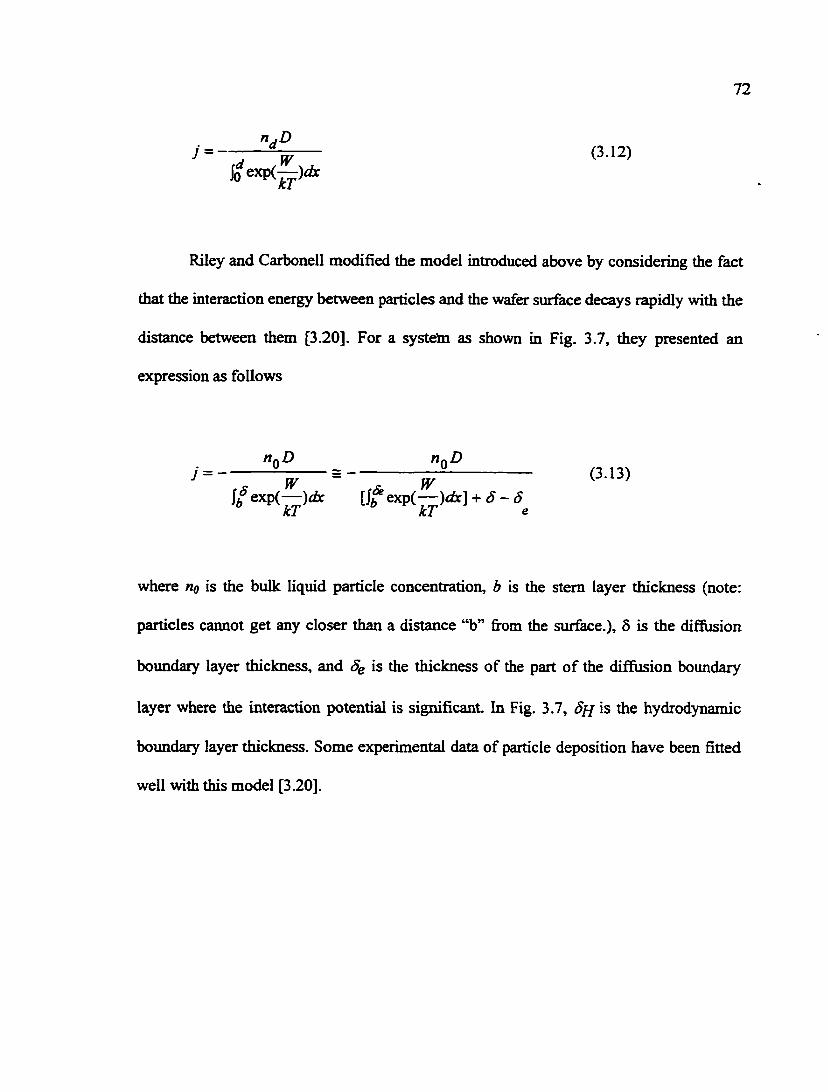
72
Joexp(-^)i&
rijD (3.12)
Riley and Carbonell modified the model introduced above by considering the fact
that the interaction energy between particles and the wafer surface decays rapidly with the
distance between them [3.20]. For a systeta as shown in Fig. 3.7, they presented an
expression as follows
where no is the bulk liquid particle concentration, b is the stem layer thickness (note:
particles cannot get any closer than a distance "b" from the surface.), 5 is the diffusion
boundary layer thickness, and Sg is the thickness of the part of the dififiision boundary
layer where the interaction potential is significant. In Fig. 3.7, Sfj is the hydrodynamic
boundary layer thickness. Some experimental data of particle deposition have been fitted
well with this model [3.20].
(3.13) J = -w w
[i?- ^ S - S kT kT e
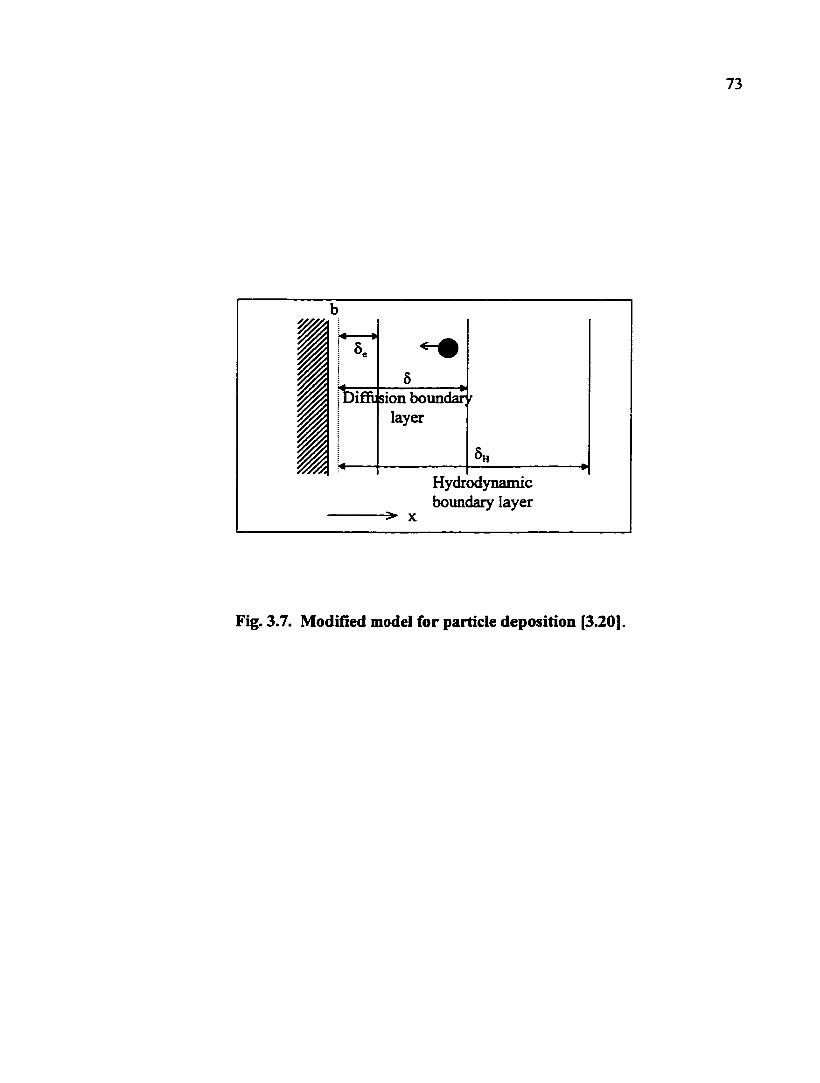
73
lloifEi] sion boundar layer
Hydrodynamic boundary layer
^ X
Fig. 3.7. Modified model for particle deposition [3.20].
74
3.2. Metallic Contamination
3.2.1. General Aspects
As shown in Tables 3.1 and 3.2, many metallic species can contaminate the wafer
smface during CMP, causing a variety of damaging effects on the manufacturing and
performance of IC devices. Based on whether electrons are transferred and the valence of
elements changes, the mechanisms of metallic contamination can be classified into
electrochemical and surface chemical types.
Metallic contamination results from the interaction between the metal ions in
solutions and the solid wafer siuface. It has been noted that different metal ions behave
differently. For example, Loewenstein and Mertens recently analyzed the adsorption of
several metal ions onto chemical silicon oxide surfaces (i.e., the oxide of silicon grown
on the silicon surface by oxidation in aqueous solutions) [3.21]. In a narrow pH range of
3 to 5.6 and with certain metal concentrations in the nitric acid solution, a relationship
between surface metal level and the ratio of ionic charge to ionic radius was
demonstrated. It is known that noble metals such as copper can deposit onto the silicon
surface in certain solutions. Numerous researches have been reported on this subject
[3.22]. However, the electrochemical deposition of metal ions onto bare silicon siurface
has little significance in current metal CMP process and is beyond the scope of this study.
With respect to wet processes, one of the obvious differences between bare silicon and
75
oxide films is that the former is much more hydrophobic than the latter. Most oxide
surfaces are electrical insulators preventing easy transfer of electrons between the oxide
surface and the metal ions near the solid/solution interface. Therefore, the stirface
adsorption/complexation models need to be applied to the understanding of metallic
contamination on oxide surfaces.
Strictly speaking, metallic contamination on oxide surfaces can be due to both the
adsorption of dissolved metal species and the precipitation of insoluble metal compounds
on the solid wafer svirface. Farley et al. developed a model for the sorption of cations on
metal oxides by considering both precipitation and surface reactions [3.23]. The model
extends the surface complexation approach by describing the precipitation on the solid
using the formation of a solid solution between the original solid and a pure precipitate of
the sorbing cations. During metal CMP processes, metallic contamination on the oxide
surface occurs most probably as a resiilt of the adsorption of metal species, because the
CMP slurry chemistry is usually designed such that the materials removed firom the metal
film can be dissolved. Therefore, the discussion below is focused on the surface
complexation between metal ions and the solid oxide surface.
3.2.2. Surface Complexation
Hirastuka et al. [3.3] investigated the effect of solution pH on metallic
contamination of Fe, Al, Zn, Ni, Cu, Cr and Na on both hydrophobic and hydrophilic
76
silicon surfaces. They claimed that metallic contamination on the surfaces is not due to
the electrostatic force between the dissolved metal ions and the wafer surface.
Furthermore, they proposed that a simple reaction, such as the one shown below, is
responsible for the contamination of Al, Fe and Ni [3.3].
Several chemical models have been developed and extensively used for
adsorption studies of metallic contaminants in soil science. A summary of these models
can be seen in [3.24]. Based on the surface complexation model, silica surface can behave
as an acid or base depending on the solution pH. In a system without specific adsorption,
three species exist on the silica surface and the chemical interactions between them are
represented by the following reactions:
Al-OH + OH-Si ^ Al-O-Si + Hp (3.14)
=SiOH CO =SiO- + BT (3.15)
sSiOH + BT o =SiOH2* (3.16)
Actually, these are the reactions which determine the surface potential of the silica
sxjrface. From Eqs. (3.15) and (3.16), it is clear that the silica surface becomes less
positive, or more negative, as the solution pH increases (Fig. 3.4) because the species of
77
=SiO* begins to dominate the surface speciation at high pH's. The double layer criterion
in the modeling is reflected by the Boltzmann equation, which relates the surface
concentrations of species to their concentrations in the bulk solution. The Boltzmann
equation can be written as
where [M^], is the surface concentration of ion M°* with n+ charge (note: the ion can also
be an anion with a negative charge), [M°^]b is the concentration of in the bulk
solution, % is the surface potential (which can be approximated as the zeta potential), F
is the Faraday constant, R is the gas constant, and T is the absolute temperature. For Eqs.
(3.15) and (3.16), M is H and n is equal to 1.
For the adsorption of metals onto a solid surface, e.g., Cu^"" onto silica, the surface
complexation reactions can be written as follows:
[NT], = [M°*]bexp(-nToF/RT) (3.17)
=siOH + cxi * o =siocu" + tr (3.18)
2 sSiOH + Cu^* (sSiOzCu + 2 IT (3.19)
In the calculation of the equilibrium constants for the above equations, either or
is used for the intrinsic (i.e., K""-) or apparent (i.e., K*") constants, respectively.
78
Two of the important parameters in such models are the density of active -OH sites on
the solid surface that can adsorb the adsorbate species and the equilibrium constants of
the surface adsorption reactions, both of which can be experimentally determined. Based
on the mass law equations and the mass conservation principle, the level of metallic
contamination on the solid oxide surface in a solution (containing a known initial amount
of metal species and with a known pH and ionic strength) can be calculated using
commercially available programs (see Experimental). As Lee et al. reported for the
adsorption of several metal ions onto chemical oxide surfaces, there is a correlation
between the experimental data and the modeling results based on the surface
complexation and double layer principles [3.25].
3.3. Galvanic Corrosion
3.3.1. Electrochemistry
Chemical (including electrochemical) reactions of the metal film to be polished
play an important role in the metal CMP process [3.14, 3.25]. Metal CMP slurries are
corrosive in nature. In addition to other components, oxidants are used in metal CMP to
control the oxidation reaction of the metal film, which can be passivation or dissolution.
Electrochemically, two of the critical parameters of the metal CMP slurry are its pH and
redox potential.
79
A thermodynamic calculation of reactions between the possible species can be
used to construct a diagram where the stable form of an element can be shown in the
coordinates of the redox potential and the pH. This type of diagrams is called Pourbaix
diagram, or Eh-pH (or E-pH) diagram. By knowing the pH and redox potential of the
CMP slurry, the stable species and the chemical reactions involved in metal CMP can be
predicted. The Eh-pH diagrams of the silicon - water and aluminimi - water systems are
illustrated as Figs. 3.8 and 3.9. These two systems are of interest to metal CMP because
they account for the most exposed surface area after CMP and the abrasive alumina
particles in CMP slimies, respectively. For example, it can be seen from Fig. 3.8 that
silica dissolves in aqueous solutions with high pH values, i.e., pH > 9. During metal
CMP, the removal rate of silica is usually slower than that of the metal film, leading to
the recess of metal areas at the final stage of polishing. A certain extent of dissolution of
silica in a basic solution (during CMP or after CMP) may help in leveling the metal and
oxide films. As indicated in Fig. 3.9, aluminum metal is only stable when the redox
potential of the system is very low or the system is strongly reducing. In the stability
region of water, alumimmi can exist as dissolved species of Al^* at low pH or AIO2" at
high pH, or it can form the solid gibbsite phase when the pH is from approximately 4.8 to
7.8 (note: This is under the condition that the activity of the dissolved alvraiinum species
is 10"^ M.)
Metal CMP slurries are corrosive and contain oxidants, so corrosion reactions of
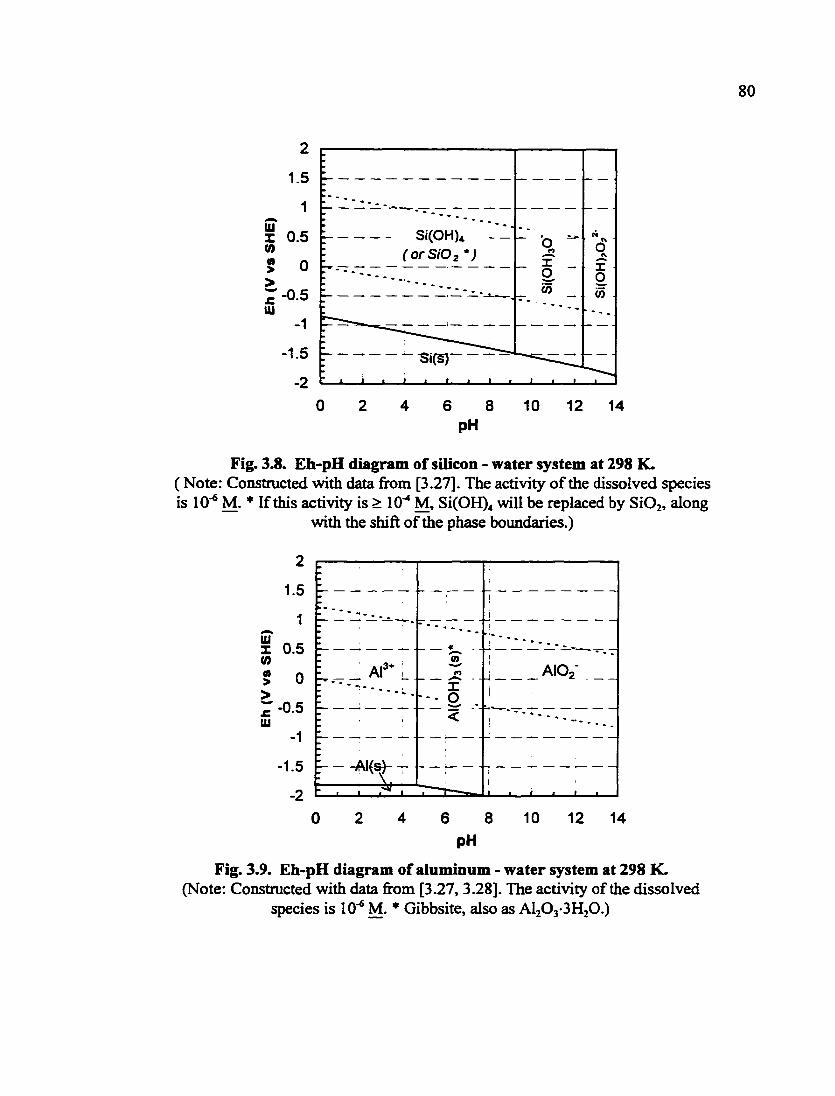
80
2
1.5
1
X 0.5
0
-0.5
1
1.5
2 0 2 4 6 8 10 12 14
Fig. 3.8. Eh-pH diagram of silicon - water system at 298 K. ( Note: Constructed with data from [3.27]. The activity of the dissolved species is 10"^ M. * If this activity is > 10"^ M, Si(0H)4 will be replaced by Si02, along
with the shift of the phase boundaries.)
2
1.5
1
Eh (V vs SHE
. P
P
cn
o
cn
_ _ _ A l ^ * L «n - -X o
<
1 • • •
j AIOz" 1
• •
-1.5
-2 . . H , . -I
1
1 J ' 1 1
0 2 4 6 8 10 12 14
Fig. 3.9. Eh-pH diagram of aluminum - water system at 298 K. (Note: Constructed with data from [3.27, 3.28]. The activity of the dissolved
species is 10"^ M. * Gibbsite, also as A1203-3H20.)
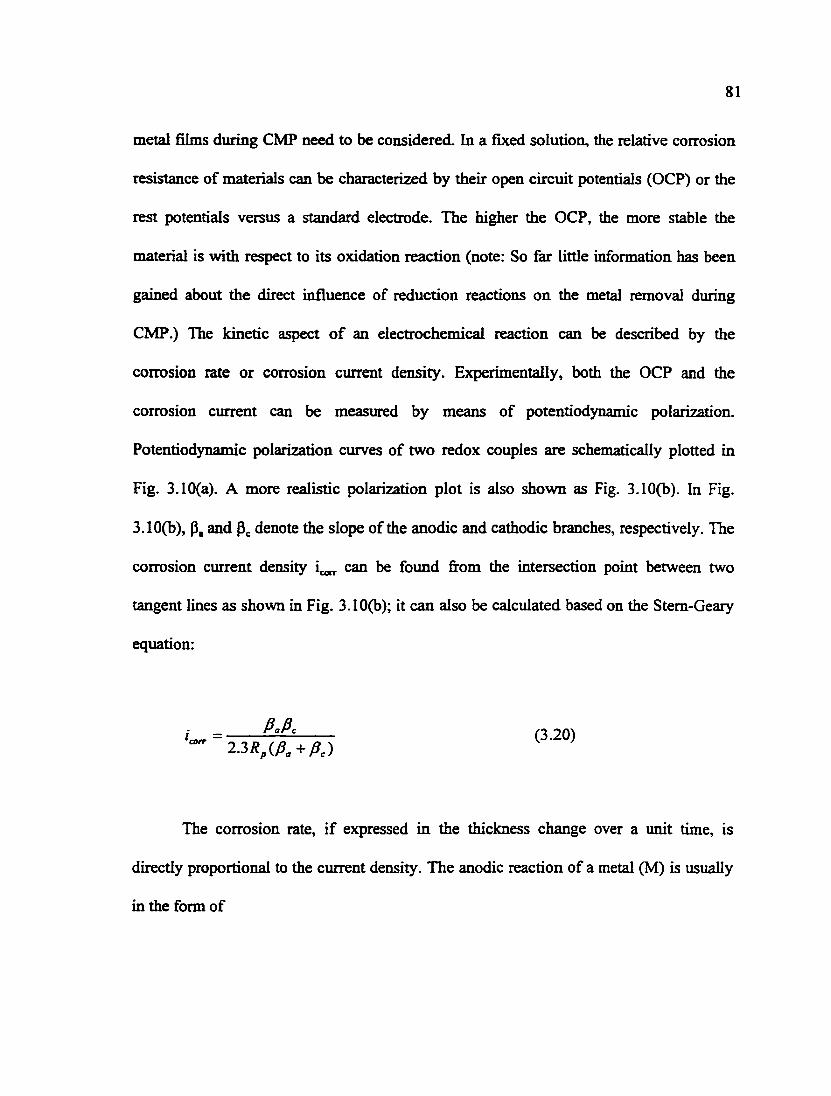
81
metal films during CMP need to be considered. In a fixed solution, the relative corrosion
resistance of materials can be characterized by their open circuit potentials (OCP) or the
rest potentials versus a standard electrode. The higher the OCP, the more stable the
material is with respect to its oxidation reaction (note: So far little information has been
gained about the direct influence of reduction reactions on the metal removal during
CMP.) The kinetic aspect of an electrochemical reaction can be described by the
corrosion rate or corrosion current density. Experimentally, both the OCP and the
corrosion current can be measured by means of potentiodynamic polarization.
Potentiodynamic polarization curves of two redox couples are schematically plotted in
Fig. 3.10(a). A more realistic polarization plot is also shown as Fig. 3.10(b). In Fig.
3.10(b), p, and denote the slope of the anodic and cathodic branches, respectively. The
corrosion current density i^on^ can be found from the intersection point between two
tangent lines as shown in Fig. 3.10(b); it can also be calculated based on the Stem-Geary
equation:
i = (3.20)
The corrosion rate, if expressed in the thickness change over a unit time, is
directly proportional to the ciorrent density. The anodic reaction of a metal (M) is usually
in the form of
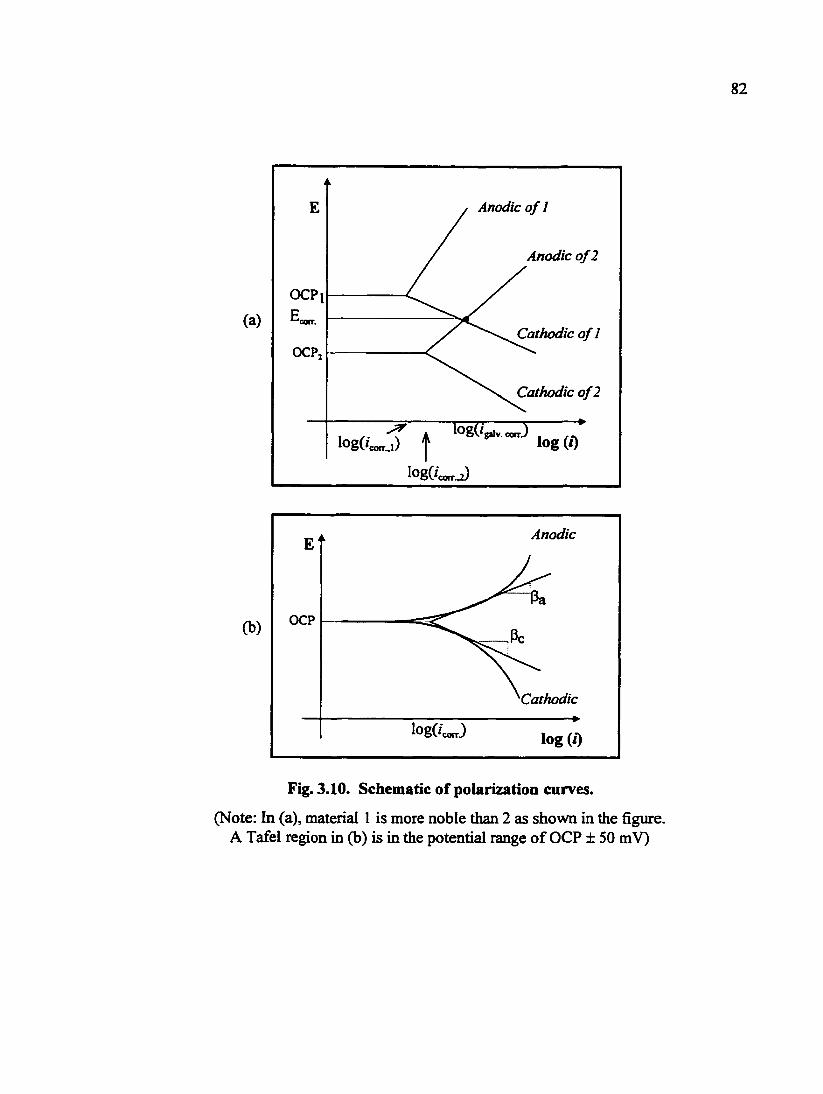
82
(a)
E , Anodic of 1
/ Anodic of 2
OCPi P
/ / OCPi P COT.
OCPi y'^^^^^Cathodic of 1
COT.
OCPi
Cathodic of 2
I /• A ^®80'gilv. coit3 , log(Wi) t 'og W
l0g(/c„J
(b)
E Anodic
OCP OCP Pc
^Cathodic
10g(/e„r) log (/)
Fig. 3.10. Schematic of polarization curves.
(Note: In (a), material 1 is more noble than 2 as shown in the figure. A Tafel region in (b) is in the potential range of OCP ± 50 mV)
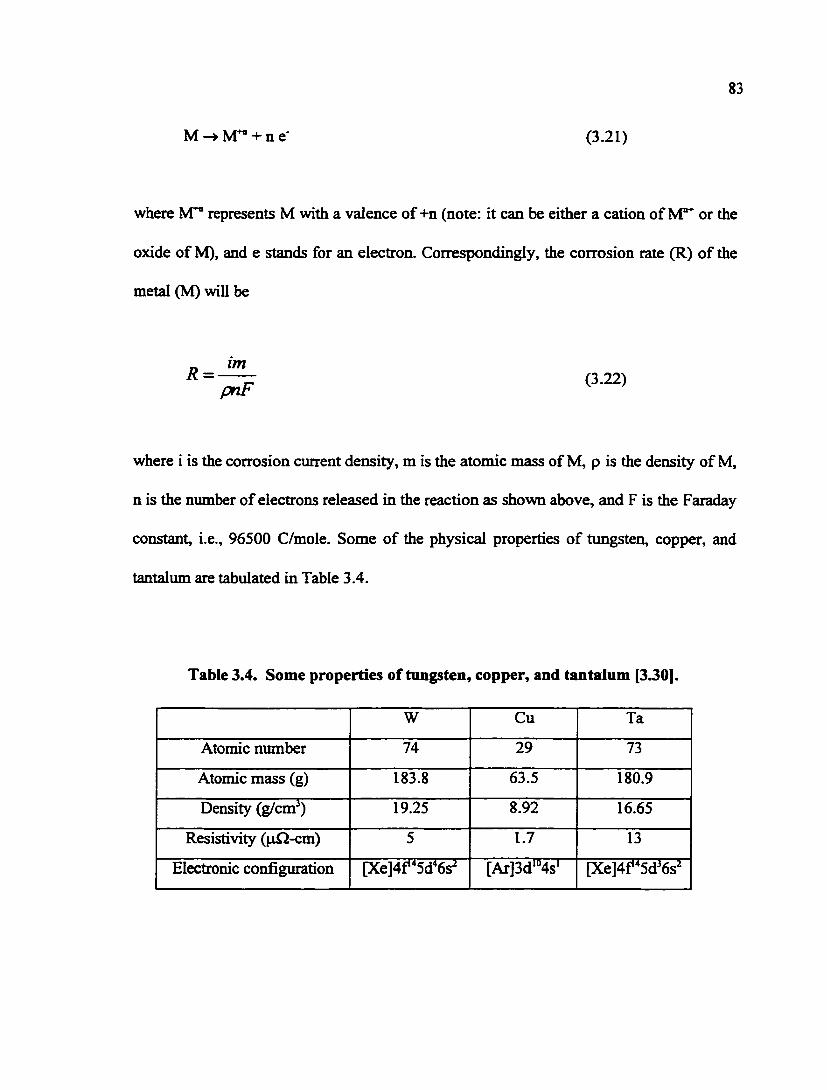
M - * • N T " + n e '
83
(3.21)
where represents M with a valence of +n (note: it can be either a cation of or the
oxide of M), and e stands for an electron. Correspondingly, the corrosion rate (R) of the
metal (M) will be
pnF (3-22)
where i is the corrosion current density, m is the atomic mass of M, p is the density of M,
n is the number of electrons released in the reaction as shown above, and F is the Faraday
constant, i.e., 96500 C/mole. Some of the physical properties of tungsten, copper, and
tantalum are tabulated in Table 3.4.
Table 3.4. Some properties of tungsten, copper, and tantalum [3.30].
W Cu Ta
Atomic number 74 29 73
Atomic mass (g) 183.8 63.5 180.9
Density (g/cm^) 19.25 8.92 16.65
Resistivity (^Q-cm) 5 1.7 13
Electronic configuration [Xe]4f'5d'6s^ [Ar]3d"'4s' [Xe]4f'5d'6s'
84
The cathodic reaction can be a reaction directly involving the metal itself, i.e., the reverse
of Eq. (3.21). It can also be one or more of the following reactions:
2 IT + 2 e- -• Hz (3.23)
O2 + 2 H2O + 4 e -> 4 OH- (3.24)
Recently it was found that the corrosion rate calculated from the measured
corrosion current density of tungsten films during tungsten CMP is very small compared
to the actual polishing rate [3.25, 3.30]. It should also be pointed out that, with abrasion,
the exposed area of the metal film is smaller than the geometrical area by which the
corrosion current measurement is reported. The actual corrosion current density may be
greater than the reported value. Under the conditions of metal CMP, dislodging of grains
or clusters of atoms assisted by corrosion preferentially occurring around the grain or at
the grain boundary should account for a certain part of the material removal [3.25, 3.31].
For metal CMP processes, the slurry development and characterization and the
understanding of material removal mechanisms rely heavily on electrochemical analyses.
So far much research has been done on the electrochemistry of the CMP processes of
tungsten [3.25, 3.30, 3.32-3.34] and copper [3.14, 3.35-3.39]. Since Heyboer et al.'s work
on silicon CMP [3.41], in situ electrochemical measurements in CMP have gained
increasing attention for small-scale simulation of the CMP process.

85
3.3.2. Galvanic Coupling
When two dissimilar conducting materials are in electrical contact in an
electrolyte solution, a galvanic couple may be formed between the two materials.
Galvanic corrosion can be defined as the corrosion of one metal in contact with another in
a conducting, corrosive environment The corrosion is stimulated by the potential
difference that exists between the two materials [3.42]. When they are in contact, one is
more active (e.g., "2" in Fig. 3.10(a)) than the other (e.g., "1" in Fig. 3.10(a)) and thus
behaves as the anode releasing electrons while the other is the cathode accepting
electrons. Usually the nobler one will be protected without corrosion reactions. In the
presence of galvanic coupling, the corrosion current density of the materials is no longer
io^ but ijo^ (Fig. 3.10(a)). In general, when there is a galvanic coupling, the corrosion
current of the material "2" will increase. Factors affecting galvanic corrosion were listed
in [3.42], such as the electrode potentials, the area ratio, mass transport, and the bulk
solution envirormient.
Different materials are involved in metallization for making interconnects, and
bimetallic contacts are extensively encountered in the IC fabrication. The effect of
galvanic corrosion on metallization structures are of increasing interest [3.42-3.47]. For
example. Griffin, Jr. et al. developed a galvanic series for a variety of thin-film
metallization and barrier layers deposited on oxide substrates using NH4CI electrolyte
86
[3.46]. Prasad et al. reported that adsorbed fluoride ionic species on the
microeiectromechanical device activate a bimetallic corrosion on the Al-Si-Ti/TiW
contacts and water rinse or replacement of TiW by TLAi, completely eliminated the active
corrosion [3.48]. It may be noted from Figs. 2.1 and 2.2 that at a certain stage of tungsten
or copper CMP, both the interconnect metal (i.e., tungsten or copper) and the imderlying
layer (i.e., TiN or tantaliim) are simultaneously exposed to the polishing slurry. Since the
underlying film is a conductor, a galvanic couple forms between the metal and the
underlying layer during the final stage of metal CMP.
The implication of galvanic coupling between neighboring materials during CMP
has been gaining some attention. In copper CMP, the resulting current flow between
copper and the barrier can cause the anomalous removal of materials in regions where
copper and barrier are in close proximity, such as the so-called "anti-dishing" where the
material is removed at the edges of large features and remains in the center [3.38]. Zeidler
et al. found that the presence of copper affects both the etching rate and the polishing rate
of Ti-W, but no galvanic interaction was observed if TiN was used as a barrier metal for
copper [3.49]. Steigerwald et al. reported a detailed study on the galvanic interaction
between copper and the barriers of titanium and tantalum [3.15]. They noted that the
galvanic corrosion has a significant effect on barrier removal. In addition, benzotriazole
(BTA) was found to inhibit the galvanic corrosion due to the strong interaction between
BTA and copper.
87
The effects of galvanic corrosion on metal CMP will depend on the area ratio of
the two materials, and the active time, as well [3.38]. Usually the barrier film has a much
smaller area than the conductor metal film. Actually, the metal film itself can form a
galvanic corrosion cell because part of the film can be more passivated while some of the
film may be fresher because of the mechanical attacks such as the impingement of
abrasive particles. Similar galvanic effect has been observed between aluminum and its
corrosion product during chemical cleaning of an aluminum structure [3.44]. It has also
been shown that the presence of abrasion will cause the OCP shift of the metal film [3.14,
3.25, 3.30]. When the surface morphology is significant and not all the spots on the film
are in good contact with the pad, a galvanic corrosion cell can be formed.

88
Chapter 4
EXPERIMENTAL
4.1. Materials
4.1.1. Wafers
Samples used in this study included p-type silicon wafers coated with 5300 A
silicon dioxide, p'^-type silicon wafers coated with a thin (100 A) silicon dioxide, ~ 9000 A
CVD tungsten wafers, reactive sputtered TiN (500 A) on an underlying layer of 200 A
titanium, PVD and electroplated copper, CVD tetraethylorthosilicate (TEOS) and wafers
of borophosphosilicate glass (BPSG) with tungsten plugs.
For electrochemical experiments, wafers diced into 1.5 cm x 1.5 cm were used. For
polishing experiments, wafer samples of 2.5 cm x 4.5 cm were used. Either small pieces of
1.5 cm X 1.5 cm or whole 6" wafers were used for immersion experiments.
4.1.2. Chemicals and Slurries
Citric acid solutions used in this study were prepared with citric acid monohydrate
purchased fix)m Fisher. Malonic acid was purchased from Sigma. Other chemicals included
89
ferric nitrate nonahydrate (99.8%) from Sigma, potassium iodate (99.5%) from Aldrich,
and cupric nitrate (99.3%) from Sigma.
Millipore 18 MQ ultrapure DI water and ppb grade chemicals (i.e., HjOj, KNO3,
KOH, NH4OH, HCl, HNO3, etc.) were used in this study. Unless otherwise notified, all pH
adjustments were made with KOH and HNO3.
High purity (99.99%) alumina powder (0.4 jxm in diameter) from Cerac was used to
prepare most of the deposition or polishing slurries. Ultrafine alumina (13 nm in diameter)
from Degussa was also used to prepare some of the slurries. A commercial hydrogen
peroxide-based acidic alumina slurry and a commercial iodate-based acidic alimiina slurry
were also used during the study.
4.1.3. Polishing Pads
Stacked pads (Suba IV/IC 1000) donated by Rodel were utilized for polishing
experiments.
90
4.2. Methods
4.2.1. Pietreatment of Wafer Samples
Before experiments, most oxide wafer samples were pretreated by (i) dipping in 4:1
piranha for 10 min. followed by DI water rinsing, (ii) dipping in 100:1 HF for 30 sec.
followed by DI water rinsing, and (iii) nitrogen drying. For electrochemical tests, tungsten
and TiN wafers were cleaned with diluted KOH (pH ~ 11) for approximately 1 min.
followed by DI rinsing \^^e copper wafers were treated with diluted HCl (pH ~ 1) for 0.5
min. followed by DI rinsing.
4.2.2. Electrokinetic Measurements
Electrophoresis and streaming potential techniques were used intensively in this
study to characterize the electrokinetic properties of alumina particles and wafer samples,
respectively.
4.2.2.1. Electrophoresis
The zeta potential measurements on particles were carried out using a Pen Kem 501
Laser Zee Meter. Except for dilute slurries, all slurries were centrifiiged in order to remove
most of the solid particles and their supematants were collected for zeta potential
measurements. During the measurements, an electric field gradient of 15 V/cm was applied
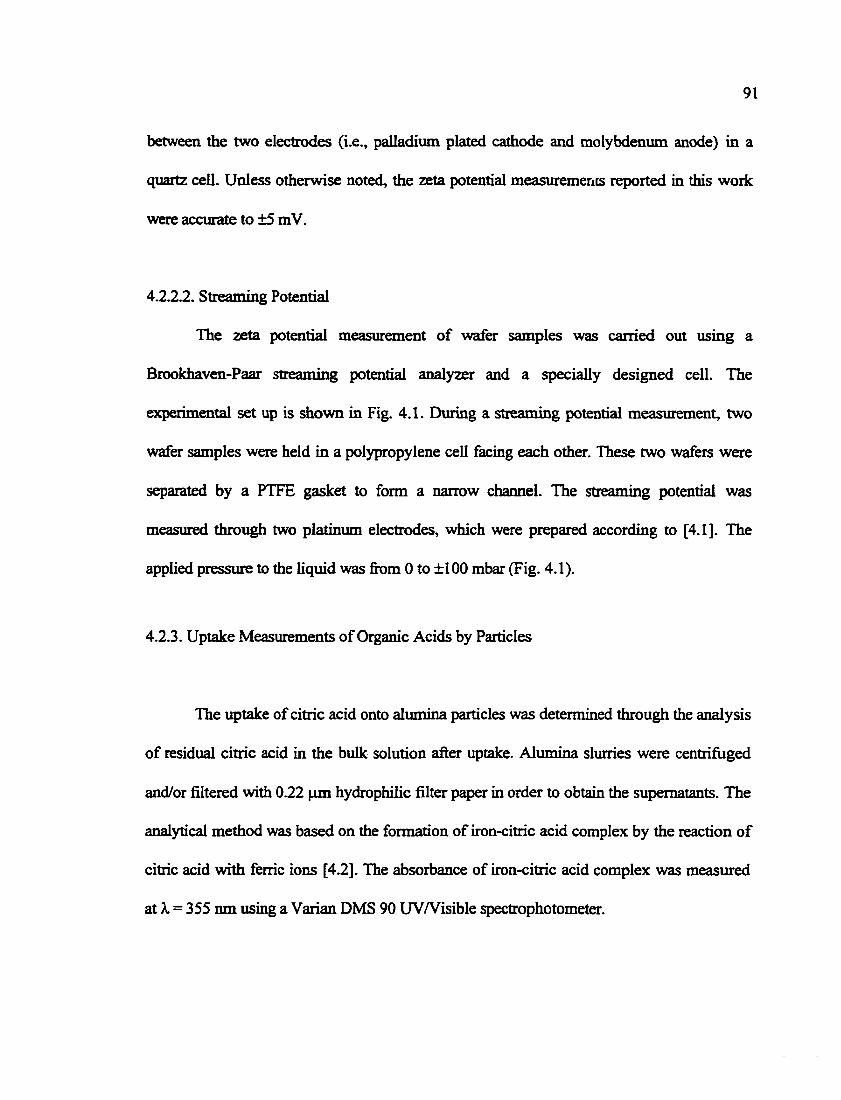
between the two electrodes (i.e., palladium plated cathode and molybdenum anode) in a
quartz cell. Unless otherwise noted, the zeta potential measurements reported in this work
were accurate to ±5 mV.
4.2.2.2. Streaming Potential
The zeta potential measurement of wafer samples was carried out using a
Brookhaven-Paar streaming potential analyzer and a specially designed cell. The
experimental set up is shown in Fig. 4.1. During a streaming potential measurement, two
wafer samples were held in a polypropylene cell facing each other. These two wafers were
separated by a PTFE gasket to form a narrow channel. The streaming potential was
measured through two platinum electrodes, which were prepared according to [4.1]. The
applied pressure to the liquid was fix)m 0 to ±100 mbar (Fig. 4.1).
4.2.3. Uptake Measurements of Organic Acids by Particles
The uptake of citric acid onto alumina particles was determined through the analysis
of residual citric acid in the bulk solution after uptake. Alumina slurries were centrifuged
and/or filtered with 0.22 ^un hydrophilic filter paper in order to obtain the supematants. The
analytical method was based on the formation of iron-citric acid complex by the reaction of
citric acid with ferric ions [4.2]. The absorbance of iron-citric acid complex was measured
at A. = 355 mn using a Varian DMS 90 UVA^isible spectrophotometer.
92
Electrode
Liquid in
t Liquid out
i
Gasket between wafers
Electrode
Upper Block
Lower Block Wafer Samples
(facing each other and separated by a gasket)
Channel for liquid flow
Gasket thickness (or wafer spacing): ~ 1/3 mm
Pressure range: from 0 to ±100 mbar
E, value: ~ mv (depending on the ionic strength of the solution)
Fig. 4.1. A schematic sketch of the streaming potential cell for wafer samples.
93
The same technique was utilized for uptake measurements of malonic acid by
alumina particles. The absorbance of malonic acid solutions was measured at A. = 290 nm
with the UV-visible spectrophotometer after addition of Fe^.
4.2.4. Contamination Experiments
4.2.4.1. Particle Deposition
During deposition experiments, two thirds of the wafer was immersed in 100 ml
dispersion. In order to simulate the worst case electrostatic interaction that may occur
during polishing, some immersion experiments were done while the wafer was biased at
positive or negative potentials with respect to a platinum coated titanium foil. A potential
gradient of 6 V/cm was used for these experiments.
Samples contaminated by immersion deposition were immediately cleaned in DI
water with a Wet Tek dynamic contact angle analyzer (DCA). A two cycle
immersion/emersion cleaning at a speed of about 0.3 mm/sec was employed.
4.2.4.2. Metal Contamination
Metal contamination on wafer surfaces was carried out on a Bold Technologies wet
bench with 625CP Temperature Controller, 870R Resistivity Monitor, and 870D Auto-
Kleen. Six inch wafer samples were immersed in a quartz bath containing copper ion spiked
solutions. After contamination, wafer samples were rinsed in overflow DI water for a
94
certain period of time. All wafers were dried using a Laurell Technologies WS-200-
8NPP\HFP single wafer spin dryer at ~ 4000 rpm for 1.5 min. In some experiments, the
rinsing step was intentionally skipped and the wafers were directly spin dried.
4.2.5. Wafer Polishing
Small scale polishing expermients were carried out on a Buelher Minimet polisher.
Unless otherwise notified, the rotation speed of the sample was 32 rpm. The pad was
attached to a glass platen and held stationary. A polishing pressure of 1.7 psi and a
polishing time 1.5 min. were used for all experiments. Immediately after polishing, each
sample was rinsed by gently flowing DI water over the surface for about 1 min. Some wafer
samples were buffed on the polisher with a firesh pad and DI water for 1 min at 30 rpm and
1.7 psi prior to post-polishing DI rinsing, in order to remove the particles deposited during
polishing.
4.2.6. Surface Cleanliness Analyses
4.2.6.1. Particulate Contamination
A Hitachi S-4500 field emission scaiming electron microscope (FE-SEM) was
used to analyze the particulate contamination level and the surface morphology of
95
contaminated or polished wafer surfaces. Most of the wafer samples were analyzed under a
Buelher Versamet 3 optical microscope prior to SEM.
Image analyses were conducted for some of the wafer samples in order to gain
quantitative characterization of the particulate contamination level. From SEM
micrographs, the size distribution of particles on samples was calculated. Micrographs were
first scanned with an HP Scan Jet Plus scanner and the Desk Scan II software, and the
0 stored information was analyzed using the Buelher Omnimet 3 image analysis program.
4.2.6.2. Metal Contamination
The technique of total reflection X-ray fluorescence (TXRF) was used to measure
copper contamination on flat wafer surfaces. A Rigaku 3700 system with a minimum
detection limit of 2x10' atoms/cm^ was used to carry out TXRF measurements.
4.2.7. Electrochemical tests
Electrochemical tests were employed to characterize the stability or reactivity of
wafer samples in certain solutions. Experiments were carried out on an EG&G Potentiostat
273A, as schematically shown in Fig. 4.2. A 3-eIectrode cell of approximately 150 ml in
volume was used. The cell body was constructed using high density polypropylene
(HDPP). The active area of the working electrode was 1 cm^, as defined by a Viton® O-
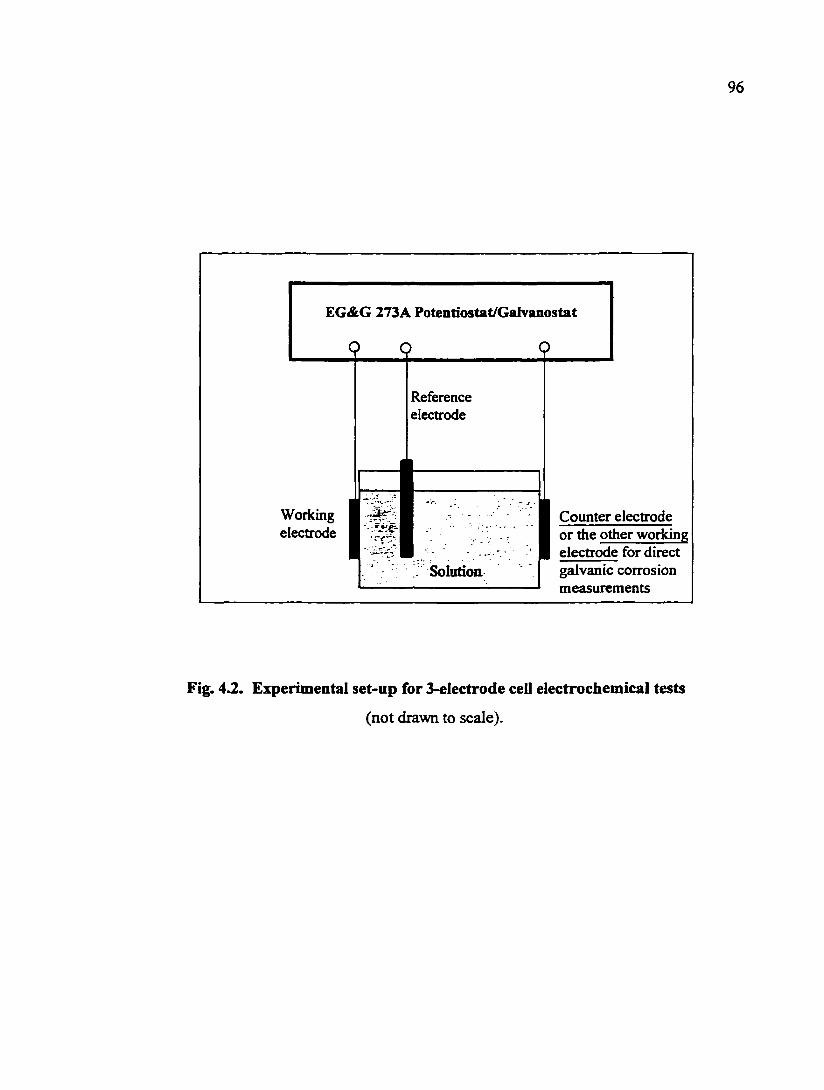
96
EG&G 273A Potentiostat/Galvanostat
0 0 0
Reference electrode
Working electrode • I
Solutioa
Counter electrode or the other working electrode for direct galvanic corrosion measurements
Fig. 4.2. Experimental set-up for 3-electrode cell electrochemical tests
(not drawn to scale).
97
ring. A platinum foil was used as the counter electrode. A saturated calomel electrode
(SCE) was used as the reference electrode. The electrochemical data were collected using
the M352 corrosion software.
For direct galvanic corrosion measurements, the counter electrode was one of the
films of interest instead of platinum foil (Fig. 4.2). In this case, the active area of both
working electrodes (or the working and the counter electrodes) was 1 cm^.
The experimental conditions for potentiodynamic polarization analysis were as
follows: initial delay of 30 sec., scan rate of 0.5 V/sec., and scan range of 0 ~ ± I V w.r.t.
the OCP.
4.2.8. Others
4.2.8.1. Determination of Dissolution of Alumina
Dissolution of alumina particles was studied by analyzing dissolved aluminum in
the supernatant of alumina slurries. Alumina particles were first removed fix)m the slurry by
centrifugation and filtration with 0.22 |mi filter paper. The concentration of dissolved
aluminum in alumina slurries was determined with a Perkin-Elmer Elan 5000A inductively
coupled plasma mass spectrometer (ICP-MS).
98
4.2.8.2. Film Removal Rate Measurements
The polishing rate of tungsten and oxide wafer samples was calculated based on
measurements of the film thickness determined by a Tencor Alpha-step 200 profilometer.
A positive photoresist was first applied to the wafer samples to define a narrow window
for subsequent etching. Tungsten films were etched by immersing in K' etchant (33 g
K3Fe(CN)6, 34 g KH2PO4, and 13.4 g KOH in 1 liter of DI water). Silicon dioxide films
were etched using buffered hydrogen fluoride (BHF). Before profilometer measurements
were taken, the photoresist was removed with a resist remover.
4.2.8.3. Surface Area Measurements
The specific surface area of alumina purchased &om Cerac was measured on a
Quantachrome Monosorb® surface area analyzer using a 30% He - Nj gas mixture.
4.2.8.4. Surface Complexation Modeling
Surface complexation modeling of copper contamination onto TEOS wafer surfaces
was conducted using Minteqa2/Prodefa2 (V. 3.0) written by Rosemarie C. Russo.
Minteqa2 is a program for the equilibrium speciation by computing equilibria among the
dissolved, adsorbed, solid, and gas phases in a geochemical system. Prodefa2 is an
interactive program designed to be executed prior to Minteqa2 for the purpose of creating
the input file required for Minteqa2. Most of the input parameters were taken from
literature data determined for surface complexation reactions on silica particles. The

99
direct results of the modeling are the distribution of surface copper species from which
the surface concentration of copper on wafer surfaces can be calculated.
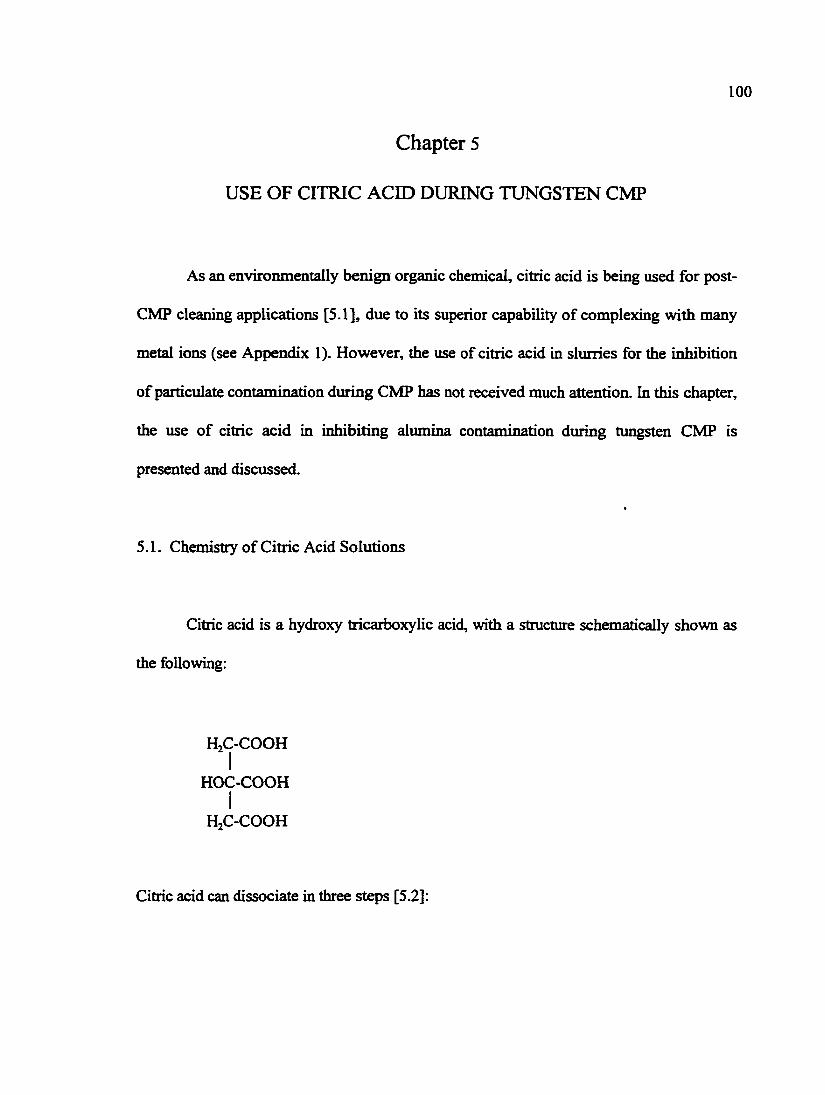
100
Chapter 5
USE OF CITRIC ACID DURING TUNGSTEN CMP
As an environmentally benign organic chemical, citric acid is being used for post-
CMP cleaning applications [5.1], due to its superior capability of complexing with many
metal ions (see Appendix 1). However, the use of citric acid in slurries for the inhibition
of particulate contamination during CMP has not received much attention. In this chapter,
the use of citric acid in inhibiting alumina contamination during tungsten CMP is
presented and discussed.
5.1. Chemistry of Citric Acid Solutions
Citric acid is a hydroxy tricarboxylic acid, with a structure schematically shown as
the following:
H^C-COOH I
HOC-COOH I
HjC-COOH
Citric acid can dissociate in three steps [5.2]:
101
HjCit HjCir + tr pK, = 3.2 (5.1)
HjCir + BT pK2 = 4.9 (5.2)
HCi^-coCit^ + Fr pKj = 6.4 (5.3)
At difTerent pH's, the concentrations of citric acid molecule and its dissociation
products will be different Fig. 5.1 shows the calculated speciation of citric acid solution as
a function of pH. For example, at a pH of 4, the dominant species in the citric acid solution
is singly charged citrate ions (H2L ). At higher pH values (i.e., >4.9), citrate ions with higher
charges become more dominant
5.2. Interaction between Citric Acid and Alumina Particles
5.2.1. Uptake Measurements
In this study, the kinetics of uptake of citric acid by alumina was first investigated.
Fig. 5.2 shows the kinetic data obtained for an initial citric acid concentration of400 ppm at
a solution pH of 4.0. The uptake of citric acid by alumina particles is initially very rapid in a
short period of time (i.e., 15 minutes) but then slows down. Based on this data, a contact
time of 10 hours was chosen for all subsequent experiments, which was sufiBciently long for

102
100
80
^ 60 S u g. 40
CO
20
0
0 2 4 6 8 10 pH
Fig. 5.1. Calculated dissociation of citric acid.
(CA: HjCit, CAl: HjCit", CA2: HCit^*, CA3: Cit^)
c V c
A A2
- CA1 /' -CA3/
/ \ \ / \ / \ /
f
1 •
•
\ / A
\ . V A *»
/ ' t \ / \ / \ . V / \
\ ,
• %
r • •
/ \ / > V
0.45
O 0 .15-
0 2 6 4 8 10 12 Time (hours)
Fig. 5.2. Uptake kinetics of citric acid by alumina (20.0 g/1 Cerac alumina in
0.001 M KNO3 at pH=4.0. Initial citric acid concentration: 400 ppm).
103
the system to reach the equilibrium.
Fig. 5.3 shows the effect of citric acid concentration on the extent of uptake of citric
acid by alumina. The uptake curve shows that the uptake of citric acid reaches a saturation
amount at -0.4 mg/m^ at an equilibrium concentration of citric acid of 800 ppm. The zeta
potential of alumina particles at different equilibrium citric acid concentrations is also
plotted in Fig. 5.3. In the absence of citric acid, the zeta potential of alumina is +67 mV.
When the equilibrium citric acid concentration is increased from 0 to 50 ppm, the zeta
potential of alumina becomes less positive and eventually reverses charge from positive to
negative. The zeta potential curve becomes flat at citric acid concentrations greater than 100
ppm. A curve of Langmuir fit to the uptake data is displayed in Fig. 5.3 and will be
discussed later.
The effect of pH on the uptake of citric acid as well as the zeta potential of alumina
is shown in Fig. 5.4. The initial concentration of citric acid in these experiments was 100
ppm. From Fig. 5.4, it can be seen that less citric acid is absorbed by alimiina at higher
solution pH values but the zeta potential is more negative at higher pH values.
5.2.2. Maintaining pH
One of the issues in the manufacturing of CMP slurries is the slurry stability, which
is dependent on the pH. The slurry pH should be stable during the storage and use of the
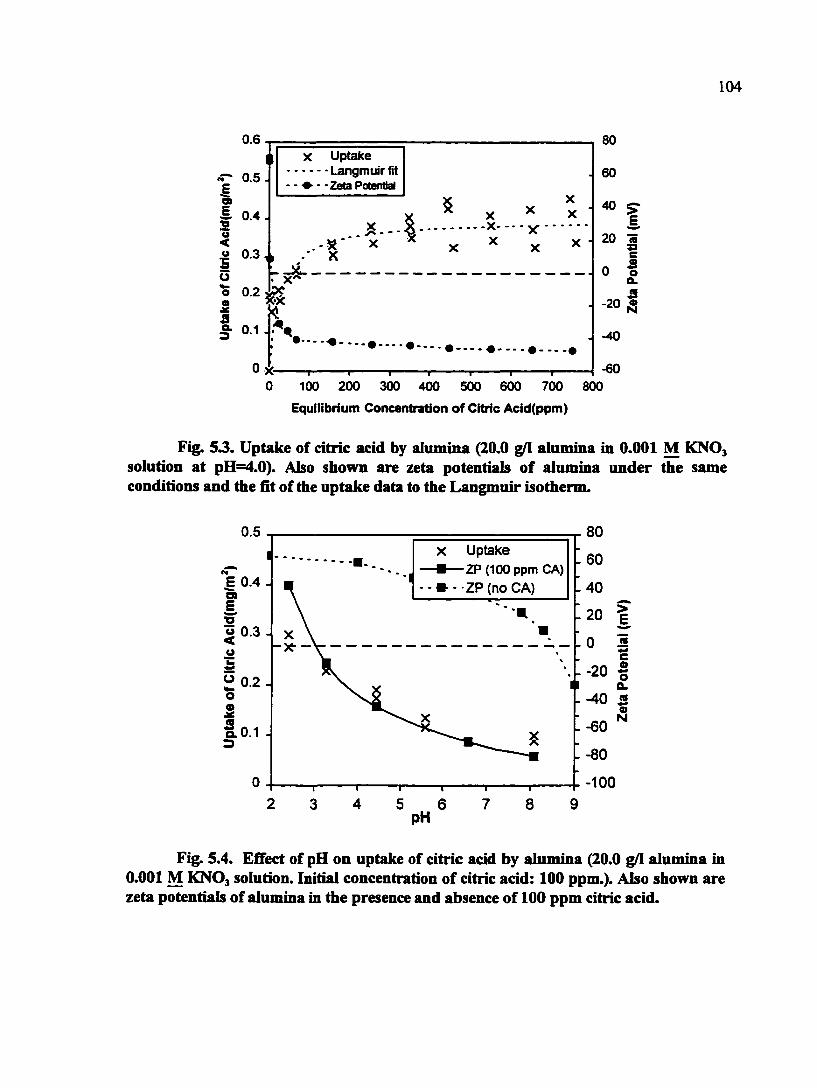
104
0.6
E 2 TS < u s o o JC a a. 3
0.5.
0.4.
0.3
0.2
0.1 J
X Uptake Langmuirfit
• -Zeta Potential
.3$ .-5?' X
• X
X X - X - - - V
X •
r 3^
80
60
40 5" E,
20 s
0 I a. S
-20 •
-40
X I I I I I I I I " 6 0 0 100 200 300 400 500 600 700 800
Equilibrium Concentration of Citric Acid(ppin)
Fig. 53. Uptake of citric acid by alumina (20.0 alumina in 0.001 M KNO, solution at pH=4.0). Also shown are zeta potentials of alumina under the same conditions and the fit of the uptake data to the Langmuir isotherm.
Uptake •ZP (100 ppm OA)
- ZP (no CA) E 0.4 .
« 0.3 -
2 0.2 -
80
60
40
20 > B
0 is
-20 I a.
-40 S o -60
-80
-100
Fig. 5.4. Effect of pH on uptake of citric acid by alumina (20.0 g/1 alumina in 0.001 M KNO3 solution. Initial concentration of citric acid: 100 ppm.). Also shown are zeta potentials of alumina in the presence and absence of 100 ppm citric acid.
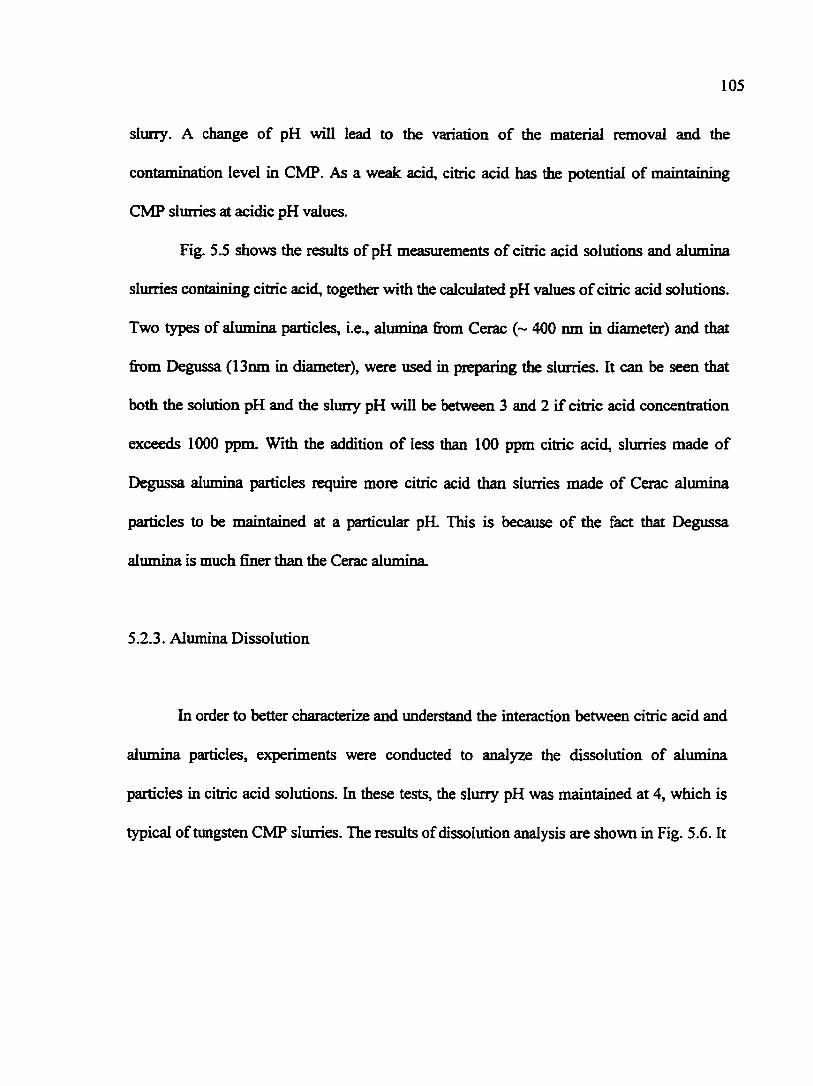
105
slurry. A change of pH will lead to the variation of the material removal and the
contamination level in CMP. As a weak acid, citric acid has the potential of maintaining
CMP slurries at acidic pH values.
Fig. 5.5 shows the results of pH measurements of citric acid solutions and alumina
slurries containing citric acid, together with the calculated pH values of citric acid solutions.
Two types of alimiina particles, i.e., alumina from Cerac (~ 400 nm in diameter) and that
from Degussa (13nm in diameter), were used in preparing the slurries. It can be seen that
both the solution pH and the slurry pH will be between 3 and 2 if citric acid concentration
exceeds 1000 ppm. With the addition of less than 100 ppm citric acid, slurries made of
Degussa alumina particles require more citric acid than slurries made of Cerac alumina
particles to be maintained at a particular pH. This is because of the fact that Degussa
alumina is much finer than the Cerac alumina.
5.2.3. Alumina Dissolution
In order to better characterize and imderstand the interaction between citric acid and
alumina particles, experiments were conducted to analyze the dissolution of alumina
particles in citric acid solutions. In these tests, the slurry pH was maintained at 4, which is
typical of tungsten CMP slurries. The results of dissolution analysis are shown in Fig. 5.6. It
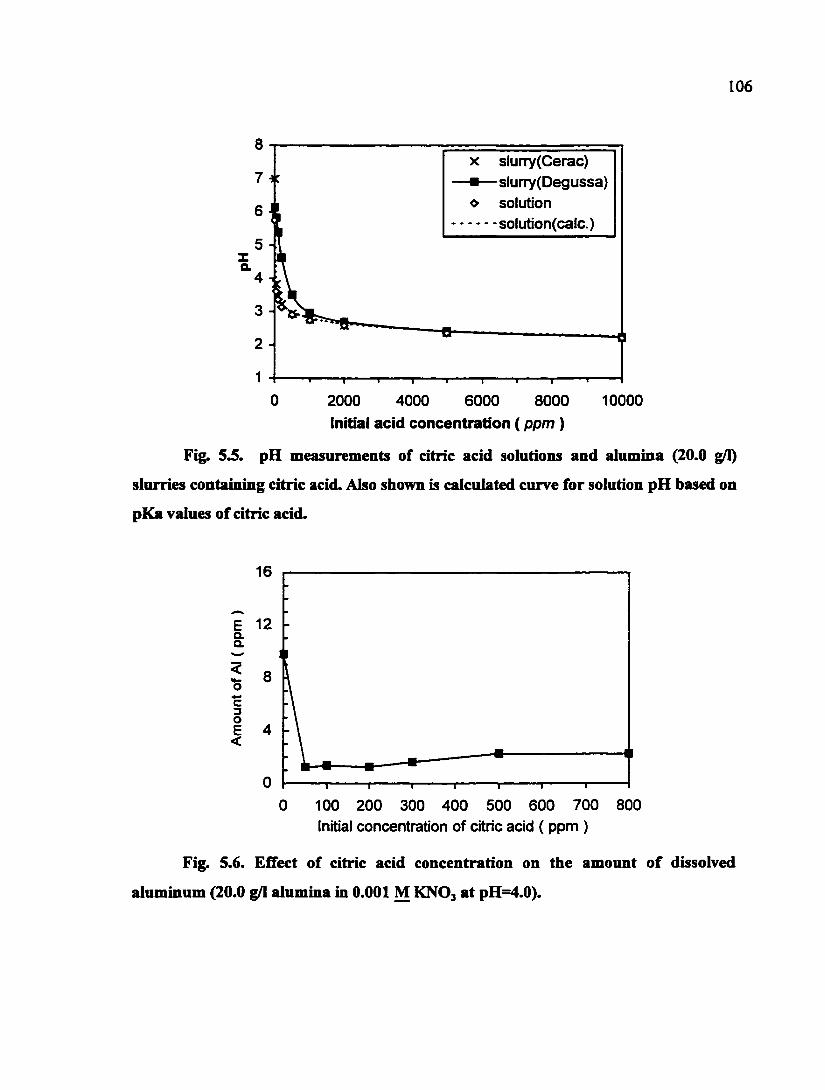
106
X slun7(Cerac) —•— slunry(Degussa)
Jl ^ solution
1 solution(calc.)
-fl -fl
0 2000 4000 6000 8000 10000 initial acid concentration (ppm )
Fig. 5.5. pH measurements of citric acid solutions and alumina (20.0 g/I)
slurries containing citric acid. Also shown is calculated curve for solution pH based on
pKa values of citric acid.
16
12
8
4
0
0 100 200 300 400 500 600 700 800 Initial concentration of citric acid (ppm )
Fig. 5.6. EfTect of citric acid concentration on the amount of dissolved
aluminum (20.0 g/1 alumina in 0.001 M KNO3 at pH=4.0).
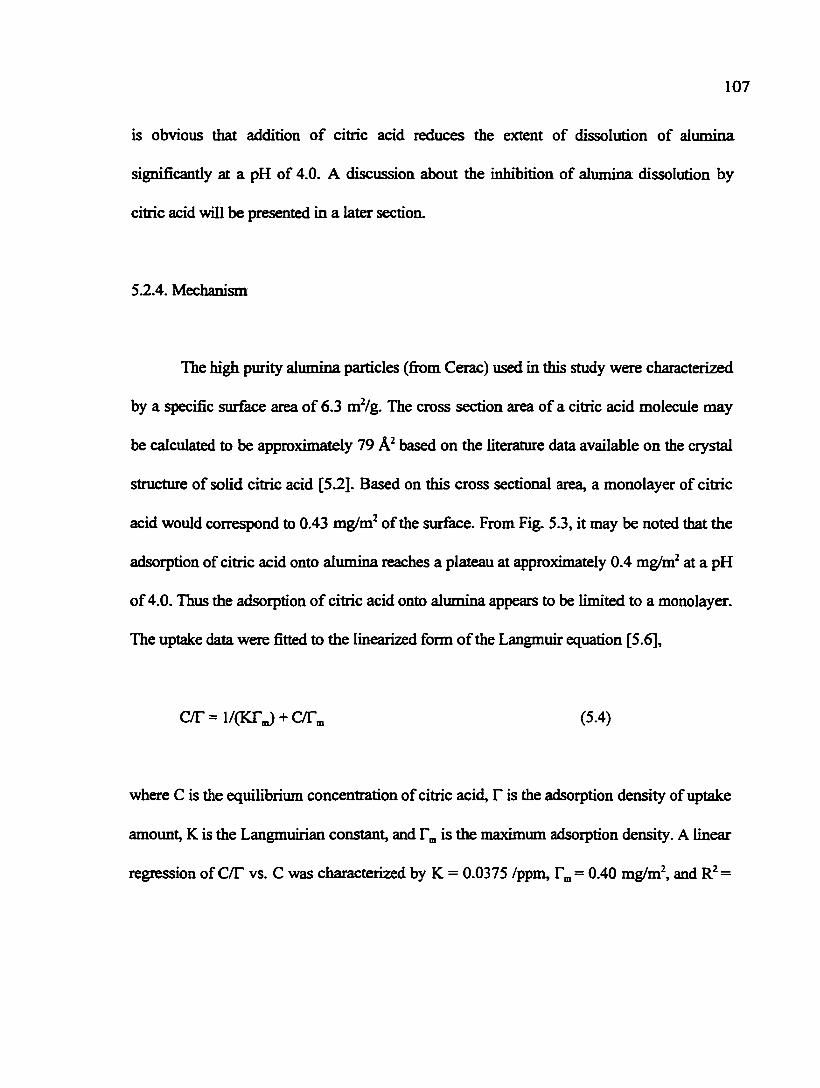
107
is obvious that addition of citric acid reduces the extent of dissolution of alumina
significantly at a pH of 4.0. A discussion about the inhibition of alumina dissolution by
citric acid will be presented in a later section.
5.2.4. Mechanism
The high purity alumina particles (fiom Cerac) used in this study were characterized
by a specific surface area of 6.3 mVg. The cross section area of a citric acid molecule may
be calculated to be approximately 79 based on the literature data available on the crystal
structure of solid citric acid [5.2]. Based on this cross sectional area, a monolayer of citric
acid would correspond to 0.43 mg/m^ of the surface. From Fig. 5.3, it may be noted that the
adsorption of citric acid onto alumina reaches a plateau at approximately 0.4 mg/m^ at a pH
of 4.0. Thus the adsorption of citric acid onto alumina appears to be limited to a monolayer.
The uptake data were fitted to the linearized form of the Langmuir equation [5.6],
c/r=i/(Krj + c/r„ (5.4)
where C is the equilibrium concentration of citric acid, F is the adsorption density of uptake
amount, K is the Langmuirian constant, and To, is the maximum adsorption density. A linear
regression of C/T vs. C was characterized by K = 0.0375 /ppm, r^, = 0.40 mg/m^, and =
108
0.9638. The value of r„ obtained fix)m the Langmuir fit is in good agreement with the
calculated monolayer capacity of citric acid as discussed above.
At a pH of 4, alumina is positively charged in the absence of citric acid. At this pH,
the predominant species in citric acid solution is HjL'. If the citric acid adsorption were
purely due to the electrostatic attraction between alumina and citrate ions, the magnitude of
the zeta potential of alimiina would be reduced from a positive value to zero, but the sign of
the zeta potential of alimiina could not be reversed. However, as may be noted fix>m Fig.
5.3, the sign of the zeta potential of alumina particles at a pH of 4 is reversed in the presence
of approximately 20 ppm citric acid. This indicates that the singly charged citrate ions may
interact with alumina particles by a chemical as well as an electrostatic force. Obviously, at
higher pH values, HL^" and become the more predominant species in the solution. These
highly charged ions may also be expected to exhibit a specific interaction with alumina
particles.
The specific adsorption behavior of citric acid onto alimiina can be further
imderstood by comparing the zeta potential values of alumina in the presence and absence
of citric acid at a higher pH, such as 8.5. Citric acid appears to adsorb onto alumina even
when the zeta potential of alumina is slightly negative. This reinforces the earlier statement
that citric acid exhibits specific adsorption onto alumina. It is known that citrate species can
complex aluminum ions very effectively in aqueous solutions [5.3]. Hidber et al. presented
evidence for a direct interaction between the carboxylate groups of citrate and the aliiminum
atoms on the siirface of alimiina [5.4]. Although alumina - citrate surface complexation
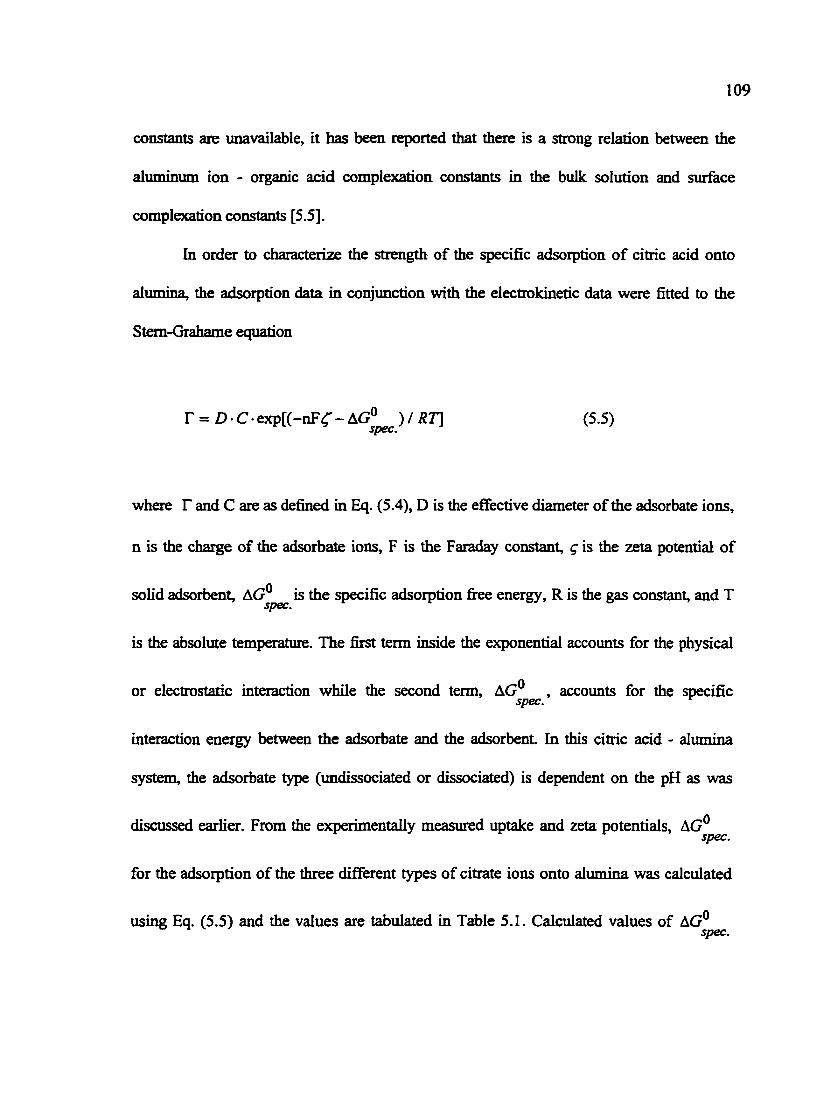
109
constants aie unavailable, it has been reported that there is a strong relation between the
aluminum ion - organic acid complexation constants in the bulk solution and surface
complexation constants [5.5].
In order to characterize the strength of the specific adsorption of citric acid onto
alumina, the adsorption data in conjunction with the electrokinetic data were fitted to the
Stem-Grahame equation
r = Z)Cexp[(-nF^-AG» )//!r] (5.5) spec.
where T and C are as defined in Eq. (5.4), D is the effective diameter of the adsorbate ions,
n is the charge of the adsorbate ions, F is the Faraday constant, g is the zeta potential of
solid adsorbent, AC?® is the specific adsorption free energy, R is the gas constant, and T spec.
is the absolute temperature. The first term inside the exponential accounts for the physical
or electrostatic interaction while the second term, AG® , accounts for the specific spec.
interaction energy between the adsorbate and the adsorbent In this citric acid - alumina
system, the adsorbate type (undissociated or dissociated) is dependent on the pH as was
discussed earlier. From the experimentally measured uptake and zeta potentials, AG® spec.
for the adsorption of the three different types of citrate ions onto alumina was calculated
using Eq. (5.5) and the values are tabulated in Table 5.1. Calculated values of AG® Sp€C»
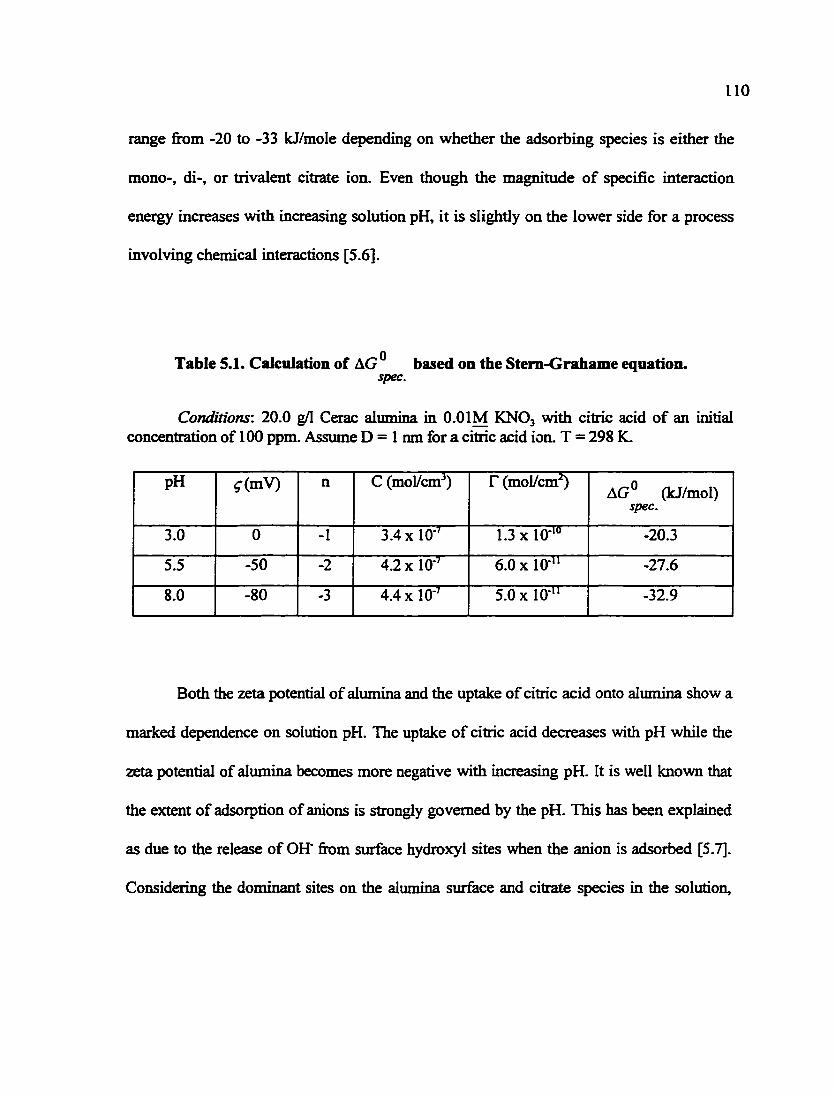
110
range from -20 to -33 kJ/mole depending on whether the adsorbing species is either the
mono-, di-, or trivalent citrate ion. Even though the magnitude of specific interaction
energy increases with increasing solution pH, it is slightly on the lower side for a process
involving chemical interactions [5.6].
Table 5.1. Calculation of based on the Stern-Grahame equation. spec.
Conditions: 20.0 g/I Cerac alumina in O.OIM KNO3 with citric acid of an initial concentration of 100 ppm. Assiune D = 1 nm for a citric acid ion. T = 298 K.
pH g(vaV) n C (mol/cm^) r (mol/cm^ AG° (kJ/mol)
spec.
3.0 0 -1 3.4x10"' 1.3 X 10-'° -20.3
5.5 -50 -2 4.2 x 10-' 6.0 X 10-" -21.6
8.0 -80 -3 4.4 X 10"' 5.0x10-" -32.9
Both the zeta potential of alumina and the uptake of citric acid onto alumina show a
marked dependence on solution pH. The uptake of citric acid decreases with pH while the
zeta potential of alumina becomes more negative with increasing pH. It is well known that
the extent of adsorption of anions is strongly govemed by the pH. This has been explained
as due to the release of OH' from siuface hydroxyl sites when the anion is adsorbed [5.7].
Considering the dominant sites on the alumina siuface and citrate species in the solution.
Ill
the inteiaction between citric acid or citrate with the alumina surface can be represented by
the following surface complexation reactions;
At low pH (e.g.. pH = 3): = Al-OH^* + H^L" c» = Al-LH^ + H^O (5.6)
AthigherpH(e.g., pH = 8): sAl-OH + L^o sAl-L ' + OH' (5.7)
As may be seen from Eq. (5.6), at low pH values, singly charged citrate species could
adsorb onto positively charged aluminimi sites and neutralize the surface charge. However,
at higher pH values, triply charged citrate ions are likely to interact with neutral =Al-OH
sites forming highly negative surface sites. This can explain the fact that the zeta potential
becomes more negative with increasing pH in the presence of citric acid. Additionally, as
depicted by Eq. (5.7), the surface sites become increasingly negatively charged as
adsorption occurs, and this would inhibit further adsorption of negative aqueous citrate
species. Even though the adsorption is less, the zeta potential is still highly negative due to
the fact that the highly negative citrate ions are the adsorbing species.
It has been reported that complexing ligands including citrate can promote the
dissolution of alumina [5.8-5.10]. The mechanism seems to be that the complexation of
metal sites with the ligand polarizes the metal - oxygen bonds in the solid and causes the
detachment of metal cations into the solution phase [5.10]. The dissolution of Cerac
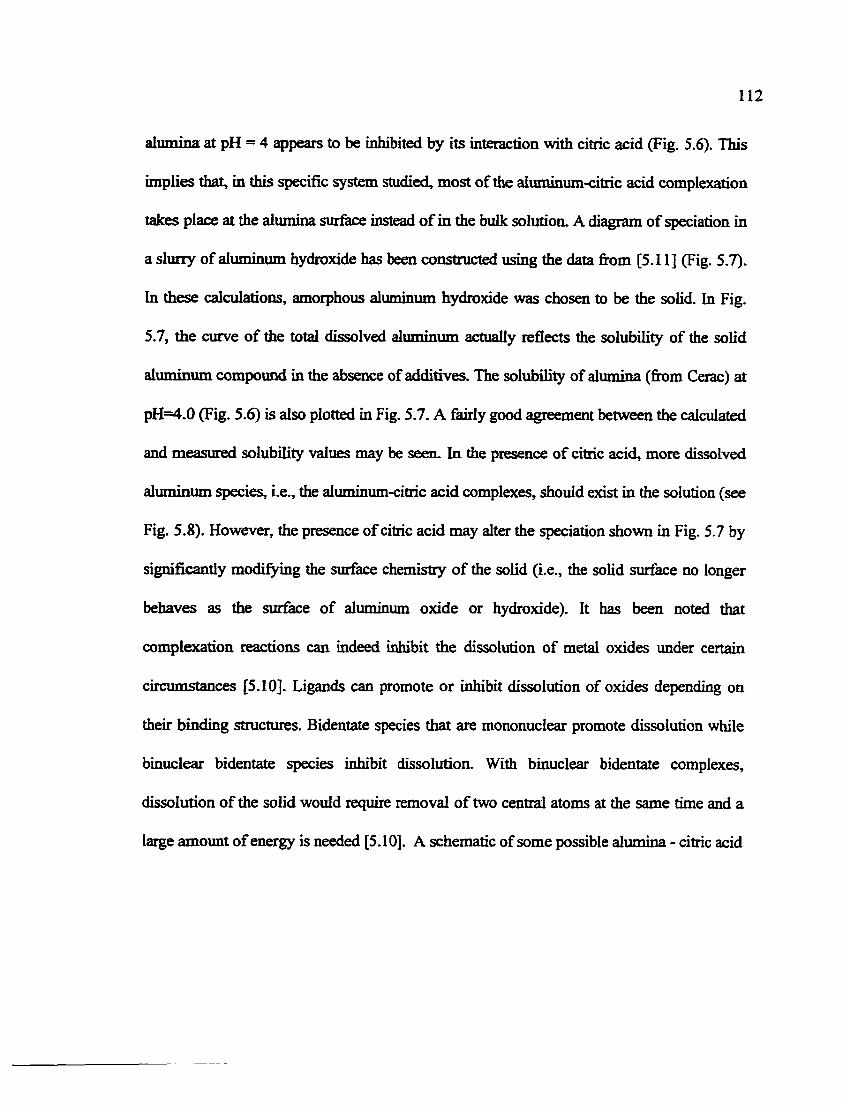
112
alumina at pH = 4 appears to be inhibited by its interaction with citric acid (Fig. 5.6). This
implies that, in this specific system studied, most of the aluminum-citric acid complexation
takes place at the alumina surface instead of in the bulk solution. A diagram of speciation in
a slurry of aluminum hydroxide has been constructed using the data from [5.11] (Fig. 5.7).
In these calculations, amorphous aluminum hydroxide was chosen to be the solid. In Fig.
5.7, the curve of the total dissolved aluminum actually reflects the solubility of the solid
aluminum compoimd in the absence of additives. The solubility of alumina (from Cerac) at
pH=4.0 (Fig. 5.6) is also plotted in Fig. 5.7. A fairly good agreement between the calculated
and measured solubility values may be seen. In the presence of citric acid, more dissolved
alimiinum species, i.e., the aluminum-citric acid complexes, should exist in the solution (see
Fig. 5.8). However, the presence of citric acid may alter the speciation shown in Fig. 5.7 by
significantly modifying the surface chemistry of the solid (i.e., the solid surface no longer
behaves as the surface of aluminum oxide or hydroxide). It has been noted that
complexation reactions can indeed inhibit the dissolution of metal oxides under certaia
circimistances [5.10]. Ligands can promote or inhibit dissolution of oxides depending on
their binding structures. Bidentate species that are mononuclear promote dissolution while
binuclear bidentate species inhibit dissolution. With binuclear bidentate complexes,
dissolution of the solid would require removal of two central atoms at the same time and a
large amount of energy is needed [5.10]. A schematic of some possible alumina - citric acid
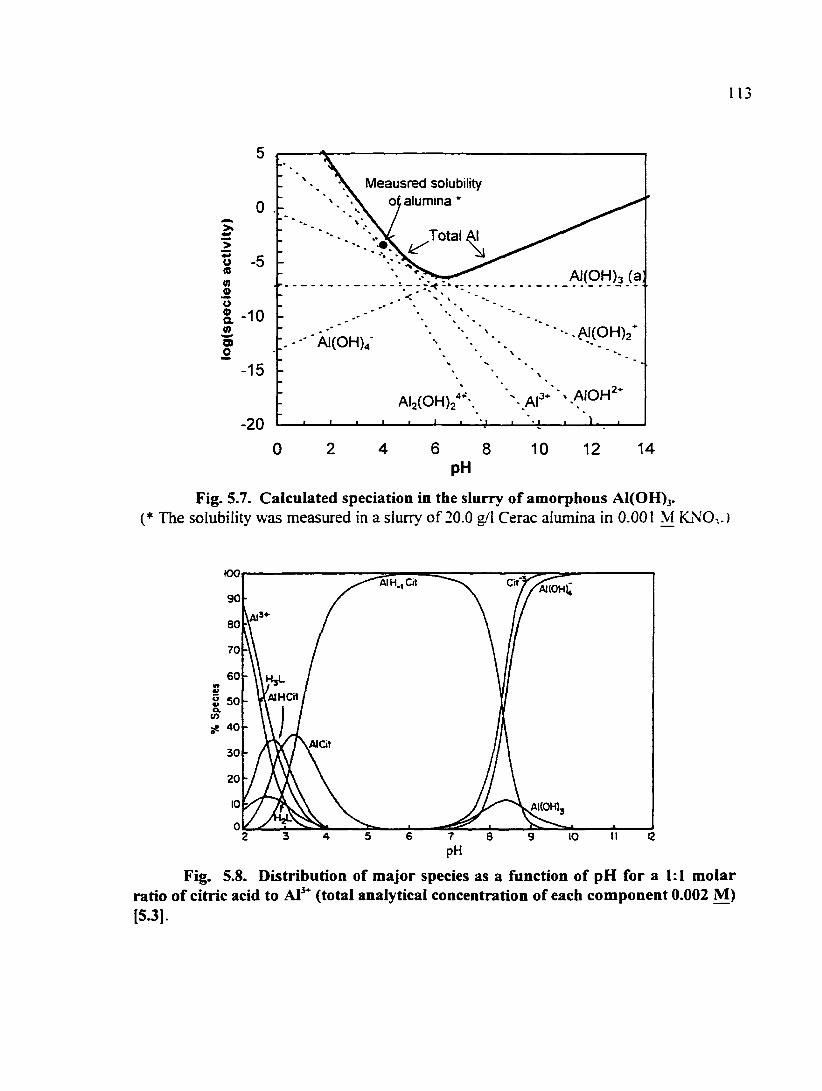
113
>»
>
u
« O O o a 5-a o
0
-5
-10
-15
-20
^ \ Meausred solubility 2 ' ot alumina *
AI(0H)3 (a: • • % . V '
• » *
;.---'AI(OH)4' \ V X
AI(0H)2" \ '
\
- Al2(OH)2'""'\ 1 1 L 1 1_ 1 • I
\
. . • > .
0 6 8 PH
10 12 14
Fig. 5.7. Calculated speciation in the slurry of amorphous AKOH)}. (* The solubility was measured in a slurry of 20.0 g/I Cerac alumina in 0.001 M fCNO-,.)
«o AIH .Ci t
90 -
30
70
60
[AIHCn S 50 a. CO
s« 40 ,Aiaf
30
20
AKOH),
3 5 6 e 2 4 7 S 9 10 pH
Fig. 5.8. Distribution of major species as a function of pH for a 1:1 molar ratio of citric acid to Al^ (total analytical concentration of each component 0.002 M) [5.31.
114
complexation configurations is sho>vn in Fig. 5.9. Because citric acid is found to inhibit the
dissolution of the alumina particles fix>m Cerac at pH=4, citric acid appears to be capable of
forming a binuclear bidentate complex (Fig. 5.9(a)) at pH = 4. When two bonds are formed
between one citric acid molecule or ion and two aluminum sites on alumina surface (Fig.
5.9(a)), the neighboring Al-O bond(s) in alumina solid is strong, compared to the situation
where there is only one bond formed between citric acid and alumina as shown in Fig.
5.9(b).
5.3. Effect of Citric Acid on Alumina Particulate Contamination
The effects of citric acid on alumina particulate contaniination of interest to
tungsten CMP were investigated through both immersion and polishing experiments.
5.3.1. Immersion Deposition
Fig. 5.10 shows the microgr^hs of thin oxide (100 A) samples initially
contaminated in 0.025 g/1 alumina slurry at a pH of 4 under different bias conditions and
then rinsed by DI water. It may be pointed out that the electrical biasing of wafers during
deposition experiments represents the best and worst case scenarios (increased or decreased
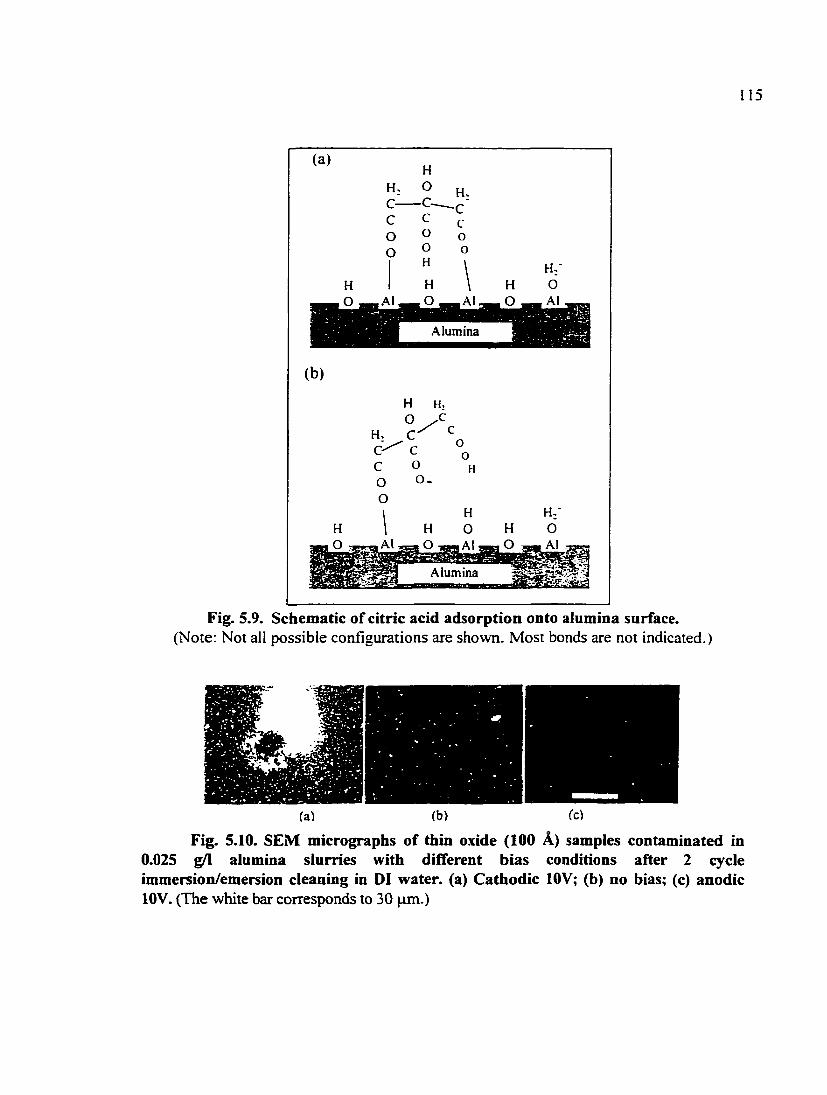
115
Alumina
Alumina
Fig. 5.9. Schematic of citric acid adsorption onto alumina surface. (Note: Not ail possible configurations are shown. Most bonds are not indicated.)
(a) (b) CO
Fig. 5.10. SEM micrographs of thin oxide (100 A) samples contaminated in 0.025 g/I alumina slurries with different bias conditions after 2 cycle immersion/emersion cleaning in DI water, (a) Cathodic lOV; (b) no bias; (c) anodic lOV. (The white bar corresponds to 30 jam.)
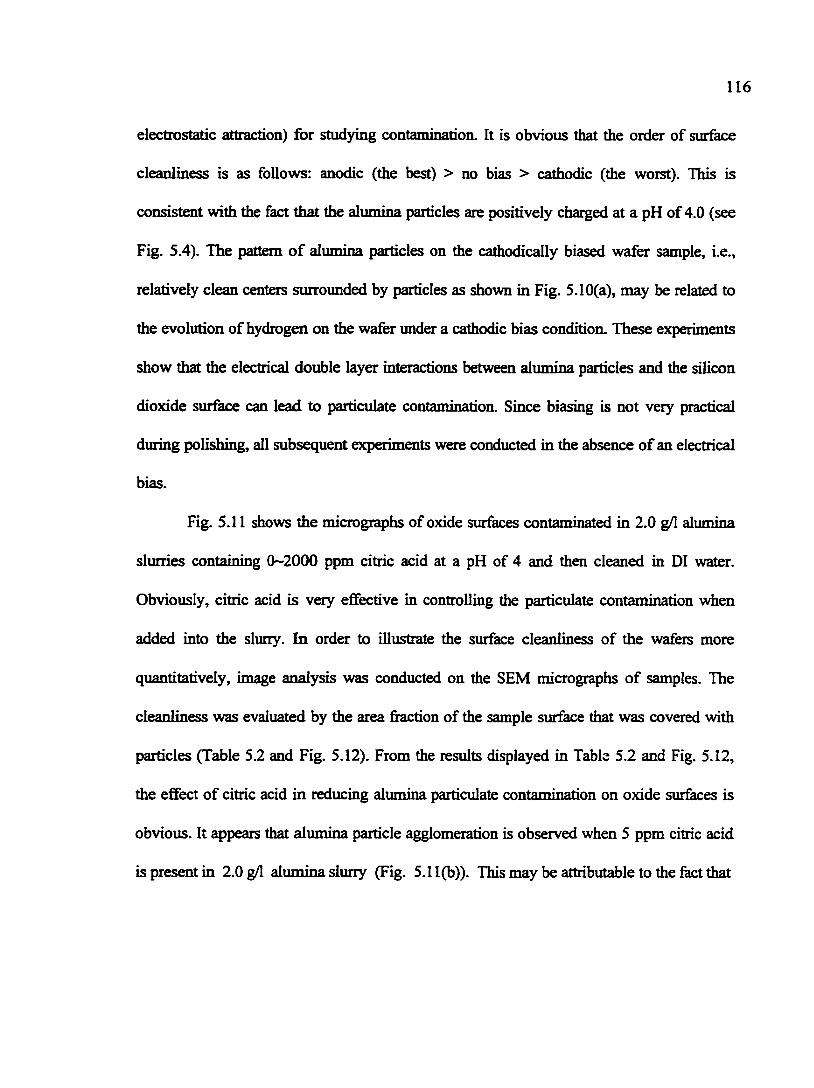
116
electrostatic attraction) for studying contamination. It is obvious that the order of surface
cleanliness is as follows: anodic (the best) > no bias > cathodic (the worst). This is
consistent with the fact that the alumina particles are positively charged at a pH of 4.0 (see
Fig. 5.4). The pattern of alumina particles on the cathodically biased wafer sample, i.e.,
relatively clean centers surrounded by particles as shown in Fig. 5.10(a), may be related to
the evolution of hydrogen on the wafer under a cathodic bias condition. These experiments
show that the electrical double layer interactions between alumina particles and the silicon
dioxide surface can lead to particulate contamination. Since biasing is not very practical
during polishing, all subsequent experiments were conducted in the absence of an electrical
bias.
Fig. 5.11 shows the microgr^hs of oxide surfaces contaminated in 2.0 g/I alumina
slurries containing 0~2000 ppm citric acid at a pH of 4 and then cleaned in DI water.
Obviously, citric acid is very effective in controlling the particulate contamination when
added into the slurry. In order to illustrate the surface cleanliness of the wafers more
quantitatively, image analysis was conducted on the SEM microgr^hs of samples. The
cleanliness was evaluated by the area fraction of the sample surface that was covered with
particles (Table 5.2 and Fig. 5.12). From the results displayed in Table 5.2 and Fig. 5.12,
the effect of citric acid in reducing alumina particulate contamination on oxide surfaces is
obvious. It appears that alimiina particle agglomeration is observed when 5 ppm citric acid
is present in 2.0 g/1 alumina slurry (Fig. 5.11(b)). This may be attributable to the fact that
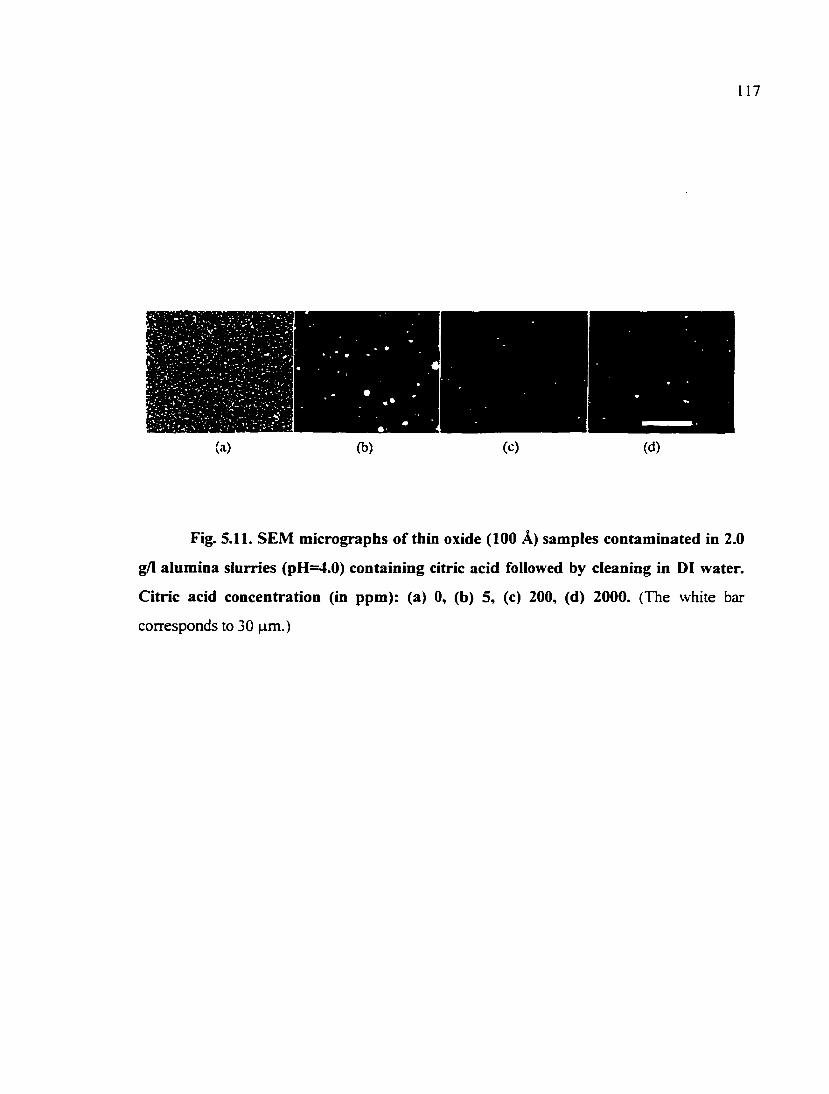
117
Fig. 5.11. SEM micrographs of thin oxide (100 A) samples contaminated in 2.0
g/I alumina slurries (pH=4.0) containing citric acid followed by cleaning in DI water.
Citric acid concentration (in ppm): (a) 0, (b) 5, (c) 200, (d) 2000. (The white bar
corresponds to 30 |j.m.)
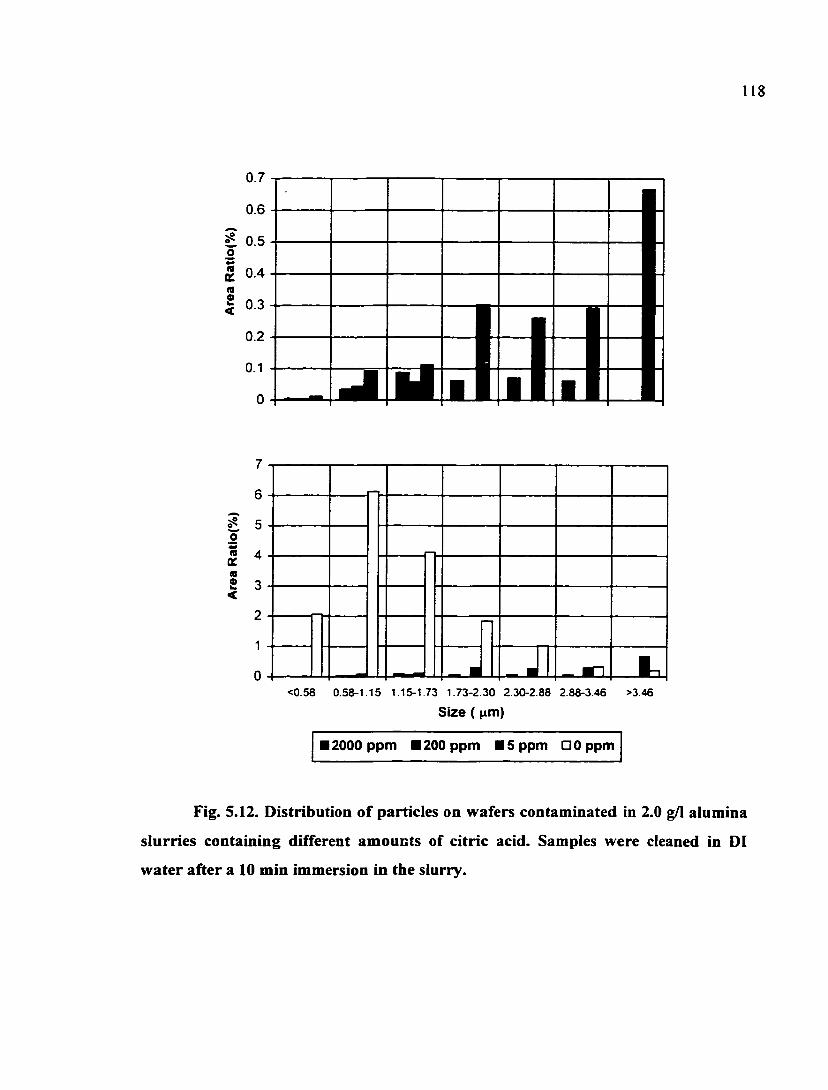
118
0.7
0.6
g 0.5 o (0 K 0.4 m o w < 0.3
0.2
0.1
0
1 1 _[ 1
~I • 1 1 t t 1
7
6
£ 5 o (0 A X n S 3 <
2
1
0 <0.58 0.58-1.15 1.15-1 73 1.73-2.30 2.30-2.88 2.88-3.46 >3.46
Size (^m)
12000 ppm 1200 ppm BSppm •Oppm
Fig. 5.12. Distribution of particles on wafers contaminated in 2.0 g/1 alumina
slurries containing different amounts of citric acid. Samples were cleaned in DI
water after a 10 min immersion in the slurry.
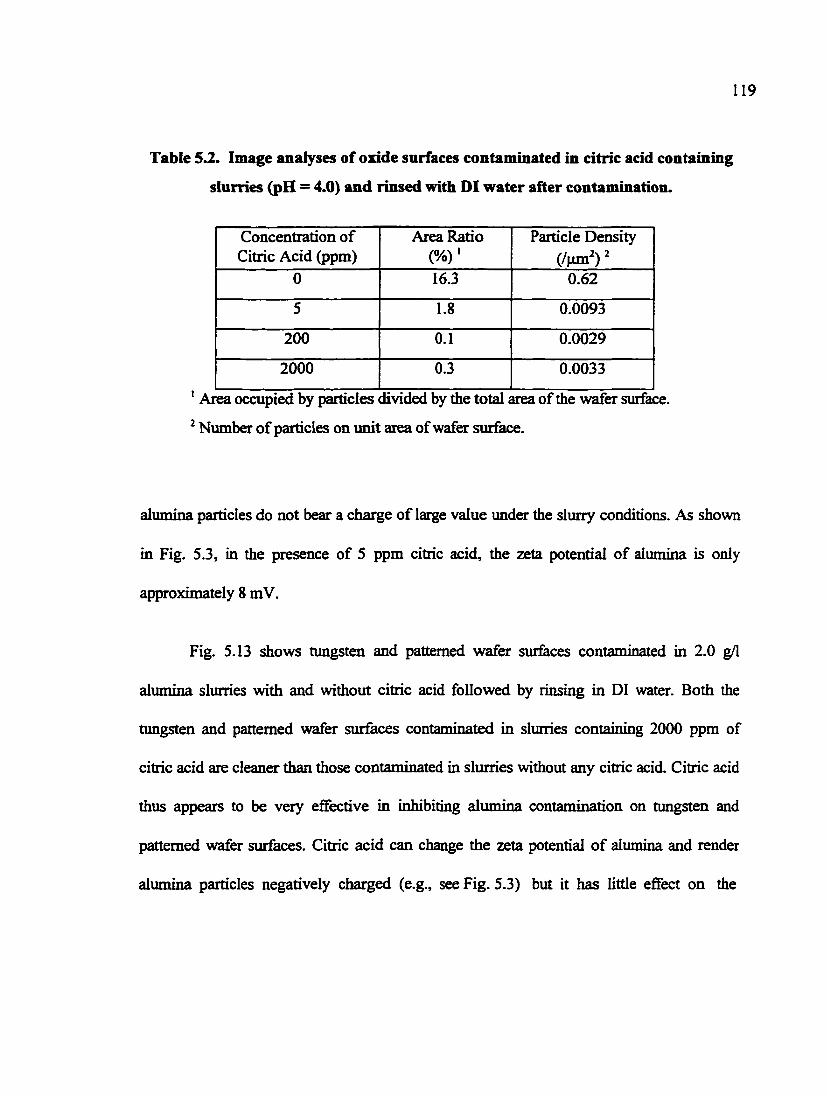
119
Table 5^. Image analyses of oxide surfaces contaminated in citric acid containing
slurries (pH = 4.0) and rinsed with DI water after contamination.
Concentration of Citric Acid (ppm)
Area Ratio (%)'
Particle Density ( W)'
0 16.3 0.62
5 1.8 0.0093
200 0.1 0.0029
2000 0.3 0.0033
' Area occupied by particles divided by the total area of the wafer surface.
^ Number of particles on unit area of wafer surface.
alumina particles do not bear a charge of large value under the slurry conditions. As shown
in Fig. 5.3, in the presence of 5 ppm citric acid, the zeta potential of alumina is only
approximately 8 mV.
Fig. 5.13 shows tungsten and patterned wafer surfaces contaminated in 2.0 g/1
alumina slurries with and without citric acid followed by rinsing in DI water. Both the
tungsten and pattemed wafer surfaces contaminated in slurries containing 2000 ppm of
citric acid are cleaner than those contaminated in slurries without any citric acid. Citric acid
thus appears to be very effective in inhibiting alumina contamination on tungsten and
pattemed wafer surfaces. Citric acid can change the zeta potential of alumina and render
alumina particles negatively charged (e.g., see Fig. 5.3) but it has little effect on the
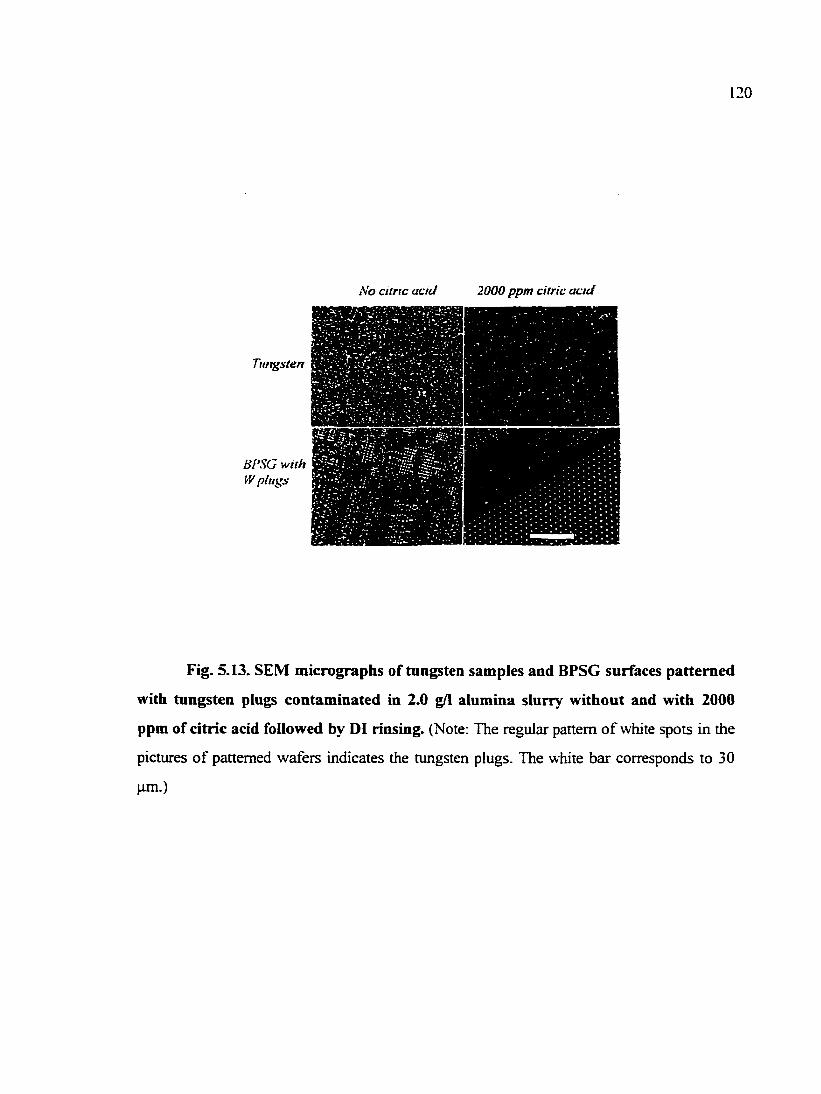
120
iVo dtnc acid 2000 ppm citric acid
Tungsten
iSl'SG with iV plugs
Fig. 5.13. SEM micrographs of tungsten samples and BPSG surfaces patterned
with tungsten plugs contaminated in 2.0 g/l alumina slurry without and with 2000
ppm of citric acid followed by DI rinsing. (Note: The regular pattern of white spots in die
pictures of patterned wafers indicates the tungsten plugs. The white bar corresponds to 30
lam.)

121
electrokinetics of silicon dioxide and tungsten. When both the wafer surface (composed of
silicon dioxide and/or tungsten) and alumina particles bear negative zeta potential, the
particiilate contamination is dramatically reduced.
5.3.2. Polishing Experiments
Polishing expenments were done on oxide surfaces with a ' mall scale polisher as
described previously. Fig. 5.14 shows a series of micrographs of polished samples. From
Figs. 5.14(a) - (c), it can be concluded that the addition of ^0 ppm citric acid into 20.0 g/1
alumina slurries gives rise to a very clean oxide surface. A comparison of Figs. 5.14(a) and
(d) shows that, with 100 ppm of citric acid in 20.0 g/1 alumina slurries, the polished oxide
sur&ce has more alumina particles when the slurry pH is 2.5 than when the slurry pH is 4.0.
This indicates that pH plays an important role in controlling particulate contamination. As
shown in Fig. 5.3, as the slurry pH is changed fixjm 4.0 to 2.5 the sign of the zeta potential
of alumina particles changes from negative to positive.
Results of polishing experiments conducted on tungsten surfaces are shown in Fig.
5.15. Based on these micrographs in Fig. 5.15, it can also be seen that citric acid can reduce
alumina particulate contamination on tungsten films, and the pH of alumina slurry
influences the contamination level of alumina on tungsten. As mentioned earlier, citric acid
modifies the zeta potential of alumina but has little effect on the electrokinetics of silicon
dioxide and tungsten surfaces.
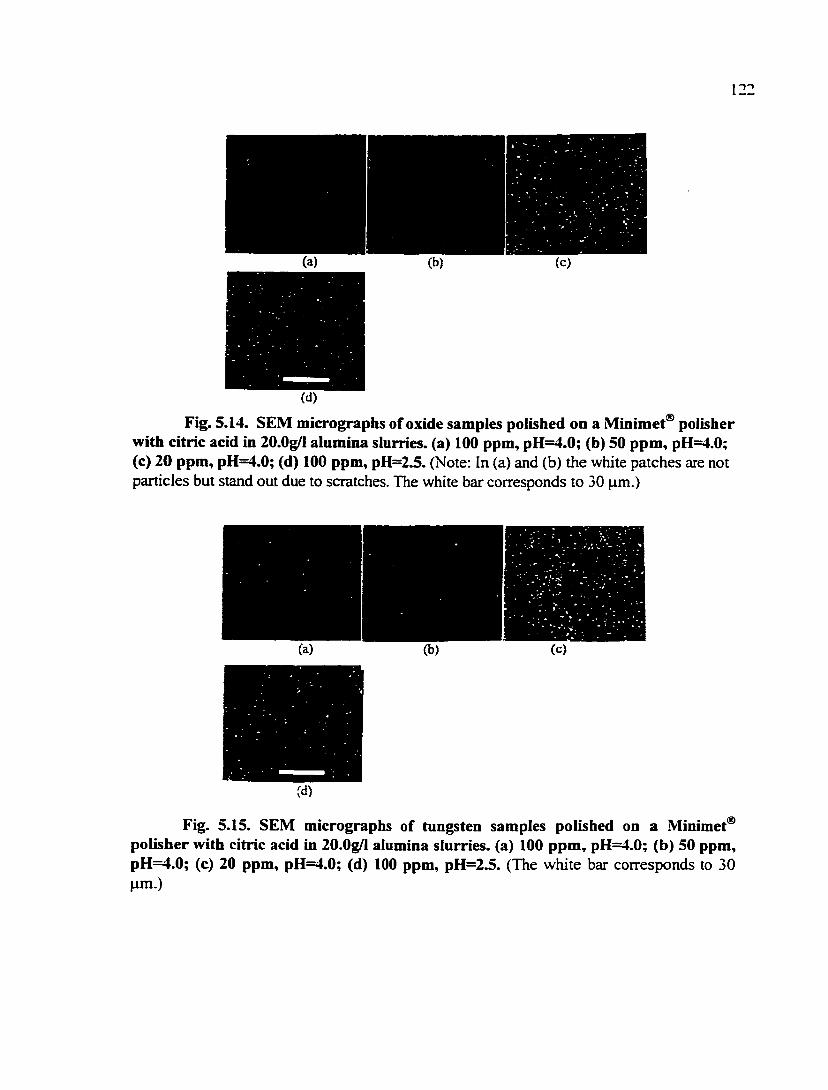
(a) (b) (c)
(d)
Fig. 5.14. SEM micrographs of oxide samples polished on a Minimet® polisher with citric acid in 20.0g/l alumina slurries, (a) 100 ppm, pH=4.0; (b) 50 ppm, pH=4.0; (c) 20 ppm, pH=4.0; (d) 100 ppm, pH=2.5. (Note: In (a) and (b) the white patches are not particles but stand out due to scratches. The white bar corresponds to 30 |i.m.)
(a) (b) (c)
id)
Fig. 5.15. SEM micrographs of tungsten samples polished on a Minimet® polisher with citric acid in 20.0g/l alumina slurries, (a) 100 ppm, pH=4.0; (b) 50 ppm, pH=4.0; (c) 20 ppm, pH=4.0; (d) 100 ppm, pH=2.5. (The white bar corresponds to 30 l^m.)
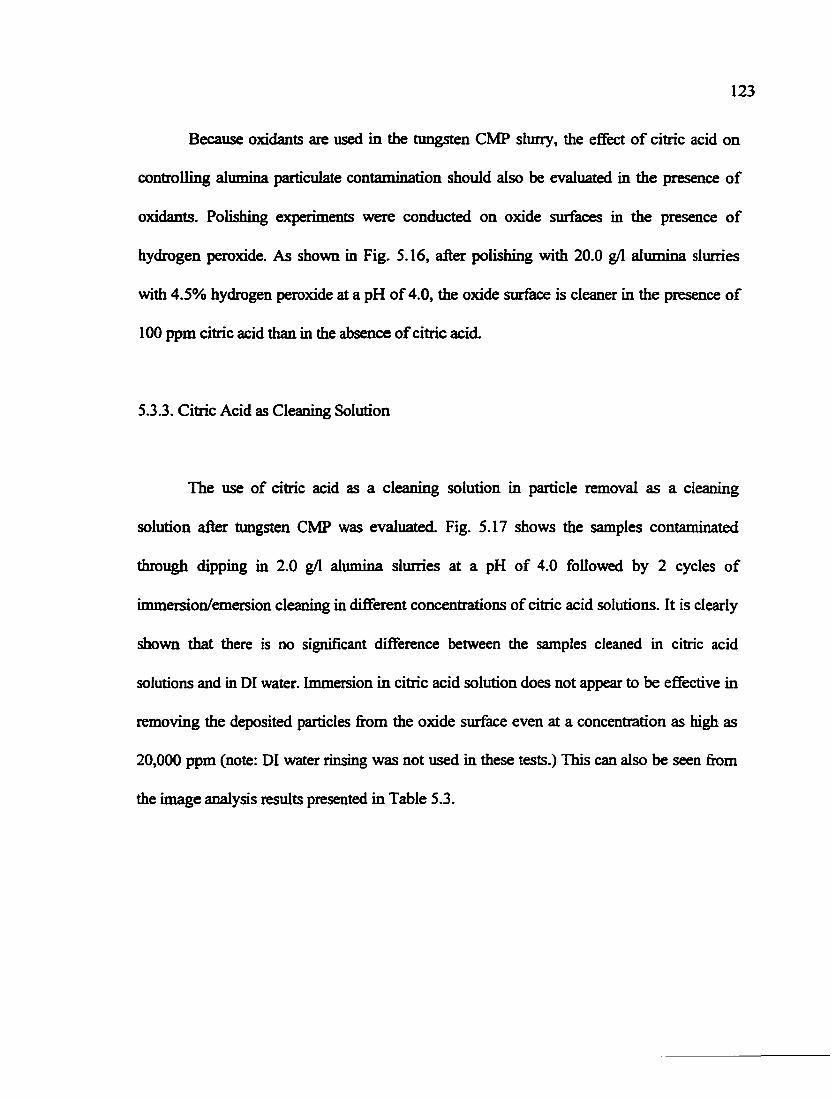
123
Because oxidants are used in the tungsten CMP slurry, the efifect of citric acid on
controlling alumina particulate contamination should also be evaluated in the presence of
oxidants. Polishing experiments were conducted on oxide surfaces in the presence of
hydrogen peroxide. As shown in Fig. 5.16, aiter polishing with 20.0 g/1 alumina sliirries
with 4.5% hydrogen peroxide at a pH of 4.0, the oxide surface is cleaner in the presence of
100 ppm citric acid than in the absence of citric acid.
5.3.3. Citric Acid as Cleaning Solution
The use of citric acid as a cleaning solution in particle removal as a cleaning
solution after tungsten CMP was evaluated. Fig. 5.17 shows the samples contaminated
through dipping in 2.0 g/1 alumina slurries at a pH of 4.0 followed by 2 cycles of
immersion/emersion cleaning in different concentrations of citric acid solutions. It is clearly
shown that there is no signiflcant difference between the samples cleaned in citric acid
solutions and in DI water. Immersion in citric acid solution does not appear to be effective in
removing the deposited particles from the oxide surface even at a concentration as high as
20,000 ppm (note: DI water rinsing was not used in these tests.) This can also be seen from
the image analysis results presented in Table 5.3.
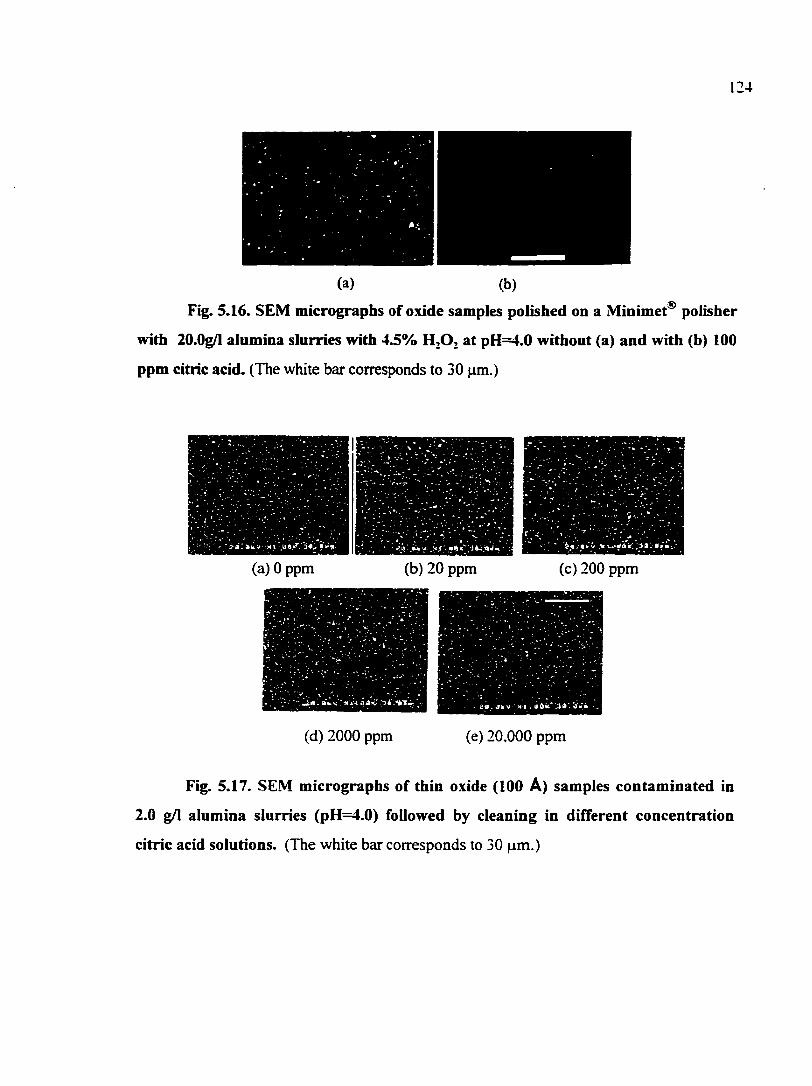
(a) (b)
Fig. 5.16. SEM micrographs of oxide samples polished on a Minimet® polisher
with 20.0g/l alumina slurries with 4.5% at pH=4.0 without (a) and with (b) 100
ppm citric acid. (The white bar corresponds to 30 |im.)
(a) 0 ppm (b) 20 ppm (c) 200 ppm
(d) 2000 ppm (e) 20,000 ppm
Fig. 5.17. SEM micrographs of thin oxide (100 A) samples contaminated in
2.0 g/1 alumina slurries (pH=4.0) followed by cleaning in different concentration
citric acid solutions. (The white bar corresponds to 30 fim.)
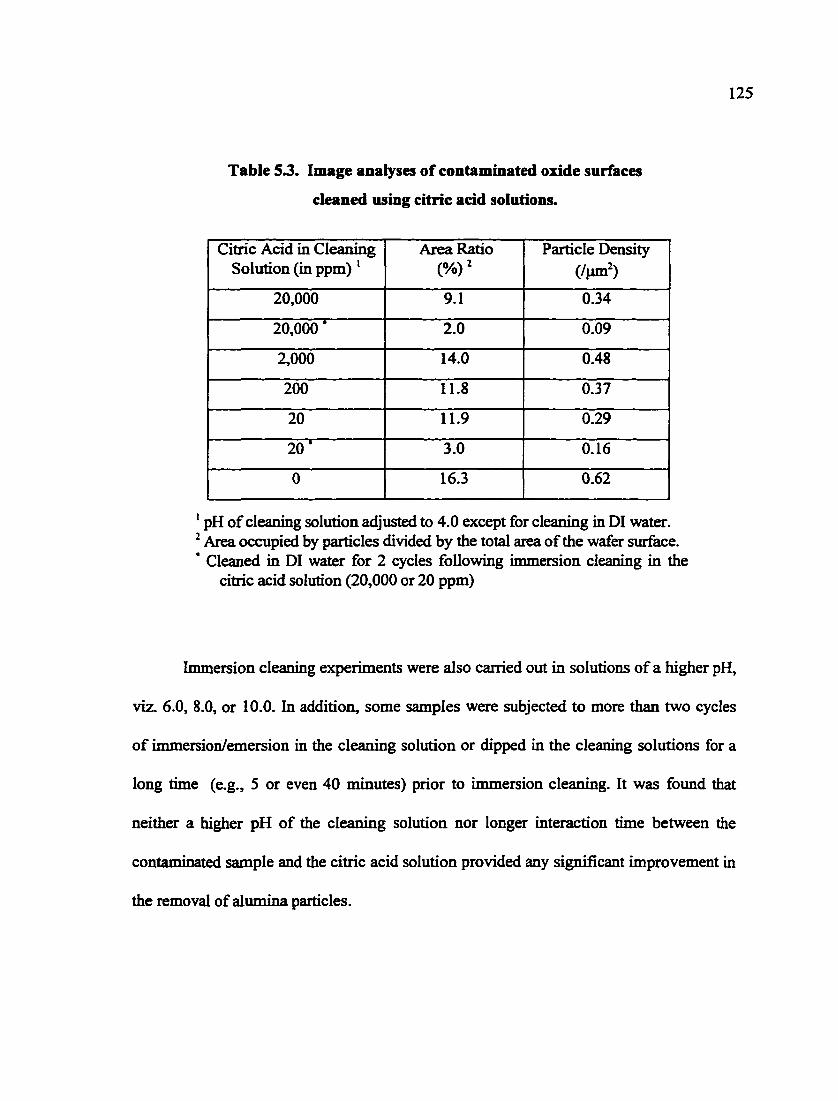
125
Table 5 J. Image analyses of contaminated oxide surfaces
cleaned using citric acid solutions.
Citric Acid in Cleaning Solution (in ppm)'
Area Ratio (%)'
Particle Density (/^m^)
20,000 9.1 0.34
20,000 • 2.0 0.09
2,000 14.0 0.48
200 11.8 0.37
20 11.9 0.29
20* 3.0 0.16
0 16.3 0.62
' pH of cleaning solution adjusted to 4.0 except for cleaning in DI water. ^ Area occupied by particles divided by the total area of the wafer surface. ' Cleaned in DI water for 2 cycles following immersion cleaning in the
citric acid solution (20,000 or 20 ppm)
Immersion cleaning experiments were also carried out in solutions of a higher pH,
viz. 6.0, 8.0, or 10.0. In addition, some samples were subjected to more than two cycles
of immersion/emersion in the cleaning solution or dipped in the cleaning solutions for a
long time (e.g., 5 or even 40 minutes) prior to immersion cleaning. It was found that
neither a higher pH of the cleaning solution nor longer interaction time between the
contaminated sample and the citric acid solution provided any significant improvement in
the removal of alumina particles.
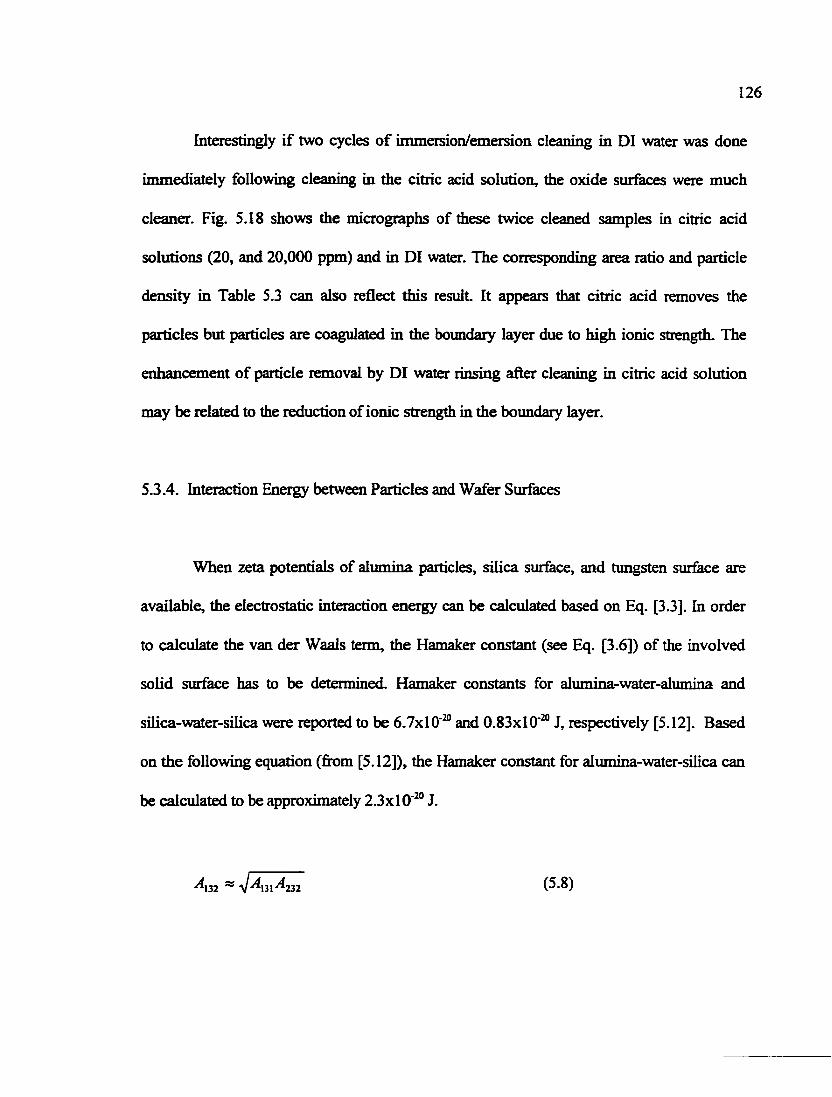
126
Interestingly if two cycles of immersion/emersion cleaning in DI water was done
immediately following cleaning in the citric acid solution, the oxide surfaces were much
cleaner. Fig. 5.18 shows the micrographs of these twice cleaned samples in citric acid
solutions (20, and 20,000 ppm) and in DI water. The corresponding area ratio and particle
density in Table 5.3 can also reflect this result It appears that citric acid removes the
particles but particles are coagulated in the boundary layer due to high ionic strength. The
enhancement of particle removal by DI water rinsing after cleaning in citric acid solution
may be related to the reduction of ionic strength in the boundary layer.
5.3.4. Interaction Energy between Particles and Wafer Surfaces
When zeta potentials of alimiina particles, silica sijrface, and tungsten surface are
available, the electrostatic interaction energy can be calculated based on Eq. [3.3]. In order
to calculate the van der Waals term, the Hamaker constant (see Eq. [3.6]) of the involved
solid surface has to be determined. Hamaker constants for alumina-water-alumina and
silica-water-silica were reported to be 6.7x10'® and 0.83x10"® J, respectively [5.12]. Based
on the following equation (fix>m [5.12]), the Hamaker constant for alumina-water-silica can
be calculated to be jqjproximately 2.3x10' ° J.
(5.8)
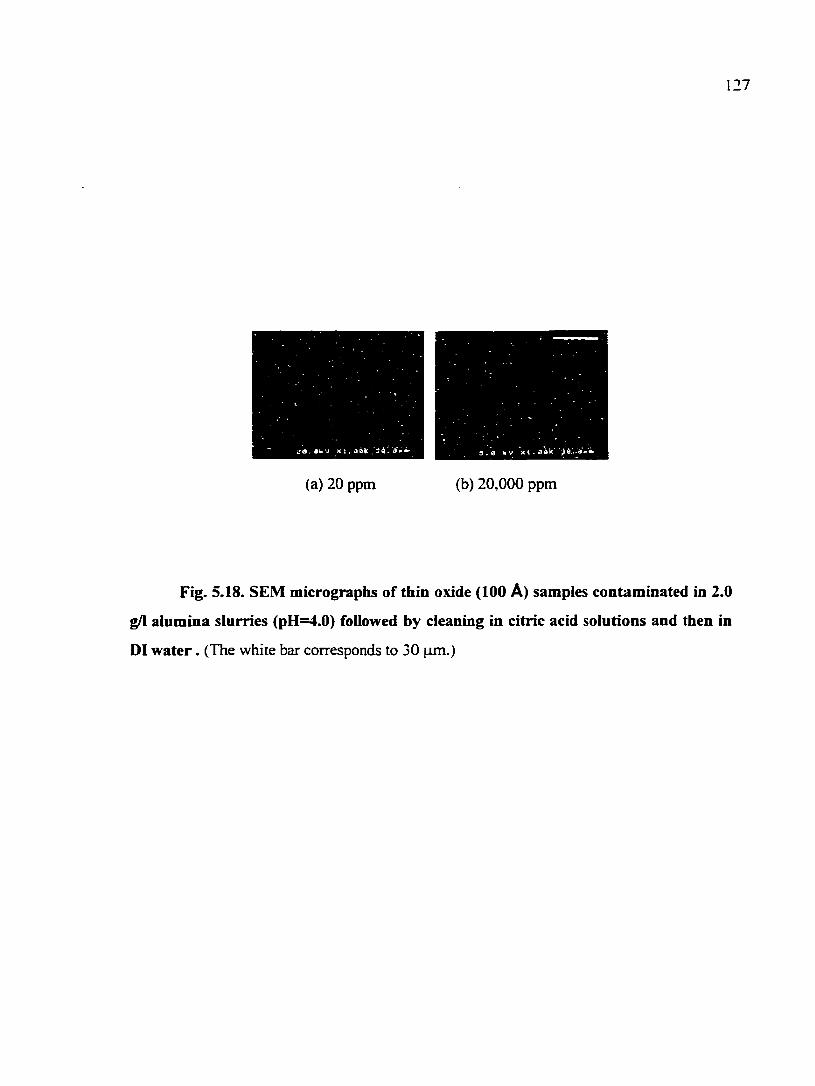
127
(a) 20 ppm (b) 20.000 ppm
Fig. 5.18. SEM micrographs of thin oxide (100 A) samples contaminated in 2.0
g/1 alumina slurries (pH=4.0) followed by cleaning in citric acid solutions and then in
DI water. (The while bar corresponds to 30 |J.m.)
128
In this equation, "I" and "2" represent two media interacting with each other through the third
medium denoted by "3". Considering the magnitude of Hamaker constants reported for metals
and their oxides [5.12], it may be appropriate to assume that the Hamaker constant for
tungsten-water-tungsten (note; tungsten film can be oxidized in CMP) to be 30 x 10' J.
Therefore, using Eq. (5.8), the Hamaker constant for alumina-water-tungsten (or tui^sten
oxide) can be calculated to be 14x10' J. These data are listed in Table 5.4.
Table 5.4. Hamaker constants of interest to tungsten CMP.
Interacting media (1-3-2) A,32 (in 10"^ J) Source
alumina - water - alumina 6.7 [5.12]
alumina - water - silica 2.3
calculated in this
study
alumina - water - tungsten (or tungsten oxide) 14 calculated in this
study alumina with citric acid film - water - silica 1.6
calculated in this
study
alunnna with citric acid film - water - tungsten
(or tungsten oxide)
3
calculated in this
study
Using Eqs. (3.3)-(3.6), the total interaction energy between an alumina particle (0.2 ^im in
radius) and silica and tungsten surfaces in 20.0 g/I Cerac alumina (+ 0.01 M KNO3, pH=4)
slurries was calculated and plotted in Fig. 5.19. Zeta potentials used in the calculation were
taken fi-om measured values shown in Figs. 3.4 and 5.3 (or 5.4) and are listed in Table 5.5.

129
3.00E-19 (a) Silica surface
-» >» a W O.OOE+OO o c « c o •• u S -3.00E-19 S c —•—NoCA
ppmCA —K—100 ppmCA
-6.00E-19
0.001 0.0001 0.01 0.1 1
Separation between particle and surface (^m)
3.00E-19
>« ? o c a c o s a <0
O.OOE+OO
g -3.00E-19--S c
-6.00E-19
fb) Tungsten surface
A=3e-2Q J
A=1.4e-19 J
I I.I 11
- No citric acid - - -it - -100 ppm CA
—H— 100 ppm CA I I 11 nil
0.0001 0.001 0.01 0.1 1 Separation between particle and surfoce (^m)
Fig. 5.19. Calculated interaction energy between alumina particle (0.2 |xm in radius) and wafer surface in 0.01 M KNO, (+ 20.0 g/1 Cerac alumina) at pH=4 with and without citric acid, (a) Silica surface, (b) tungsten surface.
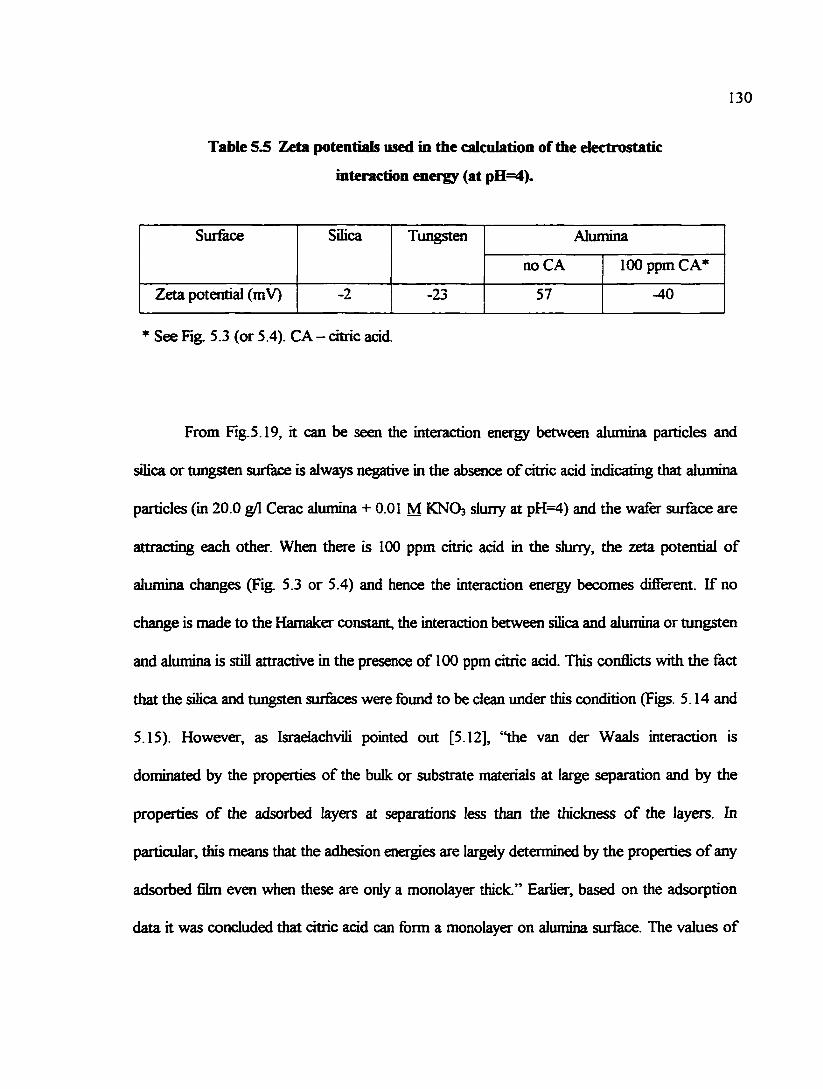
130
Table 5^ Zeta potentials used in the calculation of the electrostatic
interaction enet^ (at pH=4).
Surface Silica Tungsten Ahmiina Surface Silica Tungsten
no CA 100 ppm CA*
Zeta potential (mV) -2 -23 57 -40
* See Rg. 5.3 (or 5.4). CA - citric acid.
From Fig.5.19, it can be seen the interaction energy between alumina particles and
silica or tungsten surface is always negative in the absence of citric acid indicating that alumina
particles (in 20.0 g/I Cerac alumina + 0.01 M KNO3 slurry at pH=4) and the wafer surfece are
attracting each other. When there is 100 ppm citric acid in the slurry, the zeta potential of
alumina changes (Fig. 5.3 or 5.4) and hence the interaction energy becomes different. If no
change is made to the Hamaker constant, the interaction between silica and alimiina or tungsten
and alumina is still attractive in the presence of 100 ppm citric acid. This conflicts with the fact
that the silica and tungsten surfaces were found to be clean under this condition (Figs. 5.14 and
5.15). However, as Israelachvili pointed out [5.12], "the van der Waals interaction is
dominated by the properties of the bulk or substrate materials at large separation and by the
properties of the adsorbed layers at separations less than the thickness of the layers. In
particular, this means that the adhesion energies are largely determined by the properties of any
adsoibed film even when these are only a monolayer thick." Earlier, based on the adsorption
data it was concluded that citric acid can form a monolayer on alumina sur&ce. The values of
131
A(waler) and A(silica) were reported to be 3.7x10"^ J and 0.83x10' J, respectively. Assuming
a vahie of 5x10' J for the Hamaker constant of citric acid, the Hamaker constant for the
system of alumina with citric acid film-water-silica may be calculated to be 1.6x10' ' J using the
following equation [5.12]
For the system of alumina with citric acid film-water-silica, "1", "2", and "3" represent alumina
covered with citric acid film, silica, and water, respectively. Similarly, the Hamaker constant for
alumina with citric acid film-waler-tungsten was calculated based on Eq. (5.8) to be 3x10' J
(note; A(citric acid film-water-dtric acid film) ~ 0.3x10' J and A(tungsten-water-tungsten) «
30x10' J.) These two Hamaker constants for alumina with citric acid film-water-wafer are
also listed in Table 5.4.
When the electrostatic interaction was calculated based on the zeta potential in the
presence of citric acid and the van der Waals interaction was calculated using the Hamaker
constant for citric acid-water-wafer surface, the interaction energy curve shows a hump above
the zero energy (Fig. 5 .19). The bump is the energy barrier for alumina particle deposition onto
silica or tungsten sur&ce. For example, based on the curve with A = 3x10' J in Fig. 5.19(b),
the deposition of alumina particles onto the tungsten sur&ce is not thermodynamically
&vorable if they are separated fi'om the surface by a distance greater than 0.002 ^m.
(5.9)
132
Obviously, a more detailed study of the Hamaker constant of solid surfaces in the
presence of organic additives will lead to a more solid discussion.
5.4. Electrochemical Tests of Tungsten in Citric Acid Solutions
The effect of additives on the metal film removal is of great interest to tungsten
CMP. Electrochemical tests of tungsten films in citric acid solutions were carried out at an
acidic solution pH of 4.0. Fig. 5.20 shows the polarization curves of tungsten films in the
presence of citric acid with and without hydrogen peroxide. It can be seen from Fig. 5.20
that the addition of hydrogen peroxide increases the corrosion/dissolution of tungsten
films. In the absence of hydrogen peroxide and at pH=4.0, the corrosion current density
of tungsten is found (as shown in Fig. 3.10(b)) to be approximately 800 nA/cm^; after
adding 4.5% hydrogen peroxide into the solution, the corrosion current density of
tungsten increases by about two orders magnitude and becomes ~50 ^A/cm^ These two
values of corrosion current density correspond to tungsten corrosion rates of 0.08 and
4.94 A/min., respectively. In addition, addition of hydrogen peroxide raises the corrosion
potential of tungsten films by approximately 200 mV. The detailed reaction mechanisms of
tungsten films in oxidants containing solutions will be summarized in the chapter on
galvanic corrosion.
Either in the presence or in the absence of hydrogen peroxide, citric acid increases
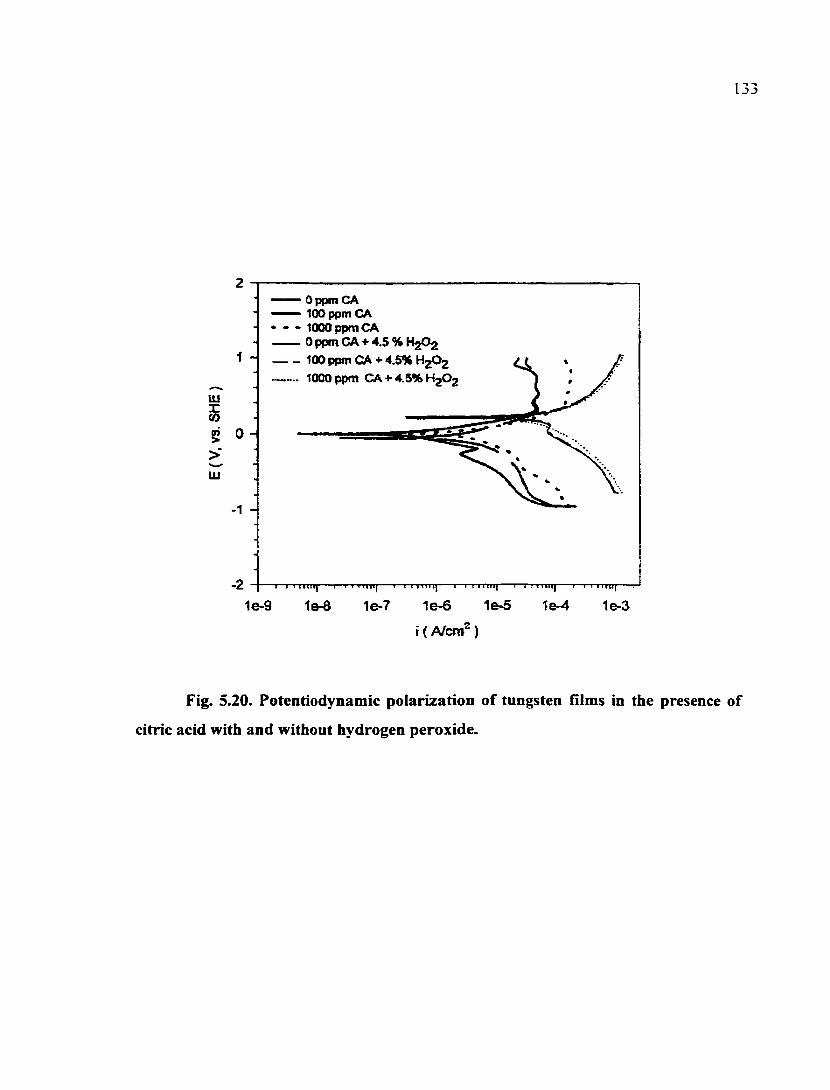
I
2
1
lu r CO
§• 0 > UJ
-1
-2
1e-9 16-8 1e-7 1e-6 16-5 1e-4 1e-3
f (AJcm^)
Fig. 5.20. Potentiodynamic polarization of tungsten films in the presence of
citric acid with and without hydrogen peroxide.
— Oppm CA —— 100 ppm CA • - - 1000 ppm CA
0 ppm CA + 4.5 % H2O2 100 ppm CA + 4.5% H2O2 1000ppm CA + 4.5%H202
iiivp I 1 1 1 l l l l l Tnr lllll TTTir
134
the corrosion of tungsten only slightly, even at concentrations as high as 1,000 ppm.
These results indicate that the addition of citric acid to polishing slurries would not be
detrimental to the stability of tungsten films.
5.5. Conclusions
Uptake and electrokinetic measurements show that citric acid and its dissociated
forms can adsorb onto the alumina surface. The uptake amount depends on the
concentration of citric acid in the slurry and the slurry pH, but is limited to a monolayer at a
pH of 4.0. The higher the pH value of the slurry, the lower is the uptake amount Citric
species exhibit a specific interaction with the alumina surface. The electrostatic interaction
and the surface chemical reaction together determine the electrokinetic properties of
alumina in the presence of citric acid. Inhibition of alumina dissolution by citric acid is
probably due to the formation of binuclear bidentate complex at pH = 4.
Through a series of deposition and polishing experiments on silicon dioxide and
tungsten surfaces, it has been found that the addition of citric acid to an aliimina slurry at a
pH of 4.0 can result in reduced alumina particulate contamination. This reduction in
particulate contamination is attributable to the modification of the zeta potential of alumina
by citric acid and a change of Hamaker constant due to the adsorption of citric acid onto
alumina. The interaction energy between alumina particles and the silica and tungsten
surfaces was calculated. It appears that the Hamaker constant for alumina-water-silica (or
135
tungsten) should be changed in the presence of citric acid. Citric acid is effective in
controlling alumina contamination even in the presence of hydrogen peroxide. If DI rinsing
is used following citric acid cleaning, particle removal can be achieved. Electrochemical
tests show that citric acid does not attack tungsten film significantly.
136
Chapter 6
USE OF MALONIC ACID DURING TUNGSTEN CMP
As an alternative to citric acid, the use of malonic acid in alumina slurries was
explored for the reduction of particulate contamination during tungsten CMP. Through a
comparison between citric acid and malonic acid with regard to the interaction between
the organic acid and alumina particles, the effect of the structure of carboxylic acids on
their performance in controlling alumina contamination was elucidated.
6.1. Chemistry of Malonic Acid Solutions
Malonic acid, C3H4O4, is a dicarboxylic acid with a structure shown below
COOH I
CH2 I
COOH
At room temperature, its two pKa values are 2.83 and 5.70, corresponding to the
following dissociation reactions, respectively [6.1].
H2L0HL +tr pK,=2.83 (6.1)
137
HL - o L'- + FT pKj = 5.70 (6.2)
The speciation in maionic acid solution as a function of pH is shown in Fig. 6.1. Malonic
acid can complex with metal ions such as and Fe^ in solutions ([6.2], and Appendix
1). For example, the overall complexation constant for a 1:2 aluminimi (+3)-malonic acid
complex is approximately 10' [6.2]. The existence of stable complexes with some metal
ions demonstrates the possibility of using malonic acid in controlling metallic
contamination on wafers during CMP.
6.2. Interaction between Malonic Acid and Alumina Particles
6.2.1. Uptake Measurements
To characterize the interaction between malonic acid and alumina particles,
electrokinetic and uptake measurements were carried out. The kinetics of uptake of
malonic acid by alimiina was investigated first (Fig. 6.2). It was foimd that the uptake
amoimt increased rapidly in 30 min. For all subsequent uptake measurements, a contact
time of 10 hours was chosen to ensure that equilibriimi was reached.
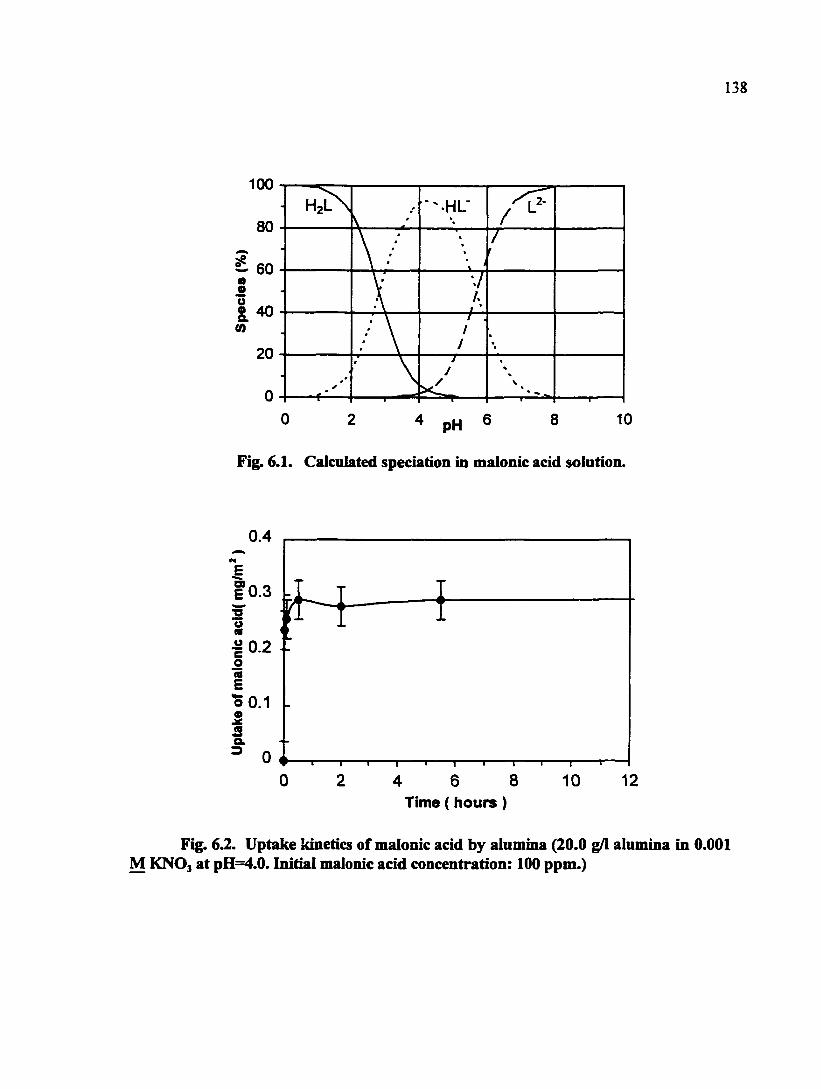
138
« o o o a (0
100
80
60
40
20
0
•-.HL"
\ «
\ » \ -/ r
•./ A
1 * \ • \
» \ « \
« \
f , / /
» V J J
/
»
V
0 2 4 pH 6 8 10
Fig. 6.1. Calculated speciation in malonic acid solution.
r
T 1 I 1 r 4 6 8 Time (hours)
Fig. 62. Uptake kinetics of malonic acid by alumina (20.0 g/1 alumina in 0.001 M KNO3 at pH=4.0. Initial malonic acid concentration: 100 ppm.)
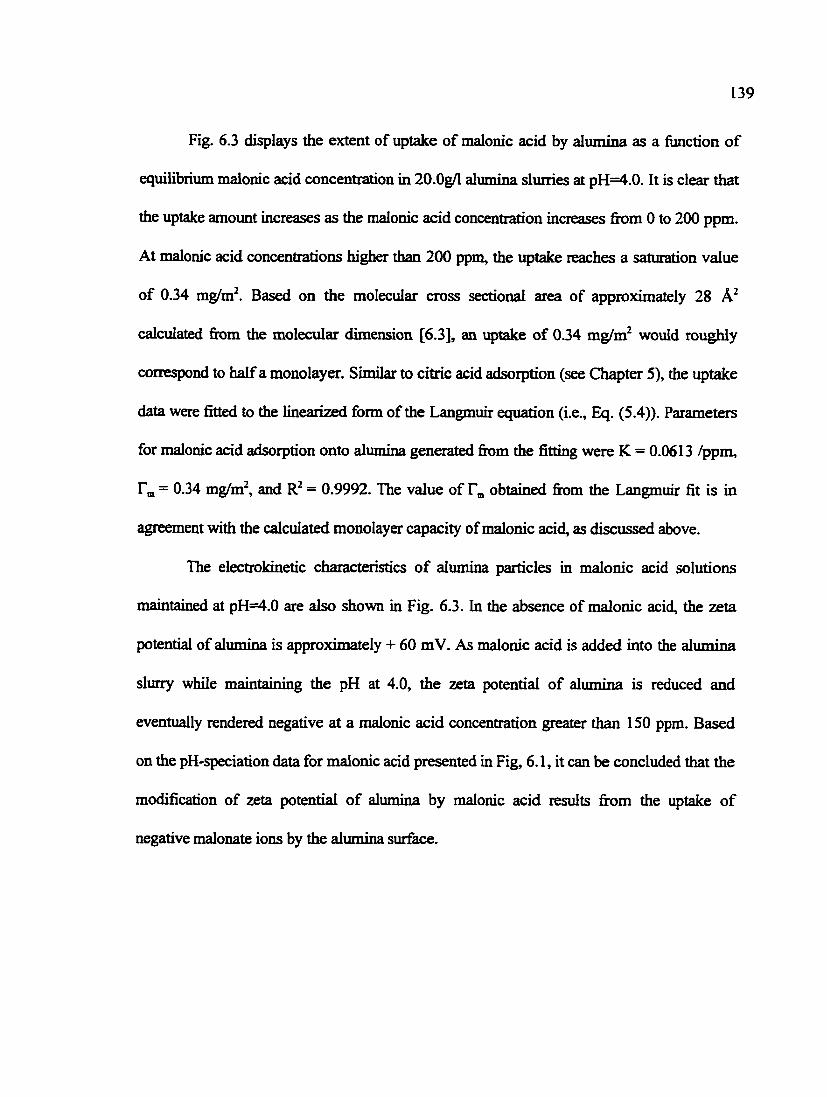
139
Fig. 6.3 displays the extent of uptake of malonic acid by alimiina as a function of
equilibrium malonic acid concentration in 20.0g/l alumina slurries at pH==4.0. It is clear that
the uptake amount increases as the malonic acid concentration increases from 0 to 200 ppm.
At malonic acid concentrations higher than 200 ppm, the uptake reaches a saturation value
of 0.34 mg/m^. Based on the molecular cross sectional area of approximately 28
calculated from the molecular dimension [6.3], an uptake of 0.34 mg/m^ would roughly
correspond to half a monolayer. Similar to citric acid adsorption (see Chapter 5), the uptake
data were fitted to the linearized form of the Langmuir equation (i.e., Eq. (5.4)). Parameters
for malonic acid adsorption onto aliimina generated from the fitting were K = 0.0613 /ppm.
To, = 0.34 mg/m^, and = 0.9992. The value of obtained firom the Langmuir fit is in
agreement with the calculated monolayer capacity of malonic acid, as discussed above.
The electrokinetic characteristics of alumina particles in malonic acid solutions
maintained at pH=4.0 are also shown in Fig. 6.3. In the absence of malonic acid, the zeta
potential of alimiina is approximately + 60 mV. As malonic acid is added into the alumina
slurry while maintaining the pH at 4.0, the zeta potential of alumina is reduced and
eventually rendered negative at a malonic acid concentration greater than 150 ppm. Based
on the pH-speciation data for malonic acid presented in Fig, 6.1, it can be concluded that the
modification of zeta potential of alumina by malonic acid results from the uptake of
negative malonate ions by the alumina surface.
140
60 > E
« e S o a a o N
30
T I I. •-
i 1 -
—^ZP * —X—Uptake
'X A
• ~
- - 0 - - Langmuir fit
•
. b
6 1—1 1— —1 1— —1 1 1——1
0 -M E a
oi o JC
S a
0 3
200 400 600 800 1000 Equilibrium concentration of malonic acid( ppm)
Fig. 63. Uptake of malonic acid by alumina (20.0 g/1 alumina in 0.001 M
KNO3 solution at pH = 4.0). Also shown are zeta potentials of alumina under the same
conditions and the fit of the uptake data to the Langmuir isotherm.
141
The effect of slurry pH on the uptake of malonic acid by alumina and the zeta
potential of alumina was studied in 20.0 g/1 alumina slurries containing 100 ppm malonic
acid. The. results are shown in Fig. 6.4. It can be seen that the uptake amount decreases
M^en the pH increases. A similar trend has been observed for the system of citric acid and
alumina (see Chapter 5). This behavior may be simply explained. At very low pH values
(e.g., pH=2), though there is not so much dissociation of malonic acid in the bulk solution,
there should be singly dissociated malonic acid (monomalonate ions) species available for
adsorption onto the alimiina surface. As pH increases to above 3 but below 5.7, the singly
charged malonate ions become the dominant specie in the malonic acid solution. At pH >
S.7, doubly charged malonate ions are available for adsorption, but the extent of adsorption
may be limited by strong electrostatic repulsion between adsorbed malonate ions. The
electrokinetic data clearly show that the zeta potential of alumina is rendered negative at pH
> 4 through the addition of 100 ppm malonic acid to the slurry. This reversal of zeta
potential is mostly attributable to the adsorption of doubly charged malonate ions.
Similar to citric acid, AG^ for adsorption of malonic acid onto alumina was spec.
calculated based on the Stem-Grahame equation (i.e., Eq. (5.5)) and the results are
summarized in Table 6.1. As can be seen from Table 6.1, for malonic acid adsorption
onto alumina, AG® is slightly smaller than the typical values for a chemical spec.
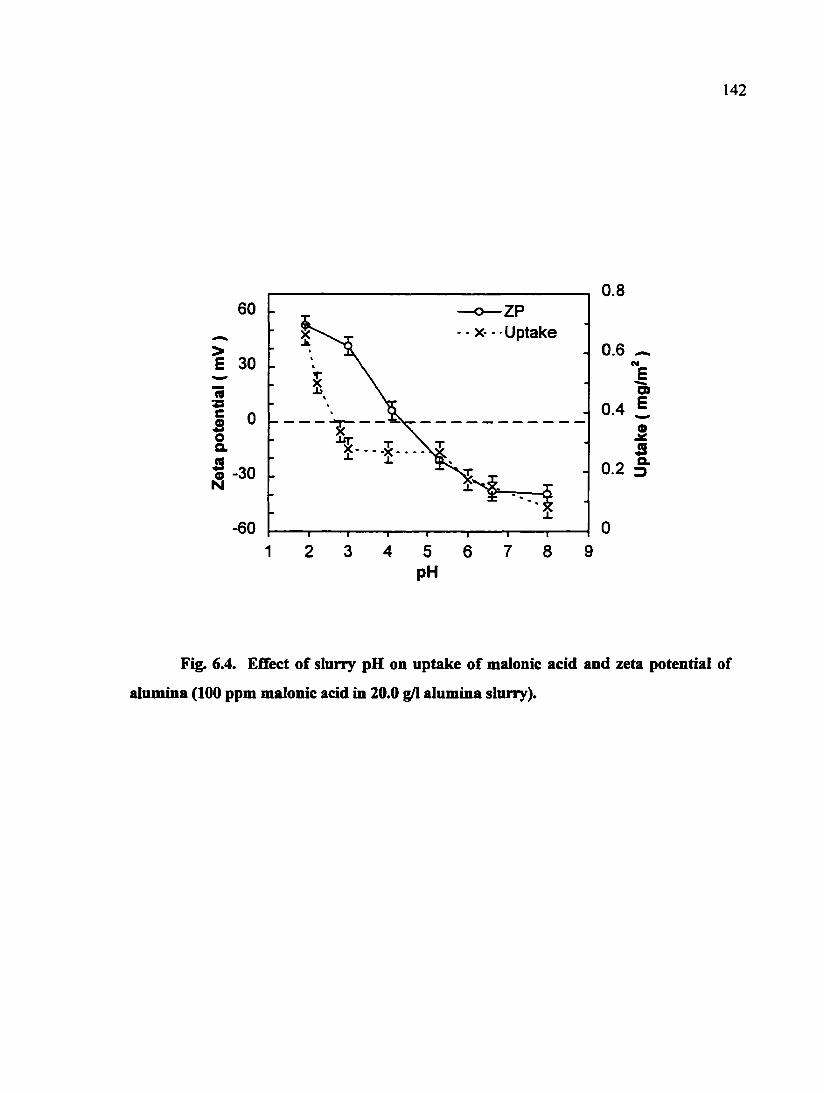
142
- —o—ZP
-
- • X- - Uptake
• ^ v \ \
-
• I
1 1—
1—1—
1—1
1 1 1
hxW
1
X
5
pH
8
0.8
0.6 ^
E c>
0.4 £ o
S 0.2 3
Fig. 6.4. Effect of slurry pH on uptake of malonic acid and zeta potential of
alumina (100 ppm malonic acid in 20.0 g/1 alumina slurry).
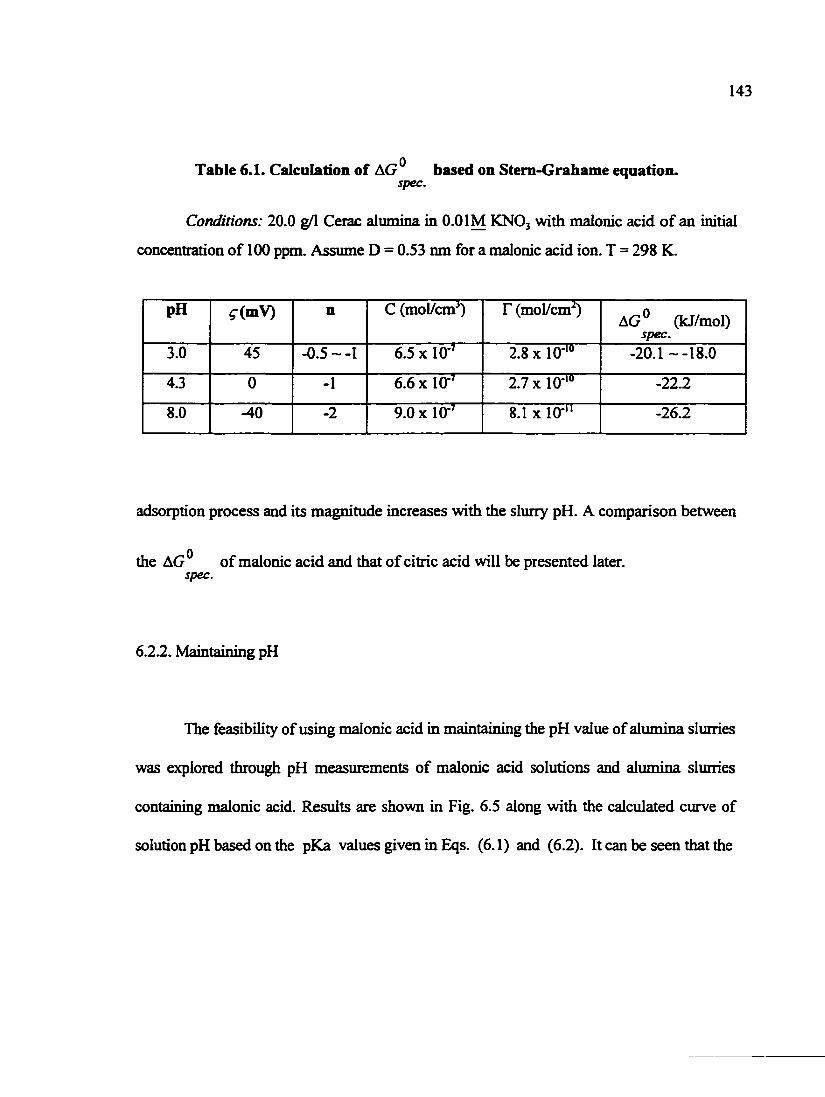
143
Table 6.1. Calculation of AG^ based on Stern-Grahame equation. spec.
Conditions: 20.0 g/1 Ceiac aiiimina in O.OIM KNO3 with malonic acid of an initial
concentration of 100 ppm. Assxme D = 0.53 nm for a malonic acid ion. T = 298 K.
pH ^(mV) n C (mol/cm^) r (mol/cm^) AG° (kJ/mol)
spec.
3.0 45 -0.5--I 6.5 X 1 0 ' 2.8 X 10-'° -20.1 ~-18.0
4.3 0 -1 6.6 X 1 0 ' 2.7x10-'° -22.2
8.0 -40 -2 9.0x10-' 8.1 X 10-" -26.2
adsorption process and its magnitude increases with the slurry pH. A comparison between
the AG® of malonic acid and that of citric acid will be presented later. spec.
6.2.2. Maintaining pH
The feasibility of using malonic acid in maintaining the pH value of alumina slurries
was explored through pH measurements of malonic acid solutions and alumina slurries
containing malonic acid. Results are shown in Fig. 6.5 along with the calculated curve of
solution pH based on the pKa values given in Eqs. (6.1) and (6.2). It can be seen that the
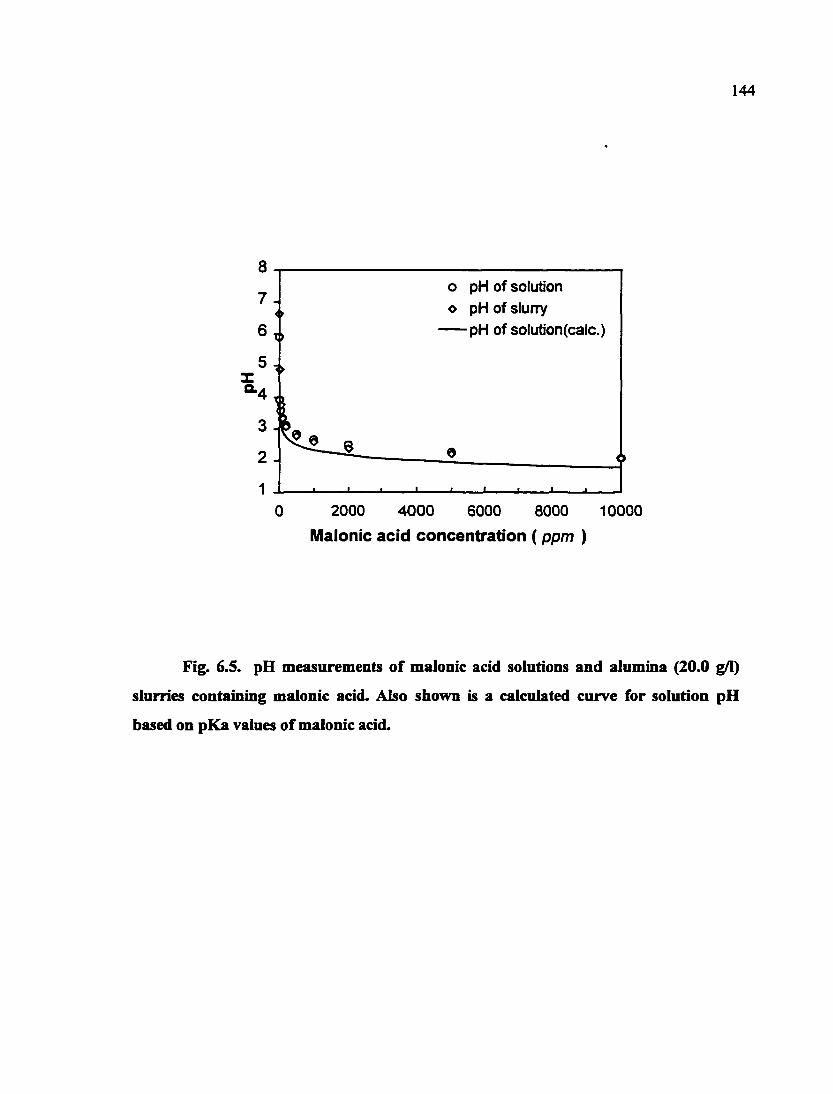
144
8 o pH of solution o pH of slurry
pH of solution(calc.)
7 i f
6
5
3
2
1 2000 4000 6000 8000 10000 0
Malonic acid concentration (ppm )
Fig. 6.5. pH measurements of malonic acid solutions and alumina (20.0 g/1)
slurries containing malonic acid. Also shown is a calculated curve for solution pH
based on pKa values of malonic acid.
145
addition of 1,000 ppm malonic acid can change 20.0 g/1 alumina slurry &om a near neutral
pH to an acidic pH of approximately 2.5. Neither solution pH nor slurry pH changes
significantly for more than 1,000 ppm malonic acid (Fig. 6.5).
6.2.3. Alumina Dissolution
The dissolution behavior of alumina in malonic acid solutions is shown in Fig. 6.6.
Similar to what was observed for citric acid (Fig. 5.6), the addition of malonic acid reduced
the extent of dissolution of alimiina significantly at pH = 4.
6.3. Polishing Experiments
Small-scale polishing experiments were carried out to explore the use of malonic
acid in controlling alimiina contamination on tungsten and oxide surfaces. In addition,
polishing rates of tungsten films were measured in alumina slurries containing malonic
acid to elucidate the detrimental effect if any of malonic acid.
6.3.1. Alumina Contamination
A series of polishing experiments were carried out using 20.0 g/1 slurries made of
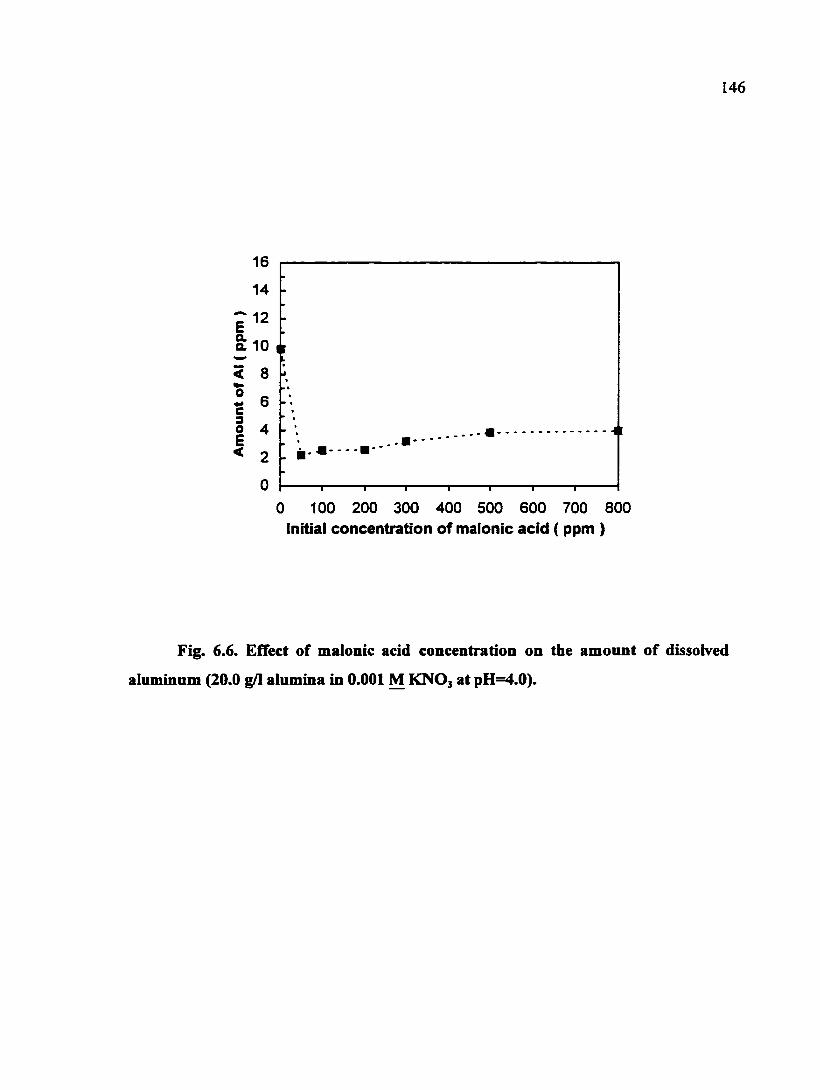
146
16
14
12 E 12
a 10
< 8
0 6 6
c 3 0 4 E < 2
0
0 100 200 300 400 500 600 700 800
initial concentration of malonic acid ( ppm )
Fig. 6.6. Effect of malonic acid concentration on the amount of dissolved
aluminum (20.0 g/1 alumina in 0.001 M KNO3 at pH=4.0).
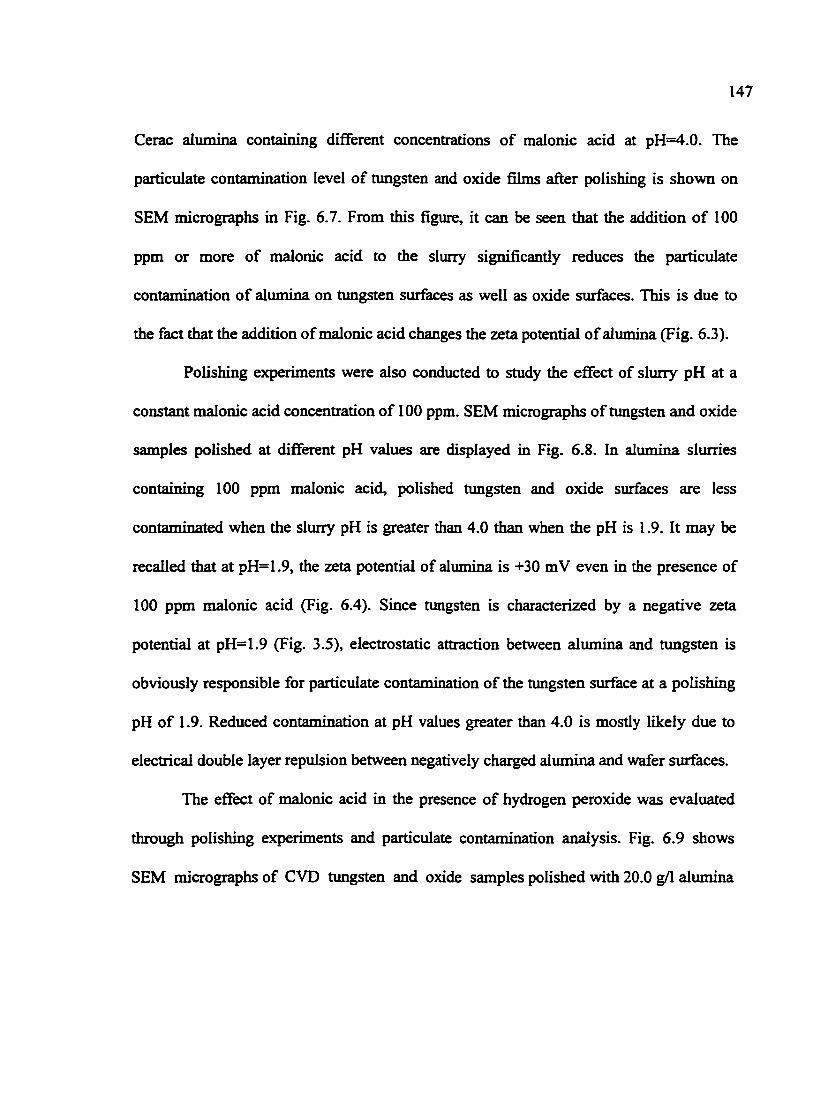
147
Cerac alumina containing different concentrations of malonic acid at pH=4.0. The
particulate contamination level of tungsten and oxide films after [X)lishing is shown on
SEM micrographs in Fig. 6.7. From this figure, it can be seen that the addition of 100
ppm or more of malonic acid to the slurry significantly reduces the particulate
contamination of alumina on timgsten surfaces as well as oxide surfaces. This is due to
the fact that the addition of malonic acid changes the zeta potential of alumina (Fig. 6.3).
Polishing experiments were also conducted to study the effect of slurry pH at a
constant malonic acid concentration of 100 ppm. SEM micrographs of tungsten and oxide
samples polished at different pH values are displayed in Fig. 6.8. In alumina slurries
containing 100 ppm malonic acid, polished tungsten and oxide surfaces are less
contaminated when the slurry pH is greater than 4.0 than when the pH is 1.9. It may be
recalled that at pH=1.9, the zeta potential of alumina is +30 mV even in the presence of
100 ppm malonic acid (Fig. 6.4). Since tungsten is characterized by a negative zeta
potential at pH=1.9 (Fig. 3.5), electrostatic attraction between alumina and tungsten is
obviously responsible for particulate contamination of the tungsten surface at a polishing
pH of 1.9. Reduced contamination at pH values greater than 4.0 is mostly likely due to
electrical double layer repulsion between negatively charged alumina and wafer surfaces.
The effect of malonic acid in the presence of hydrogen peroxide was evaluated
through polishing experiments and particulate contamination analysis. Fig. 6.9 shows
SEM micrographs of CVD tungsten and oxide samples polished with 20.0 g/1 alumina
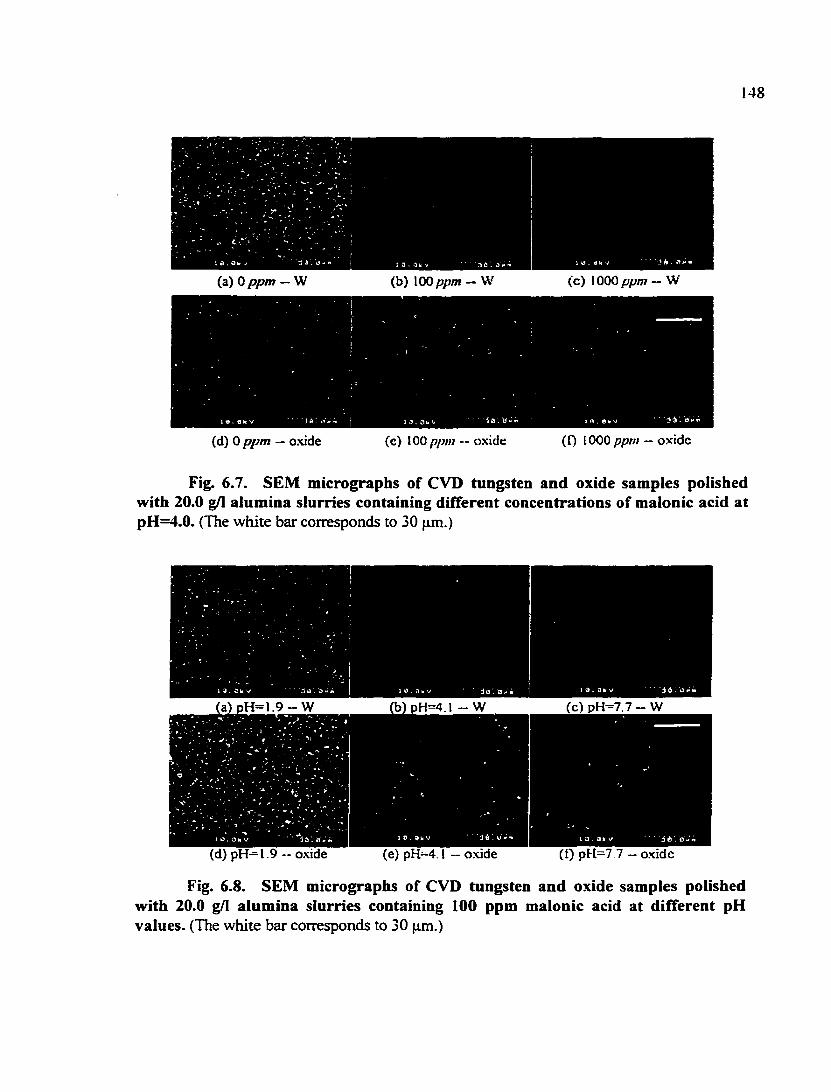
148
(a) 0 ppm — W (b) 100 ppm — W (c) 1000 ppm — W
(d) 0 pp/n — oxide (c) 100 ppm — oxide (0 1000 ppm — oxide
Fig. 6.7. SEM micrographs of CVD tungsten and oxide samples polished with 20.0 g/1 alumina slurries containing different concentrations of malonic acid at pH=4.0. (The white bar corresponds to 30 |im.)
(b) dH=4.i - W fc) pH=7.7-W
(d) pH—1.9 — oxide (e) pH^. 1 — oxide (t) pH=7 7 - oxide
Fig. 6.8. SEM micrographs of CVD tungsten and oxide samples polished with 20.0 g/1 alumina slurries containing 100 ppm malonic acid at different pH values. (The white bar corresponds to 30 |am.)
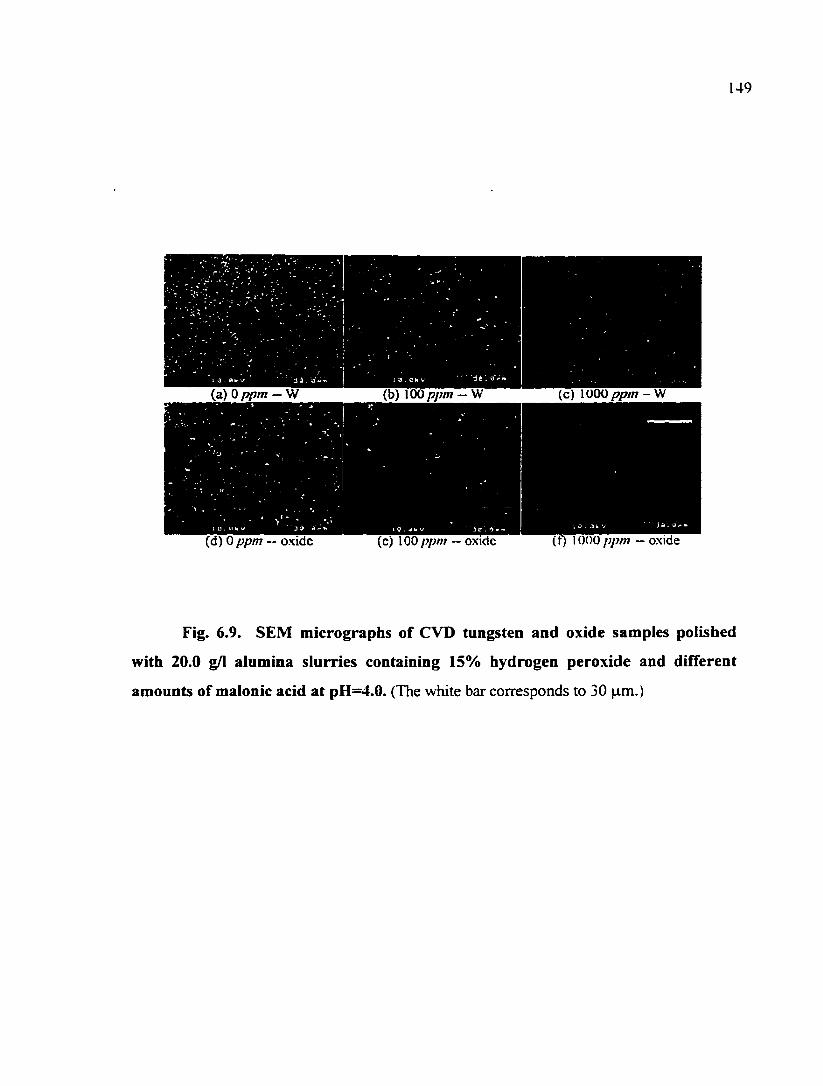
149
(b) 100 ppm — W (c) 1000 ppin - W
(c) 100 ppm ~ oxide (d) 0 ppm — oxide (f) 1000 ppm — oxide
Fig. 6.9. SEM micrographs of CVD tungsten and oxide samples polished
with 20.0 g/1 alumina slurries containing 15% hydrogen peroxide and difTerent
amounts of malonic acid at pH=4.0. (The white bar corresponds to 30 jam.)
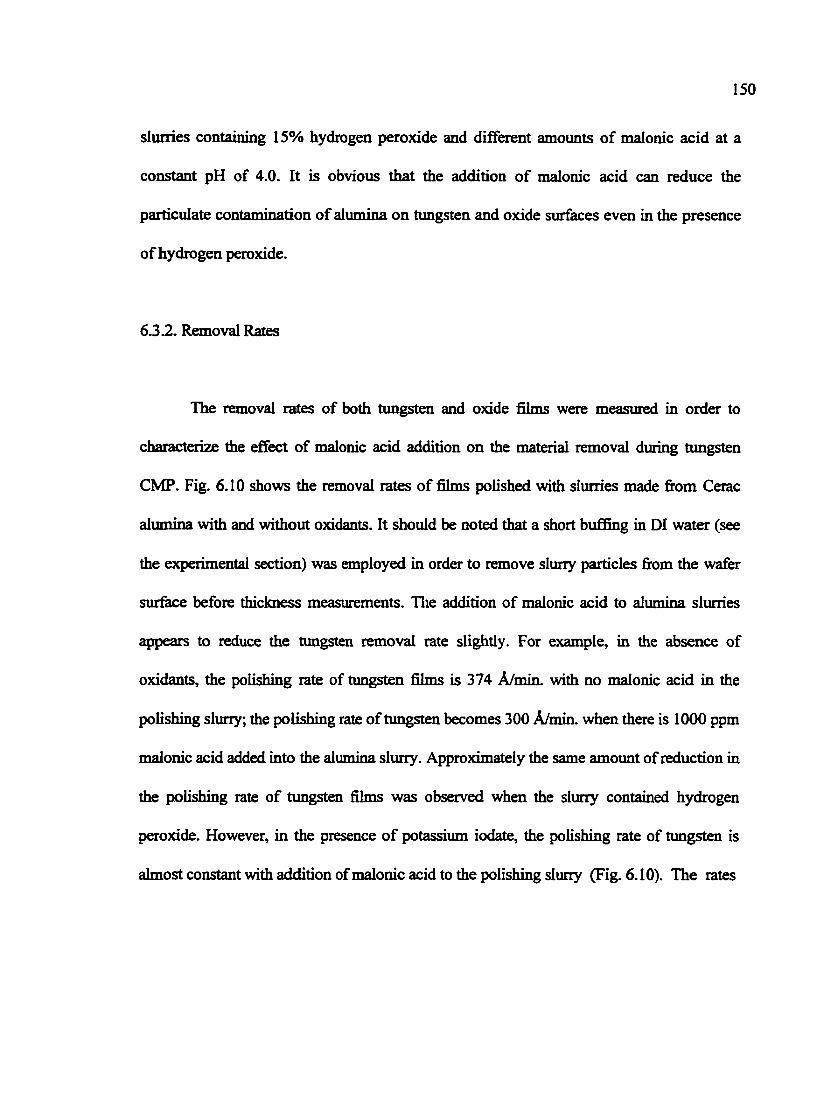
150
slurries containing 15% hydrogen peroxide and different amounts of maionic acid at a
constant pH of 4.0. It is obvious that the addition of maionic acid can reduce the
particulate contamination of alumina on tungsten and oxide surfaces even in the presence
of hydrogen peroxide.
6.3.2. Removal Rates
The removal rates of both tungsten and oxide films were measured in order to
characterize the effect of maionic acid addition on the material removal during tungsten
CMP. Fig. 6.10 shows the removal rates of films polished with slurries made from Cerac
alumina with and without oxidants. It should be noted that a short bufBng in DI water (see
the experimental section) was employed in order to remove slurry particles from the wafer
surface before thickness measurements. The addition of maionic acid to alumina slurries
appears to reduce the tungsten removal rate slightly. For example, in the absence of
oxidants, the polishing rate of tungsten films is 374 A/min. with no maionic acid in the
polishing slurry; the polishing rate of tungsten becomes 300 A/min. when there is 1000 ppm
maionic acid added into the alumina slurry. Approximately the same amount of reduction in
the polishing rate of tungsten films was observed when the slurry contained hydrogen
peroxide. However, in the presence of potassium iodate, the polishing rate of tungsten is
almost constant with addition of maionic acid to the polishing slurry (Fig. 6.10). The rates
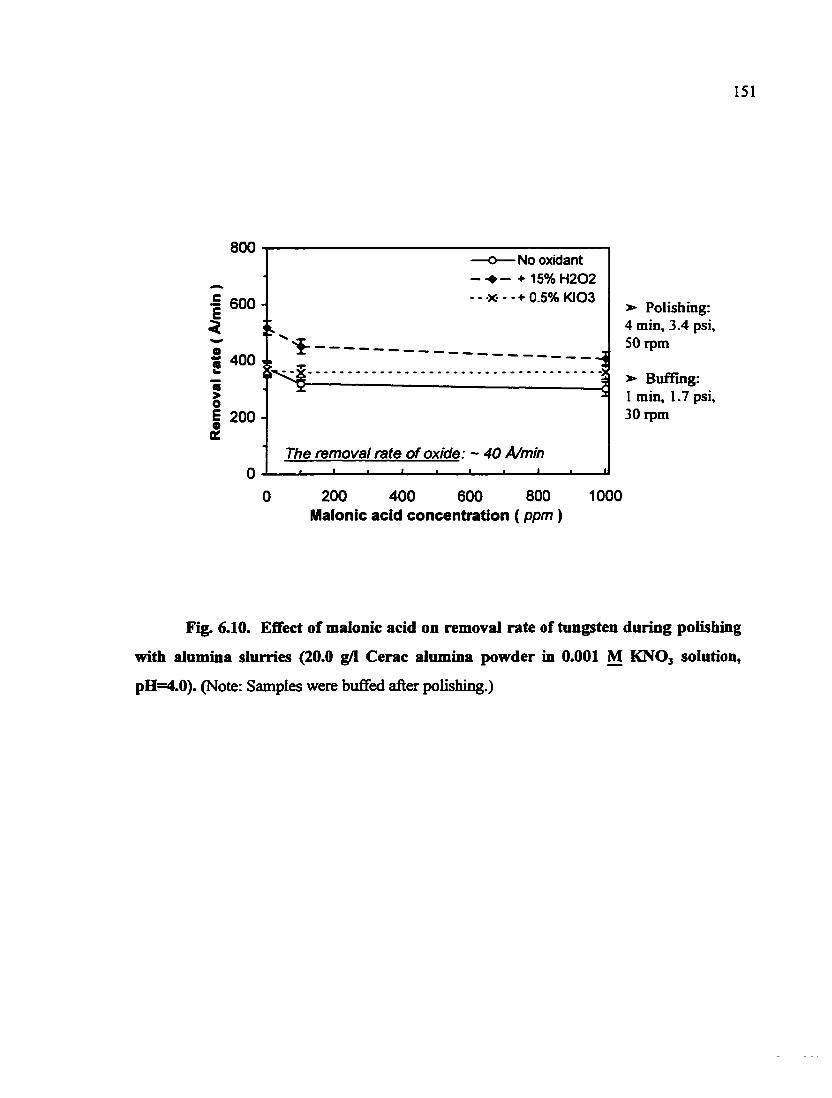
151
800
•= 600 -E
—o— No oxidant - + 15% H202 - - -X- - - + 0.5% KI03
"k.
400 4 ^
« > o E o K
200-
The removal rate of oxide: ~ 40 A/min I—
200 400 600 800
Malonic acid concentration (ppm )
*• Polishing; 4 tnin, 3.4 psi, SO rpm
*• Buffing: 1 min, 1.7 psi, 30 rpm
1000
Fig. 6.10. Effect of malonic acid on removal rate of tungsten during polishing
with alumina slurries (20.0 g/1 Cerac alumina powder in 0.001 M KNO3 solution,
pH=4.0). (Note: Samples were buffed after polishing.)
152
reported here are low compared to the rates (i.e., ~ 4000 A/min. for tungsten) achieved on
commercial CMP tools due to the fact that the polishing experiments were carried out on a
small-scale polisher. The removal rate of oxide films, which was measured to be
^proximately 40 A/miiL, is lower than that of tungsten. As shown in Fig. 6.10, the
selectivity between tungsten and oxide is approximately 10. This is also lower than the
typical selectivity obtained with commercial tungsten CMP sliirries and tools, which is
around 70.
6.4. Electrochemical Tests of Timgsten in Malonic Acid Solutions
It has been reported that malonic acid can reduce tungsten oxide under certain
conditions [6.4]. The mechanism involves two steps: (i) the formation of an intermediate
adsorption complex between tungsten oxide and the organic acid, and (ii) the breakage of
bonds on the complexed tungsten oxide surface. This may result in the removal of an
oxide passive layer formed on tungsten in the presence of an oxidant under CMP
conditions. In order to characterize the interaction between malonic acid and tungsten
films, electrochemical tests were carried out
Fig. 6.11 displays the OCPs of tungsten films in malonic acid solutions at pH=4.0
as a fimction of time. The addition of malonic acid decreases the OCP of tungsten. For
example, the OCP of timgsten is ~95 mV in the absence of malonic acid; the OCP
153
1 T ' i l l , . , , -OppmMA
1 ' • 1 —
lOOppmMA lOOOppmMA
gO..O|-UJ X 03
I . I I . I . I I . . I 1000 1500 2000 2500
111116(880)
0.00 0 500
Fig. 6.11. OCP vs. time of tungsten in the presence of malonic acid and 0.01 M KNOjatpH = 4.0.
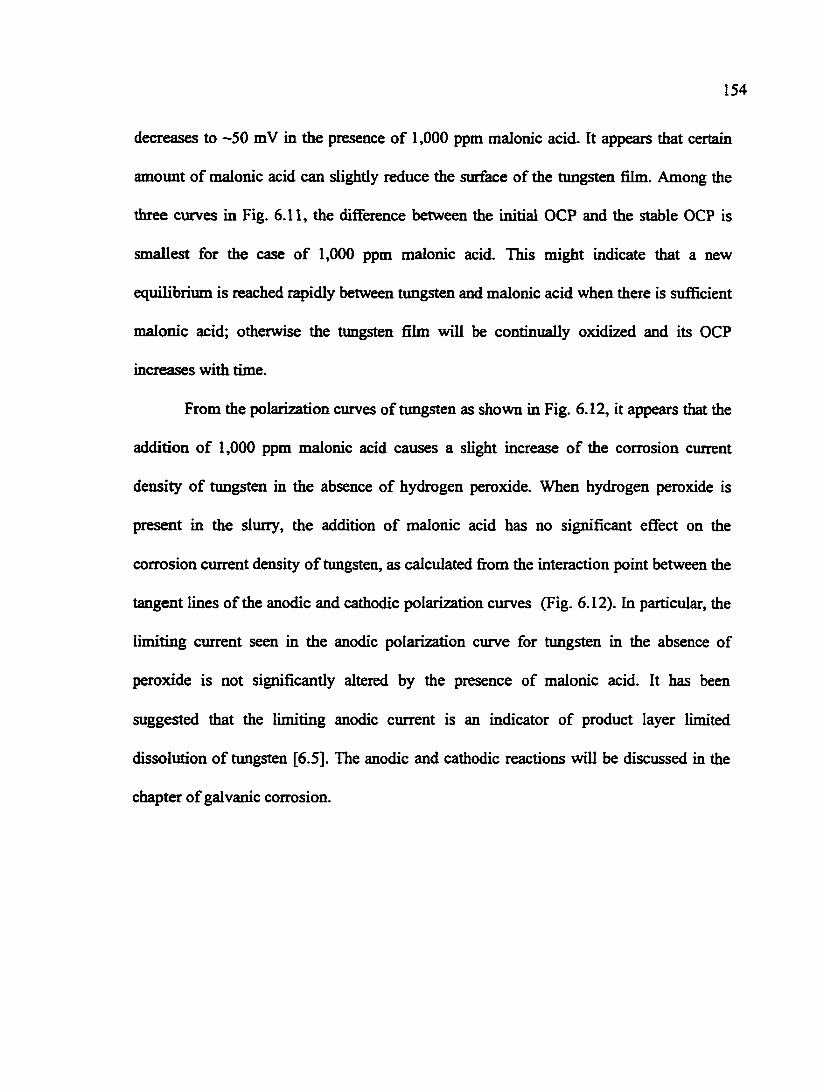
154
decreases to ~50 mV in the presence of 1,000 ppm malonic acid. It appears that certain
amount of malonic acid can slightly reduce the surface of the timgsten film. Among the
three cxirves in Fig. 6.11, the difierence between the initial OCP and the stable OCP is
smallest for the case of 1,000 ppm malonic acid. This might indicate that a new
equilibrium is reached rapidly between tungsten and malonic acid when there is sufScient
malonic acid; otherwise the tungsten film will be continually oxidized and its OCP
increases with time.
From the polarization curves of tungsten as shown in Fig. 6.12, it appears that the
addition of 1,000 ppm malonic acid causes a slight increase of the corrosion current
density of tungsten in the absence of hydrogen peroxide. When hydrogen peroxide is
present in the slurry, the addition of malonic acid has no significant effect on the
corrosion ciirrent density of timgsten, as calculated from the interaction point between the
tangent lines of the anodic and cathodic polarization curves (Fig. 6.12). In particular, the
limiting current seen in the anodic polarization curve for timgsten in the absence of
peroxide is not significantly altered by the presence of malonic acid. It has been
suggested that the limiting anodic current is an indicator of product layer limited
dissolution of tungsten [6.5]. The anodic and cathodic reactions will be discussed in the
chapter of galvanic corrosion.
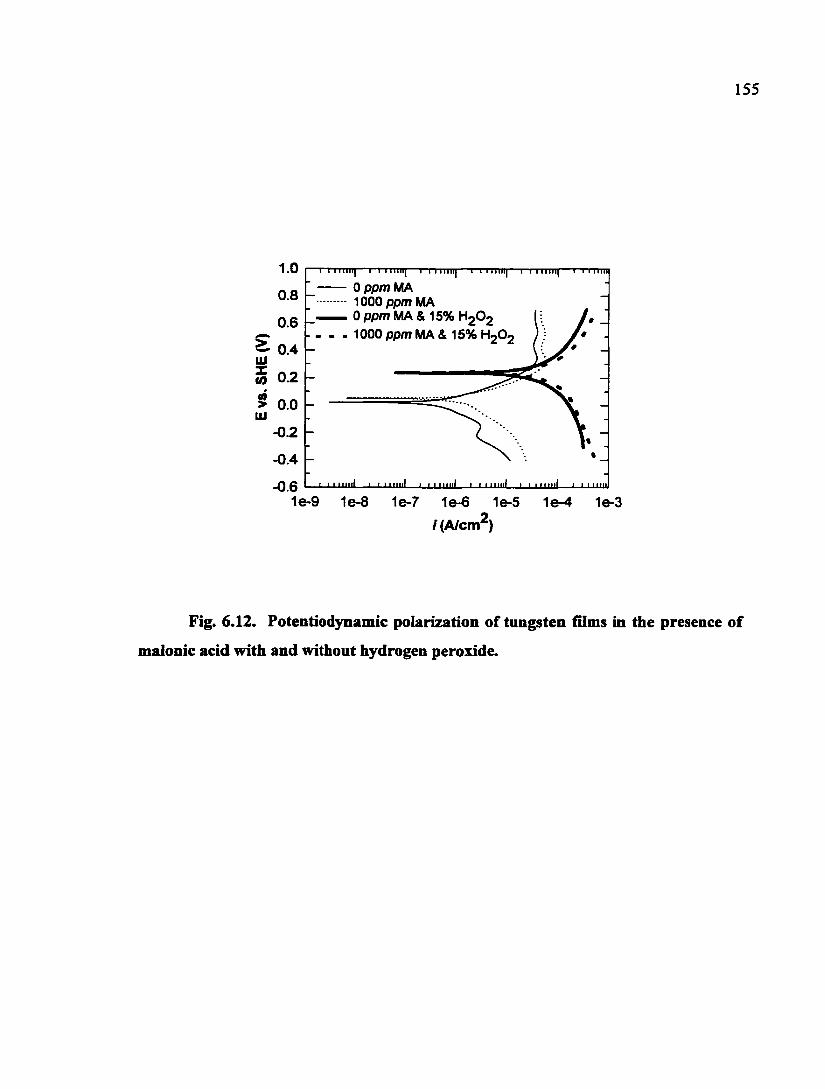
155
1.0
0.8
0.6
0.4 uj
M 0.2 0 > 0.0 UJ
-0.2
-0.4
-0.6 1e-9 1e-8 1e-7 1e-6 1e-5 1e-4 1e-3
/(A/cm^)
OppmMA 1000 ppm ma 0 ppm ma & 15% h2o2 1000 ppm ma & 15% hoo-
Fig. 6.12. Potentiodynamic polarization of tungsten films in the presence of
malonic acid with and without hydrogen peroxide.
156
6.5. Discussion
A schematic of the adsorption of maionic acid onto alumina surface is presented
in Fig. 6.13. It can be seen from Fig. 6.13 that the uptake of negatively charged malonate
ions leads to a charge reversal of alumina particles and is responsible for the reduction of
particulate contamination of alumina on tungsten and oxide surfaces during tungsten
CMP. Maionic acid is effective in controlling alumina contamination even in the presence
of hydrogen peroxide.
Maionic acid behaves very similar to citric acid with respect to the effect on the
modification of the zeta potential of alumina particles and on controlling alumina
particulate contamination. Both citric acid and maionic acid can adsorb onto aliunina
particles. For slurry manufacturing applications, both acids can be used to make slurries
with stable acidic pH (Figs. 5.5 and 6.5). Citric acid has been shown to influence the
particle size in and viscosity of alimiina slurries [6.6, 6.7]. Both the aggregate size of the
abrasive particles and the slurry viscosity are related to the electrokinetic feature of
particles in the slurry and are very important quantities for CMP slurry manufacturing.
Table 6.2 summarizes the comparison made between citric acid and maionic acid.
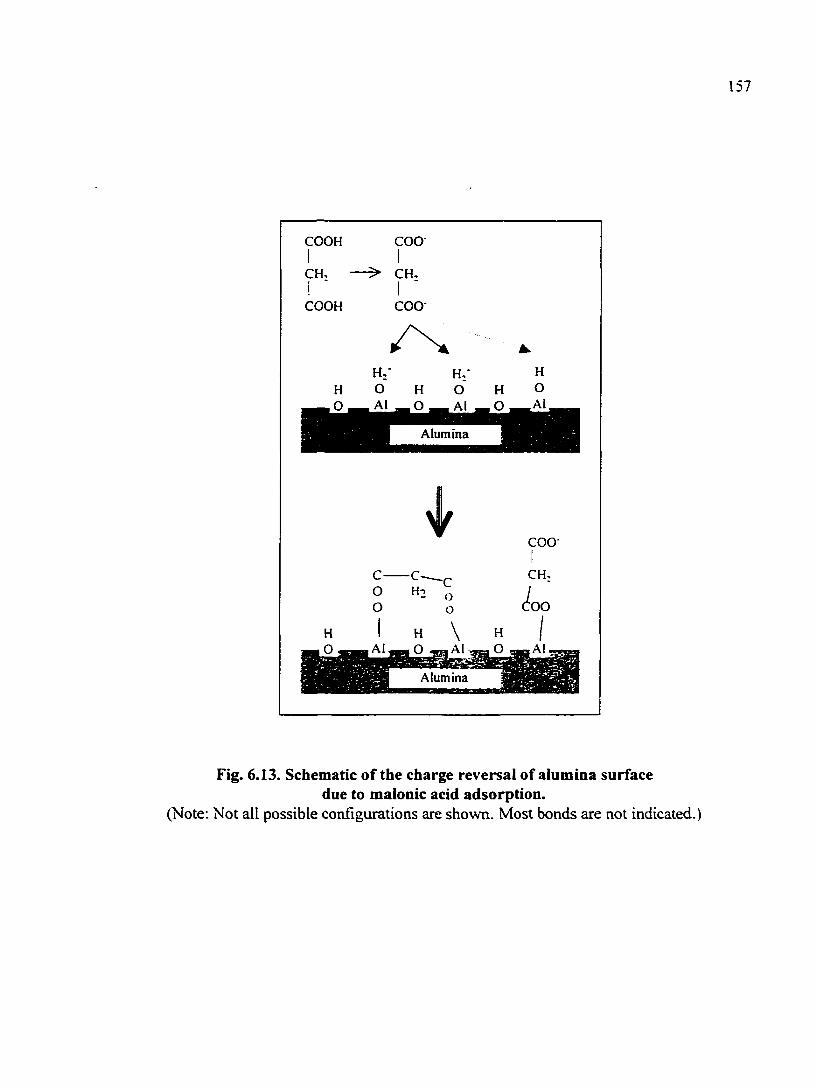
157
COOH
CH, ! •
COOH
H ,0
COO"
-> CH,
i COO-
H,-O A1
H ,o
H;' O Ai
H O
H O
.Al.
Alumina
Alumina
Fig. 6.13. Schematic of the charge reversal of alumina surface due to malonic acid adsorption.
(Note: Not all possible configurations are shown. Most bonds are not indicated.)
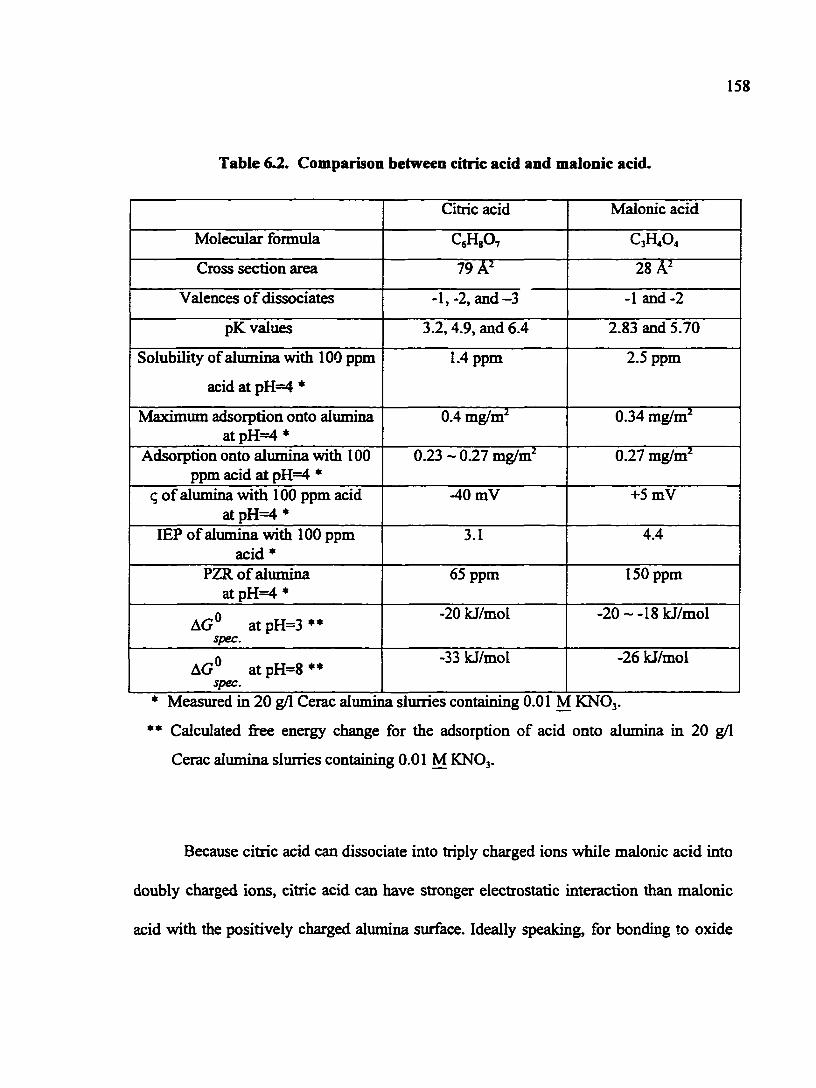
158
Table 6.2. Comparison between citric acid and malonic acid.
Citric acid Malonic acid
Molecular formula C^HgO, C3HA
Cross section area 79 A' 28 A'
Valences of dissociates -1, -2, and-3 -1 and -2
pK values 3.2,4.9, and 6.4 2.83 and 5.70
Solubility of alumina with 100 ppm 1.4 ppm 2.5 ppm
acid at pH=4 *
Maximum adsorption onto ahimina atpH=4»
0.4 mg/m^ 0.34 mg/m^
Adsorption onto alumina with 100 ppm acid at pH=4 •
0.23 ~ 0.27 mg/m^ 0.27 mg/m^
q of alumina with 100 ppm acid atpH=4*
-40 mV +5 mV
lEP of alumina with 100 ppm acid *
3.1 4.4
PZR of alumina at pH=4 •
65 ppm 150 ppm
AG° at pH=3 »» spec.
-20 kJ/mol -20 ~ -18 kJ/mol
atpH=8** spec.
-33 kJ/mol -26 kJ/mol
* Measured in 20 g/1 Cerac alumina slurries containing 0.01 ^ [KNO3.
*• Calculated free energy change for the adsorption of acid onto alumina in 20 g/1
Cerac alumina slurries containing 0.01 M KNOj.
Because citric acid can dissociate into triply charged ions while malonic acid into
doubly charged ions, citric acid can have stronger electrostatic interaction than malonic
acid with the positively charged alumina surface. Ideally speaking, for bonding to oxide
159
surfaces, citric acid has more sites available than malonic acid. However, the specific
adsorption free energy change for a citric acid - alumina system is only slightly greater
than that of a malonic acid -alimiina system (Tables 5.2 and 6.1). This perhaps indicates
that the greater afBnity of citric acid for aluminum is offset by its larger size — the citric
acid molecule is larger than the malonic acid. Citric acid will be more effective in
changing the zeta potential of an oxide siuface (Figs. 5.3 and 6.3).
The interaction between citric acid or malonic acid and timgsten is not dramatic,
as reflected by electrochemical tests. Tungsten is quite stable in citric acid or malonic
acid. Although the OCP measurements of tungsten in malonic acid solutions seem to
indicate that tungsten films can be reduced, most of the removal rate curves show the
reduction of the removal rate of tungsten in the presence of malonic acid.
160
Chapter 7
COPPER CONTAMINATION OF SILICON DIOXIDE SURFACES
In this chapter, a study of copper contamination on silicon dioxide surfaces with
relevance to copper CMP is presented. The results are divided into two parts: streaming
potential measurements and immersion contamination experiments.
7.1. Streaming Potential Measurements
Fig. 7.1 shows the effect of copper on the electrokinetic characteristics of thermal
oxide (TOX) wafers. In the absence of copper, the zeta potential of TOX decreases with
increasing pH of the solution and the IE? of TOX in 0.001 M KNOj is approximately 3.5.
The addition of 10 ppb Cu^" does not seem to affect the lEP of TOX, but the values of the
zeta potential become slightly less negative for pH values greater than the lEP. As the
concentration of copper is increased to 10 ppm, three points of zeta reversals (PZR) are
observed at pH values of 3.5, 5.4, and 10.4, respectively. The first one is the same as the
lEP of TOX. The third PZR is very close to the EEP of PVD copper film (see Fig. 3.4).
This seems to indicate that in the presence of 10 ppm Cu^*, the oxide surface behaves
similar to that of the copper hydroxide at pH values greater than 7. The second PZR
arises fi-om the transition of the surface chemistry of TOX to that of the TOX covered

161
Q.
- O - No Cu
- O -X
—A—
-lOppbCu
•10 ppm Cu
10 ppm Cu(high to low pH)
•10 ppm Cu + 100 ppm CA 1 1 1 1—
4 6 pH
-r-
8 10 12
Fig. 7.1. Streaming potential measurements on TOX wafers in 0.001 M KNO3 at
different concentrations of Cu^^
162
with copper hydroxide.
In order to ascertain whether the interaction of copper ions with silicon dioxide
surface is reversible, the streaming potential measurements were cycled between the pH
values of 2 and 11. The experimental data obtained as the pH was raised from ~ 2.3 to 11
is very nearly the same as those obtained when the pH was decreased from 11 to 2. This
probably indicates that the interaction between copper species and TOX may be
reversible. As shown by the following binding constants of copper on silica [7.1], the
interaction between copper and the silica surface is rather weak.
sSiOH + Cu^* o sSiOCu" + BT log(K) = -5.52 (7.1)
2 =SiOH + Cu^" <» (=SiO)2Cu + 2 FT log(K) = -11.19 (7.2)
The most significant change of the zeta potential of TOX occurred at pH ~ 7 as
shown in Fig. 7.1. Therefore, the next set of experiments was conducted at pH=7.1 by
varying the extent of copper ions added to the solution. The results obtained are shown in
Fig. 7.2. The zeta potential of TOX becomes less negative, passes through the zero, and
then becomes positive as more and more copper is added to the solution. The zeta
potential reversal occurs at a solution concentration of ~ 2.5 ppm. The zeta potential of
TOX reaches a plateau at approximately 35 mV at the copper concentrations greater than
5 ppm (Fig. 7.2).
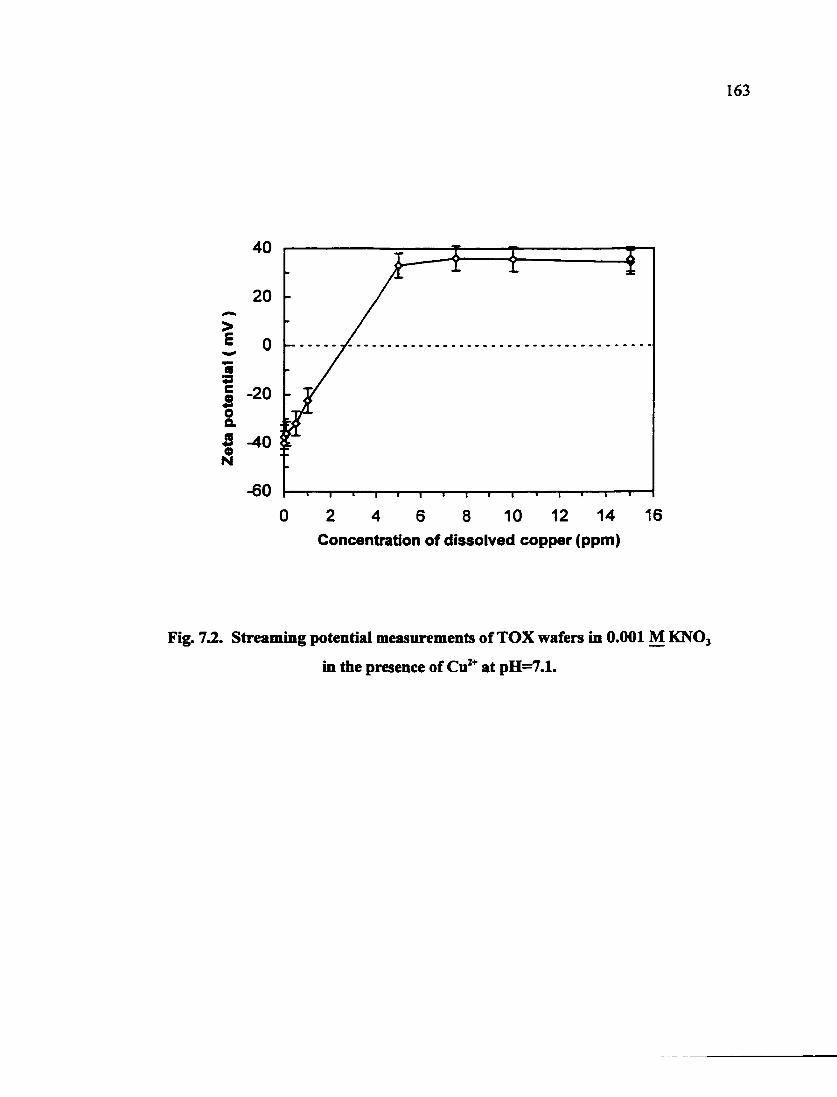
163
40
20
> E
-60
10 12 14 16 0 2 4 6 8 Concentration of dissolved copper (ppm)
Fig. 7.2. Streaming potential measurements of TOX wafers in 0.001 M KNO3
in the presence of at pH=7.1.
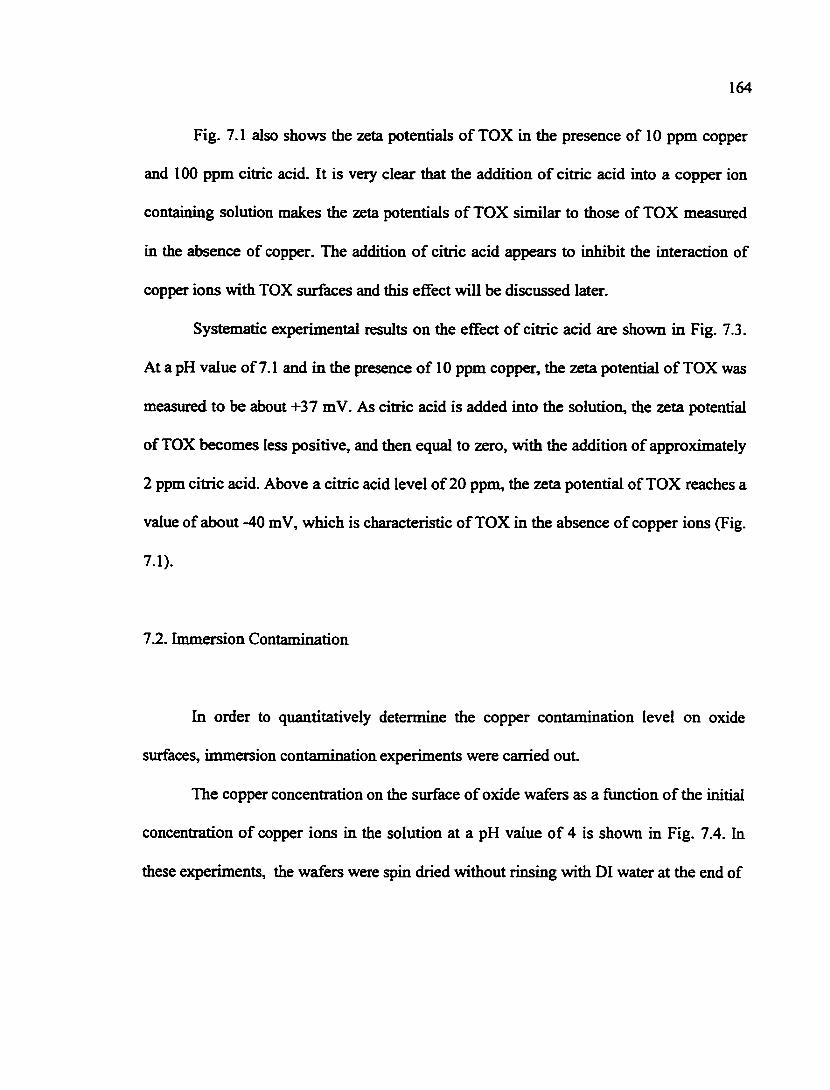
164
Fig. 7.1 also shows the zeta potentials of TOX in the presence of 10 ppm copper
and 100 ppm citric acid. It is very clear that the addition of citric acid into a copper ion
containing solution makes the zeta potentials of TOX similar to those of TOX measured
in the absence of copper. The addition of citric acid spears to inhibit the interaction of
copper ions with TOX surfaces and this effect will be discussed later.
Systematic experimental results on the effect of citric acid are shown in Fig. 7.3.
At a pH value of 7.1 and in the presence of 10 ppm copper, the zeta potential of TOX was
measured to be about +37 mV. As citric acid is added into the solution, the zeta potential
of TOX becomes less positive, and then equal to zero, with the addition of approximately
2 ppm citric acid. Above a citric acid level of 20 ppm, the zeta potential of TOX reaches a
value of about -40 mV, which is characteristic of TOX in the absence of copper ions (Fig.
7.1).
7.2. Immersion Contamination
In order to quantitatively determine the copper contamination level on oxide
surfaces, immersion contamination experiments were carried out.
The copper concentration on the surface of oxide wafers as a function of the initial
concentration of copper ions in the solution at a pH value of 4 is shown in Fig. 7.4. In
these experiments, the wafers were spin dried without rinsing with DI water at the end of
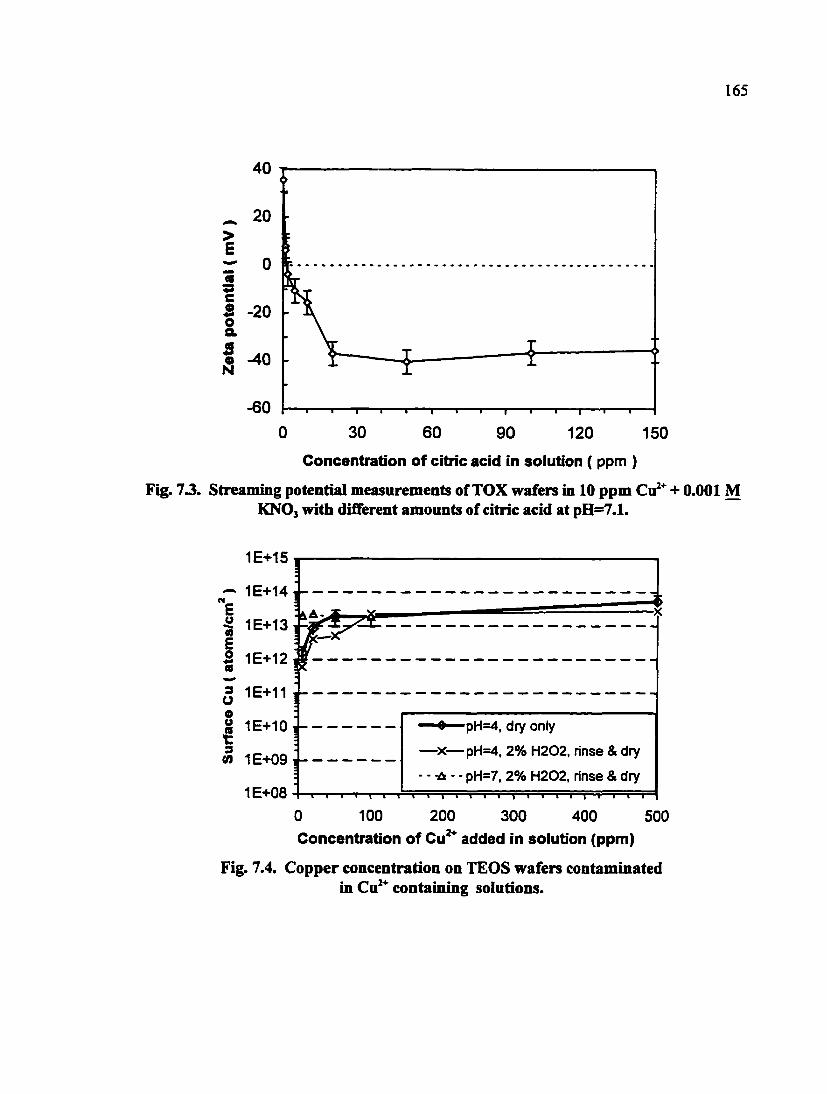
165
40
20
0
-20
9. -40
-60
0 30 60 90 120
Concentration of citric acid in solution ( ppm )
150
Fig. 73. Streaming potential measurements of TOX wafers in 10 ppm + 0.001 M KNO} with different amounts of citric acid at pH=7.1.
1E+15
- 1E+14 M E ^ 1E+13
E S 1E+12 (s
5 1E+11
§ 1E+10 "C OT 1E+09
1E+08
0 100 200 300 400 500
Concentration of Cu^^ added in solution (ppm)
Fig. 7.4. Copper concentration on TEOS wafers contaminated in Cu'^ containing solutions.
!
•
1 - 0 pH=4, dry only
• —y.— pH=4, 2% H202, rinse & dry 1 -
—y.— pH=4, 2% H202, rinse & dry
• 1 1 1 1 1 1 1 • - -A - - pH=7, 2% H202, rinse & dry

166
the experiments. Copper concentration on the oxide surface initially increases sharply
with the copper ion concentration in the solution, and the curve has a steep slope.
However, the copper level on the wafer surface reaches a plateau value of approximately
4x10' atoms/cm^ when the copper concentration in the bulk solution is greater than 50
ppm (Fig. 7.4). If the wafer is immersed in 0.1 ppm and 1 ppm copper solutions, the
surface copper concentration was below the detection limit of the TXRF technique (i.e.,
2x10' atoms/cm^) and hence is not plotted here.
Copper CMP is currently performed with hydrogen peroxide as an oxidant at
acidic or near neutral pH values. Most of subsequent contamination experiments were
carried out in the presence of hydrogen peroxide, and DI rinsing after contamination was
carried out. Two curves in Fig. 7.4 illustrate the effect of copper concentration in the bulk
solution on the post-rinse surface contamination at two pH values in the presence of
hydrogen peroxide. One conclusion that can be drawn from these post-rinse
contamination data is that copper contamination on the oxide surface is higher at pH=7
than at pH=4 at low solution copper concentration but the contamination level becomes
insensitive to the pH when the solution copper level is greater than 100 ppm. This
phenomenon may be due to two reasons: (i) more copper ions can adsorb on oxide
surface at pH=7 than pH=4 because the surface complexation reactions (see Eqs. (7.1)
and (7.2)) are more favorable at higher pH, and (ii) the solubility of copper hydroxide in
the solution is more limited at a higher solution pH. The solubility of copper hydroxide
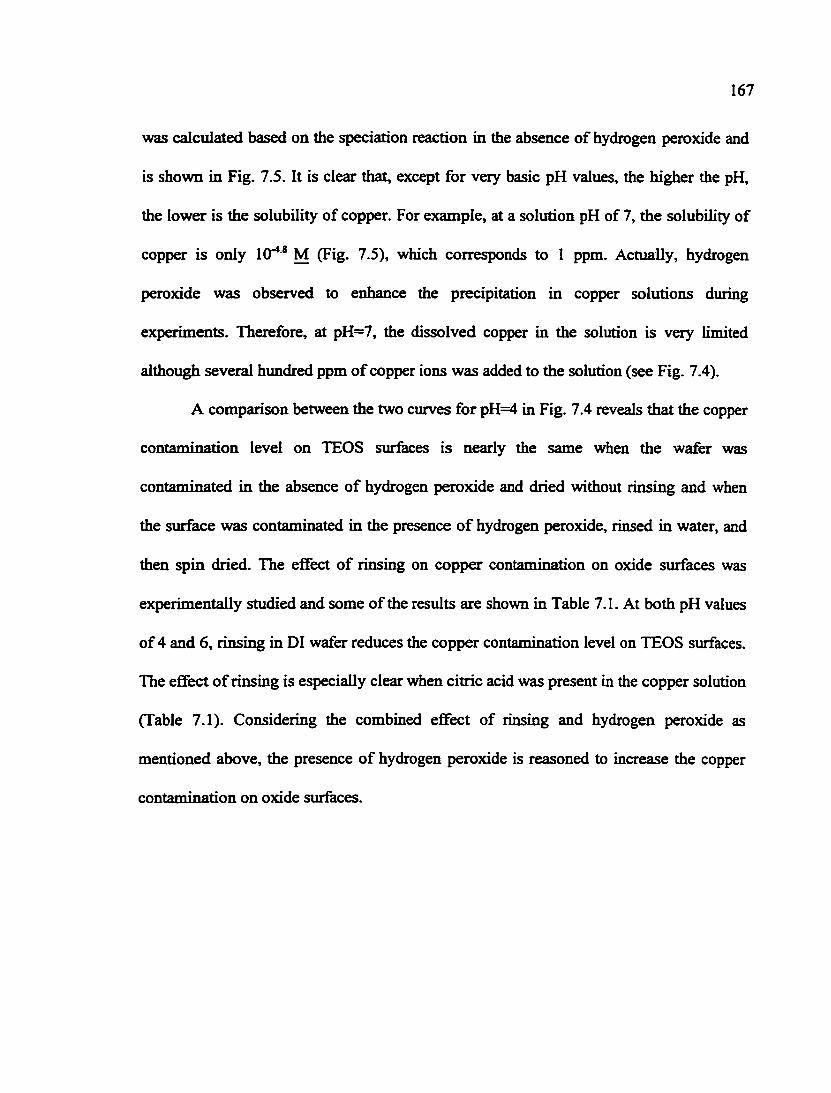
167
was calculated based on the speciation reaction in the absence of hydrogen peroxide and
is shown in Fig. 7.5. It is clear that, except for very basic pH values, the higher the pH,
the lower is the solubility of copper. For example, at a solution pH of 7, the solubility of
copper is only 10"*® M (Fig. 7.5), which corresponds to 1 ppm. Actually, hydrogen
peroxide was observed to enhance the precipitation in copper solutions during
experiments. Therefore, at pH=7, the dissolved copper in the solution is very limited
although several hundred ppm of copper ions was added to the solution (see Fig. 7.4).
A comparison between the two curves for pH=4 in Fig. 7.4 reveals that the copper
contamination level on TEOS surfaces is nearly the same when the wafer was
contaminated in the absence of hydrogen peroxide and dried without rinsing and when
the surface was contaminated in the presence of hydrogen peroxide, rinsed in water, and
then spin dried. The effect of rinsing on copper contamination on oxide surfaces was
experimentally studied and some of the results are shown in Table 7.1. At both pH values
of 4 and 6, rinsing in DI wafer reduces the copper contamination level on TEOS siufaces.
The effect of rinsing is especially clear when citric acid was present in the copper solution
(Table 7.1). Considering the combined effect of rinsing and hydrogen peroxide as
mentioned above, the presence of hydrogen peroxide is reasoned to increase the copper
contamination on oxide surfaces.
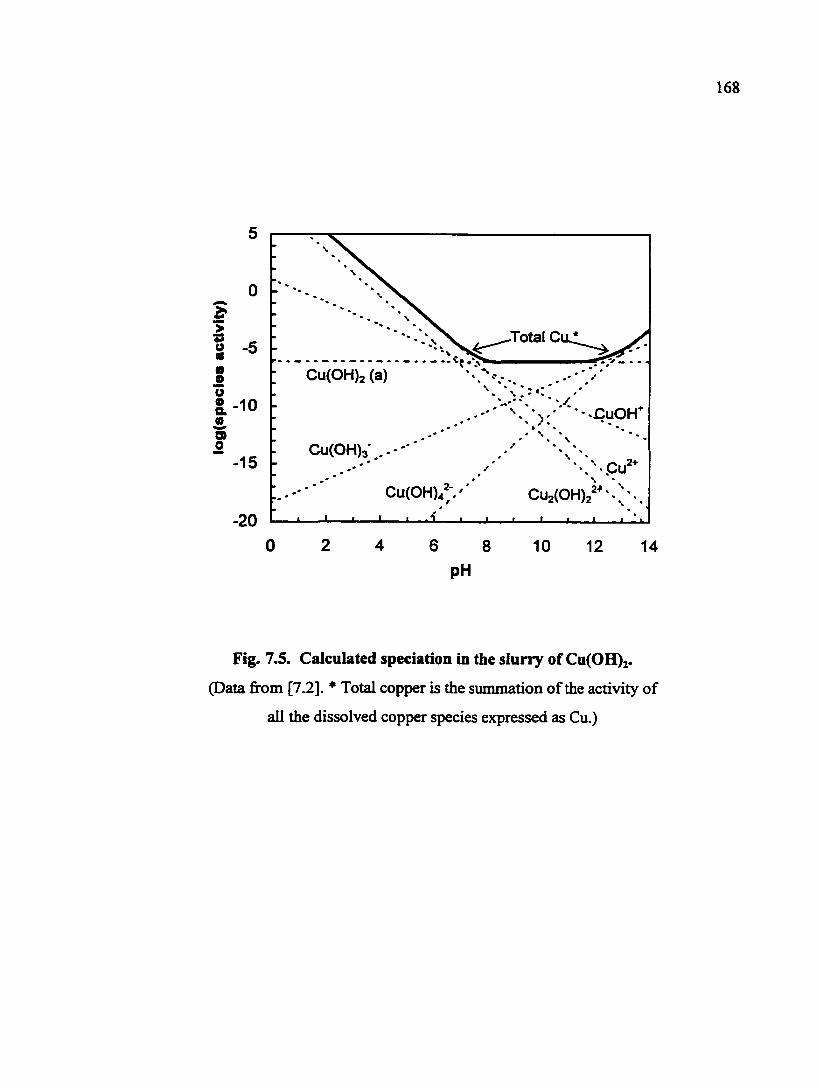
168
5
0
-Total Ci 5
2 - 1 0
15
Cu(OH),
20 2 0 4 6 10 8 12 14
PH
Fig. 7.5. Calculated speciation in the slurry of Cu(OH)2.
(Data from [7.2]. * Total copper is the summation of the activity of
all the dissolved copper species expressed as Cu.)
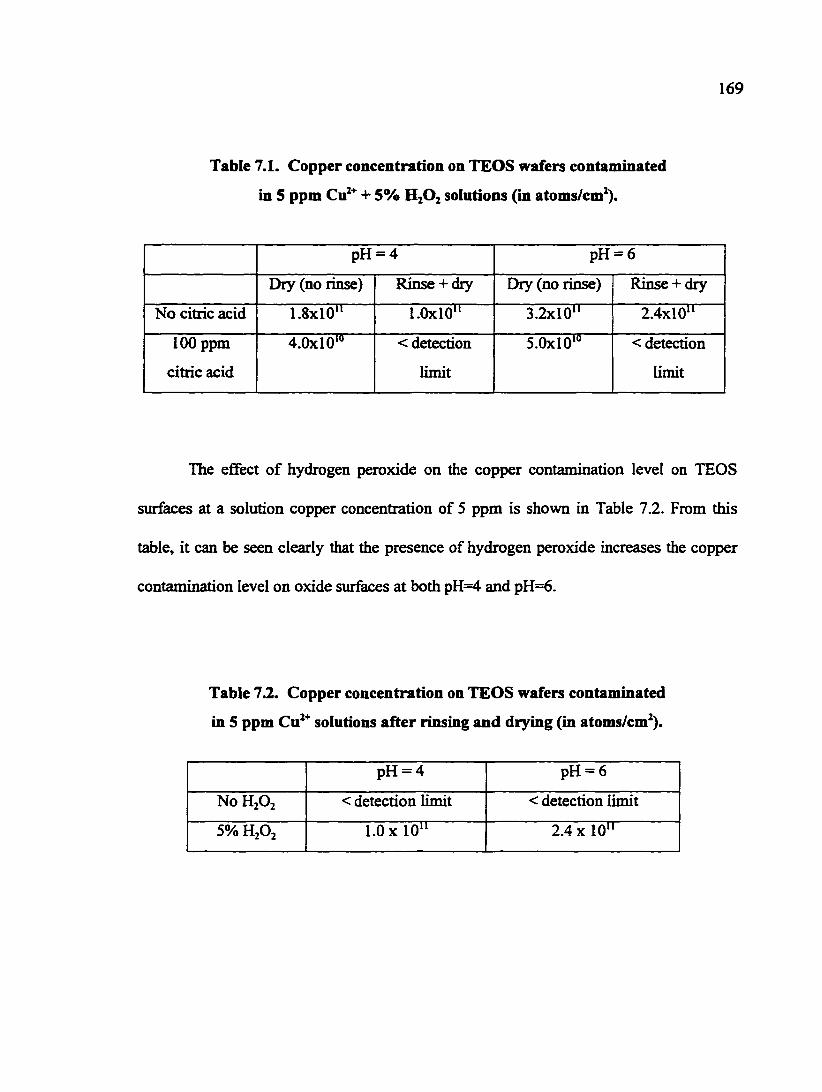
169
Table 7.1. Copper concentration on TEOS wafers contaminated
in 5 ppm + 5% H2O2 solutions (in atoms/cm').
pH = 4 pH = 6
Dry (no rinse) Rinse + dry Ehy (no rinse) Rinse + dry
No citric acid 1.8x10" I.OxlO" 3.2x10" 2.4x10"
100 ppm
citric acid
4.0x10'° < detection
limit
5.0x10'° < detection
limit
The effect of hydrogen peroxide on the copper contamination level on TEOS
surfaces at a solution copper concentration of 5 ppm is shown in Table 7.2. From this
table, it can be seen clearly that the presence of hydrogen peroxide increases the copper
contamination level on oxide surfaces at both pH=4 and pH=6.
Table 7.2. Copper concentration on TEOS wafers contaminated
in 5 ppm Cu^^ solutions after rinsing and drying (in atoms/cm').
pH = 4 pH = 6
No H2O2 < detection limit < detection limit
5% H2O2 1.0 X 10" 2.4 X 10"
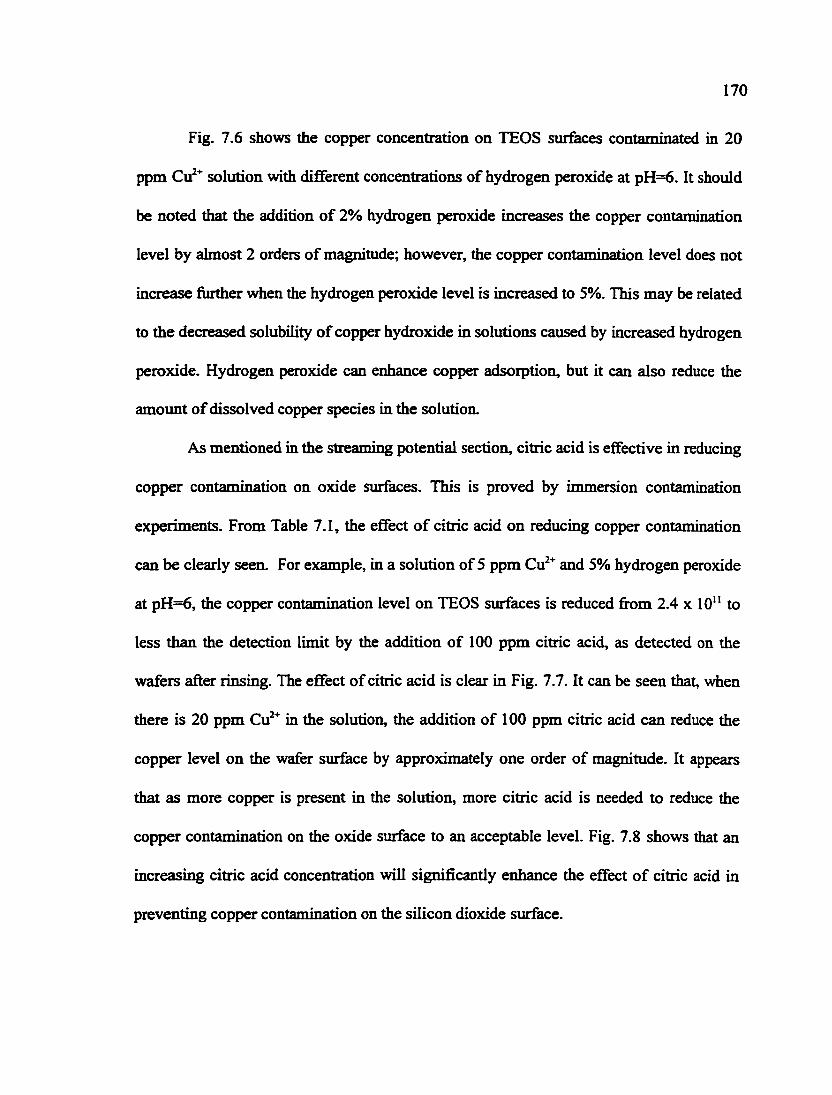
170
Fig. 7.6 shows the copper concentration on TEOS surfaces contaminated in 20
ppm Cu^* solution with different concentrations of hydrogen peroxide at pH=6. It should
be noted that the addition of 2% hydrogen peroxide increases the copper contamination
level by almost 2 orders of magnitude; however, the copper contamination level does not
increase further when the hydrogen peroxide level is increased to 5%. This may be related
to the decreased solubility of copper hydroxide in solutions caused by increased hydrogen
peroxide. Hydrogen peroxide can enhance copper adsorption, but it can also reduce the
amount of dissolved copper species in the solution.
As mentioned in the streaming potential section, citric acid is effective in reducing
copper contamination on oxide surfaces. This is proved by immersion contamination
experiments. From Table 7.1, the effect of citric acid on reducing copper contamination
can be clearly seen. For example, in a solution of 5 ppm Cu^^ and 5% hydrogen peroxide
at pH=6, the copper contamination level on TEOS surfaces is reduced from 2.4 x 10" to
less than the detection limit by the addition of 100 ppm citric acid, as detected on the
wafers after rinsing. The effect of citric acid is clear in Fig. 7.7. It can be seen that, when
there is 20 ppm Cu^* in the solution, the addition of 100 ppm citric acid can reduce the
copper level on the wafer surface by approximately one order of magnitude. It appears
that as more copper is present in the solution, more citric acid is needed to reduce the
copper contamination on the oxide surface to an acceptable level. Fig. 7.8 shows that an
increasing citric acid concentration will significantly enhance the effect of citric acid in
preventing copper contamination on the silicon dioxide surface.
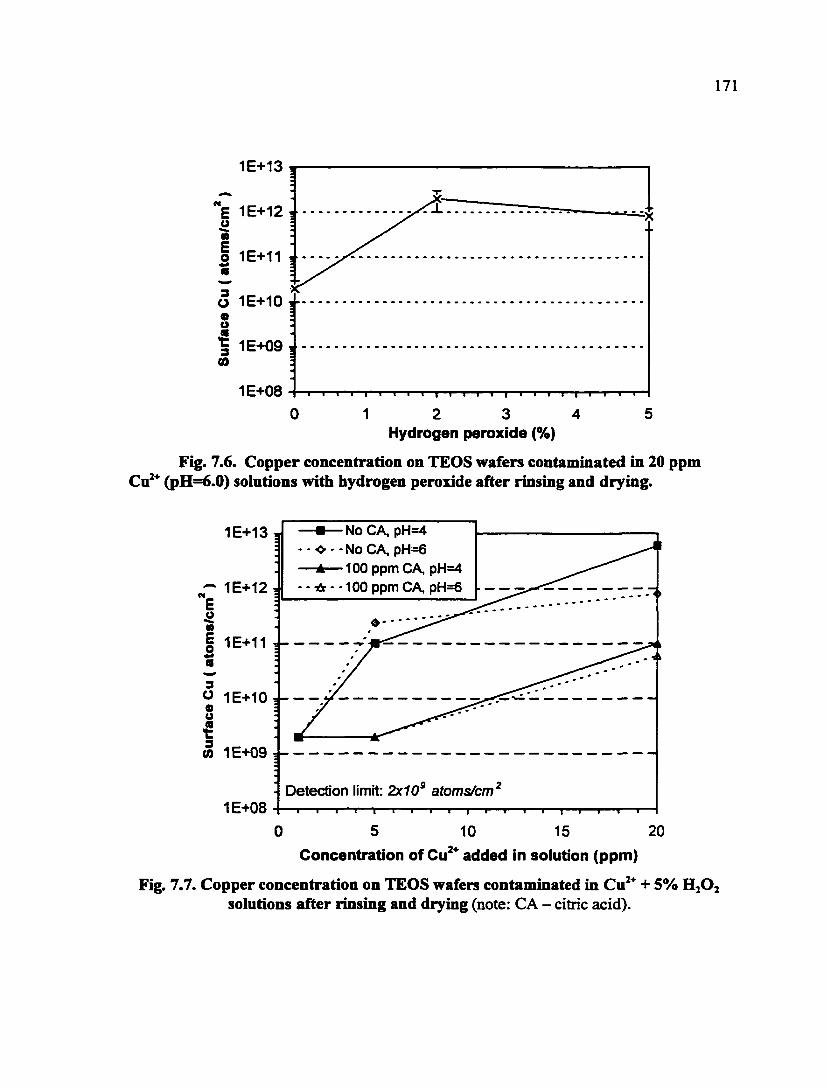
1E+08 I I I I I I I I I I I I I I I I I I I I I I I I I
0 1 2 3 4 5 Hydrogen peroxide (%)
Fig. 7.6. Copper concentration on TEOS wafers contaminated in 20 ppm Cu^^ (pH=6.0) solutions witli hydrogen peroxide after rinsing and drying.
1E+13 3
1E+12 i E o « E S 9
•NoCA, pH=4 <---NoCA,pH=6
-A—100 ppm CA, pH=4 A - -100 ppm CA, pH=6
1E+11
O 1E+10 0 u 1 m 1E+09
1E+08 Detection limit 2x10' atoms/cm^
0 5 10 15 20
Concentration of added in solution (ppm)
Fig. 7.7. Copper concentration on TEOS wafers contaminated in Cu^^ + 5% H2O2 solutions after rinsing and drying (note: CA - citric acid).
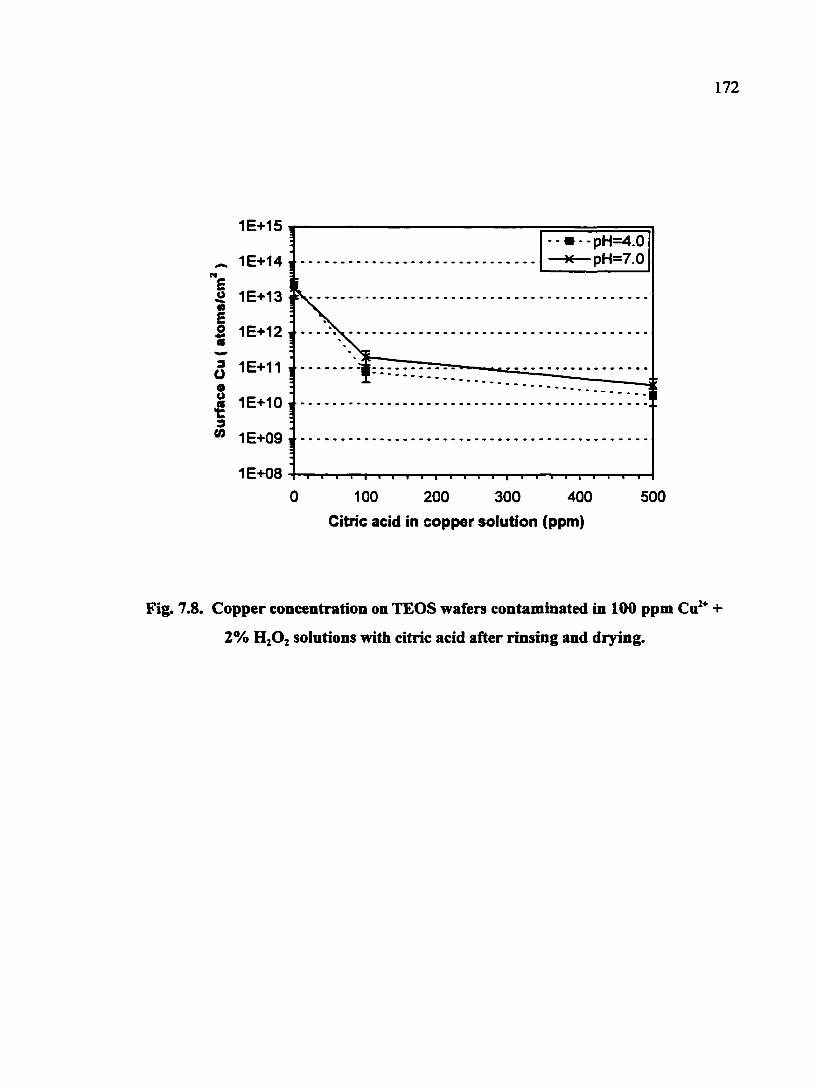
1E+15
1E+14 N
« 1E+13 « E 5 1E+12 m
§ 1E+11
I 1E+I0i 3 " 1E+09i
1E+08 I I I I I I I I I I I I I I I I I I I I I I I I I 0 100 200 300 400 500
Citric acid in copper solution (ppm)
--pH=4.0 pH=7.0
Fig. 7.8. Copper concentration on TEOS wafers contaminated in 100 ppm
2% H2O2 solutions with citric acid after rinsing and drying.
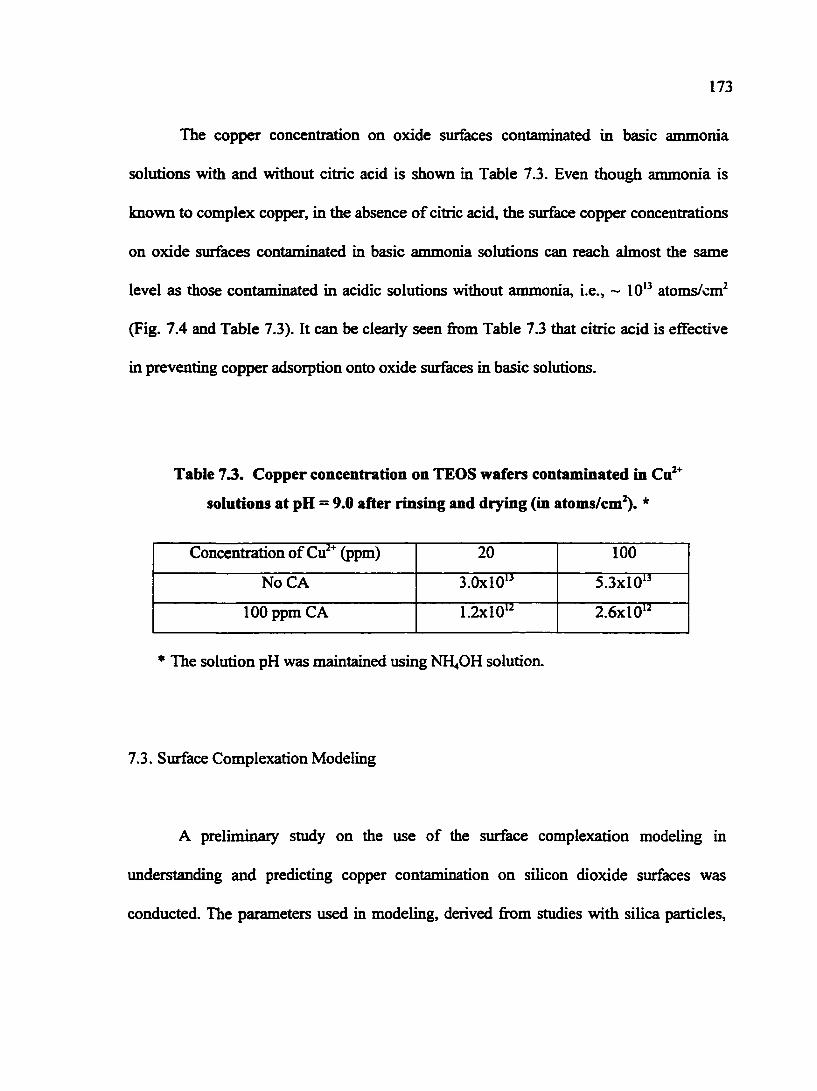
173
The copper concentration on oxide surfaces contaminated in basic ammonia
solutions with and without citric acid is shown in Table 7.3. Even though ammonia is
known to complex copper, in the absence of citric acid, the surface copper concentrations
on oxide surfaces contaminated in basic ammonia solutions can reach almost the same
level as those contaminated in acidic solutions without ammonia, i.e., ~ 10' atoms/cm*
(Fig. 7.4 and Table 7.3). It can be clearly seen from Table 7.3 that citric acid is effective
in preventing copper adsorption onto oxide surfaces in basic solutions.
Table 73. Copper concentratioii on TEOS wafers contaminated in Cu^"'
solutions at pH = 9.0 after rinsing and drying (in atoms/cm^). *
Concentration of Cu^" (ppm) 20 100
NoCA 3.0x10'" 5.3x10"
100 ppm CA 1.2x10' 2.6x10'"
* The solution pH was maintained using NH4OH solution.
7.3. Surface Complexation Modeling
A preliminary study on the use of the surface complexation modeling in
understanding and predicting copper contamination on silicon dioxide surfaces was
conducted. The parameters used in modeling, derived from studies with silica particles.
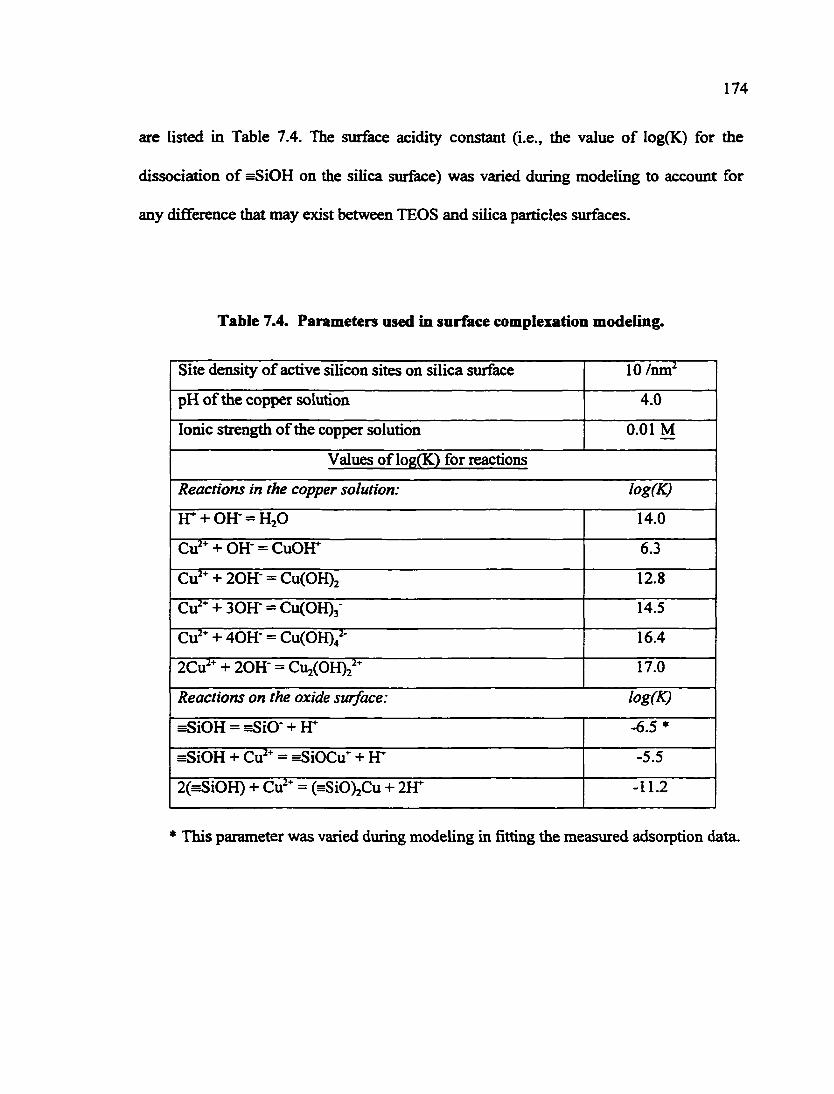
174
are listed in Table 7.4. The surface acidity constant (i.e., the value of log(K) for the
dissociation of =SiOH on the silica surface) was varied during modeling to account for
any difference that may exist between TEOS and silica particles surfaces.
Table 7.4. Parameters used in surface complexation modeling.
Site density of active silicon sites on silica surface 10 /imi^
pH of the copper solution 4.0
Ionic strength of the copper solution 0.01 M
Values of log(K) for reactions
Reactions in the copper solution: log(K)
ir + 0H- = H20 14.0
Cu'" + OH- = CuOir 6.3
Cu'* + 20H- = CU(OH)2 12.8
Cu'" + 30H- = CU(0H)3- 14.5
Cu'" + 40H- = CU(OH)4'- 16.4
2Cu^" + 20H- = CU2(OH)2'" 17.0
Reactions on the oxide surface: log(K)
=SiOH = =SiO + FT -6.5 •
=SiOH + Cu'" = sSiOCu" + H* -5.5
2(sSiOH) + Cu'" = (=SiO)2Cu + 2ir -11.2
* This parameter was varied during modeling in fitting the measured adsorption data.
175
The resvilts of modeling are shown in Fig. 7.9 along with the measured copper
level on TEOS surfaces dried without rinsing. From Fig. 7.9, it can be seen that a very
good fit to the measured values was obtained when the surface acidity constant is equal to
—2.3. This value is higher than the reported acidity constant as listed in Table 7.4,
indicating that the TEOS surface is much more acidic than the silica particles. It is clear
that an experimental measurement of the acidity of oxide wafers is needed.
7.4. Conclusions and Discussion
7.4.1. Copper Contamination
Copper can adsorb onto oxide surfaces in the solution. Based on the immersion
contamination experiments, the copper contamination on oxide surfaces can reach a level
of ~ 10" atoms/cm^. A monolayer of copper corresponds to approximately 5x10'®
atoms/cm^ if a radiiis of 80 pm is used for one copper ion [7.3]. However, in aqueous
solutions, cupric ions are hydrated and the adsorption of a cupric ion onto the silica
sxirface is schematically shown in Fig. 7.10. The hydrated cupric ion is about 0.4 nm in
radius [7.4] and a monolayer of hydrated cupric ions will roughly correspond to 2x10'*
atoms/cm^. A copper contamination level of ~10" atoms/cm^ is approximately one order
magnitude lower than the calculated monolayer coverage of hydrated cupric ions.
However, this contamination level is about two orders of magnitude higher than the SIA

176
1E+15
1E+14
1E+13
1E+12
1E+11
1E+10
1E+09
100 200 300
# Measured
• - - log(Ka1 )=-6.5
A log(Ka1)=-3.5
X log(Ka1)=-2.3
400 500
Concentration of added in solution (ppm)
Fig. 7.9. Copper concentration on TEOS wafers contaminated in Cu'"^ solutions at pH=4.0 after drying. (Note: log(Kal) represents the acidity
constant of silica surface. )
Silica
Fig. 7.10. Schematic of the adsorption of hydrated cupric ions onto silica surface. (Note: the hydrated ions are octahedrons. Not drawn to scale.)
177
Roadmap requires for the back end of line processes (which include metal CMP) (see
Table 1.3). Therefore, copper contamination onto silica during copper CMP is indeed an
issue. During copper CMP, copper is released from the copper film and can cause
contamination at both the front and the back sides of the wafers [7.5].
It has been said that the actual copper contamination on oxide after CMP can
reach 10" atoms/cm^ [7.6]. This may be mainly due to the increased surface roughness of
oxide and stripping and deposition of copper films during CMP. The copper
contamination process during copper CMP depends on several other factors, such as (i)
the copper concentration near the wafer surface, which will be largely determined by the
solubility of copper in the slurry chemistry, and (ii) the slurry chemistry. The highest
level of copper contamination reported by Lee et al. was about 5.4x10'° atoms/cm^ [7.1],
which is much lower than what has been found in this study. They used a copper solution
of only 10 ppb and the surface studied was oxide grown by immersing silicon wafers in
hydrogen peroxide containing solutions.
The copper contamination can be modeled using the surface complexation model.
The reactions between copper ions in the solution and the solid oxide surface control the
adsorption of copper onto the oxide surface causing contamination. The key to a
successful modeling is to obtain parameters for the wafer surface, which are lacking
currently.
178
7.4.2. Electrokinetics
The lEP of the oxide surface shifts when there is Cu^* in the solution, indicating
the specific adsorption feature of the interaction between Cu^" and the oxide surface,
^^ch can be represented by the surface complexation reactions such as Eqs. (7.1) and
(7.2). The high-pH segment of the zeta potential curve of silica in the presence of 100
ppm Cu^^ is close to that obtained for copper film (Figs. 7.1 and 3.4). This may be
attributed to the fact that the oxide surface is covered by copper to certain extent, or that
copper hydroxide precipitates and deposits on the wafer surface. If the precipitates
uniformly deposit onto the surface, the net results are probably the same for the two
mechanisms. For example, an electron paramagnetic resonance (EPR) analysis showed
that "the hydrolysis of the Cu^^(aq.) ion leads to the same effect as adsorption on silica"
[7.7]. However, the limited solubility of copper hydroxide may be one of the reasons for
the occurrence of a plateau in Fig. 7.2. As mentioned above, the highest copper
contamination level as measured after the immersion experiments cannot account for a
full coverage on the solid sinface. It will be of interest to study the electrokinetics of an
oxide wafer which is not fully complexed with copper or patterned with metal hydroxide
precipitates (see [7.8]).
179
7.4.3. Effect of Additives
Copper contamination is affected by the presence of hydrogen peroxide and citric
acid, in addition to the solution pH. Generally speaking, hydrogen peroxide causes more
contamination while citric acid inhibits the contamination. During copper contamination
experiments, it was observed that the pH of the acidic solutions became lower and
bubbles were formed after adding hydrogen peroxide. The following reactions may be
able to explain the observed phenomena
These reactions indicate that the hydrogen peroxide may be actually oxidized and cupric
species are reduced. The reduction of cupric ion by hydrogen peroxide has been reported
previously in the literature [7.9]. Similar discussion was also employed for the ferric -
hydrogen peroxide system [7.10].
The effect of citric acid is significant in inhibition of copper contamination due to
its powerfiil complexation with copper. A copper-citrate complex is much stronger than
the copper surface complex formed on the silica siuface as shown by their stability
constants (Table 7.5). For example, one of the reactions involved can be expressed as
Hj02 BT + H0{ (7.3)
HO{ FT + ©2 + 26 (7.4)
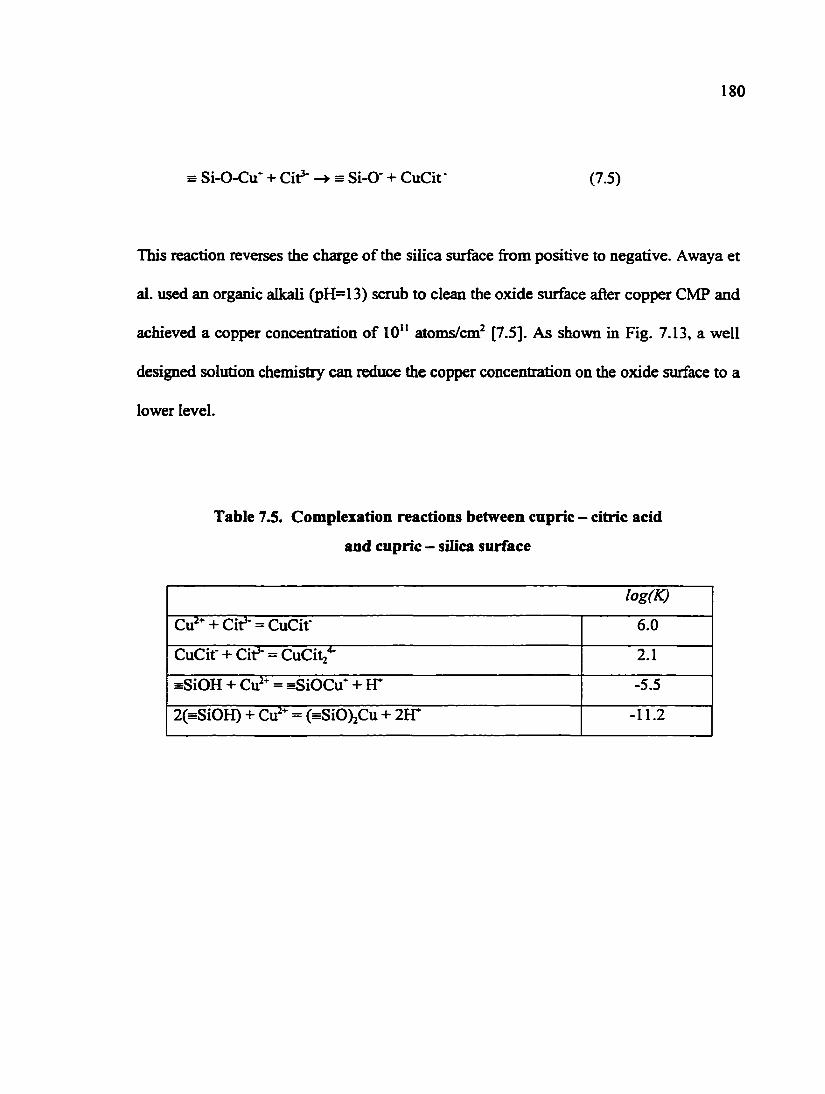
180
= Si-O-Cu" + Cit^ = Si-O" + CuCit" (7.5)
This reaction reverses the charge of the silica surface from positive to negative. Awaya et
al. used an organic alkali (pH=l3) scrub to clean the oxide surface after copper CMP and
achieved a copper concentration of 10" atoms/cm^ [7.5]. As shown in Fig. 7.13, a well
designed solution chemistry can reduce the copper concentration on the oxide surface to a
lower level.
Table 7.5. Complexation reactions between cupric - citric acid
and cupric - silica surface
log(K)
Cu^" + Cit^ = CuCir 6.0
CuCit- + Cif- = CuCitj^ 2.1
=SiOH + Cu'" = =SiOCu" + H* -5.5
2(=SiOH) + Cu'" = (=SiO)2Cu + 2YV -11.2
181
Chapter 8
GALVANIC CORROSION IN METAL-CMP
Due to the multilayer feature in metal interconnection, galvanic corrosion is of
concern in metal CMP. In this chapter, electrochemical aspects of galvanic corrosion
between the barrier layers and the metal films are discussed.
8.1. Galvanic Contact between Tungsten and TiN
Tungsten CMP is typically carried out in acidic media with an oxidant. Oxidants
investigated in this study include 4.5% HjOj, 2% KIOj, and O.IM Fe(N03)3. Hydrogen
peroxide and potassium iodate solutions were maintained at a pH of 4, while ferric
solution was maintained at a more acidic pH of 1.4 to prevent the precipitation of ferric
hydroxide. A 0.01 M KNO3 solution at pH = 4 without any oxidant was used as the base
line condition. Reduction reactions and the corresponding potentials of the oxidants used
in this study are listed in Table 8.1. Although nitrate itself is a mild oxidant as shown in
Table 8.1, only the additional additives of hydrogen peroxide, potassium iodate and ferric
solutions are called oxidants in this chapter.
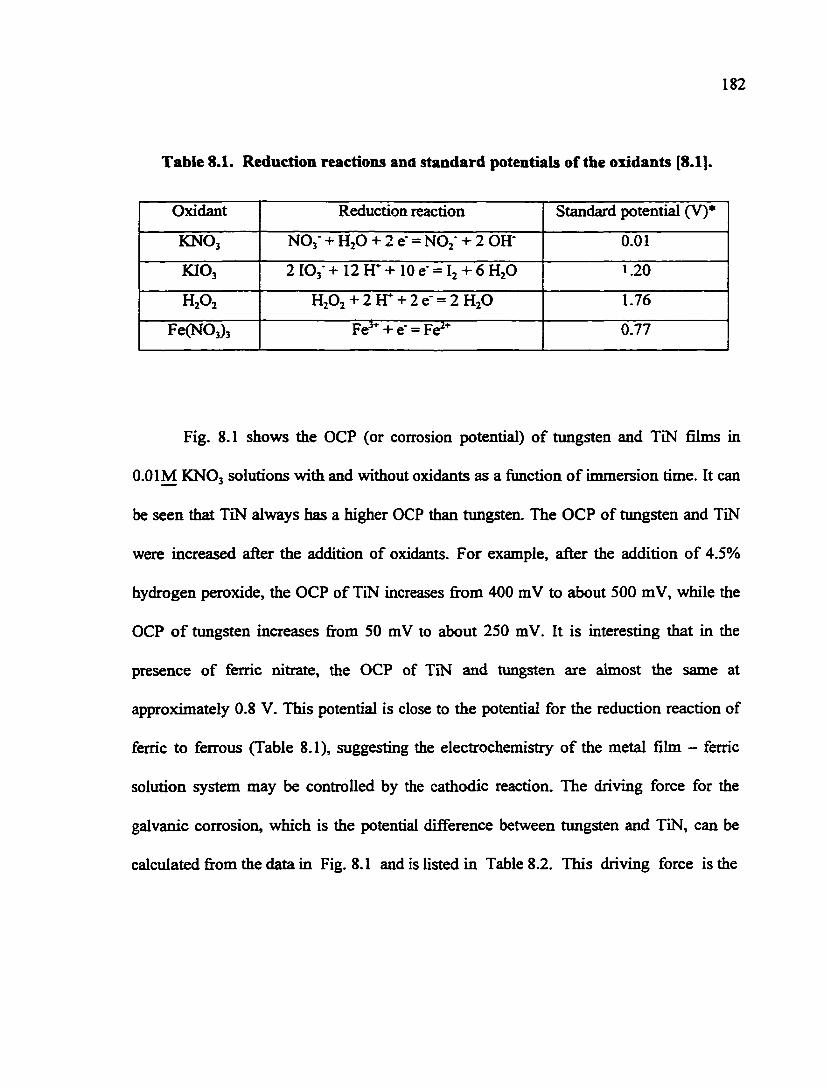
182
Table 8.1. Reduction reactions and standard potentials of the oxidants [8.1].
Oxidant Reduction reaction Standard potential (V)*
KNOj NOj- + hp + 2 e" = NO{ + 2 OH' 0.01
KIOj 2IO3-+ 12H"+ 10e=l2 + 6H20 1.20
HA HA + 2 H* + 2 e- = 2 HjO 1.76
Fe(NO,)3 Fe^ + e- = Fe'" 0.77
Fig. 8.1 shows the OCP (or corrosion potential) of tungsten and TiN films in
O.OIM KNOj solutions with and without oxidants as a function of immersion time. It can
be seen that TiN always has a higher OCP than tungsten. The OCP of tungsten and TiN
were increased after the addition of oxidants. For example, after the addition of 4.5%
hydrogen peroxide, the OCP of TiN increases from 400 mV to about 500 mV, while the
OCP of tungsten increases from 50 mV to about 250 mV. It is interesting that in the
presence of ferric nitrate, the OCP of TiN and tungsten are almost the same at
approximately 0.8 V. This potential is close to the potential for the reduction reaction of
ferric to ferrous (Table 8.1), suggesting the electrochemistry of the metal film - ferric
solution system may be controlled by the cathodic reaction. The driving force for the
galvanic corrosion, which is the potential difference between tungsten and TiN, can be
calculated from the data in Fig. 8.1 and is listed in Table 8.2. This driving force is the
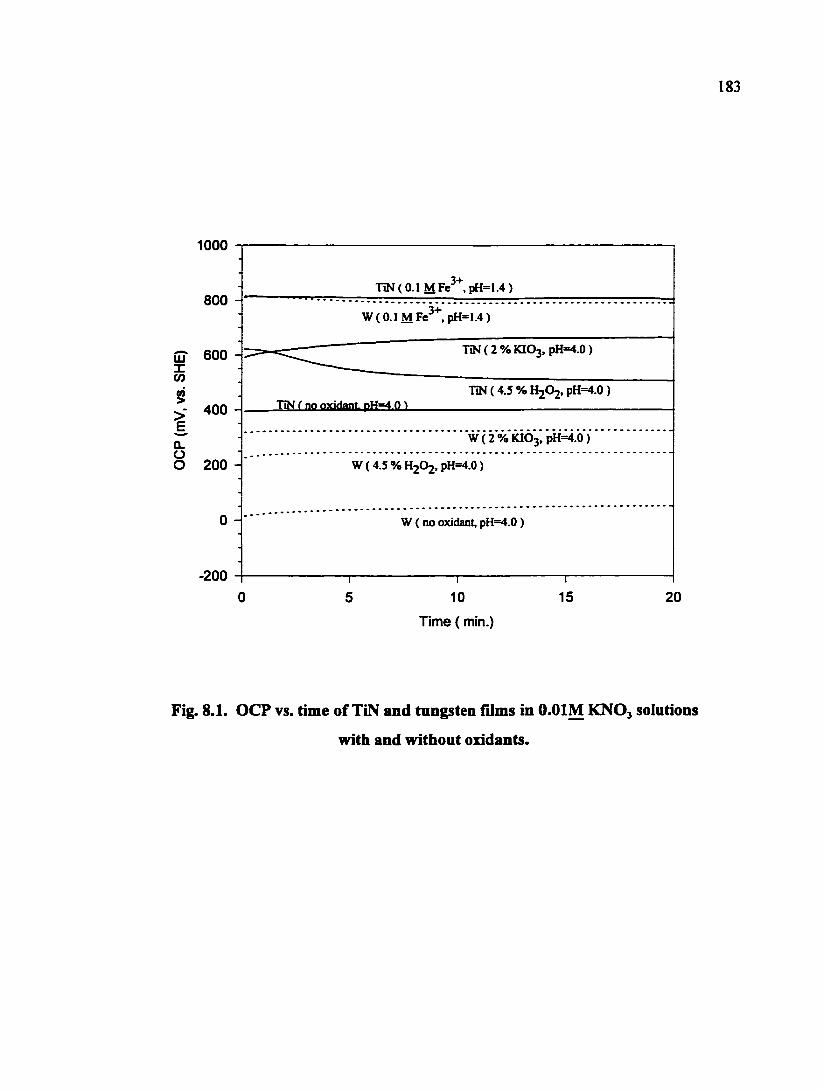
183
1000
800
£2" 600 X CO 01
400 -• > E, Q. O O 200
TiN(0.1MFe .pH=l.4)
W(O.IMFe-^ .pH=1.4)
•nN(2%KI03.pH=4.0)
TiN f no oxidant- pH=4 0 ^ TiN (4.5 % H2O2. pH=4.0)
W(2%Fa03,pH=4.0)
W (4.5 % H2O2. pH=4.0)
0 - • W ( no oxidant, pH=4.0 )
-200
5
I
10 15 20
Time (min.)
Fig. 8.1. OCP vs. time of TiN and tungsten films in O.OIM KNO3 solutions
with and without oxidants.
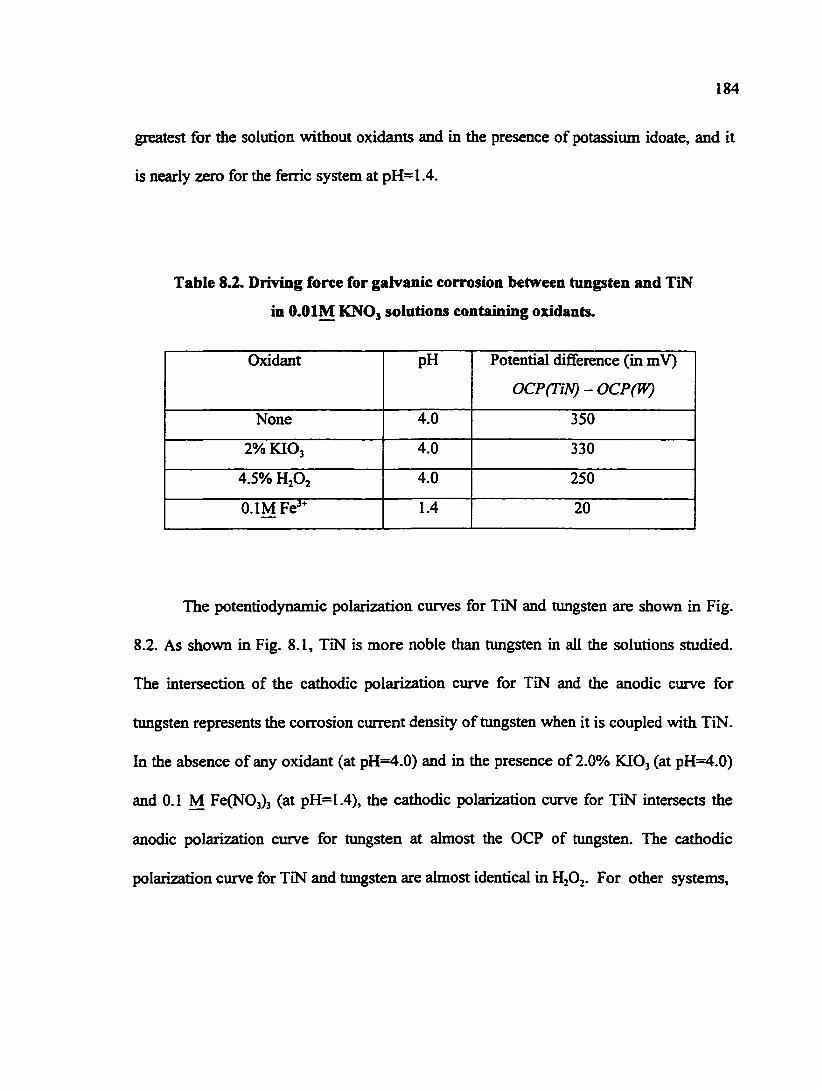
184
greatest for the solution without oxidants and in the presence of potassium idoate, and it
is nearly zero for the ferric system at pH=l .4.
Table 8 JS. Driving force for galvanic corrosion between tungsten and TiN
in 0.0 IM KNO, solutions containing oxidants.
Oxidant pH Potential difference (in mV)
OCP (TiN) - OCP(W)
None 4.0 350
2% KIOj 4.0 330
4.5% H2O2 4.0 250
O.lMFe'" 1.4 20
The potentiodynamic polarization curves for TiN and tungsten are shown in Fig.
8.2. As shown in Fig. 8.1, TiN is more noble than tungsten in all the solutions studied.
The intersection of the cathodic polarization curve for TiN and the anodic curve for
tungsten represents the corrosion current density of tungsten when it is coupled with TiN.
In the absence of any oxidant (at pH=4.0) and in the presence of 2.0% KIOj (at pH=4.0)
and 0.1 M Fe(N03)3 (at pH=1.4), the cathodic polarization curve for TiN intersects the
anodic polarization curve for tungsten at almost the OCP of tungsten. The cathodic
polarization curve for TiN and tungsten are almost identical in HjOj. For other systems.
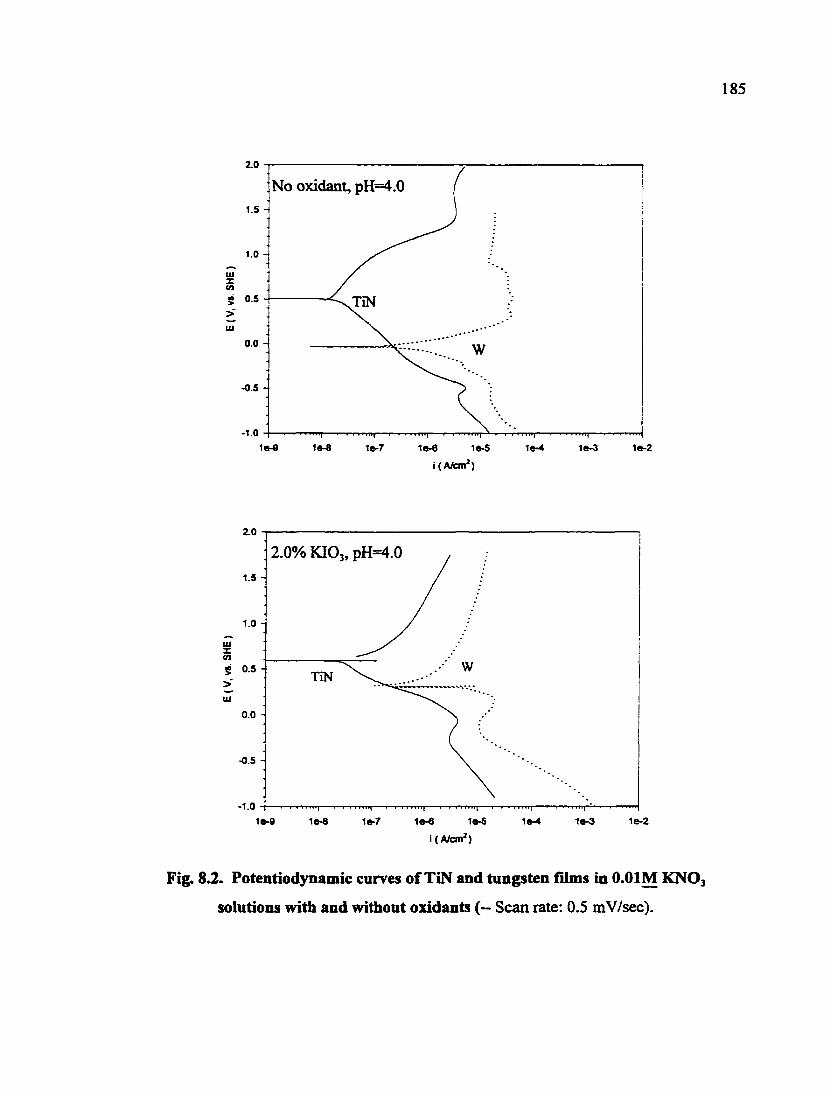
185
2.0
No oxidant, pH=4.0
111 X CO
0.5 >
> UJ
0.0 -
-0.5 -
-1.0
1e-2 1e-6 le-S ie-3
i(A/cm')
ZQ
2.0% KIOj, pH=4.0
1.5 -
1.0 -
UJ X
-1.0
1e-7 1e-5 1e-2 le-9 le-3 i(A/an')
Fig. 8.2. Potentiodynamic curves of TiN and tungsten films in O.OIM KNO3
solutions with and without oxidants (— Scan rate: 0.5 mV/sec).
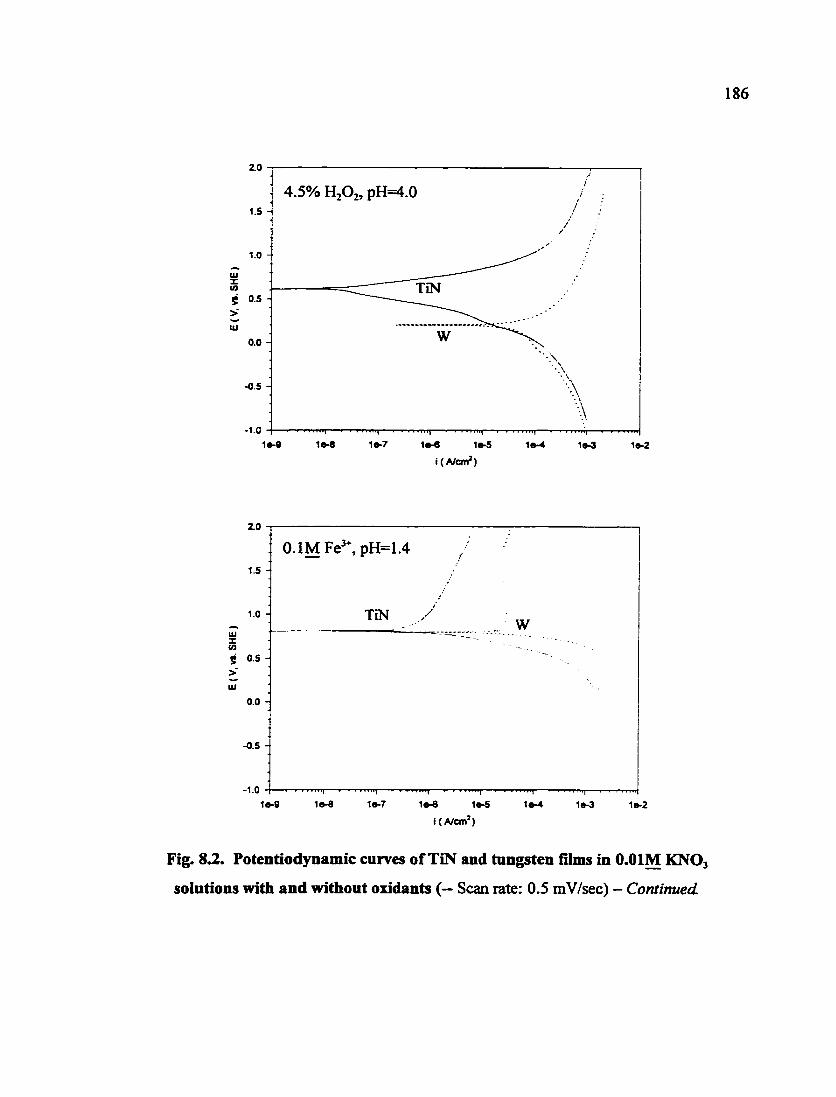
186
2.0
4.5% H^Oz, pH=4.0
tu X at 5 >•
TDM
UI 0.0 -
-0.5 -
1.0
1e-7 1*-9 1a-6 1a-5 ia-3
i (A/cm')
2.0
1.5
1.0
UJ X CO
s 0.5 >
UJ
0.0
-0.5
-1.0
1»-g 1e-8 1»-7 1e-6 la-S 1tt-4 1e-3 1»-2
i (A/cm')
Fig. 8.2. Potentiodynamic curves of TiN and tungsten films in O.OIM KNO3
solutions with and without oxidants (— Scan rate: 0.5 mV/sec) - Continued.
0.1MFe^\pH=1.4 ^
TD^ / w w
\
187
the reduction reaction on tungsten appears to be slightly more favorable than on TiN.
These features indicate that the galvanic contact with TiN should have a very minor effect
on the dissolution of tungsten.
The anodic polarization curves of tungsten show different degrees of passivation
in all the solution chemistries except for the hydrogen peroxide containing solution. For
the solution only containing potassium nitrate, the anodic reaction may be written as
W + 3 H20=W03 + 6ir + 6e- (8.1)
An abrupt passivation of tungsten was observed in ferric solution, where the formation of
a passive film of ferrous tungstate (i.e., FeW04) has been reported [8.2]. No passive film
is form in the presence of hydrogen peroxide [8.3].
The cathodic reaction for the base line solution is mostly hydrogen reduction. In
the presence of oxidants, the dominant cathodic reaction will be those shown in Table
8.1.
The corrosion current density and the corrosion potential of tungsten (in the
absence of galvanic coupling) calculated from the polarization curves are tabulated in
Table 8.3. The corrosion current density of tungsten (without coupling to TiN) is the
highest in the presence of hydrogen peroxide. The tungsten corrosion rates (in the
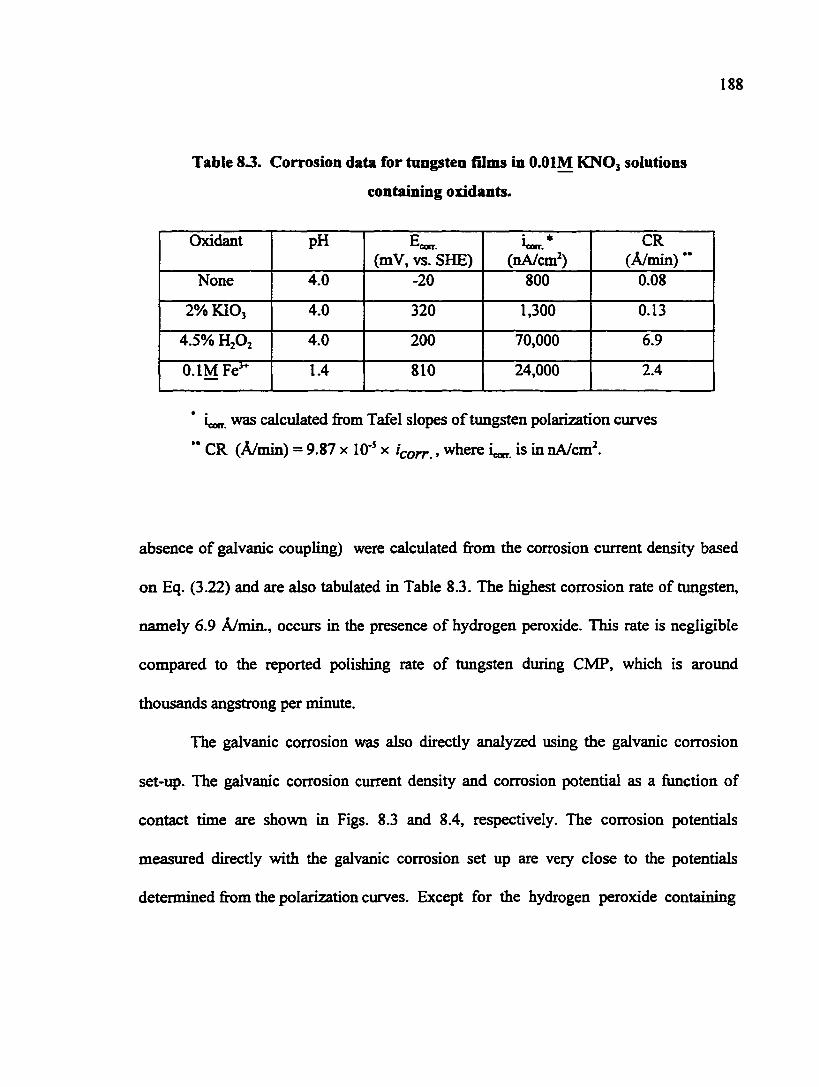
188
Table 83. Corrosion data for tungsten films in O.OIM KNO3 solutions
containing oxidants.
Oxidant pH Ecc. (mV, vs. SHE)
W* (nA/cm^)
CR (A/min) **
None 4.0 -20 800 0.08
2% KIO3 4.0 320 1,300 0.13
4.5% H2O2 4.0 200 70,000 6.9
O.lMFe"" 1.4 810 24,000 2.4
was calculated from Tafel slopes of tungsten polarization curves
" CR (A/min) = 9.87 x 10*^ x icorr.»where ijo„ is in nA/cm^.
absence of galvanic coupling) were calculated from the corrosion ciirrent density based
on Eq. (3.22) and are also tabulated in Table 8.3. The highest corrosion rate of tungsten,
namely 6.9 A/min., occurs in the presence of hydrogen peroxide. This rate is negligible
compared to the reported polishing rate of tungsten during CMP, which is around
thousands angstrong per minute.
The galvanic corrosion was also directly analyzed using the galvanic corrosion
set-up. The galvanic corrosion current density and corrosion potential as a function of
contact time are shown in Figs. 8.3 and 8.4, respectively. The corrosion potentials
measiured directly with the galvanic corrosion set up are very close to the potentials
determined from the polarization curves. Except for the hydrogen peroxide containing
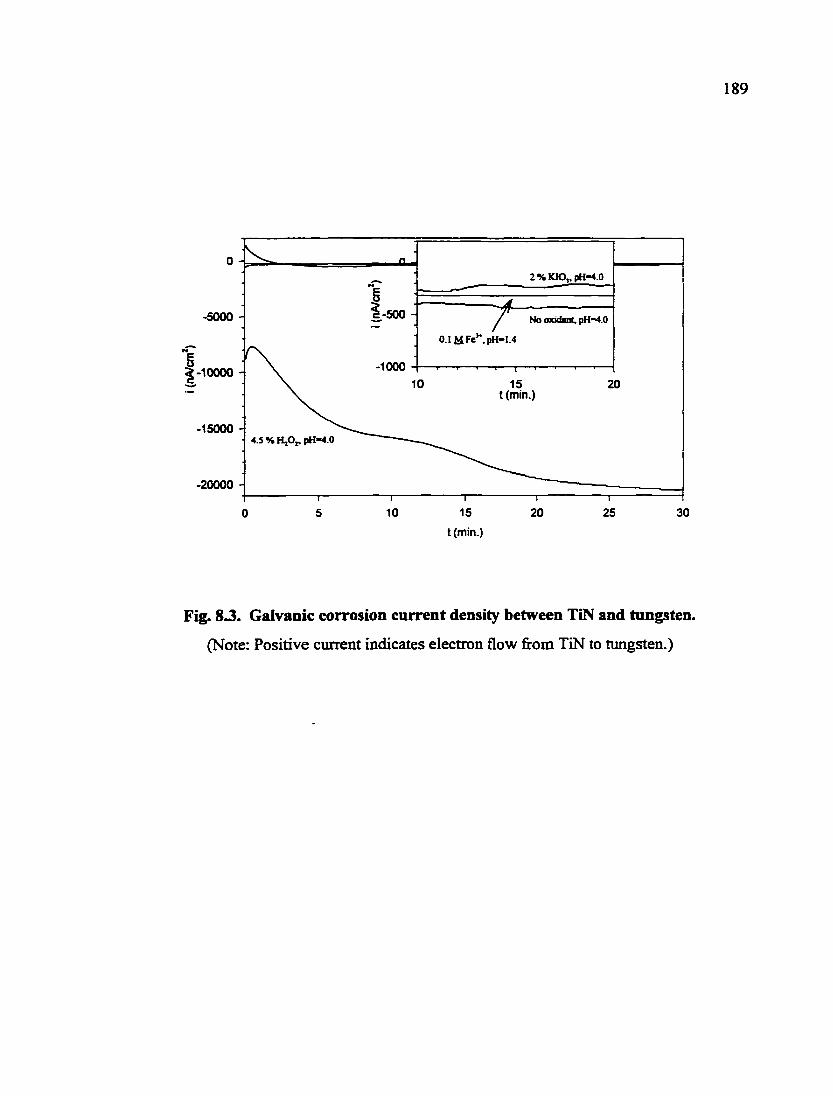
1-500 --5000 - No oxidint, pH~4.0 O.I MFe'*.pH-I.4
-1000
20 t (min.)
15 20 30 10 25 0 5
t (min.)
Fig. 83. Galvanic corrosion current density between TiN and tungsten.
(Note: Positive current indicates electron flow from TiN to tungsten.)
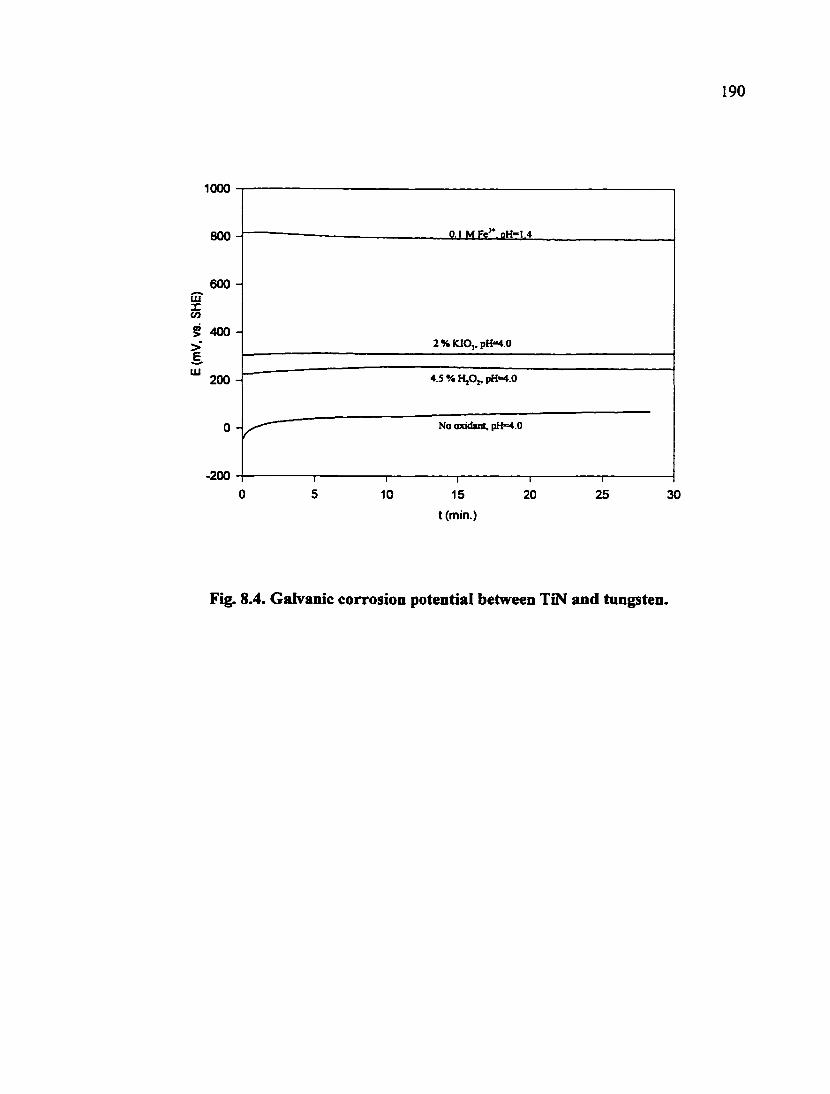
190
1000
800 0.1 MFe •aH=1.4
600 LU X CO 5 400 -> s
UJ 200 -
2SiaO,.pH=4.0
4.5 V, HjOj. pH=4.0
No oxidant, pH=4.0
-200
5 —I— 10
—r~ 15
—r-20 25 30
t (min.)
Fig. 8.4. Galvanic corrosion potential between TiN and tungsten.
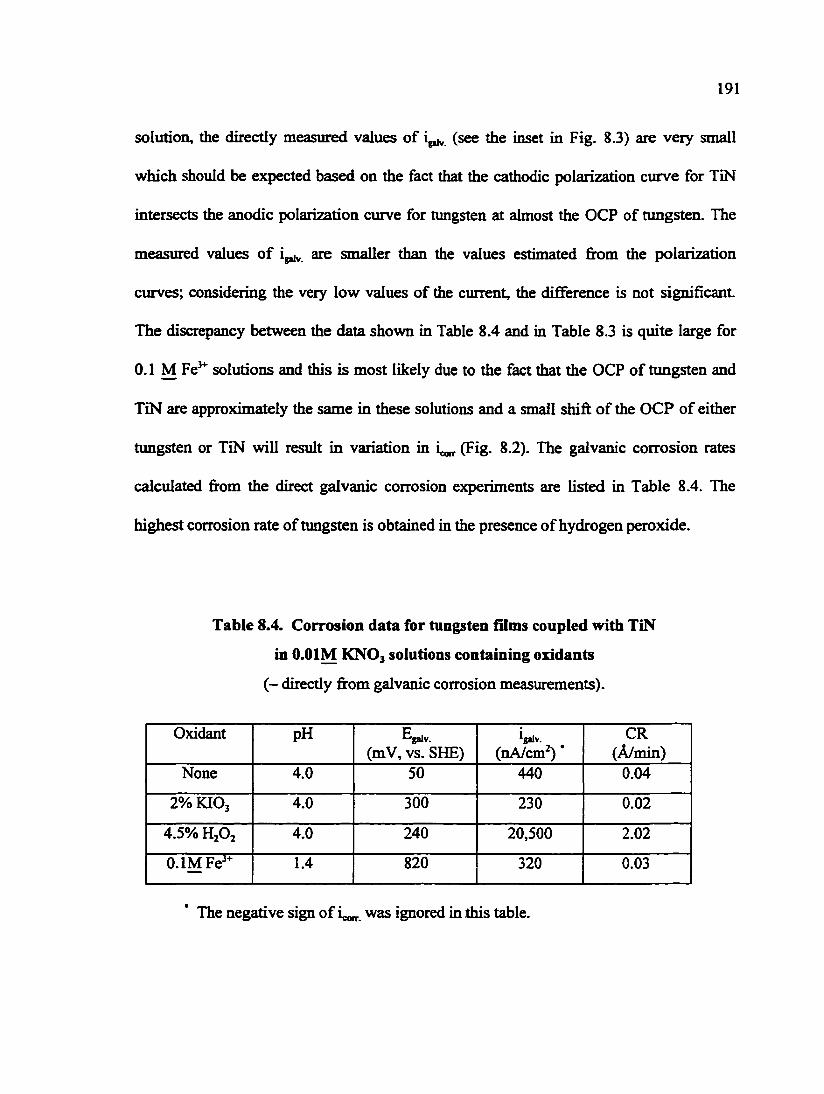
191
solution, the directly measured values of (see the inset in Fig. 8.3) are very small
which should be expected based on the fact that the cathodic polarization curve for TiN
intersects the anodic polarization curve for tungsten at almost the OCP of tungsten. The
measured values of i,^ are smaller than the values estimated &om the polarization
curves; considering the very low values of the current, the difference is not significant
The discrepancy between the data shown in Table 8.4 and in Table 8.3 is quite large for
0.1 M Fe^ solutions and this is most likely due to the fact that the OCP of tungsten and
TiN are approximately the same in these solutions and a small shift of the OCP of either
tungsten or TiN will result in variation in i^ (Fig. 8.2). The galvanic corrosion rates
calculated from the direct galvanic corrosion experiments are listed in Table 8.4. The
highest corrosion rate of tungsten is obtained in the presence of hydrogen peroxide.
Table 8.4. Corrosion data for tungsten films coupled with TiN
in 0.0 IM KNO3 solutions containing oxidants
(- directly from galvanic corrosion measurements).
Oxidant pH Egalv.
(mV, vs. SHE) 'galv.
(nA/cm^) * CR
(A/min) None 4.0 50 440 0.04
2% KIO3 4.0 300 230 0.02
4.5%H202 4.0 240 20,500 2.02
O.IM Fe'* 1.4 820 320 0.03
The negative sign of i^^^ was ignored in this table.

192
Fig. 8.5 shows the morphology of tungsten surfaces after galvanic contact with
TiN for 30 min. in different solutions. More corrosion of tungsten occurs in the presence
of hydrogen peroxide containing solution than in the other solutions, which is in
agreement with the corrosion rate data of timgsten as listed in Tables 8.3 and 8.4. No
significant morphology change was observed for the tungsten film coupled with TiN and
immersed in other solutions (Fig. 8.5).
8.2. Galvanic Contact between Copper and Tantalum
Galvanic corrosion between copper and tantalum was investigated in solutions
with and without hydrogen peroxide. Both acidic and basic solutions were investigated
since both have the potential of being used for copper CMP [8.4, 8.5] and/or the post-
CMP cleanup. The Eh-pH diagram of copper-water system is shown in Fig. 8.6. From
Fig. 8.6, it can be seen that copper is mostly stable as cupric ion at acidic pH values,
especially in the presence of oxidant, which will raise the potential (i.e.. Eh) of the
system. At basic pH values, copper can exist as hydroxide or oxide depending on the Eh
value. Fig. 8.7 displays the Eh-pH diagram of copper-ammonia system. Except for very
high (i.e., >12) or very low (i.e., <5) pH values, copper in ammonia solutions exists as
ammines. The Eh-pH diagram of tantalimi-water system is shown in Fig. 8.8. The
oxidation reaction of tantalum is as follows [8.1, 8.6]
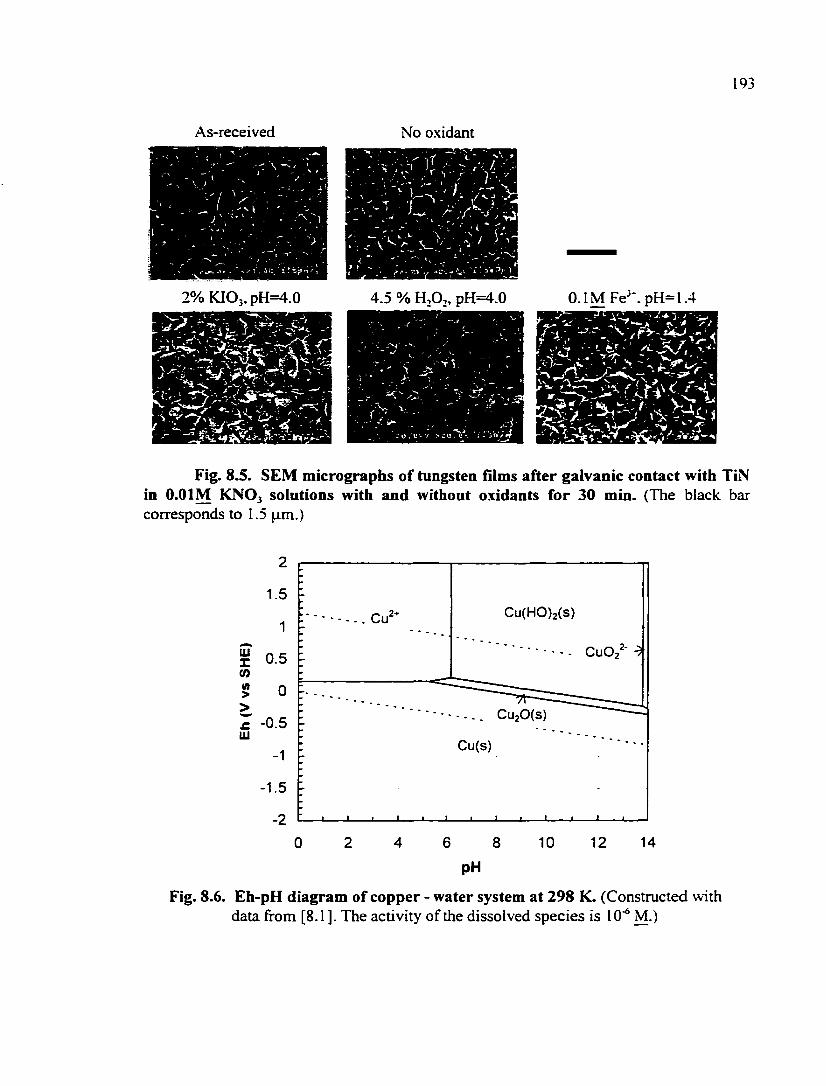
193
As-received No oxidant
2% KIOj. pH=4.0 4.5 % HA. pH=4.0 0.1M Fe^*. pH= 1.4
Fig. 8.5. SEM micrographs of tungsten films after galvanic contact with TiN in O.OIM KNO3 solutions with and without oxidants for 30 min. (The black bar corresponds to 1.5 |am.)
1.5
1 CU(H0)2(S)
i 0.5 (0
CuOz^- ^
5 0 > £ -0.5 UJ
-1
Cu20(s) •
Cu(s)
-1.5
-2 f 1 • I f 1 • 1 • 1 1 1 _ 1
0 2 4 6 8 10 12 14
PH
Fig. 8.6. Eh-pH diagram of copper - water system at 298 K. (Constructed with data from [8.1 ]. The activity of the dissolved species is 10"^ M.)
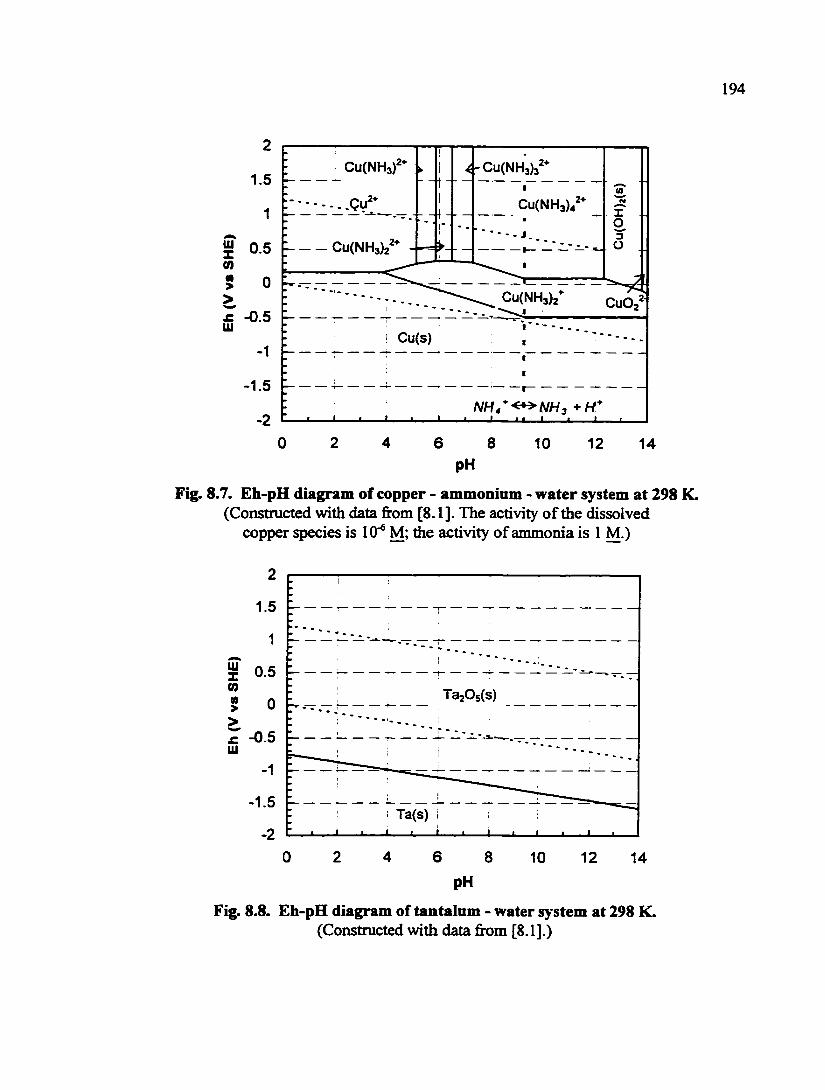
1.5 - - f
0.5
£ -0.5 ! Cu(S)
-1.5
0 2 4 6 8 10 12 14 PH
Fig. 8.7. Eh-pH diagram of copper - ammonium - water system at 298 K. (Constructed with data from [8.1]. The activity of the dissolved
copper species is 10"® M; the activity of ammonia is 1 M.)
S 0.5 (0
> W > r -0.5 ui
-1.5 Ta(s) i
0 2 6 4 8 10 12 14
pH
Fig. 8.8. Eh-pH diagram of tantalum - water system at 298 K. (Constructed with data from [8.1].)
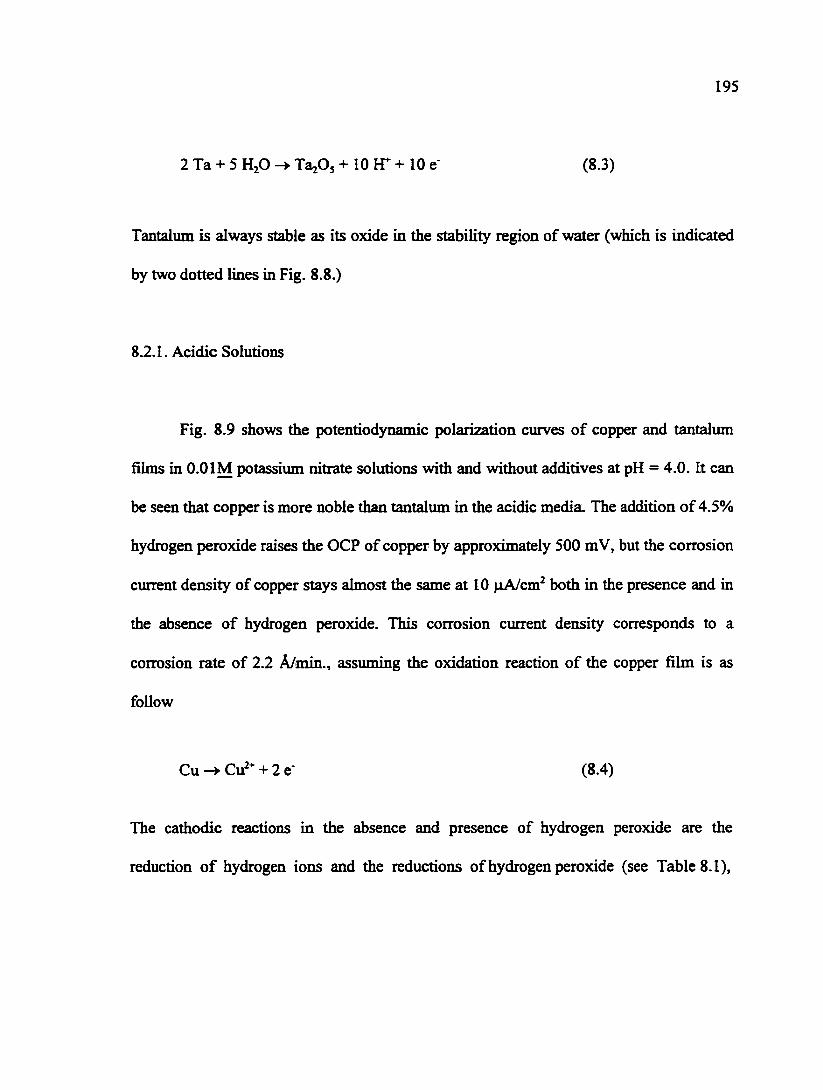
195
2 Ta + 5 HjO -• TaiOs + 10 BT + 10 e" (8.3)
Tantalum is always stable as its oxide in the stability region of water (which is indicated
by two dotted lines in Fig. 8.8.)
8.2.1. Acidic Solutions
Fig. 8.9 shows the potentiodynamic polarization curves of copper and tantalum
films in O.OIM potassium nitrate solutions with and without additives at pH = 4.0. It can
be seen that copper is more noble than tantalum in the acidic media. The addition of 4.5%
hydrogen peroxide raises the OCP of copper by approximately 500 mV, but the corrosion
current density of copper stays almost the same at 10 |aA/cm^ both in the presence and in
the absence of hydrogen peroxide. This corrosion current density corresponds to a
corrosion rate of 2.2 A/min., assimiing the oxidation reaction of the copper film is as
follow
Cu -> Cu^* + 2 e- (8.4)
The cathodic reactions in the absence and presence of hydrogen peroxide are the
reduction of hydrogen ions and the reductions of hydrogen peroxide (see Table 8.1),
196
2
1
Cu
0
-1 No additive
4.5% HjOj
lOOOppmCA
2
1e-10 1e-9 1e-8 1e-7 1e-6 1e-5 1e-4 1e-3 1e-2
i (A/cm^)
Fig. 8.9. Potentiodynamic curves of tantalum and copper films in O.OIM
KNO3 solutions with and without additives at pH = 4.0 (~ Scan rate: 0.5 mV/sec).
197
respectively. The effect of hydrogen peroxide on tantalum is much smaller than that on
copper. The OCP of tantalum increases by about 100 mV due to the addition of 4.5%
hydrogen peroxide. Citric acid does not have a significant effect on the corrosion
behavior of either tantalum or copper.
The driving force for the galvanic corrosion between copper and tantalimi is
tabulated in Table 8.5. Based on the negative values of the potential difference between
tantalum and copper, it can be expected that copper would act as a cathode while
tantalum would be the anode during the final stages of copper CMP using an acidic
slurry. It can be seen firom Table 8.5 that the addition of hydrogen peroxide enhances the
driving force for the galvanic corrosion by increasing the potential difference between
tantalum and copper by approximately a factor of 4. In the presence of hydrogen
peroxide, the corrosion current density of tantalum increases fi-om ~ 10 nA/cm^ when
there is no coupling to ~ 2 |iA/cm^ when coupled with copper. Based on Eq. 8.3, these
two current densities correspond to extremely small tantalum corrosion rates of 0.001 and
0.27 A/min., respectively. As shown in Fig. 8.8, the corrosion current density of copper is
more than 3 orders of magnitude higher than that of tantalum. This means that cathodic
and anodic reactions on copper will be hardly affected by tantalum.
No passivation was observed for copper in acidic media (Fig. 8.9). Tantalum will
be passivated when an anodic potential of approximately 500 mV vs. the OCP is applied.
This may be ascribable to the formation of tantalum oxide as described by Eq. (8.3).
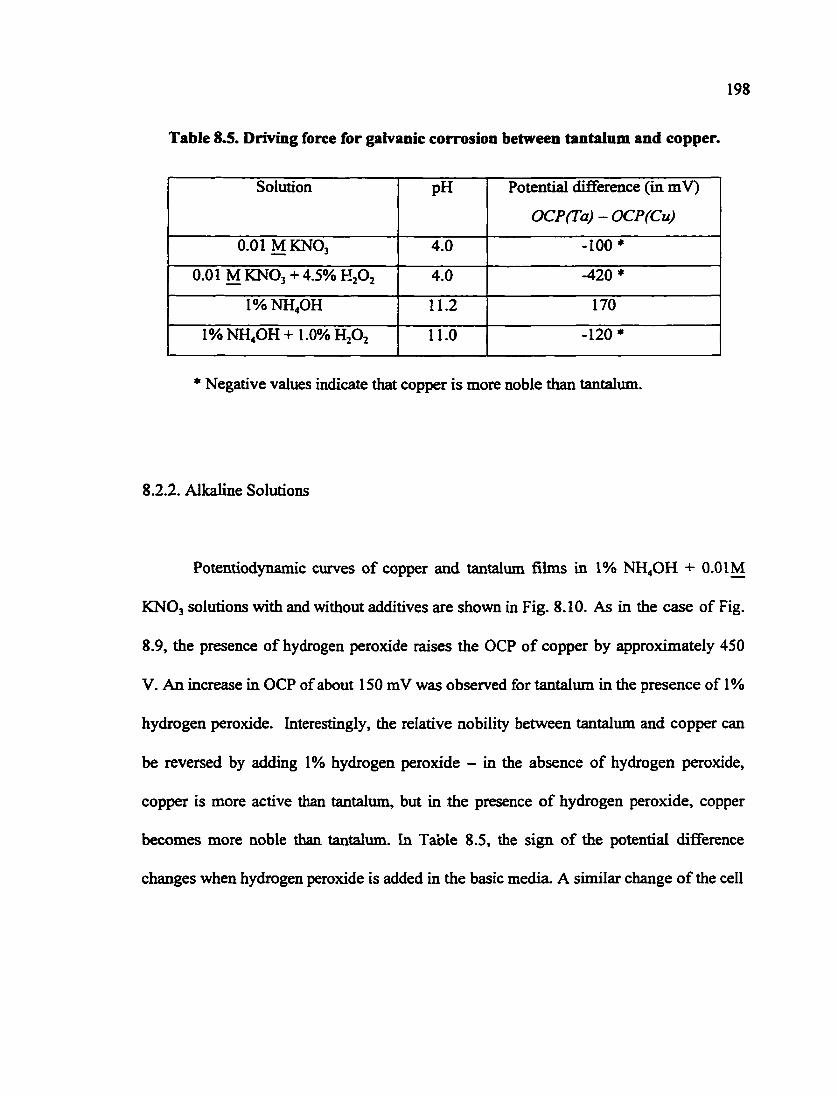
198
Table 8.5. Driving force for galvanic corrosion between tantalum and copper.
Solution pH Potential difference (in mV)
OCPCTa) - OCP(Cu)
0.01 MKNO3 4.0 -100*
0.01 M KNO3 + 4.5% HA 4.0 -420*
1%NH40H 11.2 170
1%NH40H+ 1.0%HA 11.0 -120*
* Negative values indicate that copper is more noble than tantalum.
8.2.2. Alkaline Solutions
Potentiodynamic curves of copper and tantalum films in 1% NH4OH + O.OIM
KNO3 solutions with and without additives are shown in Fig. 8.10. As in the case of Fig.
8.9, the presence of hydrogen peroxide raises the OCP of copper by approximately 450
V. An increase in OCP of about 150 mV was observed for tantalimi in the presence of 1%
hydrogen peroxide. Interestingly, the relative nobility between tantalum and copper can
be reversed by adding 1% hydrogen peroxide - in the absence of hydrogen peroxide,
copper is more active than tantalum, but in the presence of hydrogen peroxide, copper
becomes more noble than tantalum. In Table 8.5, the sign of the potential difference
changes when hydrogen peroxide is added in the basic media. A similar change of the cell
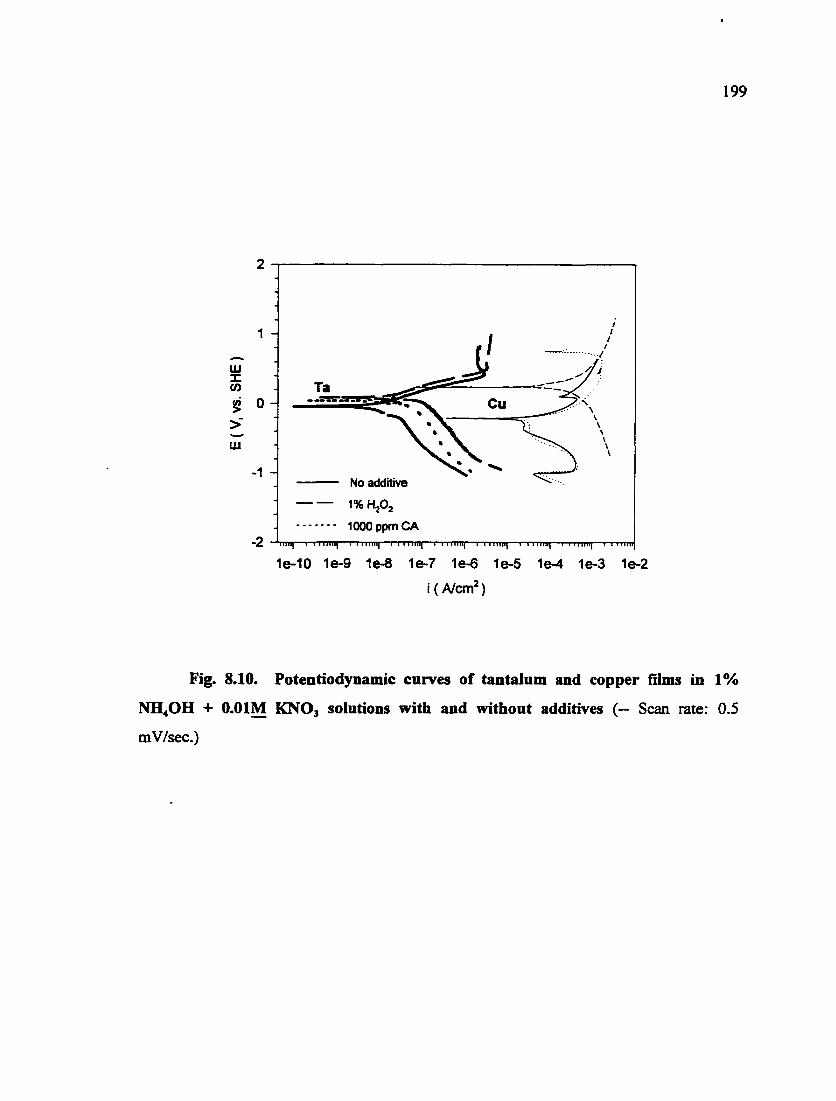
199
2
1
LU X CO « 0 > UJ
-1
-2
1e-10 1e-9 1e-8 1e-7 1e-6 1e-5 1e-4 1e-3 1e-2
i (A/cm^)
Ta
No additive
1% H2O2 lOOOppmCA
mill I I iiiiin I > niinj 1 I iiiiii| ii| I I iiiiiii—1 1 mini I 1 miiii
Fig. 8.10. Potentiodynamic curves of tantalum and copper films in 1%
NH4OH + O.OIM KNO3 solutions with and without additives (~ Scan rate: 0.5
mV/sec.)
200
polarity due to the addition of hydrogen peroxide has been reported by Evans (197) for
copper CMP with a commercial slurry.
In alkaline anmionia solutions, the corrosion current density of copper is still
more than three order magnitude higher than that of tantalum (Fig. 8.10). It can also be
seen that, in the alkaline solution, hydrogen peroxide seems to increase the corrosion
current of copper by a factor of 8, i.e., from 15 ^A/cm^ to 120 |iA/cm^. These two values
correspond to copper corrosion rates of 3.3 and 26.6 A/min., respectively. In the absence
of hydrogen peroxide, tantalum will be the cathode when coupled with copper. Therefore,
it is more difBcult to corrode tantalimi. When there is hydrogen peroxide in the solution,
copper becomes the cathode. The corrosion current density of tantalimi increases by a
factor of 20 due to the galvanic effect with copper in the presence of hydrogen peroxide
(Fig. 8.10). The corrosion ciurent density of tantalum coupled with copper in the basic
medium with hydrogen peroxide can be calculated from Fig. 8.10 to be 200 nA/cm^,
corresponding to a tantalum corrosion rate of 0.03 A/min. As discussed above for the
acidic solutions, the corrosion of copper should not be affected by the galvanic contact.
In the anmionia solutions studied (pH ~ 10.5), the anodic reactions of copper will
most probably be as shown by Eqs. (8.5) and (8.6) in the absence and presence of
hydrogen peroxide, respectively:
Cu + 2 NH4" ^ Cu(NH3)2" + 2 it + e (8.5)
201
Cu + 4 NH4* ^ Cu(NH3)4^* + 4 ft + 2 e" (8.6)
The anodic polarization curves of copper are slightly different in the absence and
presence of hydrogen peroxide (Fig. 8.10). The anodic reaction of tantalum may be
different than Eq. (8.3) in the presence of ammonia. The cathodic reaction on copper and
tantalum films may be as follows in the basic solution
The reduction of cupric or cuprous species will also be involved in the cathodic reaction.
The addition of citric acid does not change the corrosion behavior of tantalum in
the alkaline solution, but citric acid appears to slightly enhance the dissolution of the
copper films in the alkaline solution (Fig. 8.10).
8.3. Conclusions and Discussion
Through this study, it was demonstrated that TiN is more noble than tungsten both
in the presence and absence of oxidants. This is consistent with the fact that TiN is one of
the more often used coating materials due to its corrosion resistance among other
properties [8.7-8.9]. From direct galvanic measurements, it was found that the highest
galvanic corrosion current density of tungsten occurs in the presence of hydrogen
2Hj0 + 02 + 4e->.4 0H- (8.7)
202
peroxide. Tungsten film can be passivated in all the solutions except for hydrogen
peroxide. SEM micrographs of the surface morphology of tungsten samples after galvanic
contact with TiN showed more corrosion of tungsten in the presence of hydrogen
peroxide than in the presence of other oxidants or in the absence of an oxidant.
For the copper - tantalum system, copper is more noble than tantalum in acidic
media. With galvanic coupling to copper, the corrosion current of tantalum increases
more than 2 orders of magnitude. In alkaline ammonia media, copper is more active than
tantalum in the absence of hydrogen peroxide. The addition of 1% hydrogen peroxide
reverses the relative nobility of tantalum and copper. The addition of citric acid into the
ammonia solution appears to promote the corrosion of copper when anodically biased.
As mentioned previously, the corrosion current density as measured is very small
compared to the commercial polishing rate of both tungsten and copper, so the effect of
galvanic corrosion on the dissolution of the metal films shoiild be very limited. In
addition, as shown in Fig. 9.2 for tungsten-TiN and Figs. 9.9 and 9.10 for copper-
tantalum, the intersection point between the cathodic polarization curve of the more noble
film and the anodic curve of the more active film usually locates near the OCP of
tungsten or copper. This indicates that the corrosion of tungsten or copper is hardly
a£fected by the presence of TiN and tantalum, respectively. The slow polishing rate of
tantalmn is a known issue in copper CMP. As noted by Evans [8.10], the active polishing
time is an important factor determining the influence of galvanic corrosion. The low
203
removal rate of tantalum may give rise to a prolonged galvanic corrosion effect in the
copper - tantalum system, compared to the coupling of tungsten - TiN in tungsten CMP.
However, the CMP process results from both chemical and mechanical
interactions between all the components. The galvanic corrosion may also be able to alter
the physical properties of the films being polished and affect the film removal in another
physical way. For example, ammonia solutions are found to roughen the copper surface
that will make the film more susceptible to the mechanical removal. It is also interesting
that tantalum was reported to be "mechanically fractured" while being polished in a
potassium hydroxide slurry [8.6]. At present, the mechanical behavior of metal films
subject to CMP is not very clear in the presence of galvanic coupling and fiuther studies
are needed.
204
Chapter 9
CONCLUDING REMARKS
In this study, the surface chemical and electrochemical principles and techniques
were used to investigate some fundamental aspects of metal CMP. Special attention was
paid to the particulate contamination in tungsten CMP, metal contamination in copper
CMP, and galvanic corrosion in the CMP process of both tungsten and copper. The
following conclusions can be drawn from this study;
(1); Citric acid and malonic acid interact with alumina particles by electrostatic as
well as chemical interactions. The zeta potential of alumina particles can be modified by
the acids. The uptake amount and the zeta potential of alumina are a function of the
concentration of the acids in the slurry. The uptake amount and the zeta potential of
alumina also depend on the slurry pH — the higher the pH, the less adsorption but more
negative is the zeta potential.
(2): Citric acid and malonic acid are shown to be capable of inhibiting alumina
particulate contamination on both oxide and tungsten surfaces during tungsten CMP at
pH=4. This can be discussed semi-quantitatively using the interaction energy calculation,
provided that the Hamaker constant of particle-water-wafer needs to be evaluated
carefiilly. The acids are effective even in the presence of hydrogen peroxide. They appear
to have little effect on the corrosion behavior of tungsten. The effect of citric acid on
removing particles during post-CMP cleaning was also studied. Citric acid cleaning
205
followed by DI water rinsing gives rise to cleaner surface with respect to alumina
particulate contamination.
(3): Copper contamination on silicon dioxide films can reach a level of 10'
atoms/cm^. Citric acid is very effective in reducing the copper contamination. The extent
of contamination is affected by the presence of hydrogen peroxide, and the solution pH.
Copper adsorption data can be explained using a surface complexation model. Streaming
potential measurements show that the adsorption of copper can change the zeta potential
of silicon dioxide. However, the presence of citric acid inhibits this influence of copper
on the zeta potential of silicon dioxide.
(4): The electrochemistry of the galvanic coupling between tungsten and TiN and
between copper and tantalum has been studied. TIN is more noble than tungsten in all
solutions containing oxidants that were studied. The corrosion current of tungsten films
coupled with TiN was obtained both from the polarization curves and the direct galvanic
corrosion measurements. The highest corrosion current of tungsten was found in the
presence of hydrogen peroxide. Copper is more noble than tantalum in acidic media. In
an alkaline ammonia solution, hydrogen peroxide can reverse the cell polarity between
copper and tantalirai. Galvanic coupling has 'imited influence on the dissolution of the
metal films.
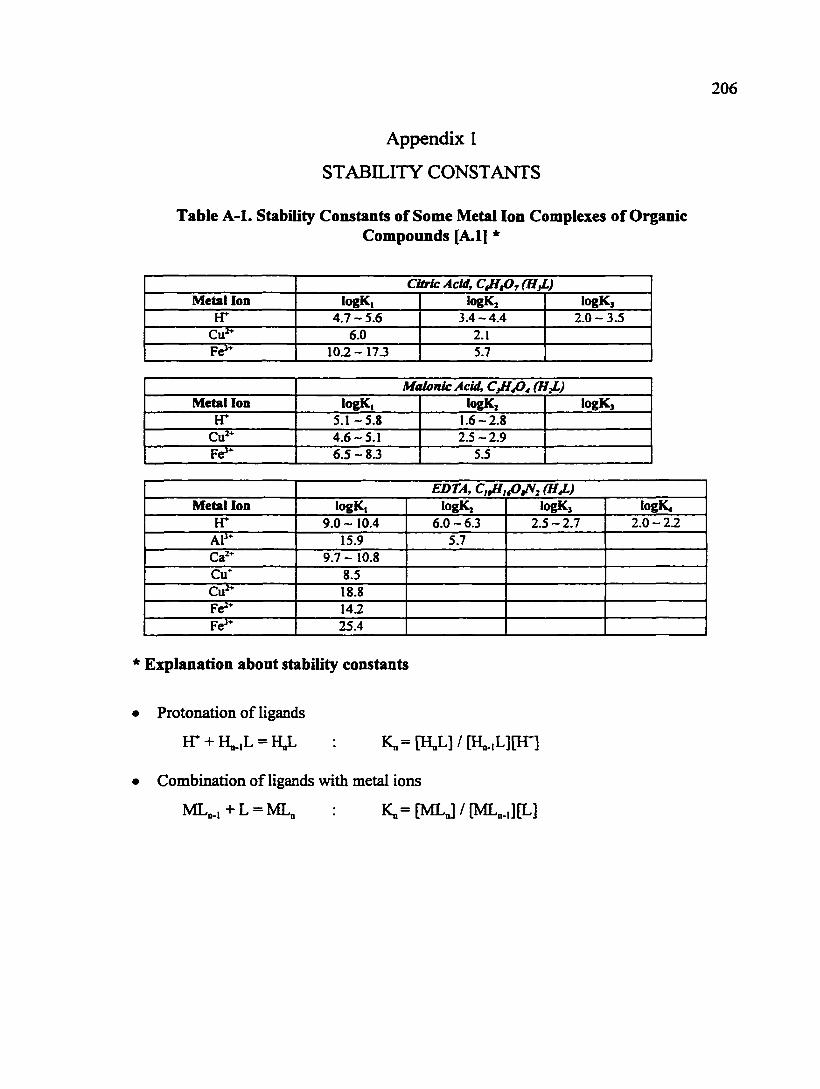
206
Appendix 1
STABILITY CONSTANTS
Table A-1. Stability Constants of Some Metal Ion Complexes of Organic Compounds [A.1] *
Citric Acid, Cfifir (H ) Metal Ion logK, logK, logK,
FT 4.7 - 5.6 3.4-4.4 2.0 - 3.5 6.0 2.1
Fe'" 10.2-173 5.7
Malonic Acid, (HJL) Metal Ion logK, logK, logK,
FT 5.1-5.8 1.6-2.8 Cu'* 4.6-5.1 2.5-2.9 Fe^ 6.5 - 8.3 5.5
Metal Ion logK, logKj logKj logK« H* 9.0 - 10.4 6.0-6.3 2.5 - 2.7 2.0 - 2.2
15.9 5.7 9.7 - 10.8
Cu" 8.5 18.8
Fe^" 14.2 Fe'" 25.4
* Explanation about stability constants
• Prctonationofligands
HT + H^,L = H„L : K„ = [H„L] / [H„.,L][Fr]
• Combmation of ligands with metal ions
ML,,+L = ML„ : K„= [MLJ / [ML,,][L]

207
REFERENCES
Chapter 1:
[1.1] SIA, The National Technology Roadmap for Semiconductors (1997 ed.)-
[1.2] P.H. Singer, Semiconductor International, p. 44 (March, 1992).
[1.3] R. Rosenberg, MRSSymp. Proc., 337, 33 (1994).
[1.4] RJ. Gutmann, T.P. Chow, W.N. Gill, A.E. Kaloyeros, W.A. Lanford, and S.P. Muraka, MRSSymp. Proc., 337,41 (1994).
[1.5] A.R Sethiiraman, J.-F. Wang, and L.M. Cook, Semiconductor International, p. 177 (June 1996).
[1.6] C.-K. Hu and J.M.E. Harper, Materials Chemistry and Physics, 52, 5 (1998).
[1.7] T.L. Myers, M. A. Fury, and W. C. fCrusell, Solid State Technol, p. 59 (October, 1995).
Chapter 2:
[2.1] J.E.J. Schmitz, Chemical Vapor Deposition of Tungsten and Tungsten Silicides for VLSI/ULSI Applications, Noyes Publications, Park Ridge (1992).
[2.2] M. Eizenberg, MRS Symp. Proc., 427, 325 (1996).
[2.3] V.M. Dubin, Y. Shacham-Diamand, B. Zhao, P.K. Vasudev, and C.H. Ting, MRS Symp. Proc., 421,179 (1996).
[2.4] D.N. Lee, MRS Symp. Proc., 427, 167 (1996).
[2.5] W.-J. Lee, MRS Symp. Proc., All, 207 (1996).
[2.6] P. Singer, Semiconductor International, p. 91 (June 1998).
[2.7] J. Wamock, J. Electrochem. Soc., 138,2398 (1991).
208
[2.8] M. Bhiishan, R. Rouse, and J. E. Lukens, J.Electrochem. Soc., 142,3845 (1995).
[2.9] M.A. ?\3iy. Solid State TechnoL, p.81 (May 1997).
[2.10] J.M. Steigerwald, S.P. Murarka, and R.J. Gutmann, Chemcial Mechanical Planarization of Microelectronic Materials, John Wiley & Sons, NY (1997).
[2.11] R-J. Colloins and G. Williams, Solid State TechnoL, 99 (March, 1995).
[2.12] MA. Fury, Solid State TechnoL, p. 47 (April, 1995).
[2.13] W.L. Smith, K. Kruse, K. Holland, and R. Harwood, Solid State TechnoL, p. 77 (January, 1996).
[2.14] S. Sivaram, R. Leggett, and A. Maury, in Proc. 3rd Int. Symp. on ULSI Science and Technology, eds. J.M. Andrews and G.K. Celler, p. 606, The Electrochem. Soc., Inc., NJ (1991).
[2.15] G. Nanz and L. E. Camilletti, IEEE Trans. Semi. Manuf., 8,382 (1995).
[2.16] P. Burggraaf, Semiconductor InternationaL p. 74 (November 1995).
[2.17] Y. Hayashi, K. Kikuta, and T. Kikkawa, IEEE International Electron Devices Meeting, p. 976 (1992).
[2.18] K.-T. Lee, PhD. Dissertation, University of Arizona (1998).
[2.19] R.J. Contolini, A.F. Bernhardt, and S.T. Mayer, J. Electrochem. Soc., 141, 2503 (1994).
[2.20] C. Raghunath, PhD. Dissertation, University of Arizona (1997).
[2.21] M. Moinpour and A. Philipossian, M Symp. Proc., 427,243 (1996).
[2.22] S.R. Rimneis, J. Electrochem. Soc., 141,1900 (1994).
[2.23] S.R. Runnels and L. M. Eyman, J. Electrochem. Soc., 141,1698 (1994).
[2.24] S.R. Rimnels, Journal of Electronic Materials, 25, 1574 (1996).
[2.25] W.-T. Tseng and Y.-L. Wang, J. Electrochem, Soc., 144, L15 (1997).
209
[2.26] B. Bhushan (ed.). Handbook of Micro/Nano Tribology, CRC Press, NY (1995).
[2.27] O.G. Chekina, L.M. Keer, and H. Liang, J. Electrochem. Soc., 145,2100 (1998).
[2.28] L Finnic, in Corrosion-erosion Behavior of Materials ed. K. Natesan, p. 118, The Metallurgical Society of AIME, NY (1980).
[2.29] P.K. Mehrotra, G.A. Sargent and H. Conrad, in Corrosion-erosion Behavior of Materials, ed., K. Natesan, p. 127, The Metallurgical Society of AIME, NY (1980).
[2.30] L.M. Cook, J. Non-Cryst. Solids, 120, 152 (1990).
[2.31] M. Tomozawa, K. Yang, H. Li and S.P. Murarka, MRS Symp. Proc., 337, 89 (1994).
[2.32] K. Rajan, Journal of Electronic Materials, 25, 1581 (1996).
[2.33] F.B. Kaufinan, D.B. Thompson, R-E. Broadie, M.A. Jaso, W.L. Guthrie, D.J. Pearson, and M.B. Small, J Electrocherru Soc., 138, 3460 (1991).
[2.34] E. Kneer, PKD. Dissertation, University of Arizona (1998).
[2.35] M. Matsumura, Corrosion Reviews, 12, 321 (1993).
[2.36] SLA, The National Technology Roadmap for Semiconductors (1997 ed.).
[2.37] W. Kem and D.A. Puotneu, RCA Review, 31, 187 (1970).
[2.38] Y.-L. Wang, C. Liu, M.-S. Feng, and W.-T. Tseng, Materials Chemistry and Physics, 52, 23 (1998).
[2.39] F. Kunimoto, T. Ohmi, and F.W. Kem, Jr., MRS Symp. Proc., 315 (1993).
[2.40] S. Verhaverbeke, J.W. Parker, and C.F. McConnell, MRS Symp. Proc., All, 47 (1997).
[2.41] H. Morinaga, M. Aoki, T. Maeda, M. Fujisue, H. Tanaka, and M. TOyoda, MRS Symp. Proc., 477,35 (1997).
210
[2.42] W.A. Syverson, M.J. Fleming, and P.J. Schubring, in Proc. 2nd International Symp. Cleaning Technology in Semiconductor Device Manufacturing, eds., J. Ruzyllo and R.E. Novak, The Electrochemical Society, Inc., NJ (1992).
[2.43] M. Olim, J. Electrochem. Soc., 144, 3657 (1997).
[2.44] J. Isiaelachvili, Intermolecular & Surface Forces, 2nd ed.. Academic Press, San E)iego (1994).
[2.45] A.A. Busnainaand F. Dai, Semiconductor International, p.85 (April 1997).
[2.46] T. Ohmi, M. Toda, M. Katoh, K. Kawada, and H. Morita, MRS Symp. Proc., 477, 3 (1997).
[2.47] W.C. (Cruseil J. de Larios, and J. Zhang, Solid State Technology, 38, 109 (1995).
[2.48] J. M. de Larios, J. Zhang, E. Zhao, T. Gockel, and M. Ravkin, Micro, 15, 61 (1997).
[2.49] L. Peters, Semiconductor International, 21, 52 (1998).
[2.50] C. Huynh, M. Rutten, R. Cheek, and H. Linde, in Proc. 1st Int. Symp. Chemical Mechanical Planarization, eds., I. Ali and S. Raghavan, p. 16, The Electrochem. Soc., Inc., NJ (1997).
Chapter 3:
[3.1] N. Awaya, H. Inokawa, E. Yamamoto, Y. Okazaki, M. Miyake, Y. Arita, and T. Kobayashi, IEEE Trans. Electron Devices, 43, 1206 (1996).
[3.2] C. Dennison, Micro, p.31 (February 1998).
[3.3] H. Hiratsuka, M. Tanaka, and Y. Matsushita, in Proc. 7th Symp. Autom. Integ. Circuits Manufac., eds., V.E. Akins and H. Harada, p. Ill, The Electrochem. Soc., Inc., NJ (1992).
[3.4] M. A. Fury, Solid State TechnoL, p. 47 (April, 1995).
[3.5] S. R. Roy, I. AH, G. Shinn, N. Furusawa, R. Shah, S. Peterman, K. Witt, and S., Wastman,y. Electrochem. Soc., 142,216 (1995).
211
[3.6] R.P. Donovan, T. Yamamoto, and R. Periasmy, MRSSymp.Proc., 315,3 (1993).
[3.7] RJ. Hunter, Introduction to Modem Colloid Science, Oxford, NY (1996).
[3.8] J. Israeiachvili, Intermolecular & Surface Forces, 2nd ed.. Academic Press, San Diego (1994).
[3.9] R.P. Donovan, A.C. Clayton, DJ. Riley, R.G. Carbonell, and V.B. Menon, Microncontamination, p. 25 (August 1990).
[3.10] I. Ali, Pk D. Dissertation, University of Arizona (1991).
[3.11] A. Saito, K. Ohta, and H. Oka, Proceed, of Microncontamination 91 Conference (October 1991).
[3.12] T. Ohmi, in Proceedings of the 3rd International Symposium on Cleaning Technology in Semiconductor Device Manufacturing, eds., J. Ruzyllo and R.E. Novak, p. 3, The Electrochem. Soc., Inc., NJ (1994).
[3.13] C. Raghunath, Ph. D. Dissertation, University of Arizona (1997).
[3.14] L.M. Cook, J. Non-Cryst Solids, 120, 152 (1990).
[3.15] J.M. Steigerwald, S.P. Murarka, and R.J. Gutmann, Chemcial Mechanical Planarization of Microelectronic Materials, John Wiley & Sons, NY (1997).
[3.16] W.-T. Tseng and Y.-L. Wang, J. Electrochem Soc., 144, L15 (1997).
[3.17] T. H. Kosel, A.P.L. Tuner, and R.O. Scattergood, in Corrosion-erosion Behavior of Materials, ed. K. Natesan, p. 146, The Metallurgical Society of AIME, NY (1980).
[3.18] A.F.M. Leenaars, in Partichs on Surface I. Detection, Adhesion, and Removal, ed. K.L. Mittal, p. 361, Plenum, NY (1988).
[3.19] J. Park, Ph. D. dissertation. University of Arizona (1991).
[3.20] D.J. Riley and R.G. Carbonell, J. Colloid Inter. Sci., 158,259 (1993).
[3.21] L.M. Loewenstein and P.W. Mertens, J. Electrochem. Soc., 145,2841 (1998).
[3.22] G. Li, Ph. D. Dissertation, University of Arizona (1998).
212
[3.23] K.J. Farley, D.A. Dzombak, and F.M.M. Morel, J. SolloicL Interf. Set, 106, 226 (1985).
[3.24] J.M. Zazhara and J.C. Westall, in Soil Physical Chemistry, ed., D.L. Sparks, 2nd Ed., p. 47, CRC Press, NY (1999).
[3.25] W. Lee, K.J. Torek, D.A. Palsulich, and L. Weston, MRS Symp. Proc., All, 57 (1997).
[3.26] E. Kneer, Ph. D. Dissertation, University of Arizona (1998).
[3.27] A.J. Bard, P. Parsons, and J. Jordan, Standard Potentials in Aqueous Solutions, lUPAC, Marcel Dekker, Inc., NY (1985).
[3.28] B.S. Hemingway and G. Sposito, in The Environmental Chemistry of Aluminum, ed., G. Sposito, p.81, CRC Lewis Publishers, NY (1996).
[3.29] M. Pourbaix, Atlas of Electrochemical Equilibria in Aqueous Solutions, translated by J.A. Franklin from French, p. 614, Pergamon Press, Cebelcor, Brussels (1966).
[3.30] http://www.shef ac.uk/chemistry/web-elements.
[3.31] D.J. Stein, D. Hetherington, T. Guilinger, and J.L. Cecchi, J. Electrochem. Soc., 145,3190(1998).
[3.32] R.C. Newman, in Corrosion Mechanisms in Theory and Practice, eds., P. Marcus and J. Oudar, p.311, Marcel Dekker, Inc., NY (1995).
[3.33] F.B. Kaufrnan, D.B. Thompson, R.E. Broadie, M.A. Jaso, W.L. Guthrie, D.J. Pearson, and M.B. Small, J. Electrochem. Soc., 138, 3460 (1991).
[3.34] J. Farkas, R. Carpio, R. Bajaa, C. Galanakis, R. Jairath, B.P. Jones, and S.-M. Tzeng, in Advanced Metallization for VLSI Applications in 1994, eds., R. Blumenthzd and G. Janssen, p. 25, Materials Research Society, Pittsburgh (1995).
[3.35] D.R. S. Basak, K. Mishra, B. Withers, and K. Rajeshwar, in Proc. 1st International Symp. Chemical Mechanical Planarizaiton, eds. I. Ali and S. Raghavan, p. 137, The Electrochem. Soc., Inc., NJ (1997).
[3.36] R. Carpio, J. Farkas, and R. Jairath, Thin Solid Films, 266, 238 (1995).
213
[3.37] K. Osseo-Assare and K.K. Mishra, J. Electronic Mat., 25, 1599 (1996).
[3.38] D.R. Evans, in Proc. 1st International Symp. Chemical Mechanical Planarizaiton, eds. I. Ali and S. Raghavan, p. 70, The Electrochem. Soc., Inc., NJ (1997).
[3.39] C. Sainio and D.J. Duquette, in Proc. 2nd International Symp. on Chemcial Mehcanical Planarization in IC Devices Manufacturing, eds., S. Raghavan, R.L. Opila, and L. Zhang, The Electrochem. Soc., Inc., NJ (in print).
[3.40] V. Brusic, R. IGstler, S. Wang, J. Hawkins, and C. Schmidt, in Proc. 2nd International Symp. on Chemcial Mehcanical Planarization in IC Devices Manufacturing, eds., S. Raghavan, R.L. Opila, and L. Zhang, The Electrochem. Soc., Inc., NJ (in print).
[3.41] W.L.C.M. Heyboer, G.A.C.M. Spierings, and J.E.A.M. van der Meerakker, J. Electrochem Sac., 138, 774 (1998).
[3.42] J.W. Oldfield, in Galvanic Corrosion, AST STP 978, H.P. Hack, ed., p.5, American Society for Testing and Materials, Philadelphia (1988).
[3.43] N. Parekh and J. Price, J.Electrochem. Soc., 137, 2199 (1990).
[3.44] S. Mayimii, I. Murozono, H. Nanatsue, and S. Ueda, J. Electrochem. Soc., 137, 1861 (1990).
[3.45] A.J. Grifl5n, Jr., S.E. Hernandez, F.R. Brotzen, J. D. Lawrence, J.W. McPherson, and C.F. Dunn, in 31st Annual Proceedings — Reliability Physics 1993, p. 327, lEEEE/IRPS, NY (1993).
[3.46] A.J. Griffin, Jr., S.E. Hernandez, F.R. Brotzen, and C.F. Dunn, J. Electrochem. Soc., 141, 807 (1994).
[3.47] R. B. Comizzoli, R.P. Frankenthal, K.J. Hanson, K. Konstadinidis, R.L. Opila, J. Sapjeta, J.D. Sinclair, K.M. Takahashi, A.L. Frank, and A.O. Ibidunni, Materials Science & Engineering A, A198, 153 (1995).
[3.48] J. Prasad, O.M.R. Chyan, J.-J. Chen, M. Liu, L. Chen, and F. Xu, J. Mat. Res., 12, 3241 (1997).
[3.49] D. Zeidler, Z. Stavreva, M. Plotner, and K. Drescher, Microelectronic Engineering, 37-38,237 (1997).
214
Chapter 4:
[4.1] A.M. Feltham and M. Spiro, Chemical Reviews, 71, 177 (1971).
[4.2] M.Pesez and J. Bartos, Colorimetric and Flourimetric Analysis of Organic Compoimds and Drugs, p. 302, Marcel Dekker, NY (1974).
Chapter 5:
[5.1] M. A. Fury, Solid State TechnoL, 47 (April, 1995).
[5.2] J. P. Glusker, J. A. Minkin, and A. L. Patterson, Acta Cryst., B25,1066 (1969).
[5.3] R- J. Motekaitis and A. Martell, Inorg. Chem., 23, 18 (1984).
[5.4] P.C. Hidber, T.J. Granle and L.J. Gauckler, J. Am. Ceram. Soc., 79, 1857 (1996).
[5.5] R. Kummert and W. Stumm, J. Colloid. Interf Sci., 75, 373 (1980).
[5.6] R.J. Hunter, Introduction to Modem Colloid Science, Oxford, NY (1996).
[5.7] P.W. Schindler and W. Stumm, in Aquatic Surface Chemistry, Chemical Processes at the Particle-Water Interface, ed., W. Stumm, p.83, John Wiley & Sons, NY (19987).
[5.8] W. Stunmi and G. Furrer, in Aquatic Surface Chemistry, Chemical Processes at the Particle-Water Interface, ed., W. Stumm, p. 197, John Wiley & Sons, NY (19987).
[5.9] A.T. Stone and J.J. Morgan, in Aquatic Surface Chemistry, Chemical Processes at the Particle-Water Interface, ed., W. Stumm, p.221, John Wiley & Sons, NY (19987).
[5.10] D.L. Sparks, in Soil Physical Chemistry, ed., D.L. Sparks, 2nd Ed., p. 135, CRC Press, NY (1999).
[5.11] W.L. Lindsay and P.M. Walthall, in The Environmental Chemistry of Aluminum, ed., G. Sposito, p.333, CRC Lewis Publishers, NY (1996).
215
[5.12] J. Isiaelachvili, Intermolecidar & Surface Forces, 2nd ed.. Academic Press, San Diego (1994).
Chapter 6:
[6.1] J. A. Dean, Lange's Handbook o/Chemistry (14"" ed.), p.8.54, McGraw-Hill, New York (1976).
[6.2] H. K. J. Powell and R. M. Town, Aust. J. Chem., 46, 721 (1993).
[6.3] J. A. Goedkoop and C. H. MacGillavry, Acta Cryst., 10, 125 (1957).
[6.4] M. M. Hefiiy, A.S. Mogoda and G.A. El-Mahdy, Indian J. TechnoL, 26, 395 (1988).
[6.5] E. Kneer, Ph. D. Dissertation, University of Arizona (1998).
[6.6] M.D. Sacks and T.Y. Tseng, J. Am. Ceram. Soc., 66,242 (1983).
[6.7] P.C. Hidber, T.J. Graule and L.J. Gauckler, J. Am. Ceram. Soc., 79,1857 (1996).
Chapter 7:
[7.1] W. Lee, K.J. Torek, D.A. Palsulich, and L, Weston, MRS Symp. Proc., 477, 57 (1997).
[7.2] R.M. Smith and A.E. Martell, Critical Stability Constants, vol. 4, Inorganic Complexes, Plenum Press, NY (1976).
[7.3] http://www.shef.ac. uk/chemistry/web-elements.
[7.4] J. Isiaelachvili, Intermolecular & Surface Forces, 2nd ed.. Academic E*ress, San Diego (1994).
[7.5] N. Awaya, H. Inokawa, E. Yamamoto, Y. Okazaki, M. Miyake, Y. Arita, and T. Kobayashi, IEEE Trans. Electron Devices, 43,1206 (1996).
[7.6] J.S. Jeon, private communication (1998).
216
[7.7] H. Motschi, in Aquatic Surface Chemistry, Chemical Processes at the Particle-Water Interface, ed., W. Stumm, p.l 11, John Wiley & Sons, NY (19987).
[7.8] R.R. Cohen and C.J. Radke, J. Colloid Interf. ScL, 141, 338 (1991).
[7.9] S.A. Olszowka, M.A. Manning, and A. Barkatt, Corrosion, 48,411 (1992).
[7.10] C.R. Helms and H. Park, in Proc. 3rd International Symp. Clearu Tech. Semicond. Device Manufact., eds., J. Ruzyllo and R.E. Novak, 26 (1994).
Chapter 8:
[8.1] A.J. Bard, P. Parsons, and J. Jordan, Standard Potentials in Aqueous Solutions, lUPAC, Marcel Dekker, Inc., NY (1985).
[8.2] C. Raghunath, Ph. D. Dissertation, University of Arizona (1997).
[8.3] E. Kneer, Ph. D. Dissertation, University of Arizona (1997).
[8.4] R. Carpio, J. Farkas, and R. Jairath, Thin Solid Films, 266, 238 (1995).
[8.5] Q. Luo, D.R. Campbell, and S.V. Babu, Langmuir, 12, 3563 (1996).
[8.6] V. Brusic, R. Kistler, S. Wang, J. Hawkins, and C. Schmidt, in Proc. 2nd Intematioruxl Symp. on Chemcial Mehcanical Planarization in IC Devices Manufacturing, eds., S. Raghavan, R.L. Opila, and L. Zhang, The Electrochem. Soc., Inc., NJ (in print).
[8.7] Y. Massiani, A. Medjahed, P. Gravier, L. Argeme, and L. Fedrizzi, Thin Solid Films, 191, 305 (1990).
[8.8] Y. Massiani, A. Medjahed, P. Gravier, and J.P. Crousier, Thin Solid Films, 217, 31 (1992).
[8.9] S. Chatteijee, T.S. Sudarshan, and S. Chandrashekhar, J. Mat. Sci., 27, 1989 (1992).
[8.10] D.R. Evans, in Proc. 1st International Symp. Chemical Mechanical Planarizaiton, eds. I. Ali and S. Raghavan, p. 70, The Electrochem. Soc., Inc., NJ (1997).
217
Appendix 1:
[A.I] E. Hogfeldt, Stability Constants of Metal-ion Complex. Part A: Inorganic Ligands. Pergamon, NY (1983).
IMAGE EVALUATION TEST TARGET (QA-3)
150mm
IM/IGE. Inc 1653 East Main Street Rochester. NY 14609 USA Phone; 716/462-0300 Fax: 716/288-5989
O 1993. Applied Image, Inc.. All Rignts Reserved