Embed Size (px)
Citation preview
GAO United States
General Accounting Office
Washington, D.C. 20548
Health, Education, and
Human Services Division
B-279910
May 12, 1998
The Honorable John D. DingellRanking Minority MemberCommittee on CommerceHouse of Representatives
The Honorable George E. Brown, Jr.Ranking Minority MemberCommittee on ScienceHouse of Representatives
Subject: Information Technology Workers: Employment and StartingSalaries
Industry reports and various newspaper and magazine articles predict thatsevere shortages of information technology (IT) workers could have acrippling effect on the growth of the economy. In conjunction withcosponsoring a convocation on the supply of IT workers, the U.S.Department of Commerce prepared a report intended to bring attention tothe issue and to encourage stakeholders to examine the potential forshortages and to take the necessary steps to ensure an adequate supply ofIT workers. That report, issued September 29, 1997, is titled America’s NewDeficit: The Shortage of Information Technology Workers.1 Our evaluationof the report found that, although the title implied that the Department ofCommerce found a shortage of IT workers, data and analysis contained inthe report did not support that conclusion.2 In fact, the report concludes,and we agree, that more information and data are needed to characterizethe IT labor market.
To better understand IT labor market conditions, you asked that weprovide you with information on recent trends in IT employment andstarting salaries for IT jobs. Specifically, you asked us to determine (1) theunemployment rates for workers in IT occupations, (2) the number ofworkers employed in IT industries and occupations, (3) the number ofdegrees awarded in IT fields of study, and (4) the starting salaries offeredbachelor’s degree candidates in IT jobs.
1Washington, D.C.: Department of Commerce, Office of Technology Policy.
2Information Technology: Assessment of the Department of Commerce’s Report on WorkforceDemand and Supply (GAO/HEHS-98-106R, Mar. 20, 1998).
GAO/HEHS-98-159R Information Technology EmploymentPage 1
B-279910
To answer these questions, we gathered information from three sources.Information on unemployment rates for IT workers and numbers ofworkers employed in IT occupations came from the Current PopulationSurvey (CPS) of the Bureau of Labor Statistics (BLS). The number ofworkers employed by IT companies comes from the Current EmploymentStatistics (CES) Survey and is compiled by BLS from payroll recordsreported monthly. Information on the number and types of IT degreesconferred came from the Integrated Postsecondary Education DataSystem (IPEDS) of the National Center for Education Statistics (NCES).Information on the salaries offered to bachelor’s degree candidates wasprovided by the National Association of Colleges and Employers (NACE).Although we did not independently verify the data, data from thesesources are widely used and represent the best data available. Our datasources are described in more detail in enclosure I. We performed ourwork in April 1998 in accordance with generally accepted governmentauditing standards.
In summary, unemployment rates for workers in IT occupations are wellbelow those for all workers. At 1.3 percent in 1997, the rate was less thanone-third the rate for all workers. Employment in IT industries has grownsteadily, as has employment of workers in IT occupations, which hasnearly doubled in the last decade to about 1.9 million in 1997. Despiteemployment increases averaging 90,000 jobs a year in IT occupations, thenumber of degrees awarded in IT fields of study has remained fairlyconstant throughout the 1990s at about 48,000 annually—of which about27,000 were bachelor’s degrees. Salary offers for bachelor’s degreecandidates in IT fields averaged about $37,500 in 1997—slightly higher thanthe salaries offered in 1989, after adjusting for inflation, and above thesalaries offered in the early 1990s, when starting salaries dipped to under$35,000.
Background Public attention became focused on issues relating to the IT labor marketwith the publication of a report by the Information TechnologyAssociation of America (ITAA) entitled Help Wanted: The IT Workforce Gapat the Dawn of a New Century in February 1997.3 Responding to thisreport, the National Economic Council and the Departments ofCommerce, Education, and Labor began to discuss the workforcerequirements of the IT sector. The Department of Commerce’s Office ofTechnology Policy was assigned the lead federal role in exploring the ITworker issue. The mission of the Office of Technology Policy is to work in
3Arlington, Va.: ITAA.
GAO/HEHS-98-159R Information Technology EmploymentPage 2
B-279910
partnership with the private sector to develop and advocate nationalpolicies that maximize technology’s contribution to U.S. economic growth,the creation of high-wage jobs, and improvements in our quality of life.The Department of Commerce’s report, America’s New Deficit: TheShortage of Information Technology Workers, examined the potential forshortages of IT workers.
BLS estimates, on the basis of surveys conducted for the OccupationalEmployment Statistics program and the CPS, that between 1996 and 2006the United States will require about 1.3 million additional IT workers as aresult of job growth and the replacement of workers who leave the field.Although there is no single, universally accepted definition of theoccupations that should be designated as IT occupations, we used theoccupations for which BLS collects data—computer programmers, systemsanalysts, computer scientists, and computer engineers4—and the widelyused IT industry definition—Standard Industry Classification (SIC) 737,computer and data processing services.5
Unemployment Ratesfor IT Workers
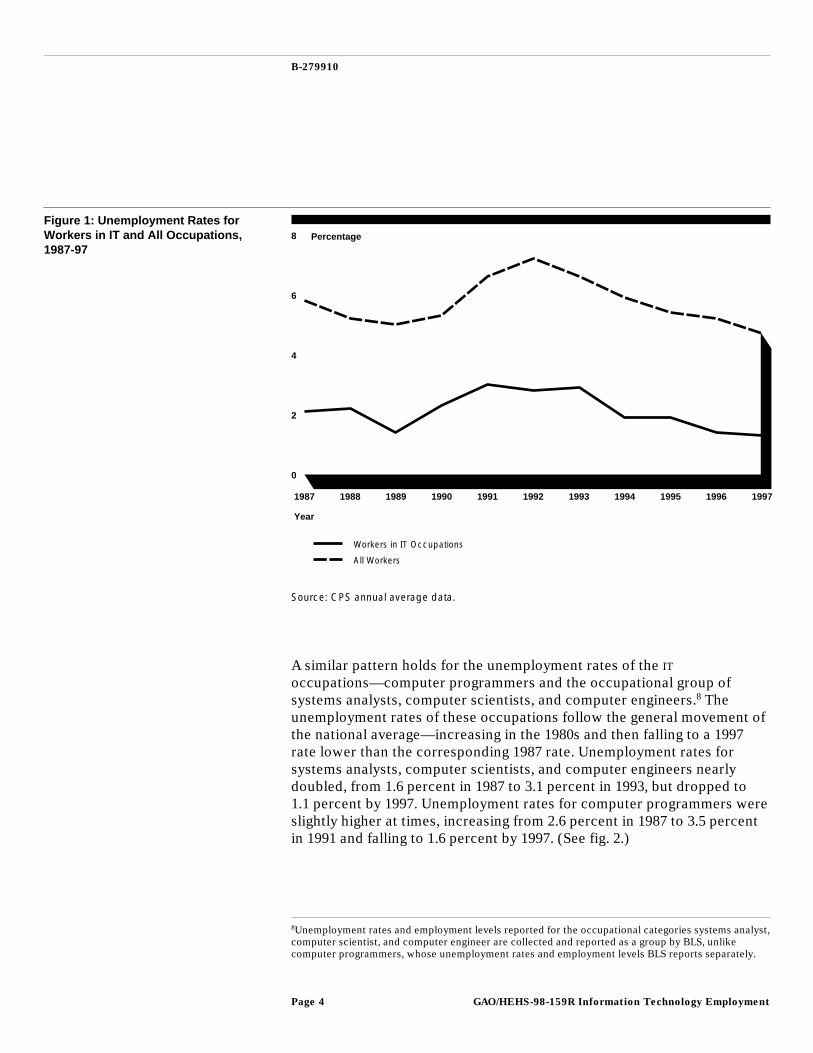
Unemployment rates for IT workers are well below the national averagefor all workers,6 but changes in these rates closely followed themovements of annual average unemployment rates for all workers from1987 through 1997.7 The unemployment rate for IT workers generallyincreased in the late 1980s, peaking at 3 percent in 1991 and falling to1.3 percent in 1997. Unemployment for all workers was 2 to 3 times greaterthan for IT workers, reaching 7.2 percent in 1992 and falling to 4.7 percentin 1997. (See fig. 1.)
4BLS descriptions of these occupations follow: (1) computer programmers write and maintain thedetailed instructions, called “programs” or “software,” that list in logical order the steps thatcomputers must execute to perform their functions; (2) systems analysts use their knowledge andskills in a problem-solving capacity, implementing the means for computer technology to meet theindividual needs of an organization; (3) computer scientists generally design computers and conductresearch to improve their design or use and develop and adapt principles for applying computers tonew uses; and (4) computer engineers work with the hardware and software aspects of systems designand development.
5BLS describes this industry as providing everything related to commercial computer use, from rentingand repairing personal computers to designing or installing an entire system; from developingpackaged software to writing customized programs; from integrating and reengineering systems tonetworking and data processing; from managing data bases to operating an entire computer facility.
6The unemployment rates for professional specialty occupations are also well below the nationalaverage for all workers and follow a pattern similar to those for IT occupations. See encl. II.
7Unemployment rates are presented for wage and salary workers. Detailed data tables are presented inencl. II.
GAO/HEHS-98-159R Information Technology EmploymentPage 3
B-279910
Figure 1: Unemployment Rates forWorkers in IT and All Occupations,1987-97
Percentage
0
2
4
6
8
1987 1988 1989 1990 1991 1992 1993 1994 1995 1996 1997
Year
Workers in IT Occupations
All Workers
Source: CPS annual average data.
A similar pattern holds for the unemployment rates of the IToccupations—computer programmers and the occupational group ofsystems analysts, computer scientists, and computer engineers.8 Theunemployment rates of these occupations follow the general movement ofthe national average—increasing in the 1980s and then falling to a 1997rate lower than the corresponding 1987 rate. Unemployment rates forsystems analysts, computer scientists, and computer engineers nearlydoubled, from 1.6 percent in 1987 to 3.1 percent in 1993, but dropped to1.1 percent by 1997. Unemployment rates for computer programmers wereslightly higher at times, increasing from 2.6 percent in 1987 to 3.5 percentin 1991 and falling to 1.6 percent by 1997. (See fig. 2.)
8Unemployment rates and employment levels reported for the occupational categories systems analyst,computer scientist, and computer engineer are collected and reported as a group by BLS, unlikecomputer programmers, whose unemployment rates and employment levels BLS reports separately.
GAO/HEHS-98-159R Information Technology EmploymentPage 4

B-279910
Figure 2: Unemployment Rates forWorkers in IT Occupations, 1987-97 Percentage
0
2
4
6
8
1987 1988 1989 1990 1991 1992 1993 1994 1995 1996 1997
Year
System Analyst, Computer Scientist & Engineer
Computer Programmer
Source: CPS annual average data.
IT Employment IT-related employment includes workers employed by IT companies (the ITindustry) and workers employed in IT occupations. We present informationon IT-related employment in two ways. First, we present information onthe number of workers employed in the IT industry, whether in IToccupations or in other jobs.9 Second, we present information on thenumber of workers employed in IT occupations whether in the IT industryor in other industries.
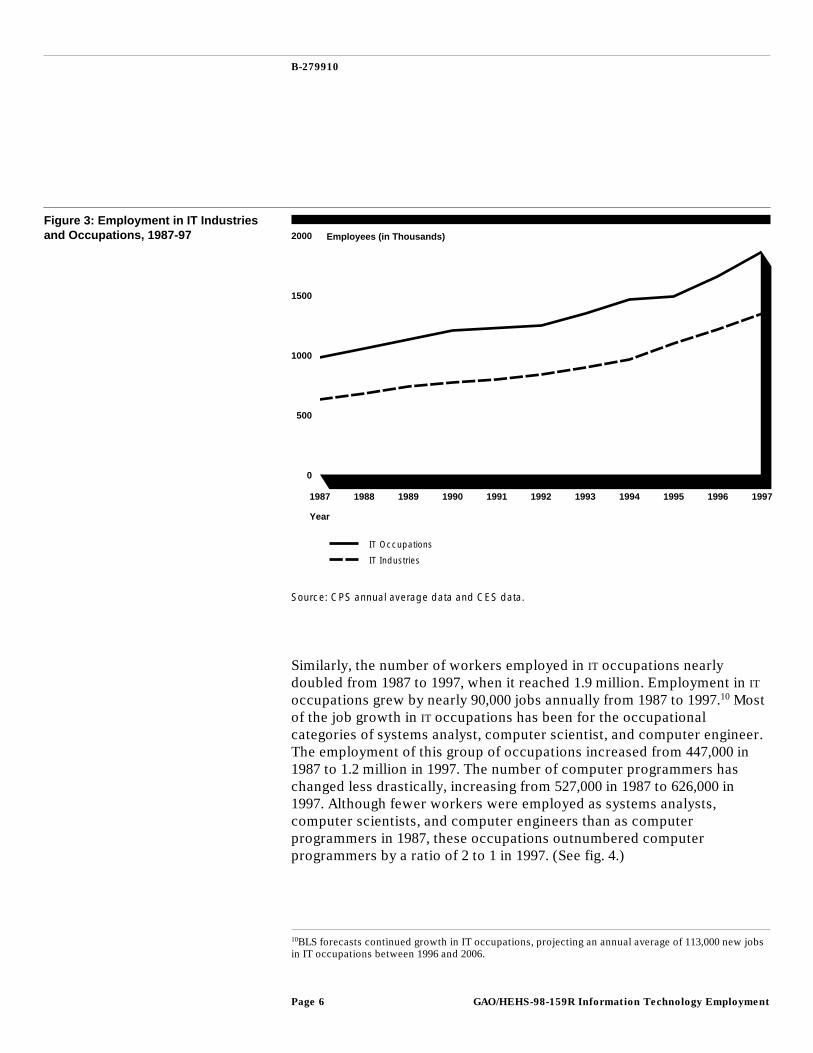
The number of workers employed in the IT industry grew steadily from1987 to 1997. Total employment in the IT industry more than doubled from628,600 in 1987 to 1.34 million in 1997. (See fig. 3.)
9We use the IT industry to refer to companies in SIC 737, computer and data processing services, awidely used definition for the IT industry. Industry employment is reported for wage and salaryworkers.
GAO/HEHS-98-159R Information Technology EmploymentPage 5
B-279910
Figure 3: Employment in IT Industriesand Occupations, 1987-97 Employees (in Thousands)
0
500
1000
1500
2000
1987 1988 1989 1990 1991 1992 1993 1994 1995 1996 1997
Year
IT Occupations
IT Industries
Source: CPS annual average data and CES data.
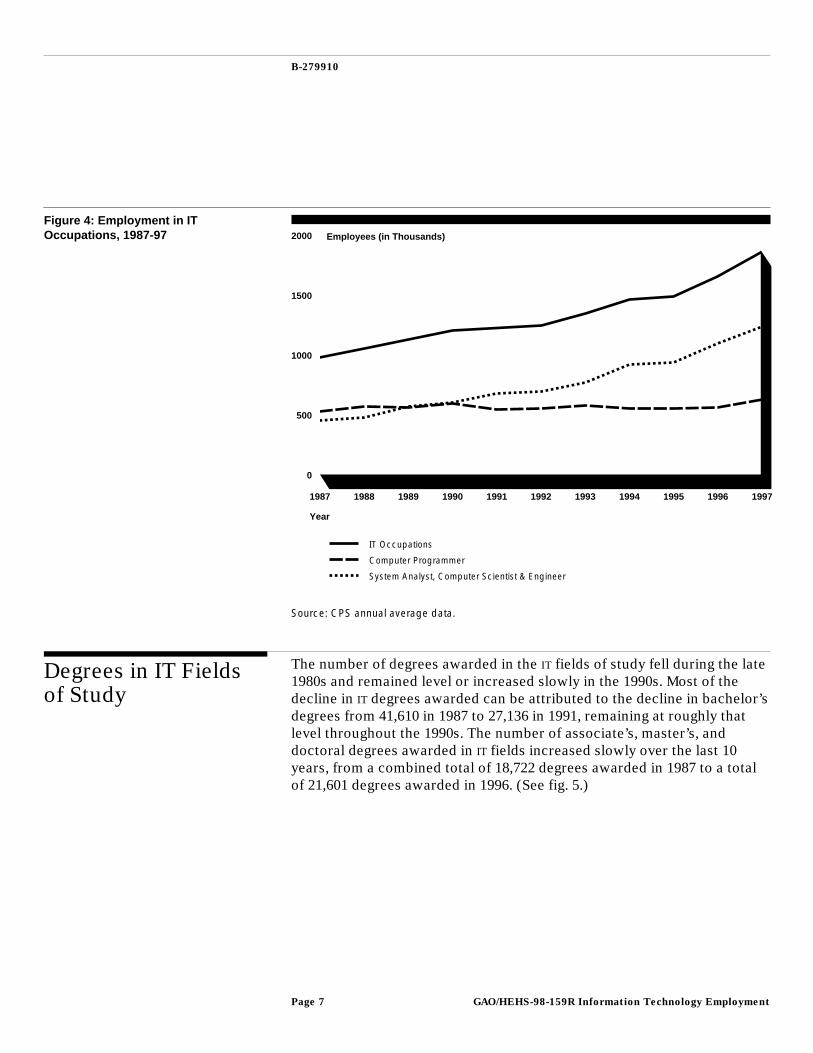
Similarly, the number of workers employed in IT occupations nearlydoubled from 1987 to 1997, when it reached 1.9 million. Employment in IToccupations grew by nearly 90,000 jobs annually from 1987 to 1997.10 Mostof the job growth in IT occupations has been for the occupationalcategories of systems analyst, computer scientist, and computer engineer.The employment of this group of occupations increased from 447,000 in1987 to 1.2 million in 1997. The number of computer programmers haschanged less drastically, increasing from 527,000 in 1987 to 626,000 in1997. Although fewer workers were employed as systems analysts,computer scientists, and computer engineers than as computerprogrammers in 1987, these occupations outnumbered computerprogrammers by a ratio of 2 to 1 in 1997. (See fig. 4.)
10BLS forecasts continued growth in IT occupations, projecting an annual average of 113,000 new jobsin IT occupations between 1996 and 2006.
GAO/HEHS-98-159R Information Technology EmploymentPage 6
B-279910
Figure 4: Employment in ITOccupations, 1987-97 Employees (in Thousands)
0
500
1000
1500
2000
1987 1988 1989 1990 1991 1992 1993 1994 1995 1996 1997
Year
IT Occupations
Computer Programmer
System Analyst, Computer Scientist & Engineer
Source: CPS annual average data.
Degrees in IT Fieldsof Study
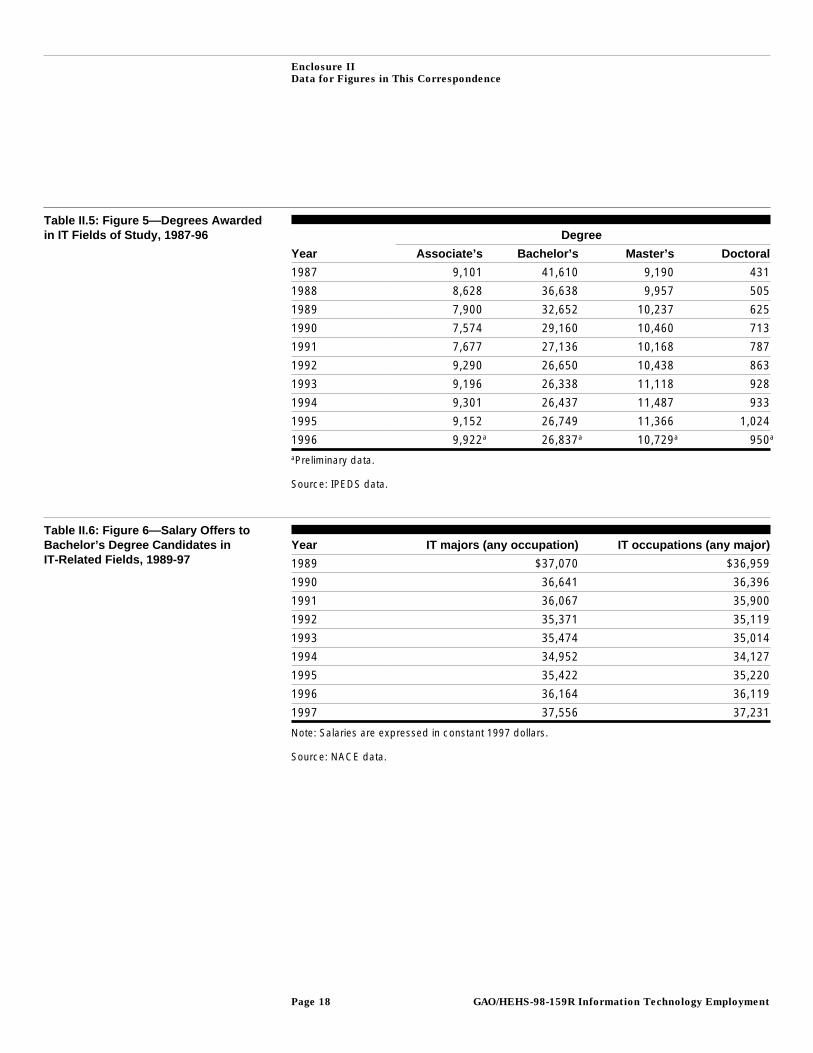
The number of degrees awarded in the IT fields of study fell during the late1980s and remained level or increased slowly in the 1990s. Most of thedecline in IT degrees awarded can be attributed to the decline in bachelor’sdegrees from 41,610 in 1987 to 27,136 in 1991, remaining at roughly thatlevel throughout the 1990s. The number of associate’s, master’s, anddoctoral degrees awarded in IT fields increased slowly over the last 10years, from a combined total of 18,722 degrees awarded in 1987 to a totalof 21,601 degrees awarded in 1996. (See fig. 5.)
GAO/HEHS-98-159R Information Technology EmploymentPage 7

B-279910
Figure 5: Degrees Awarded in IT Fieldsof Study, 1987-96 Degrees
0
10000
20000
30000
40000
50000
60000
70000
1987 1988 1989 1990 1991 1992 1993 1994 1995 1996
Year
Doctoral
Master’s
Associate’s
Bachelor’s
Source: IPEDS data.
Salary Offers in ITFields
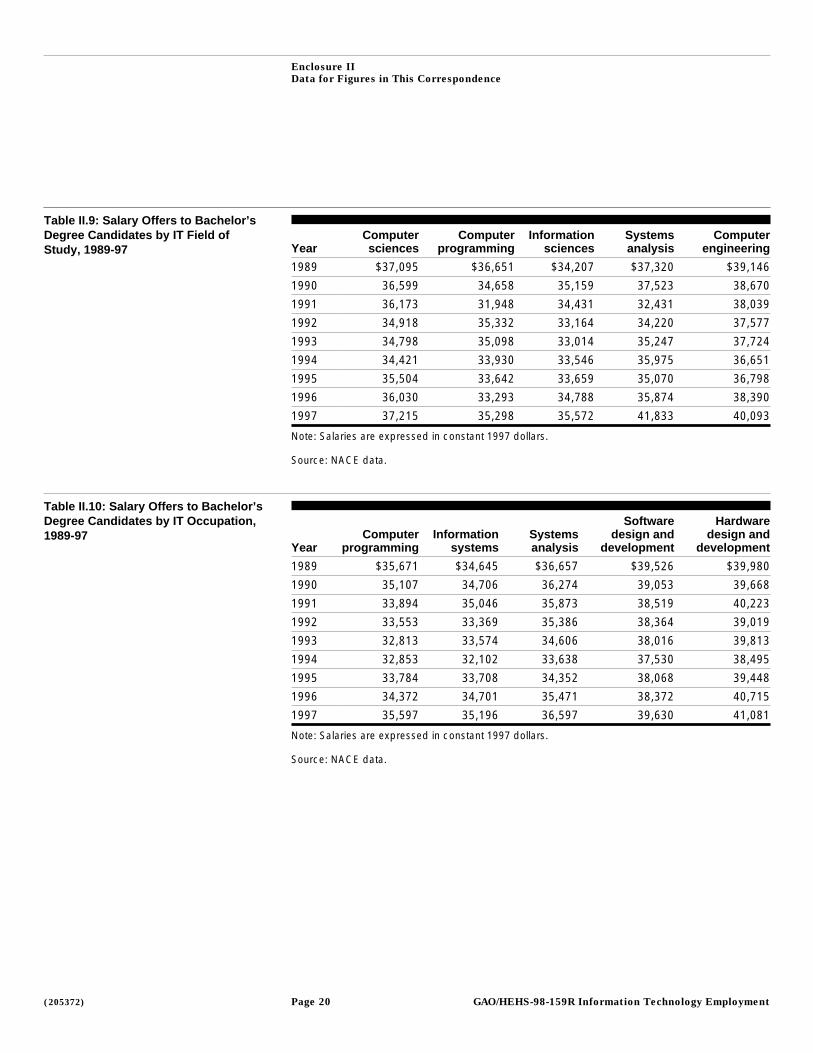
We present information on starting salaries for bachelor’s degreecandidates in two ways. First, we present information on salaries offeredto degree candidates majoring in IT fields of study. This includes bachelor’sdegrees in computer science, computer programming, informationsciences, systems analysis, and computer engineering. Not all startingsalaries offered to degree candidates majoring in IT fields are foremployment in IT occupations. Second, we present information on salariesoffered to degree candidates for employment in IT occupations. Theseoccupations include computer programming, information systems,systems analysis and design, software design and developmentengineering, and hardware design and development engineering. Not allstarting salaries offered to degree candidates for employment in IToccupations are for degree candidates majoring in IT fields.
GAO/HEHS-98-159R Information Technology EmploymentPage 8
B-279910
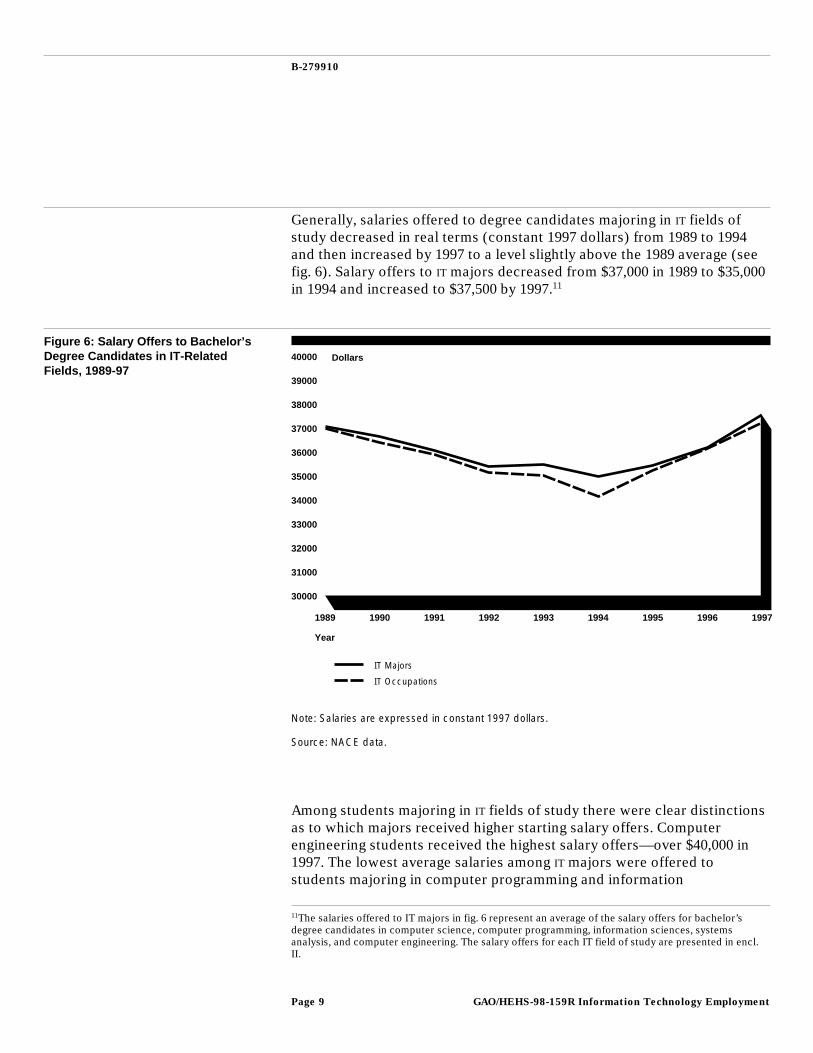
Generally, salaries offered to degree candidates majoring in IT fields ofstudy decreased in real terms (constant 1997 dollars) from 1989 to 1994and then increased by 1997 to a level slightly above the 1989 average (seefig. 6). Salary offers to IT majors decreased from $37,000 in 1989 to $35,000in 1994 and increased to $37,500 by 1997.11
Figure 6: Salary Offers to Bachelor’sDegree Candidates in IT-RelatedFields, 1989-97
Dollars
30000
31000
32000
33000
34000
35000
36000
37000
38000
39000
40000
1989 1990 1991 1992 1993 1994 1995 1996 1997
Year
IT Majors
IT Occupations
Note: Salaries are expressed in constant 1997 dollars.
Source: NACE data.
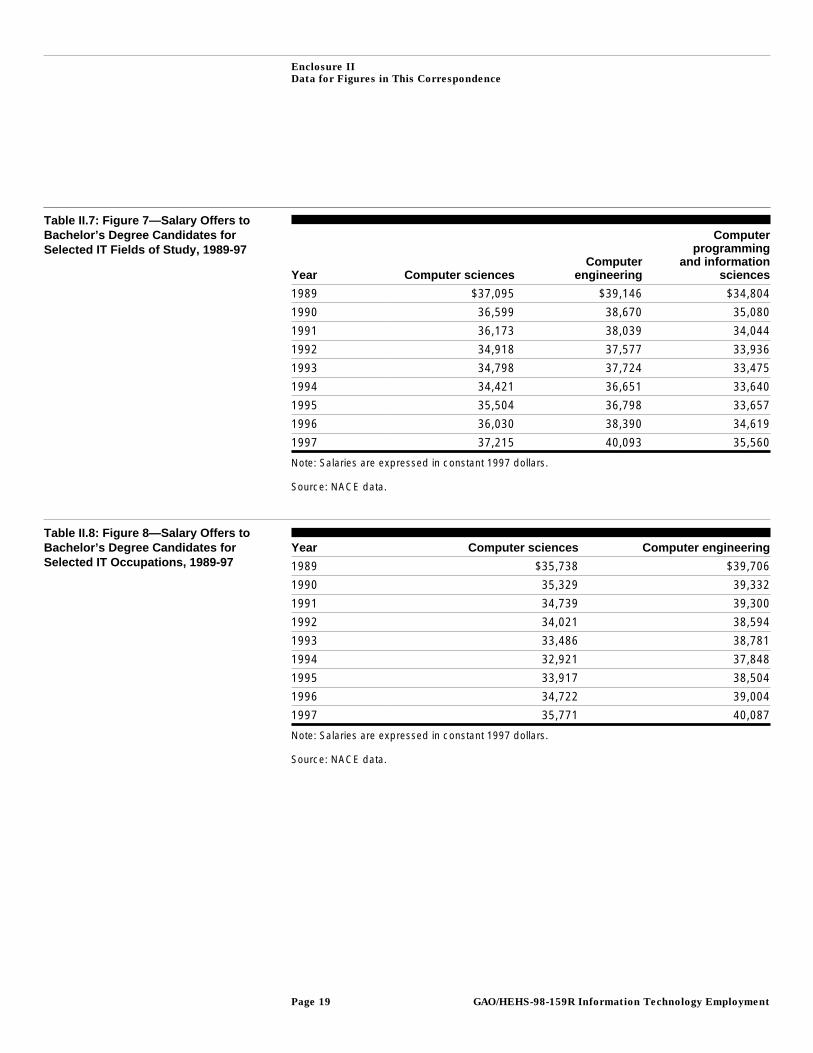
Among students majoring in IT fields of study there were clear distinctionsas to which majors received higher starting salary offers. Computerengineering students received the highest salary offers—over $40,000 in1997. The lowest average salaries among IT majors were offered tostudents majoring in computer programming and information
11The salaries offered to IT majors in fig. 6 represent an average of the salary offers for bachelor’sdegree candidates in computer science, computer programming, information sciences, systemsanalysis, and computer engineering. The salary offers for each IT field of study are presented in encl.II.
GAO/HEHS-98-159R Information Technology EmploymentPage 9

B-279910
sciences—roughly $35,600 in 1997.12 Computer sciences majors receivedsalary offers consistently between those of computer engineers andprogrammers—about $37,200 in 1997. (See fig. 7.)
Figure 7: Salary Offers to Bachelor’sDegree Candidates for Selected ITFields of Study, 1989-97
Dollars
30000
31000
32000
33000
34000
35000
36000
37000
38000
39000
40000
41000
1989 1990 1991 1992 1993 1994 1995 1996 1997
Year
Computer Sciences
Computer Engineering
Computer Programming and Information Sciences
Note: Salaries are expressed in constant 1997 dollars.
Source: NACE data.
Salaries offered to bachelor’s degree candidates for employment in IToccupations, regardless of major, decreased in real terms (constant 1997dollars) from 1989 to 1994, increasing in 1997 to a level slightly above the1989 average. Offers for IT jobs to recent graduates, regardless of theirfield of study, decreased from $37,000 in 1989 to $34,100 in 1994 and
12The salary offers reported for computer programming and information sciences represent an averageof the salaries offered to each major. The separate salary offers are reported in encl. II.
GAO/HEHS-98-159R Information Technology EmploymentPage 10

B-279910
increased to $37,200 by 1997.13 Regardless of major, graduates withcomputer engineering job offers received the highest IT salary offers—over$40,000 in 1997. (See fig. 8.)
Figure 8: Salary Offers to Bachelor’sDegree Candidates for Selected ITOccupations, 1989-97
Dollars
30000
31000
32000
33000
34000
35000
36000
37000
38000
39000
40000
41000
1989 1990 1991 1992 1993 1994 1995 1996 1997
Year
Computer Sciences
Computer Engineering
Notes: “Computer sciences” combines salary offers for jobs in computer programming,information systems, and systems analysis and design. “Computer engineering” combines salaryoffers for jobs in design and development for both hardware and software.
Salaries are expressed in constant 1997 dollars.
Source: NACE data.
13The salaries offered to degree candidates for employment in IT occupations reported in fig. 6represent an average of the salaries offered to degree candidates for employment in computerprogramming, information systems, systems analysis and design, software design and developmentengineering, and hardware design and development engineering. Salaries for the separate fields arepresented in encl. II.
GAO/HEHS-98-159R Information Technology EmploymentPage 11
B-279910
As agreed with your offices, unless you publicly announce its contentsearlier, we plan no further distribution of this correspondence until 7 daysfrom its issue date. At that time, we will send copies to the Chairmen,House Committees on Commerce and Science. Copies will also be madeavailable to others upon request.
If you have any questions about this correspondence, please contact me at(202) 512-7014. Staff who made major contributions to this work includeSigurd R. Nilsen, Assistant Director, and Gene Kuehneman, SeniorEconomist.
Carlotta C. JoynerDirector, Education and Employment Issues
Enclosures - 2
GAO/HEHS-98-159R Information Technology EmploymentPage 12

GAO/HEHS-98-159R Information Technology EmploymentPage 13
Enclosure I
Data Sources
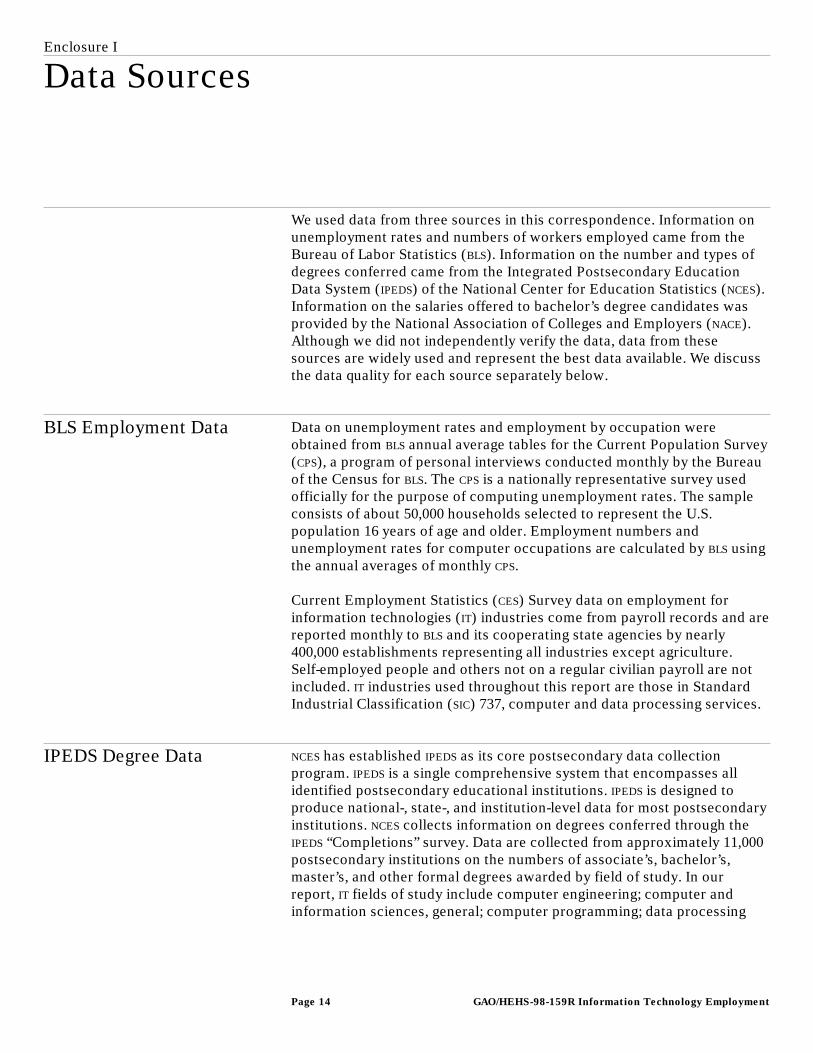
We used data from three sources in this correspondence. Information onunemployment rates and numbers of workers employed came from theBureau of Labor Statistics (BLS). Information on the number and types ofdegrees conferred came from the Integrated Postsecondary EducationData System (IPEDS) of the National Center for Education Statistics (NCES).Information on the salaries offered to bachelor’s degree candidates wasprovided by the National Association of Colleges and Employers (NACE).Although we did not independently verify the data, data from thesesources are widely used and represent the best data available. We discussthe data quality for each source separately below.
BLS Employment Data Data on unemployment rates and employment by occupation wereobtained from BLS annual average tables for the Current Population Survey(CPS), a program of personal interviews conducted monthly by the Bureauof the Census for BLS. The CPS is a nationally representative survey usedofficially for the purpose of computing unemployment rates. The sampleconsists of about 50,000 households selected to represent the U.S.population 16 years of age and older. Employment numbers andunemployment rates for computer occupations are calculated by BLS usingthe annual averages of monthly CPS.
Current Employment Statistics (CES) Survey data on employment forinformation technologies (IT) industries come from payroll records and arereported monthly to BLS and its cooperating state agencies by nearly400,000 establishments representing all industries except agriculture.Self-employed people and others not on a regular civilian payroll are notincluded. IT industries used throughout this report are those in StandardIndustrial Classification (SIC) 737, computer and data processing services.
IPEDS Degree Data NCES has established IPEDS as its core postsecondary data collectionprogram. IPEDS is a single comprehensive system that encompasses allidentified postsecondary educational institutions. IPEDS is designed toproduce national-, state-, and institution-level data for most postsecondaryinstitutions. NCES collects information on degrees conferred through theIPEDS “Completions” survey. Data are collected from approximately 11,000postsecondary institutions on the numbers of associate’s, bachelor’s,master’s, and other formal degrees awarded by field of study. In ourreport, IT fields of study include computer engineering; computer andinformation sciences, general; computer programming; data processing
GAO/HEHS-98-159R Information Technology EmploymentPage 14
Enclosure I
Data Sources
technology/technician; information science and systems; computersystems analysis; and other computer and information sciences.
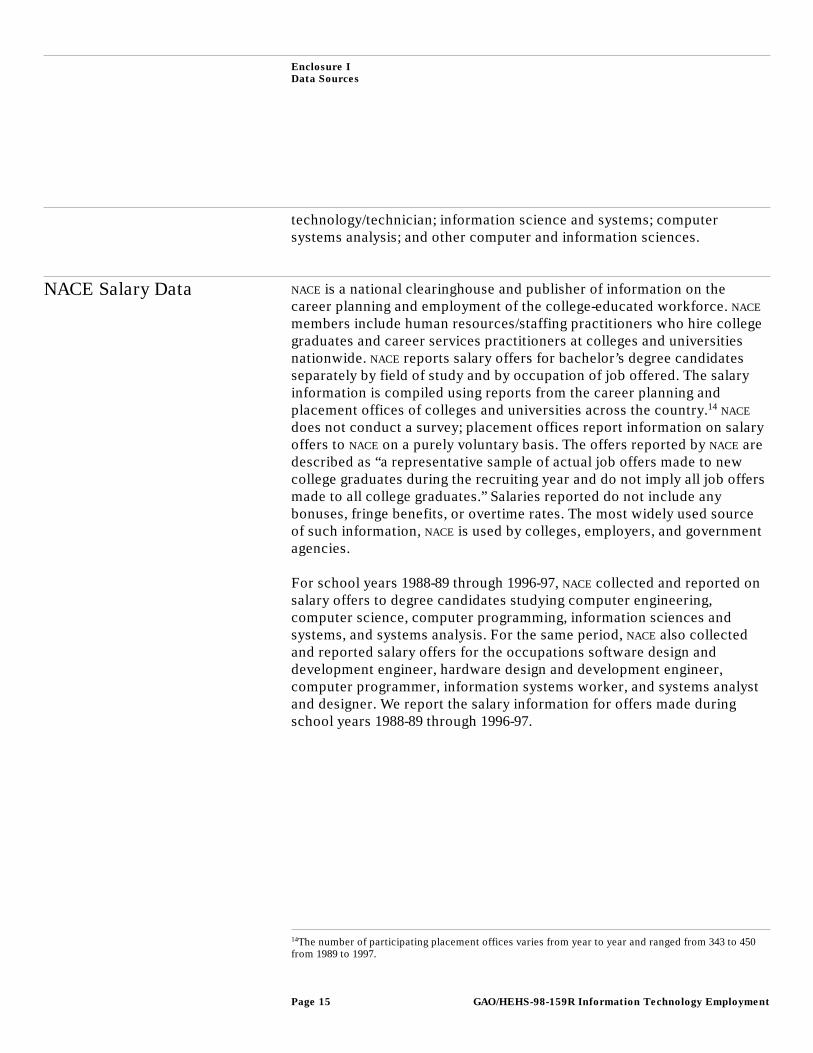
NACE Salary Data NACE is a national clearinghouse and publisher of information on thecareer planning and employment of the college-educated workforce. NACE
members include human resources/staffing practitioners who hire collegegraduates and career services practitioners at colleges and universitiesnationwide. NACE reports salary offers for bachelor’s degree candidatesseparately by field of study and by occupation of job offered. The salaryinformation is compiled using reports from the career planning andplacement offices of colleges and universities across the country.14 NACE
does not conduct a survey; placement offices report information on salaryoffers to NACE on a purely voluntary basis. The offers reported by NACE aredescribed as “a representative sample of actual job offers made to newcollege graduates during the recruiting year and do not imply all job offersmade to all college graduates.” Salaries reported do not include anybonuses, fringe benefits, or overtime rates. The most widely used sourceof such information, NACE is used by colleges, employers, and governmentagencies.
For school years 1988-89 through 1996-97, NACE collected and reported onsalary offers to degree candidates studying computer engineering,computer science, computer programming, information sciences andsystems, and systems analysis. For the same period, NACE also collectedand reported salary offers for the occupations software design anddevelopment engineer, hardware design and development engineer,computer programmer, information systems worker, and systems analystand designer. We report the salary information for offers made duringschool years 1988-89 through 1996-97.
14The number of participating placement offices varies from year to year and ranged from 343 to 450from 1989 to 1997.
GAO/HEHS-98-159R Information Technology EmploymentPage 15
Enclosure II
Data for Figures in This Correspondence
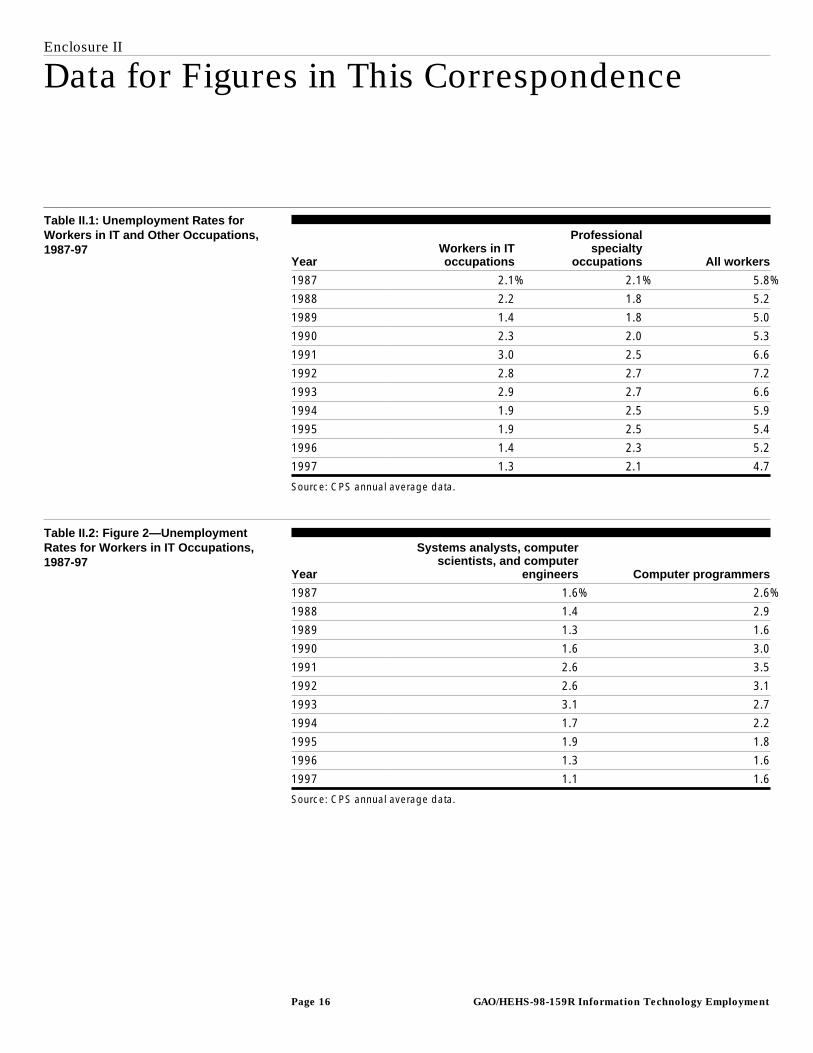
Table II.1: Unemployment Rates forWorkers in IT and Other Occupations,1987-97
YearWorkers in IToccupations
Professionalspecialty
occupations All workers
1987 2.1% 2.1% 5.8%
1988 2.2 1.8 5.2
1989 1.4 1.8 5.0
1990 2.3 2.0 5.3
1991 3.0 2.5 6.6
1992 2.8 2.7 7.2
1993 2.9 2.7 6.6
1994 1.9 2.5 5.9
1995 1.9 2.5 5.4
1996 1.4 2.3 5.2
1997 1.3 2.1 4.7
Source: CPS annual average data.
Table II.2: Figure 2—UnemploymentRates for Workers in IT Occupations,1987-97
Year
Systems analysts, computerscientists, and computer
engineers Computer programmers
1987 1.6% 2.6%
1988 1.4 2.9
1989 1.3 1.6
1990 1.6 3.0
1991 2.6 3.5
1992 2.6 3.1
1993 3.1 2.7
1994 1.7 2.2
1995 1.9 1.8
1996 1.3 1.6
1997 1.1 1.6
Source: CPS annual average data.
GAO/HEHS-98-159R Information Technology EmploymentPage 16
Enclosure II
Data for Figures in This Correspondence
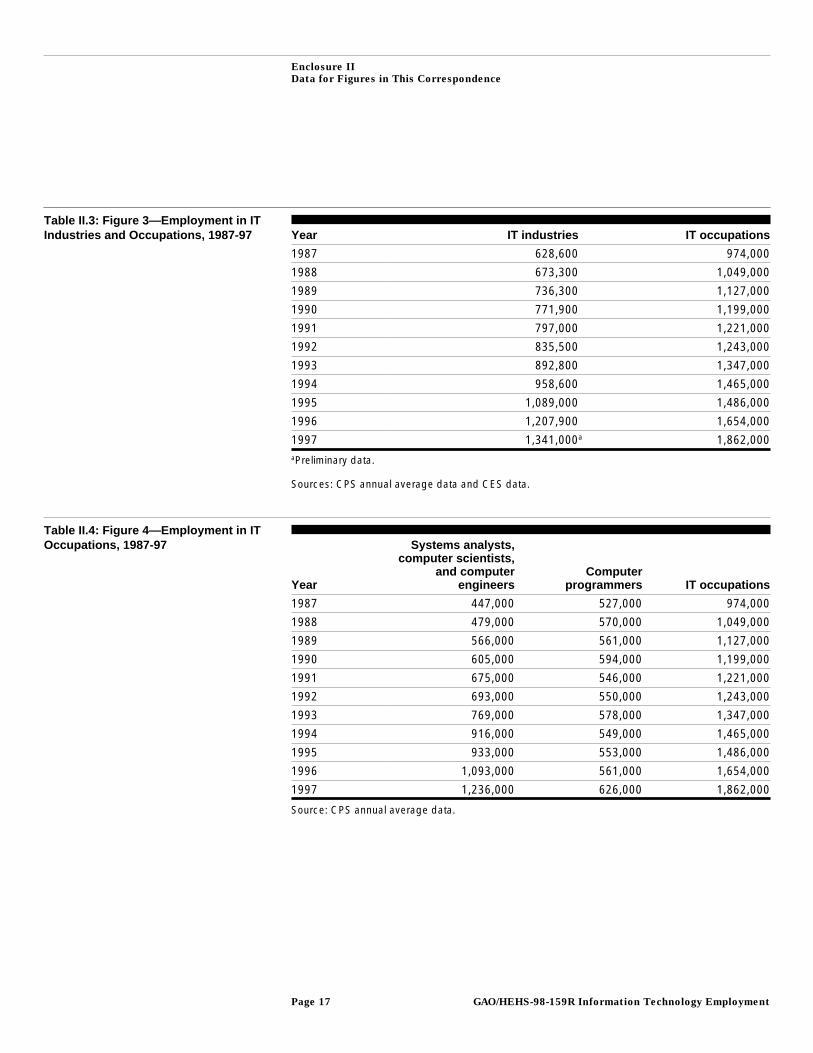
Table II.3: Figure 3—Employment in ITIndustries and Occupations, 1987-97 Year IT industries IT occupations
1987 628,600 974,000
1988 673,300 1,049,000
1989 736,300 1,127,000
1990 771,900 1,199,000
1991 797,000 1,221,000
1992 835,500 1,243,000
1993 892,800 1,347,000
1994 958,600 1,465,000
1995 1,089,000 1,486,000
1996 1,207,900 1,654,000
1997 1,341,000a 1,862,000aPreliminary data.
Sources: CPS annual average data and CES data.
Table II.4: Figure 4—Employment in ITOccupations, 1987-97
Year
Systems analysts,computer scientists,
and computerengineers
Computerprogrammers IT occupations
1987 447,000 527,000 974,000
1988 479,000 570,000 1,049,000
1989 566,000 561,000 1,127,000
1990 605,000 594,000 1,199,000
1991 675,000 546,000 1,221,000
1992 693,000 550,000 1,243,000
1993 769,000 578,000 1,347,000
1994 916,000 549,000 1,465,000
1995 933,000 553,000 1,486,000
1996 1,093,000 561,000 1,654,000
1997 1,236,000 626,000 1,862,000
Source: CPS annual average data.
GAO/HEHS-98-159R Information Technology EmploymentPage 17
Enclosure II
Data for Figures in This Correspondence
Table II.5: Figure 5—Degrees Awardedin IT Fields of Study, 1987-96 Degree
Year Associate’s Bachelor’s Master’s Doctoral
1987 9,101 41,610 9,190 431
1988 8,628 36,638 9,957 505
1989 7,900 32,652 10,237 625
1990 7,574 29,160 10,460 713
1991 7,677 27,136 10,168 787
1992 9,290 26,650 10,438 863
1993 9,196 26,338 11,118 928
1994 9,301 26,437 11,487 933
1995 9,152 26,749 11,366 1,024
1996 9,922a 26,837a 10,729a 950a
aPreliminary data.
Source: IPEDS data.
Table II.6: Figure 6—Salary Offers toBachelor’s Degree Candidates inIT-Related Fields, 1989-97
Year IT majors (any occupation) IT occupations (any major)
1989 $37,070 $36,959
1990 36,641 36,396
1991 36,067 35,900
1992 35,371 35,119
1993 35,474 35,014
1994 34,952 34,127
1995 35,422 35,220
1996 36,164 36,119
1997 37,556 37,231
Note: Salaries are expressed in constant 1997 dollars.
Source: NACE data.
GAO/HEHS-98-159R Information Technology EmploymentPage 18
Enclosure II
Data for Figures in This Correspondence
Table II.7: Figure 7—Salary Offers toBachelor’s Degree Candidates forSelected IT Fields of Study, 1989-97
Year Computer sciencesComputer
engineering
Computerprogramming
and informationsciences
1989 $37,095 $39,146 $34,804
1990 36,599 38,670 35,080
1991 36,173 38,039 34,044
1992 34,918 37,577 33,936
1993 34,798 37,724 33,475
1994 34,421 36,651 33,640
1995 35,504 36,798 33,657
1996 36,030 38,390 34,619
1997 37,215 40,093 35,560
Note: Salaries are expressed in constant 1997 dollars.
Source: NACE data.
Table II.8: Figure 8—Salary Offers toBachelor’s Degree Candidates forSelected IT Occupations, 1989-97
Year Computer sciences Computer engineering
1989 $35,738 $39,706
1990 35,329 39,332
1991 34,739 39,300
1992 34,021 38,594
1993 33,486 38,781
1994 32,921 37,848
1995 33,917 38,504
1996 34,722 39,004
1997 35,771 40,087
Note: Salaries are expressed in constant 1997 dollars.
Source: NACE data.
GAO/HEHS-98-159R Information Technology EmploymentPage 19
Enclosure II
Data for Figures in This Correspondence
Table II.9: Salary Offers to Bachelor’sDegree Candidates by IT Field ofStudy, 1989-97 Year
Computersciences
Computerprogramming
Informationsciences
Systemsanalysis
Computerengineering
1989 $37,095 $36,651 $34,207 $37,320 $39,146
1990 36,599 34,658 35,159 37,523 38,670
1991 36,173 31,948 34,431 32,431 38,039
1992 34,918 35,332 33,164 34,220 37,577
1993 34,798 35,098 33,014 35,247 37,724
1994 34,421 33,930 33,546 35,975 36,651
1995 35,504 33,642 33,659 35,070 36,798
1996 36,030 33,293 34,788 35,874 38,390
1997 37,215 35,298 35,572 41,833 40,093
Note: Salaries are expressed in constant 1997 dollars.
Source: NACE data.
Table II.10: Salary Offers to Bachelor’sDegree Candidates by IT Occupation,1989-97
YearComputer
programmingInformation
systemsSystemsanalysis
Softwaredesign and
development
Hardwaredesign and
development
1989 $35,671 $34,645 $36,657 $39,526 $39,980
1990 35,107 34,706 36,274 39,053 39,668
1991 33,894 35,046 35,873 38,519 40,223
1992 33,553 33,369 35,386 38,364 39,019
1993 32,813 33,574 34,606 38,016 39,813
1994 32,853 32,102 33,638 37,530 38,495
1995 33,784 33,708 34,352 38,068 39,448
1996 34,372 34,701 35,471 38,372 40,715
1997 35,597 35,196 36,597 39,630 41,081
Note: Salaries are expressed in constant 1997 dollars.
Source: NACE data.
(205372) GAO/HEHS-98-159R Information Technology EmploymentPage 20

Ordering Information
The first copy of each GAO report and testimony is free.
Additional copies are $2 each. Orders should be sent to the
following address, accompanied by a check or money order
made out to the Superintendent of Documents, when
necessary. VISA and MasterCard credit cards are accepted, also.
Orders for 100 or more copies to be mailed to a single address
are discounted 25 percent.
Orders by mail:
U.S. General Accounting Office
P.O. Box 37050
Washington, DC 20013
or visit:
Room 1100
700 4th St. NW (corner of 4th and G Sts. NW)
U.S. General Accounting Office
Washington, DC
Orders may also be placed by calling (202) 512-6000
or by using fax number (202) 512-6061, or TDD (202) 512-2537.
Each day, GAO issues a list of newly available reports and
testimony. To receive facsimile copies of the daily list or any
list from the past 30 days, please call (202) 512-6000 using a
touchtone phone. A recorded menu will provide information on
how to obtain these lists.
For information on how to access GAO reports on the INTERNET,
send an e-mail message with "info" in the body to:
or visit GAO’s World Wide Web Home Page at:
http://www.gao.gov
PRINTED ON RECYCLED PAPER

United StatesGeneral Accounting OfficeWashington, D.C. 20548-0001
Official BusinessPenalty for Private Use $300
Address Correction Requested
Bulk RatePostage & Fees Paid
GAOPermit No. G100