Embed Size (px)
Citation preview
Information Technology SectorPresentation By:Lauren IrwinDavid KlinkZachary KramerSteve MeechanJie Meng
Agenda
• Overview• Business Analysis• Economic Analysis• Financial Analysis• Valuation• Recommendation
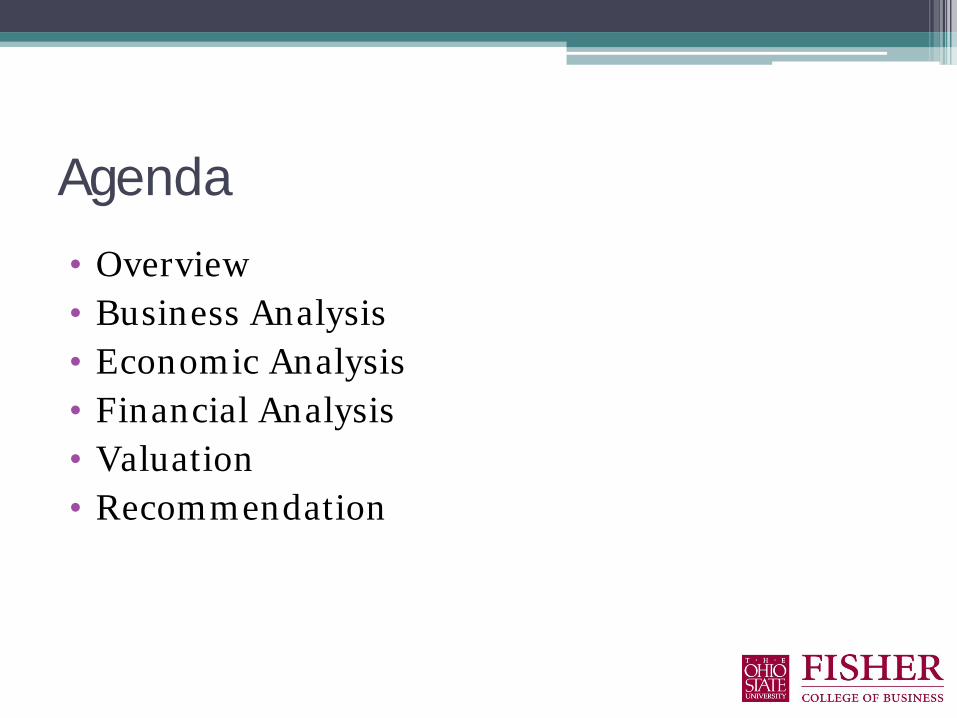
OverviewSector Market Cap
Energy 1,519,244.02
Materials 439,069.81
Industrials 1,326,284.14
Cons Disc 1,277,817.12
Cons Staples 1,280,016.64
Health Care 1,401,420.16
Financials 1,763,772.85
Info Tech 2,174,726.78
Telecom Svc 363,863.30
Utilities 404,565.98
10.69%
10.71%
12.71%
14.76%
11.73%
11.10%
18.20%
3.67%
3.04%3.39%
S&P 500 by Sector
Cons DiscCons StaplesEnergyFinancialsHealth CareIndustrialsInfo TechMaterialsTelecom SvcUtilities
As of July 14, 2011
Source: http://www.standardandpoors.com/indices/sp-500/en/us/?indexId=spusa-500-usduf--p-us-l--
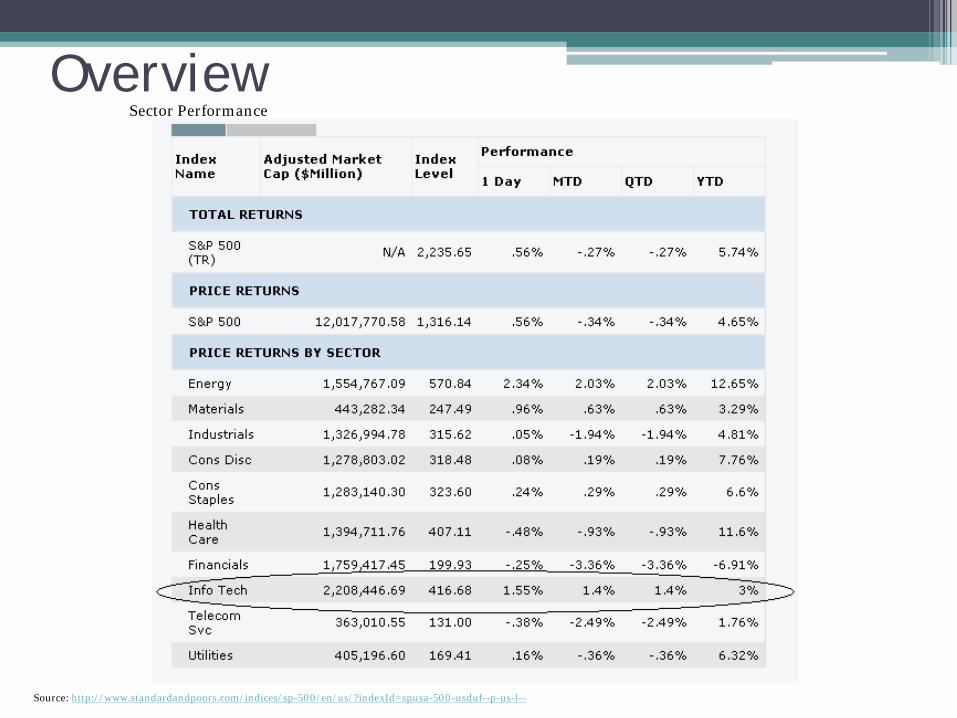
Overview Sector Performance
Source: http://www.standardandpoors.com/indices/sp-500/en/us/?indexId=spusa-500-usduf--p-us-l--

Overview
Sector S&P 500 Weight
SIM Weight +/-
Consumer Discretionary 10.69% 10.56% -.13%
Consumer Staples 10.80% 8.48% -2.32%
Energy 12.65% 10.45% -2.19%
Financials 15.22% 13.39% -1.83%
Health Care 11.66% 10.76% -.89%
Industrials 11.03% 11.03% -.01%
Information Technology 17.97% 22.35% 4.38%
Materials 3.60% 3.14% -.45%
Telecommunication Services 3.07% 4.42% 1.35%
Utilities 3.33% 2.37% -.96%
Cash 0.00% 2.81% 2.81%
Dividend Receivables 0.00% .25% .25%
SIM Portfolio
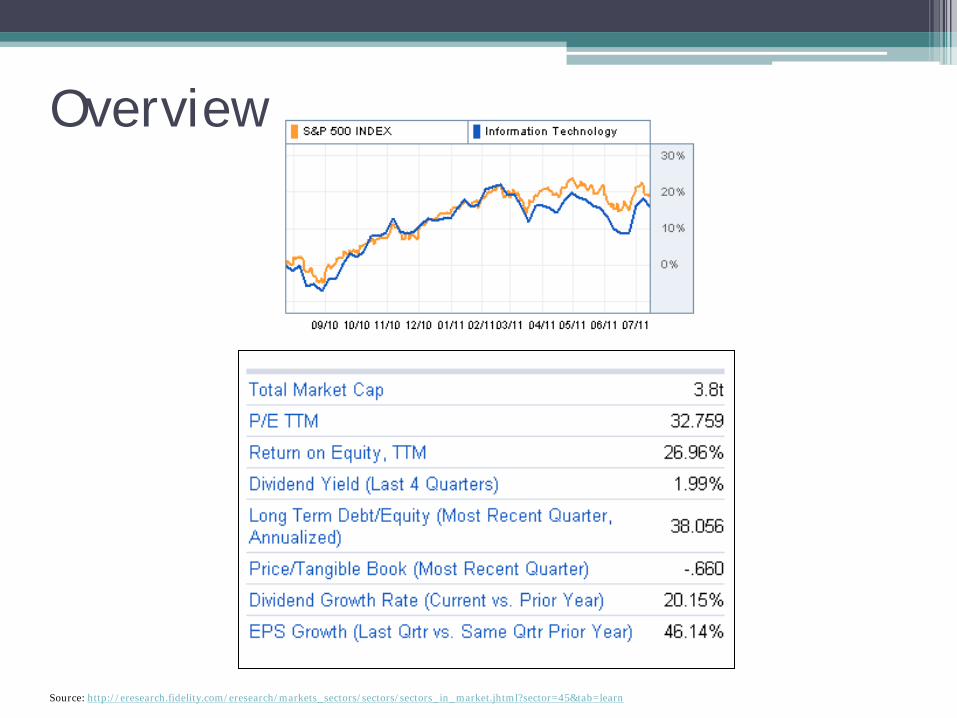
Overview
Source: http://eresearch.fidelity.com/eresearch/markets_sectors/sectors/sectors_in_market.jhtml?sector=45&tab=learn
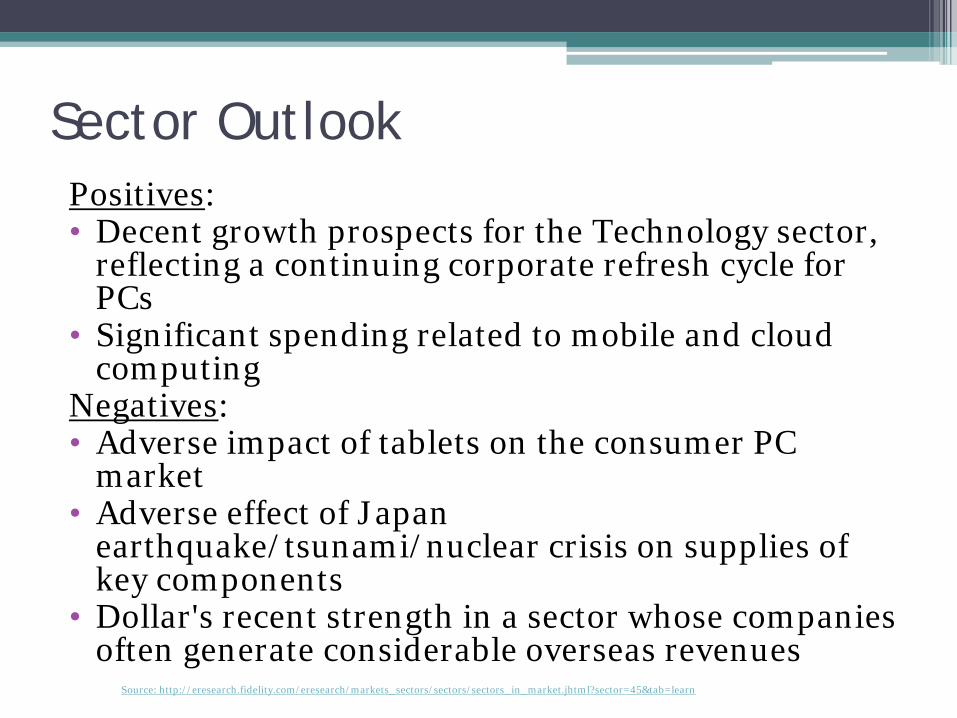
Sector OutlookPositives:• Decent growth prospects for the Technology sector,
reflecting a continuing corporate refresh cycle for PCs
• Significant spending related to mobile and cloud computing
Negatives:• Adverse impact of tablets on the consumer PC
market• Adverse effect of Japan
earthquake/tsunami/nuclear crisis on supplies of key components
• Dollar's recent strength in a sector whose companies often generate considerable overseas revenues
Source: http://eresearch.fidelity.com/eresearch/markets_sectors/sectors/sectors_in_market.jhtml?sector=45&tab=learn

Industries within sector• Application Software • Communications
Equipment• Computer Storage and
Peripherals• Computer Hardware• Electronic Component• Electronic Equipment• Electronic MNFRG SVC• Home Entertainment
Software
• Internet Software and Services
• IT Consulting and Services• Office Electronics• Semiconductor Equipment• Semiconductors• Services-Data PROC• Systems Software• Technology Distribution
Business AnalysisDemand:Products have a short life cycle, always moving to the next new
product, competitive industries within sectorClassification of Business cycle• Information Technology is cyclical
▫ Important need to all business▫ Can be volatile
External Factors• Global business and very sensitive to global economyUser and Geography• Ever increasing number of people consumer of technology – young,
adult, business, casual, etc• Most users in North America, Europe and Asia
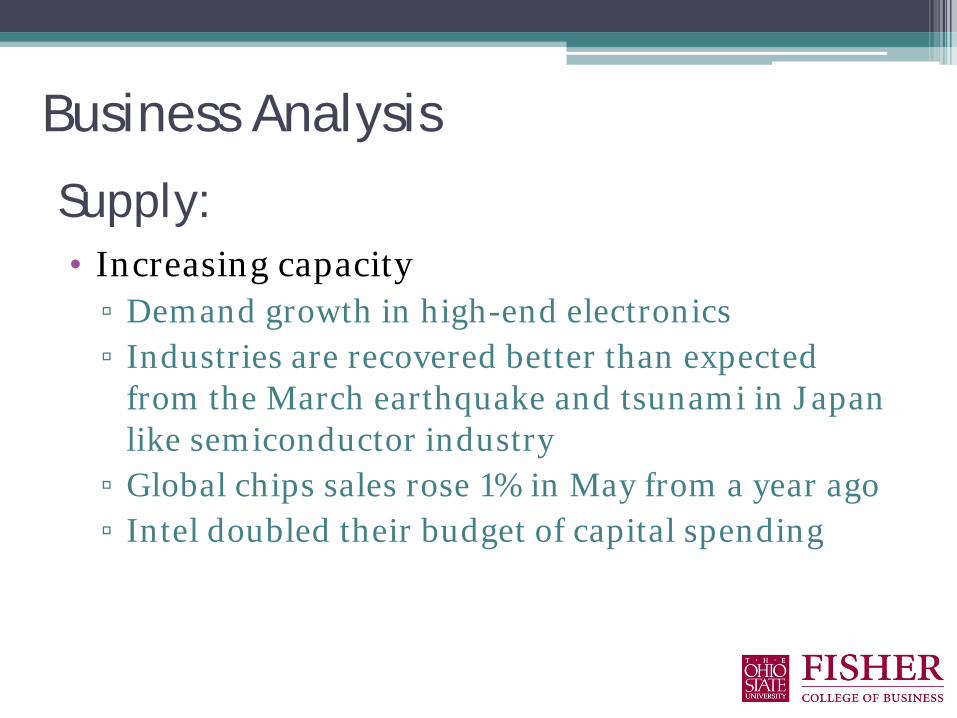
Supply:• Increasing capacity ▫ Demand growth in high-end electronics▫ Industries are recovered better than expected
from the March earthquake and tsunami in Japan like semiconductor industry
▫ Global chips sales rose 1% in May from a year ago▫ Intel doubled their budget of capital spending
Business Analysis
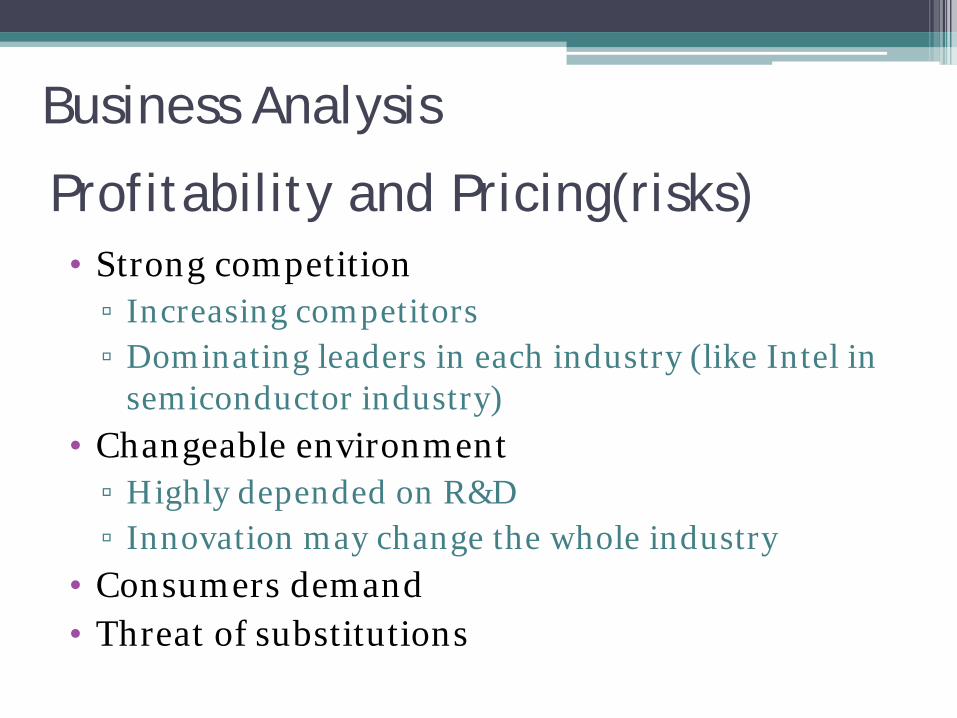
Profitability and Pricing(risks)• Strong competition▫ Increasing competitors▫ Dominating leaders in each industry (like Intel in
semiconductor industry)• Changeable environment▫ Highly depended on R&D▫ Innovation may change the whole industry
• Consumers demand • Threat of substitutions
Business Analysis
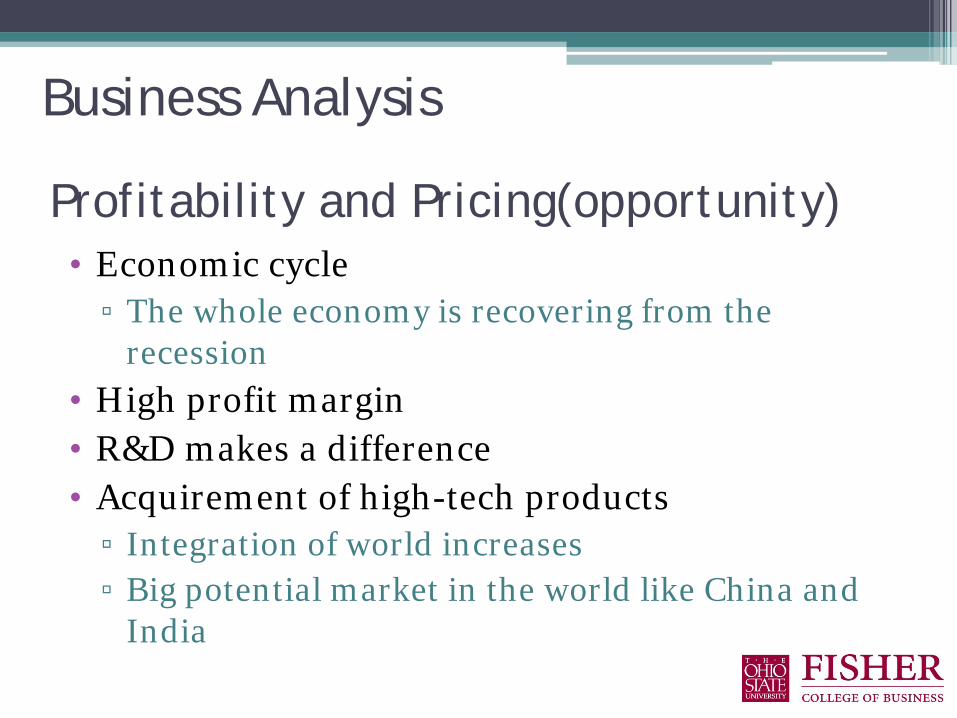
Profitability and Pricing(opportunity)• Economic cycle▫ The whole economy is recovering from the
recession• High profit margin• R&D makes a difference• Acquirement of high-tech products▫ Integration of world increases▫ Big potential market in the world like China and
India
Business Analysis

Profitability OutlookIndustry Earnings expectation Reasons
Semiconductors Increase
demand for tablets and ereaders grows; demand for industrial processors connected to renewable energy grows; the electronic systems grows
Software Increaseinternet use increases; acquisition & merge; function expansion
Storage Netural Short capacity; decrease in price
Consulting Service IncreaseBPO; demand from businesses, nonprofit institutions, and government agencies for outside advice grows
PC & Enterprise Hardware DecreaseExcess capacity; low demand; slow upgrade cycle
Business Analysis
Economic Indicators
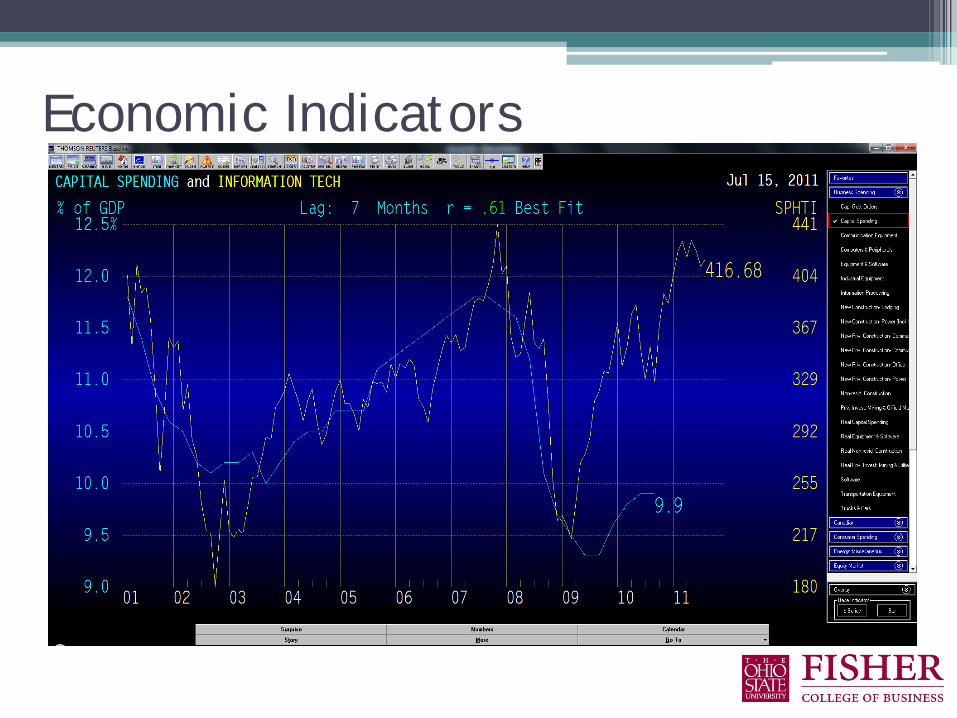
Economic Indicators
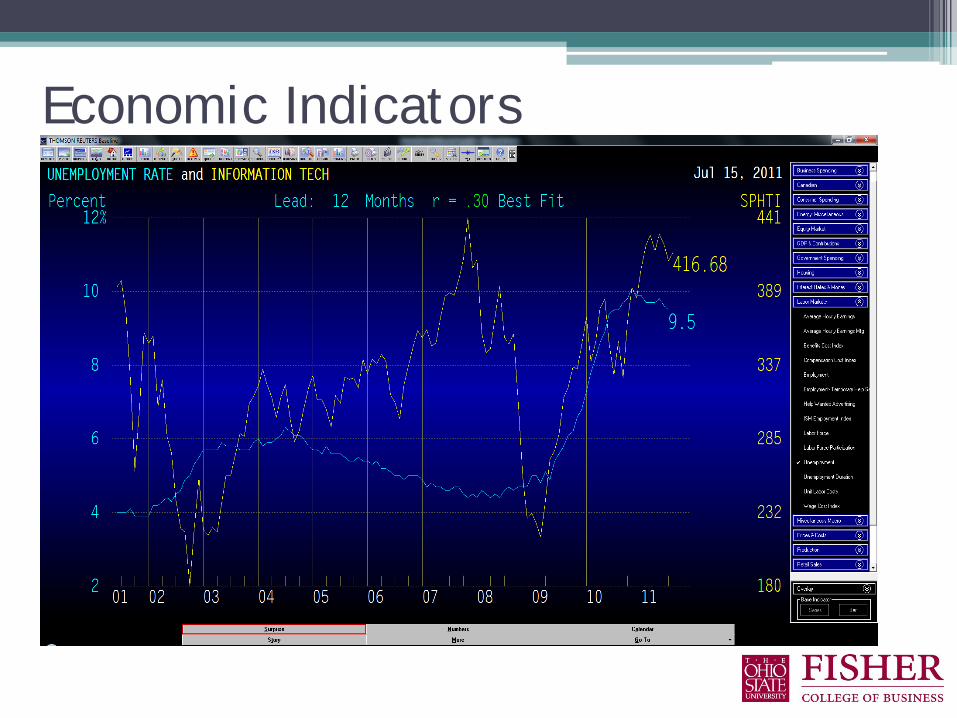
Economic Indicators
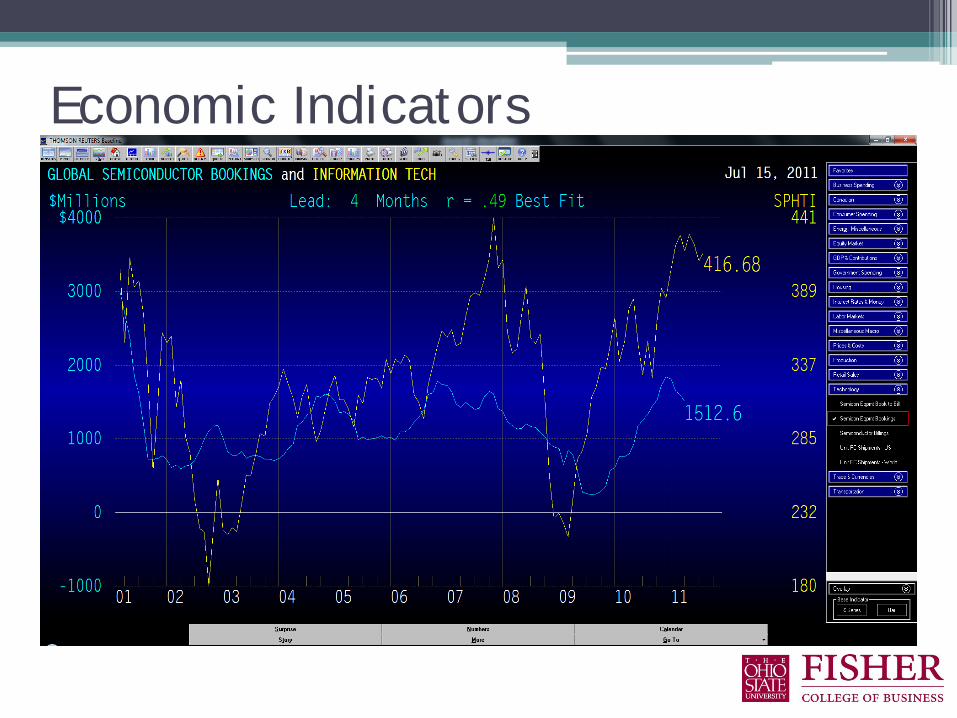
Economic Indicators
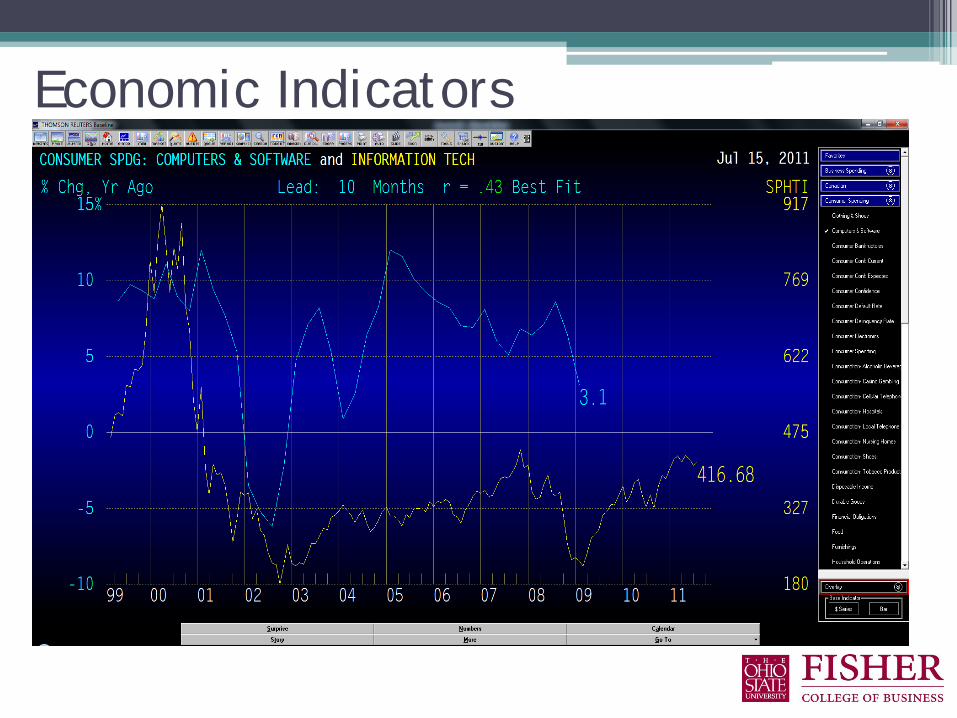
Economic Indicators
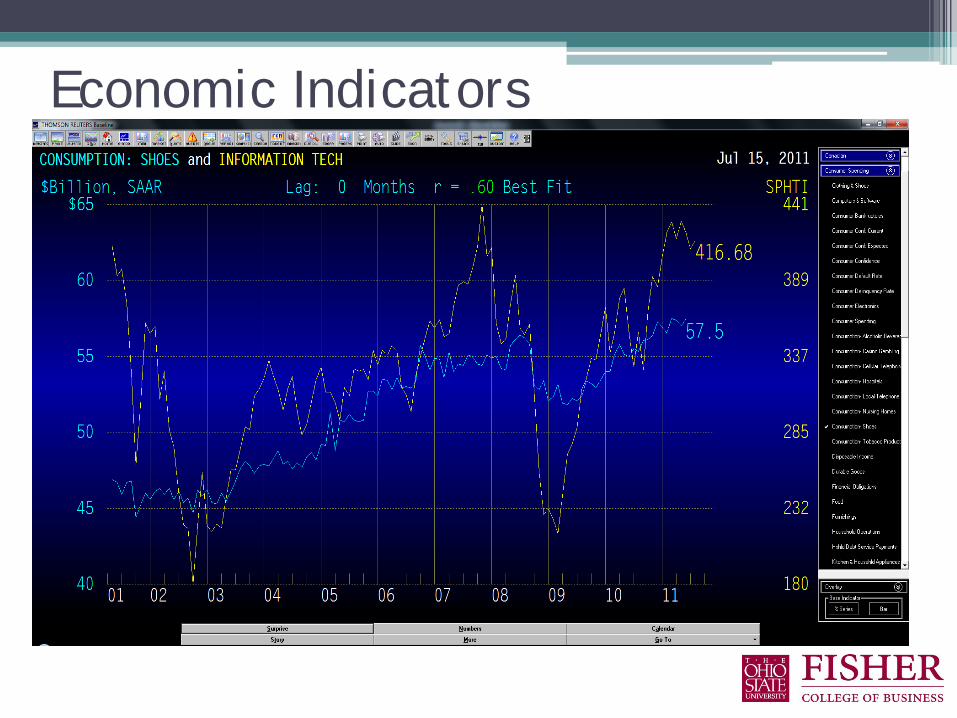
Economic Indicators
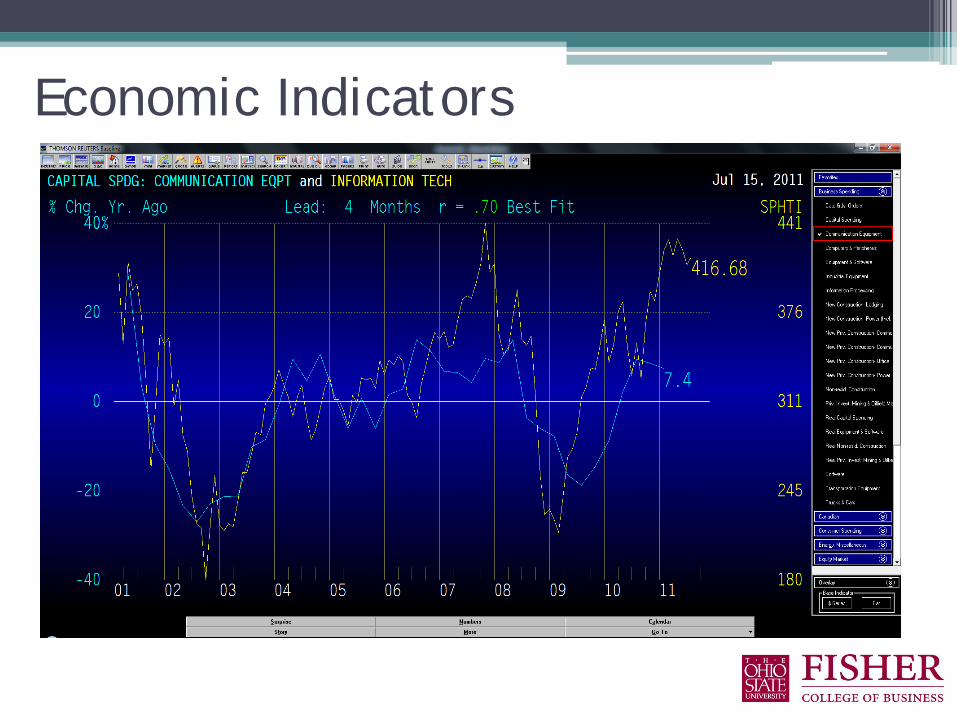
Economic Indicators
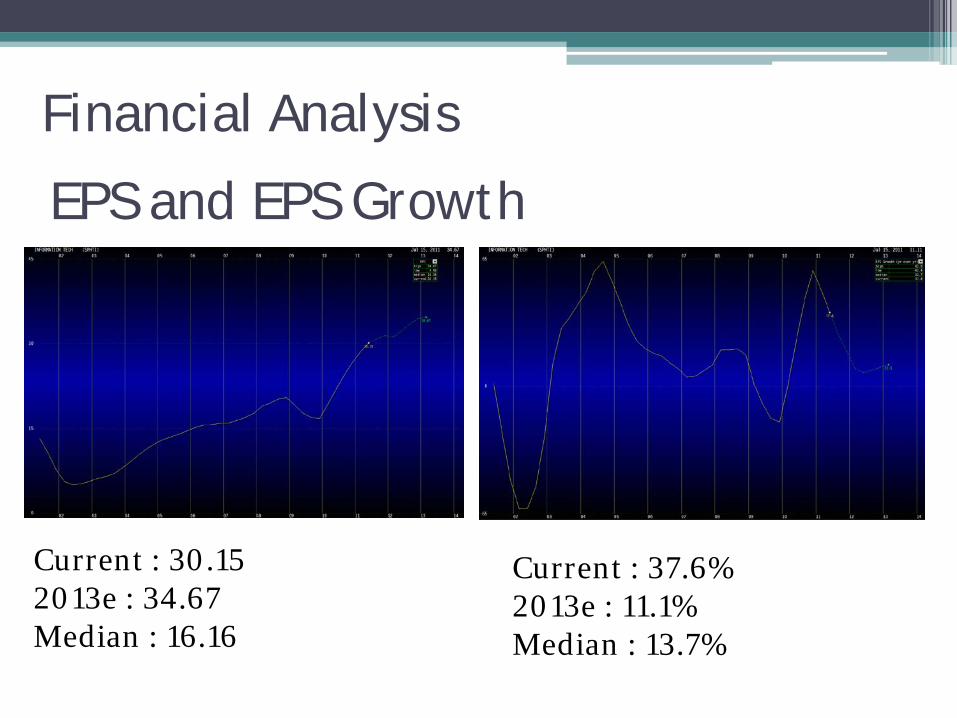
EPS and EPS Growth
Current : 30.15 2013e : 34.67Median : 16.16
Current : 37.6%2013e : 11.1%Median : 13.7%
Financial Analysis
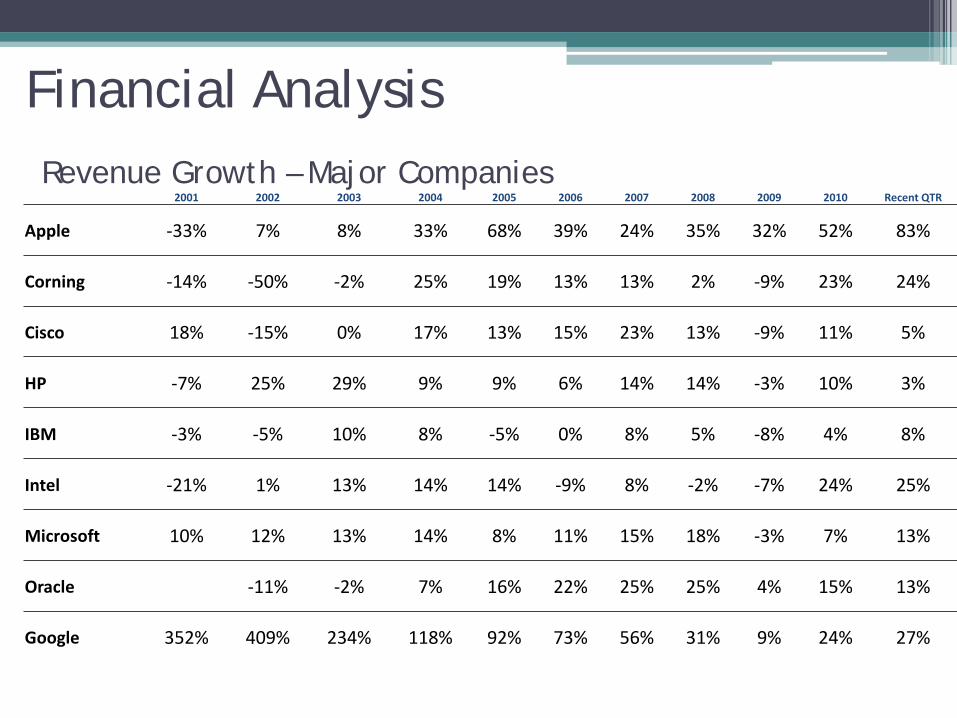
2001 2002 2003 2004 2005 2006 2007 2008 2009 2010 Recent QTR
Apple -33% 7% 8% 33% 68% 39% 24% 35% 32% 52% 83%
Corning -14% -50% -2% 25% 19% 13% 13% 2% -9% 23% 24%
Cisco 18% -15% 0% 17% 13% 15% 23% 13% -9% 11% 5%
HP -7% 25% 29% 9% 9% 6% 14% 14% -3% 10% 3%
IBM -3% -5% 10% 8% -5% 0% 8% 5% -8% 4% 8%
Intel -21% 1% 13% 14% 14% -9% 8% -2% -7% 24% 25%
Microsoft 10% 12% 13% 14% 8% 11% 15% 18% -3% 7% 13%
Oracle -11% -2% 7% 16% 22% 25% 25% 4% 15% 13%
Google 352% 409% 234% 118% 92% 73% 56% 31% 9% 24% 27%
Revenue Growth – Major Companies
Financial Analysis
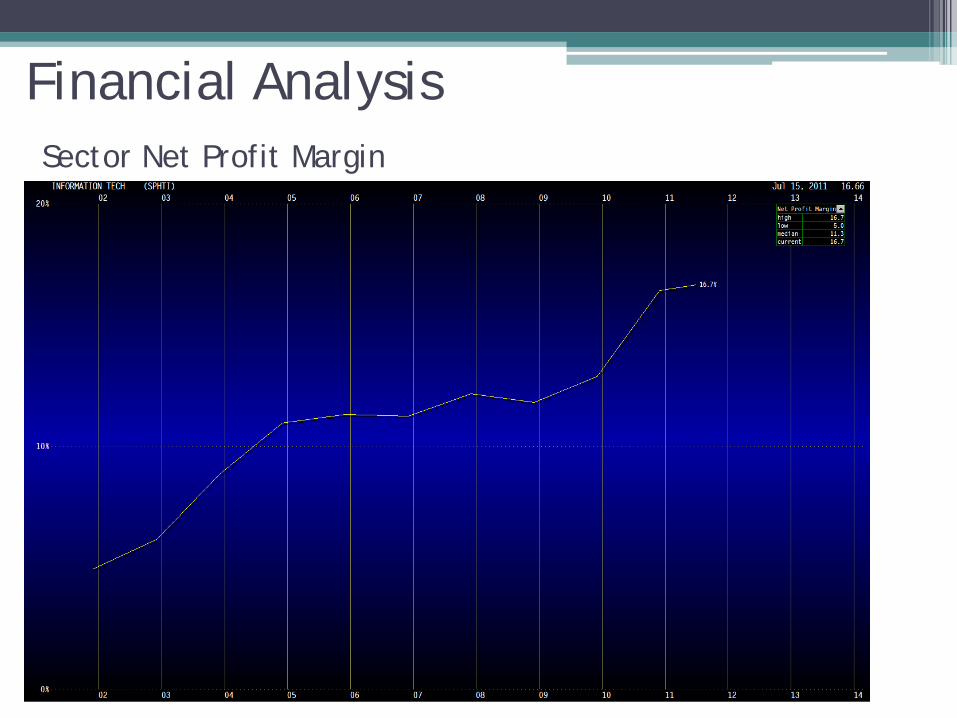
Sector Net Profit Margin
Financial Analysis

Net Profit Margin Relative to S&P 500
Financial Analysis
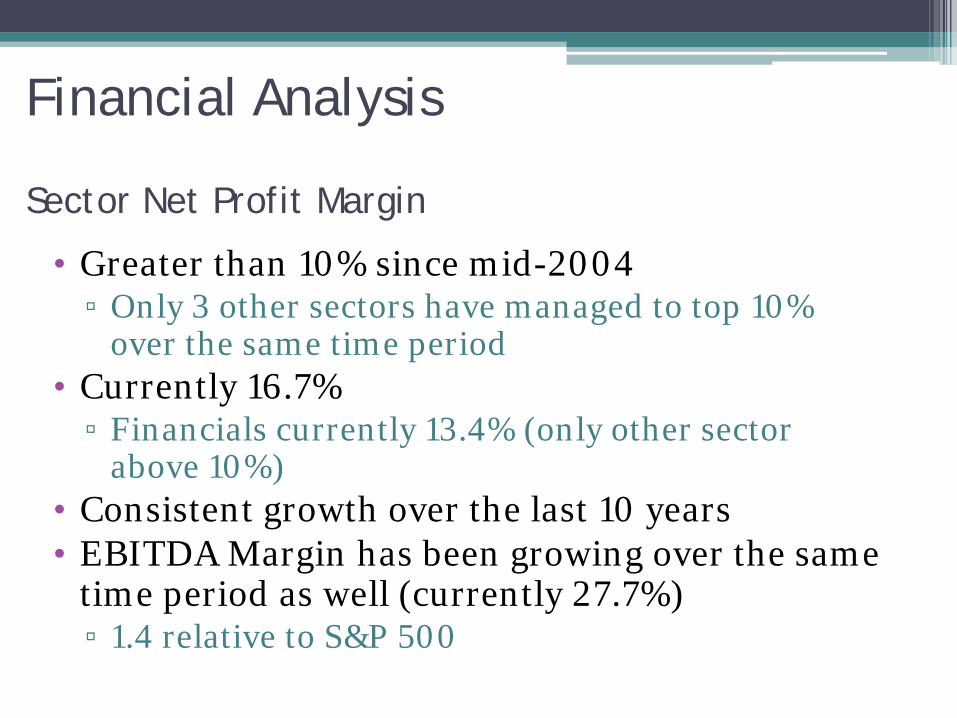
Sector Net Profit Margin
• Greater than 10% since mid-2004▫ Only 3 other sectors have managed to top 10%
over the same time period• Currently 16.7%▫ Financials currently 13.4% (only other sector
above 10%)• Consistent growth over the last 10 years• EBITDA Margin has been growing over the same
time period as well (currently 27.7%)▫ 1.4 relative to S&P 500
Financial Analysis
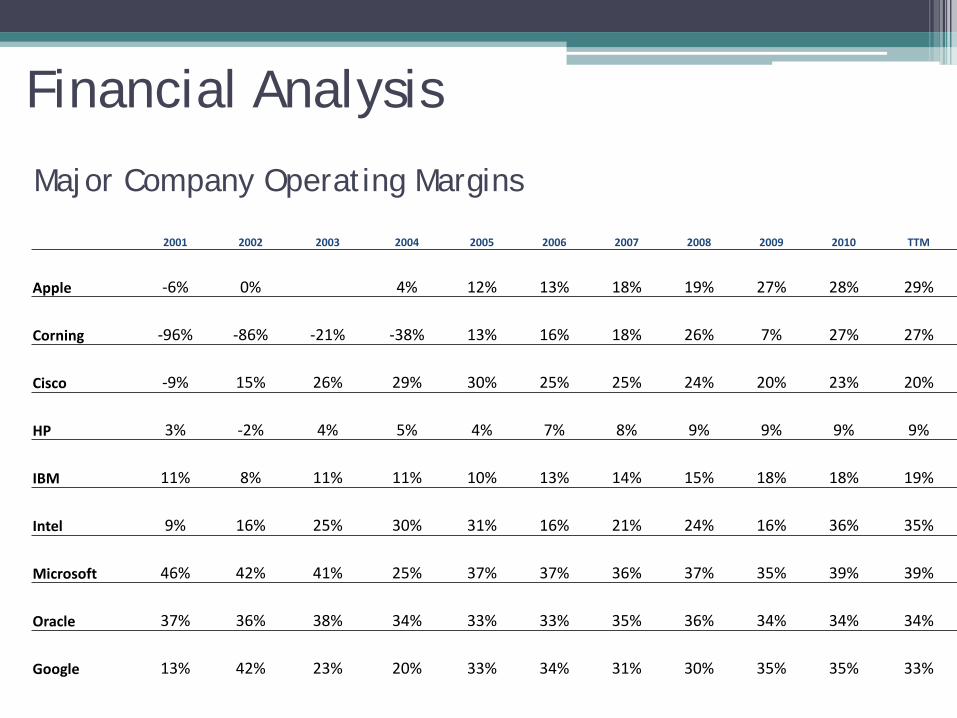
Major Company Operating Margins
2001 2002 2003 2004 2005 2006 2007 2008 2009 2010 TTM
Apple -6% 0% 4% 12% 13% 18% 19% 27% 28% 29%
Corning -96% -86% -21% -38% 13% 16% 18% 26% 7% 27% 27%
Cisco -9% 15% 26% 29% 30% 25% 25% 24% 20% 23% 20%
HP 3% -2% 4% 5% 4% 7% 8% 9% 9% 9% 9%
IBM 11% 8% 11% 11% 10% 13% 14% 15% 18% 18% 19%
Intel 9% 16% 25% 30% 31% 16% 21% 24% 16% 36% 35%
Microsoft 46% 42% 41% 25% 37% 37% 36% 37% 35% 39% 39%
Oracle 37% 36% 38% 34% 33% 33% 35% 36% 34% 34% 34%
Google 13% 42% 23% 20% 33% 34% 31% 30% 35% 35% 33%
Financial Analysis

Sector ROE Relative to S&P 500
Financial Analysis
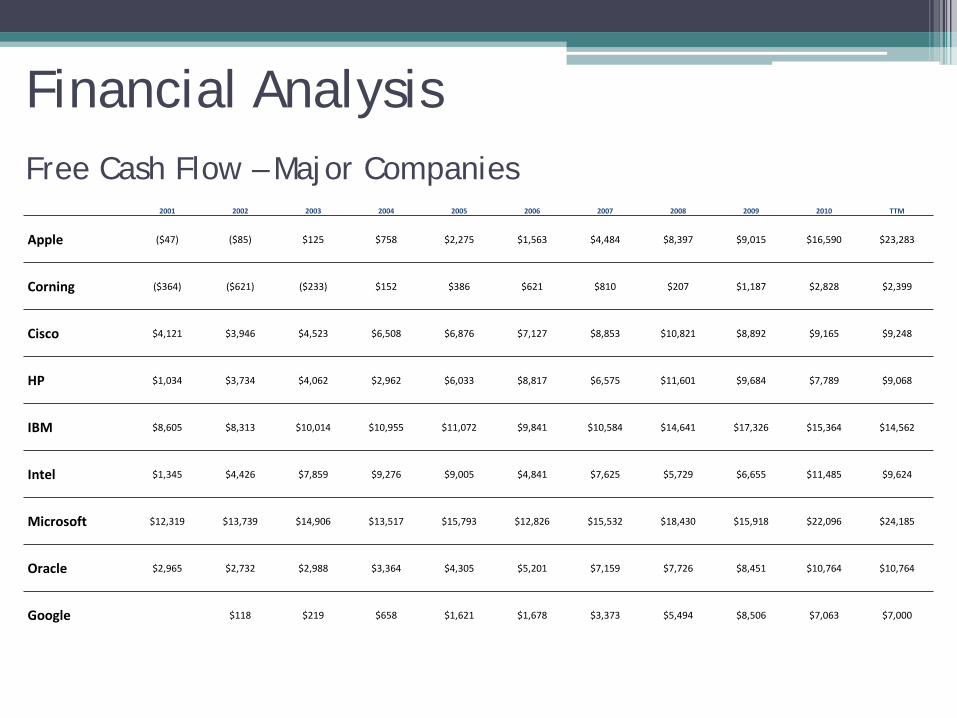
Free Cash Flow – Major Companies2001 2002 2003 2004 2005 2006 2007 2008 2009 2010 TTM
Apple ($47) ($85) $125 $758 $2,275 $1,563 $4,484 $8,397 $9,015 $16,590 $23,283
Corning ($364) ($621) ($233) $152 $386 $621 $810 $207 $1,187 $2,828 $2,399
Cisco $4,121 $3,946 $4,523 $6,508 $6,876 $7,127 $8,853 $10,821 $8,892 $9,165 $9,248
HP $1,034 $3,734 $4,062 $2,962 $6,033 $8,817 $6,575 $11,601 $9,684 $7,789 $9,068
IBM $8,605 $8,313 $10,014 $10,955 $11,072 $9,841 $10,584 $14,641 $17,326 $15,364 $14,562
Intel $1,345 $4,426 $7,859 $9,276 $9,005 $4,841 $7,625 $5,729 $6,655 $11,485 $9,624
Microsoft $12,319 $13,739 $14,906 $13,517 $15,793 $12,826 $15,532 $18,430 $15,918 $22,096 $24,185
Oracle $2,965 $2,732 $2,988 $3,364 $4,305 $5,201 $7,159 $7,726 $8,451 $10,764 $10,764
Google $118 $219 $658 $1,621 $1,678 $3,373 $5,494 $8,506 $7,063 $7,000
Financial Analysis
Valuation
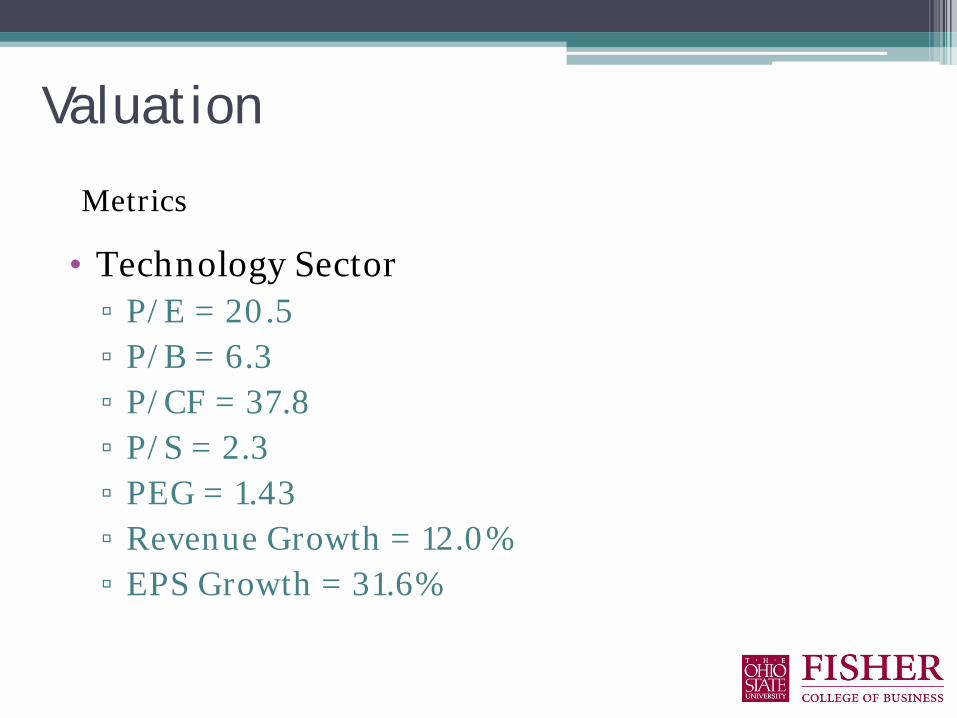
• Technology Sector▫ P/E = 20.5▫ P/B = 6.3▫ P/CF = 37.8▫ P/S = 2.3▫ PEG = 1.43▫ Revenue Growth = 12.0%▫ EPS Growth = 31.6%
Metrics
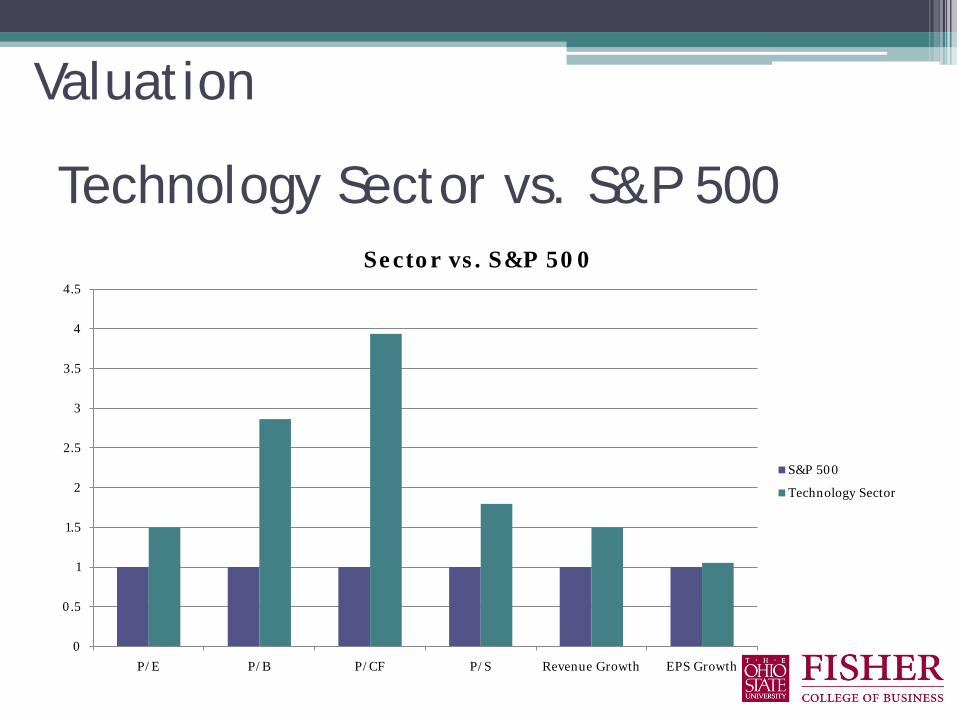
Technology Sector vs. S&P 500
0
0.5
1
1.5
2
2.5
3
3.5
4
4.5
P/E P/B P/CF P/S Revenue Growth EPS Growth
Sector vs. S&P 500
S&P 500
Technology Sector
Valuation
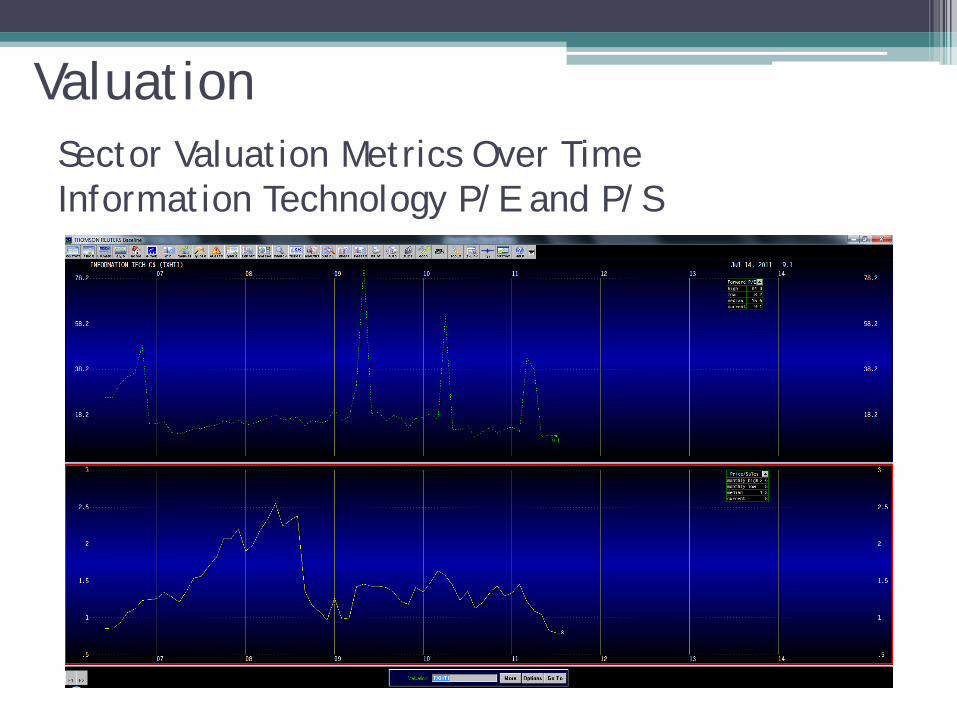
Sector Valuation Metrics Over TimeInformation Technology P/E and P/S
Valuation
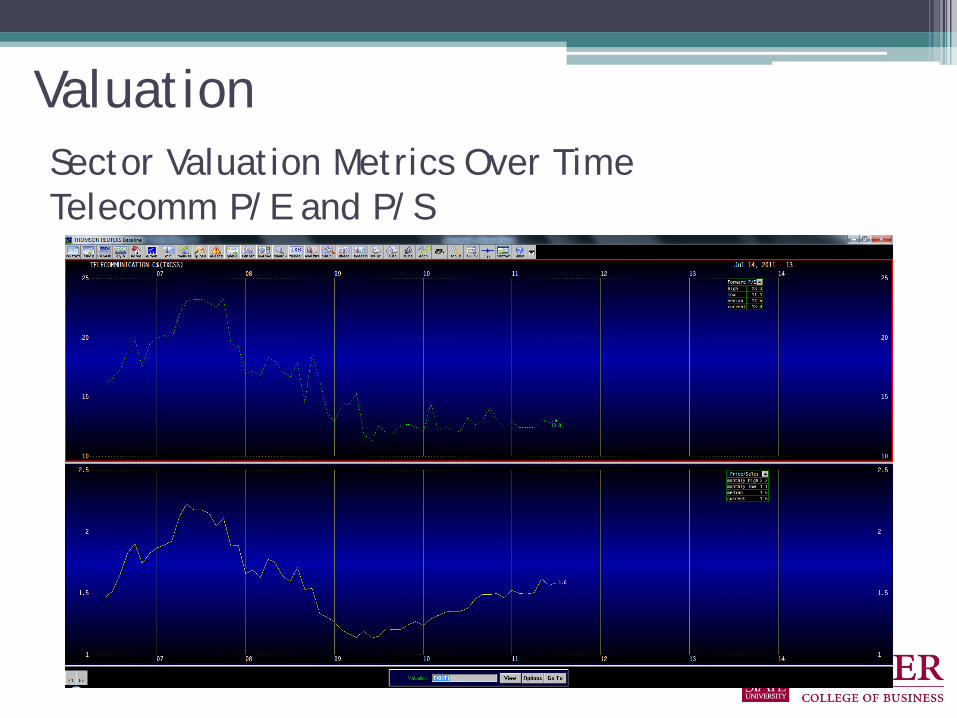
Sector Valuation Metrics Over TimeTelecomm P/E and P/S
Valuation
Valuation
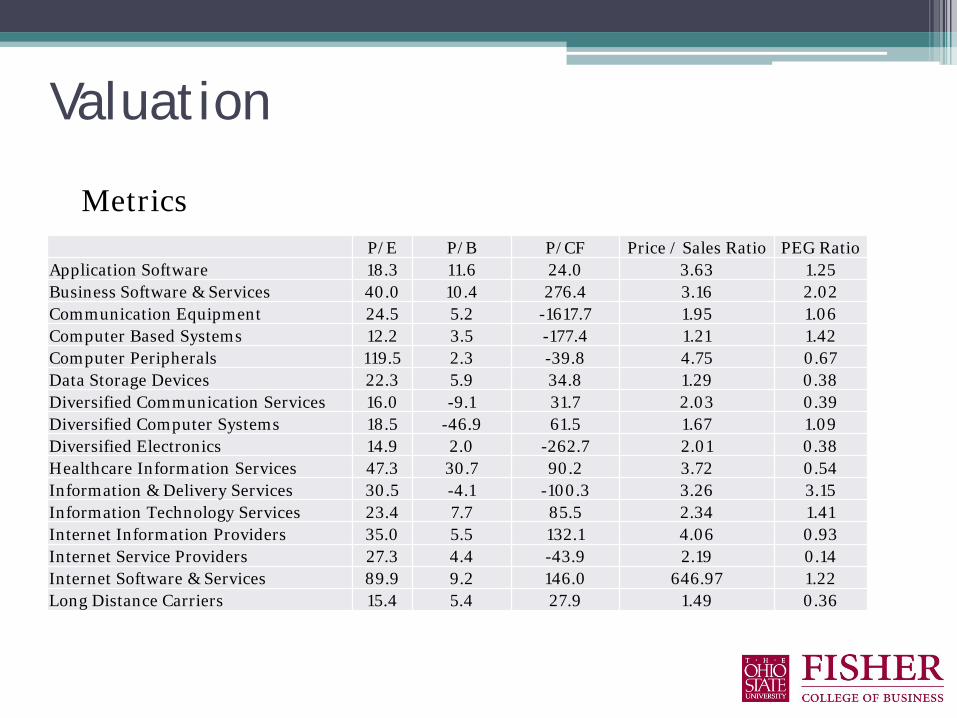
P/E P/B P/CF Price / Sales Ratio PEG RatioApplication Software 18.3 11.6 24.0 3.63 1.25Business Software & Services 40.0 10.4 276.4 3.16 2.02Communication Equipment 24.5 5.2 -1617.7 1.95 1.06Computer Based Systems 12.2 3.5 -177.4 1.21 1.42Computer Peripherals 119.5 2.3 -39.8 4.75 0.67Data Storage Devices 22.3 5.9 34.8 1.29 0.38Diversified Communication Services 16.0 -9.1 31.7 2.03 0.39Diversified Computer Systems 18.5 -46.9 61.5 1.67 1.09Diversified Electronics 14.9 2.0 -262.7 2.01 0.38Healthcare Information Services 47.3 30.7 90.2 3.72 0.54Information & Delivery Services 30.5 -4.1 -100.3 3.26 3.15Information Technology Services 23.4 7.7 85.5 2.34 1.41Internet Information Providers 35.0 5.5 132.1 4.06 0.93Internet Service Providers 27.3 4.4 -43.9 2.19 0.14Internet Software & Services 89.9 9.2 146.0 646.97 1.22Long Distance Carriers 15.4 5.4 27.9 1.49 0.36
Metrics
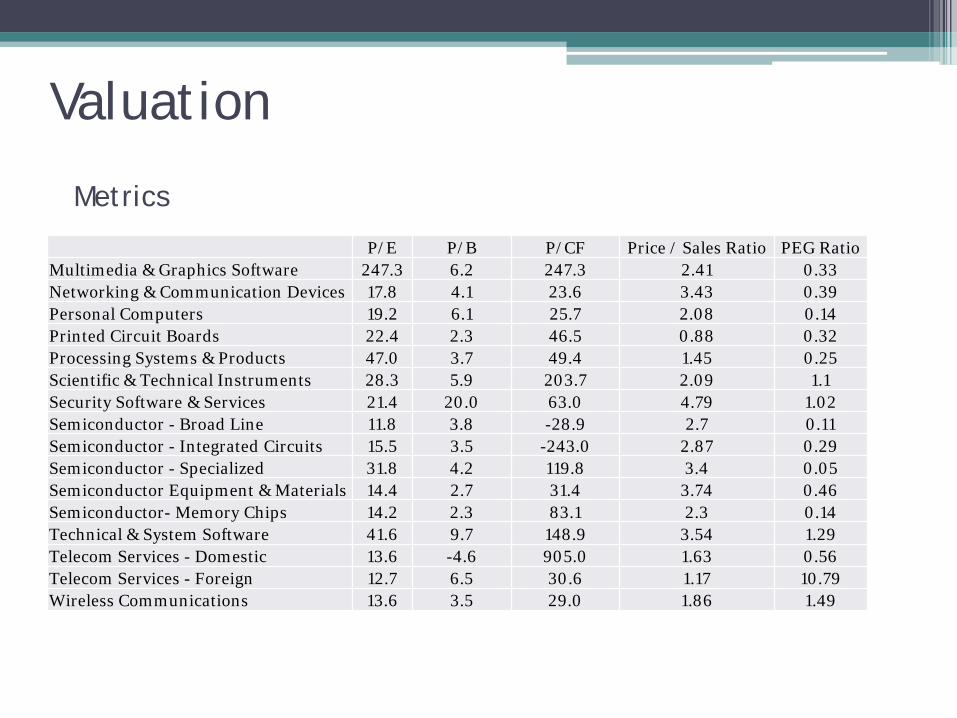
Metrics
P/E P/B P/CF Price / Sales Ratio PEG RatioMultimedia & Graphics Software 247.3 6.2 247.3 2.41 0.33Networking & Communication Devices 17.8 4.1 23.6 3.43 0.39Personal Computers 19.2 6.1 25.7 2.08 0.14Printed Circuit Boards 22.4 2.3 46.5 0.88 0.32Processing Systems & Products 47.0 3.7 49.4 1.45 0.25Scientific & Technical Instruments 28.3 5.9 203.7 2.09 1.1Security Software & Services 21.4 20.0 63.0 4.79 1.02Semiconductor - Broad Line 11.8 3.8 -28.9 2.7 0.11Semiconductor - Integrated Circuits 15.5 3.5 -243.0 2.87 0.29Semiconductor - Specialized 31.8 4.2 119.8 3.4 0.05Semiconductor Equipment & Materials 14.4 2.7 31.4 3.74 0.46Semiconductor- Memory Chips 14.2 2.3 83.1 2.3 0.14Technical & System Software 41.6 9.7 148.9 3.54 1.29Telecom Services - Domestic 13.6 -4.6 905.0 1.63 0.56Telecom Services - Foreign 12.7 6.5 30.6 1.17 10.79Wireless Communications 13.6 3.5 29.0 1.86 1.49
Valuation

Metrics
• 3 biggest industries within the overall technology sector:▫ Information Technology Services (66.0%)▫ Wireless Communications (16.3%)▫ Computer Based Systems (13.2%)
Valuation
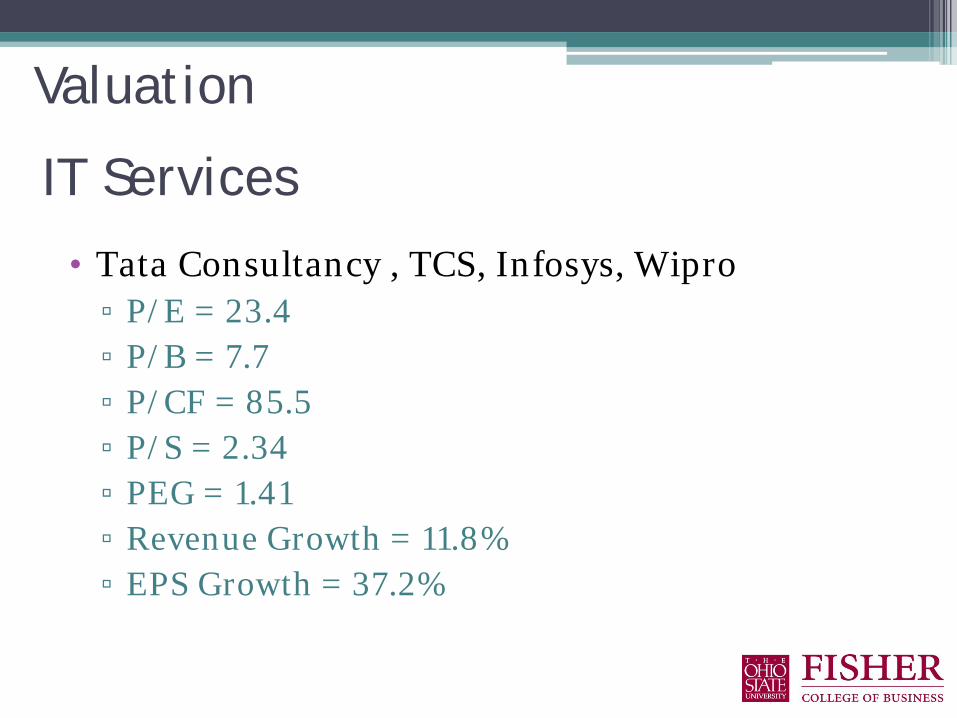
IT Services
• Tata Consultancy , TCS, Infosys, Wipro▫ P/E = 23.4▫ P/B = 7.7▫ P/CF = 85.5▫ P/S = 2.34▫ PEG = 1.41▫ Revenue Growth = 11.8%▫ EPS Growth = 37.2%
Valuation
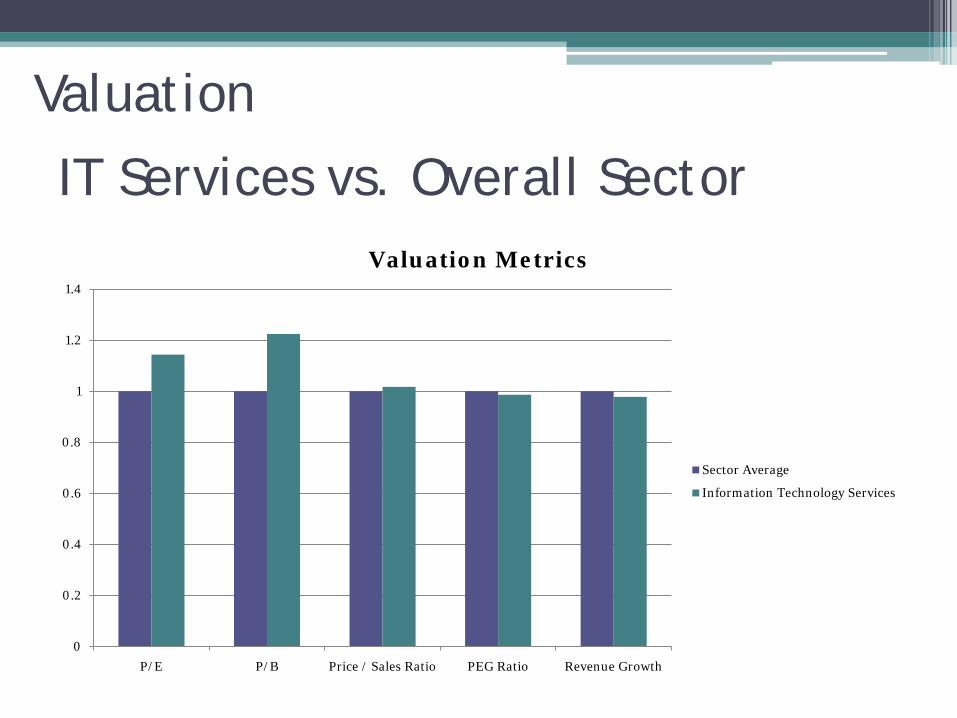
IT Services vs. Overall Sector
0
0.2
0.4
0.6
0.8
1
1.2
1.4
P/E P/B Price / Sales Ratio PEG Ratio Revenue Growth
Valuation Metrics
Sector Average
Information Technology Services
Valuation
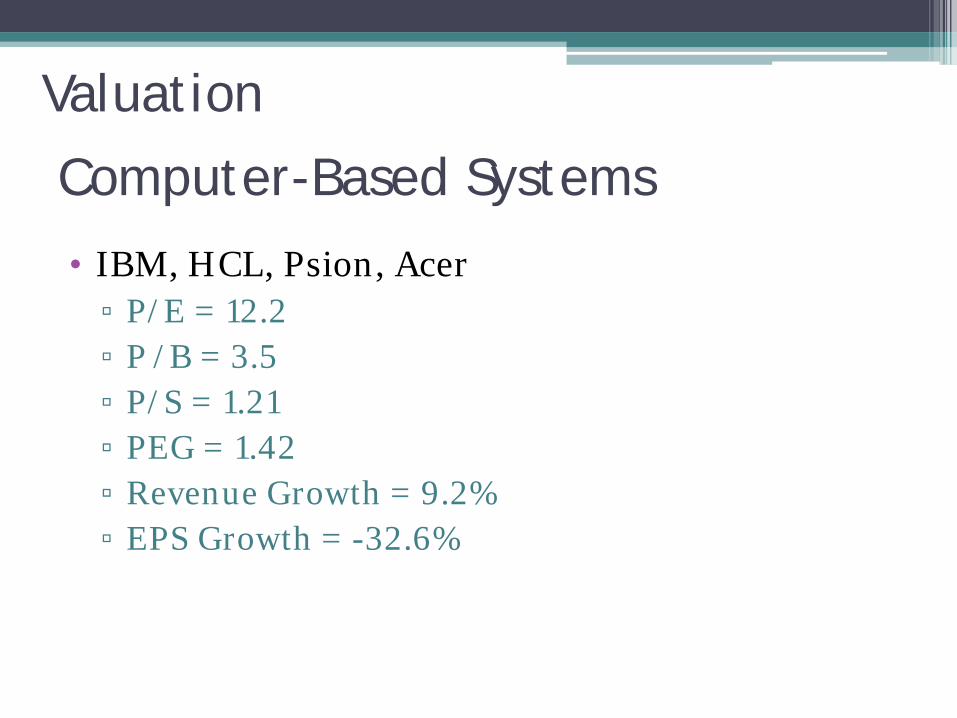
Computer-Based Systems
• IBM, HCL, Psion, Acer▫ P/E = 12.2▫ P /B = 3.5▫ P/S = 1.21▫ PEG = 1.42▫ Revenue Growth = 9.2%▫ EPS Growth = -32.6%
Valuation
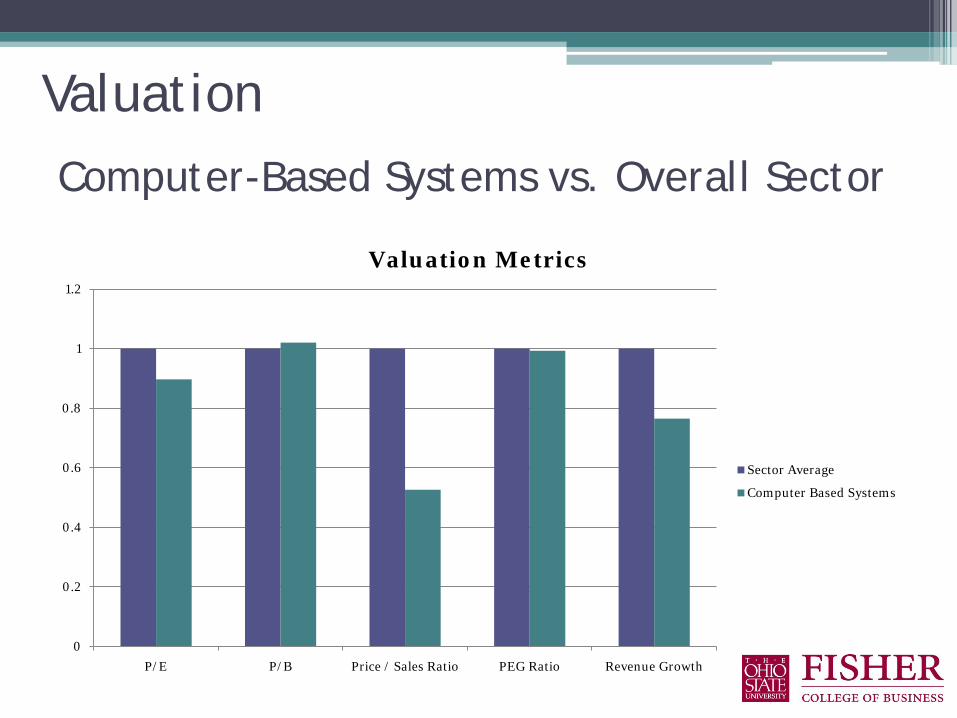
Computer-Based Systems vs. Overall Sector
0
0.2
0.4
0.6
0.8
1
1.2
P/E P/B Price / Sales Ratio PEG Ratio Revenue Growth
Valuation Metrics
Sector Average
Computer Based Systems
Valuation
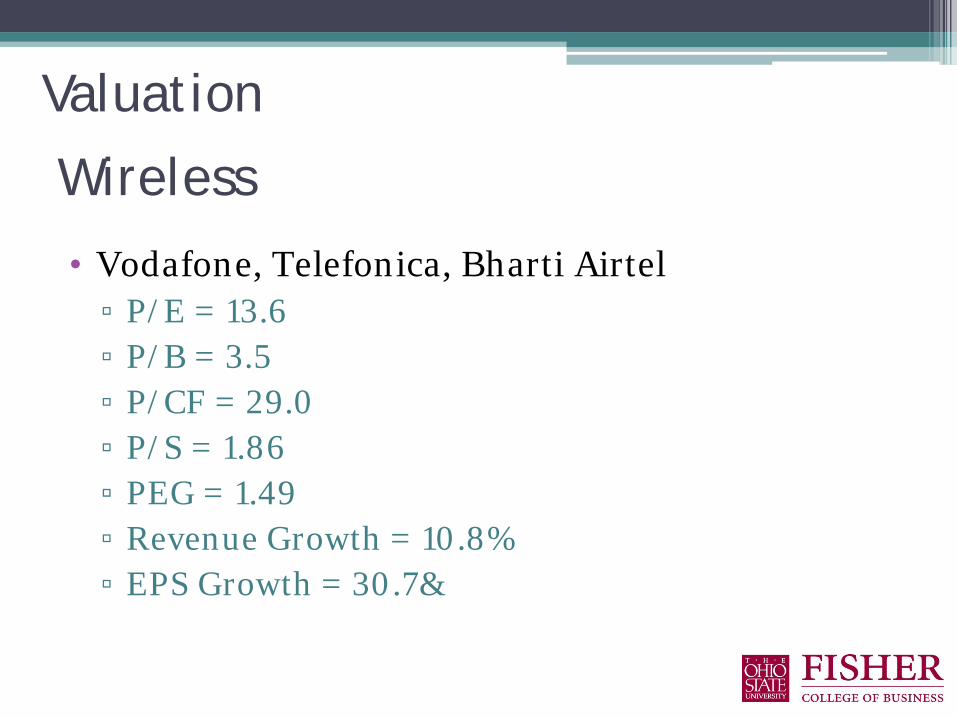
Wireless
• Vodafone, Telefonica, Bharti Airtel▫ P/E = 13.6▫ P/B = 3.5▫ P/CF = 29.0▫ P/S = 1.86▫ PEG = 1.49▫ Revenue Growth = 10.8%▫ EPS Growth = 30.7&
Valuation
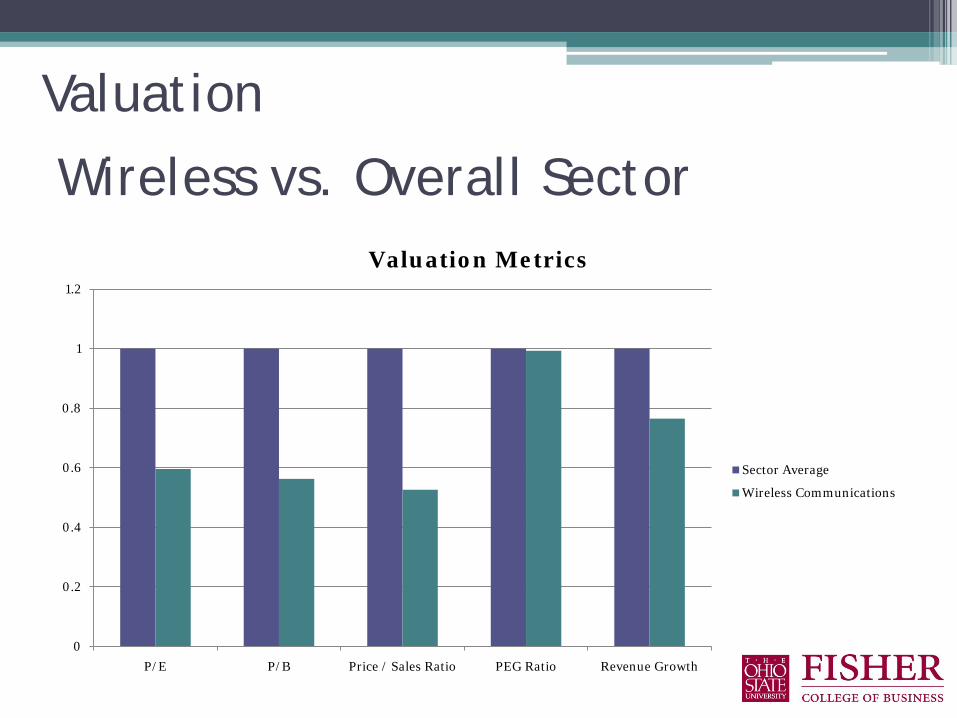
Wireless vs. Overall Sector
0
0.2
0.4
0.6
0.8
1
1.2
P/E P/B Price / Sales Ratio PEG Ratio Revenue Growth
Valuation Metrics
Sector Average
Wireless Communications
Valuation
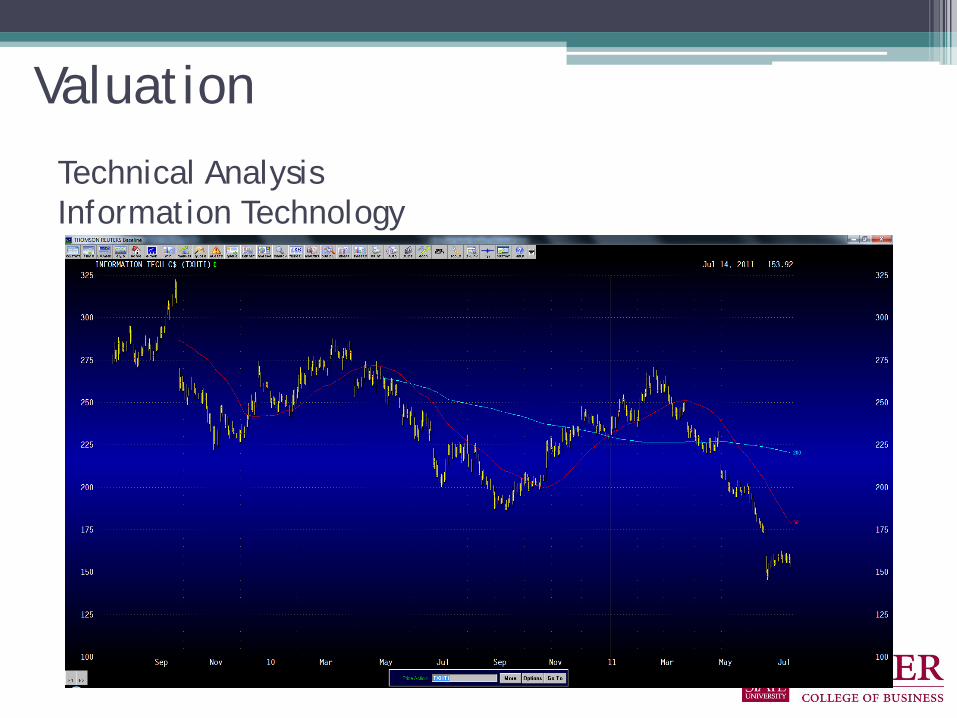
Technical AnalysisInformation Technology
Valuation
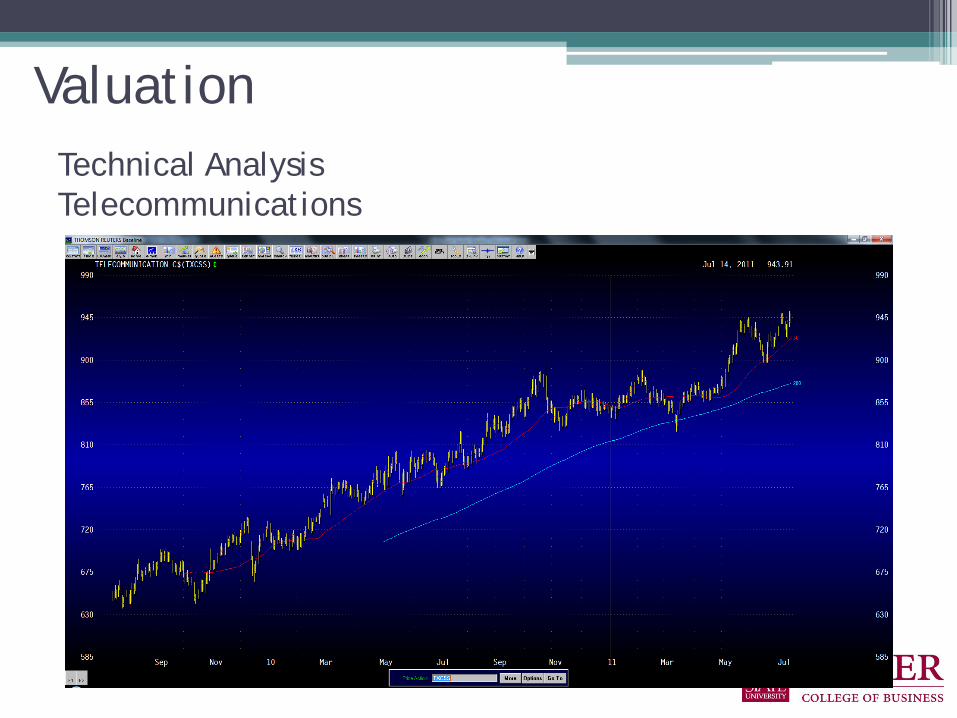
Technical AnalysisTelecommunications
Valuation
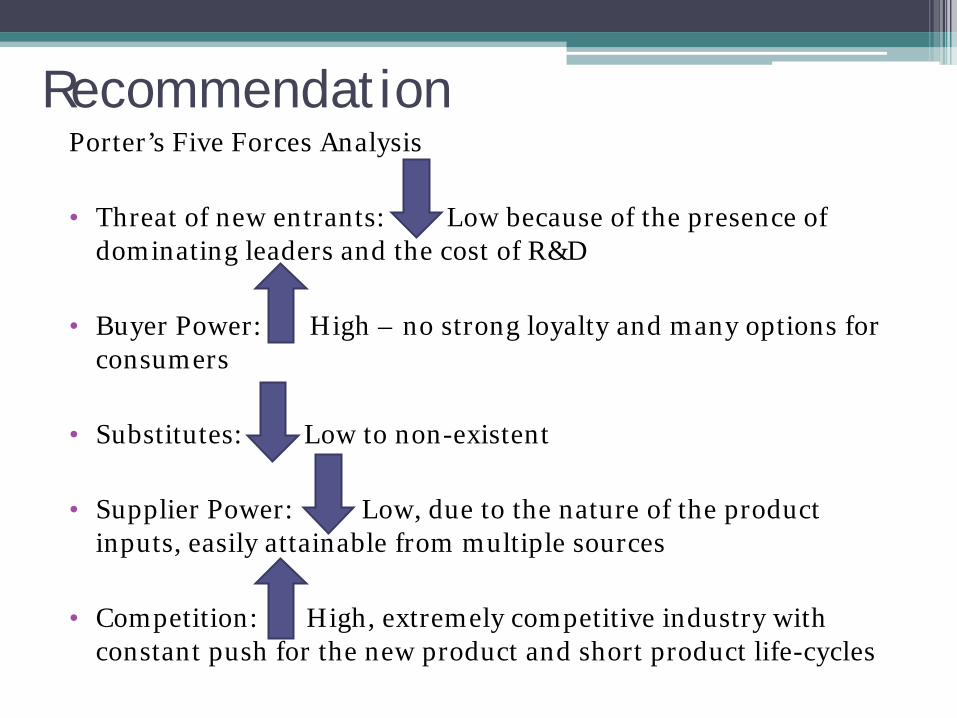
RecommendationPorter’s Five Forces Analysis
• Threat of new entrants: Low because of the presence of dominating leaders and the cost of R&D
• Buyer Power: High – no strong loyalty and many options for consumers
• Substitutes: Low to non-existent
• Supplier Power: Low, due to the nature of the product inputs, easily attainable from multiple sources
• Competition: High, extremely competitive industry with constant push for the new product and short product life-cycles
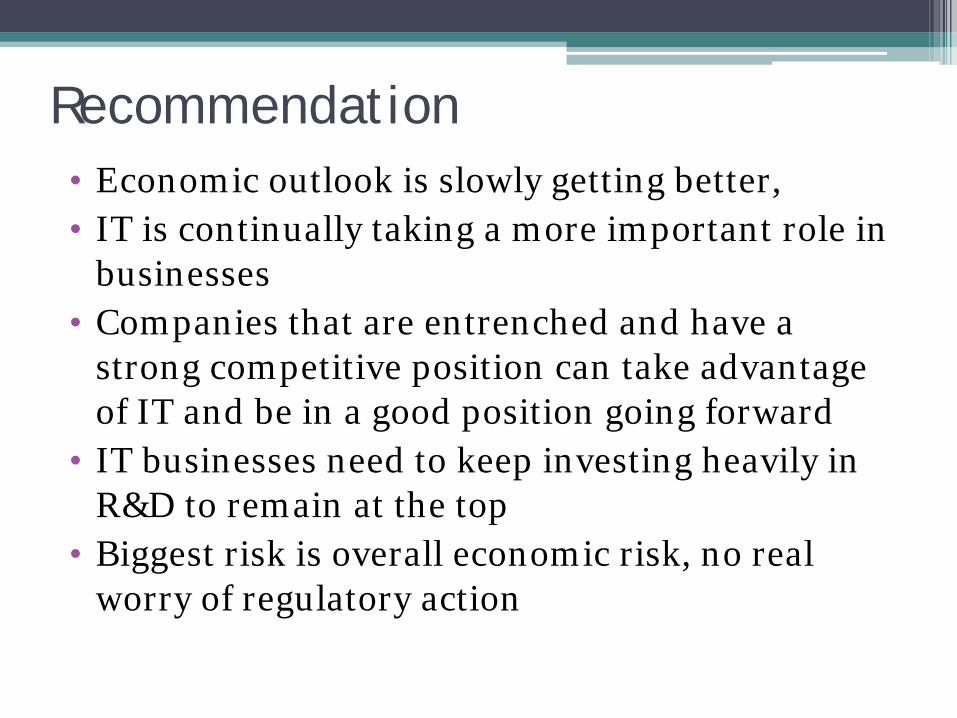
Recommendation• Economic outlook is slowly getting better,• IT is continually taking a more important role in
businesses• Companies that are entrenched and have a
strong competitive position can take advantage of IT and be in a good position going forward
• IT businesses need to keep investing heavily in R&D to remain at the top
• Biggest risk is overall economic risk, no real worry of regulatory action
• Overall Favorable outlook on IT• Cyclical sector• This group rates this sector as:
Over-weighted
Recommendation