Embed Size (px)
Citation preview

Information Technology Management in Higher Education: An Evidence-Based Approach to Improving Chief Information Officer Performance
Meredith L. Weiss
A dissertation submitted to the faculty of the University of North Carolina at Chapel Hill in partial fulfillment of the requirements for the degree of Doctor of Philosophy in the School of Information and Library Science.
Chapel Hill 2010
Approved by,
José-Marie Griffiths
Jeff Huskamp
Ben Rosen
Paul Solomon
Barbara Wildemuth

© 2010 Meredith L. Weiss
ALL RIGHTS RESERVED
ii

ABSTRACT
MEREDITH WEISS: Information Technology Management in Higher Education: An Evidence-Based Approach to Improving Chief Information Officer Performance
(Under the direction of José-Marie Griffiths)
It is critical to higher education institutions that chief information officers (CIOs)
succeed since they control information and technology assets, oversee tremendous resources,
and facilitate the accomplishments of institutions and their members. The CIO holds a
complex and demanding position. Currently there is little quantitative research on how to
succeed as a CIO. Available literature about the CIO position is almost entirely based on
expert opinion or the experiences of past CIOs and although these insights and experiences
are extremely valuable, quantitative research studies are needed to validate, expand, and
revise current success recommendations. Available chief information officer studies focus
heavily on clarifying the roles in which a CIO must excel as well as the skills, abilities,
attributes, and knowledge a CIO must possess in order to succeed.
According to evidence-based management literature, although leadership matters, a
leader’s actions “rarely explain more than 10 percent of the differences in performance
between the best and the worst organizations and teams” and leaders may have the most
positive impact by improving organizational and group performance, valuing employees, and
developing systems that enable others to succeed (Pfeffer & Sutton, 2006h, pp. 192 - 200).
Therefore, rather than focusing on the specific CIO roles, skills, abilities, attributes, and
iii

iv
knowledge requirements, this study examines the environment the CIO creates among his/her
staff and how it impacts CIO and information technology (IT) organization performance.
The results of this study are consistent with the hypothesis that CIOs whose
centralized IT organizations perform well in organizational quality areas and who create
high-performance IT cultures are perceived as having more successful IT organizations and
as being more successful CIOs. Further, this study identifies the factors that are most
associated with satisfaction with the centralized IT organization and the CIO, organizational
quality and high-performance areas of opportunity for improvement, factors CIOs believe are
most important for the success of the IT organization, areas to include in CIO performance
reviews, criteria to assist with CIO hiring, and factors to include in employee job descriptions
and incentives. Finally, it begins the development of a much needed framework for CIO
success.

DEDICATION
To my sons, Lennon and Dylan, may you have the confidence and determination to
do whatever you set your mind to and the self-respect, empathy, kindness, and wisdom to
value and help others along your journey. I love you and wish you a lifetime of happiness.
v

ACKNOWLEDGEMENTS
First and foremost, I want to extend a special thank you to my committee chair Dr.
José-Marie Griffiths who happily agreed to take on a doctoral student during the beginning of
a new deanship. For her willingness to do so and her constant support, advice, guidance,
insightfulness, collegiality, and kindness, I am forever grateful.
I would like to thank my entire doctoral committee for their advice and insight
throughout this process. I learned a great deal from each one of them and I am extremely
grateful for their guidance. I would especially like to thank:
• Dr. Jeff Huskamp for his invaluable insight from the position of a current CIO. His genuine interest in my research is very motivating and I am extremely grateful for his appreciation of this study.
• Dr. Ben Rosen for his statistical guidance and extremely helpful feedback. His recommendations kept me on track and improved my work tremendously.
• Dr. Paul Solomon for his constant support, availability, calmness, and business insight. He is incredibly helpful to so many doctoral students at UNC.
• Dr. Barbara Wildemuth for her ongoing support on this dissertation as well as on
articles I wrote throughout the doctoral program. Her counsel, support, and advice were invaluable.
I would also like to extend an extremely appreciative thank you to:
• Dr. Laura N. Gasaway for introducing me to Dr. José-Marie Griffiths and supporting me throughout the Ph.D. program.
• Dr. Richard Hawthorne for his advice, encouragement, and willingness to proofread very long documents.
vi

vii
• all my friends who have encouraged me and checked in with me for the past five years. I would especially like to thank Dana Hanson-Baldauf for her friendship, advice, and support.
• the faculty and my fellow Ph.D. students at the School of Information and Library Science at the University of North Carolina at Chapel Hill. They are an absolutely amazing group of people.
• Chris Wiesen at the Odum Institute for Research in Social Science for his many hours of statistical assistance.
• the extremely busy CIOs, faculty, students, and staff who made the time to participate in this study. Finally, a very special thank you to my wonderful and supportive family which has
grown by two young boys during this process.
• Melissa for supporting me through this process and listening to endless hours about technology despite the fact that she doesn’t even like computers.
• Lennon and Dylan for making me laugh and smile every day.
• Howard for always encouraging me to try. Many times, his simple advice ‘Go ahead, give it a shot. What’s the worst thing that can happen?’ has given me the confidence to try new things and believe in myself. This has been invaluable and I hope to pass on his ‘can do’ attitude to my boys.
• Hedy for her constant cheerleading. I couldn’t hire a public relations firm any better!
• Adam for always checking in and keeping our family well fed through this process.
• Sammy and Lucy for keeping me company through many late nights.

TABLE OF CONTENTS
LIST OF TABLES ................................................................................................................. xiii
LIST OF FIGURES ............................................................................................................... xvi
LIST OF ABBREVIATIONS ............................................................................................... xvii
Chapter
I. INTRODUCTION .................................................................................................. 1
Introduction and purpose of the study ................................................................... 1
Identification of the problem and need for the study ............................................. 2
Research questions ................................................................................................. 6
Methodology overview and theoretical framework ............................................... 8
Summary ................................................................................................................ 9
II. LITERATURE REVIEW ..................................................................................... 10
The Chief Information Officer (CIO) .................................................................. 10
The CIO in higher education ................................................................................ 10
Constituencies of the CIO in higher education .................................................... 11
The roles of the CIO in higher education ............................................................. 17
Challenges surrounding the position of CIO in higher education ........................ 37
Top concerns for CIOs in higher education ......................................................... 46
Summary of the CIO in higher education literature ............................................. 48
The CIO outside higher education ....................................................................... 49
viii

Current trends in the position ............................................................................... 49
CIO and/or IT department success measures ....................................................... 51
How to be a successful CIO in industry ............................................................... 55
Top concerns for CIOs outside higher education ................................................ 62
Summary of the CIO outside higher education literature .................................... 63
Evidence-based management (EBM) literature ................................................... 64
Definition and basic principles of evidence-based management ......................... 64
History of evidence-based management .............................................................. 65
Evidence-based medicine ..................................................................................... 65
Early evidence-based management ...................................................................... 66
Other areas of evidence-based practice ................................................................ 67
Evidence-based management ............................................................................... 67
Differences between evidence-based management and other areas of evidence based practice ........................................................................................ 68 Barriers to evidence-based management ............................................................. 68
Evaluating evidence ............................................................................................. 70
Implementing evidence-based management ........................................................ 71
Evidence-based management summary ............................................................... 74
Evidence-based management in practice ............................................................. 74
What does evidence-based management literature state about building a high-performance culture? ................................................................................ 74 What does evidence-based management literature state about human resource (HR) management? ................................................................................ 76 What does evidence-based management literature state about leadership? ......... 79
ix

Evidence-based management studies that inform this dissertation study ............ 82 Summary of the evidence-based management literature ..................................... 85
Research questions revisited and contribution this study makes to the field ....... 86
III. METHODOLOGY .............................................................................................. 90
Theoretical framework ......................................................................................... 90
Operationalization of variables ............................................................................ 92
Inter-institutional differences in IT user satisfaction ......................................... 103
Sampling Frame ................................................................................................. 104
Survey Distribution and Administration ............................................................ 104
IV. ANALYSIS AND STUDY FINDINGS ........................................................... 108
Participation overview ....................................................................................... 108
Descriptive survey data ...................................................................................... 109
Research questions ............................................................................................. 110
Research question 1 - factors associated with user satisfaction ......................... 110
Research question 2 - organizational quality ..................................................... 127
Research question 3 - organizational quality area combinations ....................... 129
Research question 4 - high-performance ........................................................... 130
Research question 5 - important to IT organization success .............................. 135
Research question 6 - user satisfaction perceptions ........................................... 136
Research question 7 - elements tied to success .................................................. 139
Research question 8 - performance reviews ...................................................... 141
Research question 9 - central IT organization importance ................................ 143
V. DISCUSSION .................................................................................................... 144
x

Research question 1 - factors associated with user satisfaction ......................... 144
Research questions 2-4 - organizational quality and high-performance ............ 145
Research question 5 - important to IT organization success .............................. 150
Research question 6 - user satisfaction perceptions ........................................... 151
Research question 7 - elements tied to success .................................................. 152
Research question 8 - performance reviews ...................................................... 153
Research question 9 - central IT organization importance ................................ 154
Limitations ........................................................................................................ 155
VI. CONCLUSIONS AND FURTHER STUDY ................................................... 159
Findings of interest to current CIOs ................................................................... 161
Findings of interest to future CIOs .................................................................... 166
Findings of interest to those evaluating CIOs .................................................... 167
Findings of interest to those hiring CIOs ........................................................... 168
A framework for CIO success - a beginning ..................................................... 169
Conclusion ......................................................................................................... 172
APPENDIX A: Chief Information Officer (CIO) Survey .................................................. 174
APPENDIX B: Campus Technology Survey ..................................................................... 183
APPENDIX C: Doctoral/Research Universities ................................................................. 203
APPENDIX D: Introductory Email to CIO ........................................................................ 210
APPENDIX E: Introductory Email to CIO’s Assistant ...................................................... 212
APPENDIX F: Follow Up Email to CIO ............................................................................ 214
APPENDIX G: How Your Institution Can Participate – Simple Instructions.................... 217
xi

xii
APPENDIX H: Email to CIO Listserve .............................................................................. 218
APPENDIX I: Email to Faculty ......................................................................................... 220
APPENDIX J: Between Universities Variance .................................................................. 222 APPENDIX K: Research Question One Results ................................................................ 223
APPENDIX L: Research Question Two Results ................................................................ 232
APPENDIX M: Research Question Three Results ............................................................. 233
APPENDIX N: Research Question Four Results ............................................................... 234
APPENDIX O: Research Question Five Results ................................................................ 239
APPENDIX P: Research Question Six Results .................................................................. 240
APPENDIX Q: Research Question Seven Results ............................................................. 253
APPENDIX R: Research Question Eight Results .............................................................. 254
APPENDIX S: Research Question Nine Results ................................................................ 255
APPENDIX T: Internal Consistency .................................................................................. 256
REFERENCES ..................................................................................................................... 284

LIST OF TABLES
Table
1. Factors potentially impacting user satisfaction ....................................................... 6
2. Nine areas used to define organizational quality .................................................... 6
3. High-performance culture categories ...................................................................... 7
4. Summary- constituencies of the chief information officer in higher education ... 17
5. Summary- the roles identified for the chief information officer in higher education ................................................................................................ 37 6. Summary- skills, abilities, attributes, and knowledge requirements identified for the chief information officer in higher education ........................... 45 7. Top concerns for CIOs in higher education in 2007 ............................................. 46
8. Top concerns for CIOs in higher education historically ....................................... 47
9. Evaluation methods, tools, metrics, and approaches used by industry CIOs ....... 55
10. Summary- suggested skills, abilities, attributes, and knowledge requirements identified for a successful chief information officer in industry .......................... 61 11. Summary- top concerns for CIOs outside higher education ................................ 63
12. Operationalization of variables: nine areas used to define organizational quality........................................................................................... 93 13. Operationalization of variables: high-performance culture categories ................ 96 14. Operationalization of variables: factors potentially impacting user satisfaction .................................................................................................... 99
15. Operationalization of variables: overall IT organization and CIO satisfaction ................................................................................................. 102
xiii

16. Institution participation overview ...................................................................... 108
17. Individual participation overview ...................................................................... 109
18. Factors correlated with satisfaction with the centralized IT organization ......... 112 19. Factors correlated with satisfaction with the centralized IT organization (research universities only) ................................................................................ 113
20. Factors correlated with satisfaction with the CIO .............................................. 114
21. Factors correlated with satisfaction with the CIO (research universities only) ................................................................................ 115 22. Percentage of participants who responded not sure about factors ..................... 116
23. Percentage of participants who responded not sure about overall satisfaction .. 117
24. Faculty satisfaction correlation comparison ...................................................... 119
25. Student satisfaction correlation comparison ...................................................... 121
26. Non-centralized IT staff satisfaction correlation comparison ............................ 123
27. Non-IT staff satisfaction correlation comparison .............................................. 125
28. Mean overall satisfaction scores ........................................................................ 126
29. Organizational quality questions........................................................................ 127
30. High-performance culture results by category ................................................... 132
31. CIO perceptions of IT organization success factors .......................................... 136
32. CIO and IT perception of campus user satisfaction ........................................... 138
33. Centralized IT employee success perceptions…………………………… ....... 140
34. Centralized IT employee success perceptions (research universities only) ....... 141
xiv

xv
35. Elements CIOs believe are most heavily factored into their performance reviews…………………………… .............................................. 142 36. Importance of the centralized IT department ..................................................... 143
LIST OF FIGURES
Figure
1. Overall user satisfaction ........................................................................................ 91
2. Percentage of participants who responded not sure about factors ...................... 116
3. Percentage of participants who responded not sure about overall satisfaction ... 117
4. Mean overall satisfaction scores ......................................................................... 126
xvi

xvii
LIST OF ABBREVIATIONS
CIO Chief Information Officer – The title commonly given to the senior technology
leader of an organization (Moberg et al., 2000; Brown, 2004). CTO Chief Technology Officer – A position often designed to alleviate some of the
pressure on the CIO by passing the majority of technical responsibility to the CTO (Beatty et al., 2005).
DRU Doctoral/Research Universities (The Carnegie Foundation Staff, 2008). EBM Evidence-Based Management – The process by which managers seek out the best
scientific evidence available and translate findings into organizational problem solving practices (Rousseau, 2006; Rousseau, 2007).
IS Information System – An application within the information technology
environment (Post & Anderson, 2003; Lineman, 2005). IT Information Technology – “The use of hardware, software, services, and
supporting infrastructure to manage and deliver information” (North Dakota Information Technology Department Staff, 2008).
RU/H Research universities with high research activity (The Carnegie Foundation Staff,
2008). RU/VH Research universities with very high research activity (The Carnegie Foundation
Staff, 2008).

INTRODUCTION
Introduction and Purpose of the Study
During the past few decades, technology has become increasingly pervasive and has
radically changed many peoples’ day to day lives. This is evidenced by the abundance of
new technologies that have been rapidly adopted including personal computers, the World
Wide Web, email, cell phones, instant messengers, digital video recorders, video games, fax
machines, global positioning systems, video conferencing units, and the list goes on and on.
Technology has impacted the ways in which people interact as well as changed how many
carry out routine functions such as shopping, driving, banking, and finding information.
New technologies are not only impacting peoples’ personal lives but are transforming
industries as well. Some people believe new technologies are even “flattening the world”
(Friedman, 2005).
Higher education is not unlike any other industry in that its leaders need to understand
and embrace new technologies, leverage information technology (IT) to further business
goals, and learn how best to operate in a new, rapidly changing environment. Higher
education leaders must examine how technology is impacting their day to day jobs as well as
how it will impact the future of colleges and universities. This is no small task. It is one that
is complex, expanding, and constantly changing.
To begin to address these large issues, many organizations, including higher
education institutions, have created a new technology leadership position often termed the
chief information officer (CIO). It is this person who is charged with the enormous and
1

complex task of overseeing current technology and information assets while strategically
planning with other organizational leaders for the future of not only the technology
department but also the organization. The purpose of this study is to determine where the
chief information officer in higher education should focus effort in order to improve his/her
performance, positively impact the institution and its members, and begin to position the
higher education organization for the future.
Identification of the Problem and Need for the Study
The chief information officer (CIO) in higher education holds an extremely visible
and complex position comprised of numerous roles and requiring a diverse set of skills,
abilities, attributes, and knowledge. The person with this title has a tremendous amount of
responsibility and serves many constituencies. Beyond these complexities, there are
additional issues surrounding the position including high turnover, lack of career progression,
confusion regarding the proper training and background needed, unclear definitions of and
metrics for success, and a lack of people aspiring to the role (Applegate & Elam, 1992;
Moberg et al., 2000; Hawkins, 2004; Katz et al., 2004; Schaffer, 2004).
In reviewing the literature over 30 constituencies, over 50 roles, and almost 50 skills,
abilities, attributes, and knowledge requirements were identified as being necessary for a
successful CIO. In addition, chief information officers are working in rapidly changing
environments with tremendous funding constraints, unique organizational cultures, differing
administrative structures, increased privacy and security concerns, greater functional
requirements, changing political climates, high expectations, intellectual property conflicts,
inadequate IT management approaches, aging systems, increasing accountability, expensive
2

initiatives, complex governance and decision making structures, increasing strategic
responsibility, and changing institutional priorities (Moberg et al., 2000; Brooks, 2003;
Hawkins, 2004; Clark, 2005; Hogue & Dodd, 2006; Lineman, 2007). It is easy to see how a
role such as this could easily be perceived as overwhelming. Despite these challenges,
colleges and universities “need to ensure effective IT leadership at the highest levels” (Katz
et al., 2004, p. 6).
In sorting through the plethora of recommendations for this position, a clear question
arose -- With all the information out there, in what areas should one focus to become a
successful CIO? Available literature about the CIO position is almost entirely based on
expert opinion or the experiences of past CIOs and, although these insights and experiences
are extremely valuable, quantitative research studies are needed to validate, expand, and
revise current success recommendations. Very little data was found that linked any of these
CIO roles, skills, abilities, attributes, and knowledge requirements to CIO success
empirically. In fact, complicating this further, the definition of CIO success itself is unclear
and there seems to be no standard metrics or evaluation methods used to measure CIO
performance. A 2003 study found that IT success in higher education was usually evaluated
in terms of user satisfaction, technology reliability, and budget control (Griffiths, 2003).
Although technology reliability and budget control are somewhat easily quantifiable for
evaluation, user satisfaction is more difficult. Since user satisfaction is being used as a
critical component in evaluating IT success, how does a CIO focus effort to succeed in
satisfying users? A framework is needed to determine what makes a CIO successful for
those in the position looking to improve and for those in the process of selecting their next
3

technology leader (Hawkins, 2004). This study begins the research necessary to develop
such a framework.
It is clear in reading current literature surrounding the CIO in higher education that
evidence is needed to develop a framework for CIO success -- evidence of what can be done
to improve CIO performance and how that performance is being evaluated. Therefore,
evidence-based management literature was consulted as a starting point from which to begin
this study and the process of developing a framework for CIO success.
In reviewing the evidence-based management literature, one of perhaps the most
surprising findings was that, although leadership matters, leaders do not have a “massive
influence” over organizational performance (Pfeffer & Sutton, 2006h, p. 194). In fact, “their
actions rarely explain more than 10 percent of the differences in performance between the
best and the worst organizations and teams” (Pfeffer & Sutton, 2006h, p. 192).
Leadership is a difficult craft because the expectations are always so high, the blame so swift and harsh, and leaders have less impact over what happens to their organizations than most people imagine. But it is a craft that people can develop over time and that some are better than others… there is evidence about the steps leaders can take to have a more positive effect on their organizations (Pfeffer & Sutton, 2006h, p. 214).
The literature notes that where organizational leaders may have the most positive impact is in
improving organizational and group performance, valuing employees, and developing
systems that enable others to succeed (Pfeffer & Sutton, 2006h).
One must bear in mind that one-half of organizations won’t believe the connection between how they manage their people and the profits they earn. One-half of those who do see the connection will do what many organizations have done-try to make a single change to solve their problems, not realize that the effective management of people requires a more comprehensive and systematic approach. Of the firms that make comprehensive changes, probably only about one-half will persist with their practices long enough to actually derive economic benefits (Pfeffer & Veiga, 1999, p. 47).
4
To this end, Pfeffer notes that “the best way to encourage performance is to build a high-
performance culture. We know the components of such a system, and we ought to pay
attention to this research and implement its findings” (Pfeffer, 2007a, p. 3). Therefore, rather
than focusing on the specific CIO roles, skills, abilities, attributes, and knowledge
requirements as many have in the past, this study focuses on the technology environment the
CIO creates among his/her staff and how that impacts CIO performance in terms of user
satisfaction. CIO performance is determined differently than it has been in most previous
higher education technology leadership studies. CIO and technology department
performance in this study is evaluated by internal college or university stakeholders rather
than solely the perceptions of the CIO or those within the technology organization. The
study employs an evidence-based management approach to investigate if combinations of
management practices within the centralized academic technology organization correlate
with higher perceptions of CIO and technology organization performance. Further, it
investigates if there is a correlation between high-performance culture and overall
satisfaction with CIO and IT department. Finally, it identifies what constitutes user
satisfaction in the eyes of internal college and university constituencies.
It is important to improve chief information officer performance since one of the
position’s primary roles is that of enabler. A successful CIO, therefore, has arguably
facilitated the success of those around him/her. In facilitating that success, s/he is helping
higher education institutions succeed in their education, scholarly, and service missions.
5

Research Questions
1. Which factors are most associated with user satisfaction with the centralized technology organization (Table 1)? Which factors are most associated with satisfaction with the CIO?
Table 1: Factors Potentially Impacting User Satisfaction Academic Alignment Communication Enablement Fiscal Responsibility Importance Innovation Reliability Responsiveness Shared Governance Support
2. Are technology organizations with a higher straight average of performance in the nine areas used to define organizational quality (Table 2) viewed as performing better than those which do not?
Table 2: Nine Areas Used to Define Organizational Quality Accountability Capability Coordination and Control Direction Environment and Values External Orientation Innovation Leadership Motivation
(Leslie et al., 2006; Smet et al., 2007a)
3. Are technology organizations with a higher performance in certain combinations of the nine areas used to define organizational quality (Table 2) viewed as performing better than those which do not?
6

4. Are current higher education technology leaders building high-performance organizations that value, respect, and develop their employees (Table 3)? Is there a correlation between the degree to which this is done and perceptions of CIO and technology organization performance? Are technology organizations with a higher performance in certain combinations of high-performance categories viewed as performing better than those which do not?
Table 3: High-Performance Culture Categories Good Pay Meaningful Jobs Psychological Safety and Job Security Staff Development Systems, Procedures, and Information Availability Teamwork and Team Rewards Valued, Well-Treated Employees Work Climate/Recognition
(Pfeffer, 1999a; Pfeffer, 1999b; Pfeffer & Sutton, 2006h; Pfeffer, 2007a)
5. What do CIOs believe is important for the success of the centralized information
technology organization?
6. Do CIOs have an accurate understanding of how satisfied their campus users are? Do centralized information technology employees?
7. Do centralized information technology employees believe the elements tied to their
success are the same as those tied to the centralized technology organization’s success?
8. Do CIOs have a clear understanding of what metrics will be used to evaluate their
performance? Which elements do CIOs believe are most heavily factored into their performance reviews? Do CIOs believe that those conducting their performance reviews have adequate guidelines and information to carry out meaningful evaluations?
9. How important do users believe the centralized information technology department
is to their success and that of their institution?
7

Methodology Overview and Theoretical Framework This study is based upon evidence-based management studies in 2006 and 2007 by
Leslie, Loch, Palmer, Schaninger, and Smet. They found correlations between combinations
of management practices and superior financial results in 230 global businesses (Leslie et al.,
2006; Smet et al., 2007). Additionally, it builds upon 1999, 2006, and 2007 works by Pfeffer
and Sutton who outline the keys to creating high-performance cultures (Pfeffer, 1999a;
1999b; Pfeffer & Sutton 2006h; Pfeffer, 2007a).
This study investigates if superior performance in the nine areas used to define
organizational quality and the creation of a high-performance culture correlate with
perceptions of CIO and technology organization performance. Further, this study identifies
the factors that are most associated with satisfaction with the centralized IT organization and
the CIO, organizational quality and high-performance areas of opportunity for improvement,
factors CIO’s believe are most important for the success of the IT organization, areas to
include in CIO performance reviews, criteria to assist with CIO hiring, and factors to include
in employee job descriptions and incentives. Finally, it begins the development of a much
needed framework for CIO success. Chief information officers at institutions identified with
doctoral level programs through The Carnegie Foundation for the Advancement of Teaching
(DRU: Doctoral/Research Universities, RU/H: Research Universities – high research
activity, RU/VH: Research Universities – very high research activity) were contacted to
request their school’s participation in this study which was conducted using an online survey
tool (The Carnegie Foundation Staff, 2008).
8

9
Summary
The chief information officer in higher education holds a complex and demanding
position. Currently there is little quantitative research on how to succeed as a CIO. The
literature states that perhaps the best way for leaders to positively impact their organizations
is by improving group performance, valuing employees, and enabling others to succeed
(Pfeffer & Sutton, 2006h). Therefore, this study takes an evidence-based management
approach to i if higher education CIOs whose organizations exemplify superior
organizational performance in the nine areas used to define organizational quality and/or
those that create high-performance cultures have more satisfied campus users. It also begins
the development of a much needed framework for CIO success. It is critical to higher
education institutions that CIOs succeed since they control information and technology
assets, oversee tremendous resources, and facilitate the accomplishments of the institution
and its members.

LITERATURE REVIEW
Several areas of literature were researched in preparation for this study and will be
reviewed below. First, chief information officer (CIO) literature within higher education will
be discussed. Second, CIO literature outside higher education is examined. Finally,
evidence-based management literature is reviewed.
The Chief Information Officer (CIO) The CIO in Higher Education
The title of chief information officer (CIO) is commonly given to the senior
technology leader of an organization (Moberg et al., 2000; Brown, 2004). The CIO is a
somewhat recent addition to the higher education administrative team initially appearing in
the late 1970s (Hawkins, 2004). The role of the CIO has evolved during its short history from
a technical authority to an institutional leader who creates a school’s information technology
strategy and accompanying technology policies (Drabier, 2003; Penrod, 2003; Brown 2004;
Hawkins, 2004). Over 92% of CIOs in higher education report to a chancellor/president/
CEO, an executive/other vice president, or a provost/academic vice president (Moberg et al.,
2000). As a key member of an institution’s executive administrative team, the CIO has
responsibilities toward a large number of constituencies and takes on a wide range of roles
(Zastrocky & Schlier, 2000; Penrod, 2003). In order to provide an understating of the CIO
position, literature surrounding the higher education CIO’s constituencies and roles will first
be explored.
Constituencies of the CIO in Higher Education
Operational Administrators
Operational administrators will be defined in this study as senior administrative
stakeholders that directly oversee day to day operations of the college or university. In a
higher educational environment, these positions might include vice chancellors, vice
presidents, and/or directors of such areas as finance, administration, athletics, institutional
research, development, libraries, academic advancement, student affairs, and other similar
positions. It is important that these individuals understand their role in facilitating the
achievement of campus goals and advancing the school’s mission through the use of
technology (Hawkins, 2004). Not all technology decisions should be made by the CIO and
the information technology department. Research shows that one of the most important
factors in the success of technology initiatives is that senior non-technology executives take a
leadership role in key technology decisions that effect organizational strategy.
Although it is important for campus to have a good CIO, the CIO alone is not responsible for how well IT is used on campus. As information technology and information resources have become more pervasive and more important, the collective direction and wisdom of the entire executive team is required to ensure that IT fulfills its potential (Hawkins & Oblinger, 2005, p. 13).
It is important that operational administrators “take responsibility for overseeing the systems
that manage the information assets in their specified domains and for working with each
other and the CIO to maximize the institutional effectiveness and efficiency in using
technology” (Ward & Hawkins, 2003, p.39). It is these individuals that are most familiar
with the needs and limitations of their users and should therefore be involved in the strategic
11

technology decisions that directly or indirectly impact their respective areas and the
university as a whole.
In order for a CIO to communicate effectively with operational administrators and
encourage them to take a leadership role in key technology decisions, the information leader
must have a true appreciation and understanding of their contribution to the institution. It is
imperative that the CIO realize the role each group plays for the university and how it
operates. The technology team should strive to be seen as a strategic partner for these
administrators. Knowing their strengths, weaknesses, resource needs, and challenges can help
create a sense of “being in this together” (Zastrocky & Schlier, 2000; Hawkins, 2006).
According to Hawkins, effective IT professionals need to make it apparent that they are
aware of and appreciate the fact that the institution and others at the decision making table
have priorities that must be dealt with. IT professionals must be team players who know
both when to advocate for IT resources and when to reduce the importance of their needs if
another campus initiative should take precedence (Hawkins, 2006).
Executive Leaders
There are technology decisions that raise strategic issues for higher educational
institutions which require attention from the most senior institutional leaders. These
individuals comprise the CIO’s second audience which will be referred to in this study as
“executive leaders.” These individuals are employed by the college or university, oversee the
operational administrators, and have strategic responsibility for the institution as a whole. In
higher education, these include the positions of chancellor, provost, president, and similar
titles. These individuals must realize that technology decisions are comparable in importance
to finance, government relations, and private fundraising where ultimate responsibility lies
12

with them. Therefore their leadership role extends to technology decision making as well
(Hawkins, 2004; Duderstadt et al., 2002).
Today, information technology is inextricably woven throughout the fabric of higher education and has assumed a strategic role in the fulfillment of the campus mission. It is thus imperative that campus IT decisions involve not only the chief technology administrator but also the president or chancellor and his or her leadership team (Ward & Hawkins, 2003, p.39).
According to Ayati and Curzon, support from this level is the most critical component of a
CIO’s success (Ayati & Curzon, 2003).
When higher education leaders fail to engage in IT decision-making, and fail to identify information technology as a key responsibility of functional-area executives, their colleges and universities miss countless opportunities to make strategic use of the technology, the campuses make unwise investments, and the institutional budgets bleed from IT expenditures (Ward & Hawkins, 2003, p.46). Since it is not uncommon for people throughout the campus community to perceive
IT as a black hole for resources, it is important for CIOs to gain credibility and promote
initiatives that advance the mission of the institution. Therefore, the chief information officer
must understand the mission and strategic direction of the institution and its leadership. This
is the only way to communicate effectively with executive leaders and gain their support.
Appearing selfish in looking for resources will cost the CIO campus credibility. The chief
information officer must be able to communicate resource and project needs in a way that
puts him/her in the proper goal specific institutional context. This is a critical part of being
an effective technology leader (Hawkins, 2006).
External Executive Stakeholders
Beyond the executive leaders often lie trustees, boards of governors, legislatures, and
similar audiences. The CIO faces unique challenges in addressing these audiences since it is
not often that they have direct contact. Messages from time to time may be delivered through
13

direct presentations but often CIOs reach these audiences through other channels such as
through the executive leaders, publications, and/or the media. Little literature surrounds the
best way to communicate with these audiences. It can be assumed that communicating
effectively with this audience would involve a similar strategy to that used when
communicating with executive leaders insofar as promoting initiatives that advance the
mission of the institution. Therefore, it is once again critical that the chief information
officer understand the mission and strategic direction of the institution and its leadership
(Hawkins, 2006). With this constituency group, it is important that the CIO be familiar with
higher education issues and legislation, know the key political figures and donors as well as
their positions on issues, and know who the organization’s supporters are as well as its
adversaries (Zastrocky & Schlier, 2000).
Professional Schools and Colleges
In addition to understanding the needs of the central administrative departments and
the college or university as a whole, it is important for the CIO to understand the challenges,
technologically and otherwise, for the professional schools and colleges that make up the
academic environment. This involves several groups of people including deans, faculty,
administrators (including school based technology directors), students, and staff. When
communicating with these constituencies, emphasizing collaboration and partnership is
essential (Bucher, et al., 2001). Similarly to communication with the operational
administrators, it is also important that the CIO have a true appreciation and understanding of
these groups’ contributions to the institution and how they operate. The technology team
should once again strive to be seen as a strategic partner (Zastrocky & Schlier, 2000;
Hawkins, 2006). In order to avoid misunderstandings, CIOs must manage these
14

constituencies’ expectations by clearly communicating timeframes, priorities, and resources
(Ayati & Curzon, 2003).
Technology Department
Internally to the technology function, the CIO must communicate with her
administrators, staff, business partners, and vendors. In some locations, this includes dealing
with unions (Moberg, 2000). In communicating with this group it is important that
expectations are clearly set. Additionally, meeting with staff, soliciting feedback, building
relationships, and getting to know what motivates technology team members is important for
CIO success (Bucher et al., 2001).
Advisory/Governance Committees
Advisory committees can be extremely helpful to a CIO if managed effectively.
These groups are often more about governance than advice since members are often the voice
of key constituencies that need to be paid attention to. The purpose of these groups is usually
to help define direction and policy. In order to communicate effectively with these
individuals, the CIO must be prepared to act on the information they provide or explain why
s/he did not. A technology leader that does not do so risks participant drop out or adversarial
relationship development. The CIO should consider consulting with key members outside
committee meetings to cultivate critical relationships (Hawkins, 2006).
Other External Audiences
The CIO serves and interacts with various other external audiences including the
general public, media, and community leaders and members. As with all of the CIO’s
constituencies, the CIO must manage his/her interactions with these groups and listen to them
to find out their needs, expectations, and/or perceptions. Bucher et al. recommend preparing
15

a sound bite in advance that concisely states the CIO’s goals and plans (Bucher et al., 2001).
Due to the increasing dependency of colleges and universities on information technology,
there is more and more public interest in regard to what schools are doing with IT. This can
be both positive and negative for the IT leader. Although spotlighting technology
achievements can greatly benefit the organization, the CIO may also be contacted to discuss
more unpleasant topics such as security failures or information loss. It is critical that the CIO
know how to communicate effectively with the media in all possible situations (Hawkins,
2006).
Peers
CIOs may turn to peers for advice and professional development. In addition,
information technology professionals often publish, attend, and/or present at industry
conferences to network and expand their knowledge base. EDUCAUSE
(http://www.EDUCAUSE.edu/) and Gartner (http://www.gartner.com/) are examples of
organizations that offer conferences and publish articles that serve these purposes for higher
education CIOs.
16

Table 4: Summary- Constituencies of the Chief Information Officer in Higher Education Internal Audiences External Audiences*
University Wide Advisory Committees
Campus Wide Committees Alumni Executive Leaders Board of Governors Central University Staff Community Groups Operational Administrators Community Leaders
Unions Donors Central Technology General Public
Advisory Committees Peers Business Partners Legislature IT Administrators Media IT Staff Trustees Vendors State Boards
School Based Administrators Deans Faculty IT Directors Staff
Students Distance Education Students Graduate Students Professional/Executive Students International Students Undergraduates
Visiting Students * in general not employed primarily by the institution
The Roles of the CIO in Higher Education
The chief information officer wears many hats in the world of higher education.
Overall the position in the academic environment may be defined today similarly to how the
CIO role was first defined in 1981 as a senior executive of the organization with both
17

business management and information system expertise who is responsible for information
policy, management, control, and standards (Synott & Gruber, 1981; Zastrocky & Schlier,
2000; Beatty et al., 2005). More recently, however, expectations and scope of the role have
increased to include a strategic responsibility whereby the CIO leverages technology to
achieve organizational goals. In so doing, the position has been elevated in many cases to an
executive level position that goes beyond information resource management to one that
participates in overall organizational strategic planning (Applegate & Elam, 1992; Zastrocky
& Schlier, 2000; Beatty et al., 2005). The CIO is both the head of information systems as
well as a member of the CEO’s executive team (Zastrocky & Schlier, 2000). The primary
functions of the CIO role include involvement in organizational strategic planning,
information systems planning, leading information policy development, managing
information resources, and overseeing new system development. According to Synott and
Gruber, CIOs must be leaders, managers, and visionaries with the ability to position
technology as a strategic resource (Synott & Gruber, 1982; Penrod, 2001). With more than
100 years IT management experience, Bucher, Hawkins, Horgan, Moberg, Paterson, and
Todd agree that overall the CIO needs three primary skills: communication, alliance building,
and collaboration (Bucher, et al., 2001). Clearly, CIOs need many different skill sets and take
on many roles. These roles, as identified in higher education CIO literature, will be explored
next.
Academic/Author/Researcher
There is debate surrounding whether or not the CIO should be an academic. It is
clear, however, that s/he must have a solid understanding of the academic environment
(Hawkins, 2004). Many technology leaders conduct research and contribute to industry and
18

academic publications such as EDUCAUSE. Doing so fosters dialog, facilitates relationship
building, and encourages information sharing between campus leaders (EDUCAUSE
Quarterly Staff, 2008). It is also important that the CIO stay abreast of current technologies
and industry trends (Gottschalk, 2002).
Business Partner
The CIO should actively seek to create partnerships with internal business units, other
colleges and universities, and private enterprise to gain economies of scale as well as to
provide unique educational and support opportunities for his/her constituencies. The central
technology department is no longer the only technology expert on campus. Library,
academic, and administrative departments often have their own technology expertise. They
generally have technology knowledge specific to their respective areas and often determine
which IT solutions they will implement. The CIO must recognize this and work
collaboratively to ensure that their solutions work with the campus infrastructure (Drabier,
2003).
Central System and Infrastructure Provider
The CIO oversees the campus technology infrastructure in support of the institution’s
mission. This usually includes administrative, instructional, and research computing as well
as networking, data storage, and information security (Jackson, 2004).
Change Agent
Since technology implementation and use often involves change, the CIO must be
able to facilitate institutional change (Penrod, 2001; Hawkins, 2004). As a change agent, it is
critical to communicate changes widely. The organization’s goals should be clearly defined
and a consistent message must be delivered regularly (Brooks, 2003). It is important to
19

realize that the CIO is an agent of change but is not, however, the campus change agent. In
2004 Hawkins notes:
The effective CIO understands that in advocating for technological change, his or her ultimate credibility comes from effectively communicating and realistically evaluating the goals, costs, options, tradeoffs, and risks associated with pursuing a proposed technological direction, implementation, or innovation. The CIO must be an active participant in campus discussions and must be able to help other institutional leaders understand the complexities of information resources, service delivery, technologies, and the information demands of the community (Hawkins, 2004).
Although not the campus change agent, the CIO certainly has a role in overarching
institutional change. Hogue and Dodd summarize the CIO’s change agent role well stating
that s/he “must participate in and influence change in the institution’s structure, processes,
and culture, transcending boundaries in instruction, scholarship, service, business processes,
and administration” (Hogue & Dodd, 2006, pp. 49-50).
In this role, the CIO may face resistance. To mitigate this, it is important to have a
clear understanding of the expectations regarding the scope of the CIO’s change agent role
and to include constituencies when setting priorities and making decisions. In the event that
one of these groups decides to go over the CIO’s head, it is important that the person above is
aware and supportive of the IT leaders decisions (Bucher, et al., 2001).
Coach/Motivator/Mentor/Mentee
The CIO is increasingly expected to assume the role of coach and teacher (Hawkins,
2004). Often, CIOs have been mentored and become mentors. Mentoring relationships are
important in that they nurture organizational talent (Kuo, 2000). “Veteran IT professionals
are often charged with identifying and developing future IT leaders, while future leaders
often seek current leaders to whom they can turn for support and guidance” (Hogue &
Pringle, 2005, p. 50). Mentoring relationships should be mutually beneficial. The mentor
20

and mentee must understand, support, and help to achieve each other’s goals. Finally for the
mentor-mentee relationship to work well, both should commit to honesty and active listening
as well as learn from each other, lead by example, and maintain flexibility (Hogue & Pringle,
2005).
Coalition Builder/Collaborator/Facilitator
The chief information officer must be a coalition builder (Hawkins, 2004).
Collaboration is necessary to build coalitions and successful, high-performance
organizations. According to Agee and Holisky, collaboration is necessary to overcome the
academic and IT cultural divide to accomplish the institution’s mission more effectively than
could be done single-handedly. In order to achieve this level of collaboration, the CIO and
the academic leaders “need to commit to, plan for, and model collaborative behavior” (Agee
& Holisky, 2003, p.64).
This can be done by adopting a leadership style that is more collaborative than
authoritative. The CIO does not unilaterally make decisions and sell the campus on specific
technologies. Instead, s/he must act as a facilitator “who listens to many campus
constituencies, encourages involvement and ownership of technological tolls and processes,
synthesizes the many needs and ideas, and articulates the collective IT vision for the campus”
(Drabier, 2003, p.8).
By using collaboration as a leadership strategy, CIOs can minimize conflict between
institutional players, leverage limited financial and personnel resources to increase
accomplishments, and develop a powerful tool for institutional change (Agee & Holisky,
2003). When working with his/her various constituencies, it is more important for the CIO to
focus on user needs and processes than on particular technologies (Brooks, 2003).
21

For successful collaborative relationships, clear, open, and regular communication is
essential. Open communication channels provide the groundwork. Regularized
communications including feedback mechanisms are critical for successful collaborative
activities. Planned, strategic communications support long run successful collaboration
(Agee & Holisky, 2003).
Committee Member/Leader
CIOs often serve on and/or lead committees. These may include institution strategic
planning committees, educational committees, advisory committees, governance committees
or others. It is important for the CIO to know how to develop and lead committees including
what the role of the group should be and what types of tasks are best undertaken within a
committee structure. Furthermore, the CIO must understand his/her role on the committee
and contribute accordingly (Penrod, 2001; Weill & Ross, 2004).
Communicator
To succeed as a chief information officer, effective communication skills are
necessary (Pernod, 2001; Hawkins, 2006). The CIO must plan for communication by
thinking explicitly about who needs to be involved in the communication network, how
frequent communication needs to be, and which activities are going to be the most effective.
Strategically planned communication supports successful long run collaborations and
therefore chief information officer success (Agee & Holisky, 2003).
Although the literature states CIOs must be adept communicators, some senior
executives believe CIOs are the most lacking communicators of all administrators (DeLisi,
1998; Christenberry, 2001; Pernod, 2001; Ayaiti & Curzon, 2003; Brown, 2004). The
literature documents a communication gap between technology departments and executive
22

leadership (Brown, 2004). It is important that the CIO bridge this gap and communicate
effectively (White, 2001; Agee & Holisky, 2003; Brown 2004).
The CIO must be comfortable communicating using business and higher education
vocabularies. CIOs must be fluent in both of these areas as well as able to clearly
communicate without technical terms. (Wang, 1997; Agee & Holisky, 2003; Brown, 2006).
Without adequate communication, relationships between the technology department and
others in the academic environment can suffer (Agee & Holisky, 2003; Brown, 2004; Brown,
2006). Successful communication requires planning and follow-through. Without someone
specifically responsible for maintaining communication, IT departments may easily return to
an isolated method of operation (Agee & Holisky, 2003).
Not all communication is one-way information dissemination. It is also important for
the CIO to understand the perceptions and requirements of her constituencies. When meeting
with constituencies it is important that the CIO spend time listening to and asking about their
needs. Having a short consistent “sound bite” that describes technology goals and plans is
helpful. It is also important for the CIO to encourage partnership, communication, and
collaboration (Bucher, et al., 2001).
CIOs must determine “which people or groups should be communicating on an
ongoing basis to ensure smooth operations. They also need to decide explicitly the forms that
communication should take” (Agee & Holisky, 2003, p.78).
Contract Overseer/Negotiator
As a contract negotiator, the CIO is responsible for vendor relationship management
and contract negotiation, supervision, and evaluation (Brown, 2006). More recently this role
has expanded to include national and international negotiations (Jackson, 2004).
23

Decision Maker
The CIO is a decision maker. It is the IT Leader’s role to:
Listen, encourage, coach, and foster ongoing dialogue with all constituencies, describe the range of possible implementation strategies, articulate the campus vision and plan, and make final implementation decisions based upon a combination of what people want and what will be technically feasible (Drabier, 2003, p. 9).
A CIO’s decision making process should examine whether the outcomes will support the
university’s mission (Brooks, 2003).
In making decisions, it is important that the CIO be well informed. This means that
s/he must depend on and trust the capabilities and advice of other specialists. These advisors
may be IT staff, faculty, colleagues at other institutions, members of professional
organizations, or others. Furthermore, academic evidence should be consulted. By drawing
on these resources, a CIO is able to make decisions based on a more extensive base of
knowledge (Hawkins, 2004). Making sound information technology decisions and
effectively communicating and explaining them to executive leaders are chief CIO
responsibilities in academia (Kelly & Sharif, 2005).
Educator/Advocate/Salesperson
The CIO must educate others about the ways in which new technologies and
information flows are affecting information-based environments such as higher education
(Hawkins, 2006). S/he must promote strategic technology use and educate others on how IT
adds organizational value (Brown, 2006). The chief information officer also has a
responsibility to educate others on technology limitations (Hawkins et al., 2003; Brown,
2004). The CIO must also be an advocate. S/he must advocate to both internal and external
constituencies on behalf of information technology and the institution (Jackson, 2004).
24

Enabler
All CIOs are in the “service” business since they assist students, faculty, and staff in
achieving their goals. As a service partner, the IT leader must help the campus community
determine how information technology can assist them in achieving the goals of their units
and the campus at large. The CIO must communicate effectively, listen, and establish trust in
order to be perceived as acting in partnership with end users as well as be careful not to
overstep the boundaries of his/her local expertise (Hawkins, 2006).
Entrepreneur
The CIO must often function as an entrepreneur in that s/he identifies organizational
needs and develops innovative solutions. “A major responsibility of the IS manager is to
ensure that rapidly evolving technical opportunities are understood, planned, implemented,
and strategically exploited in the organization” (Lineman, 2005, p. 81).
Evaluator
CIOs agree that there is a need to assess and evaluate IT efforts including identifying
the benefits of IT investments, understanding student and faculty IT concerns, evaluating
employee and project team performance, and calculating return on investment. There is a
gap between the number of CIOs who believe this to be important and the actual level of
current assessment and evaluation taking place (Green, 2007).
Project-based work highlights “individual contributions, innovation, and leadership
potential” (Renaud & Murray, 2003, P. 175). Although Renaud and Murray wrote about
evaluating and finding leadership potential in higher education librarians, it can be assumed
that the chief information officer as well must find internal leaders and may do so by defining
and evaluating successful individuals, groups, and projects based on clearly stated metrics.
25

In order to do so, s/he must be able to determine project “objectives, measures of success,
deliverables, and a specific beginning and end” (Renaud & Murray, 2003, p. 176).
Financial Manager/Resource Allocator
“Successful IT leaders need to understand the financial environment in which the
institution operates in order to best plan and implement supporting information technologies”
(Goldstein, 2007, p. 63). To do so, the CIO must understand higher education financial
reports. S/he should track key numbers, understand the financial strength of the organization,
and know the financial resources necessary for success (Zastrocky & Schlier, 2000). The
constantly increasing gap between funding and expectation requires that the chief
information officer make strategic choices for how to use technology resources effectively
(Brooks, 2003).
The typical college or university spends 5 percent to 10 percent of its operating budget on information technology… Particularly as funds become scarcer, deciding how much to invest in information technology, through what mechanisms, and for what purposes becomes a difficult university wide challenge…. Such negotiations must reflect a consistent, strategic view of information technology and its institutional role. Developing and espousing that view is the … most rapidly evolving element of a CIO’s role (Jackson, 2004, p. 23).
Deciding how to allocate funds should come directly from strategic discussions.
Unfortunately, Ross and Weill find this is often not the case. Instead, IT resources are often
given out across constituencies “satisfying everyone a little and no one completely.”
Allocating funds in this “political” manner is not strategic (Ross & Weill, 2002; Ward &
Hawkins, 2003, p.42). In addition to financial resources, the CIO must also allocate human
and information resources (Gottschalk, 2002; Lineman, 2007).
26
Fundraiser/Politician
According to Ann Field, CIOs must manage in all directions to obtain the money and
influence they need. The position has moved from technical to political (Field, 2001; Penrod,
2001). The technology leader must have the ability to secure IT resources (Penrod, 2001).
The chief information officer should also be familiar with higher education issues and
legislation. S/he must know the key political figures and donors as well as their positions on
important issues. In addition, the CIO must know who the organization’s supporters are as
well as its adversaries. Finally, the CIO should be familiar with relevant higher education
media reports (Zastrocky & Schlier, 2000).
Informaticist/Information Manager/Information Security Provider
As an informationist and technology strategist, the CIO must secure the institution’s
data assets and align IT and institutional goals (Brown, 2006).
CIOs are being asked to do more than simply manage information technology – they are being asked to archive and preserve not just the assets themselves but also the historic applications and data formats that will someday be required to decode these archives (Hawkins & Oblinger, 2007, p. 10).
The CIO must know what information is needed and make it accessible. S/he also should
ensure that data is presented in a way that results in value and information creation (Hawkins
& Oblinger, 2007).
Security and privacy issues are also key concerns for the CIO.
Privacy and academic freedom are critical components of campus culture; it is vital that decisions on policies and practices regarding security and related issues be carefully vetted, understood, and authorized by both the highest levels of the campus leadership and the representatives of the campus community (Ward & Hawkins, 2003, p.45).
CIOs are in a position to address institutional data demands as well as security and privacy
issues and this role is becoming increasingly important (Hawkins & Oblinger, 2007).
27

Innovator
Centralized higher education IT departments, overall, are not perceived as overly
supportive of technology innovation. Data shows it likely that IT leaders who foster and
support innovative environments positively impact their institution. IT professionals who
feel that they work in innovative environments agree more that their department is
influential, that IT is an important part of institutional strategic plans, that IT contributions
are valued, that IT facilitates positive cultural change, and that the institution is
technologically forward thinking (Katz et al., 2004). This seems to indicate that CIOs may
be more successful if they are able communicate the importance of technology innovation
and create an innovative environment.
Leader
A term “leader” is not the same as the term “manager” although managers can be
leaders and vice versa. Leaders have a vision and are able to get others to want to strive
toward it. They are able to bring people together for a shared goal (Hawkins, 2004).
Direction is set by the leader, while a manager creates systems and structure to pursue set
directions (Kotter, 1990; Renaud & Murray, 2003).
In 2003, Ware found that IT and business alignment was a top CIO issue (Brown,
2004). As the technology leader, the CIO must be able to align these to meet the institution’s
goals (Feldman, 2003; Brown, 2004). According to Poley, effective communication is critical
to alignment success (Poley, 2001; Brown, 2004).
Proper alignment ensures that institutional and IT leaders agree on the optimal use of IT resources – and recognize technology’s intrinsic value to the institution… The heart of IT’s alignment with an institution is a common understanding of that institution’s priorities, which is derived from an inter-connected web of strategic leadership activities – IT strategic planning, IT governance, communications, and measurement/assessment (Pirani, 2004, p. 1).
28

In order to overcome the cultural differences and problems often seen between the
technology and academic departments of an institution, Agee and Holisky suggest using
collaboration as a leadership strategy. Collaborative leadership is an effective strategy for
overcoming this cultural divide since:
Collaborative activities improve mutual understanding, increase respect for the expertise embodied in each organization, open up the possibility of commonly-agreed-upon solutions, enable more effective use of resources, and, as a result of all these, build trust relationships that foster further collaboration (Agee & Holisky, 2003, p.70). Katz found that the majority of senior IT leaders that responded to the 2004
EDUCAUSE ECAR survey had high transformational leadership scores which have been
associated with organizational effectiveness (Burns, 1978; Katz et al., 2004).
“Transformational leaders are good role models: they inspire, empower, and motivate staff;
encourage creativity; and effectively communicate a shared mission and vision” (Katz et al.,
2004, p. 5).
As leaders, CIOs should focus on creating value for their institution. “Our goal as
CIO leaders must be to take this mass of commoditized technology and apply it to today’s
problems in creative and fundamentally different ways. That’s where IT remains strategic,
and it’s how we can provide value as CIO leaders” (Chester, 2006, p. 57). Hogue and Dodd
state, “flexibility, adaptability, vision, innovation, and creativity will play very important
roles in helping the next generation of leaders think beyond current paradigms and move
toward fundamental transformation” (2006, p. 50).
John C. Hitt – fourth president of the University of Central Florida (UCF) states that
as a leader:
29

If you can formulate a plan, as set of activities, a list of goals that people who are involved in the institution can remember, can understand, and can trust will take them in the direction that they want to go and that the institution needs to go, then you have a powerful vehicle for building something that is going to serve the needs of students, faculty, and staff—and the larger society—in ways that will make all participants proud (Barone, 2005, p. 32).
CIOs are the technology leaders of an institution and it is in this role that they are able to
create value and ensure business alignment.
Liaison
The CIO must communicate with many different groups both internal and external to
the college or university. Often s/he must act as a liaison between these groups and the IT
organization, college, or university. These groups include the constituencies discussed
earlier (Gottschalk, 2002; Lineman, 2007, p. 81).
Manager/Administrator
As a manager, the CIO should clearly communicate his/her management philosophy
including which management theories s/he respects and what transformation strategies s/he
believes are best for the organization. Once the CIO defines his/her strategy, it is important
that it is communicated widely. It is also imperative that the CIO understand the latest in
organizational development strategies and have the ability to build and retain a talented staff
and management team (Penrod, 2001). The CIO should define the roles of the organization
and communicate those to his/her staff. It is in this way that staff members understand how
their jobs are relevant (Brooks, 2003).
Additionally, the CIO must build and/or sustain a viable governance structure. Peter
Weill and Jeanne Ross define IT governance as:
Specifying the decision rights and accountability framework to encourage desirable behavior in using IT. It governance is not about making specific decisions–
30

management does that—but rather determines who systematically makes and contributes to those decisions (Weill & Ross, 2004, p.2).
IT alone should not be responsible for all technology decisions. A governance structure
outlines those with input as well as those with decision rights and defines IT accountability
(Clark, 2005).
Marketer
Zastrocky and Schlier state that the chief information officer should be familiar with
the school’s competition as well as the key figures associated with successful marketing of
the organization. They also note that the CIO should understand the institution’s critical
success factors as well as its strengths and weaknesses (Zastrocky & Schlier, 2000).
Brooks touches on the idea of integrated marketing when discussing the importance
of defining what each area of the technology organization does so that a common message
can be given to staff, clients, and the institution about what can be expected from the IT
department. A clear, constant message, if well communicated and understood, enables
everyone to accurately represent what the organization does (Brooks, 2003).
The IT organization must also be aware of possible marketing pitfalls. According to
a recent CIO magazine article, marketing efforts will be unsuccessful when IT’s credibility is
low and if constituent experiences are counter to what is communicated. It is important to
identify those who make information technology decisions and those who influence them as
primary marketing targets. Effective marketing requires understanding how each customer
defines value and ensuring “that IT is both delivering against their tangible expectations and
over-delivering on the intangibles” (Cramm, 2005, p.2).
31

Monitor
It is important that the technology leader stay on top of technical changes and
competition. To this end, it is necessary for him or her to periodically scan the external
environment for new innovations.
In acting as the firm’s technical innovator, the IS manager identifies new ideas from sources outside of the organization. To accomplish this, the IS manager uses many sources including vendor contacts, professional relationships, and a network of personal contacts (Lineman, 2005, p. 81).
Policy Maker/Standards Developer
CIOs often have institutional policy development responsibility (Penrod, 2003).
Additionally, the chief information officer must be involved in technology policy issues.
S/he must be able to align campus policy with federal policy, regulatory demands, and
campus operations. It is imperative that the CIO be aware of relevant policy issues (Hawkins,
2004).
The CIO, for “reasons of policy and efficiency and because of legal constraints” must
work with institution leaders to develop information technology policies, standards, and
procedures (Jackson, 2004, p. 23). The CIO should also ensure that peoples’ technology use
does not negatively impact others or compromise security (Jackson, 2004). It is important
that CIOs work with campus leaders to set a reasonable standard of service in line with
available resources.
Before making a decision that a given level of service should be maximized, leaders should examine the service in light of the trade-offs between costs and goals… with the consensus nature of campuses, it is often easier to make a decision that will result in the least amount of criticism and complaint. Faculty advisory committees sometimes will shoulder a portion of this responsibility, but often they are not concerned with—or even charged with—the economic consequences of their decisions (Ward & Hawkins, 2003, p. 44).
32

Therefore, it is important that the CIO provide appropriate campus leaders with the options,
costs, and the trade-offs involved in making service level decisions so that the group can
work together to implement standards.
This consultation cannot be relegated to the loudest or the most cantankerous member of the community but needs to fit with broad institutional objectives and be backed up with the authority of the academic leadership, not just the perceived arbitrariness and capriciousness of the CIO. The trade-offs regarding reliability, customization, and responsiveness on IT matters must become campus decisions (Ward & Hawkins, 2003, p. 44).
Project Manager
Technology leaders should have project management skills (Haggerty, 2000; Smaltz,
2000; Brown, 2004). Since 2001 upgrading and/or replacing enterprise resource planning
(ERP) systems has been a top issue for higher education institutions (Green, 2007). The
CIO, who is responsible for critical and complex institutional projects such as ERP
implementations, has to be a project manager capable of successfully completing large,
complicated, costly, impactful initiatives (Haggerty, 2000; Brown, 2004).
Public Speaker/Presenter/Public and Media Relations Manager/Spokesperson
The chief information officer must be a skilled public speaker, since the position
often involves communicating future plans in a persuasive manner. Success as a public
speaker ultimately depends on the individual’s credibility (Hawkins, 2004). Due to the
increasing dependency of colleges and universities on information technology, there is more
and more public interest in regard to what schools are doing with IT. It is therefore also
critical that the CIO know how to communicate effectively with the media (Hawkins, 2006).
Student
Technology and higher education fields are always changing and a successful chief
technology officer in a college or university environment must stay up-to-date on the fields
33

of management, leadership, higher education, and technology. What leaders read contributes
to shaping their views on issues and this continuous learning is essential to developing a
strategic broader view of the factors affecting technology, the campus, and the field of higher
education (Hawkins, 2006).
Strategic Planner/Consensus Builder
Strategic planning is an important CIO responsibility (Brown, 2006). Seventy-three
percent of campuses participating in the 2007 Campus Computing Project have an
institutional IT strategic plan (Green, 2007). As campuses continue to expand IT uses and
expectations, strategic planning is necessary to avoid wasting scarce resources and initiatives
that fail to make meaningful progress (Maughan, 2001).
According to Drabier, strategic planning is about communication and building
consensus among the constituencies of the institution (2003). It is important in higher
education due to rising costs and productivity and accountability demands as well as
increasing pressure from the economy, competition, and government regulation (Drabier,
2003; Brown, 2004).
In higher education being strategic means being closely aligned with both the academic and business missions of the institution…Technology projects that don’t support strategic goals have declining value for the institution (Chester, 2006, p. 57). To be a respected member of the executive team, the CIO must contribute more than
information technology specific initiatives. S/he must also understand institution-wide issues
and participate in strategizing solutions for them. CIOs should suggest potential technology
based solutions when appropriate and manage the technology department as a profit-center
(Zastrocky & Schlier, 2000). According to Hogue and Dodd, the CIO must transform
campus IT into “strategic organizations” poised to meet current and future needs (p. 49).
34

Support Provider/Secure Service Provider
This role involves maintaining overall technology support, responsiveness, and
security (Brown, 2006). As technology continues to pervade the academic environment, IT
departments will be valued for the achievements they make possible rather than the difficulty
of their tasks or quantitative efficiency measures. This means the CIO must be able to
demonstrate and communicate that resources are appropriately targeted and contribute to
programmatic achievements (Brooks, 2003).
Many institutions are moving to a more flexible multi-tiered support structure. In this
type of environment, there are both centralized and distributed support services. The CIO
must make sure that the core centralized services are “stable, well supported, and cleanly
delivered” (Brooks, 2003, p.52). Additionally, s/he must make sure that initiatives
undertaken outside of the central IT organization work with the campus infrastructure
(Drabier, 2003). In this type of environment, it is important to focus on achieving goals by
collaborating across organization boundaries (Brooks, 2003).
Team Builder
The CIO must be able to strategically design teams by identifying their type and goals
and developing their structure and capabilities. Once in place, it is important to build a
team’s effectiveness by providing conflict resolution and interpersonal communication
trainings, building group trust, engendering mutual respect, and developing commitment and
cohesiveness (Penrod, 2001).
Visionary
The CIO must have a visionary capacity as well as the ability to generate a shared
vision for the organization’s future (Synnott & Gruber, 1981; Penrod, 2001). Building a
35

campus-wide vision for information technology is essentially a consensus-building task
which requires the CIO to have developed trust with the many campus constituencies. The
trust needed is “founded upon good communication within the campus concerning IT issues,
concerns, and developments, the existence of a true service attitude toward the delivery of
technical support and services, and a history of acting in a collaborative manner” (Drabier,
2003, p.6).
In summary, the CIO position is a difficult and demanding one comprised of many
roles. The roles suggested in the higher education literature for college and university CIOs
are recapped in Table 5.
36
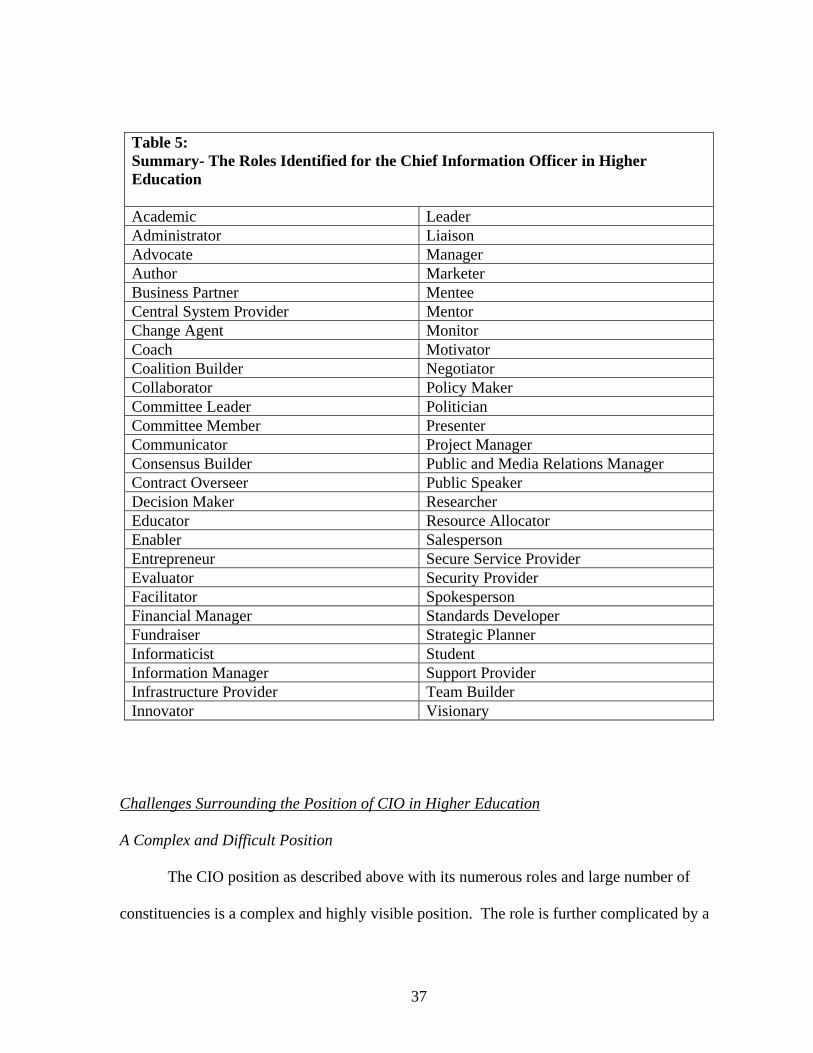
Table 5: Summary- The Roles Identified for the Chief Information Officer in Higher Education Academic Leader Administrator Liaison Advocate Manager Author Marketer Business Partner Mentee Central System Provider Mentor Change Agent Monitor Coach Motivator Coalition Builder Negotiator Collaborator Policy Maker Committee Leader Politician Committee Member Presenter Communicator Project Manager Consensus Builder Public and Media Relations Manager Contract Overseer Public Speaker Decision Maker Researcher Educator Resource Allocator Enabler Salesperson Entrepreneur Secure Service Provider Evaluator Security Provider Facilitator Spokesperson Financial Manager Standards Developer Fundraiser Strategic Planner Informaticist Student Information Manager Support Provider Infrastructure Provider Team Builder Innovator Visionary
Challenges Surrounding the Position of CIO in Higher Education A Complex and Difficult Position
The CIO position as described above with its numerous roles and large number of
constituencies is a complex and highly visible position. The role is further complicated by a
37

rapidly changing technology environment, as well as often times by a lack of understanding
and support by upper management, lack of strategic funding, lack of technology standards,
aging technology systems, high expectations, and inadequate IT management approaches
(Moberg et al., 2000). Higher education environments can create an additional challenge for
the CIO in that they are typically slow to change, have unique organizational cultures, are
comprised of differing administrative structures, and maintain traditional approaches to
governance and decision making (Lineman, 2007).
In addition to the numerous roles and responsibilities, there are other challenges that
make the CIO position difficult such as, “changing priorities in the institution, expensive and
visible initiatives, and increasing expectations for ubiquitous and seamless service” (Brooks,
2003, p.42). Higher education’s shared governance approach to decision making also makes
the role increasingly complex (Clark, 2005). Hogue and Dodd note:
Diminishing financial support, greater user expectations and functional requirements, increased public and constituent accountability, economic globalization, deeper concerns over privacy and security, digital content and intellectual property conflicts, changing political climates, and escalating competition from both traditional and nontraditional education “franchisees” can be viewed as threats and pressures (2006, p. 49).
It is clear that the CIO position is indeed complex.
Turnover Turnover is high in CIO positions. In 2000, Moberg et al. reported that 52.9 percent
of CIOs surveyed had been in their position less than three years. Zastrocky and Schlier also
note the lack of longevity in the CIO role as compared to other executive academic positions
(2000). In industry, it is relatively well known that the title CIO not only stands for “chief
information officer,” it also, unfortunately, “is said to stand for Career Is Over” (Rothfeder &
Driscoll, 1990; Lin, 2004, p. 51).
38
Lack of Career Progression
Little was found in the higher education literature surrounding career paths beyond
the CIO role. In industry literature, Applegate and Elam found senior IT executives rarely
leave positions for promotion (Applegate & Elam, 1992).
Confusion Regarding Proper Training/Background
There is little clarity surrounding the proper preparation for the role of CIO. There is
much debate surrounding what educational background a CIO should possess and there is
also a lack of clear career progression to the role (Hawkins, 2004).
The selection of a CIO may be hampered… by the lack of a systematic identification of the important educational and career experiences this individual should possess in order to be successful in leading this important function in the higher education environment. A review of the literature revealing a list of standardized qualifications that a CIO needs to possess in order to be successful has not been identified. There is a lack of research that clearly identifies the importance of formal education and career experiences that current CIOs have identified important in aiding his or her success (Schaffer, 2004, pp. 50-51).
Schaffer found that CIOs believed beneficial educational fields included business,
information systems, and educational leadership. CIOs also noted that other important
competencies for success in the position included understanding school politics, networking
with others in the CIO role, strategic partnerships, and planning, leadership, and strategy
development skills. Schaffer concludes that “additional research should be conducted to
investigate the relationship between the formal fields of education deemed important for the
success of a CIO and the educational preparation for CIO candidates” (2004, p. 128).
Currently certificate programs, business schools, computer science programs, and schools of
information are often part of the CIO’s educational background (Katz et al., 2004).
Selecting a CIO is Difficult
Due to the complexity of the CIO role, lack of role definition, and a diverse set of
39

expectations, selecting a CIO is a difficult task. A framework is needed to determine what
makes a CIO successful for those in the position looking to improve and for those in the
process of selecting their next technology leader (Hawkins, 2004).
Chief Information Officer Success Definition is Unclear
Lack of Clear Definition and Metrics
There is not a clear definition of what constitutes CIO success and how it should be
measured. “Only one-third of institutions include metrics for assessment at the time IT
initiatives are approved… Only a few institutions use full methodologies such as the
Malcolm Baldridge process or Balanced Scorecard” (Albrecht et al., 2004, p. 103). Many
past CIOs and industry experts offer advice and insight on what makes a CIO successful, but
their suggestions are broad and varied and a standard method of CIO evaluation could not be
found in the higher education literature. Perhaps the most commonly cited success measure
was how well technology enables the institution to reach its goals or individuals within the
organization to reach theirs (Brooks, 2003; Jackson, 2004; Chester, 2006). “Potential CIO
leaders should understand that the value of IT comes from the benefits realized by those
outside the IT organization. Success is best understood from their perspective” (Chester,
2006, p. 58). Others noted communication that enables long run collaborations leads to CIO
success (Agee & Holisky, 2003). Still another wrote that technology invisibly is a sign of
success. “For information technology, at least in higher education, invisibility constitutes
success. As an instrument rather than a goal, IT succeeds by advancing other goals like
research, teaching, and service” (Jackson, 2004, p. 22). A 2003 study found that that success
for IT in higher education was usually evaluated in terms of user satisfaction, technology
40

reliability, and budget control (Griffiths, 2003). Although technology reliability and budget
control are somewhat easily quantifiable for evaluation, user satisfaction is more difficult.
Although these may very well be identified as keys to CIO success, how these goals are best
achieved, measured, and evaluated is an area in need of further study. Additional advice and
research on how to be a successful CIO in higher education will be explored next.
How to be a Successful CIO in Higher Education – Advice from Experts/Past CIOs
Many studies offer advice based on the experiences of past CIOs or other industry
experts on how to be successful as a CIO (Moberg et al., 2000; Bucher et al., 2001; Agee &
Holisky, 2003; Ayati & Curzon, 2003; Brooks, 2003; Drabier, 2003; Hawkins, 2004;
Hawkins, 2006). Hawkins states that strong communication skills, boundary-spanning
ability, leadership ability, familiarity with the academic environment, coalition building
ability, change management ability, technological skills and understanding, and management
experience are necessary qualities in a CIO (Hawkins, 2004). Ayati and Curzon state that a
CIO’s success depends on, the “ability to understand the environment, manage effectively,
communicate skillfully, know the technology, align with the mission, establish priorities, set
clear directions, and support users” (Ayati & Curzon, 2003, p. 23). Bucher et al. agree with
EDUCAUSE President Brian Hawkin’s recommendation that a CIO must have excellent
communication and alliance building skills as well as possess the ability to collaborate. They
break these into five key skills: flexibility, pragmatism, relationship management, budget
management, and expectation management (Bucher et al., 2001). Pete DeLisi, academic
dean of the Information Technology Leadership Program at Santa Clara University states,
“The ideal CIO needs to be a marketer, a strategist, a technologist, a leader, an organizational
behaviorist – all these things” (Kwak, 2001, p.16; Schubert, 2004, p. 65). Ward and Hawkins
41

note that the CIO “must articulate goals that integrate information technology within the
institutional strategic plan, align planning and assessment at all levels, and focus on
outcomes” (Ward & Hawkins, 2003, p.40)
More recent advice on how to be a successful CIO includes that from Goldstein,
Chester, Hogue, and Dodd. “Today’s leaders in higher education information technology (IT)
know that a significant factor in their success is a solid understanding and skillful
management of finances related to IT” (Goldstein, 2007, p. 61). Chester advises:
Accept the commoditization of IT and use it to your institution’s advantage by shrinking costs. Become strategic by changing the culture of your organization and linking its success to the success of others outside the group…Take advantage of strategic sourcing… measure and report the performance of your organization (2006, p. 60).
Hogue and Dodd state that the “transformation of IT [into strategic organizations capable of
meeting current needs and future positioning requirements] is the minimum achievement for
a CIO’s performance to be considered acceptable” (2006, p. 49). It is easy to see how such
advice may be helpful and overwhelming at the same time. There is little evidence that any
of this advice has been empirically proven to lead to CIO success, especially given the fact
that the CIO “success” definition is unclear, and there is little written on how to translate
much of this advice into action.
How to be a Successful CIO in Higher Education – Research Studies
There were a few empirical studies found that offered data on how to be a successful
CIO in higher education. Pirani found that “higher levels of perceived effectiveness in the
core activities of planning, governance, and communication do indeed result in higher levels
of perceived alignment between IT and the institutional purpose” (Pirani, 2004, p.1). He
42

established that IT departments that do the following are perceived to be more closely
aligned with organizational goals:
• Clearly articulate campus vision and/or priorities • Consider planning important and closely linked to the institutional budget • Publish an institution or a campus IT plan or engage in planning activities
continuously • Report dynamic or stable environmental climates • Perceive their IT governance process to be effective • Perceive their it strategic planning process to be effective • Have greater communication with and involvement of key constituents, especially
faculty and deans • Clearly document objectives at the time IT initiatives are approved (Pirani, 2004,
p.2).
Perhaps the organization that contributes the most empirical research for the higher
education technology community is The EDUCAUSE Center for Applied Research (ECAR).
It was started in 2002 “to create a body of research and analysis on important issues at the
intersection of higher education and information technology” (Albrecht et al., 2004, p. 5;
Katz et al., 2004, p. 5). A 2004 ECAR study found that that mentoring may contribute to
CIO success. An association between mentoring and improved transformational leadership
abilities, higher salaries, and industry commitment was found in their 2004 higher education
study (Katz et al., 2004). The study found that IT leaders have high transformational
leadership scores which are often associated with higher organizational effectiveness.
These leaders are good role models who empower staff members to achieve higher standards and engender trust in others. They are change agents who articulate a clear, shared vision of organization and establish meaning in organizational life (Katz et al., 2004, p. 64).
The study also found that CIOs who fostered more innovative climates had organizations
whose members perceived the IT department to be more influential. IT effectiveness
markers were put forward based on a study conducted in 2003 by Nelson and Green which
surveyed CIOs to find that business, human relations, and technology expertise were
43

perceived as critical for success. The markers developed were based on the need for the CIO
to understand institutional culture, perceived needs, politics, technology impact, IT staff,
influential groups, and executives (Nelson & Green, 2003; Katz et al., 2004). A 2003 ECAR
study found that “leadership style appears to play an important role in CIO effectiveness”
(Nelson, 2003, p. 10). Again, however, the idea that CIO success can come from a
proficiency in these areas is based primarily on the perceptions of CIOs or IT staff members
and not empirical evidence that ties this expertise to actual success measurements by those
outside the IT organization.
Finally, Sabherwal and Kirs found that IT alignment with a school’s strategic needs
improves perceived performance and technology success (Sabherwal & Kirs, 1992; Katz et
al., 2004). Institutions with higher perceived alignment with organizational goals also have
greater perceived effectiveness in planning, governance, and communication (Albrecht et al.,
2004).
Challenges Summary
In summary, the CIO position is a complex and challenging one. High expectations, a
rapidly changing environment, lack of management support, high visibility, lack of funding,
differing administrative structures, lack of standards, aging systems, inadequate IT
management approaches, unique higher education cultures, challenging or non-existent
governance structures, increasing privacy and security demands, high turnover, uncertain
career progression, increasing responsibility, unclear training, lack of success definition, and
unclear evaluation metrics all contribute to creating a difficult position in need of a
framework for success. The skills, abilities, attributes, and knowledge requirements
44

suggested in the higher education literature for college and university CIOs are recapped in
Table 6.
Table 6: Summary- Skills, Abilities, Attributes, and Knowledge Requirements Identified for the Chief Information Officer in Higher Education Ability to Align IT and University Goals Innovation Ability to Align IT and Individual Goals Institutional Commitment Ability to Align Planning and Assessment
Interpersonal Skills
Ability to Build Alliances, Coalitions, and Strategic Partnerships
Knowledge of Academia
Ability to Build and Retain Talented Staff
Knowledge of Marketing
Ability to Enable the Success of Others Knowledge of Organizational Culture Ability to Engender Trust in Others Leadership Skills Ability to Focus on Outcomes Listening Skills Ability to Prioritize Management Skills Ability to Secure Financial Resources Networking Skills Ability to Set Direction Organizational Behavior Skills Ability to Sustain a Viable Governance Structure
Organizational Skills
Adaptability Planning Ability Alliance Building Skills Political Savvy Boundary-Spanning Ability Pragmatism Business Acumen Relationship Management Skills Change Management Ability Respect for Colleagues Collaboration Skills Self Confidence Communication Skills Strategy Development Skills Creativity Strong Work Ethic Credibility Technical Knowledge Decisiveness Trustworthiness Evaluation Skills Understanding of CEO’s Outlook and DirectionExpectation Management Skills Understanding of Fellow Executives Financial Management Skills Vision Flexibility
45

Top Concerns for CIOs in Higher Education Since 1990, Kenneth Green has conducted a yearly study, The Campus Computing
Project, of computing and information technology in American higher education. Each year
senior technology officers across the country (a representative sample of 1200 two- and four-
year public and private colleges and universities) participate in the study and answer many IT
questions including what their top concerns are. In 2007, 555 two- and four- year public and
private institution IT leaders participated in the study and identified their top concerns as
network and data security (25.5%), upgrade/replace ERP (13.0%), and hiring/retaining IT
staff (12.3%). The reemergence of the “hiring/retaining IT staff” issue as a major concern
reflects a recent increase in competition for IT talent. This concern was also elevated during
the dot.com era around 2001. CIOs in public research universities and public four-year
colleges see hiring/retaining IT staff as an even greater concern (Green, 2007).
Table 7: Top Concerns for CIOs in Higher Education in 2007 The Campus Computing Project Public Research Universities
Private Research Universities
Public 4-Year Colleges
Private 4-Year Colleges
Upgrade/replace ERP (21.8%)
Network and data security (28.9%)
Network and data security (25.0%)
Network and data security (24.9%)
Network and data security (20.5%)
Upgrade/replace ERP (15.6%)
Hiring/retaining IT staff (16.7%)
Instructional integration of IT (14.5%)
Hiring/retaining IT staff (18.0%)
Hiring/retaining IT staff (13.3%)
Upgrade/replace ERP (11.7%)
Financing IT and IT user support (11.4%)
(Green, 2007, p. 4)
46

Since 1999, EDUCAUSE has sent out an annual survey that asks campus IT leaders
to identify their top IT challenges. Once criticism worth noting about the EDUCAUSE
annual survey is that it is not taken by a representative sample of the higher education
population but rather by EDUCAUSE members. For 2007, 591 of 1,785 recipients
responded (39.7% from private institutions, 53.2% from public institutions) that their top
concerns were funding IT and security (Camp et al, 2007).
Table 8: Top Concerns for CIOs in Higher Education HistoricallyThe Campus Computing Project 2003 2004 2005 2006 2007
Instructional integration
Network and data security
Network and data security
Network and data security
Network and data security
Upgrade/replace ERP
Instructional integration
Instructional integration
Instructional integration
Upgrade/replace ERP
Financing IT
Upgrade/replace ERP
Upgrade/replace ERP
Upgrade/replace ERP
Hiring/retaining IT staff
EDUCAUSE 2003 2004 2005 2006 2007
Funding IT Funding IT Funding IT
Security and identity management
Funding IT
Administrative/ERP/information systems
Administrative/ERP/information systems
Security and identity management
Funding IT Security
(Crawford et al, 2003; Maltz et al 2005; Dewey et al, 2006; Camp et al, 2007; Green, 2007, p. 3)
47
It is clear from the historical information above that over time funding, security, and
enterprise information systems have be ongoing concerns for CIOs. Other issues include
instructional integration and more recently hiring and retaining IT staff, particularly in public
institutions. In 2004, Schaffer notes a difference between retention issues in higher
education versus that in industry:
The biggest difference noted was in the retention of the IT staff and the culture of these two environments. The corporate world can usually recruit and afford to pay for the technical expertise required for the environment, whereas, a CIO in higher education needs to work at recruiting and retaining qualified staff with rewards other than money (p. 49).
As staffing in higher education becomes a more pressing issue, CIOs will be challenged to
look at human resource practices in an effort to recruit and retain top talent.
Summary of the CIO in Higher Education Literature The chief information officer position in higher education is a complex and
challenging senior level technology role. The higher education literature clearly highlights
this complexity in the number of constituencies the CIO serves, roles s/he plays, ongoing
challenges the position faces, and the skills, abilities, attributes, and knowledge suggested
that a CIO have.
Although there are numerous articles written about CIOs in higher education, most
are based on advice from past CIOs and relatively few are empirical research studies. As the
role of the chief information officer continues to elevate in importance and escalate in
responsibility and scope, it is imperative that empirical research be conducted to, as Hawkins
in 2004 notes, provide a framework for CIO success.
48

The CIO Outside Higher Education
To get a comprehensive understanding of the chief information officer position, it is
also necessary to review industry CIO literature. Similar to that of higher education literature
found, the CIO literature in industry is comprised mostly of advice from past CIOs and other
industry experts. In examining the CIO literature outside higher education it is important to
look at current trends, success measures, successful CIO practices and characteristics, and
top concerns for industry CIOs.
Current Trends in the Position The chief information officer role in industry is becoming one of senior level strategic
businessperson even over that of technologist (Schubert, 2004). Schubert states:
There remains an assumption that the CIO is technically savvy, but trends demonstrate an even greater assumption that the CIO is business savvy – specifically in terms of the business of the company and how the IT function contributes to the overall value of the company (Schubert, 2004, p. 50).
In addition to meeting technological needs, implementing technology strategy, and managing
human resources, one of the chief information officer’s top responsibilities is “building a
reputation as a knowledgeable business executive” (Beatty et al., 2005, p.2). As trusted a
senior management team member, the CIO is assuming an increasingly strategic role
(Robbins & Pappas, 2004).
Another important and often mentioned trend is that toward business and technology
alignment and the importance of value creation. High-performance companies are
increasingly recognizing the value derived from strategic IT and business alignment
(Schubert, 2004). Reich and Nelson note:
49
According to CIOs, their virtual, global IT organizations need to move even closer towards the strategic centre of the company, requiring increased business knowledge, improved ability to influence and negotiate, and a renewed focus on standardized architectures, metrics, and value creation (2003, p.28).
The CIO serves as the liaison between business and technology. S/he designs and delivers IT
solutions that meet business goals. Technology is a critical component of today’s business
strategies and IT leaders are responsible for ensuring business value is derived from IT
investments (Robbins & Pappas, 2004; Hugos, 2007).
A recent Gartner survey found that the CIO and technology organizations are
becoming more and more involved in overall business growth and competitiveness. Marcus
Blosch, VP and Research Director, states “The survey results make it evident that business
expectations of IT have changed dramatically, and CIOs are expected to move beyond
concerns about cost, security and quality to help grow the business” (CXOToday Staff, 2006,
p.1).
Today’s industry CIO role extends beyond traditional technology management and
internal business reach. Often the IT leader must delegate internal issues to subordinates
while s/he focuses on external constituencies such as customers, businesses, suppliers,
venture capital firms, analysts, media, and others. Top external concerns “include supply
chain integration and data flow, network distribution and globalization, corporate intellectual
asset management, and strategic alliances (Robbins & Pappas, 2004, p. 5).
The final trend identified is that toward software-based services economies.
Technology is increasingly being used in customer relationship and distribution management.
The IT leader is also expected to find new avenues for revenue growth and to sustain
productivity (McKenna, 2004). This trend necessitates a new kind of CIO:
50

The extent to which the modern enterprise has become, in effect, an information resource broker points to the emergence of the information professional and new kind of leadership. This new leadership has both the general business and relationship skills and the specialized expertise needed to make informed choices and judgments concerning the management of the enterprise’s core asset – information…The new IT-smart leadership understands that the creative application of information technology is essential for coordinating all the various elements of the business: operations, investment, and innovation, as well as sustaining competitive market positions and customer loyalty (McKenna, 2004, p. xxi).
Information technology leaders are increasingly expected to be senior level strategic partners
that not only understand technology but also business. Aligning the two and creating business
value through the use of technology is a relatively recent and extremely important trend in
the position of the chief information officer in industry. This coupled with increasing
responsibility to the company’s external audiences make the corporate CIO position a
challenging one.
CIO and/or IT Department Success Measures CIOs must be able to quantify performance; therefore metrics, monitoring, and
measuring are of utmost importance to a CIO’s survival (Waggener & Zoppi, 2004). The
CIO should work with the executive team to “develop IT-related measures of strategic
success that apply to technical and non-technical employee group performance” (Schubert,
2004, pp. 158). There are many evaluation metrics and performance management
approaches used for evaluating IT value and technology success noted in the industry
literature.
Often accounting measures are used to determine the value of technology. Return on
investment and total cost of ownership are two commonly mentioned metrics (Schubert,
2004; Smith, 2006; Hugos & Stenzel, 2007). A CIO magazine poll in 2004 found that they
51

were the metrics used 70 percent of the time (Schubert, 2004). Other accounting type tools
used by CIOs include net present value, return on value, return on assets, and internal rate of
return (Schubert, 2004; Smith, 2006; Hugos & Stenzel, 2007).
As a rule, a system should pay for itself and return an appropriate profit within one to three years… CIOs who accept more than a three-year payback period are probably using the analysis to justify what is really an emotional decision (Hugos & Stenzel, 2007, p. 323).
Schubert, however, seems to indicate that relying on these metrics may not be the best way to
ensure value creation. He states, “the traditional accounting-based means of measurements
for product-based companies and technology-based groups fall significantly short in enabling
value creation” (2004, p 177).
Other techniques being used to measure technology effectiveness and IT strategic
goals include: balanced scorecard, benchmarking, periodic initiative review, gap analysis,
regular customer analysis, formal reviews, business intelligence, hypotheses testing,
management analysis, and six sigma (Kaplan & Norton, 1996; Schubert, 2004; Smith, 2006;
Niven, 2007). Niven states:
Many IT groups are discovering the power of performance management, and particularly the Balanced Scorecard concept, as a means of demonstrating IT’s alignment with overall firm strategy and clearly communicating the value of information technology in delivering the company’s value proposition to all stakeholders, including customers, employees, boards, and regulators alike (Niven, 2007, p. 186).
Beyond the tools and metrics above, others promote more unique evaluation methods.
Dr. Bruce Kavan, for example, states:
All levels and responsibility types within the IT function can have goals and objectives and can be measured across three distinct levels: the strategic level, the application development level, and the operational level…Infrastructure and architecture are at the strategic level…At the application development level is the set of individual applications that together provide the solutions that fulfill the strategy; and at the operational level is the set of measurements everyone always hears about:
52
service-level agreements, response time, performance, uptime/downtime, ‘five nines’ or less, and other typical reporting metrics from an operations point of view (Schubert, 2004, p. 161).
The CIO should determine performance measures for each level that align with each other
and with business strategy thereby enabling organizational success. Additionally, to be seen
as a value center, CIOs should meet with peers and partners to determine measurements that
they need done well to accomplish their goals. To this end, CIOs mentioned that they
consider the following in their value creation equation: number of transactions,
costs/expenses, external customer satisfaction, productivity, profit, response time of internet,
revenue, service-level agreements, soft benefits, uptime, visitors to web site, and non-it web
costs such as public relations and marketing (Schubert, 2004).
Paul A. Strassman, who held CIO positions with Xerox and NASA found,
“Ultimately, the value of any action involving IT is the difference between a company’s cash
plans with our without a change in IT” (Caldwell, 1990, p. 37; Schubert, 2004, p. 188). His
research found no real correlation between technology spending and profits or success so he
concluded that technology success should be evaluated based on return on management
(Schubert, 2004).
Effective governance is yet another way of determining information technology
value; in fact, Weill and Woodham state that it is the most important predictor (2002). To
evaluate effective IT governance, Weill and Ross “found empirically that the best predictor
of IT governance performance is the percentage of managers in leadership positions who can
accurately describe IT governance” (Weill & Ross, 2004; Clark, 2005, p. 3).
There are four categories that may provide data for evaluating technology:
• Cost efficiency, in terms of IT infrastructure, IT operations, and IT R&D investment
53

• Service to the business, in terms of customer satisfaction with IT products and customer satisfaction with IT service
• Business improvements, in terms of IT support effectiveness • Direct revenue/profit generation, in terms of IT profit generation and competitive
edge (Seddon et al., 2002; Schubert, 2004, p. 190)
Finally, evaluating only the areas in which technology differentiates a company has
been proposed. “In order to run a world-class IT shop (one whose specific solutions truly
enable the business’s success), CIOs must focus on measuring and managing only those
things [which differentiates a company from its competitors]” (Waggener & Zoppi, 2004, p.
360).
It is easy to see that there are many methods, tools, metrics, and approaches being
used to measure technology value and IT success in industry. Which are the best to use, is
still undetermined. “Based on available research, publications, and the trade press, it is clear
that the search is still on for the silver bullet for measuring IT effectiveness” (Schubert, 2004,
p. 190).
54
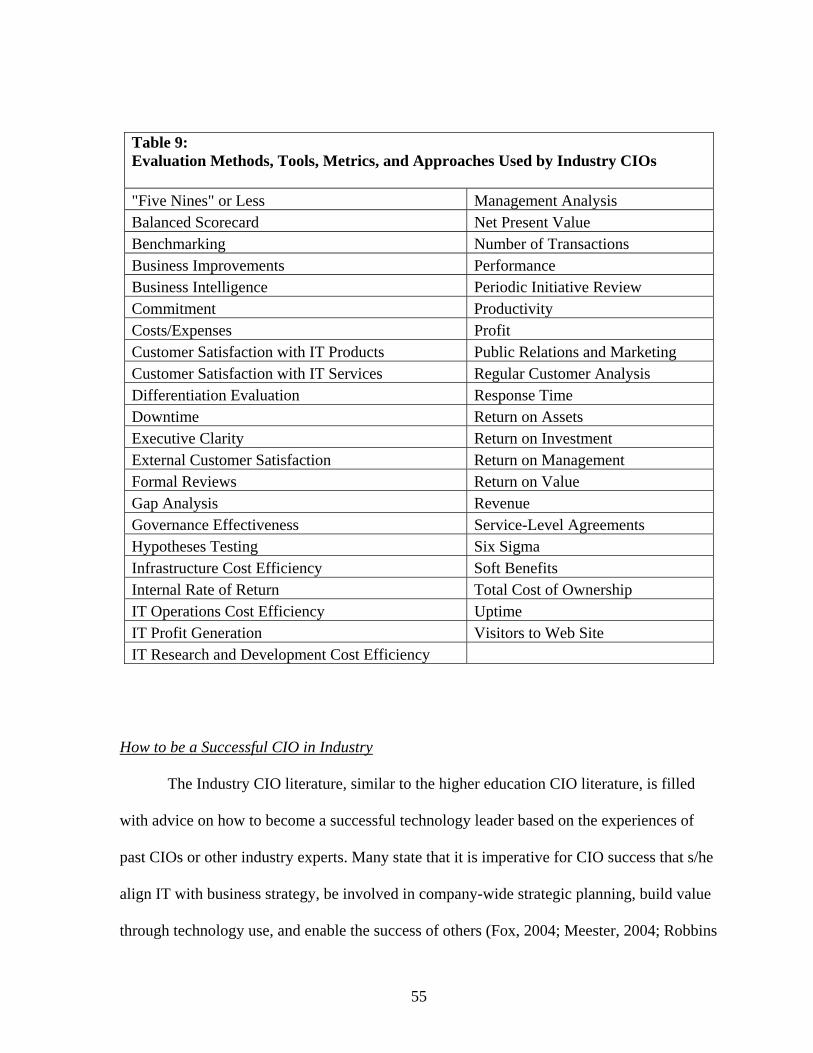
Table 9: Evaluation Methods, Tools, Metrics, and Approaches Used by Industry CIOs "Five Nines" or Less Management Analysis Balanced Scorecard Net Present Value Benchmarking Number of Transactions Business Improvements Performance Business Intelligence Periodic Initiative Review Commitment Productivity Costs/Expenses Profit Customer Satisfaction with IT Products Public Relations and Marketing Customer Satisfaction with IT Services Regular Customer Analysis Differentiation Evaluation Response Time Downtime Return on Assets Executive Clarity Return on Investment External Customer Satisfaction Return on Management Formal Reviews Return on Value Gap Analysis Revenue Governance Effectiveness Service-Level Agreements Hypotheses Testing Six Sigma Infrastructure Cost Efficiency Soft Benefits Internal Rate of Return Total Cost of Ownership IT Operations Cost Efficiency Uptime IT Profit Generation Visitors to Web Site IT Research and Development Cost Efficiency
How to be a Successful CIO in Industry
The Industry CIO literature, similar to the higher education CIO literature, is filled
with advice on how to become a successful technology leader based on the experiences of
past CIOs or other industry experts. Many state that it is imperative for CIO success that s/he
align IT with business strategy, be involved in company-wide strategic planning, build value
through technology use, and enable the success of others (Fox, 2004; Meester, 2004; Robbins
55

& Pappas, 2004; Schubert, 2004; Vavra & Lane, 2004; Webb, 2004; Hill, 2007; Hugos,
2007).
To be successful, the CIO must be involved in organizational strategic planning,
understand the company’s and CEO’s objectives, and properly align the technology
organization (Luftman, et al., 1999; Schubert, 2004; Hugos, 2007).
The CIO must keep in mind that strategic planning with the CEO is about the corporate strategic plan, the IT strategic plan, and the CEO’s strategic plans: business and strategic alignment. The CIO’s responsibilities are to enable the success of the other two strategic plans by implementation of a well-aligned IT strategic plan. When these plans are in alignment, the CEO’s success is enabled, and in a closed-loop system, the CEO’s success is the CIO’s success (Schubert, 2004, p 230).
IT strategy must support and enable current and future business operations and be carried out
systematically using a series of steps toward a larger goal (Hugos, 2007). The IT leader
should develop an adaptable technology organization that strives to eliminate the gap
between what the current IT department can accomplish and what the ideal one would be
able to facilitate in terms of reaching company goals (Hill, 2007). S/he “guides
organizational behaviors, decision making, and capital budgeting to lead the organization to
the destination” (Hill, 2007, p.46). CIOs that use IT to realize business goals are in demand
(Hill, 2007). If executives outside the technology department do not remain involved in an
important IT project, either in an oversight or advisory role, it is likely that the project is
misaligned (Hugos, 2007). Successful CIOs are leaders who ensure technology and business
remain closely aligned (Meester, 2004; Robbins & Pappas, 2004; Webb, 2004) and “have a
unique ability to integrate strategic planning with other key skills, such as project
management and leadership” (Vavra & Lane, 2004, p.223).
56
It is important that the CIO focus on real value creation and return on investment
(Egan, 2004) as well as use technology to enable others throughout the organization.
Enabling activities make up the greatest portion of the CIO’s responsibilities, so successful CIOs draw a significant amount of satisfaction from what they accomplish by enabling others to perform more successfully (Schubert, 2004, p. 25).
Good governance leads to higher value generation.
Mindful of competing internal forces, the top performers designed governance structures linked to the performance measure on which they excelled... thereby harmonizing business objectives, governance approach, governance mechanisms, and performance goals and metrics (Weill & Ross, 2004, p.3).
In addition to those mentioned above, there are many skills, attributes, knowledge
areas, and characteristics suggested that industry CIO possess to be successful. These
include a broad business background (strategy, management, and operations), effectiveness
in diverse and global teams, information systems experience, emotional intelligence,
listening skills, public speaking ability, motivation skills, communication skills, ability to
influence others, truthfulness, self-awareness, leadership skills, technical experience, social-
awareness, networking skills, and business knowledge (Applegate & Elam, 1992; Earl &
Feeny, 1995; Berkman, 2002; Hallet & Mott, 2003; Reich & Nelson, 2003; Fox, 2004;
Schubert, 2004; Broadbent & Kitzis, 2005; Smith, 2006). “Understanding the business is a
proven CIO success factor in the eyes of fellow IT professionals and in the eyes of IT’s
customers” (Schubert, 2004, p. 178). Robbins and Pappas add even more requirements:
The new CIO must be an entrepreneur, a matrix manager of teams that do not report into IT and may not even belong to the company, an architect and e-business visionary, an evangelist, a relentless recruiter, a mentor, and an expert in the psychology as well as the implementation of (constant) change management (Robbins & Pappas, 2004, p.7). Other success suggestions for CIOs include getting to know their supervisor better to
improve communication, possessing an extensive vocabulary (strategic, operational,
57

financial, technical), being collaborative, having credibility, managing the day-to-day
operation well, being a good project manager, exemplifying integrity, having a compelling
vision, being service oriented, having a customer relationship strategy, and effectively
managing resources (Earl & Feeny, 1995; Egan, 2004; Lane, 2004; Schubert, 2004; Webb,
2004).
Understanding which and how many resources are needed and how much time is required to accomplish your goals and meet your commitments to your peers and partners is key to a CIO’s success and to the success of the IT organization…As the senior IT executive, it is the CIO’s responsibility to prevent his or her teams from using any significant resources or participating in any significant project without proper provisioning – without identifying and securing the necessary resources and, especially, without developing a plan for resource utilization according to a project plan with milestones along the way (Schubert, 2004, pp. 193-194).
Hugos adds illustrating and quantifying the IT strategy, communicating constantly, training
and developing others, implementing participatory decision-making, maximizing return on
resources available, and bold (not reckless) decision-making to the CIO needed repertoire
(Hugos, 2007, p. 23). Schubert also notes a CIO should take notice of how often s/he says
“no.” Leaders who say “yes” more often are held in higher regard (Schubert, 2004).
Finally, it has also been suggested that an external view, evaluation skills, technical
understanding, negotiation ability, and human resource management skills are necessary for
CIO success (Meester, 2004; Vavra & Lane, 2004; Smith, 2006). The CIO must manage
both internal and external activities and collect metrics to support decision-making (Meester,
2004). Smith notes that the CIO should understand four key technical areas: applications and
architecture, database management, networking, and security (Smith, 2006). S/he must also
have “great contract negotiation skills” (Smith, 2006, p. 177). Finally, technology alone does
not create competitive advantage; people do. As technology continues to commoditize its
return on investment depends largely on people and processes (Hill, 2007). Therefore, “the
58

successful CIO must assemble the right people with the right technical and soft skills”
(Meester, 2004, p.119).
Due to the position’s enormous responsibilities, it has recently been recommended
that the CIO’s role be split to create two positions the chief information officer (CIO) and the
chief technology officer (CTO). This would alleviate some of the pressure on the CIO by
passing the majority of technical responsibility to the CTO (Beatty et al., 2005). Hugos notes:
Successful CIOs figure out ways to delegate systems operations tasks to others so that they can devote most of their time to… the high-risk task of alignment and use of systems infrastructure to drive enterprise strategy. This is where successful CIOs bring the most value to the enterprises that employ them. High risk also means the potential for great rewards, and the CIOs who effectively collaborate with other executives to reap those rewards for their enterprises are indispensable players on any senior management team (2007, p. 1).
By delegating technical responsibilities to a chief technology officer, the CIO has more time
for higher-risk tasks. CIOs must be adept at managing risk and developing risk profiles and
strategy (Schubert, 2004).
Smith, Prewitt, Broadbent and Kitzis provide detailed lists of what CIOs should do to
be successful. Smith and Prewitt state that they must:
1. Drive innovation and growth while managing costs 2. Prove the strategic value of IT 3. Run IT efficiently and effectively 4. Develop the next generation of IT leaders 5. Manage CXO expectations (Prewitt, 2005; Smith, 2006, pp. 218-219). Broadbent and Kitzis state that to be successful, CIOs should follow these top ten
recommendations:
(1) lead don’t just manage, (2) understand the fundamentals of your environment, (3) create a vision for IT, (4) shape and inform expectations, (5) create clear and appropriate IT governance, (6) weave business and IT strategy together, (7) build a new IS organization [process-based work, strategic sourcing, solid financial foundation], (8) develop and nurture a high-performance team, (9) manage the new
59

enterprise and IT risk [risk, security, data privacy, cyber-terrorism, compliance], (10) communicate IS performance in business-relevant language (pp. 7-9).
It is clear that much like the higher education literature; industry literature provides
many suggestions for a CIO to follow. Once again, however, there are few studies that
provide solutions for how to best implement any of these recommendations (Beatty et al.
2005) or that empirically validate them. Therefore it is unclear where the CIO’s time and
attention are best spent.
60

Table 10: Summary- Suggested Skills, Abilities, Attributes, and Knowledge Requirements Identified for a Successful Chief Information Officer in Industry "Yes" Manager External View Ability to Align IT with Business Strategy Human Resource Management Ability Ability to Create Proper Governance Structure Information Systems Experience Ability to Create Value Through IT Knowledge of Database Systems Ability to Determine Metrics Innovator Ability to Develop Adaptable Technology Organization Integrity
Ability to Enable the Success of Others Knowledge of Applications and Architecture
Ability to Guide Capital Budgeting Knowledge of Computer Networking Ability to Guide Decision Making Knowledge of Security Ability to Guide Organization Behaviors Knowledge of the Business Ability to Influence Others Leadership Ability to Maximize Return on Investment Listening Skills Adept at Communicating with CEO Matrix Manager of Teams Adept at Managing Day-to-Day Operation Mentor Architect Motivation Skills Broad Business Background Negotiation Skills Business Knowledge Networking Skills Change Manager Project Management Expertise Collaborative Promoter Communication Skills Public Speaker Cost Manager Recruiter Credible Resource Manager Customer Relationship Strategist Return on Investment Focus Decision Maker Risk Manager Delegation Skills Self-aware Developer of High-Performance Teams Service Oriented E-Business Visionary Social-awareness Effective in Diverse and Global Teams Strategic Planning Expertise Efficient Operational Manager Strategic Planning Involvement
Emotional Intelligence Skills Support and Enable Current and Future Business
Entrepreneur Technical Expertise Evaluator Truthfulness Evangelist Understand CEO Objectives Expectation Manager Understand Company Objectives Extensive Vocabulary Vision
61

Top Concerns for CIOs Outside Higher Education
CIOs outside higher education have many concerns. Top among them in 2006 and
2007 are IT and business alignment, IT recruitment and related human resource issues, and
IT security and privacy (Gross, 2006; McGee, 2006; Hoffman, 2007). Human resource
concerns include attracting, developing, and retaining a talented IT staff, availability of
technology skills, and developing business skills among technology workers (McGee, 2006;
Bernard, 2007; Hoffman, 2007). Other issues expressed include the speed and agility of
technology departments and solutions, information quality, strategic planning, project
management, business process improvement, standardizing and consolidating infrastructure,
return on investment, technology governance, managed services, and value measurement
(CXOToday Staff, 2006; Gross, 2006; McGee, 2006; Hoffman, 2007).
In 2007, CIO Magazine reported a top ten CIO concern list which included
additional issues such as people leadership, budget management, infrastructure refresh,
compliance, resource management, customer management, change management, and board
politics (CIO Magazine Staff, 2007). Finally, a 2007 study conducted by Jerry Luftman,
distinguished professor at the Howe School of Technology Management, found, like several
others previously mentioned, a lack of IT skills and IT and business alignment to be top
concerns. He also published additional concerns including reducing the cost of doing
business, improving IT quality, making better use of information, and evolving the CIO
leadership role (Bernard, 2007; CIO Canada staff, 2007). This study, conducted for the
Society for Information Management (SIM), supports the trend of the CIO moving from a
technical to a strategic business position. Luftman states,
This is the first time it [evolving CIO leadership] has finished in the top ten. CIOs
62

are recognizing that they are going through a major transition from one of a more technical role to one that is more of a business management role, and the study substantiates that (CIO Canada staff, 2007, p.1).
Table 11: Summary- Top Concerns for CIOs Outside Higher Education
2006 2007 Alignment of IT and Business Board Politics Attracting, Developing, and Retaining IT Talent Business Alignment Business Process Improvement Compliance Examining Ways to Use Managed Services Evolving the CIO Leadership Role
Helping Grow Customer Relationships Improving the Quality and Integrity of Information
Improving Competitiveness and Increasing Efficiency Infrastructure Refresh Introducing Rapid Business Solutions IT Governance IT Governance IT Recruitment and Related Issues IT Security and Privacy Making Better Use of Information IT Strategic Planning Managing Budgets Measuring the Value of IT Investments Managing Change Project Management Capability Managing Customers
Speed and Agility Building better Business Skills Among IT Workers
Standardizing and Consolidating IT Infrastructure People Leadership Reducing the Cost of Doing Business Resource Management Security and Privacy Strategic Planning
Summary of the CIO Outside Higher Education Literature The chief information officer position in industry is a challenging role. It is
increasingly becoming one of a strategic senior level business executive. CIOs in industry
63
are expected to build value for their companies and use numerous measures and metrics to
quantify their performance. Due to the wide-ranging evaluation metrics, research aimed at
determining which are best suited for the technology organization and its leader would be
beneficial. The advice on how to be a successful CIO is plentiful and arguably
overwhelming. Most is based on past CIO experience or other expert opinion. To pare this
down, there is a need for empirically derived data to highlight where CIO efforts should be
directed. Finally, current CIOs have many concerns. Chief among them are the alignment of
technology and business, human resource concerns, and security and privacy issues. Just as
in higher education, the position of chief information officer in industry continues to escalate
in complexity and responsibility.
Evidence-Based Management (EBM) Literature Definition and Basic Principles of Evidence-Based Management There is a research-practice gap in business today as evidenced by the continued use
of management practices known to be ineffective (Rousseau, 2006). The evidence-based
management movement is working toward eliminating this gap by making “organizational
decisions informed by social science and organizational research” (Rousseau, 2006, p. 256).
Managers committed to evidence-based management seek out the best scientific evidence
available and translate findings into organizational problem solving practices (Rousseau,
2006; Rousseau, 2007).
64

There are five principles of evidence-based management:
1. Face the hard facts, and build a culture in which people are encouraged to tell the truth, even if it is unpleasant
2. Be committed to "fact based" decision making -- which means being committed to getting the best evidence and using it to guide actions
3. Treat your organization as an unfinished prototype -- encourage experimentation and learning by doing
4. Look for the risks and drawbacks in what people recommend -- even the best medicine has side effects
5. Avoid basing decisions on untested but strongly held beliefs, what you have done in the past, or on uncritical "benchmarking" of what winners do (Pfeffer & Sutton, 2008a)
History of Evidence-Based Management Evidence-Based Medicine
Evidence-based management is based upon the concepts found in evidence-based
medicine. Dr. David Sackett, a leader in the evidence-based medical field, defines evidence-
based medicine as “the conscientious, explicit, and judicious use of current best evidence in
making decisions about the care of individual patients.” Physicians who practice evidence-
based medicine identify, disseminate, and apply sound and relevant medical research in their
medical positions (Pfeffer & Sutton, 2006a, p. 63).
Medicine was the first field to institutionalize evidence-based practice by integrating
clinical expertise and rigorous external evidence. According to Rousseau, the evidence-based
medicine concept was first seen in 1847, when Ignaz Semmelweis “discovered the role
infection played in childbirth fever” (Rousseau, 2006, p. 258).
65

Today, despite the numerous medical studies available, only approximately 15% of
physicians use relevant research for evidence-based decision making. Instead, most rely on
outdated school knowledge, unproven traditions, what they have done in the past, methods
with which they are most comfortable, and/or information from vendors (Pfeffer & Sutton,
2006a).
Critics of evidence-based medicine express concern that its use will devalue or
replace clinical judgment and that it may cause HMOs to refuse experimental or costly
techniques. Studies have found, however, that patients experience better outcomes as a result
of evidence-based medical practice and doctors who use it are better informed (Pfeffer &
Sutton, 2006a).
Early Evidence-Based Management
The idea of evidence-based management may be traced back to Chester Barnard in
1938 who “promoted the development of a natural science of organization to better
understand the unanticipated problems associated with authority and consent” (Rousseau,
2006, p. 60). Although the idea has existed for almost a century it was only recently labeled
“evidence-based management” and little has been done to close the research-practice gap.
Implementing Pfeffer and Sutton’s evidence-based management model (the five principles of
evidence-based management stated earlier) may facilitate the necessary connection between
management science and business practice (Rousseau, 2006).
66

Other Areas of Evidence-Based Practice In addition to management and medicine, other areas of evidence-based practice
include conservation, criminology, education, policing, librarianship, social work, software
ngineering, and sports (Pfeffer & Sutton, 2008b; Rousseau, 2006). e
According to Rosseau, evidence-based practice should include:
1. learning about cause-effect connections in professional practices
2. isolating the variations that measurably affect desired outcomes
3. creating a culture of evidence-based decision making and research
participation
4. using information-sharing communities to reduce overuse, underuse, and misuse of specific practices
5. building decision supports to promote practices the evidence validates, along
with techniques and artifacts that make the decision easier to execute or perform (e.g., checklists, protocols, or standing orders)
6. having individual, organizational, and institutional factors promote access to
knowledge and its use (2006, pp. 259-260) Evidence-Based Management Evidence-based management is based on the belief that managers who seek out and
act on evidence when making decisions will outperform those who do not. Pfeffer and
Sutton, leaders in the field, believe that managers will be more effective if “they are routinely
guided by the best logic and evidence – and if they relentlessly seek new knowledge and
insight, from both inside and outside their companies, to keep updating their assumptions,
knowledge, and skills” (Pfeffer & Sutton, 2006a, p. 64).
67

Differences Between Evidence-Based Management and Other Areas of Evidence-Based Practice
Evidence-based management differs from other areas of evidence-based practice in
several ways. First, feedback from management decisions may be scarce, hard to attribute to
a specific practice, and take years to receive. Second, mangers are regularly influenced by a
wide range of stakeholders and therefore often must compromise during decision making for
political reasons. Third, management interactions are almost constant which may cloud the
recognition that a decision is being made that will result in consequences that should be
considered in light of available evidence. Fourth, management in itself is not a profession.
Those in management positions have diverse backgrounds, lack a body of shared knowledge,
and often times have a limited understanding of the scientific method as opposed to those in
other evidence-based practice fields such as the medical field. Finally, few organizations
conduct management research or work in partnership with others who do. Expert
communities of evidence-based management practitioners for the purpose of vetting
management research findings currently do not exist (Rousseau, 2006).
Barriers to Evidence-Based Management
Rather than seeking out and using the best evidence, managers often rely on personal
experience or follow advice based on weak evidence. Additionally, managers and
consultants typically are not aware of the best evidence and do not seek it out (Rousseau,
2006; Rousseau, 2007). Many people claim to be “management experts” which makes it
difficult to determine what information is true evidence. Organizational makeup, goals, and
culture also vary widely so one must be careful when presuming that a successful practice
68

when transferred to another company will produce a similar outcome (Pfeffer & Sutton,
2006a).
There are many substitutes that managers, like physicians, use instead of evidence
when making decisions. These include “obsolete knowledge, personal experience, specialist
skills, hype, dogma, and mindless mimicry [casual benchmarking] of top performers”
(Pfeffer & Sutton, 2006a, p. 67). Additionally, managers often make decisions that take
advantage of their own strengths and expertise (Pfeffer & Sutton, 2006a).
Pfeffer and Sutton point out several other reasons that make it challenging to make
evidence-based decisions. First, there is “too much evidence,” magazines, journals,
newspapers, books, websites etc., for anyone to consume. Second there is “not enough good
evidence” meaning little study on the value of different management tools and techniques.
Third, the “evidence does not quite apply;” therefore, it is only correct under certain
conditions. Fourth, “people are trying to mislead you.” Consultants, for example, are
“always rewarded for getting work, only sometimes rewarded for doing good work, and
hardly ever rewarded for evaluating whether they have actually improved things.” Fifth, “you
are trying to mislead you” by disregarding evidence that is against core beliefs, ideologies,
perceptions, and self-fulfilling expectations. Sixth, “side effects outweigh the cure.” This
happens when the side effects of a decision are not fully examined or realized. Lastly, it is
sometimes difficult to stay committed to gathering evidence when one realizes that often
“stories are more persuasive.” They too have their place in evidence-based management, “in
suggesting hypotheses, augmenting other (often quantitative) research, and rallying people
who will be affected by a change,” but they should not be used in lieu of quantitative
evidence (Pfeffer & Sutton, 2006a, pp. 66-67).
69

Evaluating Evidence
As stated above, there is an abundance of information available to managers and
therefore Pfeffer and Sutton suggest “six standards for producing, evaluating, selling and
applying business knowledge.” First, “stop treating old ideas as if they were brand-new”
involves acknowledging and building upon past work. Second, “be suspicious of
‘breakthrough’ ideas and studies” which are usually based on the work of others and are not
“magic remedies.” Third, “celebrate and develop collective brilliance” since the development
and implementation of ideas require the coordinated efforts of many. Fourth, “emphasize
drawbacks as well as virtues” so potential pitfalls and costs are understood and managers do
not “abandon a valuable program or practice when known setbacks occur.” Fifth, “use
success (and failure) stories to illustrate sound practices, but not in place of a valid research
method” since research that relies on recollection is often problematic. Finally, “adopt a
neutral stance toward ideologies and theories” so that they do not interfere with one’s ability
to be open to learning from new evidence (Pfeffer & Sutton, 2006a, p. 71; Pfeffer & Sutton,
2006e; Pfeffer & Sutton, 2006h).
In 2003, Christensen and Raynor wrote a Harvard Business Review article outlining
how to “become a discerning consumer of managerial theory” (p. 1). To identify unsound
theories they suggest avoiding those that urge revolutionary change of everything since
management theories never uniformly apply, being wary of research that “classifies
phenomena into categories based solely on attributes or characteristics,” and watching out for
correlation being presented as causation. It is important to remember that “sound theories
describe how something works” (Christensen & Raynor, 2003, p. 1).
70

Implementing Evidence-Based Management
An evidence-based management decision-making process should start with an
answerable question that can be solved by gathering relevant evidence. Practices from other
companies should only be copied if the organizations are so similar that implementation
would be successful. Assumptions underlying new directions must be flushed out and
examined to ensure that they will in fact produce desired results. Evidence must be weighed
in terms of both potential positive and negative effects. It is also important that studies used
in evidence-based decision making not violate the condition of causality. The cause must
precede the effect or the evidence is not valid and it is important to remember that correlation
is not the same as causation (Pfeffer & Sutton, 2006a; Pfeffer & Sutton, 2006e). Finally,
evidence-based management is not only for senior executives. Throughout the organization
there should be a responsibility to gather and act on evidence as well as help others learn
what is known (Pfeffer & Sutton, 2006b).
For evidence-based management to work, managers must be willing to put aside their
conventional beliefs and commit to seeking out the facts to make better decisions. As a
leader one must ask for evidence when a change is proposed. Additionally leaders should
“treat the organization as an unfinished prototype and encourage trial programs, pilot studies,
and experimentation – and reward learning from these activities, even when something fails”
(Pfeffer & Sutton, 2006a, p.70). Pfeffer and Sutton propose the following keys to
implementing evidence-based management: (1) demand evidence, (2) examine logic, (3) treat
the organization as an unfinished prototype, and (4) embrace the attitude of wisdom (Pfeffer
& Sutton, 2006a; Pfeffer & Sutton, 2006b; Pfeffer & Sutton, 2006c; Pfeffer & Sutton, 2006d;
Pfeffer & Sutton, 2006e).
71

In demanding evidence it is important to build systems that let people know how they
are doing. To do this one must understand relevant metrics and find a way to measure them.
It is also important to develop a culture that encourages people to speak the truth (Pfeffer &
Sutton, 2006a; Pfeffer & Sutton, 2006e).
Examining logic entails more than finding supportive research; it includes making
sure that research is sound by examining gaps in exposition, reasoning, and inference. Non-
experimental findings of correlation between practices and performance are common in
management studies and must be carefully examined for alternative explanations and
limitations. The assumptions underlying a proposed idea must be examined to see if they are
sensible and transferable to one’s organization. Pfeffer and Sutton propose this can be done
by answering two questions, “What would have to be true about people and organizations if
this idea or practice were going to be effective? Does that feel true to us?” (Pfeffer & Sutton,
2006a, p.72).
To treat the organization as an unfinished prototype, one must find evidence in the
organization’s own data and experience by getting “in the habit of running trial programs,
pilot studies, and small experiments, and thinking about the inferences that can be drawn
from them” (Pfeffer & Sutton, 2006a, p.72). Doing such experiments on a small scale rather
than an all or nothing approach will give organizations a chance to gather evidence for better
decision making, use a control group, and learn before embarking on a company-wide
decision (Pfeffer & Sutton, 2006a). In order to do this effectively, the organization must
realize and tolerate failure and errors since, when handled correctly, both lead to learning.
Punishment and blame in these circumstances create a culture of fear that will severely
hamper the creation of an evidence-based management environment. Purposely building in
72

time to review and reflect is important for future improvement and learning. Having the
courage to speak the truth and creating a culture in which this is possible is tremendously
important. Otherwise “opportunities for improvement are lost” (Pfeffer & Sutton, 2006b;
Pfeffer & Sutton, 2006c, p. 29).
Finally, embracing an attitude of wisdom, “a healthy respect for and curiosity about
the vast realms of knowledge still unconquered,” is perhaps the most important guideline
(Pfeffer & Sutton, 2006a, p.73). The best evidence-based managers appreciate what they do
not know, act on the best knowledge they are able to gather, and question what they know.
Identifying and applying life long learning strategies is crucial for success (Pfeffer & Sutton,
2006a). Pfeffer and Sutton note:
Having people who know the limits of their knowledge, who ask for help when they need it, and are tenacious about teaching and helping colleagues is probably more important [than IQ] for making constant improvements in an organization, technical system, or body of knowledge (2006h, p.103).
As stated earlier, it is also important that practices from other companies not be
imitated as a strategy without thorough investigation. Before embarking on any
benchmarking activity, there are several key questions that should be asked:
1. Do sound logic and evidence indicate that the benchmarking target’s success is attributable to the practice we seek to emulate?
2. Are the conditions at our company – strategy, business model, workforce –
similar enough to those at the benchmarked company to make the learning useful?
3. Why does a given practice enhance performance? And what is the logic that
links it to bottom-line results? 4. What are the downsides of implementing the practice even if it is a good idea
overall? (Pfeffer & Sutton, 2006a, p. 69)
73

It is important not to take part in “casual benchmarking” in which “people mimic the most
visible, the most obvious, and frequently, the least important practices” (Pfeffer & Sutton,
2006a, p. 69). When this is done, the logic behind the visible attributes is often not examined
and therefore what is imitated does not produce the expected outcome (Pfeffer & Sutton,
2006a; Pfeffer & Sutton, 2006d).
Evidence-Based Management Summary
It is argued that practicing evidence-based management will lead to improved
decision-making and organizational success. Studies by experienced researchers offer sound
insight for managers. Pfeffer and Sutton contend that using the information found in these
studies in a way consistent with the principles of evidence-based management will improve
organizational performance. There are other implications of practicing evidence-based
management that leaders should be aware of including that when done correctly, it changes
organizational power dynamics by valuing data over formal authority, reputation, and
intuition. In sum, evidence-based management forces managers to view their role as a craft
in which examining logic and demanding facts in order to make decisions improves their
effectiveness (Pfeffer & Sutton, 2006a).
Evidence-Based Management In Practice What Does Evidence-Based Management Literature State About Building a High-Performance Culture?
During Jeffery Pfeffer’s testimony for the United Sates House of Representatives
Committee on Oversight and Government Reform Subcommittee on Federal Workforce,
74

Postal Service, and the District of Columba, he stated that “the best way to encourage
performance is to build a high-performance culture. We know the components of such a
system, and we ought to pay attention to this research and implement its findings” (2007a, p.
3).
The components of such a system are not isolated interventions but systemic,
complimentary management practices “to provide an environment that produces innovation,
discretionary effort, and high levels of performance and service” (Pfeffer, 2007a, p. 15).
High-performance components usually include:
1. Sustained investment in training and development, including job rotation, both formal and on-the-job training, and a tendency to promote from within as a consequence of the successful internal development of skill and people
2. An egalitarian culture in which formal status distinctions are downplayed,
salary differences across levels are less than in the general economy, and in which people feel as if their contributions are important and valued
3. Delegation of decision making responsibility so that skilled and developed
people can actually use their gifts and skills to make real decisions
4. High pay to reduce turnover and attract the best people, coupled with rewards that share organizational success with its members
5. Employment security and a policy of mutual commitment, so that the
workforce does not fear for the outcomes of events over which it has no control and instead, feels reciprocally committed to the employer (Pfeffer, 2007a, p. 15)
Pfeffer further states that an organization must respect and value its employees, treat them
with dignity, ensure jobs are meaningful, and let staff know their contributions are essential
(2007a).
75

What Does Evidence-Based Management Literature State About Human Resource (HR) Management?
“There is compelling evidence that when companies use human resource practices
based on the best research, they trump the competition. These findings are replicated in
industry after industry” (Pfeffer & Sutton, 2006h, p. 217). Unfortunately, many human
resource managers do not practice evidence-based HR management (Lawler III, 2007).
There are a couple of reasons noted in the literature as to why this may be so. First is that
academic human resource management research is not covered by many practitioner
publications and, therefore, those practicing HR management are often not aware of it
(Lawler III, 2007). Second, many human resource managers do not have formal education in
business or human resource management (Lawler III, 2007).
Human Resources activities such as recruitment, recognition, compensation, and
development are increasingly important in today’s competitive environment for talent
(Pfeffer & Sutton, 2006c). Making sure compensation packages and rewards encourage
appropriate behaviors and do not harm organizations should be a top concern. Human
resource managers can add significant organizational value by adopting evidence-based
management practices particularly in the areas of compensation system development,
recruiting, and training (Pfeffer & Sutton, 2006c).
Before making any human resource decisions, it is important to determine the greatest
opportunities for improvement and what the underlying causes for issues are. This must be
done through a careful analysis rather than assumption based on a few peoples’ beliefs.
Pfeffer and Sutton state that it is not uncommon that:
Companies don’t know how they are doing in people management or the source of those problems. Some companies do surveys. Some have HR information systems. Some do exit interviews. Some have feedback sessions with senior leaders. All
76

companies have people with ideas and opinions about what the issues are and the causes of those issues. But relatively few companies pull this information together in a systematic way to formulate ideas about what is going on and then test their hunches with the facts (2006c, p. 30).
By reading, understanding, and adopting human resource practices based on the best
evidence and using experiments to test assumptions and ideas, managers can begin to
improve critical human resource management practices such as recruiting, retention,
compensation system development, and training (Pfeffer & Sutton, 2006c).
Evidence shows that a common assumption is talent is a relatively fixed characteristic
that must be identified during recruitment and retained. This often leads to hiring based on
skills rather than aptitude and attitude and targeted professional development investments
toward select, usually higher level, employees or those deemed to have greater potential.
These assumptions, that ability is fixed and the organizations “with the best people do the
best,” are often not correct and should not be relied upon for several reasons including the
fact that identifying the best individuals is not easy since performance varies over time. It
has also been shown that evaluating individuals with precision is difficult. Evidence shows
that “talent is at least as much ‘created’ as inherent” (Pfeffer & Sutton, 2006f, pp. 28-30).
Decades of research by Anders Ericsson, professor of psychology at Florida State University, show that exceptional performance doesn't happen without around 10 years of nearly daily, deliberate practice for about four hours a day, by people who somehow - through coaching, skilled peers or competitors, or books - have access to the best techniques. Once achieved, exceptional performance can't be maintained without relentless effort (Pfeffer & Sutton, 2006f, p. 30).
Since training and effort can impact performance, how people are managed matters in
addition to who is selected. Stanford psychology professor Carol Dweck found that
employees with learning goals (to build knowledge and abilities) rather than performance
goals (to validate ability) perform better. Therefore, those who believe in fixed ability assess
77

performance based on where they are rather than what they need to do to enhance
performance. The view then becomes a self-fulfilling prophecy where those who see
intelligence and ability as fixed, do not improve (Pfeffer & Sutton, 2006f, p. 30). Talent
should be looked upon as something anyone can develop since evidence shows that those
who “believe in themselves, try hard, and learn constantly” perform better (Pfeffer & Sutton,
2006h, p. 100). It is also important to realize that performance depends on one’s work
environment including the systems in place, support of colleagues, available resources, and
infrastructure (Pfeffer & Sutton, 2006h).
Few human resource professionals, unfortunately, are aware of the “research
literature on genius; issues in measuring performance and ability; and theories of
intelligence, achievement goals, mastery and learning behavior” (Pfeffer & Sutton, 2006f, p.
30). Human resources is an area where evidence-based management could improve
organizational success.
The evidence-based management literature points out several other human resources
pitfalls to avoid. First, one should not hire those whose main priority is money. Those “who
actually have some interest in the company, its customers, its products and services, and its
values” tend to stay longer and perform better (Pfeffer & Sutton, 2006h, p.125). Second, one
should avoid using individual reward or incentive systems (in environments where work is
interdependent with others) that often lead to inequality rather than team based recognition
(Pfeffer & Sutton, 2006h, p.125). Third, it is important not to jump to financial rewards in
order to motivate staff. Focusing on other work-related benefits “such as being a part of a
supportive community and doing work that helps benefit others” is often a better choice
(Pfeffer & Sutton, 2006h, p.130). Fourth, failing to build trust with employees and not
78

treating them as trusted individuals will negatively impact performance (Pfeffer, 2007b).
Finally, “when creative, independent people don’t get much say in what their organization
does, job satisfaction and disengagement are high” (Pfeffer, 2007b, p.67).
What Does Evidence-Based Management Literature State About Leadership?
There is an assumption that what leaders do greatly impacts their organizations. It is
interesting to note that the evidence does not support this assumption. “Leaders and
managers often have far less influence over performance than most people think” (Pfeffer &
Sutton, 2006h, p.192).
Although leaders do have some impact, their actions rarely explain more than 10 percent of the differences in performance between the best and the worst organizations and teams. Scores of more recent studies confirm that the link between leadership and performance is modest (Pfeffer & Sutton, 2006h, p.192).
The evidence shows that organizational and group performance is where leaders may have
the most positive impact and make an important difference (Pfeffer & Sutton, 2006h).
Not only is there the assumption that leaders have more impact than they do, many
believe this is as it should be.
It is not just that people believe leaders have almost total control of their organizations. Many people believe that leaders should have complete control… Most people believe that leaders in more senior positions – those higher up the chain of command – not only have the right, but also have the responsibility, to make important decisions about and for those serving under them. People in higher positions are presumed to know what should be done and how to do it better than their underlings (Pfeffer & Sutton, 2006h, p.186). Although there are positive outcomes from the belief that what leaders to greatly
impacts their organization, such as the fact that it produces a sense of security and control,
giving too much credence to this belief can actually have negative consequences since it
“affects what people in leadership roles do, the decisions they make, and their effects on
79

others” (Pfeffer & Sutton, 2006g, p. 14). The evidence indicates that organizations are not
always better off with “excessive centralization and too much influence and control on the
part of the leader” (Pfeffer & Sutton, 2006h, p.189).
It seems clear that leaders have some chance of making things better, but they can also make things much worse by taking actions that increase employee turnover and diminish employee motivation, as well as encourage lying and stealing, and causing numerous other organizational problems. This all suggests that avoiding bad leaders may be a crucial goal, perhaps more important than getting great leaders (Pfeffer & Sutton, 2006h, p.194).
Pfeffer and Sutton point out potential harmful consequences of placing too much faith
in leaders.
1. Overcontrol and monitoring – leadership stereotypes often produce leaders who give too much feedback, guidance, and surveillance which makes people nervous, saps initiative, and undermines motivation
2. Bullying and self-centered behavior – leaders given positions of power
sometimes develop a lack of sensitivity toward others (teasing, stereotyping, self-interested behavior)
3. Inhibiting others from taking responsibility – everyone pays attention to
the leader and stop listening as closely to each other. Employees ignore suggestions that don't come from the top and in doing so lose information and wisdom from colleges. They cede control and responsibility to leaders which in turn lessens their learning, knowledge, practice, and experience (2006g, p. 14)
To be an effective leader and avoid the pitfalls above, one should project confidence about
the future, act as if s/he is in control, tell the truth, accept responsibility, admit mistakes,
acknowledge organizational realities, let people know issues will be resolved, realize
personal limitations, get out of the way of their employees, maintain an attitude of wisdom,
avoid power trips, stay modest, and focus on facilitating the success of others (Pfeffer &
Sutton, 2006g; Pfeffer & Sutton, 2006h).
Leaders often have the most positive impact when they help build systems where the actions of a few powerful and magnificently skilled people matter least. Perhaps the
80

best way to view leadership is as the task of architecting organizational systems, teams, and cultures – as establishing the conditions and preconditions for others to succeed (Pfeffer & Sutton, 2006h, p.200).
According to the evidence, leaders should also focus on customers’ expectations,
employee views, and execution (Pfeffer & Sutton, 2006h).
What actually provides competitive success and what is difficult to copy is not so much knowing what to do – deciding on the right strategy – but the ability to do it. That is why Richard Bank, has repeatedly argued that organizational culture and the ability to operate effectively – successful implementation – is much more important to organizational success than having the right strategy (Pfeffer & Sutton, 2006h, p.145).
Additionally, when problems arise, it is important not to confuse improper strategy with
ineffective execution. A leader should not reject or reconsider a strategy decision that is not
working without first looking at implementation complications as the cause of failure. “This
problem of confusing strategy problems with implementation problems seems particularly
common in service industries” (Pfeffer & Sutton, 2006h, p.152). Strategies should be agreed
upon, understood, and simple. “Complicated, difficult-to-explain strategies may or may not
confuse your competitors, but they will almost certainly confuse your organization” (Pfeffer
& Sutton, 2006h, p.153).
Finally it is noted that leaders can positively impact organizational and group
performance by displaying and promoting curiosity so that:
They and their followers will keep learning new skills, coming to grips with the best logic and evidence and applying what they know (for now) to change their organizations for the better. Leaders breed such curiosity by having both the humility to be students and the confidence to be teachers. And the best leaders know when and how to switch between these roles (Pfeffer & Sutton, 2006h, p.234).
81

Leadership matters but not in the way most believe. Rather than having tremendous
influence, the best leaders positively impact organizational and group performance and
develop systems that enable others to succeed (Pfeffer & Sutton, 2006h).
Evidence-Based Management Studies That Inform This Dissertation Study In 2006, Leslie, Loch, and Schaninger published a study in the McKinsey Quarterly
which proposed that a combination of management practices carefully selected can be more
effective than single interventions. This is consistent with Pfeffer’s testimony about building
a high-performance culture. They found that companies that maintained a basic proficiency
in all 34 of the management practices identified in the study and also exhibited superiority in
a much smaller complimentary subset had better financial results (Leslie et al., 2006). These
34 practices fall under nine key areas used to define organizational quality (accountability,
capabilities, coordination and control, direction, environment and values, external
orientation, innovation, leadership, and motivation) that the authors believe “underpin
organizational excellence” (Smet et al., 2007, p. 6). Companies with a straight average of
performance in the nine areas in the top quartile “were more than twice as likely as those in
the bottom quartile to have above-average margins for their industry” (Smet et al., 2007, p.
6). Further, after analyzing 230 global businesses, the authors found that companies which
made employees accountable, set goals and priorities, and established a performance culture
outperformed their peers. “Senior executives must provide for clear roles within a structure
matched to the needs of the business (accountability), articulate a compelling vision of the
future (direction), and develop an environment that encourages openness, trust, and challenge
(culture)” (Leslie et al., 2006, p. 69). They believe this “base case” should be applied by at
82

least 50 percent of companies and that all companies would benefit more from excelling in a
few complimentary practice areas than they would from being distinctive in just one (Leslie
et al., 2006, p. 72). In 2007, Smet, Palmer, and Schaninger further state that the companies
“in the top quartile in five outcomes: environment and values, accountability, coordination
and control, motivation, and external orientation” had an 83% chance of beating the median
earnings before interest, taxes, depreciation and amortization (EBITDA) margin (2007, pp. 7-
8).
Smet, Palmer, and Schaninger suggest that improving any of the 34 practices in the
2006 McKinsey Quarterly study will benefit an organization. To start with, however, they
recommend focusing on vision (direction), structure/role design (accountability), and open
and trusting (environment) as universally beneficial practices to enhance performance while
being sure that none of the 34 practice areas are below average. They further state:
With minimum competencies in place, companies can focus on driving a few practices to distinctiveness (i.e., the top quartile). Achieving distinctiveness in even a single practice can have a measurable effect on overall organizational effectiveness, pushing the likelihood of top-quartile organizational performance from 25% to nearly 50%. Driving a second practice to distinctiveness increases this likelihood to more than 50%. Once a company has achieved top-quartile performance in four or five practices, the likelihood that all outcomes are distinctive plateaus at approximately 80%. For most companies, the effort of achieving distinctiveness in a sixth or seventh practice may not be worth it, as a point of diminishing returns is reached. Companies should focus on being truly distinctive in four or five practices and being good enough (about average) in the remaining practices) (2007, p.8).
When deciding which competencies in which to excel, it is important to make sure they
complement each other, fit within the corporate strategy, and do not disrupt an area in which
the organization already excels (Smet et al., 2007).
In 1999, 2006, and 2007, works by Pfeffer and Sutton outline the keys to creating
high-performance cultures (Pfeffer, 1999a; 1999b; Pfeffer & Sutton 2006h; Pfeffer, 2007a).
83

Before Pfeffer specifically began writing about an “evidence-based management” movement,
he published two articles based on extensive research that outline seven practices of
successful organizations and keys to creating high-performance management systems. These
are: employment security, selective hiring, self-managed teams, high compensation, training
investment, reduction in status differences, and not keeping secrets (Pfeffer, 1999a; Pfeffer,
1999b). Employment security builds employee trust, improves cooperation, encourages
workers to take a longer term perspective, causes companies to pay more attention to hiring,
decreases costly premature layoffs, and encourages companies to invest in training, share
information, and delegate responsibilities. Hiring the right people is important and can be
accomplished by ensuring a large applicant pool, having clarity about critical skills needed,
emphasizing attributes which are difficult to change with training, and looking for a cultural
fit. Using self-managed teams has been shown to create “greater autonomy and discretion
[among employees] which translates into intrinsic rewards and job satisfaction. Teams out-
perform traditionally supervised groups” (Pfeffer, 1999a, p. 26). There is a relationship
between salary paid and quality of employee. Level of salary also sends a value message to
staff. Pfeffer further states:
By coupling employment security with some form of group-based incentive, such as profit or gain sharing or share ownership, the organization unleashes the power of the team, whose economic interests are aligned with high levels of economic performance (1999a, p. 27).
Training is tremendously important and is a source of competitive advantage across
industries. Reducing status differences “symbolically, through the use of language and
labels, physical space and dress and substantively, in the reduction of the organization’s
degree of wage inequality, particularly across levels” helps build high-performance
management systems where employees feel valued (Pfeffer, 1999b, p. 56). Finally,
84

information sharing conveys trust and allows people to contribute to organizational success
by providing them needed “information on important dimensions of performance and, in
addition, training on how to use and interpret that information” (Pfeffer, 1999b, p. 57). A
strategy toward achieving profits through people is key to enhancing organizational
performance (Pfeffer, 1999b). Research points to a direct relationship between management
practices that value employees and put them first and organizational success (Pfeffer &
Veiga, 1999).
During Jeffery Pfeffer’s testimony for the United Sates House of Representatives
Committee on Oversight and Government Reform Subcommittee on Federal Workforce,
Postal Service, and the District of Columba, he stated that “the best way to encourage
performance is to build a high-performance culture” (Pfeffer, 2007a, p. 3). High-
performance components usually include an investment in training and development,
egalitarian culture, delegation of decision-making responsibility, high pay, and employment
security. Pfeffer further states that an organization must respect and value its employees,
treat them with dignity, ensure jobs are meaningful, and let staff know their contributions are
essential (2006h; 2007a).
Summary of the Evidence-Based Management Literature Too often despite scientific evidence, organizations continue to use ineffective
management practices. To address this issue, those who practice evidence-based
management use academic research to inform organizational business decisions. Doing so
effectively requires that managers identify good evidence, examine logic, conduct
85

experiments, learn from failures, and embrace an attitude of wisdom (Pfeffer & Sutton,
2006a; Pfeffer & Sutton, 2006g; Pfeffer & Sutton, 2006h; Rousseau, 2006; Rousseau, 2007).
Evidence-based management literature indicates that leaders have less influence then
many assume. Studies show that where leaders can be most effective is in building high-
performance organizations that value, respect, and develop their employees. Creating
environments that promote learning, building quality systems, developing community,
downplaying status differences, rewarding group performance, creating a trusting
environment, delegating decision authority, and helping others to succeed have been shown
to be ways in which a leader can positively impact his or her organization (Pfeffer & Sutton,
2006g; Pfeffer & Sutton, 2006h; Pfeffer, 2007).
Evidence-based management studies in 2006 and 2007 by Leslie, Loch, Palmer,
Schaninger, and Smet linked combinations of management practices with superior financial
results in 230 global businesses (Leslie et al., 2006; Smet et al., 2007). Additionally in 1999,
2006, and 2007, works by Pfeffer and Sutton outline the keys to creating high-performance
cultures (Pfeffer, 1999a; 1999b; Pfeffer & Sutton 2006h; Pfeffer, 2007a). These research
findings inform this dissertation study.
Research Questions Revisited and Contribution this Study Makes to the Field
The higher education chief information officer position is an important, complex, and
challenging senior level technology role that serves many constituencies, takes on a large
number of job roles, requires a variety of skills, abilities, attributes, and knowledge, and faces
tremendous obstacles as it continues to elevate in importance and escalate in responsibility.
Although there are numerous articles written about college and university CIOs, most are
86
based on advice from past CIOs and relatively few are empirical research studies.
Additionally, the definition of “CIO success” is unclear and there are few consistent metrics
or methodologies used to evaluate higher education technology organizations or those in the
position of CIO. Since chief information officers enable the success of others throughout the
institution, it is imperative that quantitative research be conducted in order to begin to
develop a framework for CIO success. Such a framework will allow those in the position to
improve performance, positively impact the institution and its members, and position the
higher education organization for the future (Hawkins, 2004).
Evidence-based management literature indicates that leaders have less influence then
many assume and often use ineffective management practices. To address this issue, those
who practice evidence-based management use academic research to inform organizational
business decisions. Studies show that where leaders can be most effective is in building
high-performance organizations that value, respect, and develop their employees (Pfeffer &
Sutton, 2006g; Pfeffer & Sutton, 2006h; Pfeffer, 2007).
Evidence-based management studies in 2006 and 2007 linked combinations of
management practices with superior financial results in 230 global businesses (Leslie et al.,
2006; Smet et al., 2007). Additionally in 1999, 2006, and 2007, works by Pfeffer and Sutton
outline the keys to creating high-performance cultures (Pfeffer, 1999a; 1999b; Pfeffer &
Sutton 2006h; Pfeffer, 2007a). This research provides a theoretical framework and basis for
the dissertation study. The study begins to investigate if combinations of management
practices within the centralized academic technology organization correlate with higher
perceptions of CIO and technology organization performance. Further, it investigates if there
is a correlation between high-performance culture and overall satisfaction with CIO and IT
87

department. Finally, it identifies what constitutes user satisfaction in the eyes of internal
college and university constituencies. The following research questions are investigated:
1. Which factors are most associated with user satisfaction with the centralized
technology organization (Table 1)? Which factors are most associated with satisfaction with the CIO?
2. Are technology organizations with a higher straight average of performance in the nine areas used to define organizational quality (Table 2) viewed as performing better than those which do not?
3. Are technology organizations with a higher performance in certain combinations
of the nine areas used to define organizational quality (Table 2) viewed as performing better than those which do not?
4. Are current higher education technology leaders building high-performance
organizations that value, respect, and develop their employees (Table 3)? Is there a correlation between the degree to which this is done and perceptions of CIO and technology organization performance? Are technology organizations with a higher performance in certain combinations of high-performance categories viewed as performing better than those which do not?
5. What do CIOs believe is important for the success of the centralized information
technology organization?
6. Do CIOs have an accurate understanding of how satisfied their campus users are? Do centralized information technology employees?
7. Do centralized information technology employees believe the elements tied to their
success are the same as those tied to the centralized technology organization’s success?
8. Do CIOs have a clear understanding of what metrics will be used to evaluate their
performance? Which elements do CIOs believe are most heavily factored into their performance reviews? Do CIOs believe that those conducting their performance reviews have adequate guidelines and information to carry out meaningful evaluations?
9. How important do users believe the centralized information technology department
is to their success and that of their institution?
88

89
This study is valuable to the field in that it enables current CIOs to begin to focus
effort on areas likely to improve their success, it suggests CIO hiring and evaluation criteria,
it recommends where those aspiring to the position should focus professional development
efforts, and it begins to develop a much needed framework for CIO success. As a result it is
hoped that this study will improve CIO performance, aid in reducing CIO turnover, and
create a more appealing job to which more aspire. Chief information officers and their staff
members facilitate the success of many throughout the higher education community and
therefore their success improves education, scholarship, and service and better positions the
higher education organization for the future.

METHODOLOGY
Theoretical Framework This study is based upon both the results and the methods of evidence-based
management studies in 2006 and 2007 by Leslie, Loch, Palmer, Schaninger, and Smet. They
found correlations between combinations of management practices and superior financial
results in 230 global businesses (Leslie et al., 2006; Smet et al., 2007). Additionally, this
study is based upon 1999, 2006, and 2007 works by Pfeffer and Sutton who outline the keys
to creating high-performance cultures (Pfeffer, 1999a; 1999b; Pfeffer & Sutton 2006h;
Pfeffer, 2007a).
This study investigates if superior performance in the nine areas used to define
organizational quality correlate with higher perceptions of CIO and technology organization
performance in terms of overall user satisfaction. Further, it examines if there is a correlation
between high-performance culture creation and CIO and IT department performance in terms
of overall user satisfaction. Finally, it identifies what constitutes overall satisfaction in the
eyes of internal college and university constituencies (Figure 1).

Figure 1: Overall User Satisfaction DO
Superior performance in organizational quality areas
WITHIN THE CENTRALIZED
IT DEPARTMENT
Development of a high-performance culture
• Accountability • Capability • Direction • Coordination &
Control • Environment & Values • External Orientation • Innovation • Leadership • Motivation
• Teamwork & Team Rewards
• Systems, Procedures, & Information Availability
• Staff Development • Psychological Safety &
Job Security • Valued, Well-Treated
Employees • Meaningful Jobs • Good Pay • Work
Climate/Recognition
(Leslie et al., 2006; Smet et al., 2007)
(Pfeffer, 1999a; 1999b; Pfeffer &Sutton, 2006h; Pfeffer, 2007a)
AFFECT
Factors Potentially Impacting User Satisfaction Academic Alignment Communication Enablement Fiscal Responsibility Importance Innovation Reliability Responsiveness Shared Governance Support (Satisfaction factors based upon higher education CIO literature.)
OVERALL USER SATISFACTION
91

Operationalization of Variables
Organizational Quality Areas
In 2006, Leslie, Loch, and Schaninger published a study in the McKinsey Quarterly
which proposed that a combination of management practices carefully selected can be more
effective than single interventions. They found that companies that maintained a basic
proficiency in all 34 of the management practices identified in the study and also exhibited
superiority in a much smaller complimentary subset had better financial results (Leslie et al.,
2006). These 34 practices fall under nine key areas used to define organizational quality
(accountability, capabilities, coordination and control, direction, environment and values,
external orientation, innovation, leadership, and motivation) that the authors believe
“underpin organizational excellence” (Smet et al., 2007, p. 6). Companies with a straight
average of performance in the nine areas in the top quartile “were more than twice as likely
as those in the bottom quartile to have above-average margins for their industry” (Smet et al.,
2007, p. 6).
This study looked at these same organizational quality areas to see if there was a
correlation between overall user satisfaction with the IT organization and CIOs and a similar
straight average of performance in these nine areas. The surveys that were used in these
McKinsey Quarterly studies were not publicly available but Schaninger, one of the
McKinsey Quarterly study authors, was very helpful in providing general information about
how the surveys were written. The operational definitions below (Table 12) are based upon
this discussion with Schaninger as well as the 2006 and 2007 articles. Centralized IT
organization employees were asked to respond to each operational definition using a six-
point Likert scale (used to allow no neutral position).
92

Table 12: Operationalization of Variables: Nine Areas Used to Define Organizational Quality Variables Operational Definitions
Accountability • I feel accountable for the results I must deliver (Q49). • I believe people throughout the centralized IT organization are accountable
for the results they must deliver (Q50). Capability • I have the skills I need to support the centralized IT organization’s
technology initiatives (Q51). • I believe people throughout the centralized IT organization have the skills
they need to support the centralized IT organization’s technology initiatives (Q52).
Coordination and Control
• Our centralized IT organization’s performance is measured regularly (Q53). • Our centralized IT organization’s performance is reported regularly (Q54). • Technology risks are measured regularly (Q55). • Technology risks are reported regularly (Q56).
Direction • I know the goals of the centralized IT organization (Q57). • I know how my job supports the goals of the centralized IT organization
(Q58). • I believe in the goals of the centralized IT organization (Q59).
Environment and Values
• The centralized IT organization has a strong culture of shared values (Q60). • I fit well with the centralized IT organization’s culture (Q61).
External Orientation
• I have consistent two-way communication with campus users to ensure their satisfaction (Q62).
• I believe people throughout the centralized IT organization have consistent two-way communication with campus users to ensure their satisfaction (Q63).
Innovation • I am encouraged to be innovative (Q64). • The centralized IT organization is innovative (Q65). • I am encouraged to generate new ideas to improve the centralized IT
organization (Q66). Leadership • I am a leader among my peers (Q67).
• I inspire employees to perform better (Q68). • I am inspired to perform better by individuals at all levels throughout the
centralized IT organization (Q69). • I am inspired to perform better by my supervisor (Q70). • I am inspired to perform better by the senior most technology leader on our
campus (chief information officer, vice president, etc.) (Q71). Motivation • I am encouraged to stay with the centralized IT organization (continue
working for the centralized IT organization) (Q72). • I believe people throughout the centralized IT organization are encouraged
to stay with the organization (continue working for the centralized IT organization) (Q73).
93

Since this is an experimental design and a first attempt to define these organizational
quality variables within IT organizations, it is the author’s point of view that for the purposes
of this study, each organizational quality variable’s operational definitions specifically define
the variable. The components are not necessarily trying to measure the same thing but
together comprise the variable’s score. Appendix T provides internal consistency
information using Cronbach’s Alpha for that may be useful for further research. A brief
overview of the consistency findings will be discussed.
• Accountability – A high inter-item correlation (above .7) was found – Cronbach’s
alpha was .84.
• Capability – An interesting negative inter-item correlation was found - Cronbach’s
alpha was -1.9. This is an extremely interesting finding (one that seems to indicate
that responders believe there is a difference between their capabilities and those of
their peers) and is an area for further research.
• Coordination and Control – A high inter-item correlation (above .7) was found -
Cronbach’s alpha was .94. All items are highly correlated with the total with the
weakest being “technology risks are measured regularly” at .81.
• Direction – A high inter-item correlation (above .7) was found - Cronbach’s alpha
was .89. All items are highly correlated with the total with the weakest being “I know
how my job supports the goals of the centralized IT organization” at .70.
• Environment and Values – A high inter-item correlation (above .7) was found -
Cronbach’s alpha was .90.
• External Orientation – A very slight negative inter-item correlation was found -
Cronbach’s alpha was -.02. This is an extremely interesting finding (one that seems
94

to indicate that responders believe there is a difference between their external
orientation and that of their peers) and is an area for further research.
• Innovation – A high inter-item correlation (above .7) was found - Cronbach’s alpha
.93. All items are highly correlated with the total with the weakest being “I am
encouraged to be innovative” at .87.
• Leadership – An inter-item correlation was found - Cronbach’s alpha .67. Item
correlations with the total varied from the strongest being “I am inspired to perform
better by individuals at all levels throughout the centralized IT organization” at (.64)
to the weakest being “I inspire employees to perform better” at .22. Separating
questions 67 and 68 into a separate category would increase the Cronbach’s alpha and
is an area for further study.
• Motivation – A high inter-item correlation (above .7) was found - Cronbach’s alpha
.97.
In this study, the score for each organizational quality variable was calculated by taking an
average of each variable’s operational definitions (Table 12).
High-Performance Areas
Based on 1999, 2006, and 2007 works by Pfeffer and Sutton who outline the keys to
creating high-performance cultures, eight high-performance culture categories were
identified (Pfeffer, 1999a; 1999b; Pfeffer &Sutton, 2006h; Pfeffer, 2007a). Each category
was then defined by one or more statements (operational definitions) which were also
developed based on these works (Table 13). Centralized IT staff members were asked to
respond to each operational definition using a six-point Likert scale (used to allow no neutral
position).
95
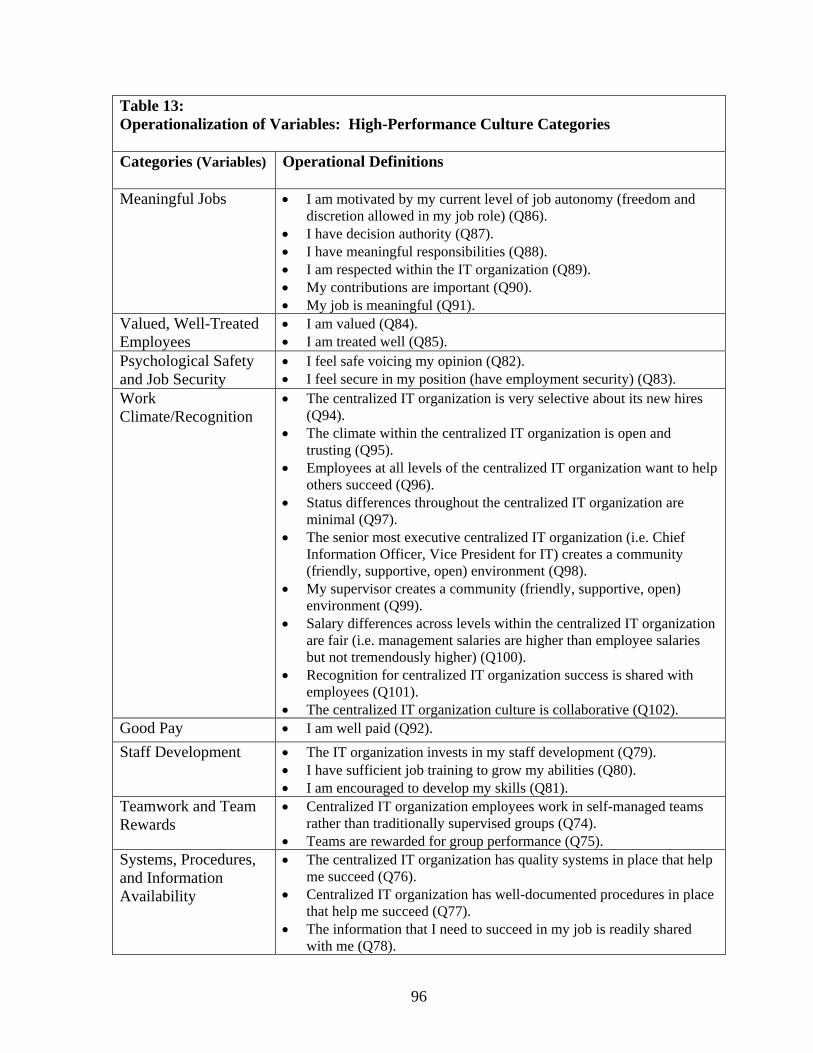
Table 13: Operationalization of Variables: High-Performance Culture Categories Categories (Variables) Operational Definitions
Meaningful Jobs • I am motivated by my current level of job autonomy (freedom and discretion allowed in my job role) (Q86).
• I have decision authority (Q87). • I have meaningful responsibilities (Q88). • I am respected within the IT organization (Q89). • My contributions are important (Q90). • My job is meaningful (Q91).
Valued, Well-Treated Employees
• I am valued (Q84). • I am treated well (Q85).
Psychological Safety and Job Security
• I feel safe voicing my opinion (Q82). • I feel secure in my position (have employment security) (Q83).
Work Climate/Recognition
• The centralized IT organization is very selective about its new hires (Q94).
• The climate within the centralized IT organization is open and trusting (Q95).
• Employees at all levels of the centralized IT organization want to help others succeed (Q96).
• Status differences throughout the centralized IT organization are minimal (Q97).
• The senior most executive centralized IT organization (i.e. Chief Information Officer, Vice President for IT) creates a community (friendly, supportive, open) environment (Q98).
• My supervisor creates a community (friendly, supportive, open) environment (Q99).
• Salary differences across levels within the centralized IT organization are fair (i.e. management salaries are higher than employee salaries but not tremendously higher) (Q100).
• Recognition for centralized IT organization success is shared with employees (Q101).
• The centralized IT organization culture is collaborative (Q102). Good Pay • I am well paid (Q92).
Staff Development • The IT organization invests in my staff development (Q79). • I have sufficient job training to grow my abilities (Q80). • I am encouraged to develop my skills (Q81).
Teamwork and Team Rewards
• Centralized IT organization employees work in self-managed teams rather than traditionally supervised groups (Q74).
• Teams are rewarded for group performance (Q75). Systems, Procedures, and Information Availability
• The centralized IT organization has quality systems in place that help me succeed (Q76).
• Centralized IT organization has well-documented procedures in place that help me succeed (Q77).
• The information that I need to succeed in my job is readily shared with me (Q78).
96

Once again, since this is an experimental design and a first attempt to define these high-
performance categories, it is the author’s point of view that for the purposes of this study,
each category’s questions specifically define the category. The components are not
necessarily trying to measure the same thing but together comprise the category’s score.
Appendix T provides internal consistency information using Cronbach’s Alpha for that may
be useful for further research. A brief overview of the consistency findings will be
discussed.
• Meaningful Jobs – A high inter-item correlation (above .7) was found - Cronbach’s
alpha .93. All items are highly correlated with the total with the weakest being “I
have decision authority” at .74.
• Valued, Well-Treated Employees – A high inter-item correlation (above .7) was
found - Cronbach’s alpha .93.
• Psychological Safety and Job Security – A high inter-item correlation (above .7) was
found - Cronbach’s alpha .89.
• Work Climate/Recognition – A high inter-item correlation (above .7) was found -
Cronbach’s alpha .96. Items are highly correlated with the total with the weakest
being “My supervisor creates a community (friendly, supportive, open) environment”
at .66.
• Staff Development – A high inter-item correlation (above .7) was found - Cronbach’s
alpha .95. Items are highly correlated with the total with the weakest being “I am
encouraged to develop my skills” at .84.
• Teamwork and Team Rewards – Cronbach’s alpha was .49. This is an area for
further study.
97

• Systems, Procedures, and Information Availability – A high inter-item correlation
(above .7) was found - Cronbach’s alpha .92. Items are highly correlated with the
total with the weakest being “The centralized IT organization has well-documented
procedures in place that help me succeed” at .82.
In this study, the score for each high performance culture variable were calculated by taking
an average of each variable’s operational definitions (Table 13).
Factors Potentially Impacting User Satisfaction
Based on the higher education chief information officer literature, ten factors were
identified as potential drivers of user satisfaction (academic alignment, communication,
enablement, fiscal responsibility, importance, innovation, reliability, responsiveness, shared
governance, and support). Each factor was then defined by one or more statements
(operational definitions) which were also developed based on available literature (Table 14).
Faculty, non-centralized IT staff, and students were asked to respond to each operational
definition using a six-point Likert scale (used to allow no neutral position).
98

Table 14: Operationalization of Variables: Factors Potentially Impacting User Satisfaction Variables Operational Definitions
Academic Alignment
• The centralized IT organization understands the academic environment (Q210a). • The centralized IT organization’s priorities seem to be aligned with the institution’s
priorities (Q210b). • The centralized IT organization’s priorities seem to be aligned with the institution’s
purpose (Q210c). • The centralized IT organization’s priorities seem to be aligned with my priorities
(Q210d). Communication • The centralized IT organization communicates effectively with me (Q25a).
• I am aware of the priorities of the centralized IT organization (Q25b). • I am aware of the goals of the centralized IT organization (Q25c). • The centralized IT organization communicates effectively (Q25d). • The centralized IT organization communicates proactively (Q25e). • I am aware of our campus vision for technology (Q25f). • I am aware of how the centralized IT organization works toward supporting our
campus vision (Q25g). • The centralized IT organization manages change well (Q25h).
Enablement • The centralized IT organization assists me in achieving my goals (Q11a). • The centralized IT organization understands my needs (Q11b). • The centralized IT organization focuses on initiatives that matter to me (Q11c).
Fiscal Responsibility
• The centralized IT organization seems to manage its resources well (Q23a). • The centralized IT organization seems to fund initiatives that assist me in achieving
my goals (Q23b). • The centralized IT organization seems to be fiscally responsible (Q23c).
Importance • An effective centralized IT organization is critical to the success of our institution (Q29a).
• An effective centralized IT organization is critical to my success (Q29b). Innovation • The centralized IT organization is innovative (Q27). Reliability • I can rely on centralized IT organization employees (Q15a).
• The services provided to me by the centralized IT organization are stable (Q15b). • The services provided to me by the centralized IT organization are reliable (Q15c).
Responsiveness • The centralized IT organization is flexible (Q17a). • The centralized IT organization is responsive (Q17b).
Shared Governance
• Centralized IT organization employees collaborate with members of the campus community to solve problems (Q19a).
• Centralized IT organization employees collaborate with members of the campus community to establish priorities (Q19b).
• Responsibility for major technology initiatives are shared between the centralized IT organization and campus stakeholders (others on campus who have an interest in the project’s outcome) (Q19c).
• The centralized IT organization is effective at gathering support for initiatives (Q19d).
• I currently have adequate input into campus decision making (Q19e). • I currently have adequate involvement with campus IT decision making (Q19f).
Support • The centralized IT organization provides me the services I need (Q13a). • The centralized IT organization provides me the technology training I need (Q13b). • The centralized IT organization provides me good customer service (Q13c). • The centralized IT organization supports my needs (Q13d).
99

Since this is an experimental design and a first attempt to identify and define these
factors, it is the author’s point of view that for the purposes of this study, each factor’s
components specifically define the factor. The components are not necessarily trying to
measure the same thing but together comprise the factor’s score. Appendix T provides
internal consistency information using Cronbach’s Alpha for that may be useful for further
research. A brief overview of the consistency findings will be discussed.
• Academic Alignment – A high inter-item correlation (above .7) was found -
Cronbach’s alpha .95. All items are highly correlated with the total with the weakest
being “the centralized IT organization’s priorities seem to be aligned with my
priorities” at .84.
• Communication – A high inter-item correlation (above .7) was found - Cronbach’s
alpha .96. All items are highly correlated with the total with the weakest being “the
centralized IT organization communicates effectively with me” at .80.
• Enablement – A high inter-item correlation (above .7) was found - Cronbach’s alpha
.92. All items are highly correlated with the total with the weakest being “the
centralized IT organization assists me in achieving my goals” at .82.
• Fiscal Responsibility – A high inter-item correlation (above .7) was found -
Cronbach’s alpha .94. All items are highly correlated with the total with the weakest
being “the centralized IT organization seems to fund initiatives that assist me in
achieving my goals” at .85.
• Importance – A high inter-item correlation (above .7) was found - Cronbach’s alpha
.81.
• Innovation – Innovation was only comprised of one question so no analysis is needed.
100

• Reliability – A high inter-item correlation (above .7) was found - Cronbach’s alpha
.93. All items are highly correlated with the total with the weakest being “I can rely
on centralized information technology (IT) organization employees” at .79.
• Responsiveness – A high inter-item correlation (above .7) was found - Cronbach’s
alpha .88.
• Shared Governance – A high inter-item correlation (above .7) was found -
Cronbach’s alpha .95. All items are highly correlated with the total with the weakest
being “I currently have adequate involvement with campus IT decision making” at
.80.
• Support – A high inter-item correlation (above .7) was found - Cronbach’s alpha .90.
All items are highly correlated with the total with the weakest being “The centralized
IT organization provides me the technology training I need” at .67.
In this study, the total scores for each factor (academic alignment, communication,
enablement, fiscal responsibility, importance, innovation, reliability, responsiveness, shared
governance, and support) were calculated by taking an average of each factor’s operational
definitions (Table 14). Respondents who answered “Not Sure” to all sub-questions for a
given factor were eliminated from the correlation analysis for that factor.
Overall Satisfaction
Based on the higher education chief information officer literature, questions were
developed to measure overall IT organization and CIO satisfaction (Table 15). Faculty, non-
centralized IT staff, and students were asked to respond to each operational definition using a
six-point Likert scale (used to allow no neutral position). Respondents who responded “Not
101

Sure” to CIO satisfaction questions 36-38 (Appendix B) were omitted from the CIO
satisfaction correlation analysis.
Table 15: Operationalization of Variables: Overall IT Organization and CIO Satisfaction Variables Operational Definitions
Overall Satisfaction with IT Organization
• The centralized IT organization at our institution is effective (Q31).
• I am satisfied with the performance of the central IT organization (Q232).
• I believe the central IT organization is doing an outstanding job (Q33).
• Overall my satisfaction with the central IT organization at our institution is high (Q34).
Overall Satisfaction with CIO
• The Chief Information Officer (senior most technology leader for the college or university) at our institution is effective (Q36).
• I am satisfied with the performance of the Chief Information Officer (senior most technology leader for the college or university) (Q37).
• I believe the Chief Information Officer (senior most technology leader for the college or university) is doing an outstanding job (Q38).
Once again, since this is an experimental design and a first attempt to identify and
define overall satisfaction, it is the author’s point of view that for the purposes of this study,
each overall satisfaction score’s operational definitions specifically define overall
satisfaction. Appendix T provides internal consistency information using Cronbach’s Alpha
for that may be useful for further research. A brief overview of the consistency findings will
be discussed.
• Satisfaction with the Centralized Information Technology Organization – A high
inter-item correlation (above .7) was found - Cronbach’s alpha .97. All items are
highly correlated with the total.
102

• Satisfaction with the Chief Information Officer – A high inter-item correlation (above
.7) was found - Cronbach’s alpha .98. All items are highly correlated with the total.
Inter-Institutional Differences in IT User Satisfaction
The overall IT user satisfaction scores are a function of the university they come from
(average score) and individual subject score (which accounts for error).
yIT~U +S
Intraclass correlation coefficient (ICC) was used to assess the consistency of user
satisfaction responses at the eleven institutions with institution-wide participation. The test
hypothesis was that the between university variance is 0. The between institutions variance
was 4.26 and the error variance between subjects within the institution was 21.06. The
resulting p value of .0245 is small (<.05) therefore this hypothesis was rejected. There is a
difference in the levels of satisfaction reported in different institutions (Appendix J).
The study found that 17% of the total variance was between universities which is
large in the context of this study. Since in this study what is being measured (user
satisfaction) and how it is being measured (individuals responding to Likert scale questions)
should result in significant between subject error (people responding to Likert scales and
perceive user satisfaction differently), the fact that results show such a large percentage of
variance as institutional variance is significant and supports the conclusion that user
satisfaction differs between institutions.
Information technology user satisfaction, which has now been shown to differ
between universities, is an outcome that must be the function of something. In this study, it
is being defined as a function of the IT organization’s performance, the CIO’s performance,
103

other intervening variables, and subject score (individual differences which account for
error). Thus the overall model is:
yuser satisfaction ~ XIT + XCIO + Uother + S
Uother is the portion of the difference between universities that is not accounted for by
IT organization and CIO performance. University effect is an unmeasured variable in the
model.
Sampling Frame
Chief information officers at institutions identified with doctoral level programs
through The Carnegie Foundation for the Advancement of Teaching (DRU:
Doctoral/Research Universities, RU/H: Research Universities – high research activity,
RU/VH: Research Universities – very high research activity) were contacted to request their
school’s participation in the study which was conducted using an online survey tool (The
Carnegie Foundation Staff, 2008). Doctoral level institutions were selected for this study
rather than including all higher education institutions to keep the study size manageable.
Contact information was gathered for the CIO, the CIO’s executive assistant, and two
faculty members in Library and Information Science, Computer Science, or other closely
related department at each of the 282 institutions listed in Appendix C. Contact information
for all of these people was collected in order to provide numerous avenues in which to
request overall institution participation. Potential participants at each institution included
faculty, staff, and students.
Survey Distribution and Administration
The data was collected using two online survey instruments loosely based upon those
used in 2006 and 2007 evidenced-based management McKinsey Quarterly articles (Leslie et
104

al., 2006; Smet et al., 2007). The surveys that were used in these McKinsey Quarterly
studies were not publicly available so I spoke with one of the authors of the articles,
Schaninger, and he was very helpful in providing information about how the surveys were
written. The surveys used in this study were developed based on those articles as well as
conversations with the author. Additionally, high-performance questions were derived from
1999, 2006, and 2007 works by Pfeffer and Sutton which outline the keys to creating high-
performance management systems (Pfeffer, 1999a; 1999b; Pfeffer & Sutton 2006h; Pfeffer,
2007a).
A giveaway (choice of $200 or a Nintendo Wii) was used as an incentive for survey
participation. One winner was randomly selected among all participants.
CIOs were asked to take the online “Chief Information Officer (CIO) Survey”
(Appendix A) and send out a prewritten recruitment email (Appendix G) to all faculty,
students, and staff at their institution to take the “Campus Technology Survey” (Appendix
B). Qualtrics survey software (provided through University of North Carolina’s Odum
Institute for Research in Social Science) was used to gather the data.
In the McKinsey Quarterly study, employees from all levels of an organization took a
survey that measured performance based on outcomes and practices. The study looked at the
nine outcomes listed previously in Table 2. The survey in that study asked employees to rate
their company’s effectiveness in these nine outcome areas using a Likert scale. This
dissertation study conducted a similar survey. Additionally, the Campus Technology Survey
included high-performance culture category questions (Table 3) that were answered by the
centralized information technology department employees.
105

Before sending out surveys to the institutions, the surveys were reviewed by
consultants at the Odum Institute and my dissertation committee. They were then tested by a
group of SILS Ph.D. students. The surveys were then further tested at one of the 282
doctoral institutions. Only one change was made to the campus technology survey
(Appendix B). Originally, there were three surveys: one for CIOs, one for centralized IT
employees, and a third for campus users. This made the distribution directions for the CIO
too complicated. Therefore, the centralized IT employee survey was combined into the
campus technology survey and survey logic was used to direct respondents to answer
relevant questions based on their role. All groups completed introductory questions and then
campus users continued the survey until they completed question 41. Centralized IT
employees completed questions 43-116.
I then began my recruitment plan. First, I sent out a promotional and recruitment
email (Appendix H) about my survey to the EDUCAUSE CIO Constituent Group Listserv
([email protected]). Second, I used the contact information I gathered
for each of the 282 CIOs to send a personalized email (Appendix D) requesting their
participation in the study and attaching participation instructions (Appendix G). Third, I
thanked those that agreed to take part in the study and sent participation instructions once
again. Fourth, after approximately two weeks, I followed up with the CIOs that I had not
heard back from with a second email (Appendix F). Fifth, after waiting another week, I
contacted the CIOs assistant and/or faculty members at institutions that had not responded
requesting their assistance in obtaining their institution’s participation (Appendices E & I).
Finally, after I sent the email to the EDUCAUSE CIO Constituent Group Listserv there were
a few requests to participate from those not at doctoral institutions. I modified my
106

107
institutional review board (IRB) submission and received approval to include these
institutions in the study as well since the study sample size was small. Select results below
include analysis with and without these institutions included.

ANALYSIS AND STUDY FINDINGS
Participation Overview
Twenty-eight institutions participated in the study. Twenty-two are classified as
either DRU, RU/H, or RU/VH and six of the 28 are private. An overview of institutional
participation is in Table 16 and individual participation is in Table 17. Incomplete surveys,
as well as responses from students under 18 years of age and from those who worked at the
institution less than three months, were not included in the data analysis. Institution-wide
participation is defined as any institution where participation requests were sent to all groups
regardless of response rate (Table 16).
Table 16: Institution Participation Overview DRU,
RU/H, or RU/VH
NON DRU, RU/H, or RU/VH
Public Private TOTAL
Institution-Wide Participation (all groups responding)
8 1 8 1 9
Institution-Wide Participation (incomplete CIO survey)
1 0 1 0 1
Institution-Wide Participation (but no student responses)
0 1 1 0 1
CIO Participation Only 12 4 11 5 16
CIO and IT Staff Only Participation
1 0 1 0 1
TOTALS 22 6 22 6 28

Table 17: Individual Participation Overview DRU,
RU/H, or RU/VH
NON DRU, RU/H, or RU/VH
Public Private TOTAL
CIOs 21 6 21 6 27
Centralized IT Department Staff 163 39 163 39 202
Decentralized IT Department Staff 176 1 176 1 177
Non-IT Staff 979 132 979 132 1111
Faculty 487 13 487 13 500
Students 1304 1 1304 1 1305
TOTALS 3130 192 3130 192 3322
Descriptive Survey Data
The total number of students enrolled at the participating intuitions ranged from under
5,000 to 35,000 with the average being between 10,000 and 20,000. CIOs responding to this
survey, on average, have held their current position for three to five years. Two CIOs have
been in the position less than six months and two held their current role for eleven or more
years. Not including student workers, the average CIO oversaw centralized IT organizations
consisting of between 51 and 100 employees and the majority of responders had
organizations ranging from 51 to 200 employees. Three CIOs had less than 25 employees
and two had greater than 300. The average recurring centralized IT budget was reported by
CIOs to be between $5,000,000 and $10,000,000. Two IT leaders reported centralized
budgets less than $1,000,000 and two reported ones greater than $50,000,000. Twenty-one
109

of the 27 CIOs responding stated that information technology management and responsibility
at their institution was either mostly or very centralized. Four believed it to be equally
divided and two stated it was mostly decentralized.
Research Questions
Research Question 1 – Factors Associated with User Satisfaction
Which factors are most associated with user satisfaction with the centralized technology organization (Table 1)? Which factors are most associated with satisfaction with the CIO? Data for this question was captured from all faculty, student, non-centralized IT staff,
and non-IT staff using questions 11, 13, 15, 17, 19, 21 (labeled 210), 23, 25, 27, 29 on the
Campus Technology Survey (Appendix B). Based on the literature, ten factors were
identified as potential drivers of user satisfaction (academic alignment, communication,
enablement, fiscal responsibility, importance, innovation, reliability, responsiveness, shared
governance, and support). Each factor was then operationalized using one or more
statements (Table 12) which were developed based on available literature. Respondents were
asked to agree or disagree with each statement using a six point Likert scale and those who
responded “Not Sure” to questions 36-38 were omitted from the CIO satisfaction correlation
analysis. Data is reported for all participating institutions and then additionally for research
institutions (DRU, RU/H, RU/VH) only.
All factors were found to be correlated with centralized IT organization and CIO
satisfaction. Most were highly correlated (Tables 18 & 20). Overall, academic alignment,
fiscal responsibility, communication, innovation, and support appear most often (six, six,
five, four, and four times respectively) as one of the top associated across all respondents
with both IT organization and CIO satisfaction. The importance of IT, reliability, shared
110

governance, and responsiveness appear most often (eight, five, five, and four times
respectively) as one of the bottom associated across all respondents.
The factors most highly correlated with satisfaction with the centralized IT
organization are academic alignment, support, fiscal responsibility, reliability, and
enablement. The factors most highly correlated with satisfaction with the CIO are fiscal
responsibility, communication, innovation, and academic alignment. The factors least
associated with satisfaction with the centralized IT organization are the importance of
information technology, shared governance, and communication. The ones least associated
with satisfaction with the CIO are importance of information technology, reliability, and
responsiveness (Tables 18 & 20).
Tables 19 and 21 report correlations for research institutions (DRU, RU/H, RU/VH)
only. Only slight differences were found and are highlighted in the tables below. When
examining satisfaction with the centralized IT organization in research universities only,
shared governance was slightly (.00708) more correlated than communication (faculty),
enablement was slightly (.00091) more correlated than reliability (non-IT staff), and
innovation was slightly (.00324) more correlated than responsiveness (non-IT staff). When
examining satisfaction with the CIO in research universities only, responsiveness was
slightly (.00007) more correlated than reliability (non-IT staff).
111
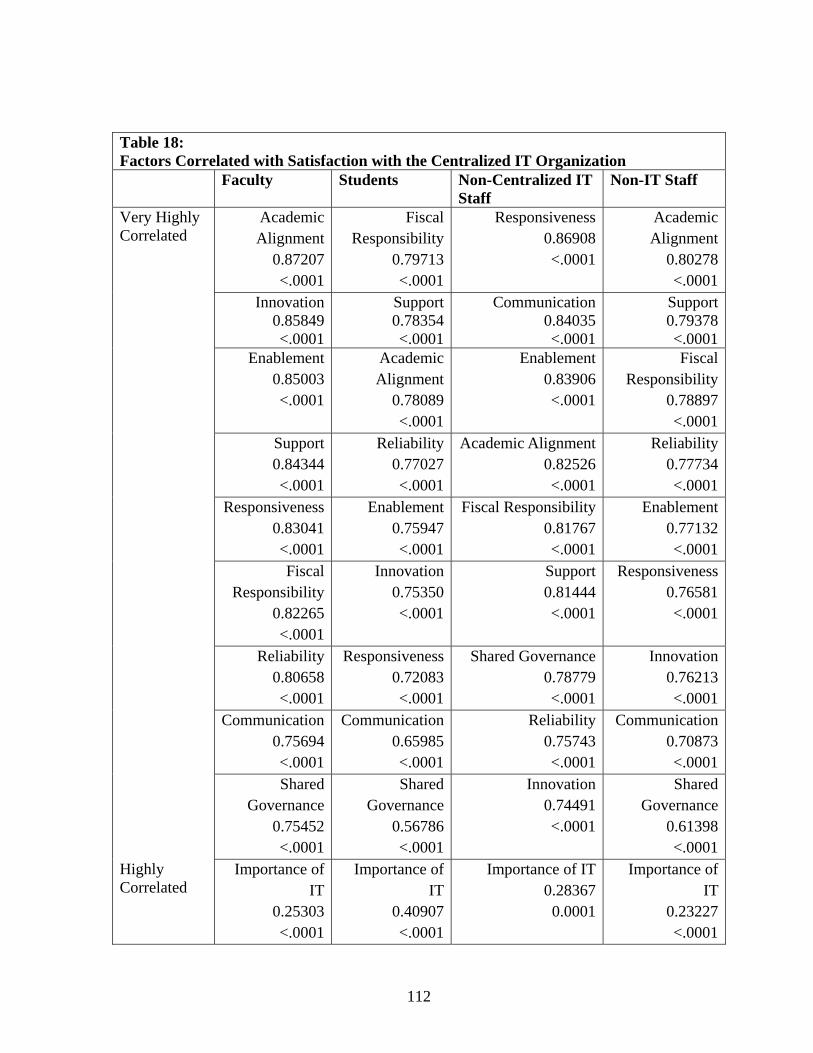
Table 18: Factors Correlated with Satisfaction with the Centralized IT Organization Faculty Students Non-Centralized IT
Staff Non-IT Staff
Very Highly Correlated
Academic Alignment
0.87207 <.0001
Fiscal Responsibility
0.79713<.0001
Responsiveness 0.86908 <.0001
Academic Alignment
0.80278<.0001
Innovation 0.85849 <.0001
Support0.78354<.0001
Communication 0.84035 <.0001
Support0.79378<.0001
Enablement 0.85003 <.0001
Academic Alignment
0.78089<.0001
Enablement 0.83906 <.0001
Fiscal Responsibility
0.78897<.0001
Support 0.84344 <.0001
Reliability0.77027<.0001
Academic Alignment 0.82526 <.0001
Reliability0.77734<.0001
Responsiveness 0.83041 <.0001
Enablement0.75947<.0001
Fiscal Responsibility 0.81767 <.0001
Enablement0.77132<.0001
Fiscal Responsibility
0.82265 <.0001
Innovation0.75350<.0001
Support 0.81444 <.0001
Responsiveness0.76581<.0001
Reliability 0.80658 <.0001
Responsiveness0.72083<.0001
Shared Governance 0.78779 <.0001
Innovation0.76213<.0001
Communication 0.75694 <.0001
Communication0.65985<.0001
Reliability 0.75743 <.0001
Communication0.70873<.0001
Shared Governance
0.75452 <.0001
Shared Governance
0.56786<.0001
Innovation 0.74491 <.0001
Shared Governance
0.61398<.0001
Highly Correlated
Importance of IT
0.25303 <.0001
Importance of IT
0.40907<.0001
Importance of IT 0.28367 0.0001
Importance of IT
0.23227<.0001
112

Table 19: Factors Correlated with Satisfaction with the Centralized IT Organization (Research Universities Only) Faculty Students Non-Centralized IT
Staff Non-IT Staff
Very Highly Correlated
Academic Alignment
0.87155 <.0001
Fiscal Responsibility
0.79721<.0001
Responsiveness 0.86833 <.0001
Academic Alignment
0.80283<.0001
Innovation 0.85489 <.0001
Support0.78356<.0001
Communication 0.83908 <.0001
Support0.78898<.0001
Enablement 0.84661 <.0001
Academic Alignment
0.78090<.0001
Enablement 0.83837 <.0001
Fiscal Responsibility
0.78664<.0001
Support 0.84085 <.0001
Reliability0.77057<.0001
Academic Alignment 0.82381 <.0001
Enablement0.77101<.0001
Responsiveness 0.82598 <.0001
Enablement0.75946<.0001
Fiscal Responsibility 0.81641 <.0001
Reliability0.77010<.0001
Fiscal Responsibility
0.82027 <.0001
Innovation0.75352<.0001
Support 0.81309 <.0001
Innovation0.76604<.0001
Reliability 0.80266 <.0001
Responsiveness0.72082<.0001
Shared Governance 0.78645 <.0001
Responsiveness0.76280<.0001
Shared Governance 0.75667 <.0001
Communication0.65983<.0001
Reliability 0.75740 <.0001
Communication0.70123<.0001
Communication 0.74959 <.0001
Shared Governance
0.56785<.0001
Innovation 0.74305 <.0001
Shared Governance
0.60169
Highly Correlated
Importance of IT 0.24679 <.0001
Importance of IT0.40528<.0001
Importance of IT 0.23690 0.0015
Importance of IT0.21598<.0001
113

Table 20: Factors Correlated with Satisfaction with the CIO Faculty Students Non-Centralized IT
Staff Non-IT Staff
Highly Correlated
Academic Alignment
0.72256 <.0001
Fiscal Responsibility
0.65191<.0001
Responsiveness 0.68457 <.0001
Fiscal Responsibility
0.62750<.0001
Fiscal Responsibility
0.69795 <.0001
Communication0.63113<.0001
Communication 0.68057 <.0001
Communication0.59617<.0001
Innovation 0.69329 <.0001
Innovation0.62096<.0001
Shared Governance 0.66334 <.0001
Academic Alignment
0.59312<.0001
Communication 0.68905 <.0001
Support0.60866<.0001
Fiscal Responsibility 0.66064 <.0001
Innovation0.55192<.0001
Shared Governance
0.63235 <.0001
Academic Alignment
0.58579<.0001
Innovation 0.64126 <.0001
Support0.52776<.0001
Enablement
0.63112 <.0001
Reliability0.57680<.0001
Enablement 0.61004 <.0001
Shared Governance
0.52464<.0001
Responsiveness 0.62193 <.0001
Shared Governance
0.57059<.0001
Academic Alignment 0.60167 <.0001
Enablement0.50798<.0001
Support 0.61725 <.0001
Responsiveness0.56112<.0001
Support 0.57667 <.0001
Reliability0.49755<.0001
Reliability 0.54548 <.0001
Enablement0.55900<.0001
Reliability 0.50934 <.0001
Responsiveness0.48775<.0001
Correlated Importance of IT
0.27383 <.0001
Importance of IT
0.36398<.0001
Importance of IT 0.29108 0.0005
Importance of IT
0.22526<.0001
114

Table 21: Factors Correlated with Satisfaction with the CIO (Research Universities Only) Faculty Students Non-Centralized IT
Staff Non-IT Staff
Highly Correlated
Academic Alignment
0.71666 <.0001
Fiscal Responsibility
0.65278<.0001
Responsiveness 0.68336 <.0001
Fiscal Responsibility
0.60665<.0001
Fiscal Responsibility
0.69262 <.0001
Communication0.63134<.0001
Communication 0.67869 <.0001
Communication0.57858<.0001
Innovation 0.68775 <.0001
Innovation0.62086<.0001
Shared Governance 0.66128 <.0001
Academic Alignment
0.57537<.0001
Communication 0.68027 <.0001
Support0.60911<.0001
Fiscal Responsibility 0.65857 <.0001
Innovation0.52309<.0001
Shared Governance
0.62895 <.0001
Academic Alignment
0.58617<.0001
Innovation 0.63912 <.0001
Support0.51545<.0001
Enablement 0.62331 <.0001
Reliability0.57834<.0001
Enablement 0.60784 <.0001
Shared Governance
0.50564<.0001
Responsiveness 0.61158 <.0001
Shared Governance
0.57108<.0001
Academic Alignment 0.59890 <.0001
Enablement0.50558<.0001
Support 0.60722 <.0001
Responsiveness0.56110<.0001
Support 0.57390 <.0001
Responsiveness0.52122<.0001
Reliability 0.53565 <.0001
Enablement0.55897<.0001
Reliability 0.50762 <.0001
Reliability0.52115<.0001
Correlated Importance of IT
0.26951 <.0001
Importance of IT
0.36334<.0001
Importance of IT 0.28802 0.0006
Importance of IT
0.21519<.0001
115

Factors about which users reported most uncertanty included fiscal responsibility,
innovation, shared governance, and academic alignment. Users were not unsure about the
importance of information technology (Figure 2 & Table 22).
Figure 2: Percentage of Participants Who Responded Not Sure About Factors
Table 22: Percentage of Participants Who Responded Not Sure About Factors
Faculty Students Non-Centralized
IT Staff Non-IT Staff
Academic Alignment 9.6% 15.2% 4.5% 10.4%Communication 3.8% 10.3% 1.1% 2.3%Enablement 5.0% 13.3% 2.3% 4.9%Fiscal Responsibility 29.2% 27.2% 8.5% 25.7%Importance of IT 0.0% 0.0% 0.0% 0.0%Innovation 26.4% 29.4% 7.3% 25.1%Reliability 7.4% 12.9% 2.3% 3.7%Responsiveness 9.2% 18.5% 3.4% 5.1%Shared Governance 11.6% 20.8% 2.8% 8.9%Support 5.2% 12.3% 1.7% 2.6%
116

Although responders were not unsure of overall satisfaction with the information
technology organization, many were unsure of CIO performance. Approximately 40% of
faculty, students, and non-IT staff were unsure and 23% of decentralized IT employees were
uncertain as well (Figure 3 & Table 23).
Figure 3: Percentage of Participants Who Responded Not Sure About Overall Satisfaction
Table 23: Percentage of Respondents Who Responded Not Sure About Overall Satisfaction
Faculty StudentsNon-Centralized IT Staff
Non-IT Staff
Percentage Unsure of Overall IT Organization Satisfaction 0.0% 0.0% 0.0% 0.1%Percentage Unsure of Overall CIO Satisfaction 39.8% 40.8% 22.6% 40.0%
117

Faculty Data
Faculty results indicate that all ten factors (academic alignment, communication,
enablement, fiscal responsibility, importance, innovation, reliability, responsiveness, shared
governance, and support) are highly correlated with IT organization satisfaction. The most
strongly correlated are academic alignment, innovation, enablement, and support. The
weakest are reliability, communication, shared governance, and the importance of
information technology (Table 24).
All ten factors are also correlated (although not as strongly) with CIO satisfaction.
The most strongly correlated are academic alignment, fiscal responsibility, innovation, and
communication. The weakest are responsiveness, support, reliability, and the importance of
information technology (Table 24).
Both academic alignment and innovation are highly correlated with both centralized IT
organization and CIO satisfaction. Reliability and the importance of IT are least correlated
with both centralized IT organization and CIO satisfaction.
118

Table 24: Faculty Satisfaction Correlation Comparison Centralized IT Organization CIO
Academic Alignment0.87207<.0001
Academic Alignment0.72256<.0001
Innovation0.85849<.0001
Fiscal Responsibility0.69795<.0001
Enablement0.85003<.0001
Innovation0.69329<.0001
Support0.84344<.0001
Communication0.68905<.0001
Responsiveness0.83041<.0001
Shared Governance0.63235<.0001
Fiscal Responsibility0.82265<.0001
Enablement0.63112<.0001
Reliability0.80658<.0001
Responsiveness0.62193<.0001
Communication0.75694<.0001
Support0.61725<.0001
Shared Governance0.75452<.0001
Reliability0.54548<.0001
Importance of IT0.25303<.0001
Importance of IT0.27383<.0001
119

Student Data
Student results indicate that all ten factors (academic alignment, communication,
enablement, fiscal responsibility, importance, innovation, reliability, responsiveness, shared
governance, and support) are highly correlated with IT organization satisfaction. The most
correlated are fiscal responsibility, support, academic alignment, and reliability. The least
are responsiveness, communication, shared governance, and the importance of information
technology (Table 25).
All ten factors are also correlated (although not as strongly) with CIO satisfaction.
The most correlated are fiscal responsibility, communication, innovation, and support. The
least are shared governance, responsiveness, enablement, and the importance of information
technology (Table 25).
Fiscal responsibility and support are both highly correlated with both centralized IT
organization and CIO satisfaction. Responsiveness, shared governance, and the importance
of IT are least correlated with both centralized IT organization and CIO satisfaction.
120

Table 25: Student Satisfaction Correlation Comparison Centralized IT Organization CIO
Fiscal Responsibility0.79713<.0001
Fiscal Responsibility0.65191<.0001
Support0.78354<.0001
Communication0.63113<.0001
Academic Alignment0.78089<.0001
Innovation0.62096<.0001
Reliability0.77027<.0001
Support0.60866<.0001
Enablement0.75947<.0001
Academic Alignment0.58579<.0001
Innovation0.75350<.0001
Reliability0.57680<.0001
Responsiveness0.72083<.0001
Shared Governance0.57059<.0001
Communication0.65985<.0001
Responsiveness0.56112<.0001
Shared Governance0.56786<.0001
Enablement0.55900<.0001
Importance of IT0.40907<.0001
Importance of IT0.36398<.0001
121

Non-Centralized IT Staff Data
Non-centralized IT staff results indicate that all ten factors (academic alignment,
communication, enablement, fiscal responsibility, importance, innovation, reliability,
responsiveness, shared governance, and support) are highly correlated with IT organization
satisfaction. The most correlated are responsiveness, communication, enablement, and
academic alignment. The least are shared governance, reliability, innovation, and the
importance of information technology (Table 26).
All ten factors are also correlated (although not as strongly) with CIO satisfaction.
The most correlated are responsiveness, communication, shared governance, and fiscal
responsibility. The least are academic alignment, support, reliability, and the importance of
information technology (Table 26).
Both responsiveness and communication are highly correlated with both centralized IT
organization and CIO satisfaction. Reliability and the importance of IT are least correlated
with both centralized IT organization and CIO satisfaction.
122

Table 26: Non-Centralized IT Staff Satisfaction Correlation Comparison Centralized IT Organization CIO
Responsiveness0.86908<.0001
Responsiveness0.68457<.0001
Communication0.84035<.0001
Communication0.68057<.0001
Enablement0.83906<.0001
Shared Governance0.66334<.0001
Academic Alignment0.82526<.0001
Fiscal Responsibility0.66064<.0001
Fiscal Responsibility0.81767<.0001
Innovation0.64126<.0001
Support0.81444<.0001
Enablement0.61004<.0001
Shared Governance0.78779<.0001
Academic Alignment0.60167<.0001
Reliability0.75743<.0001
Support0.57667<.0001
Innovation0.74491<.0001
Reliability0.50934<.0001
Importance of IT0.283670.0001
Importance of IT0.291080.0005
123

Non-IT Staff Data
Non-IT staff results indicate that all ten factors (academic alignment, communication,
enablement, fiscal responsibility, importance, innovation, reliability, responsiveness, shared
governance, and support) are highly correlated with IT organization satisfaction. The most
correlated are academic alignment, support, fiscal responsibility, and reliability. The least
are innovation, communication, shared governance, and the importance of information
technology (Table 27).
All ten factors are also correlated (although not as strongly) with CIO satisfaction.
The most correlated are fiscal responsibility, communication, academic alignment, and
innovation. The least are enablement, reliability, responsiveness, and the importance of
information technology (Table 27).
Academic alignment and fiscal responsibility are both highly correlated with both
centralized IT organization and CIO satisfaction. The importance of information technology
is least correlated with both centralized IT organization and CIO satisfaction
124

Table 27: Non-IT Staff Satisfaction Correlation Comparison Centralized IT Organization CIO
Academic Alignment0.80278<.0001
Fiscal Responsibility0.62750<.0001
Support0.79378<.0001
Communication0.59617<.0001
Fiscal Responsibility0.78897<.0001
Academic Alignment0.59312<.0001
Reliability0.77734<.0001
Innovation0.55192<.0001
Enablement0.77132<.0001
Support0.52776<.0001
Responsiveness0.76581<.0001
Shared Governance0.52464<.0001
Innovation0.76213<.0001
Enablement0.50798<.0001
Communication0.70873<.0001
Reliability0.49755<.0001
Shared Governance0.61398<.0001
Responsiveness0.48775<.0001
Importance of IT 0.23227<.0001
Importance of IT0.22526<.0001
125

Mean overall satisfaction scores for the different groups of respondents are reported
below (Table 28 & Figure 4). Overall satisfaction with the centralized Information
Technology (IT) organization is an average of questions 31, 32 (labeled 232), 33, and 34 (per
respondent) (Appendix B) and with the chief information officer is an average of questions
36, 37 and 38 (per respondent) (Appendix B). A full list of means is reported in Appendix K.
Non-IT staff and students are most satisfied while non-centralized IT staff members are the
least satisfied.
Table 28: Mean Overall Satisfaction Scores
Faculty StudentsNon-Centralized
IT Staff Non-IT
StaffOverall IT Organization Satisfaction 4.28 4.44 3.67 4.56Overall CIO Satisfaction 4.24 4.31 3.66 4.28
Figure 4: Mean Overall Satisfaction Scores
126

Research Question 2 – Organizational Quality
Are technology organizations with a higher straight average of performance in the nine areas used to define organizational quality (Table 2) viewed as performing better than those which do not?
Data from the eleven institutions with responses from both campus users and the
centralized IT department was used to answer this question. Centralized IT employees
responded to these questions. First, the scores for each set of questions in each of the nine
organizational quality areas were averaged for each person responding to get an average
score per respondent in each of the nine areas (Table 29).
Table 29: Organizational Quality Questions Nine Organizational Quality Areas Campus Technology
Survey Accountability Questions 49-50 Capability Questions 51- 52 Coordination and Control Questions 53-56 Direction Questions 57-59 Environment and Values Questions 60-61 External Orientation Questions 62-63 Innovation Questions 64-66 Leadership Questions 67-71 Motivation Questions 72-73
Second, an institutional score for each organizational quality area was created by
averaging the per-person scores within each institution. Finally, the organizational quality
area scores for each institution were averaged to get a single mean score in each area across
all institutions. Means of each organizational quality area show that centralized IT employees
scored their organizations highest in accountability (5.13), capability (4.76), and direction
(4.68). They scored their organizations lowest in motivation (4.29), environment and values
(4.25), and coordination and control (3.71). A table of means is reported in Appendix L.
127

Next, the nine organizational quality area scores at each institution were averaged to
obtain a single organizational quality score for each institution, similar to the McKinsey
Quarterly studies this methodology is based upon. Whether or not the nine areas should be
equally weighted to determine the organizational quality score or whether certain items
should be weighted more heavily than others is an area for further study. Finally,
correlations were computed between each institution’s organizational quality score
(generated from centralized IT employee responses) and that institution’s overall satisfaction
with the centralized Information Technology (IT) organization and the belief that the chief
information officer is doing an outstanding job (generated from user responses, as defined
above in question one). Correlations are listed in Appendix L.
Since this sample size was very small (only 11 institutions), there is not enough
power to reasonably expect to reject a null hypothesis of no association. Instead, what this
study does is obtain and report an estimate of that association and make an assessment as to
whether that association may be large enough for further exploration. If, in fact, the
association in the population is the same size as that found in this exploratory study (.2), it is
a small to moderate correlation and one worth further exploration (Cohen, 1988). The
correlation found in this study between the organizational quality score and overall
satisfaction with the centralized Information Technology (IT) organization (.21), as well as
with the belief that the chief information officer is doing an outstanding job (.25) (Appendix
L), is consistent with the hypothesis that CIOs whose centralized information technology (IT)
organizations perform well in the nine areas used to define organizational quality are viewed
as having more successful IT organizations and as being more successful CIOs. The p-
values are high since there were only eleven institutions. According to Hoyle,
128

quite commonly, small samples will lead to results that do not reach the conventional level of significance—p values of less than .05, which might mistakenly lead the researcher to accept the null hypothesis of no relationship. Yet, by considering the effect size, the researcher might uncover a potentially interesting and valuable relationship that might have yielded more significant results if only more subjects were added to the study (Hoyle, 1999, p. 64).
The results of this research question as well as those to be discussed in question four,
particularly when taken together, are consistent with the hypothesis that CIOs whose
centralized information technology (IT) organizations perform well in the nine areas used to
define organizational quality and who create high-performance IT cultures are viewed as
having more successful IT organizations and as being more successful CIOs. Both are
positively correlated with small to moderate effect sizes (Cohen, 1988). Hoyle illustrates that
results that are far from significant in a small study with a small to moderate associated effect
size can have the same effect size in a larger more significant study (Hoyle, 1999). This is an
area for further research.
Research Question 3 – Organizational Quality Area Combinations
Are technology organizations with a higher performance in certain combinations of the nine areas used to define organizational quality (Table 2) viewed as performing better than those which do not?
Data from the eleven institutions with responses from both campus users and the
centralized IT department was used to answer this question. Centralized IT employees
responded to organizational quality questions. First, the scores for each set of questions in
each of the nine organizational quality areas were averaged for each person responding to get
an average score per respondent in each of the nine areas (Table 29). Second, an institutional
score for each organizational quality area was created by averaging the per-person scores
129

within each institution. Third, the organizational quality area scores for each institution were
averaged to get a single mean score in each area across all institutions. Linear regression was
used to choose the optimal model of three of the nine organizational quality factors that were
most associated with overall satisfaction with the centralized Information Technology (IT)
organization and the belief that the chief information officer is doing an outstanding job (as
defined above in question one). Correlations are listed in Appendix M.
In 2006, Leslie, Loch, and Schaninger published a study in the McKinsey Quarterly
which proposed that a combination of management practices carefully selected can be more
effective than single interventions. In this study, similar to the McKinsey Quarterly studies
this methodology is based on, correlations for an optimal model of three organizational
quality factors were calculated. Whether or not three is the optimal combination of factors to
examine (as opposed to two or four, for example) is an area for further study. This data is
provided for informational purposes as potential first areas in which to focus efforts as
discussed below.
The largest set of correlations with IT satisfaction includes coordination and control,
direction, and motivation (.78). The largest set of correlations with CIO satisfaction includes
coordination and control, direction, and external orientation (.79) (Appendix M). It is likely,
although large correlations are to be expected with a small dataset, that the combinations
with the highest correlations are probably valid, although a bigger sample is needed to
confirm this, and therefore should be the first to be explored in a larger analysis.
Research Question 4 – High-Performance
Are current higher education technology leaders building high-performance organizations that value, respect, and develop their employees (Table 3)? Is there a correlation between
130

the degree to which this is done and perceptions of CIO and technology organization performance? Are technology organizations with a higher performance in certain combinations of high-performance categories viewed as performing better than those which do not?
Results for each of these research questions will be reported here.
Are current higher education technology leaders building high-performance organizations that value, respect, and develop their employees (Table 3)?
Data from the twelve institutions with responses from centralized information
technology department staff (202 respondents) was used to answer this question. Centralized
IT employees responded to the high-performance questions. First, the scores for each set of
questions in each of the high-performance category areas was averaged for each person
responding to get an average score per respondent for each of the high-performance
categories (Table 13). Second, an institutional score for each high-performance category was
created by averaging the per-person scores within each institution. Finally, the high-
performance category scores for each institution were averaged to get a single mean score in
each category across all institutions. The categories were then sorted from highest to lowest
mean (Table 30).
According to employees, centralized IT organizations are doing well at creating
meaningful jobs, valuing and treating employees well, and creating an environment of
psychological safety and job security. Areas in which to focus additional efforts include
teamwork and team rewards, creating systems and procedures, and sharing information
(Table 30).
131

Table 30: High-Performance Culture Results By Category
Mean
Meaningful Jobs (Mean Q86-91)
4.87
Valued, Well-Treated Employees (Mean Q84+85)
4.83
Psychological Safety and Job Security (Mean Q82+83)
4.51
Work Climate/Recognition (Mean Q94-102)
4.23
Good Pay (Mean Q92)
4.20
Staff Development (Mean Q79-81)
4.15
Teamwork and Team Rewards (Mean Q74+75)
3.68
Systems, Procedures, and Information Availability (Mean Q76-78)
3.52
Overall Mean (mean of category means above) 4.25 Is there a correlation between the degree to which this is done and perceptions of CIO and technology organization performance? Data from the eleven institutions with responses from both campus users and the
centralized IT department was used to answer this question. Centralized IT employees
responded to the high-performance questions. First, the scores for each set of questions in
each of the high-performance category areas was averaged for each person responding to get
an average score per respondent for each of the high-performance categories (Table 13).
Second, an institutional score for each high-performance category was created by averaging
the per-person scores within each institution. Third, the high-performance category scores at
each institution were averaged to obtain a single high-performance score for each institution.
Whether or not the category areas should be equally weighted to determine the organizational
high-performance score or whether certain items should be weighted more heavily than
132

others is an area for further study. Finally, correlations were computed between each
institution’s high-performance score (generated from centralized IT employee responses) and
that institution’s overall satisfaction with the centralized Information Technology (IT)
organization and the belief that the chief information officer is doing an outstanding job
(generated from user responses, as defined above in question one).
The correlation found in this study between institutional high-performance culture
scores and overall satisfaction with the centralized Information Technology (IT) organization
(r = 0.14) and the belief that the chief information officer is doing an outstanding job (r =
0.19) (Appendix N) is consistent with the hypothesis that CIOs who create high-performance
IT cultures are viewed as having more successful IT organizations and as being more
successful CIOs. However, the p-values are high since there were only eleven institutions.
Since this sample size was very small (only 11 institutions), there is not enough power to
reasonably expect to reject a null hypothesis of no association. Instead, what this study does
is obtain and report an estimate of that association and make an assessment as to whether that
association may be large enough for further exploration. If, in fact, the association in the
population is the same size as that found in this exploratory study (.14 - .19), it is a small to
moderate correlation and one worth further exploration (Cohen, 1988).
The results of this research question as well as those discussed in question two,
particularly when taken together, are consistent with the hypothesis that CIOs whose
centralized information technology (IT) organizations perform well in the nine areas used to
define organizational quality and who create high-performance IT cultures are viewed as
having more successful IT organizations and as being more successful CIOs. Both are
positively correlated with small to moderate effect sizes. Hoyle illustrates that results that
133

are far from significant in a small study with a small to moderate associated effect size can
have the same effect size in a larger more significant study (Hoyle, 1999). This is an area for
further research.
Are technology organizations with a higher performance in certain combinations of high-performance categories (Table 3) viewed as performing better than those which do not?
Data from the eleven institutions with responses from both campus users and the
centralized IT department was used to answer this question. Centralized IT employees
responded to the high-performance questions. First, the scores for each set of questions in
each of the high-performance category areas was averaged for each person responding to get
an average score per respondent for each of the high-performance categories (Table 13).
Second, an institutional score for each high-performance category was created by averaging
the per-person scores within each institution. Third, the high-performance category scores at
each institution were averaged to obtain a single high-performance score for each institution.
Linear regression was used to choose the optimal model of three high-performance categories
that were most associated with overall satisfaction with the centralized Information
Technology (IT) organization and the belief that the chief information officer is doing an
outstanding job (as defined above in question one). Correlations are listed in Appendix N.
In this study, similar to the McKinsey Quarterly studies this methodology is based on,
correlations for an optimal model of three were calculated. The components necessary to
develop a high-performance culture are not isolated interventions but systemic,
complimentary management practices “to provide an environment that produces innovation,
discretionary effort, and high levels of performance and service” (Pfeffer, 2007a, p. 15).
134

Whether or not three is the optimal combination of categories to examine (as opposed to two
or four, for example) is an area for further study. This data is provided for informational
purposes as potential first areas in which to focus efforts as discussed below.
The largest correlation with overall IT organization satisfaction using a combination
of three high-performance categories is .89 (staff development, psychological safety and job
security, meaningful jobs). The largest correlation with overall CIO satisfaction is .89
(systems, procedures, and information availability; psychological safety and job security;
meaningful jobs). It is likely, although large correlations are to be expected with a small
dataset, that the combinations with the highest correlation are probably significant, although
a bigger sample is needed to confirm this, and should be the first to be explored in a larger
analysis.
Research Question 5 – Important to IT Organization Success
What do CIOs believe is important for the success of the centralized information technology organization?
The components of question 14 on the CIO survey (Appendix A) were averaged
across all CIO responders to get a single score for each sub question. These questions were
then sorted by mean. Data is reported for all participating institutions and then additionally
for research institutions (DRU, RU/H, RU/VH) only.
Reliability, satisfaction, communication, support, and responsiveness were perceived
to be most important to the success of the centralized IT organization. Budget management
and innovation were perceived to be least important. Means with and without non-research
universities varied only slightly and are highlighted below in bold (Table 31).
135

Table 31: CIO Perceptions of Centralized IT Organization Success Factors How important are the following to the success of the IT organization?
Mean All Institutions
Mean Research Institutions Only
Reliability of technology services 4.6 4.5End user satisfaction 4.6 4.6Proactive communication 4.5 4.5End user support 4.5 4.5Responsiveness of the technology organization 4.5 4.5Effective communication 4.5 4.4High-performance IT employee teams (employees are respected, well trained, and valued)
4.4 4.4
Technology alignment with campus goals 4.4 4.3Technology alignment with campus priorities 4.3 4.3End user enablement (IT allows users to accomplish their goals)
4.2 4.3
IT fiscal responsibility 4.1 4.1Campus involvement in technology decisions 4.0 4.0IT budget management 3.9 3.9Innovation 3.6 3.6 Research Question 6 – User Satisfaction Perceptions
Do CIOs have an accurate understanding of how satisfied their campus users are? Do centralized information technology employees?
Data from the eleven institutions with responses from both campus users and the
centralized IT department was used to answer this question. First, the scores for each set of
questions in each of the areas of interest (Table 32) were averaged for each person
responding to get an average score per respondent for each of the areas. Second, an
institutional score for each area was created by averaging the per-person scores within each
institution. Finally, the area scores for each institution were averaged to get a single mean
score in each area across all institutions (Table 32). Results by institution are listed in
Appendix P.
136

In most categories (enablement, support, reliability, responsiveness, academic
alignment, and innovation) users at these institutions are more satisfied than CIOs and IT
employees perceive them to be. Perceived satisfaction with shared governance and fiscal
responsibility was slightly higher than actual satisfaction and perceived satisfaction with
communication was higher than actual satisfaction. Actual overall satisfaction was slightly
above perceived overall satisfaction. Interestingly, however, both the CIO and IT department
believe that the centralized IT organization is more effective than campus users do with CIOs
rating their organizations almost a point higher in effectiveness than campus users do. CIOs
and IT employees also believe the centralized IT organization is doing an outstanding job
more than campus users do. Finally, CIOs and IT employees believe the centralized IT
organization does a better job than other centralized campus units but campus users are a
little bit less likely to believe this.
137

Table 32: CIO and IT Perception of Campus User Satisfaction CIO
Perception (CIO Survey)
Centralized IT Perception (Campus Survey)
Actual Campus User Satisfaction (Campus Survey)
Enablement
Q16_3 Q108_3 Q11 4.27 4.25 4.48
Support
Q16_2 Q108_2 Q13 4.27 4.36 4.50
Reliability
Q16_4 Q108_4 Q15 4.45 4.34 4.76
Responsiveness
Q16_5 Q108_5 Q17 4.18 4.17 4.38
Shared Governance
Q16_6 Q108_6 Q19 3.82 3.98 3.82
Academic Alignment
Q16_7&8 Q108_7&8 Q210 4.27 4.16 4.52
Fiscal Responsibility
Q16_9&10 Q108_9&10 Q23 4.41 4.11 4.34
Communication
Q16_11&12 Q108_11&12 Q25 4.20 3.90 3.83
Innovation
Q16_13 Q108_13 Q27 4.20 4.07 4.22
Overall satisfaction IT organization is high
Q29 Q114 Q34 4.30 4.22 4.33
138

CIO Belief
IT Employee Belief User Belief
Believe the centralized IT organization is effective
Q27 Q110 Q31 5.40 4.64 4.51
Believe the centralized IT organization is doing an outstanding job
Q28 Q111 Q33 4.50 4.34 4.21
Believe centralized IT organization does a better job than does other centralized campus units (i.e. finance and human resources)
Q30 Q115 Q40 4.60 4.52 4.13 Research Question 7 – Elements Tied to Success
Do centralized information technology employees believe the elements tied to their success are the same as those tied to the centralized technology organization’s success?
Data from the twelve institutions with responses from centralized information
technology department staff (202 respondents) was used to answer this question. A table of
means for each of the questions of interest (questions 104 and 106 Appendix B) was created
below (Table 33). The difference between the two means was calculated.
Centralized information technology employees at these institutions believe that some
of the elements tied to their success are almost equally tied to that of the IT organization
(satisfaction, support, enablement, reliability, responsiveness, communication, high-
performance teams) while others are less tied to their success (campus involvement in
technology decisions, alignment with goals and priorities, budget management and fiscal
139

responsibility, and innovation) (Table 33). Differences between overall responses and
research university responses alone were small and are noted below in Table 34.
Table 33: Centralized IT Employee Success Perceptions Important to
Employee (“My”) Success
Important to Technology Organization’s Success
Difference
End User Satisfaction 4.59 4.57 0.02End User Support 4.45 4.47 -0.02End User Enablement 4.44 4.42 0.02Reliability of Technology Services
4.58 4.67 -0.09
Responsiveness of the Technology Organization
4.38 4.41 -0.03
Campus Involvement in Technology Decisions
3.80 4.01 -0.21
Technology Alignment with Campus Goals
4.16 4.31 -0.15
Technology Alignment with Campus Priorities
4.15 4.30 -0.14
IT Budget Management 4.00 4.34 -0.34IT Fiscal Responsibility 4.07 4.31 -0.24Proactive Communication
4.32 4.33 -0.01
Effective Communication
4.48 4.42 0.05
Innovation 3.94 4.04 -0.10High-Performance IT Teams
4.17 4.18 -0.01
140

Table 34: Centralized IT Employee Success Perceptions (Research Universities Only) Important to
Employee (“My”) Success
Important to Technology Organization’s Success
Difference
End User Satisfaction 4.58 4.55 0.03End User Support 4.45 4.45 -0.01End User Enablement 4.45 4.41 0.04Reliability of Technology Services
4.57 4.65 -0.07
Responsiveness of the Technology Organization
4.36 4.40 -0.04
Campus Involvement in Technology Decisions
3.84 4.03 -0.18
Technology Alignment with Campus Goals
4.16 4.31 -0.16
Technology Alignment with Campus Priorities
4.15 4.29 -0.14
IT Budget Management 4.01 4.34 -0.33IT Fiscal Responsibility 4.08 4.32 -0.24Proactive Communication
4.32 4.32 0.01
Effective Communication
4.48 4.41 0.07
Innovation 3.95 4.04 -0.09High-Performance IT Teams
4.18 4.19 -0.01
Research Question 8 – Performance Reviews
Do CIOs have a clear understanding of what metrics will be used to evaluate their performance? Which elements do CIOs believe are most heavily factored into their performance reviews? Do CIOs believe that those conducting their performance reviews have adequate guidelines and information to carry out meaningful evaluations? Results for each of these research questions are presented here. Do CIOs have a clear understanding of what metrics will be used to evaluate their performance?
141

Responses were counted for question 18 on the CIO survey (Appendix A). The
percentage of each response type was then calculated. Fifty-nine percent of CIOs responded
yes, they have a clear understanding of what metrics will be used to evaluate their
performance, twenty-six percent responded no, and fifteen percent responded somewhat.
Which elements do CIOs believe are most heavily factored into their performance reviews?
The components of question 21 on the CIO survey (Appendix A) were averaged
across all CIO responders to get a single score for each sub question. These questions were
then sorted by mean.
CIOs believe satisfaction, reliability, and responsiveness are most heavily factored
into their performance reviews. Innovation, campus involvement in technology decisions,
and high-performance teams were believed to be least heavily factored into CIO performance
reviews (Table 35).
Table 35: Elements CIOs Believe are Most Heavily Factored into their Performance Reviews
End User Satisfaction 4.37Reliability of Technology Services 4.37Responsiveness of the Technology Organization 4.19IT Fiscal Responsibility 4.08IT Budget Management 4.00Technology Alignment with Campus Priorities 3.89Technology Alignment with Campus Goals 3.78End User Support 3.74Effective Communication 3.69End User Enablement 3.67Proactive Communication 3.65High-Performance IT Teams 3.58Campus Involvement in Technology Decisions 3.41Innovation 3.22
142

143
Do CIOs believe that those conducting their performance reviews have adequate guidelines and information to carry out meaningful evaluations?
Responses were counted for Questions 19 and 20 on the CIO survey (Appendix A).
The percentage of each response type was then calculated. Seventy-four percent of CIOs
responded yes, they believe that those conducting their performance reviews have adequate
guidelines and information to carry out meaningful evaluations, nineteen percent responded
no, and seven percent responded somewhat.
Research Question 9 – Central IT Organization Importance How important do users believe the centralized information technology department is to their success and that of their institution?
Data from the components of question 29 on the Campus Technology Survey
(Appendix B) were averaged by responder type (faculty, students, non-centralized IT staff,
and non-IT staff) to get a single score for each sub question. Respondents all agree that
technology is important to both their success and even more so to that of their institution.
Table 36: Importance of the Centralized IT Department
Number Responding
To Institution’s Success
To My Success Difference
Faculty 500 5.57 5.12 0.45
Students 1305 5.40 5.03 0.37
Non-Centralized
IT Staff
177 5.54 5.01 0.53
Non-IT Staff 1111 5.70 5.30 0.40

DISCUSSION
Research Question 1 – Factors Associated with User Satisfaction
Which factors are most associated with user satisfaction with the centralized technology organization (Table 1)? Which factors are most associated with satisfaction with the CIO?
All factors were found to be correlated with centralized IT organization and CIO
satisfaction. Most were highly correlated (Tables 18 & 20). Overall, academic alignment,
fiscal responsibility, communication, innovation, and support appear most often (six, six,
five, four, and four times respectively) as one of the top associated across all respondents.
The importance of IT, reliability, shared governance, and responsiveness appear most often
(eight, five, five, and four times respectively) as one of the bottom associated across all
respondents.
This first research question examined what factors correlated with overall user
satisfaction, which is used to evaluate IT success in higher education (Griffiths, 2003).
Although further study is required across a larger dataset, this study provides CIOs with
baseline information regarding areas in which to focus effort in order to improve user
satisfaction. IT leaders can use this information to begin to structure services, develop
communication strategies, determine committee goals, design evaluation metrics, and create
employee job descriptions, reviews, and incentives with the goal of improving the factors
above that correlate most with improved user satisfaction. In order to be most effective, it is
important that IT leaders create an iterative process where changes that are implemented are

evaluated to determine their impact. In the event that new initiatives do not bring about the
desired result, it is important to determine if the lack of result was due to implementation
issues before determining the failure was due to a faulty strategy. Through an iterative
process, changes in implementation (and/or strategy if necessary) should continue to be made
and evaluated in order to improve user satisfaction thereby positively impacting CIO and IT
organization success.
Finally, it is interesting to note that across institutions in this study, decentralized IT
staff members were the least satisfied with centralized IT organization and CIO performance
(Table 28). This highlights an additional area in which the CIO and IT team should focus.
Satisfaction with this group, as noted earlier, correlated strongly with responsiveness,
communication, enablement, and academic alignment (IT organization) and responsiveness,
communication, shared governance, and fiscal responsibility (CIO) (Tables 18 and 20).
Special strategies should be developed for this group in order to serve their needs and
improve their satisfaction. Similarly, efforts should be made to raise campus awareness and
build understanding surrounding the centralized IT organization’s efforts to be fiscally
responsible, innovative, and align with the academic mission and goals. Additionally, its
governance structure should be well known. CIOs should also proatively communicate their
goals and achievements to raise visability of and understanding for their position. These are
all areas in which respondents were unsure of satisfaction.
Research Questions 2-4 – Organizational Quality and High-Performance
Are technology organizations with a higher straight average of performance in the nine areas used to define organizational quality (Table 2) viewed as performing better than those which do not?
145

Are technology organizations with a higher performance in certain combinations of the nine areas used to define organizational quality (Table 2) viewed as performing better than those which do not? Are current higher education technology leaders building high-performance organizations that value, respect, and develop their employees (Table 3)? Is there a correlation between the degree to which this is done and perceptions of CIO and technology organization performance? Are technology organizations with a higher performance in certain combinations of high-performance categories viewed as performing better than those which do not?
The results of this study are consistent with the hypothesis that CIOs who create high-
performance IT cultures and whose centralized IT organizations perform well in the nine
areas used to define organizational quality are viewed as having more successful IT
organizations and as being more successful CIOs. Since this sample size was very small
(only 11 institutions), there is not enough power to reasonably expect to reject a null
hypothesis of no association. Instead, what this study does is obtain and report an estimate of
that association and make an assessment as to whether that association may be large enough
for further exploration. If, in fact, the association in the population is the same size as that
found in this exploratory study, it is a small to moderate correlation and one worth further
exploration (Cohen, 1988). Hoyle illustrates that results that are far from significant in a
small study with a small to moderate associated effect size can have the same effect size in a
larger more significant study (1999). This, therefore, is an area for further research.
Means in organizational quality areas show that centralized IT employees scored their
organizations highest in accountability (5.13), capability (4.76), and direction (4.68). They
scored their organizations lowest in motivation (4.29), environment and values (4.25), and
coordination and control (3.71) which, therefore, may be areas for possible improvement.
146

Further, performance in combinations of the organizational quality areas such as
coordination and control, direction, motivation (IT organization satisfaction) and
coordination and control, direction, and external orientation (CIO satisfaction) correlate
highly with satisfaction and may be areas in which to focus new initiatives first. One IT
employee reports, “Although the need for greater collaboration among work groups has been
voiced time and time again, we still work in ‘silos’ with lack of across the board
communication and groups see themselves in competition with other units in the dept.” As
mentioned earlier, when deciding which areas in which to excel, it is important to make sure
they complement each other, fit within the department’s strategy, and do not disrupt an area
in which the organization already excels (Smet et al., 2007b).
High-performance categories most associated with IT satisfaction are staff
development, psychological safety and job security, and meaningful jobs. High-performance
categories most associated with CIO satisfaction are systems, procedures, and information
availability; psychological safety and job security; and meaningful jobs. According to one IT
employee, “Much of the work I do is thankless. If it goes well we continue another day and
little or nothing is ever noticed or valued. On the other hand if anything goes badly, it is
front page news.” Another said, “I feel fortunate that my peers, supervisors, and managers
place a lot of value on me as an individual.” Yet another answered, “Just once I would like to
have a sense that my supervisor and department have value for what I do.”
Once again, although further study is required across a larger dataset, this study
provides CIOs baseline information regarding areas in which they may want to consider
focusing effort in order to improve performance. CIOs can use this information to begin to
strategically improve the work environment for their employees, create a high-performance
147

culture, and thereby hopefully improve satisfaction. According to the results above, high-
performance areas of opportunity for improvement include rewarding team performance,
documenting procedures, improving systems, limiting status differences, investing in staff
development, providing employees needed information, and creating an open and trusting
environment. This aligns with the evidence-based management literature mentioned earlier
which states that where organizational leaders may have the most positive impact is in
improving organizational and group performance, valuing employees, and developing
systems that enable others to succeed (Pfeffer & Sutton, 2006h). The comments of several
IT employees note the need for improvement in these areas.
Because of a lack of funding and sufficient FTE to support the needed central IT initiatives, employees at this institution are responsible for far to many widgets, have no time/funds for training, are unable to devote time to gain deep knowledge of the software and hardware they are responsible for and frequently suffer from burn out and low moral. I enjoy my job, take what I do very seriously, and feel that I provide a very important support service. However, I do not feel particularly valued as an employee; this is not only because of my pay rate, but also because I feel that my professional development is not a priority …the past decade… in the name of efficiency, which is not realized, the employees have been turned into drones, numbers instead of people. This is tremendously sad, since people gravitate to the university workplace specifically because they want to help people, on a very personal level. They want to be valued on a personal level. Unfortunately, my own work environment has now become sterile, impersonal, corporate, and devoid of meaningful dialogue. This was not always true. My job environment was once so incredibly supportive, so incredibly collaborative that I told a colleague that I loved my job here at the university so much that, even if I won the lottery, I would still come to work that same week!
As stated earlier, employment security builds employee trust, improves cooperation,
encourages workers to take a longer term perspective, causes companies to pay more
attention to hiring, decreases costly premature layoffs, and encourages companies to invest in
training, share information, and delegate responsibilities. Using self-managed teams has
148

been shown to create “greater autonomy and discretion [among employees] which translates
into intrinsic rewards and job satisfaction. Teams out-perform traditionally supervised
groups” (Pfeffer, 1999a, p. 26). There is a relationship between salary paid and quality of
employee. Level of salary also sends a value message to staff. Pfeffer further states, “By
coupling employment security with some form of group-based incentive… the organization
unleashes the power of the team, whose economic interests are aligned with high levels of
economic performance” (Pfeffer, 1999a, p. 27). Training is tremendously important and is a
source of competitive advantage across industries. Reducing status differences
“symbolically, through the use of language and labels, physical space and dress and
substantively, in the reduction of the organization’s degree of wage inequality, particularly
across levels” helps build high-performance management systems where employees feel
valued (Pfeffer, 1999b, p. 56). Finally, information sharing conveys trust and allows people
to contribute to organizational success by providing them needed “information on important
dimensions of performance and, in addition, training on how to use and interpret that
information” (Pfeffer, 1999b, p. 57). Research points to a direct relationship between
management practices that value employees and put them first and organizational success
(Pfeffer & Veiga, 1999).
The findings of this study are consistent with the hypothesis that IT leaders can
benefit from creating a high-performance culture and improving performance in the
organizational quality areas mentioned above. Additionally, a potential CIO’s ability to build
a high-performance culture and develop systems should be one of the key decision making
criteria, in addition to experience and education, when selecting a CIO. His/her success in
doing so should similarly be a criterion used to evaluate performance.
149

As noted above, in order to be most effective, it is important that IT leaders create an
iterative process where changes that are implemented are evaluated to determine their
impact. In the event that new initiatives do not bring about the desired result, it is important
to determine if the lack of result was due to implementation issues before determining the
failure was due to a faulty strategy. Through an iterative process, changes in implementation
(and/or strategy if necessary) should continue to be made and evaluated in order to improve.
Research Question 5 – Important to IT Organization Success
What do CIOs believe is important for the success of the centralized information technology organization?
CIOs believe reliability, satisfaction, communication, support, and responsiveness are
most important to the success of the IT organization. One CIO noted,
A service-oriented culture that: 1. Responds in a timely manner 2. Engages in active listening 3. Proactively communicates change 4. Demonstrates competency of subject 5. Sets realistic and appropriate expectations 6. Establishes service goals and monitors metrics 7. Respects individuals while serving the whole 8. and is passionate for others’ success.
They responded that innovation, budget management, and campus involvement in technology
decisions are less important factors. High-performance IT teams, alignment, user
enablement, and fiscal responsibility fell in the middle. Many of these CIO importance
beliefs align with the factors found to be most highly correlated with user satisfaction with
the IT organization (Table 18). “I believe that user satisfaction is closely tied to
communications. It involves understanding what the users really want and then
communicating on how you are meeting those needs.”
150

Academic alignment, fiscal responsibility, and innovation were among the factors
most correlated with user satisfaction among all groups yet they were not rated as important
by CIOs and perhaps therefore are areas in which to focus effort in order to improve
satisfaction. Additionally, it can be argued that, in order for CIOs to excel in the areas most
correlated with IT organization satisfaction, high-performance IT teams are critical and
should be at the top rather than in the middle of this list. Possibly in agreement with that
sentiment, one CIO wrote, “People are the most important asset any IT organization can
possess. Working hard to eliminate or reduce unwanted turnover is a critical task for any
CIO.”
Research Question 6 – User Satisfaction Perceptions
Do CIOs have an accurate understanding of how satisfied their campus users are? Do centralized information technology employees?
In most categories (enablement, support, reliability, responsiveness, academic
alignment, and innovation) users are more satisfied than CIOs and IT employees perceive
them to be. Perceived satisfaction with shared governance and fiscal responsibility was
slightly higher than actual and perceived satisfaction with communication was higher than
actual. Actual overall satisfaction was slightly above perceived overall satisfaction.
Interestingly, however, both the CIO and IT department believe that the centralized IT
organization is more effective than campus users do with CIOs rating their organizations
almost a point higher in effectiveness than campus users do. CIOs and IT employees also
believe the centralized IT organization is doing an outstanding job more than campus users
151

do. Finally, CIOs and IT employees believe the centralized IT organization does a better job
than other centralized campus units but campus users are a little bit less likely to believe this.
One way a CIO might use this information is to proactively and strategically
communicate the centralized IT organization’s effectiveness and highlight achievements and
success stories. It also seems to indicate that, according to users, satisfaction and
effectiveness are two different measurements and therefore effectiveness may be a new
measure in addition to user satisfaction, reliability, and budget control that might be best
included in evaluating CIO and IT organization performance. This is an area for further
study.
Research Question 7 – Elements Tied to Success
Do centralized information technology employees believe the elements tied to their success are the same as those tied to the centralized technology organization’s success?
Centralized information technology employees believe that some of the elements tied
to their success are almost equally tied to that of the IT organization (satisfaction, support,
enablement, reliability, responsiveness, communication, high-performance teams) while
others are less tied to their success (campus involvement in technology decisions, alignment
with goals and priorities, budget management and fiscal responsibility, and innovation). This
list highlights areas where job descriptions, rewards, incentives, and responsibilities could be
written and implemented that draw a more direct connection between employee and
organizational success. Since many of the areas listed above are highly correlated with CIO
success, making the connection between employee success and organizational success in
152

these areas potentially benefits the CIO, IT employees, and the centralized technology
organization.
Research Question 8 – Performance Reviews
Do CIOs have a clear understanding of what metrics will be used to evaluate their performance? Which elements do CIOs believe are most heavily factored into their performance reviews? Do CIOs believe that those conducting their performance reviews have adequate guidelines and information to carry out meaningful evaluations? Results from this question were interesting. Seventy-four percent of CIOs believe
that those conducting their performance reviews have adequate guidelines and information to
carry out meaningful evaluations but only fifty-nine percent of CIOs responded that they
have a clear understanding of what metrics will be used to evaluate their performance. This
supports the fact that CIOs need to know how they will be evaluated and perhaps the best
way for them to know is to proactively suggest metrics. The CIO usually reports to non-
technical senior university executives who may not know how best to evaluate technology
organizations and leaders.
CIOs believe user satisfaction and reliability of services to be most heavily factored
into their performance reviews. This once again supports the need to study how users define
user satisfaction, which was examined above in research question one. Other factors heavily
factored in IT leader performance reviews were noted to be responsiveness, fiscal
responsibility, and budget management. Alignment, support, communication, and
enablement were perceived not to be factored as heavily and high-performance IT teams,
governance, and innovation were perceived to be the least factored into performance reviews.
This shows somewhat of a misalignment between what perhaps should be factored into
153

performance reviews and what is factored. Since IT success in higher education is usually
evaluated in terms of user satisfaction, technology reliability, and budget control (Griffiths,
2003) and user satisfaction is largely a component of enablement, support, communication,
reliability, fiscal responsibility, academic alignment, and innovation (Tables 18 and 20),
communication, enablement, support, innovation, and alignment should be a clear component
of a CIOs performance review. Additionally, according to the findings in research question
six above, effectiveness may be a new measure in addition to user satisfaction, reliability,
and budget control that might be best included in evaluating CIO and IT organization
performance. Finally, if the effect size found in question four above exists in the population
(an area for further study), CIO’s success in creating high-performance teams should be
toward the top rather than at the bottom of this list.
Research Question 9 – Central IT Organization Importance How important do users believe the centralized information technology department is to their success and that of their institution?
Across all groups, academic community members mostly or completely agree that an
effective centralized IT department is critical to the success of the institution and their
individual success. One respondent noted, “Not a single workday goes by where I don't use
the services provided by [centralized IT]. As [centralized IT] gets more effective, so do I.”
Another stated, “Dependable technology is essential to academic work.” All groups
responded that an effective centralized IT organization is slightly more critical to the
institution’s success than their own. As IT is a relative newcomer to the higher education
scene, it is interesting to note that users believe in its importance and that the need to educate
154

the campus community on its importance is perhaps not as critical as it once was. Now,
communication efforts must shift from importance to enablement, support, reliability, and
alignment to bring added value and begin to improve user satisfaction through effectiveness
advocacy.
L
imitations
One of the primary limitations of this exploratory study is that of sample size.
Although 282 doctoral institutions (DRU, RU/H, or RU/VH) were contacted, 22 participated
(six non DRU, RU/H, or RU/VH participated) and of those 22, only nine had full institution
participation (two non DRU, RU/H, or RU/VH). Recruiting additional participants was
challenging due to the number of requests CIOs receive for research participation. Further,
gathering institution-wide data for this study was difficult in that several CIOs that who
participated stated that they were unable to survey their entire institution for many reasons
including: lack of mechanism, rules prohibiting user surveys, restrictions requiring prior
approval for surveys (with a long lead time), limited number of permitted surveys per year,
or recently completed surveys making the CIO reluctant to survey users again. Several of
those that did send out institution-wide surveys had low response rates which is another study
limitation. Due to the number of participants, this is a good exploratory study but not one
that can be generalized to the entire higher education population without further research.
Furthermore, this first study looks at correlation not causation. Even if correlation is
confirmed across a larger study, further research must then build upon this early work to find
causal relationships.
The CIO role is a difficult one for reasons both within and beyond the CIO’s control.
The environment is ever changing. Not all factors that impact an IT organization are within
155

the CIO
f
n
bility
ver, that
despite
's control. Although not all factors that impact an IT organization are within his/her
control, this research aims to provide concrete areas in which CIOs may focus efforts to
impact those that are and mitigate against those that are not. All IT organizations function in
a complex and complicated environment and must respond to events outside the control o
the CIO. The purpose of this study is to determine if high-performance IT teams and those
IT organizations that excel in the organizational quality factors mentioned above are better
able to succeed in this type of environment. To this end, the CIOs at each institution were
asked if there have been any recent events that they believe might impact user satisfaction o
a large scale either positively or negatively. Ten CIOs responded no, twelve responded yes
(a positive impact) and seven responded yes (a negative impact). CIOs were able to respond
in more than one category. Recent events that CIOs believe would positively impact users
included: ERP implementations, new lower cost departmental service agreements, classroom
technology renovations, Voice over Internet Protocol (VoIP) implementations, new
application deployments, enhanced communication and alert system implementations, and
new high-performance computing initiatives. Recent events that CIOs believe would
negatively impact user satisfaction were a Web site data breach, a campus portal software
bug, an ERP implementation, delays in application implementation, infrastructure relia
issues, a VoIP failure, and a data center unavailable temporarily due to weather.
A limitation of this study is that it cannot account how much or little impact these
occurrences influenced current user satisfaction. Several of the CIOs noted, howe
these problems, their organizations responded quickly and in some cases the CIOs
believed the setback helped them overall. “This turned into a good event because it
156

highlighted all the problems I mentioned in a report about disaster recovery. My solu
unfunded before the generator failure and funded afterwards.”
As stated above all CIOs operate in a complex and com
tion was
plicated environment and will
have bo
s
ationalize many of the
variabl
cademic environment. • The centralized IT organization’s priorities seem to be aligned with the institution’s
he respondent may answer each differently but the scores together comprise the factor’s
r
th successes and failures. Outside of a major catastrophe, it can be argued that over
time these occurrences effect most organizations and therefore do not pose a major study
limitation but one worth noting. Arguably, those with the best performing IT teams may
have less frequent problematic occurrences and/or be able to respond to and recover more
quickly from negative events. If true, this would support the hypothesis that high-
performance cultures and organizations that excel in the organization quality factor
positively impact user satisfaction. This is an area for further study.
Since this is an experimental design and a first attempt to oper
es used in this study, it is the author’s point of view that for the purposes of this study,
each factor’s components specifically defined the factor and, therefore, comprise a definition
index rather than a scale. The components are not necessarily trying to measure the same
thing but together comprise the factor’s score. For example, in this study academic
alignment is being defined by the following statements:
• The centralized IT organization understands the a
priorities. • The centralized IT organization’s priorities seem to be aligned with the institution’s
purpose. • The centralized IT organization’s priorities seem to be aligned with my priorities.
T
score in this study. The statements do not necessarily have to be correlated with each othe
157

158
but together define the variable being examined. Appendix K provides internal consistency
information using Cronbach’s Alpha for informational purposes and further research.
Based on this internal consistency analysis, some of these operationalizations (e.g., the
Capability and External Orientation categories of Organizational Quality) were found to be
less reliable than others. In most cases, these variables included combinations of questions
about personal attributes and parallel attributes of the other staff in the centralized IT
organization. For example, the External Orientation category in Organizational Quality
included the following items:
• I have consistent two-way communication with campus users to ensure their satisfaction.
• I believe people throughout the centralized IT organization have consistent two-way communication with campus users to ensure their satisfaction.
It can be argued that these constructs should be treated as a scale rather than an index and
therefore reliability would be important. Based on the analysis of the internal consistency, if
one took this viewpoint, future research will need to develop additional/different items to
more validly measure these constructs or split these constructs in some fashion.
Other limitations of this study include the general weaknesses associated with survey
research. Survey research does not usually capture situational context and behavior as would
direct observation. In general, surveys are also not flexible in allowing tailored questions
based on previous responses. Surveys are also subject to the problem of artificiality. They
only collect self-reports of recalled or hypothetical actions and emotions (Babbie, 2004).
Further, those who are less technologically savvy may not have participated in this study due
to the online survey format and email participation request.

CONCLUSIONS AND FURTHER STUDY
The chief information officer in higher education holds an extremely visible and
complex position comprised of numerous roles and requiring a diverse set of skills, abilities,
attributes, and knowledge. The person with this title has a tremendous amount of
responsibility and serves many constituencies.
In reviewing the literature over 30 constituencies, over 50 roles, and almost 50 skills,
abilities, attributes, and knowledge requirements were identified as being necessary for a
successful CIO. In addition, chief information officers are working in rapidly changing
environments with tremendous funding constraints, unique organizational cultures, differing
administrative structures, increased privacy and security concerns, greater functional
requirements, changing political climates, high expectations, intellectual property conflicts,
inadequate IT management approaches, aging systems, increasing accountability, expensive
initiatives, complex governance and decision making structures, increasing strategic
responsibility, and changing institutional priorities (Moberg et al., 2000; Brooks, 2003;
Hawkins, 2004; Clark, 2005; Hogue & Dodd, 2006; Lineman, 2007). Despite these
challenges, colleges and universities “need to ensure effective IT leadership at the highest
levels” (Katz et al., 2004, p. 6). Available literature about the CIO position is almost entirely
based on expert opinion or the experiences of past CIOs and although these insights and
experiences are extremely valuable, quantitative research studies are needed to validate,
expand, and revise current success recommendations.

A 2003 study found that IT success in higher education was usually evaluated in
terms of user satisfaction, technology reliability, and budget control (Griffiths, 2003).
Although technology reliability and budget control are somewhat easily quantifiable for
evaluation, user satisfaction is more difficult. Since user satisfaction has been determined to
be a critical component in evaluating IT success, it is important to determine how a CIO
should focus effort to succeed in satisfying users. A framework is needed to determine what
makes a CIO successful for those in the position looking to improve and for those in the
process of selecting their next technology leader (Hawkins, 2004). This study began the
research necessary to develop such a framework.
Evidence-based management literature was consulted as a starting point from which
to begin this study and the process of developing a framework for successful CIOs. In
reviewing the evidence-based management literature, one of perhaps the most surprising
findings was that although leadership matters, leaders do not have a “massive influence” over
organizational performance (Pfeffer & Sutton, 2006h, p. 194). In fact, “their actions rarely
explain more than 10 percent of the differences in performance between the best and the
worst organizations and teams” (Pfeffer & Sutton, 2006h, p. 192). The literature notes that
where organizational leaders may have the most positive impact is in improving
organizational and group performance, valuing employees, and developing systems that
enable others to succeed (Pfeffer & Sutton, 2006h). To this end, Pfeffer notes that “the best
way to encourage performance is to build a high-performance culture. We know the
components of such a system, and we ought to pay attention to this research and implement
its findings” (2007a, p. 3). Therefore, this study focused on the technology environment the
160

CIO creates among his/her staff and how that impacts CIO performance in terms of user
satisfaction. The study employed an evidence-based management approach to examine if
superior performance in the nine areas used to define organizational quality (Table 2) and/or
the development of a high-performance culture correlate with improved perceptions of chief
information officer and technology organization performance in higher education.
Although additional research across a larger dataset is needed before the findings of
this study can be generalized to the entire higher education population, the results of this
exploratory study are consistent with the hypothesis that CIOs who create high-performance
IT cultures and whose centralized IT organizations perform well in the nine areas used to
define organizational quality are viewed as having more successful IT organizations and as
being more successful CIOs. This study also makes many additional contributions to the
field which are useful to current chief information officers, future CIOs, those evaluating
CIOs, and those hiring chief information officers. These will be reviewed next.
Findings of Interest to Current CIOs
There are many findings of interest from this study for current CIOs. First, the study
identified which factors are most associated with user satisfaction with the IT organization
(academic alignment, support, enablement, fiscal responsibility, and reliability) and with the
CIO (communication, fiscal responsibility, innovation, and academic alignment). This
provides CIOs baseline information regarding areas in which to begin to focus efforts by
structuring services, developing communication strategies, determining committee goals,
designing evaluation metrics, and/or creating employee job descriptions, reviews, and
161

incentives with the goal of improving performance in the factors above that correlate most
with improved user satisfaction.
Second, it identified high-performance areas of opportunity for improvement
(rewarding team performance, documenting procedures, improving systems, limiting status
differences, investing in staff development, providing employees needed information, and
creating an open and trusting environment) and organizational quality areas of opportunity
for improvement (motivation, environment and values, and coordination and control). CIOs
can use this information to begin to strategically improve the work environment for their
employees, create a high-performance culture, and thereby potentially improve satisfaction.
Once again, this is an exploratory study and therefore in order to be most effective in
implementing its findings, it is important that when deciding areas in which to focus
improvement efforts, one selects areas that complement each other, fit within the
organization’s strategy, and do not disrupt an area in which the department already excels
(Smet et al., 2007). Although this early research indicates that improvement in any of the
organizational quality or high-performance areas should help the IT organization, IT leaders
should create an iterative process where changes that are implemented are evaluated to
determine their impact.
In the event that new initiatives do not bring about the desired result, it is important to
determine if the lack of result was due to implementation issues before determining the
failure was due to a faulty strategy.
What actually provides competitive success and what is difficult to copy is not so much knowing what to do – deciding on the right strategy – but the ability to do it. That is why Richard Bank, has repeatedly argued that organizational culture and the ability to operate effectively – successful implementation – is much more important to organizational success than having the right strategy (Pfeffer & Sutton, 2006h, p.145).
162

Therefore, when problems arise, it is important not to confuse improper strategy with
ineffective execution. The CIO should not reject or reconsider a strategy decision that is not
working without first looking at implementation complications as the cause of failure. “This
problem of confusing strategy problems with implementation problems seems particularly
common in service industries” (Pfeffer & Sutton, 2006h, p.152). CIOs may also have
additional obstacles, such as budget and/or political constraints, which may have to be
overcome to successfully implement new initiatives.
Third, the study identified what CIOs believe is most important for the success of the
centralized information technology organization (reliability, satisfaction, communication,
support, and responsiveness). They responded that innovation, budget management, and
campus involvement in technology decisions are less important factors. High-performance
IT teams, alignment, user enablement, and fiscal responsibility fell in the middle. Academic
alignment, fiscal responsibility and innovation were among the factors most correlated with
user satisfaction among all groups yet they were not rated as important by CIOs and perhaps
therefore are areas in which to focus effort in order to improve satisfaction. Additionally, it
can be argued that, in order for CIOs to excel in the areas most correlated with IT
organization satisfaction, high-performance IT teams are critical and should be at the top
rather than in the middle of this list.
Fourth, overall this study found that users were more satisfied with the IT
organization’s performance than the CIO or centralized IT staff believed them to be.
Interestingly, however, users perceived the IT organization to be less effective than CIO and
centralized IT staff perceptions and users are less likely to believe the IT organization is
doing an outstanding job. This seems to indicate that user satisfaction and effectiveness are
163

two distinct measurements and therefore effectiveness may be a new measure outside of user
satisfaction, reliability, and budget control CIOs should evaluate to improve performance.
This is an area for further study.
Fifth, although information technology employees believe that some of the elements
tied to their success are approximately equally tied to that of the IT organization (satisfaction,
support, enablement, reliability, responsiveness, communication, and high-performance
teams), those they believe are often less tied to their success (campus involvement in
technology decisions, alignment with goals and priorities, budget management and fiscal
responsibility, and innovation) are often highly correlated with overall CIO and IT
satisfaction. CIOs, therefore, may want to begin to directly tie employee job descriptions,
rewards, incentives, and responsibilities to these areas.
Sixth, study results indicate that only fifty-nine percent of CIOs responded that they
have a clear understanding of what metrics will be used to evaluate their performance. The
CIO often reports to non-technical senior university executives who may not know how best
to evaluate technology organizations and leaders. CIOs can use the results from this study to
proactively identify evaluation metrics and work with senior executives to develop an
assessment framework. Since IT success in higher education is usually evaluated in terms of
user satisfaction, technology reliability, and budget control (Griffiths, 2003) and user
satisfaction is largely a component of enablement, support, communication, reliability, fiscal
responsibility, academic alignment, and innovation (Tables 14 and 16), communication,
enablement, support, innovation, and alignment should be a clear component of a CIOs
performance review. Additionally, according to the findings in research question six above,
effectiveness may be a new measure in addition to user satisfaction, reliability, and budget
164
control that might be best included in evaluating CIO and IT organization performance.
Finally, if the effect size found in question four above exists in the population (an area for
further study), CIO’s success in creating high-performance teams should be toward the top
rather than at the bottom of this list.
Seventh, decentralized IT staff members were the least satisfied with centralized IT
organization and CIO performance (Table 28). This highlights an additional area in which
the CIO and IT team should focus. Satisfaction with this group, as noted earlier, correlated
strongly with responsiveness, communication, enablement, and academic alignment (IT
organization) and responsiveness, communication, shared governance, and fiscal
responsibility (CIO) (Tables 18 and 20). Special strategies should be developed for this
group in order to serve their needs and improve their satisfaction.
Eighth, efforts should be made to raise campus awareness and build understanding
surrounding the centralized IT organization’s efforts to be fiscally responsible, innovative,
and align with the academic mission and goals. Additionally, IT’s governance structure
should be well known and communicated regularly. CIOs should also proatively
communicate their goals and achievements to raise visability of and understanding for their
position. These are all areas in which respondents were unsure of satisfaction.
Finally, users mostly or completely agreed that an effective centralized IT department
is critical to the success of the institution and their individual success. Not too long ago,
higher education operated with much less reliance on technology so substantial progress in
user acceptance and reliance has been made. This indicates that communication efforts
should shift from importance to enablement, support, reliability, alignment, effectiveness,
and fiscal responsibility, for examples, to highlight technology’s added value.
165

Findings of Interest to Future CIOs
There are several findings of interest in this study for future CIOs. First, this study
provides an extremely comprehensive overview of the position based on all recent relevant
literature. When preparing to become a CIO, a future CIO can evaluate his/her strengths and
weaknesses in terms of the roles, skills, abilities, attributes, and knowledge requirements
found above. S/he can use this information to put together a professional development plan
and seek out opportunities to improve skills and increase knowledge in areas of inexperience.
Second, since CIOs are evaluated in terms of user satisfaction, technology reliability,
and budget control (Griffiths, 2003), a potential CIO must have experience in these areas and
know how to be successful in each. This study found that effectiveness may also be an area
to look at when evaluating CIOs, therefore, potential CIOs should have experience evaluating
the effectiveness of their initiatives.
Third, according to evidence-based management literature, although leadership
matters, a leader’s actions “rarely explain more than 10 percent of the differences in
performance between the best and the worst organizations and teams” and leaders may have
the most positive impact by improving organizational and group performance, valuing
employees, and developing systems that enable others to succeed (Pfeffer & Sutton, 2006h,
pp. 192 - 200). Future CIOs can begin to hone these skills so that they are prepared to lead in
a way that facilitates the success of others. Knowing the components of a high-performance
culture as described above and creating such an environment is a critical skill needed for a
CIO.
Finally, this study is extremely beneficial for those interviewing for CIO positions.
By familiarizing themselves with the CIO position and acquiring the proper experience, CIO
166

candidates can communicate an understanding of the role and use concrete examples to
highlight their abilities and preparation. Candidates should use the role, skill, ability,
attribute, and knowledge requirement information above to ask questions to accurately
understand the role envisioned for the CIO at a particular institution before accepting a
position offer. Although many roles, skills, abilities, attributes, and knowledge requirements
were identified for the position, a potential CIO should identify which are most important for
the particular institution where they are interviewing and on what basis CIOs success will be
evaluated. This information is crucial to negotiating terms of employment and knowing if
the job expectations are reasonable and success in the position attainable.
Findings of Interest to Those Evaluating CIOs There are several findings of interest in this study for those evaluating CIOs. Study
results indicate that only fifty-nine percent of CIOs responded that they have a clear
understanding of what metrics will be used to evaluate their performance. CIOs must know
how they will be evaluated.
The data from this study can be used to identify evaluation metrics. CIOs and
executive leadership should work together to develop an assessment framework. Since IT
success in higher education is usually evaluated in terms of user satisfaction, technology
reliability, and budget control (Griffiths, 2003) and user satisfaction is largely a component
of enablement, support, communication, reliability, fiscal responsibility, academic alignment,
and innovation (Tables 18 and 20), communication, enablement, support, innovation, and
alignment should be a clear component of a CIO’s performance review. Additionally,
according to the findings in research question six above, effectiveness may be a new measure
in addition to user satisfaction, reliability, and budget control that might be best included in
167

evaluating CIO and IT organization performance. Further, the CIO and executive leadership
should review the roles, skills, abilities, attributes, and knowledge requirements that were
identified for the CIO position and choose which are most important for their institution and
then weave those into their CIO’s performance review. Finally, if the effect size found in
questions two and four above exist in the population (an area for further study), CIOs
performance in the nine areas used to define organizational quality their success at creating
high-performance teams should be a key components of their evaluations.
Findings of Interest to Those Hiring CIOs
In addition to education and experience, data from this study can be used to
specifically identify hiring criteria used for selecting an institution’s CIO. Since IT success
in higher education is usually evaluated in terms of user satisfaction, technology reliability,
and budget control (Griffiths, 2003) and user satisfaction is largely a component of
enablement, support, communication, reliability, fiscal responsibility, academic alignment,
and innovation (Tables 18 and 20), a candidate’s ability to communicate, enable others to
succeed, support users, encourage innovation, and achieve academic alignment should be a
criteria used to hire a CIO.
Additionally, according to the findings in research question six above, an applicant’s
ability to evaluate IT’s effectiveness may be a new criterion to include when deciding which
candidate to hire for the position. Further, the hiring committee should review the roles,
skills, abilities, attributes, and knowledge requirements that were identified for the CIO
position above and choose which are most important (and which are not as important) for
their institution. These should be used to screen applicant abilities and let candidates know
the responsibilities and expectations of the CIO role at their particular institution.
168

Finally, if the effect size found in questions two and four above exist in the
population (an area for further study), a CIO’s ability to create organization that performs
well in the nine areas used to define organizational quality as well as their ability to create
high-performance teams should be a key components of the hiring criteria.
A Framework for CIO Success – A Beginning
As mentioned above, a framework is needed to determine what makes a CIO
successful for those in the position looking to improve and for those in the process of
selecting their next technology leader (Hawkins, 2004). This study began the research
necessary to develop such a framework.
Several findings from this initial exploratory study can be used to begin to develop
this framework. First, in addition to user satisfaction, technology reliability, and budget
control (Griffiths, 2003), effectiveness may be a new criterion to use when evaluating chief
information officer performance. Second, an initial set of user satisfaction factors were
identified and correlations between each and overall user satisfaction was determined. Third,
organizational quality factors were defined and a correlation determined between an
organization’s organizational quality score and overall satisfaction with the CIO and IT
department. Fourth, high-performance categories were defined and a correlation determined
between an organization’s high-performance score and overall satisfaction with the CIO and
IT department.
As stated above, information technology user satisfaction, which was shown to differ
between universities, is an outcome that must be the function of something. In this study, it
was defined as a function of the IT organization’s performance, the CIO’s performance, other
intervening variables, and subject score (which accounts for error).
169
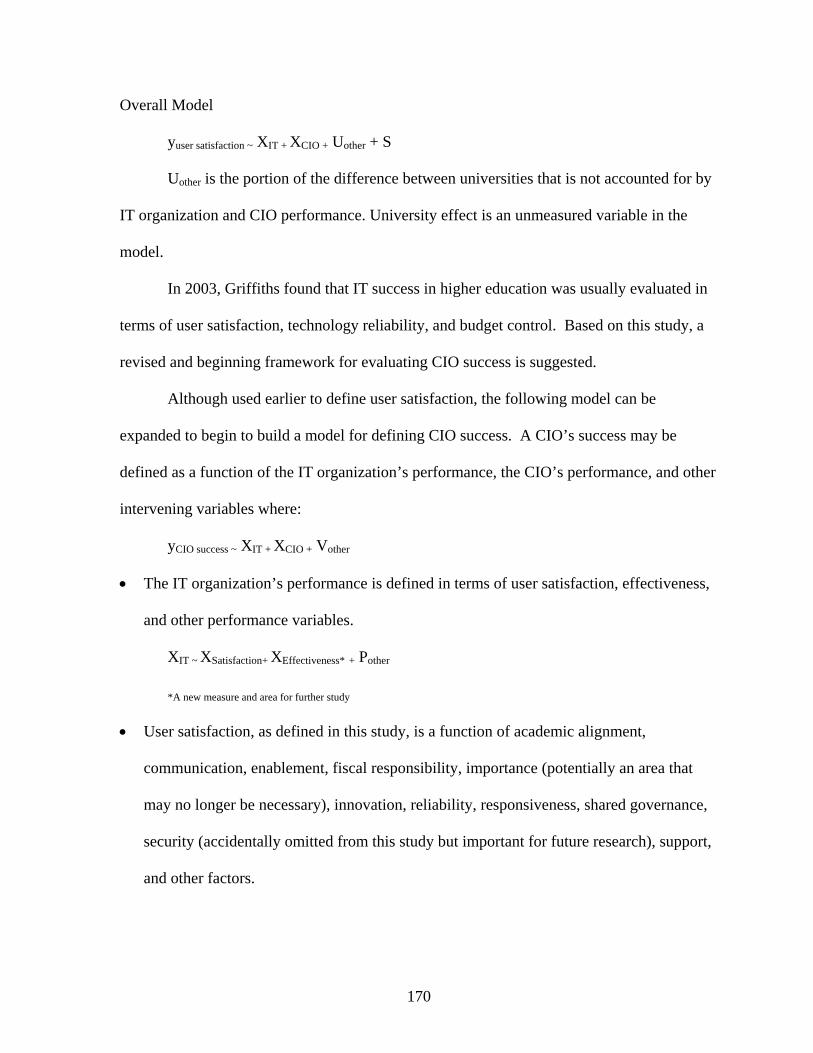
Overall Model
yuser satisfaction ~ XIT + XCIO + Uother + S
Uother is the portion of the difference between universities that is not accounted for by
IT organization and CIO performance. University effect is an unmeasured variable in the
model.
In 2003, Griffiths found that IT success in higher education was usually evaluated in
terms of user satisfaction, technology reliability, and budget control. Based on this study, a
revised and beginning framework for evaluating CIO success is suggested.
Although used earlier to define user satisfaction, the following model can be
expanded to begin to build a model for defining CIO success. A CIO’s success may be
defined as a function of the IT organization’s performance, the CIO’s performance, and other
intervening variables where:
yCIO success ~ XIT + XCIO + Vother
• The IT organization’s performance is defined in terms of user satisfaction, effectiveness,
and other performance variables.
XIT ~ XSatisfaction+ XEffectiveness* + Pother
*A new measure and area for further study
• User satisfaction, as defined in this study, is a function of academic alignment,
communication, enablement, fiscal responsibility, importance (potentially an area that
may no longer be necessary), innovation, reliability, responsiveness, shared governance,
security (accidentally omitted from this study but important for future research), support,
and other factors.
170

XSatisfaction ~ XAcademicAlignment + XCommunication+ XEnablement+ XFiscalResponsibility + XImportance**+
XInnovation+ XReliability + XResonsiveness + XSharedGovernance + XSecurity*** + XSupport + Fother
**Importance may no longer be necessary
***An accidental omission from this study but one that should be included in further research
• The CIO’s performance is a function of the centralized IT department’s organizational
quality score, the centralized IT department’s high-performance score, institution specific
CIO success metrics (selected, as suggested above, from the overall list of roles, skills,
abilities, attributes, and knowledge requirements by the CIO and executive leaders based
on individual institutional need), and other CIO performance variables.
XCIO~ XOrgQual + XHigh-Perf + XInstitutionSpecific + Cother
This leads to the following overall beginning framework for CIO success:
yCIO success ~ XAcademicAlignment + XCommunication + XEnablement + XFiscalResponsibility + XImportance + XInnovation + XReliability + XResponsiveness + XSharedGovernance + XSecurity +
XSupport + Fother + XEffectiveness + Pother + XOrgQual + XHigh-Perf + XInstitutionSpecific + Cother + Vother
The weights and relative importance of each item in the model are areas for further study.
Results from this study are consistent with evidence-based management literature
which states that where organizational leaders may have the most positive impact is in
improving organizational and group performance, valuing employees, and developing
systems that enable others to succeed (Pfeffer & Sutton, 2006h). Due to the number of
participants, this is a good exploratory study but not one that can be generalized to the entire
higher education population without further research. It is, however, a start.
171

Conclusion
Too often, despite scientific evidence, organizations continue to use ineffective
management practices. To address this issue, those who practice evidence-based
management use academic research to inform organizational business decisions. Doing so
effectively requires that managers identify good evidence, examine logic, conduct
experiments, learn from failures, and embrace an attitude of wisdom (Pfeffer & Sutton,
2006a; Pfeffer & Sutton, 2006g; Pfeffer & Sutton, 2006h; Rousseau, 2006; Rousseau, 2007).
Evidence-based management literature indicates that leaders have less influence than
many assume. Studies show that where leaders can be most effective is in building high-
performance organizations that value, respect, and develop their employees. Creating
environments that promote learning, building quality systems, developing community,
downplaying status differences, rewarding group performance, creating a trusting
environment, delegating decision authority, and helping others to succeed have been shown
to be ways in which a leader can positively impact his or her organization (Pfeffer & Sutton,
2006g; Pfeffer & Sutton, 2006h; Pfeffer & Sutton, 2007a).
Technology alone does not create competitive advantage; people do. As technology
continues to commoditize, its return on investment depends largely on people and processes
(Hill, 2007). Therefore, “the successful CIO must assemble the right people with the right
technical and soft skills” (Meester, 2004, p.119). Evidence-based management research
points to a direct relationship between management practices that value employees and put
them first and organizational success (Pfeffer & Veiga, 1999; Pfeffer & Sutton, 2006h).
A CIO’s success, therefore, lies in his/her organization’s success at facilitating the
achievement of others. As the organization’s leader, even if one found a superhero to be the
172

CIO (someone with every ability on the literature review list identified earlier), unless that
person can cultivate those abilities in his/her staff, s/he will not succeed. The literature and
this study support that the CIO must set the agenda, manage, and lead his/her organization in
such a way that allows its members to succeed in facilitating the achievement of others.
Leaders often have the most positive impact when they help build systems where the actions of a few powerful and magnificently skilled people matter least. Perhaps the best way to view leadership is as the task of architecting organizational systems, teams, and cultures – as establishing the conditions and preconditions for others to succeed (Pfeffer & Sutton, 2006h, p.200).
This study makes many important contributions to the field. It provides information
highlighting where current chief information officers may begin focusing effort to improve
their success, it suggests CIO hiring and evaluation criteria, it recommends where those
aspiring to the position should focus professional development efforts, and it begins to
develop a much needed framework for CIO success. As a result it is hoped that this study
will improve CIO performance, aid in reducing CIO turnover, and create a more appealing
job to which more aspire. Chief information officers and their staff members facilitate the
success of many throughout the higher education community and therefore their success
improves education, scholarship, and service and better positions the higher education
organization for the future.
173

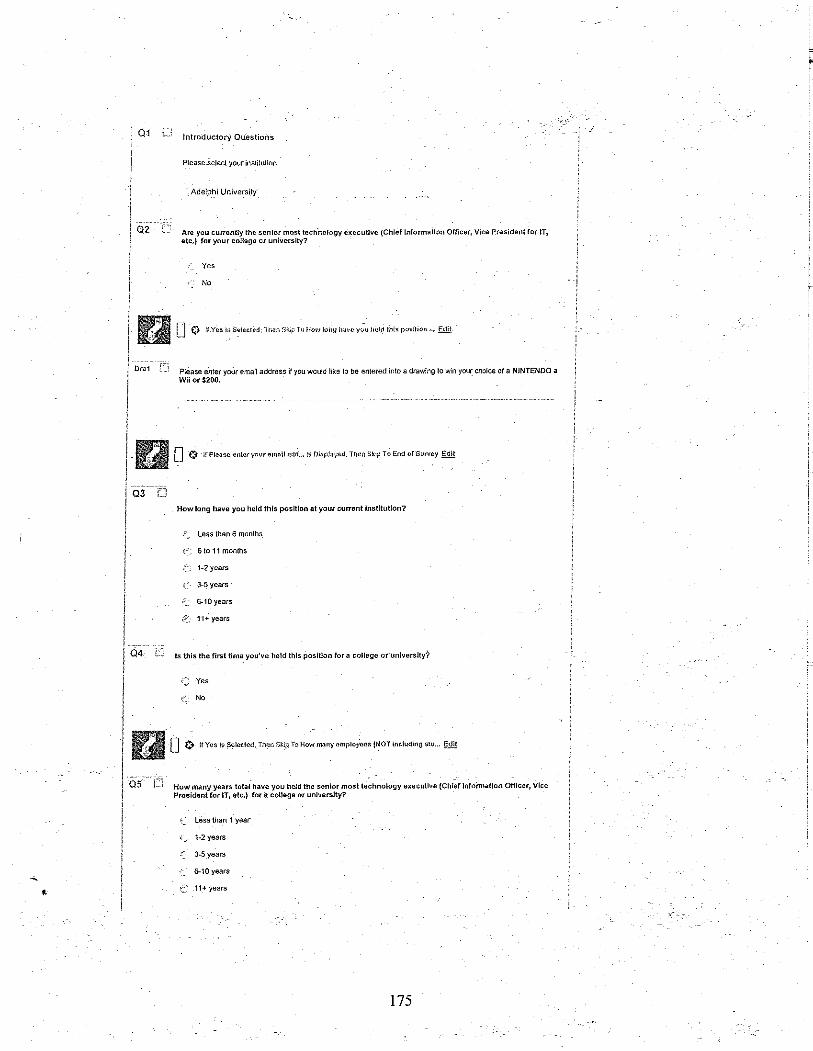


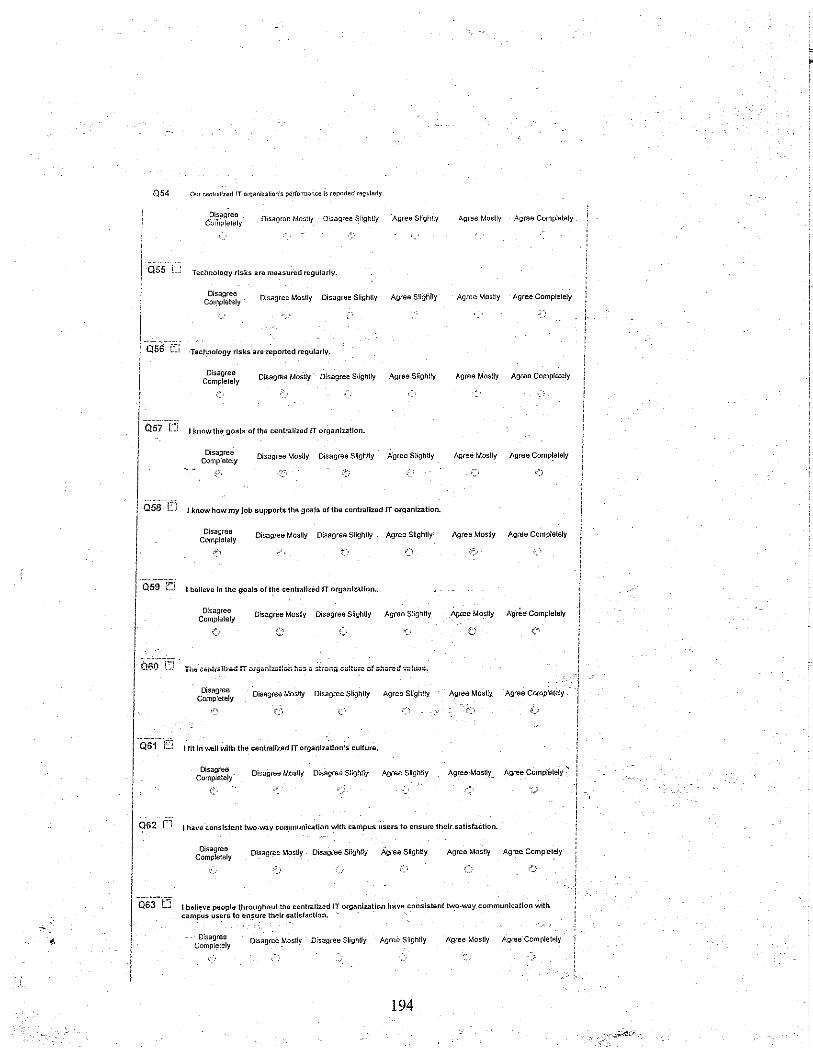


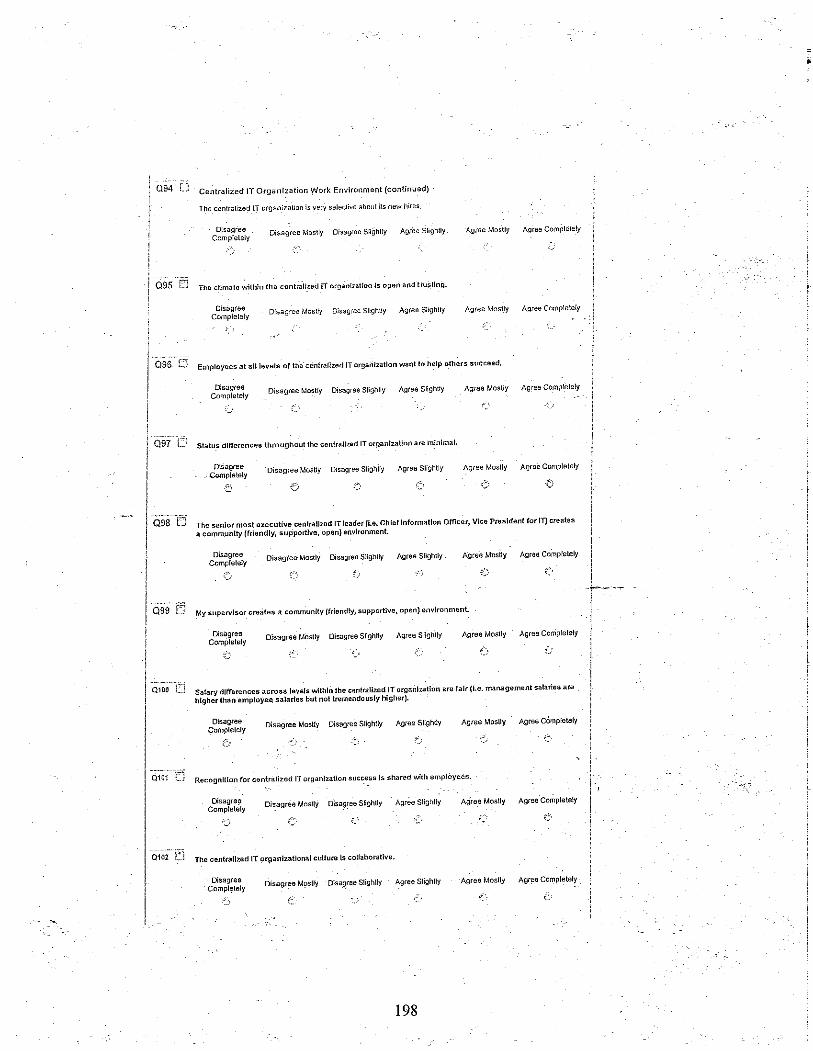


APPENDIX C: Doctoral/Research Universities
The Carnegie Foundation for the Advancement of Teaching (DRU: Doctoral/Research Universities, RU/H: Research Universities – high research activity, RU/VH: Research Universities – very high research activity) Adelphi University Garden City NY Alliant International University-San Diego San Diego CA American University Washington DC Andrews University Berrien Springs MI Antioch University New England Keene NH Argosy University-Orange Campus Santa Ana CA Argosy University-Sarasota Campus Sarasota FL Argosy University-Twin Cities Campus Eagan MN Arizona State University at the Tempe Campus Tempe AZ Auburn University Main Campus Auburn University AL Azusa Pacific University Azusa CA Ball State University Muncie IN Barry University Miami FL Baylor University Waco TX Biola University La Mirada CA Boston College Chestnut Hill MA Boston University Boston MA Bowling Green State University-Main Campus Bowling Green OH Brandeis University Waltham MA Brigham Young University Provo UT Brown University Providence RI California Institute of Integral Studies San Francisco CA California Institute of Technology Pasadena CA Capella University Minneapolis MN Carlos Albizu University San Juan PR Carnegie Mellon University Pittsburgh PA Case Western Reserve University Cleveland OH Catholic University of America Washington DC Central Michigan University Mt Pleasant MI Claremont Graduate University Claremont CA Clark Atlanta University Atlanta GA Clark University Worcester MA Clarkson University Potsdam NY Clemson University Clemson SC Cleveland State University Cleveland OH College of William and Mary Williamsburg VA Colorado School of Mines Golden CO Colorado State University Fort Collins CO Columbia University in the City of New York New York NY
203

Cornell University-Endowed Colleges Ithaca NY CUNY Graduate School and University Center New York NY Dartmouth College Hanover NH DePaul University Chicago IL Drexel University Philadelphia PA Duke University Durham NC Duquesne University Pittsburgh PA East Carolina University Greenville NC East Tennessee State University Johnson City TN Emory University Atlanta GA Fielding Graduate University Santa Barbara CA Florida Agricultural and Mechanical University Tallahassee FL Florida Atlantic University-Boca Raton Boca Raton FL Florida Institute of Technology-Melbourne Melbourne FL Florida International University Miami FL Florida State University Tallahassee FL Fordham University Bronx NY George Fox University Newberg OR George Mason University Fairfax VA George Washington University Washington DC Georgetown University Washington DC Georgia Institute of Technology-Main Campus Atlanta GA Georgia Southern University Statesboro GA Georgia State University Atlanta GA Golden Gate University-San Francisco San Francisco CA Harvard University Cambridge MA Hofstra University Hempstead NY Howard University Washington DC Idaho State University Pocatello ID Illinois Institute of Technology Chicago IL Illinois State University Normal IL Immaculata University Immaculata PA Indiana State University Terre Haute IN Indiana University-Bloomington Bloomington IN Indiana University of Pennsylvania-Main Campus Indiana PA Indiana University-Purdue University-Indianapolis Indianapolis IN Inter American University of Puerto Rico-Metro San Juan PR Iowa State University Ames IA Jackson State University Jackson MS Johns Hopkins University Baltimore MD Kansas State University Manhattan KS Kent State University-Main Campus Kent OH Lehigh University Bethlehem PA Long Island University-C W Post Campus Brookville NY Louisiana State Univ & Ag & Mech & Hebert Laws Baton Rouge LA
204

Ctr Louisiana Tech University Ruston LA Loyola University Chicago Chicago IL Marquette University Milwaukee WI Massachusetts Institute of Technology Cambridge MA Mayo Graduate School Rochester MN Miami University-Oxford Oxford OH Michigan State University East Lansing MI Michigan Technological University Houghton MI Mississippi State University Mississippi State MS Montana State University-Bozeman Bozeman MT Morgan State University Baltimore MD New Jersey Institute of Technology Newark NJ New Mexico State University-Main Campus Las Cruces NM New School University New York NY New York University New York NY North Carolina A & T State University Greensboro NC North Carolina State University at Raleigh Raleigh NC North Dakota State University-Main Campus Fargo ND Northcentral University Prescott AZ Northeastern University Boston MA Northern Arizona University Flagstaff AZ Northern Illinois University Dekalb IL Northwestern University Evanston IL Nova Southeastern University Ft Lauderdale FL Oakland University Rochester Hills MI Ohio State University-Main Campus Columbus OH Ohio University-Main Campus Athens OH Oklahoma State University-Main Campus Stillwater OK Old Dominion University Norfolk VA Oral Roberts University Tulsa OK Oregon State University Corvallis OR Pace University-New York New York NY Pacific University Forest Grove OR Pacifica Graduate Institute Carpinteria CA Pennsylvania State University-Main Campus University Park PA Pepperdine University Malibu CA Polytechnic University Brooklyn NY Portland State University Portland OR Princeton University Princeton NJ Purdue University-Main Campus West Lafayette IN Regent University Virginia Beach VA Rensselaer Polytechnic Institute Troy NY Rice University Houston TX Rutgers University-New Brunswick New Brunswick NJ
205

Rutgers University-Newark Newark NJ St. John's University-New York Queens NY Saint Louis University-Main Campus St Louis MO Saint Mary's University of Minnesota Winona MN Samford University Birmingham AL San Diego State University San Diego CA The Scripps Research Institute La Jolla CA Seton Hall University South Orange NJ South Carolina State University Orangeburg SC South Dakota State University Brookings SD Southern Illinois University Carbondale Carbondale IL Southern Methodist University Dallas TX Spalding University Louisville KY Stanford University Stanford CA Stevens Institute of Technology Hoboken NJ SUNY at Albany Albany NY SUNY at Binghamton Binghamton NY SUNY at Buffalo Buffalo NY SUNY at Stony Brook Stony Brook NY SUNY College of Environmental Science and Forestry Syracuse NY Syracuse University Syracuse NY Teachers College at Columbia University New York NY Temple University Philadelphia PA Tennessee State University Nashville TN Texas A & M University College Station TX Texas A & M University-Commerce Commerce TX Texas A & M University-Kingsville Kingsville TX Texas Christian University Ft Worth TX Texas Tech University Lubbock TX Texas Woman's University Denton TX Trevecca Nazarene University Nashville TN Trinity International University Deerfield IL Tufts University Medford MA Tulane University of Louisiana New Orleans LA Union Institute & University Cincinnati OH University of Akron Main Campus Akron OH University of Alabama, The Tuscaloosa AL University of Alabama at Birmingham Birmingham AL University of Alabama in Huntsville Huntsville AL University of Alaska Fairbanks Fairbanks AK University of Arizona Tucson AZ University of Arkansas at Little Rock Little Rock AR University of Arkansas Main Campus Fayetteville AR University of Bridgeport Bridgeport CT University of California-Berkeley Berkeley CA
206

University of California-Davis Davis CA University of California-Irvine Irvine CA University of California-Los Angeles Los Angeles CA University of California-Riverside Riverside CA University of California-San Diego La Jolla CA University of California-Santa Barbara Santa Barbara CA University of California-Santa Cruz Santa Cruz CA University of Central Florida Orlando FL University of Chicago Chicago IL University of Cincinnati-Main Campus Cincinnati OH University of Colorado at Boulder Boulder CO University of Colorado at Denver and Health Sciences Center Denver CO University of Connecticut Storrs CT University of Dayton Dayton OH University of Delaware Newark DE University of Denver Denver CO University of Florida Gainesville FL University of Georgia Athens GA University of Hartford West Hartford CT University of Hawaii at Manoa Honolulu HI University of Houston-University Park Houston TX University of Idaho Moscow ID University of Illinois at Chicago Chicago IL University of Illinois at Urbana-Champaign Champaign IL University of Iowa Iowa City IA University of Kansas Main Campus Lawrence KS University of Kentucky Lexington KY University of La Verne La Verne CA University of Louisiana at Lafayette Lafayette LA University of Louisville Louisville KY University of Maine Orono ME University of Maryland-Baltimore County Baltimore MD University of Maryland-College Park College Park MD University of Massachusetts-Amherst Amherst MA University of Massachusetts-Boston Boston MA University of Massachusetts-Lowell Lowell MA University of Memphis Memphis TN University of Miami Coral Gables FL University of Michigan-Ann Arbor Ann Arbor MI University of Minnesota-Twin Cities Minneapolis MN University of Mississippi Main Campus University MS University of Missouri-Columbia Columbia MO University of Missouri-Kansas City Kansas City MO University of Missouri-Rolla Rolla MO
207

University of Missouri-St. Louis St Louis MO University of Montana-Missoula, The Missoula MT University of Nebraska at Lincoln Lincoln NE University of Nevada-Las Vegas Las Vegas NV University of Nevada-Reno Reno NV University of New Hampshire-Main Campus Durham NH University of New Mexico-Main Campus Albuquerque NM University of New Orleans New Orleans LA University of North Carolina at Chapel Hill Chapel Hill NC University of North Carolina at Charlotte Charlotte NC University of North Carolina at Greensboro Greensboro NC University of North Dakota-Main Campus Grand Forks ND University of North Texas Denton TX University of Northern Colorado Greeley CO University of Notre Dame Notre Dame IN University of Oklahoma Norman Campus Norman OK University of Oregon Eugene OR University of Pennsylvania Philadelphia PA University of Phoenix-Online Campus Phoenix AZ University of Pittsburgh-Main Campus Pittsburgh PA University of Puerto Rico-Rio Piedras Campus Rio Piedras PR University of Rhode Island Kingston RI University of Rochester Rochester NY University of St. Thomas St Paul MN University of San Diego San Diego CA University of San Francisco San Francisco CA University of South Carolina-Columbia Columbia SC University of South Dakota Vermillion SD University of South Florida Tampa FL University of Southern California Los Angeles CA University of Southern Mississippi Hattiesburg MS University of Tennessee, The Knoxville TN University of Texas at Arlington, The Arlington TX University of Texas at Austin, The Austin TX University of Texas at Dallas, The Richardson TX University of Texas at El Paso, The El Paso TX University of the Pacific Stockton CA University of Toledo Toledo OH University of Tulsa Tulsa OK University of Utah Salt Lake City UT University of Vermont and State Agricultural Coll Burlington VT University of Virginia-Main Campus Charlottesville VA University of Washington-Seattle Campus Seattle WA University of West Florida, The Pensacola FL University of Wisconsin-Madison Madison WI
208

209
University of Wisconsin-Milwaukee Milwaukee WI University of Wyoming Laramie WY Utah State University Logan UT Vanderbilt University Nashville TN Virginia Commonwealth University Richmond VA Virginia Polytechnic Institute and State Univ Blacksburg VA Wake Forest University Winston Salem NC Walden University Minneapolis MN Washington State University Pullman WA Washington University in St. Louis St Louis MO Wayne State University Detroit MI West Virginia University Morgantown WV Western Michigan University Kalamazoo MI Wichita State University Wichita KS Widener University-Main Campus Chester PA Wilmington College New Castle DE Worcester Polytechnic Institute Worcester MA Wright State University-Main Campus Dayton OH Yale University New Haven CT Yeshiva University New York NY

APPENDIX D: Introductory Email to CIO Email Subject: Request for help from a Ph.D. student
Dear (CIO Name),
My name is Meredith Weiss and I am a Ph.D. student studying the success of senior technology executives in higher education. I also hold the position of Associate Dean for Information Technology. As I am certain you know, the position you are in is an extremely challenging one that is critical to the success of higher education institutions.
Current articles about chief information officer (CIO) success are almost entirely based on expert opinion or the experiences of past technology leaders and although these insights and experiences are extremely valuable, quantitative research studies are needed to give CIOs concrete areas in which to focus efforts in order to succeed.
I am asking for your help by participating in a new research study. I realize and respect that you are busy and promise that this will not take but a few minutes of your time. I know as technology leaders we are often asked for our participation in research studies and hope even if you usually decline, that you will participate in this study.
I am asking the senior technology executive at every institution identified with doctoral level programs through The Carnegie Foundation for the Advancement of Teaching to participate in this study.
What you will receive for participating:
1. An analysis of how campus users at your institution and across the country define user satisfaction.
2. An analysis of current user satisfaction at your institution.
3. A list of management practices IT leaders have implemented within their centralized IT organization that have been associated with higher user satisfaction.
4. An analysis revealing if the creation of high-performance technology teams improve IT department and CIO success.
5. An analysis of current management practices taking place within your technology organization.
6. An analysis of how CIOs are being evaluated across the country.
7. A complete dataset (without identifying information) of all responses at your institution.
210

211
Your institution’s results WILL be made available to YOU (the institution’s senior technology executive).
Published results will NOT identify you or your organization.
Your organization’s responses will be securely stored and will remain confidential at all times.
It is critical to higher education institutions that their centralized information technology (IT) organizations succeed since technology organizations facilitate the accomplishments of the institution and its members.
Participation is easy.
I am attaching simple directions explaining how your institution can participate using an online survey.
I sincerely hope that you will agree to participate in this research study. Please contact me using the email below to let me know if you will participate in this new study or be unable to. The more institutions that participate, the more information I will be able to provide to you and other technology leaders across the country. Thank you very much in advance for your consideration and hopefully for your participation in this study.
Best wishes-
Meredith Weiss
--
You are being given the opportunity to volunteer to participate in a research study to help determine which technology organization practices most impact user satisfaction on campus. It is critical to higher education institutions that their technology organizations succeed since IT organizations facilitate the accomplishments of the institution and its members.
To learn more about this study please contact Meredith Weiss at (919) 619-5443 or [email protected].
The principal investigator for this study is Meredith Weiss, M.I.S., M.B.A., Ph.D. ABD, UNC School of Information and Library Science at UNC Chapel Hill. Faculty Advisor: Dean Jose-Marie Griffiths. The Information Technology Management in Higher Education study and this message have received approval from the UNC IRB on 2/11/2009, study #09-0201.

APPENDIX E: Introductory Email to CIO’s Assistant Email Subject: Request for help from a Ph.D. student
Dear (CIO’s Assistant’s Name),
My name is Meredith Weiss and I am a Ph.D. student studying the success of senior technology executives in higher education. As I am certain you know, the chief information officer (CIO) position is an extremely challenging one that is critical to the success of higher education institutions. Current articles about CIO success are almost entirely based on expert opinion or the experiences of past technology leaders and although these insights and experiences are extremely valuable, quantitative research studies are needed to give CIOs concrete areas in which to focus efforts in order to succeed. I am asking for your help by participating in a new study. I realize and respect that you are busy and promise that this will not take but a few minutes of your time. I am asking the senior technology executive at every institution identified with doctoral level programs through The Carnegie Foundation for the Advancement of Teaching to participate in this study.
What you will receive for participating:
1. An analysis of how campus users at your institution and across the country define user satisfaction.
2. An analysis of current user satisfaction at your institution.
3. A list of management practices IT leaders have implemented within their centralized IT organization that have been associated with higher user satisfaction.
4. An analysis revealing if the creation of high-performance technology teams improve IT department and CIO success.
5. An analysis of current management practices taking place within your technology organization.
6. An analysis of how CIOs are being evaluated across the country.
7. A complete dataset (without identifying information) of all responses at your institution.
Your institution’s results WILL be made available to the institution’s senior technology executive.
212

213
Published results will NOT identify you or your organization. Your organization’s responses will be securely stored and will remain confidential at all times.
It is critical to higher education institutions that their centralized information technology (IT) organizations succeed since technology organizations facilitate the accomplishments of the institution and its members.
Participation is easy.
I am attaching simple directions explaining how your institution can participate using an online survey.
I sincerely hope that you will agree to participate in this research study. Please contact me using the email below to let me know if you will participate in this new study or be unable to. The more institutions that participate, the more information I will be able to provide to you and other technology leaders across the country. Thank you very much in advance for your consideration and hopefully for your participation in this study.
Best wishes-
Meredith Weiss
--
You are being given the opportunity to volunteer to participate in a research study to help determine which technology organization practices most impact user satisfaction on campus. It is critical to higher education institutions that their technology organizations succeed since IT organizations facilitate the accomplishments of the institution and its members.
To learn more about this study please contact Meredith Weiss at (919) 619-5443 or [email protected].
The principal investigator for this study is Meredith Weiss, M.I.S., M.B.A., Ph.D. ABD, UNC School of Information and Library Science at UNC Chapel Hill. Faculty Advisor: Dean Jose-Marie Griffiths. The Information Technology Management in Higher Education study and this message have received approval from the UNC IRB on 2/11/2009, study #09-0201.

APPENDIX F: Follow Up Email to CIO Email Subject: Follow Up On Request for help from a Ph.D. student
Hello (CIO NAME),
I wanted to take a quick moment and follow up on the email I sent to you a couple of weeks ago. I realize you are very busy and since I have not heard back from you yet, I thought I’d send you a quick reminder. I am hoping you will be able to help me. In case you did not receive my original email, I have included a copy below.
Thank you in advance for your help.
Best-
Meredith Weiss
--
Dear (CIO NAME),
My name is Meredith Weiss and I am a Ph.D. student studying the success of senior technology executives in higher education. I also hold the position of Associate Dean for Information Technology. As I am certain you know, the position you are in is an extremely challenging one that is critical to the success of higher education institutions.
Current articles about chief information officer (CIO) success are almost entirely based on expert opinion or the experiences of past technology leaders and although these insights and experiences are extremely valuable, quantitative research studies are needed to give CIOs concrete areas in which to focus efforts in order to succeed.
I am asking for your help by participating in a new research study. I realize and respect that you are busy and promise that this will not take but a few minutes of your time. I know as technology leaders we are often asked for our participation in research studies and hope even if you usually decline, that you will participate in this study.
I am asking the senior technology executive at every institution identified with doctoral level programs through The Carnegie Foundation for the Advancement of Teaching to participate in this study.
What you will receive for participating:
1. An analysis of how campus users at your institution and across the country define user satisfaction.
214

2. An analysis of current user satisfaction at your institution.
3. A list of management practices IT leaders have implemented within their centralized IT organization that have been associated with higher user satisfaction.
4. An analysis revealing if the creation of high-performance technology teams improve IT department and CIO success.
5. An analysis of current management practices taking place within your technology organization.
6. An analysis of how CIOs are being evaluated across the country.
7. A complete dataset (without identifying information) of all responses at your institution.
Your institution’s results WILL be made available to YOU (the institution’s senior technology executive).
Published results will NOT identify you or your organization.
Your organization’s responses will be securely stored and will remain confidential at all times.
It is critical to higher education institutions that their centralized information technology (IT) organizations succeed since technology organizations facilitate the accomplishments of the institution and its members.
Participation is easy.
I am attaching simple directions explaining how your institution can participate using an online survey.
I sincerely hope that you will agree to participate in this research study. Please contact me using the email below to let me know if you will participate in this new study or be unable to. The more institutions that participate, the more information I will be able to provide to you and other technology leaders across the country. Thank you very much in advance for your consideration and hopefully for your participation in this study.
Best wishes-
Meredith Weiss
--
215

216
You are being given the opportunity to volunteer to participate in a research study to help determine which technology organization practices most impact user satisfaction on campus. It is critical to higher education institutions that their technology organizations succeed since IT organizations facilitate the accomplishments of the institution and its members.
To learn more about this study please contact Meredith Weiss at (919) 619-5443 or [email protected].
The principal investigator for this study is Meredith Weiss, M.I.S., M.B.A., Ph.D. ABD, UNC School of Information and Library Science at UNC Chapel Hill. Faculty Advisor: Dean Jose-Marie Griffiths. The Information Technology Management in Higher Education study and this message have received approval from the UNC IRB on 2/11/2009, study #09-0201.

APPENDIX G: How Your Institution Can Participate – Simple Instructions
How Your Institution Can Participate – Simple Instructions Steps may be completed in any order or simultaneously. Please complete all steps by March 31, 2009. Step One: The senior most technology executive should take the brief 8 minute Chief Information Officer (CIO) Survey online at http://uncodum.qualtrics.com/SE?SID=SV_aVuZuife6Pzh8ji&SVID=Prod. Step Two: Many institutions have a listserve that can be used to request research study participation from their campus community. Please have someone from your staff send out the email below to the campus community [faculty, staff (including Information Technology employees) and students] asking them to take part in this research study by taking a Campus Technology Survey online. THAT’S IT! We will send you the results and dataset as soon as the analysis is competed! Email Text for Step Two Above: Subject Line for the Email: Please Take the Campus Technology Survey Email Text: Please take this anonymous survey to help determine which centralized information technology organization practices most impact user satisfaction on campus. You will also have the chance to Win your choice of a Nintendo Wii or $200. We need your help! This is a voluntary research study for the campus community. To learn more about this study please contact Meredith Weiss at (919) 619-5443 or [email protected]. The principal investigator for this study is Meredith Weiss, Ph.D. ABD, UNC School of Information and Library Science at UNC Chapel Hill. Faculty Advisor: Dean Jose-Marie Griffiths. The Information Technology Management in Higher Education study and this message have received approval from the UNC IRB on 2/11/2009, study #09-0201. TAKE THE SURVEY NOW AT – http://uncodum.qualtrics.com/SE?SID=SV_2i6qYO5rgdLGdog&SVID=Prod
217

APPENDIX H: Email to CIO Listserve Email Subject: Request for assistance
Hello Everyone, I am conducting a new research study on the success of senior technology executives in higher education and am looking for CIOs willing to participate. Current articles about chief information officer (CIO) success are almost entirely based on expert opinion or the experiences of past technology leaders and although these insights and experiences are extremely valuable, quantitative research studies are needed to give CIOs concrete areas in which to focus efforts in order to succeed.
I realize and respect that you are busy and promise that this will not take but a few minutes of your time. I know as technology leaders we are often asked for our participation in research studies and hope even if you usually decline, that you will participate in this study.
This first study will focus on institutions with doctoral level programs through The Carnegie Foundation for the Advancement of Teaching. If your institution falls into this category, I’m asking for your help.
What you will receive for participating:
1. An analysis of how campus users at your institution and across the country define user satisfaction.
2. An analysis of current user satisfaction at your institution.
3. A list of management practices IT leaders have implemented within their centralized IT organization that have been associated with higher user satisfaction.
4. An analysis revealing if the creation of high-performance technology teams improve IT department and CIO success.
5. An analysis of current management practices taking place within your technology organization.
6. An analysis of how CIOs are being evaluated across the country.
7. A complete dataset (without identifying information) of all responses at your institution.
218

219
Your institution’s results WILL be made available to YOU (the institution’s senior technology executive).
Published results will NOT identify you or your organization.
Your organization’s responses will be securely stored and will remain confidential at all times.
Participation is very easy. If you are interested, please contact me directly off this list for more information.
Thank you and best wishes-
Meredith Weiss
Meredith Weiss Associate Dean for Administration, Finance, and Information Technology University of North Carolina at Chapel Hill [email protected] 919-962-4706
--
You are being given the opportunity to volunteer to participate in a research study to help determine which technology organization practices most impact user satisfaction on campus. It is critical to higher education institutions that their technology organizations succeed since IT organizations facilitate the accomplishments of the institution and its members.
To learn more about this study please contact Meredith Weiss at (919) 962-4706 or [email protected].
The principal investigator for this study is Meredith Weiss, M.I.S., M.B.A., Ph.D. ABD, UNC School of Information and Library Science at UNC Chapel Hill. Faculty Advisor: Dean Jose-Marie Griffiths. The Information Technology Management in Higher Education study and this message have received approval from the UNC IRB on 2/11/2009, study #09-0201.
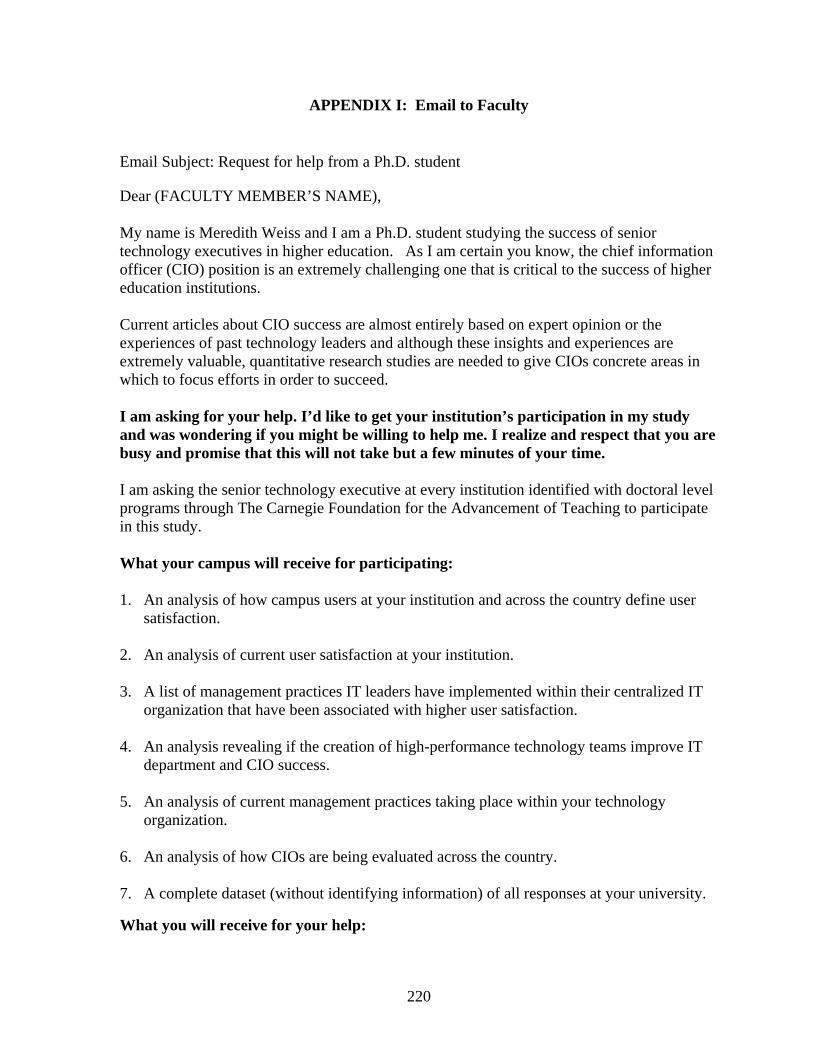
APPENDIX I: Email to Faculty
Email Subject: Request for help from a Ph.D. student
Dear (FACULTY MEMBER’S NAME), My name is Meredith Weiss and I am a Ph.D. student studying the success of senior technology executives in higher education. As I am certain you know, the chief information officer (CIO) position is an extremely challenging one that is critical to the success of higher education institutions. Current articles about CIO success are almost entirely based on expert opinion or the experiences of past technology leaders and although these insights and experiences are extremely valuable, quantitative research studies are needed to give CIOs concrete areas in which to focus efforts in order to succeed. I am asking for your help. I’d like to get your institution’s participation in my study and was wondering if you might be willing to help me. I realize and respect that you are busy and promise that this will not take but a few minutes of your time. I am asking the senior technology executive at every institution identified with doctoral level programs through The Carnegie Foundation for the Advancement of Teaching to participate in this study. What your campus will receive for participating: 1. An analysis of how campus users at your institution and across the country define user
satisfaction.
2. An analysis of current user satisfaction at your institution.
3. A list of management practices IT leaders have implemented within their centralized IT organization that have been associated with higher user satisfaction.
4. An analysis revealing if the creation of high-performance technology teams improve IT department and CIO success.
5. An analysis of current management practices taking place within your technology organization.
6. An analysis of how CIOs are being evaluated across the country.
7. A complete dataset (without identifying information) of all responses at your university.
What you will receive for your help:
220

221
The undying gratitude of a Ph.D. student. Hopefully you remember the dissertation process and are willing to help out a future colleague ☺. Your institution’s results WILL be made available to the institution’s senior technology executive. Published results will NOT identify you or your organization. Your organization’s responses will be securely stored and will remain confidential at all times. If you would be willing to help me get your institution included in this study, please respond to this email. Thank you in advance for any assistance you are willing to provide. Best- Meredith Meredith Weiss School of Information and Library Science University of North Carolina at Chapel Hill [email protected] 919-962-4706

APPENDIX J: Between Universities Variance
Obs CovParm Subject Estimate StdErr ZValue ProbZ 1 Intercept Institution 4.2565 2.1623 1.97 0.0245 2 Residual 21.0561 0.5382 39.12 <.0001 3 ICC 0.1682 . . .
222

APPENDIX K: Research Question One Results Which factors most impact user satisfaction with the centralized technology organization? Which factors are most associated with satisfaction with the CIO? Factors Correlated with Satisfaction with the Centralized IT Organization Faculty Students Non-Centralized IT
Staff Non-IT Staff
Very Highly Correlated
Academic Alignment
0.87207 <.0001
452 9.6% Not Sure
Fiscal Responsibility
0.79713<.0001
95027.2% Not Sure
Responsiveness 0.86908 <.0001
171 3.4% Not Sure
Academic Alignment
0.80278<.0001
99610.4% Not Sure
Innovation 0.85849 <.0001
368 26.4% Not Sure
Support0.78354<.0001
114412.3% Not Sure
Communication 0.84035 <.0001
175 1.1% Not Sure
Support0.79378<.0001
10822.6% Not Sure
Enablement 0.85003 <.0001
475 5.0% Not Sure
Academic Alignment
0.78089<.0001
110715.2% Not Sure
Enablement 0.83906 <.0001
173 2.3% Not Sure
Fiscal Responsibility
0.78897<.0001
82625.7% Not Sure
Support 0.84344 <.0001
474 5.2% Not Sure
Reliability0.77027<.0001
113712.9% Not Sure
Academic Alignment 0.82526 <.0001
169 4.5% Not Sure
Reliability0.77734<.0001
10703.7% Not Sure
Responsiveness 0.83041 <.0001
454 9.2% Not Sure
Enablement0.75947<.0001
113113.3% Not Sure
Fiscal Responsibility 0.81767 <.0001
162 8.5% Not Sure
Enablement0.77132<.0001
10574.9% Not Sure
Fiscal Responsibility
0.82265 <.0001
354 29.2% Not Sure
Innovation0.75350<.0001
92129.4% Not Sure
Support 0.81444 <.0001
174 1.7% Not Sure
Responsiveness0.76581<.0001
10545.1% Not Sure
223

Reliability 0.80658 <.0001
463 7.4% Not Sure
Responsiveness0.72083<.0001
106418.5% Not Sure
Shared Governance 0.78779 <.0001
172 2.8% Not Sure
Innovation0.76213<.0001
83225.1% Not Sure
Communication 0.75694 <.0001
481 3.8% Not Sure
Communication0.65985<.0001
117010.3% Not Sure
Reliability 0.75743 <.0001
173 2.3% Not Sure
Communication0.70873<.0001
10862.3% Not Sure
Shared Governance
0.75452 <.0001
442 11.6% Not Sure
Shared Governance
0.56786<.0001
103420.8% Not Sure
Innovation 0.74491 <.0001
164 7.3% Not Sure
Shared Governance
0.61398<.0001
10128.9% Not Sure
Highly Correlated
Importance of IT
0.25303 <.0001
500 0.0% Not Sure
Importance of IT
0.40907<.0001
13050.0% Not Sure
Importance of IT 0.28367 0.0001
177 0.0% Not Sure
Importance of IT
0.23227<.0001
11110.0% Not Sure
224

Factors Correlated with Satisfaction with the Centralized IT Organization (Research Universities Only) Faculty Students Non-Centralized IT
Staff Non-IT Staff
Very Highly Correlated
Academic Alignment
0.87155 <.0001
Fiscal Responsibility
0.79721<.0001
Responsiveness 0.86833 <.0001
Academic Alignment
0.80283<.0001
Innovation 0.85489 <.0001
Support0.78356<.0001
Communication 0.83908 <.0001
Support0.78898<.0001
Enablement 0.84661 <.0001
Academic Alignment
0.78090<.0001
Enablement 0.83837 <.0001
Fiscal Responsibility
0.78664<.0001
Support 0.84085 <.0001
Reliability0.77057<.0001
Academic Alignment 0.82381 <.0001
Enablement0.77101<.0001
Responsiveness 0.82598 <.0001
Enablement0.75946<.0001
Fiscal Responsibility 0.81641 <.0001
Reliability0.77010<.0001
Fiscal Responsibility
0.82027 <.0001
Innovation0.75352<.0001
Support 0.81309 <.0001
Innovation0.76604<.0001
Reliability 0.80266 <.0001
Responsiveness0.72082<.0001
Shared Governance 0.78645 <.0001
Responsiveness0.76280<.0001
Shared Governance
0.75667 <.0001
Communication0.65983<.0001
Reliability 0.75740 <.0001
Communication0.70123<.0001
Communication 0.74959 <.0001
Shared Governance
0.56785<.0001
Innovation 0.74305 <.0001
Shared Governance
0.60169
Highly Correlated
Importance of IT 0.24679 <.0001
Importance of IT0.40528<.0001
Importance of IT 0.23690 0.0015
Importance of IT0.21598<.0001
225

Factors Correlated with Satisfaction with the CIO Faculty Students Non-Centralized IT
Staff Non-IT Staff
Highly Correlated
Academic Alignment
0.72256 <.0001
285 43.0% Not Sure
Fiscal Responsibility
0.65191<.0001
62452.2% Not Sure
Responsiveness 0.68457 <.0001
134 24.3% Not Sure
Fiscal Responsibility
0.62750<.0001
56948.8% Not Sure
Fiscal Responsibility
0.69795 <.0001
247 50.6% Not Sure
Communication0.63113<.0001
70246.2% Not Sure
Communication 0.68057 <.0001
137 22.6% Not Sure
Communication0.59617<.0001
65940.7% Not Sure
Innovation 0.69329 <.0001
255 49.0% Not Sure
Innovation0.62096<.0001
61453.0% Not Sure
Shared Governance 0.66334 <.0001
136 23.2% Not Sure
Academic Alignment
0.59312<.0001
62643.7% Not Sure
Communication 0.68905 <.0001
295 41.0% Not Sure
Support0.60866<.0001
68747.4% Not Sure
Fiscal Responsibility 0.66064 <.0001
131 26.0% Not Sure
Innovation0.55192<.0001
57248.5% Not Sure
Shared Governance
0.63235 <.0001
280 44.0% Not Sure
Academic Alignment
0.58579<.0001
67948.0% Not Sure
Innovation 0.64126 <.0001
129 27.1% Not Sure
Support0.52776<.0001
65541.0% Not Sure
Enablement 0.63112 <.0001
291 41.8% Not Sure
Reliability0.57680<.0001
68547.5% Not Sure
Enablement 0.61004 <.0001
136 23.2% Not Sure
Shared Governance
0.52464<.0001
63442.9% Not Sure
Responsiveness 0.62193 <.0001
286 42.8% Not Sure
Shared Governance
0.57059<.0001
665
Academic Alignment 0.60167 <.0001
134 24.3% Not Sure
Enablement0.50798<.0001
64741.8% Not Sure
226

49.0% Not SureSupport 0.61725 <.0001
292 41.6% Not Sure
Responsiveness0.56112<.0001
66349.2% Not Sure
Support 0.57667 <.0001
136 23.2% Not Sure
Reliability0.49755<.0001
65141.4% Not Sure
Reliability 0.54548 <.0001
289 42.2% Not Sure
Enablement0.55900<.0001
68147.8% Not Sure
Reliability 0.50934 <.0001
136 23.2% Not Sure
Responsiveness0.48775<.0001
64841.7% Not Sure
Correlated Importance of IT
0.27383 <.0001
301 39.8% Not Sure
Importance of IT
0.36398<.0001
77340.8% Not Sure
Importance of IT 0.29108 0.0005
138 22.0% Not Sure
Importance of IT
0.22526<.0001
66839.9% Not Sure
227

Factors Correlated with Satisfaction with the CIO (Research Universities Only) Faculty Students Non-Centralized IT
Staff Non-IT Staff
Highly Correlated
Academic Alignment
0.71666 <.0001
Fiscal Responsibility
0.65278<.0001
Responsiveness 0.68336 <.0001
Fiscal Responsibility
0.60665<.0001
Fiscal Responsibility
0.69262 <.0001
Communication0.63134<.0001
Communication 0.67869 <.0001
Communication0.57858<.0001
Innovation 0.68775 <.0001
Innovation0.62086<.0001
Shared Governance 0.66128 <.0001
Academic Alignment
0.57537<.0001
Communication 0.68027 <.0001
Support0.60911<.0001
Fiscal Responsibility 0.65857 <.0001
Innovation0.52309<.0001
Shared Governance
0.62895 <.0001
Academic Alignment
0.58617<.0001
Innovation 0.63912 <.0001
Support0.51545<.0001
Enablement 0.62331 <.0001
Reliability0.57834<.0001
Enablement 0.60784 <.0001
Shared Governance
0.50564<.0001
Responsiveness 0.61158 <.0001
Shared Governance
0.57108<.0001
Academic Alignment 0.59890 <.0001
Enablement0.50558<.0001
Support 0.60722 <.0001
Responsiveness0.56110<.0001
Support 0.57390 <.0001
Responsiveness0.52122<.0001
Reliability 0.53565 <.0001
Enablement0.55897<.0001
Reliability 0.50762 <.0001
Reliability0.52115<.0001
Correlated Importance of IT
0.26951 <.0001
Importance of IT
0.36334<.0001
Importance of IT 0.28802 0.0006
Importance of IT
0.21519<.0001
228
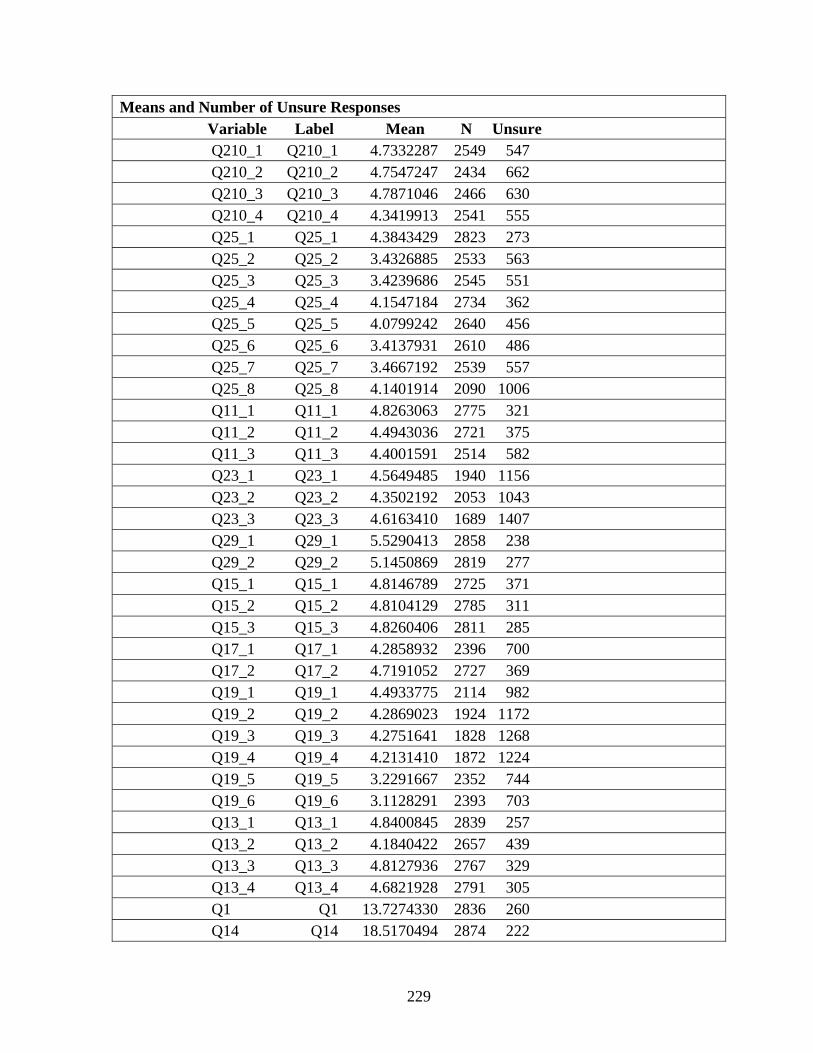
Means and Number of Unsure Responses Variable Label Mean N Unsure Q210_1 Q210_1 4.7332287 2549 547 Q210_2 Q210_2 4.7547247 2434 662 Q210_3 Q210_3 4.7871046 2466 630 Q210_4 Q210_4 4.3419913 2541 555 Q25_1 Q25_1 4.3843429 2823 273 Q25_2 Q25_2 3.4326885 2533 563 Q25_3 Q25_3 3.4239686 2545 551 Q25_4 Q25_4 4.1547184 2734 362 Q25_5 Q25_5 4.0799242 2640 456 Q25_6 Q25_6 3.4137931 2610 486 Q25_7 Q25_7 3.4667192 2539 557 Q25_8 Q25_8 4.1401914 2090 1006 Q11_1 Q11_1 4.8263063 2775 321 Q11_2 Q11_2 4.4943036 2721 375 Q11_3 Q11_3 4.4001591 2514 582 Q23_1 Q23_1 4.5649485 1940 1156 Q23_2 Q23_2 4.3502192 2053 1043 Q23_3 Q23_3 4.6163410 1689 1407 Q29_1 Q29_1 5.5290413 2858 238 Q29_2 Q29_2 5.1450869 2819 277 Q15_1 Q15_1 4.8146789 2725 371 Q15_2 Q15_2 4.8104129 2785 311 Q15_3 Q15_3 4.8260406 2811 285 Q17_1 Q17_1 4.2858932 2396 700 Q17_2 Q17_2 4.7191052 2727 369 Q19_1 Q19_1 4.4933775 2114 982 Q19_2 Q19_2 4.2869023 1924 1172 Q19_3 Q19_3 4.2751641 1828 1268 Q19_4 Q19_4 4.2131410 1872 1224 Q19_5 Q19_5 3.2291667 2352 744 Q19_6 Q19_6 3.1128291 2393 703 Q13_1 Q13_1 4.8400845 2839 257 Q13_2 Q13_2 4.1840422 2657 439 Q13_3 Q13_3 4.8127936 2767 329 Q13_4 Q13_4 4.6821928 2791 305 Q1 Q1 13.7274330 2836 260 Q14 Q14 18.5170494 2874 222
229

Q16 Q16 14.4224411 2843 253 Q18 Q18 9.0933285 2743 353 Q20 Q20 22.8044361 2660 436 Q24 Q24 13.4171030 2292 804 Q26 Q26 30.6525085 2912 184 Q30 Q30 9.7919225 3095 1 Q212 Q212 18.4263338 2724 372 Q27_1 Q27_1 4.2901532 2285 811 Q35 Q35 17.6552504 3095 1 Q39 Q39 13.0792553 1880 1216 Faculty Q35 Q35 17.1200000 500 0 Q39 Q39 12.7176080 301 199 Q31 Q31 4.4520000 500 0 Q232 Q232 4.3440000 500 0 Q33 Q33 4.0820000 500 0 Q34 Q34 4.2420000 500 0 Q36 Q36 4.4673540 291 209 Q37 Q37 4.4081633 294 206 Q38 Q38 4.3076923 286 214 Students Q35 Q35 17.7626340 1305 0 Q39 Q39 12.9417853 773 533 Q31 Q31 4.5570881 1305 1 Q232 Q232 4.4773946 1305 1 Q33 Q33 4.3080460 1305 1 Q34 Q34 4.4337165 1305 1 Q36 Q36 4.5345304 724 582 Q37 Q37 4.4993307 747 559 Q38 Q38 4.4503311 755 551 Non-Centralized IT Staff Q35 Q35 14.6685393 177 0 Q39 Q39 10.9855072 138 40 Q31 Q31 3.9717514 177 1 Q232 Q232 3.7118644 177 1
230

231
Q33 Q33 3.4350282 177 1 Q34 Q34 3.6327684 177 1 Q36 Q36 3.7925926 135 43 Q37 Q37 3.8014706 136 42 Q38 Q38 3.6074074 135 43 Non-IT Staff Q35 Q35 18.2484248 1111 1 Q39 Q39 13.8338323 668 444 Q31 Q31 4.6786679 1111 1 Q232 Q232 4.6012601 1111 1 Q33 Q33 4.4266427 1111 1 Q34 Q34 4.5418542 1111 1 Q36 Q36 4.8982512 629 483 Q37 Q37 4.8463950 638 474 Q38 Q38 4.7639752 644 468

APPENDIX L: Research Question Two Results Are technology organizations with a higher straight average of performance in the nine areas used to define organizational quality (Table 2) viewed as performing better than those which do not?
Pearson Correlation Coefficients
Number of Observations = 11 Prob > |r| under H0: Rho=0
Org Quality Score
IT Satisfaction 0.21201 0.5314
CIO Satisfaction 0.24977 0.4589
Organizational Quality Questions Nine Organizational Quality Areas
Campus Technology Survey Mean
Accountability Questions 49-50 5.1275258 Capability Questions 51- 52 4.7569386 Coordination and Control Questions 53-56 3.7112712 Direction Questions 57-59 4.6757128 Environment and Values Questions 60-61 4.2458973 External Orientation Questions 62-63 4.3781263 Innovation Questions 64-66 4.3710500 Leadership Questions 67-71 4.3764171 Motivation Questions 72-73 4.2939944 Organizational Quality Score Average of nine areas above 4.4374370
232

APPENDIX M: Research Question Three Results Are technology organizations with a higher performance in certain combinations of the nine areas used to define organizational quality (Table 2) viewed as performing better than those which do not? With Overall Centralized IT Organization Satisfaction RSquare CorrelationCoordination and Control Direction Motivation 0.6039 0.7771Coordination and Control Direction External Orientation 0.5892 0.7676Coordination and Control Direction Environment and Values 0.5647 0.7515Accountability Coordination and Control Direction 0.5599 0.7483Coordination and Control Direction Innovation 0.5597 0.7481Direction Leadership Motivation 0.5591 0.7477Coordination and Control Direction Leadership 0.5552 0.7451Capability Coordination and Control Direction 0.5501 0.7417Direction Environment and Values Motivation 0.5381 0.7336Accountability Direction Motivation 0.5373 0.7330 With Overall CIO Satisfaction Coordination and Control Direction External Orientation 0.6248 0.7904Coordination and Control Direction Environment and Values 0.5961 0.7721Coordination and Control Direction Motivation 0.5543 0.7445Coordination and Control Direction Leadership 0.5519 0.7429Coordination and Control Direction Innovation 0.5403 0.7350Accountability Coordination and Control Direction 0.5325 0.7297Capability Coordination and Control Direction 0.5300 0.7280Direction Innovation Motivation 0.4548 0.6744Direction External Orientation Motivation 0.4461 0.6679Accountability Direction Motivation 0.4446 0.6668
233

APPENDIX N: Research Question Four Results Are current higher education technology leaders building high-performance organizations that value, respect, and develop their employees (Table 3)? Is there a correlation between the degree to which this is done and perceptions of CIO and technology organization performance? Are current higher education technology leaders building high-performance organizations that value, respect, and develop their employees (Table 3)?
High-Performance Culture Results By Category
Mean
Meaningful Jobs (Mean Q86-91)
4.87
Valued, Well-Treated Employees (Mean Q84+85)
4.83
Psychological Safety and Job Security (Mean Q82+83)
4.51
Work Climate/Recognition (Mean Q94-102)
4.23
Good Pay (Mean Q92)
4.20
Staff Development (Mean Q79-81)
4.15
Teamwork and Team Rewards (Mean Q74+75)
3.68
Systems, Procedures, and Information Availability (Mean Q76-78)
3.52
Overall mean by category 4.25
234
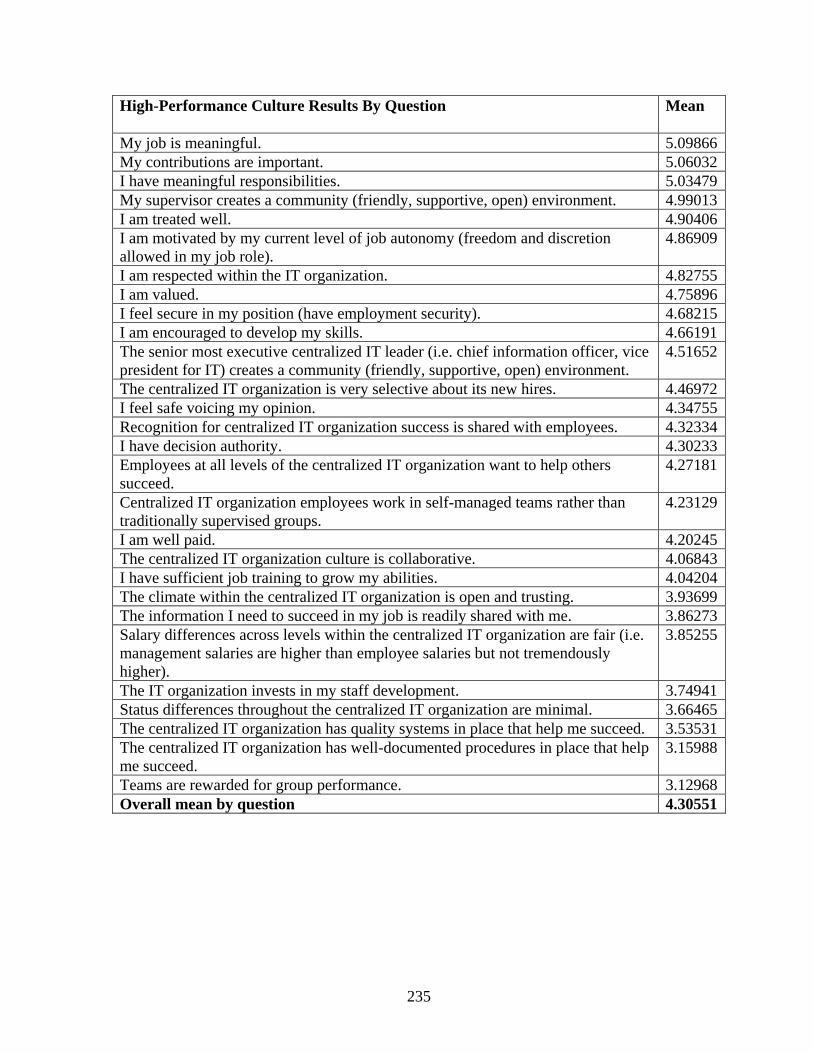
High-Performance Culture Results By Question
Mean
My job is meaningful. 5.09866My contributions are important. 5.06032I have meaningful responsibilities. 5.03479My supervisor creates a community (friendly, supportive, open) environment. 4.99013I am treated well. 4.90406I am motivated by my current level of job autonomy (freedom and discretion allowed in my job role).
4.86909
I am respected within the IT organization. 4.82755I am valued. 4.75896I feel secure in my position (have employment security). 4.68215I am encouraged to develop my skills. 4.66191The senior most executive centralized IT leader (i.e. chief information officer, vice president for IT) creates a community (friendly, supportive, open) environment.
4.51652
The centralized IT organization is very selective about its new hires. 4.46972I feel safe voicing my opinion. 4.34755Recognition for centralized IT organization success is shared with employees. 4.32334I have decision authority. 4.30233Employees at all levels of the centralized IT organization want to help others succeed.
4.27181
Centralized IT organization employees work in self-managed teams rather than traditionally supervised groups.
4.23129
I am well paid. 4.20245The centralized IT organization culture is collaborative. 4.06843I have sufficient job training to grow my abilities. 4.04204The climate within the centralized IT organization is open and trusting. 3.93699The information I need to succeed in my job is readily shared with me. 3.86273Salary differences across levels within the centralized IT organization are fair (i.e. management salaries are higher than employee salaries but not tremendously higher).
3.85255
The IT organization invests in my staff development. 3.74941Status differences throughout the centralized IT organization are minimal. 3.66465The centralized IT organization has quality systems in place that help me succeed. 3.53531The centralized IT organization has well-documented procedures in place that help me succeed.
3.15988
Teams are rewarded for group performance. 3.12968Overall mean by question 4.30551
235

Is there a correlation between the degree to which this is done and perceptions of CIO and technology organization performance?
Pearson Correlation Coefficients Number of Observations = 11
Prob > |r| under H0: Rho=0
IT Org CIO
High Performance Score (mean of questions) 0.1626 0.2169 0.6329 0.5218 High Performance Score (mean of categories) 0.14372 0.18648 0.6733 0.5830
Are technology organizations with a higher performance in certain combinations of high-performance questions viewed as performing better than those which do not? Results for Satisfaction with the centralized IT organization Questions RSquare Correlation Q83 Q91 Q95 0.9349 0.9669 Q83 Q88 Q91 0.9247 0.9616 Q83 Q89 Q91 0.9152 0.9567 Q75 Q77 Q83 0.9045 0.951 Q81 Q83 Q91 0.9001 0.9487 Q84 Q89 Q102 0.8917 0.9443 Q83 Q90 Q91 0.8887 0.9427 Q76 Q83 Q90 0.8882 0.9425 Q74 Q89 Q97 0.8832 0.9398 Q83 Q88 Q90 0.8829 0.9396
236

Results for the belief that the chief information officer is doing an outstanding job Questions RSquare Correlation Q83 Q89 Q91 0.9354 0.9672 Q83 Q91 Q95 0.9352 0.9671 Q83 Q91 Q99 0.9286 0.9636 Q83 Q91 Q92 0.9285 0.9636 Q83 Q88 Q91 0.9281 0.9634 Q81 Q83 Q91 0.9255 0.9620 Q83 Q91 Q97 0.9253 0.9619 Q79 Q83 Q91 0.9241 0.9613 Q83 Q90 Q91 0.9225 0.9605 Q83 Q91 Q102 0.9224 0.9604
Are technology organizations with a higher performance in certain combinations of high-performance categories viewed as performing better than those which do not? Results for satisfaction with the centralized IT organization Categories RSquare CorrelationStaff Development Psychological Safety & Job Security Meaningful Jobs 0.7900 0.8888Systems, Procedures, & Information Availability Psychological Safety & Job Security Meaningful Jobs 0.7881 0.8877Psychological Safety & Job Security Meaningful Jobs Work Climate/Recognition 0.7703 0.8776Psychological Safety & Job Security Meaningful Jobs Good Pay 0.7670 0.8758Teamwork & Rewards Systems, Procedures, & Information Availability Safety & Security 0.7663 0.8754Psychological Safety & Job Security Valued, Well-Treated Employees Meaningful Jobs 0.7588 0.8711Teamwork & Team Rewards Psychological Safety & Job Security Meaningful Jobs 0.7570 0.8701Systems, Procedures, & Information Availability Psychological Safety & Job Security Work Climate/Recognition 0.7210 0.8491Systems, Procedures, & Information Availability Psychological Safety & Job Security Valued, Well-Treated Employees 0.6666 0.8164Systems, Procedures, & Information Availability Psychological Safety & Job Security Good Pay 0.6600 0.8124
237

238
Results for the belief that the chief information officer is doing an outstanding job Categories RSquare CorrelationSystems, Procedures, & Information Availability Psychological Safety & Job Security Meaningful Jobs 0.7861 0.8866Psychological Safety & Job Security Valued, Well-Treated Employees Meaningful Jobs 0.7818 0.8842Psychological Safety & Job Security Meaningful Jobs Good Pay 0.7801 0.8832staff Psychological Safety & Job Security Meaningful Jobs 0.7751 0.8804Teamwork & Team Rewards Psychological Safety & Job Security Meaningful Jobs 0.7686 0.8767Psychological Safety & Job Security Meaningful Jobs Work Climate/Recognition 0.7675 0.8761Systems, Procedures, & Information Availability Psychological Safety & Job Security Work Climate/Recognition 0.7625 0.8732Teamwork & Team Rewards Systems, Procedures, & Information Availability Psychological Safety & Job Security 0.7167 0.8466Systems, Procedures, & Information Availability Psychological Safety & Job Security Valued, Well-Treated Employees 0.6813 0.8254Teamwork & Team Rewards Systems, Procedures, & Information Availability Work Climate/Recognition 0.6691 0.818

APPENDIX O: Research Question Five Results What do CIOs believe is important for the success of the centralized information technology organization? CIO Perceptions of IT Organization Success Factors How important are the following to the success of the IT organization?
Mean All Institutions
Mean Research Institutions Only
Reliability of technology services 4.6071 4.5217End user satisfaction 4.5714 4.6087Proactive communication 4.5357 4.5217End user support 4.4643 4.4783Responsiveness of the technology organization 4.4643 4.4783Effective communication 4.4643 4.4348High-performance IT employee teams (employees are respected, well trained, and valued)
4.4286 4.3913
Technology alignment with campus goals 4.3571 4.3478Technology alignment with campus priorities 4.2857 4.3478End user enablement (IT allows users to accomplish their goals)
4.1786 4.2609
IT fiscal responsibility 4.1071 4.1304Campus involvement in technology decisions 3.9643 4.0000IT budget management 3.9286 3.9130Innovation 3.6429 3.5652
239

APPENDIX P: Research Question Six Results What do CIOs believe is important for the success of the centralized information technology organization? Institution 9 CIO
Response Centralized IT Organization
Campus Users
Enablement 3.00 4.17 3.31Support 2.00 3.92 3.05Reliability 3.00 3.83 3.72Responsiveness 3.00 3.58 3.16Shared Governance 3.00 3.92 2.80Academic Alignment 4.00 4.29 3.40Fiscal Responsibility 3.00 4.00 2.89Communication No Data
Available3.54 2.78
Innovation No Data Available
4.17 3.25
Overall satisfaction IT organization is high
No Data Available
3.83 2.94
Believe the centralized IT organization is effective
No Data Available
4.83 3.26
Believe the centralized IT organization is doing an outstanding job
No Data Available
4.17 2.74
Believe centralized IT organization does a better job than does other centralized campus units (i.e. finance and human resources)
No Data Available
4.58 3.16
240

Institution 232 CIO
Response Centralized IT Organization
Campus Users
Enablement 4.00 4.41 4.48Support 5.00 4.45 4.50Reliability 5.00 4.34 4.63Responsiveness 4.00 4.28 4.44Shared Governance 4.00 3.90 3.75Academic Alignment 5.00 4.22 4.54Fiscal Responsibility 5.00 4.17 4.41Communication 4.00 4.09 3.65Innovation 4.00 3.90 4.33Overall satisfaction IT organization is high
5.00 4.45 4.21
Believe the centralized IT organization is effective
6.00 4.90 4.36
Believe the centralized IT organization is doing an outstanding job
5.00 4.72 4.14
Believe centralized IT organization does a better job than does other centralized campus units (i.e. finance and human resources)
5.00 4.69 4.07
241

Institution 229 CIO
Response Centralized IT Organization
Campus Users
Enablement 3.00 4.31 4.58Support 4.00 4.62 4.65Reliability 3.00 4.41 4.88Responsiveness 3.00 4.55 4.57Shared Governance 2.00 4.03 3.83Academic Alignment 3.00 4.22 4.52Fiscal Responsibility 3.00 4.45 4.49Communication 3.50 4.26 3.77Innovation 3.00 4.10 4.00Overall satisfaction IT organization is high
2.00 4.38 4.43
Believe the centralized IT organization is effective
5.00 4.90 4.59
Believe the centralized IT organization is doing an outstanding job
4.00 4.66 4.28
Believe centralized IT organization does a better job than does other centralized campus units (i.e. finance and human resources)
5.00 4.62 4.26
242

Institution 141 CIO
Response Centralized IT Organization
Campus Users
Enablement 4.00 3.93 4.35Support 5.00 3.93 4.18Reliability 4.00 4.31 4.77Responsiveness 4.00 3.69 4.08Shared Governance 4.00 3.31 3.64Academic Alignment 5.00 3.76 4.32Fiscal Responsibility 5.00 4.05 4.12Communication 5.00 3.31 3.69Innovation 4.00 3.59 3.73Overall satisfaction IT organization is high
4.00 3.69 4.04
Believe the centralized IT organization is effective
5.00 4.41 4.31
Believe the centralized IT organization is doing an outstanding job
4.00 3.97 3.93
Believe centralized IT organization does a better job than does other centralized campus units (i.e. finance and human resources)
4.00 4.34 4.07
243

Institution 228 CIO
Response Centralized IT Organization
Campus Users
Enablement 4.00 3.95 4.51Support 5.00 4.25 4.52Reliability 5.00 4.30 4.84Responsiveness 3.00 3.85 4.52Shared Governance 2.00 3.90 3.68Academic Alignment 3.00 3.88 4.61Fiscal Responsibility 5.00 3.50 4.35Communication 3.00 3.58 3.64Innovation 3.00 3.55 4.16Overall satisfaction IT organization is high
3.00 3.65 4.38
Believe the centralized IT organization is effective
5.00 4.10 4.54
Believe the centralized IT organization is doing an outstanding job
3.00 3.45 4.15
Believe centralized IT organization does a better job than does other centralized campus units (i.e. finance and human resources)
3.00 3.90 4.22
244

Institution 220 CIO
Response Centralized IT Organization
Campus Users
Enablement 5.00 4.10 4.84Support 4.00 4.40 4.93Reliability 4.00 3.90 4.97Responsiveness 5.00 4.00 4.83Shared Governance 4.00 4.00 3.94Academic Alignment 4.00 4.10 4.83Fiscal Responsibility 4.00 4.15 4.75Communication 4.00 3.60 4.18Innovation 5.00 4.20 4.58Overall satisfaction IT organization is high
5.00 4.40 4.64
Believe the centralized IT organization is effective
5.00 4.40 4.75
Believe the centralized IT organization is doing an outstanding job
5.00 4.30 4.56
Believe centralized IT organization does a better job than does other centralized campus units (i.e. finance and human resources)
4.00 4.60 4.32
245

Institution 207 CIO
Response Centralized IT Organization
Campus Users
Enablement 5.00 4.14 4.28Support 4.00 4.00 4.39Reliability 5.00 4.29 4.46Responsiveness 4.00 3.86 4.19Shared Governance 5.00 4.14 3.52Academic Alignment 4.00 4.07 4.37Fiscal Responsibility 4.00 4.14 4.31Communication 4.00 3.50 3.65Innovation 5.00 4.57 4.11Overall satisfaction IT organization is high
5.00 3.71 4.15
Believe the centralized IT organization is effective
6.00 4.43 4.36
Believe the centralized IT organization is doing an outstanding job
5.00 4.29 3.97
Believe centralized IT organization does a better job than does other centralized campus units (i.e. finance and human resources)
6.00 4.43 4.38
246

Institution 140 CIO
Response Centralized IT Organization
Campus Users
Enablement 4.00 4.33 4.22Support 4.00 4.48 4.46Reliability 4.00 4.71 4.57Responsiveness 4.00 4.48 4.04Shared Governance 5.00 4.05 3.69Academic Alignment 5.00 4.23 4.00Fiscal Responsibility 5.00 3.93 3.94Communication 4.50 3.66 3.70Innovation 5.00 4.10 4.07Overall satisfaction IT organization is high
4.00 4.29 4.12
Believe the centralized IT organization is effective
5.00 4.76 4.27
Believe the centralized IT organization is doing an outstanding job
4.00 4.33 4.03
Believe centralized IT organization does a better job than does other centralized campus units (i.e. finance and human resources)
4.00 4.29 3.86
247

Institution 99 CIO
Response Centralized IT Organization
Campus Users
Enablement 5.00 4.07 4.74Support 4.00 4.13 4.49Reliability 5.00 3.93 4.95Responsiveness 6.00 3.93 4.37Shared Governance 4.00 4.00 4.26Academic Alignment 4.00 3.87 4.94Fiscal Responsibility 4.00 3.77 4.50Communication 5.00 3.87 4.14Innovation 4.00 3.73 4.33Overall satisfaction IT organization is high
5.00 3.93 4.68
Believe the centralized IT organization is effective
5.00 4.07 4.95
Believe the centralized IT organization is doing an outstanding job
5.00 3.67 4.63
Believe centralized IT organization does a better job than does other centralized campus units (i.e. finance and human resources)
5.00 4.87 4.63
248

Institution 39 CIO
Response Centralized IT Organization
Campus Users
Enablement 5.00 4.79 4.96Support 5.00 4.79 5.10Reliability 5.00 4.21 5.13Responsiveness 6.00 4.64 4.99Shared Governance 4.00 4.07 4.41Academic Alignment 5.00 4.64 4.95Fiscal Responsibility 5.50 4.54 4.89Communication 4.50 4.54 4.57Innovation 4.00 4.36 4.95Overall satisfaction IT organization is high
5.00 5.07 4.95
Believe the centralized IT organization is effective
6.00 5.21 5.02
Believe the centralized IT organization is doing an outstanding job
5.00 5.14 4.90
Believe centralized IT organization does a better job than does other centralized campus units (i.e. finance and human resources)
5.00 4.36 4.30
249

Institution 325 CIO
Response Centralized IT Organization
Campus Users
Enablement 5.00 4.50 5.06Support 5.00 5.00 5.24Reliability 6.00 5.50 5.49Responsiveness 4.00 5.00 5.03Shared Governance 5.00 4.50 4.54Academic Alignment 5.00 4.50 5.20Fiscal Responsibility 5.00 4.50 5.06Communication 4.50 5.00 4.33Innovation 5.00 4.50 4.89Overall satisfaction IT organization is high
5.00 5.00 5.13
Believe the centralized IT organization is effective
6.00 5.00 5.16
Believe the centralized IT organization is doing an outstanding job
5.00 5.00 4.94
Believe centralized IT organization does a better job than does other centralized campus units (i.e. finance and human resources)
5.00 5.00 4.16
250

CIO and IT Perception of Campus User Satisfaction CIO
Perception (CIO Survey)
Centralized IT Perception (Campus Survey)
Actual Campus User Satisfaction (Campus Survey)
Enablement
Q16_3 Q108_3 Q11 4.27 4.25 4.48
Support
Q16_2 Q108_2 Q13 4.27 4.36 4.50
Reliability
Q16_4 Q108_4 Q15 4.45 4.34 4.76
Responsiveness
Q16_5 Q108_5 Q17 4.18 4.17 4.38
Shared Governance
Q16_6 Q108_6 Q19 3.82 3.98 3.82
Academic Alignment
Q16_7&8 Q108_7&8 Q210 4.27 4.16 4.52
Fiscal Responsibility
Q16_9&10 Q108_9&10 Q23 4.41 4.11 4.34
Communication
Q16_11&12 Q108_11&12 Q25 4.20 3.90 3.83
Innovation
Q16_13 Q108_13 Q27 4.20 4.07 4.22
Overall satisfaction IT organization is high
Q29 Q114 Q34 4.30 4.22 4.33
251
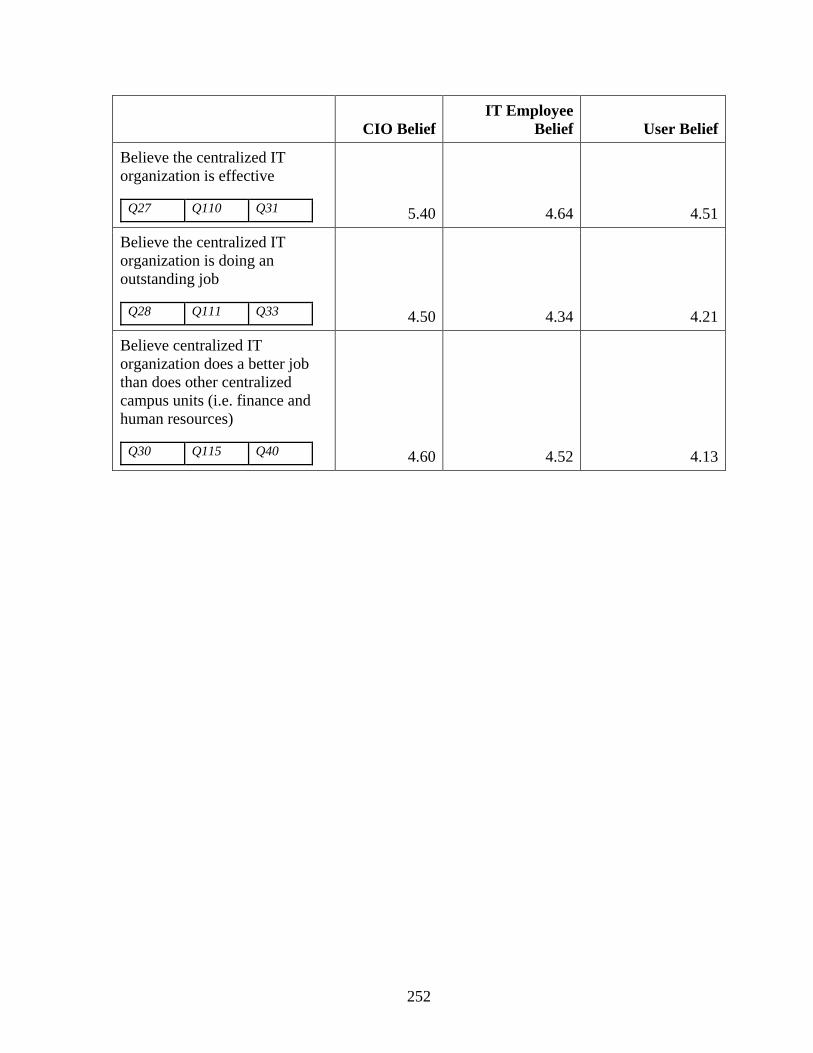
252
CIO Belief
IT Employee Belief User Belief
Believe the centralized IT organization is effective
Q27 Q110 Q31 5.40 4.64 4.51
Believe the centralized IT organization is doing an outstanding job
Q28 Q111 Q33 4.50 4.34 4.21
Believe centralized IT organization does a better job than does other centralized campus units (i.e. finance and human resources)
Q30 Q115 Q40 4.60 4.52 4.13
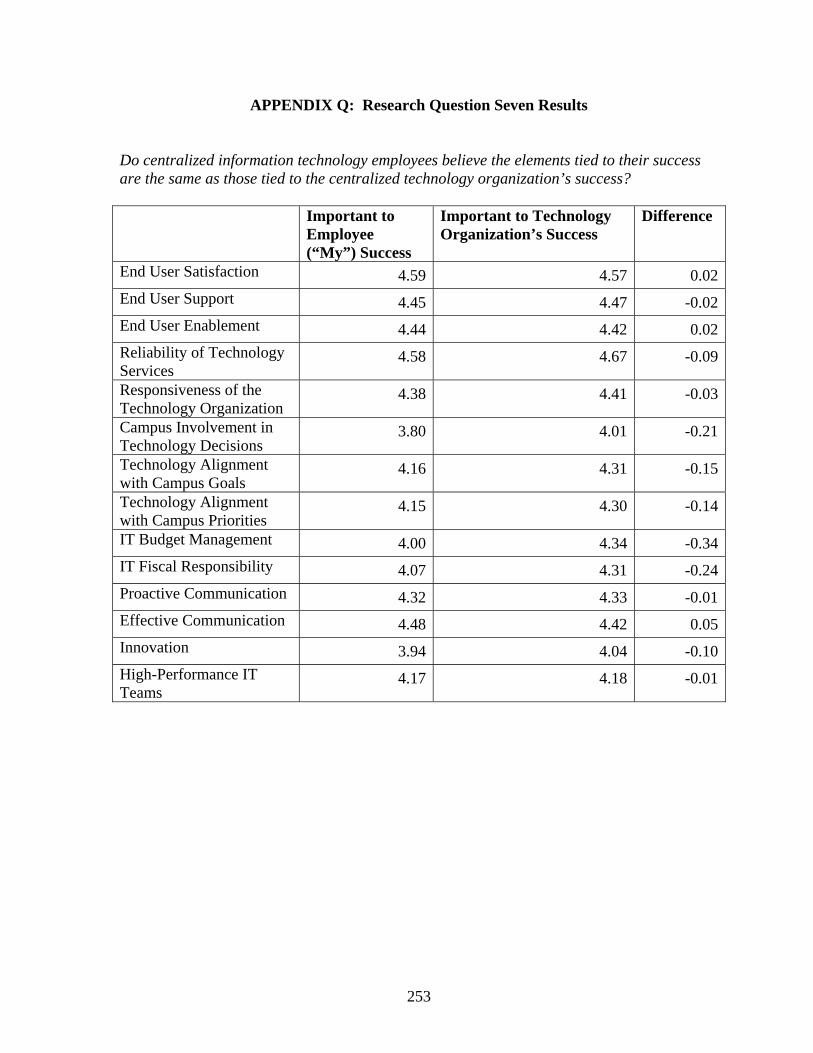
APPENDIX Q: Research Question Seven Results
Do centralized information technology employees believe the elements tied to their success are the same as those tied to the centralized technology organization’s success? Important to
Employee (“My”) Success
Important to Technology Organization’s Success
Difference
End User Satisfaction 4.59 4.57 0.02End User Support 4.45 4.47 -0.02End User Enablement 4.44 4.42 0.02Reliability of Technology Services
4.58 4.67 -0.09
Responsiveness of the Technology Organization
4.38 4.41 -0.03
Campus Involvement in Technology Decisions
3.80 4.01 -0.21
Technology Alignment with Campus Goals
4.16 4.31 -0.15
Technology Alignment with Campus Priorities
4.15 4.30 -0.14
IT Budget Management 4.00 4.34 -0.34IT Fiscal Responsibility 4.07 4.31 -0.24Proactive Communication 4.32 4.33 -0.01Effective Communication 4.48 4.42 0.05Innovation 3.94 4.04 -0.10High-Performance IT Teams
4.17 4.18 -0.01
253

APPENDIX R: Research Question Eight Results
Do CIOs have a clear understanding of what metrics will be used to evaluate their performance? Which elements do CIOs believe are most heavily factored into their performance reviews? Do CIOs believe that those conducting their performance reviews have adequate guidelines and information to carry out meaningful evaluations?
Yes No Somewhat
Do CIOs have a clear understanding of what metrics will be used to evaluate their performance? 59% 26% 15% Do CIOs believe that those conducting their performance reviews have adequate guidelines and information to carry out meaningful evaluations? 74% 19% 7%
End User Satisfaction 4.21Reliability of Technology Services 4.21Responsiveness of the Technology Organization 4.11IT Fiscal Responsibility 4.07IT Budget Management 4.00Technology Alignment with Campus Priorities 3.75Technology Alignment with Campus Goals 3.64Effective Communication 3.64End User Support 3.61Proactive Communication 3.61End User Enablement 3.54High-Performance IT Teams 3.32Campus Involvement in Technology Decisions 3.29Innovation 3.11
254

APPENDIX S: Research Question Nine Results
How important do users believe the centralized information technology department is to their success and that of their intuition?
The MEANS Procedure Institution’s Success
Analysis Variable : Q29_1 Respondent Number of Observations Mean Faculty 500 5.6560000 Students 1305 5.5609195 Non-Centralized IT Staff 177 5.5649718 Non-IT Staff 1111 5.7398740
The MEANS Procedure
“My” Success Analysis Variable : Q29_2
Respondent Number of Observations Mean Faculty 500 5.2480000 Students 1305 5.3141762 Non-Centralized IT Staff 177 5.0621469 Non-IT Staff 1111 5.3708371
255

APPENDIX T: Internal Consistency
Internal consistency information using Cronbach’s Alpha Organizational Quality Areas Accountability
Cronbach Coefficient Alpha Variables Alpha Raw 0.842743
Cronbach Coefficient Alpha with Deleted Variable
Raw Variables Deleted
Variable Correlation
with TotalAlpha
Q49 0.776242 . Q50 0.776242 .
Pearson Correlation Coefficients, N = 11
Prob > |r| under H0: Rho=0
Q49 Q50 Q49 1.00000 0.77624 Q49 0.0050 Q50 0.77624 1.00000 Q50 0.0050
256

Capability
Cronbach Coefficient Alpha Variables Alpha Raw -1.90205
Cronbach Coefficient Alpha with Deleted Variable
Raw Variables Deleted
Variable Correlation
with TotalAlpha
Q51 -.532354 . Q52 -.532354 .
Pearson Correlation Coefficients, N = 11
Prob > |r| under H0: Rho=0
Q51 Q52 Q51 1.00000 -0.53235 Q51 0.0918 Q52 -0.53235 1.00000 Q52 0.0918
257

Coordination and Control
Cronbach Coefficient Alpha Variables Alpha Raw 0.935377
Cronbach Coefficient Alpha with Deleted Variable
Raw Variables Deleted
Variable Correlation
with TotalAlpha
Q53 0.952772 0.879433 Q54 0.811137 0.933625 Q55 0.810766 0.929438 Q56 0.849759 0.916443
Pearson Correlation Coefficients, N = 11
Prob > |r| under H0: Rho=0
Q53 Q54 Q55 Q56 Q53 1.00000 0.94245 0.79831 0.82047 Q53 <.0001 0.0032 0.002 Q54 0.94245 1.00000 0.62712 0.69084 Q54 <.0001 0.0389 0.0186 Q55 0.79831 0.62712 1.00000 0.88723 Q55 0.0032 0.0389 0.0003 Q56 0.82047 0.69084 0.88723 1.00000 Q56 <.0001 <.0001 <.0001
258

Direction
Cronbach Coefficient Alpha Variables Alpha Raw 0.893069
Cronbach Coefficient Alpha with Deleted Variable
Raw Variables Deleted
Variable Correlation
with TotalAlpha
Q57 0.778673 0.863499 Q58 0.702432 0.927395 Q59 0.929055 0.756844
Pearson Correlation Coefficients, N = 11
Prob > |r| under H0: Rho=0
Q57 Q58 Q59 Q57 1.00000 0.60903 0.88875 Q57 0.0467 0.0003 Q58 0.60903 1.00000 0.77639 Q58 0.0467 0.005 Q59 0.88875 0.77639 1.00000 Q59 0.0003 0.005
259
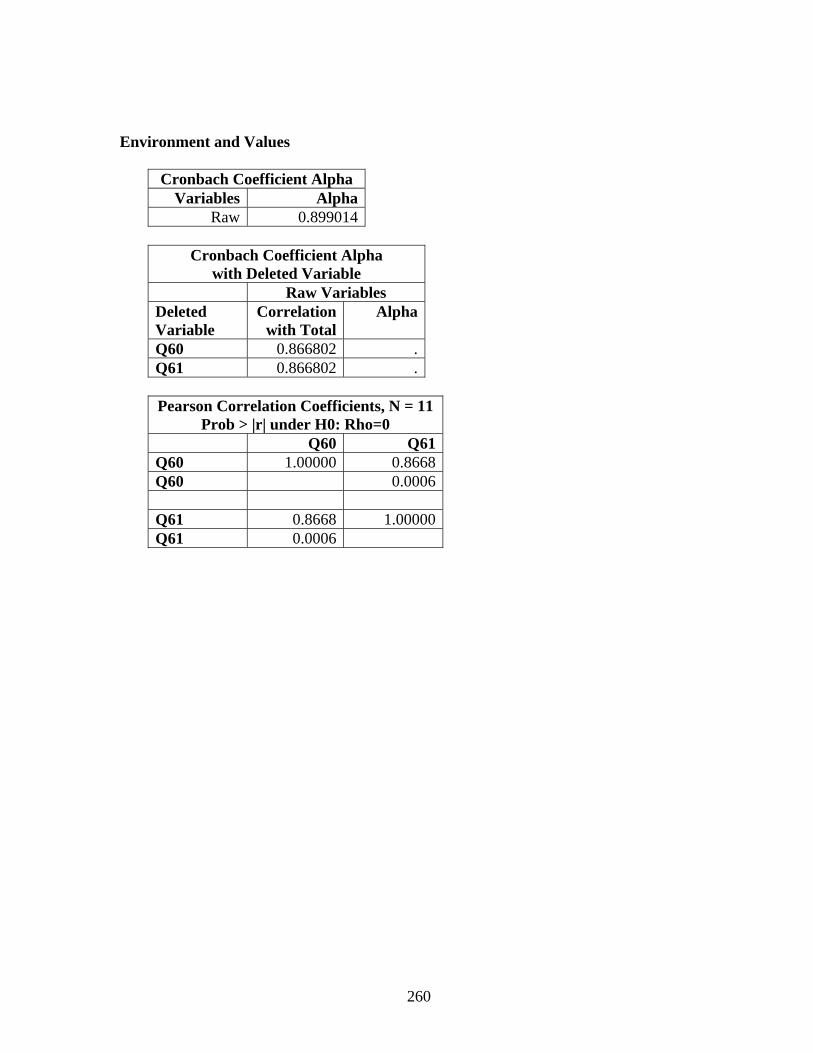
Environment and Values
Cronbach Coefficient Alpha Variables Alpha Raw 0.899014
Cronbach Coefficient Alpha with Deleted Variable
Raw Variables Deleted
Variable Correlation
with TotalAlpha
Q60 0.866802 . Q61 0.866802 .
Pearson Correlation Coefficients, N = 11
Prob > |r| under H0: Rho=0
Q60 Q61 Q60 1.00000 0.8668 Q60 0.0006 Q61 0.8668 1.00000 Q61 0.0006
260

External Orientation
Cronbach Coefficient Alpha Variables Alpha Raw -.024686
Cronbach Coefficient Alpha with Deleted Variable
Raw Variables Deleted
Variable Correlation
with TotalAlpha
Q62 -0.01532 . Q63 -0.01532 .
Pearson Correlation Coefficients, N = 11
Prob > |r| under H0: Rho=0
Q62 Q63 Q62 1.00000 -0.01532 Q62 0.9643 Q63 -0.01532 1.00000 Q63 0.9643
261

Innovation
Cronbach Coefficient Alpha Variables Alpha Raw 0.933885
Cronbach Coefficient Alpha with Deleted Variable
Raw Variables Deleted
Variable Correlation
with TotalAlpha
Q64 0.869179 0.931814 Q65 0.910494 0.865875 Q66 0.888754 0.906304
Pearson Correlation Coefficients, N = 11
Prob > |r| under H0: Rho=0
Q64 Q65 Q66 Q64 1.00000 0.85991 0.82798 Q64 0.0007 0.0016 Q65 0.85991 1.00000 0.88023 Q65 0.0007 0.0003 Q66 0.82798 0.88023 1.00000 Q66 0.0016 0.0003
262

Leadership Cronbach Coefficient Alpha Variables Alpha Raw 0.671106 Cronbach Coefficient Alpha
with Deleted Variable
Raw Variables Deleted
Variable Correlation
with Total Alpha
Q67 0.241084 0.688291 Q68 0.216605 0.692050 Q69 0.643944 0.544812 Q70 0.613559 0.540421 Q71 0.562947 0.584399 Pearson Correlation Coefficients, N =11
Prob > |r| under H0: Rho=0
Q67 Q68 Q69 Q70 Q71 Q67 1.00000 0.80322 0.04652 0.10005 0.02093 Q67 0.0029 0.892 0.7698 0.9513 Q68 0.80322 1.00000 -0.08243 0.06516 0.00357 Q68 0.0029 0.8096 0.849 0.9917 Q69 0.04652 -0.08243 1.00000 0.63735 0.77278 Q69 0.892 0.8096 0.0349 0.0053 Q70 0.10005 0.06516 0.63735 1.00000 0.64367 Q70 0.7698 0.849 0.0349 0.0326 Q71 0.02093 0.00357 0.77278 0.64367 1.00000 Q71 0.9513 0.9917 0.0053 0.0326
263

Motivation
Cronbach Coefficient Alpha Variables Alpha Raw 0.973405
Cronbach Coefficient Alpha with Deleted Variable
Raw Variables Deleted
Variable Correlation
with TotalAlpha
Q72 0.955445 . Q73 0.955445 .
Pearson Correlation Coefficients, N = 11
Prob > |r| under H0: Rho=0
Q72 Q73 Q72 1.00000 0.95544 Q72 <.0001 Q73 0.95544 1.00000 Q73 <.0001
264
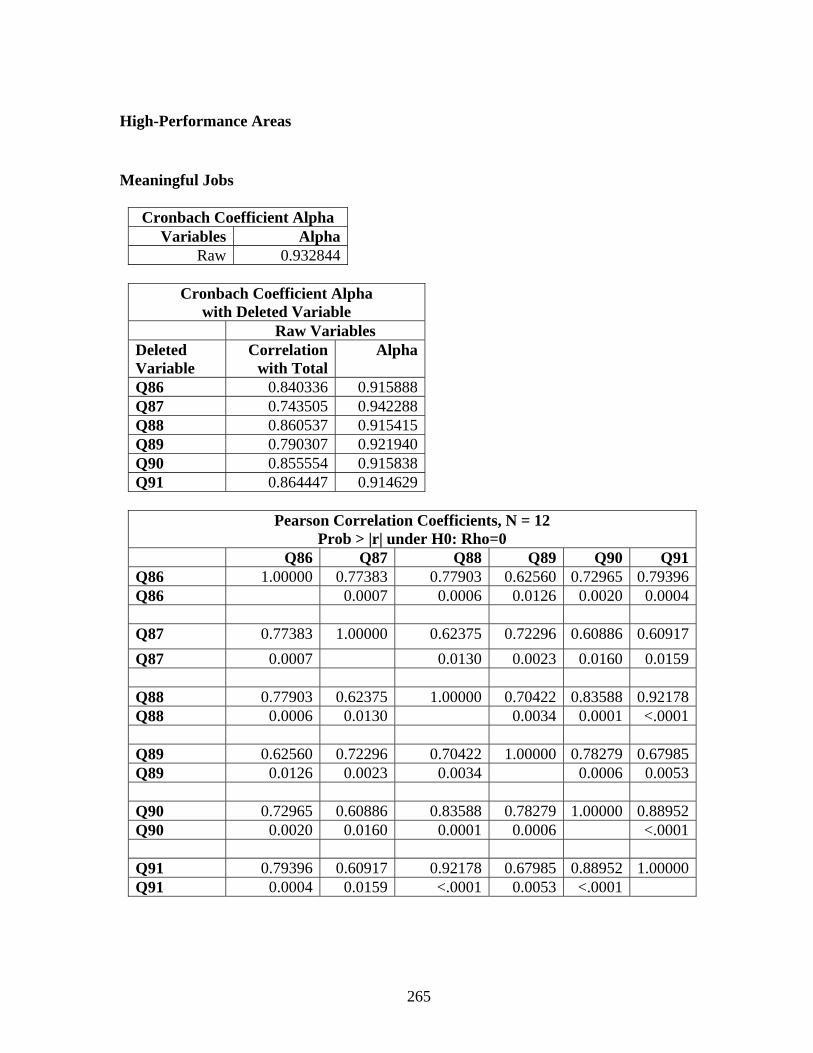
High-Performance Areas
Meaningful Jobs Cronbach Coefficient Alpha Variables Alpha Raw 0.932844 Cronbach Coefficient Alpha
with Deleted Variable
Raw Variables Deleted
Variable Correlation
with TotalAlpha
Q86 0.840336 0.915888 Q87 0.743505 0.942288 Q88 0.860537 0.915415 Q89 0.790307 0.921940 Q90 0.855554 0.915838 Q91 0.864447 0.914629 Pearson Correlation Coefficients, N = 12
Prob > |r| under H0: Rho=0
Q86 Q87 Q88 Q89 Q90 Q91 Q86 1.00000 0.77383 0.77903 0.62560 0.72965 0.79396 Q86 0.0007 0.0006 0.0126 0.0020 0.0004 Q87 0.77383 1.00000 0.62375 0.72296 0.60886 0.60917 Q87 0.0007 0.0130 0.0023 0.0160 0.0159 Q88 0.77903 0.62375 1.00000 0.70422 0.83588 0.92178 Q88 0.0006 0.0130 0.0034 0.0001 <.0001 Q89 0.62560 0.72296 0.70422 1.00000 0.78279 0.67985 Q89 0.0126 0.0023 0.0034 0.0006 0.0053 Q90 0.72965 0.60886 0.83588 0.78279 1.00000 0.88952 Q90 0.0020 0.0160 0.0001 0.0006 <.0001 Q91 0.79396 0.60917 0.92178 0.67985 0.88952 1.00000 Q91 0.0004 0.0159 <.0001 0.0053 <.0001
265

Valued, Well-Treated Employees
Cronbach Coefficient Alpha Variables Alpha Raw 0.930581
Cronbach Coefficient Alpha with Deleted Variable
Raw Variables Deleted
Variable Correlation
with TotalAlpha
Q84 0.874883 . Q85 0.874883 .
Pearson Correlation Coefficients, N = 12
Prob > |r| under H0: Rho=0
Q84 Q85 Q84 1.00000 0.87488 Q84 <.0001 Q85 0.87488 1.00000 Q85 <.0001
266

Psychological Safety and Job Security
Cronbach Coefficient Alpha Variables Alpha Raw 0.886111
Cronbach Coefficient Alpha with Deleted Variable
Raw Variables Deleted
Variable Correlation
with TotalAlpha
Q82 0.795857 . Q83 0.795857 .
Pearson Correlation Coefficients, N = 12
Prob > |r| under H0: Rho=0
Q82 Q83 Q82 1.00000 0.79586 Q82 0.0004 Q83 0.79586 1.00000 Q83 0.0004
267

Work Climate/Recognition
Cronbach Coefficient Alpha Variables Alpha Raw 0.958010 Cronbach Coefficient Alpha
with Deleted Variable
Raw Variables
Deleted Variable
Correlation with Total
Alpha
Q94 0.751339 0.956592 Q95 0.907613 0.948906 Q96 0.877455 0.950990 Q97 0.925826 0.947961 Q98 0.824003 0.953291 Q99 0.658019 0.960431 Q100 0.711840 0.959026 Q101 0.873338 0.950667 Q102 0.938273 0.947831
Pearson Correlation Coefficients, N = 12 Prob > |r| under H0: Rho=0
Q94 Q95 Q96 Q97 Q98 Q99 Q100 Q101 Q102 Q94 1.00000 0.81685 0.62289 0.76934 0.67808 0.35501 0.49793 0.81911 0.65825 Q94 0.0002 0.0131 0.0008 0.0055 0.1941 0.0589 0.0002 0.0076 Q95 0.81685 1.00000 0.82319 0.93155 0.79316 0.49707 0.63521 0.83337 0.89096 Q95 0.0002 0.0002 <.0001 0.0004 0.0594 0.0109 0.0001 <.0001 Q96 0.62289 0.82319 1.00000 0.82945 0.79903 0.67858 0.67139 0.73726 0.89277 Q96 0.0131 0.0002 0.0001 0.0004 0.0054 0.0061 0.0017 <.0001 Q97 0.76934 0.93155 0.82945 1.00000 0.72649 0.64111 0.71788 0.79901 0.94117 Q97 0.0008 <.0001 0.0001 0.0022 0.01 0.0026 0.0004 <.0001 Q98 0.67808 0.79316 0.79903 0.72649 1.00000 0.62741 0.53146 0.84421 0.74391 Q98 0.0055 0.0004 0.0004 0.0022 0.0123 0.0415 <.0001 0.0015 Q99 0.35501 0.49707 0.67858 0.64111 0.62741 1.00000 0.52906 0.58071 0.75075 Q99 0.1941 0.0594 0.0054 0.01 0.0123 0.0426 0.0232 0.0013
268

Q100 0.49793 0.63521 0.67139 0.71788 0.53146 0.52906 1.00000 0.65154 0.78425 Q100 0.0589 0.0109 0.0061 0.0026 0.0415 0.0426 0.0085 0.0005 Q101 0.81911 0.83337 0.73726 0.79901 0.84421 0.58071 0.65154 1.00000 0.76223 Q101 0.0002 0.0001 0.0017 0.0004 <.0001 0.0232 0.0085 0.001 Q102 0.65825 0.89096 0.89277 0.94117 0.74391 0.75075 0.78425 0.76223 1.00000 Q102 0.0076 <.0001 <.0001 <.0001 0.0015 0.0013 0.0005 0.001
Staff Development
Cronbach Coefficient Alpha Variables Alpha Raw 0.945820
Cronbach Coefficient Alpha with Deleted Variable
Raw Variables Deleted
Variable Correlation
with TotalAlpha
Q79 0.89228 0.916413 Q80 0.930577 0.886307 Q81 0.84047 0.955323
Pearson Correlation Coefficients, N = 12
Prob > |r| under H0: Rho=0
Q79 Q80 Q81 Q79 1.00000 0.91503 0.79626 Q79 <.0001 0.0004 Q80 0.91503 1.00000 0.84769 Q80 <.0001 <.0001 Q81 0.79626 0.84769 1.00000 Q81 0.0004 <.0001
269

Teamwork and Team Rewards
Cronbach Coefficient Alpha Variables Alpha Raw 0.494648
Cronbach Coefficient Alpha with Deleted Variable
Raw Variables Deleted
Variable Correlation
with TotalAlpha
Q74 0.329354 . Q75 0.329354 .
Pearson Correlation Coefficients, N = 12
Prob > |r| under H0: Rho=0
Q74 Q75 Q74 1.00000 0.32935 Q74 0.2306 Q75 0.32935 1.00000 Q75 0.2306
270

Systems, Procedures, and Information Availability
Cronbach Coefficient Alpha Variables Alpha Raw 0.918881
Cronbach Coefficient Alpha with Deleted Variable
Raw Variables Deleted
Variable Correlation
with TotalAlpha
Q76 0.869867 0.859054 Q77 0.823151 0.896424 Q78 0.837162 0.894845
Pearson Correlation Coefficients, N = 12
Prob > |r| under H0: Rho=0
Q76 Q77 Q78 Q76 1.00000 0.80982 0.82506 Q76 0.0003 0.0002 Q77 0.80982 1.00000 0.76718 Q77 0.0003 0.0008 Q78 0.82506 0.76718 1.00000 Q78 0.0002 0.0008
271

Factors Potentially Impacting User Satisfaction Academic Alignment
Cronbach Coefficient Alpha Variables Alpha Raw 0.950991
Cronbach Coefficient Alpha with Deleted Variable
Raw Variables Deleted
Variable Correlation
with TotalAlpha
Q210_1 0.863371 0.940975 Q210_2 0.916975 0.925134 Q210_3 0.914129 0.926364 Q210_4 0.840364 0.950875
Pearson Correlation Coefficients, N = 2230
Prob > |r| under H0: Rho=0
Q210_1 Q210_2 Q210_3 Q210_4 Q210_1 1.00000 0.85104 0.82817 0.77934 Q210_1 <.0001 <.0001 <.0001 Q210_2 0.85104 1.00000 0.91935 .80627 Q210_2 <.0001 <.0001 <.0001 Q210_3 0.82817 0.91935 1.00000 0.82069 Q210_3 <.0001 <.0001 <.0001 Q210_4 0.77934 0.80627 0.82069 1.00000 Q210_4 <.0001 <.0001 <.0001
272

Communication Cronbach Coefficient Alpha Variables Alpha Raw 0.963018 Cronbach Coefficient Alpha
with Deleted Variable
Raw Variables
Deleted Variable
Correlation with
Total
Alpha
Q25_1 0.804345 0.960933 Q25_2 0.872121 0.957013 Q25_3 0.872253 0.957009 Q25_4 0.881445 0.956521 Q25_5 0.857535 0.957873 Q25_6 0.845846 0.958658 Q25_7 0.888973 0.955987 Q25_8 0.830056 0.959509
Pearson Correlation Coefficients, N = 2230 Prob > |r| under H0: Rho=0
Q25_1 Q25_2 Q25_3 Q25_4 Q25_5 Q25_6 Q25_7 Q25_8 Q25_1 1.00000 0.68569 0.66740 0.85592 0.80746 0.63172 0.68225 0.74601Q25_1 <.0001 <.0001 <.0001 <.0001 <.0001 <.0001 <.0001 Q25_2 0.68569 1.00000 0.92684 0.75229 0.73076 0.80940 0.83409 0.69942Q25_2 <.0001 <.0001 <.0001 <.0001 <.0001 <.0001 <.0001 Q25_3 0.66740 0.92684 1.00000 0.74722 0.72492 0.82131 0.83672 0.71190Q25_3 <.0001 <.0001 <.0001 <.0001 <.0001 <.0001 <.0001 Q25_4 0.85592 0.75229 0.74722 1.00000 0.89079 0.71166 0.76017 0.78923Q25_4 <.0001 <.0001 <.0001 <.0001 <.0001 <.0001 <.0001 Q25_5 0.80746 0.73076 0.72492 0.89079 1.00000 0.69298 0.74357 0.78682Q25_5 <.0001 <.0001 <.0001 <.0001 <.0001 <.0001 <.0001 Q25_6 0.63172 0.80940 0.82131 0.71166 0.69298 1.00000 0.90331 0.71848
273

Q25_6 <.0001 <.0001 <.0001 <.0001 <.0001 <.0001 <.0001 Q25_7 0.68225 0.83409 0.83672 0.76017 0.74357 0.90331 1.00000 0.76488Q25_7 <.0001 <.0001 <.0001 <.0001 <.0001 <.0001 <.0001 Q25_8 0.74601 0.69942 0.71190 0.78923 0.78682 0.71848 0.76488 1.00000 Q25_8 <.0001 <.0001 <.0001 <.0001 <.0001 <.0001 <.0001
274

Enablement
Cronbach Coefficient Alpha Variables Alpha Raw 0.923807
Cronbach Coefficient Alpha with Deleted Variable
Raw Variables Deleted
Variable Correlation
with TotalAlpha
Q11_1 0.825009 0.909866 Q11_2 0.873143 0.867160 Q11_3 0.847137 0.889063
Pearson Correlation Coefficients, N = 2428
Prob > |r| under H0: Rho=0
Q11_1 Q11_2 Q11_3 Q11_1 1.00000 0.80793 0.77233 Q11_1 <.0001 <.0001 Q11_2 0.80793 1.00000 0.83465 Q11_2 <.0001 <.0001 Q11_3 0.77233 0.83465 1.00000 Q11_3 <.0001 <.0001
275

Fiscal Responsibility
Cronbach Coefficient Alpha Variables Alpha Raw 0.942141
Cronbach Coefficient Alpha with Deleted Variable
Raw Variables Deleted
Variable Correlation
with TotalAlpha
Q23_1 0.893624 0.904819 Q23_2 0.850575 0.938653 Q23_3 0.895121 0.903556
Pearson Correlation Coefficients, N = 1521
Prob > |r| under H0: Rho=0
Q23_1 Q23_2 Q23_3 Q23_1 1.00000 0.82463 0.88440 Q23_1 <.0001 <.0001 Q23_2 0.82463 1.00000 0.82663 Q23_2 <.0001 <.0001 Q23_3 0.88440 0.82663 1.00000 Q23_3 <.0001 <.0001
276

Importance
Cronbach Coefficient Alpha Variables Alpha Raw 0.809808
Cronbach Coefficient Alpha with Deleted Variable
Raw Variables Deleted
Variable Correlation
with TotalAlpha
Q29_1 0.696108 . Q29_2 0.696108 .
Pearson Correlation Coefficients, N = 2808
Prob > |r| under H0: Rho=0
Q29_1 Q29_2 Q29_1 1.00000 0.69611 Q29_1 <.0001 Q29_2 0.69611 1.00000 Q29_2 <.0001
277

Reliability
Cronbach Coefficient Alpha Variables Alpha Raw 0.931316
Cronbach Coefficient Alpha with Deleted Variable
Raw Variables Deleted
Variable Correlation
with TotalAlpha
Q15_1 0.790108 0.953008 Q15_2 0.891102 0.874121 Q15_3 0.898199 0.868396
Pearson Correlation Coefficients, N = 2672
Prob > |r| under H0: Rho=0
Q15_1 Q15_2 Q15_3 Q15_1 1.00000 0.76776 0.77662 Q15_1 <.0001 <.0001 Q15_2 0.76776 1.00000 0.91025 Q15_2 <.0001 <.0001 Q15_3 0.77662 0.91025 1.00000 Q15_3 <.0001 <.0001
278

Responsiveness
Cronbach Coefficient Alpha Variables Alpha Raw 0.876442
Cronbach Coefficient Alpha with Deleted Variable
Raw Variables Deleted
Variable Correlation
with TotalAlpha
Q17_1 0.781316 . Q17_2 0.781316 .
Pearson Correlation Coefficients, N = 2380
Prob > |r| under H0: Rho=0
Q17_1 Q17_2 Q17_1 1.00000 0.78132 Q17_1 <.0001 Q17_2 0.78132 1.00000 Q17_2 <.0001
279

Shared Governance Cronbach Coefficient Alpha Variables Alpha Raw 0.947884 Cronbach Coefficient Alpha
with Deleted Variable
Raw Variables Deleted
Variable Correlation
with Total Alpha
Q19_1 0.835459 0.939016 Q19_2 0.870962 0.934823 Q19_3 0.870345 0.934726 Q19_4 0.857537 0.936218 Q19_5 0.831445 0.939693 Q19_6 0.797518 0.944395 Pearson Correlation Coefficients, N = 1473
Prob > |r| under H0: Rho=0
Q19_1 Q19_2 Q19_3 Q19_4 Q19_5 Q19_6 Q19_1 1.00000 0.87727 0.81081 0.80318 0.66455 0.62888 Q19_1 <.0001 <.0001 <.0001 <.0001 <.0001 Q19_2 0.87727 1.00000 0.85145 0.83251 0.69455 0.66470 Q19_2 <.0001 <.0001 <.0001 <.0001 <.0001 Q19_3 0.81081 0.85145 1.00000 0.85691 0.71099 0.68144 Q19_3 <.0001 <.0001 <.0001 <.0001 <.0001 Q19_4 0.80318 0.83251 0.85691 1.00000 0.70098 0.66971 Q19_4 <.0001 <.0001 <.0001 <.0001 <.0001 Q19_5 0.66455 0.69455 0.71099 0.70098 1.00000 0.93603 Q19_5 <.0001 <.0001 <.0001 <.0001 <.0001 Q19_6 0.62888 0.66470 0.68144 0.66971 0.93603 1.00000 Q19_6 <.0001 <.0001 <.0001 <.0001 <.0001
280

Support
Cronbach Coefficient Alpha Variables Alpha Raw 0.897455
Cronbach Coefficient Alpha with Deleted Variable
Raw Variables Deleted
Variable Correlation
with TotalAlpha
Q13_1 0.803401 0.860243 Q13_2 0.673248 0.912114 Q13_3 0.785243 0.862791 Q13_4 0.859160 0.836790
Pearson Correlation Coefficients, N = 2548
Prob > |r| under H0: Rho=0
Q13_1 Q13_2 Q13_3 Q13_4 Q13_1 1.00000 0.60686 0.72759 0.81950 Q13_1 <.0001 <.0001 <.0001 Q13_2 0.60686 1.00000 0.59976 0.65837 Q13_2 <.0001 <.0001 <.0001 Q13_3 0.72759 0.59976 1.00000 0.78986 Q13_3 <.0001 <.0001 <.0001 Q13_4 0.81950 0.65837 0.78986 1.00000 Q13_4 <.0001 <.0001 <.0001
281
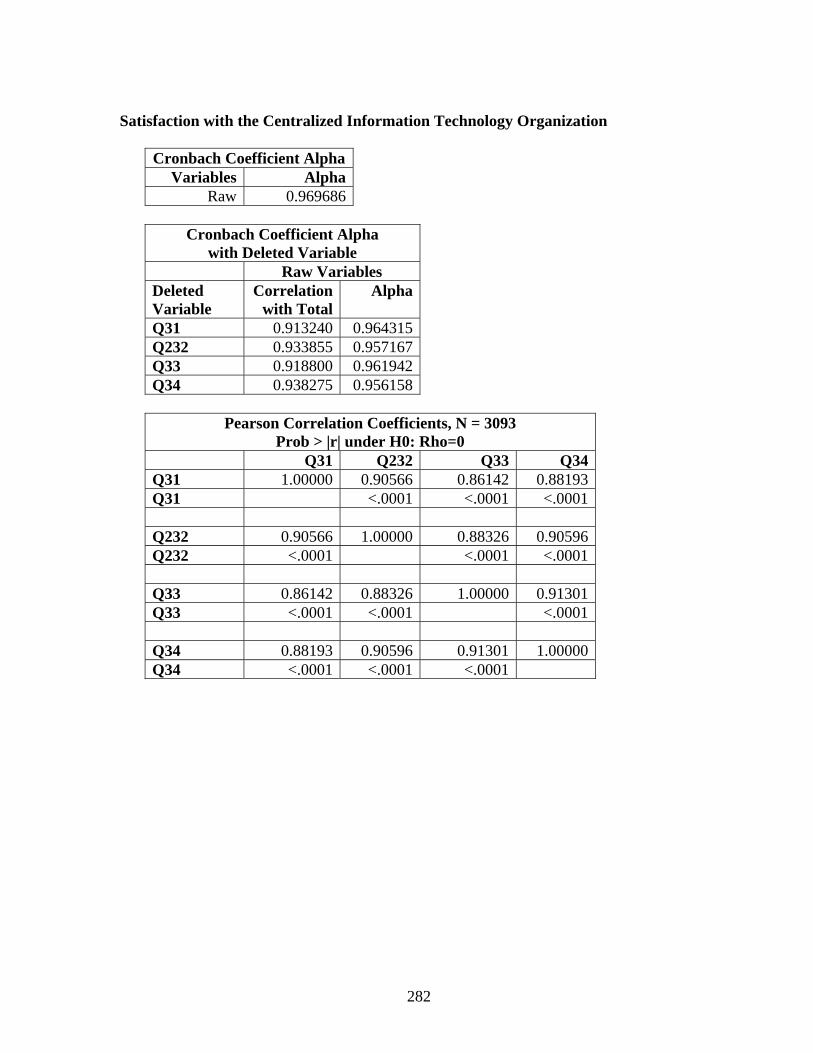
Satisfaction with the Centralized Information Technology Organization
Cronbach Coefficient Alpha Variables Alpha Raw 0.969686
Cronbach Coefficient Alpha with Deleted Variable
Raw Variables Deleted
Variable Correlation
with TotalAlpha
Q31 0.913240 0.964315 Q232 0.933855 0.957167 Q33 0.918800 0.961942 Q34 0.938275 0.956158
Pearson Correlation Coefficients, N = 3093
Prob > |r| under H0: Rho=0
Q31 Q232 Q33 Q34 Q31 1.00000 0.90566 0.86142 0.88193 Q31 <.0001 <.0001 <.0001 Q232 0.90566 1.00000 0.88326 0.90596 Q232 <.0001 <.0001 <.0001 Q33 0.86142 0.88326 1.00000 0.91301 Q33 <.0001 <.0001 <.0001 Q34 0.88193 0.90596 0.91301 1.00000 Q34 <.0001 <.0001 <.0001
282

Overall Satisfaction Satisfaction with the Chief Information Officer
Cronbach Coefficient Alpha Variables Alpha Raw 0.984968
Cronbach Coefficient Alpha with Deleted Variable
Raw Variables Deleted
Variable Correlation
with TotalAlpha
Q36 0.966961 0.977625 Q37 0.974430 0.972351 Q38 0.959446 0.982879
Pearson Correlation Coefficients, N = 1725
Prob > |r| under H0: Rho=0
Q36 Q37 Q38 Q36 1.00000 0.96638 0.94637 Q36 <.0001 <.0001 Q37 0.96638 1.00000 0.95627 Q37 <.0001 <.0001 Q38 0.94637 0.95627 1.00000 Q38 <.0001 <.0001
283

REFERENCES
Agee, A., & Holisky, D. (2003). Crossing the great divide: Implementing change by creating collaborative relationships. In B. Dewey (Ed.), Leadership, higher education, and the information age (pp. 61-80). New York: Neal-Schuman.
Albrecht, B., Bender, B., Katz, R. N., Pirani, J. A., Salaway, G., Sitko, T. D., et al. (2004). Information technology alignment in higher education. EDUCAUSE Center for Applied Research Study, 3.
Applegate, L. M., & Elam, J. J. (1992). New information systems leaders: A changing role in a changing world. MIS Quarterly, 16(4), 469-490.
Ayati, M., & Curzon, S. (2003). How to spot a CIO in trouble. EDUCAUSE Quarterly, 26(4), 18-23.
Babbie, E. (2004). The practice of social research (10th ed.). United States: Thomson Wadsworth.
Barone, C. A. (2005). Leadership, goals, & transformation: An interview with John C. Hitt. EDUCAUSE Review, 25.
Beatty, R. C., Arnett, K. P., & Liu, C. (2005). CIO/CTO job roles: An emerging organizational model. Communications of the IIMA, 5(2).
Berkman, E. (2002). The state of the CIO: Skills. Retrieved January 7, 2008, from www.cio.com/archive/030102/skills.html
Bernard, A. (2007). Availability of skills tops list of CIO concerns. Retrieved March 14, 2008, from http://www.cioupdate.com/trends/article.php/3704946
Broadbent, M., & Kitzis, E. S. (2005). The new CIO leader. Boston, Massachusetts: Harvard Business School Press.
Brooks, L. (2003). Finding the vision: Shaping technology support services in the twenty-first century institution. In B. Dewey (Ed.), Leadership, higher education and the information age (pp. 39-60). New York: Neal-Schuman.
Brown, W. (2004). A study of chief information officer effectiveness in higher education. Unpublished doctoral dissertation, Nova Southeastern University.
Brown, W. (2006). CIO effectiveness in higher education. EDUCAUSE Quarterly, 29(1), 48-53.
284

Bucher, J., Horgan, B., Moberg, T., Paterson, R., & Todd, D. (2001). The realities of a new senior-level IT position. EDUCAUSE Quarterly, 24(2), 34-38.
Burns, J. M. (1978). Leadership. New York: Harper & Row.
Caldwell, B. (1990). A new bible for MIS. Information Week, (October 15), 36-40.
Camp, J. S., DeBlois, P. B., & EDUCAUSE Current Issues Committee. (2007). Current issues survey report, 2007 EDUCAUSE.
Carnegie Foundation Staff, The. The Carnegie Foundation for the Advancement of Teaching. Retrieved April 1, 2008, from http://www.carnegiefoundation.org/index.asp
Cavanaugh, J. C. (2004). We need to reframe the IT issue. EDUCAUSE Review, 39(1), 6.
Chester, T. M. (2006). A roadmap for IT leadership and the next ten years. EDUCAUSE Quarterly, 29(2), 56-60.
Christenberry, J. (2001). Seamanship of the CIO: Fish versus cut bait or…Bail versus abandon ship! Paper presented at EDUCAUSE Southeast Regional, Orlando, FL.
Christensen, C. M., & Raynor, M. E. (2003). Why hard-nosed executives should care about management theory. Harvard Business Review, Sep; 81(9):66-74.
CIO Canada Staff. (2007). Talent crunch tops list of CIO concern. IT World Canada, March 14, 2008.
CIO Magazine Staff. Top ten concerns.CIO, Retrieved April 13, 2007, from http://www.cio.co.uk/concern/
Clark, A. J. (2005). IT governance: Determining who decides (Research Bulletin No. 24). Boulder, Colorado: EDUCAUSE Center for Applied Research.
Cohen, J. (1988). Statistical Power Analysis for the Behavioral Sciences. Hillsdale, New Jersey: Lawrence Erlbaum Associates, Inc. Cramm, S. (2005). IT marketing smarts. CIO, Retrieved 1/18, 2008, from
http://www.cio.com/article/107908/IT_Marketing_Smarts
Crawford, G., Rudy, J. A., & EDUCAUSE Current Issues Committee. (2003). Fouth annual EDUCAUSE survey identifies current IT issues. EDUCAUSE Quarterly, 26(2), 12-26.
CXOToday Staff. (2006). Gartner highlights CIO concerns. CXOToday, March 14, 2008.
DeLisi, P. (1998). CEOs look at the IT function. Featured presentation at the CIO Magazine Perspectives Conference, Orlando, FL.
285

Dewey, B. I., DeBlois, P. B., & EDUCAUSE Current Issues Committee. (2006). Current IT issues survey report, 2006. EDUCAUSE Quarterly, 29(2), 12-30.
Drabier, R. (2003). Developing a campuswide vision for use of information technology in teaching and learning. In B. Dewey (Ed.), Leadership, higher education, and the information age (pp. 3-10). New York: Neal - Schuman.
Duderstadt, J. J., Atkins, D. E., & Van Houweling, D. (2002). Higher education in the digital age: Technology issues and strategies for American colleges and universities. Westport, Ct: Oryx Press.
Earl, M. J., & Feeny, D. F. (1995). Is your CIO adding value? McKinsey Quarterly, (2), 144.
EDUCAUSE Quarterly Staff. Publication guidelines. EDUCAUSE Quarterly, Retrieved April 8, 2008, from http://connect.educause.edu/eq/contribute
Egan, M. (2004). The first 90 days. In D. Lane (Ed.), CIO wisdom: Best practices from Silicon Valley's leading IT experts (pp. 35). Upper Saddle River, New Jersey: Prentice Hall.
Feldman, J. (2003). IT leadership alchemy. Upper Saddle River, NJ: Prentice Hall.
Field, A. (2001). Boardroom strategies & tactics. CIO Insight, p.41.
Fox, B. J. (2004). Communications: Communication excellence in IT management. In D. Lane (Ed.), CIO wisdom: Best practices from Silicon Valley's leading IT experts (pp. 71). Upper Saddle River, New Jersey: Prentice Hall.
Friedman, T. L. (2005). The world is flat: A brief history of the twenty-first century (First ed.). New York: Farrar, Straus and Giroux.
Goldstein, K. L. (2007). Preparing the next IT leaders: Financial management. EDUCAUSE Quarterly, 30(2), 61-63.
Gottschalk, P. (2002). The chief information officer: A study of managerial roles in Norway. Proceedings of the 35th Hawaii International Conference on System Sciences, 8, 241.
Graeser, V., Willcocks, L., & Pisanias, N. (1998). Developing the IT scorecard. Wimbledon, London: Business Intelligence Ltd.
Green, K. Campus computing 2007. Claremont, CA: Claremont Graduate University.
Griffiths, J.M. (2003) Information technology success and best practices in higher education: 2003 independent research results. Study and Report for Collegis, Inc., June 2003.
286

Gross, G. (2006). Government CIO survey: IT security is top concern. Network World Online. Retrieved March 14, 2008, from http://www.networkworld.com/news/2006/030706-government-cio-survey.html
Haggerty, N. (2000) Understanding the link between IT project manager skills and project success research in progress. SIGCPR 2000, Evanston, IL.
Hallet, T., & Mott, R. (2003). Dell's CIO on strategy, skills, Microsoft and more: One of the top IT users in the world opens up to silicon.com. Retrieved June 1, 2003, from Silicon.com: www.silicon.com/news/500021/1/3769.html
Hawkins, B. (2004). Selecting a CIO. EDUCAUSE Review, 39(6).
Hawkins, B. (2006). 12 habits of successful IT professionals. EDUCAUSE Review, 41(1), 57-66.
Hawkins, B., & Barone, C. A. (2003). Assessing information technology: Changing the conceptual framework. Organizing and managing information resources on your campus (Polley A. McClure ed.). San Francisco: Jossey-Bass.
Hawkins, B., & Oblinger, D. G. (2005). The myth about CIOs. EDUCAUSE Review, 40(1), 12-13.
Hawkins, B., & Oblinger, D. G. (2007). The myth about managing IT: The CIO manages information technology. EDUCAUSE Review, 42(2), 10-11.
Hawkins, B., Rudy, J., & Madsen, J. (2003). EDUCAUSE core data service 2002 summary report.
Hill, A. (2007). Architecture, portfolio management, organizational development -- integrated foundations for strategy realization. In J. Stenzel (Ed.), CIO best practices: Enabling strategic value with information technology. Hoboken, New Jersey: John Wiley & Sons, Inc. p. 43.
Hoffman, T. (2007). Recruitment issues top CIO concerns: Study. Retrieved March 14, 2008, from Computer World New Zealand: http://computerworld.co.nz:80/news.nsf/printer/BE934DBDC2F61043CC2573 72000492CE
Hogue, W. F., & Dodd, D. W. (2006). Professional development for aspiring CIOs. EDUCAUSE Quarterly, 29(3), 49-50.
Hogue, W. F., & Pringle, E. M. (2005). What's next after you say hello: First steps in mentoring. EDUCAUSE Quarterly, 28(2), 50-52.
287

Hoyle, R. H. (1999). Statistical strategies for small sample research. Thousand Oaks, CA: Sage.
Hugos, M. (2007). Harnessing IT to drive enterprise strategy. In J. Stenzel (Ed.), CIO best practices: Enabling strategic value with information technology (p. 1). Hoboken, New Jersey: John Wiley & Sons, Inc.
Hugos, M., & Stenzel, J. (2007). Managing for returns on IT investments. In J. Stenzel (Ed.), CIO best practices: Enabling strategic value with information technology (p. 321). Hoboken, New Jersey: John Wiley & Sons, Inc.
Jackson, G. A. (2004). A CIO's question: Will you still need me when I'm 64? The Chronicle of Higher Education, Volume 50, Issue 21, Page B22.
Kaplan, R. S., & Norton, D. P. (1996). The balanced scorecard: Translating strategy into action. Boston: Harvard Business School Press.
Katz, R. N., Kvavik, R. B., Penrod, J. I., Pirani, J. A., Nelson, M. R., & Salaway, G. (2004). Information technology leadership in higher education: The condition of the community. EDUCAUSE Center for Applied Research Study, 1.
Kelly, T. D., & Sharif, N. M. (2005). Understanding the mindset of higher education CIOs. EDUCAUSE Quarterly, 28(4), 33-43.
Kotter, J. P. (1990). What leaders really do. Harvard Business Review, 68(May/June), 103-104.
Kuo, K. (2000). The power of mentoring. EDUCAUSE Review, 35(2), 8-11.
Kwak, M. (2001). Information technology: Technical skills, people skills: It's not either/or. MIT Sloan Management Review, 42(3), 16.
Lane, D. (2004). Foreword. In D. Lane (Ed.), CIO wisdom: Best practices from Silicon Valley's leading IT experts (pp. xxv). Upper Saddle River, New Jersey: Prentice Hall.
Lawler III, E. E. (2007). Why HR practices are not evidence-based. Academy of Management Journal, 50(5), 1033.
Leslie, K., Loch, M. A., & Schaninger, W. (2006). Managing your organization by the evidence. The McKinsey Quarterly, (3), 65.
Lin, G. (2004). The tao perspective. In D. Lane (Ed.), CIO wisdom: Best practices from silicon valley's leading IT experts (p. 51). Upper Saddle River, New Jersey: Prentice Hall.
288

Lineman, J. P. (2005). The chief information officer in higher education: A study in managerial roles. Unpublished doctoral dissertation, Capella University.
Lineman, J. P. (2007). The corporate CIO model and the higher education CIO. EDUCAUSE Quarterly, 30 (1), 4-5.
Luftman, J., Papp, R., & Brier, T. (1999). Enablers and inhibitors of business-IT alignment. Communications of the Association for Information Systems, 1(11), 1-33.
Maltz, L., DeBlois, P. B., & EDUCAUSE Current Issues Committee. (2005). Trends in current issues, 2000–2005 EDUCAUSE.
Maughan, G. (2001). Communication and information systems infrastructure. In G. Maughan (Ed.), Technology leadership: Communication and information systems in higher education (pp. 17-28). San Francisco, CA: Jossey-Bass.
McGee, M. K. (2006, September 18). What keeps CIOs awake at night? Old and new worries, says survey. Information Week.
McKenna, R. (2004). Foreword. In D. Lane (Ed.), CIO wisdom: Best practices from Silicon Valley's leading IT experts (pp. xix). Upper Saddle River, New Jersey: Prentice Hall.
Meester, G. (2004). IT organization. In D. Lane (Ed.), CIO wisdom: Best practices from Silicon Valley's leading IT experts (p. 95). Upper Saddle River, New Jersey: Prentice Hall.
Moberg, T., Bucher, J., Horgan, B., Paterson, R., & Todd, D. (2000). CIOs on the move. EDUCAUSE Quarterly, 23(3), 20-25.
Nelson, M. R. (2003). The CIO in higher education: Leadership, competencies, effectiveness. EDUCAUSE Center for Applied Research,33 (22), 1-13.
Nelson, M. R., & Green, M. W. (2003). Study on higher education information management and leadership: Questionnaire results, working paper, Lally School of Management and Technology at Rensselaer Polytechnic Institute.
Niven, P. (2007). IT performance management using the balanced scorecard. In J. Stenzel (Ed.), CIO best practices: Enabling strategic value with information technology (p. 185). Hoboken, New Jersey: John Wiley & Sons, Inc.
North Dakota Information Technology Department Staff. Definition of information technology. Retrieved April 28, 2008, from http://www.nd.gov/itd/planning/definition.html
Penrod, J. (2001). Observations from a four time CIO. Presentation at EDUCAUSE Seminar on Academic Computing, Snowmass Village, CO.
289

Penrod, J. (2003). Building an effective governance and decision-making structure for information technology. In P. McClure (Ed.), Organizing and managing information resources on your campus (pp. 15-28). San Francisco, CA: Jossey-Bass.
Pfeffer, J. (1999a). Seven practices of successful organizations part 1. Health Forum Journal, 42(1), 24-27.
Pfeffer, J. (1999b). Seven practices of successful organizations part 2. Health Forum Journal, 42(2), 55-57.
Pfeffer, J. (2007a). Testimony submitted for the record for United States House of Representatives committee on oversight and government reform, from http://www.evidence-basedmanagement.com/research_practice/commentary/pfeffer_ congressional_ testimony_08mar2007.pdf .
Pfeffer, J. (2007b). What were they thinking? Boston, Massachusetts: Harvard Business School Press.
Pfeffer, J., & Sutton, R. I. (2008a) Evidence-based management. Retrieved March, 24, 2008a, from http://www.evidence-basedmanagement.com/
Pfeffer, J., & Sutton, R. I. (2008b) Evidence-based management movements. Retrieved March, 24, 2008b, from http://www.evidence-basedmanagement.com/movements/index.html
Pfeffer, J., & Sutton, R. I. (2006a). Evidence-based management. Harvard Business Review, 84(1), 62-74.
Pfeffer, J., & Sutton, R. I. (2006b). Profiting from evidence-based management. Strategy & Leadership, 34(2), 35.
Pfeffer, J., & Sutton, R. I. (2006c). A matter of fact. People Management, 24-30.
Pfeffer, J., & Sutton, R. I. (2006d). Benchmarking: Dangerous half truths. CriticalEYE REVIEW: The Journal of Europe’s Centre for Business Leaders, (15), 1-5.
Pfeffer, J., & Sutton, R. I. (2006e). Act on facts, not faith. Stanford Social Innovation Review, 39-47.
Pfeffer, J., & Sutton, R. I. (2006f). The real brain teaser. People Management, 12(8), 28.
Pfeffer, J., & Sutton, R. I. (2006g). Sometimes less is more. Leadership Excellence, 23(3), 14-15.
Pfeffer, J., & Sutton, R. I. (2006h). Hard facts dangerous half-truths and total nonsense. Boston, Massachusetts: Harvard Business School Press.
290

Pfeffer, J., & Sutton, R. I. (2007). Suppose we took evidence-based management seriously: Implications for reading and writing management. Academy of Management Learning & Education, 6(1), 153-158.
Pfeffer, J., & Veiga, J. F. (1999). Putting people first for organizational success. The Academy of Management Executive, 13(2), 37-47.
Pirani, J. A. (2004). Information technology alignment in higher education, EDUCAUSE Center for Applied Research, 1-10.
Poley, J. (2001). Leadership. In G. Maughan (Ed.), Technology leadership: Communication and information systems in higher education (pp. 83-94). San Francisco, CA: Jossey-Bass.
Post, G. V., & Anderson, D. L. (2003). Management information systems: Solving business problems with information technology. San Francisco: McGraw-Hill Irwin.
Prewitt, E. (2005, February 1). What will it take for CIOs to succeed in 2005? CIO Magazine, 37.
Reich, B. H., & Nelson, K. M. (2003). In their own words: CIO visions about the future of in-house IT organizations. The DATA BASE for Advances in Information Systems, 34(4), 28-44.
Renaud, R., & Murray, A. (2003). Organizing for leadership: How university libraries can meet the leadership challenge in higher education. In B. Dewey (Ed.), Leadership, higher education, and the information age (pp. 163-180). New York: Neal-Schuman.
Robbins, S., & Pappas, A. (2004). Within and beyond: Understanding the role of the CIO. In D. Lane (Ed.), CIO wisdom: Best practices from silicon valley's leading IT experts (p. 1). Upper Saddle River, New Jersey: Prentice Hall.
Ross, J. W., & Weill, P. (2002). Six IT decisions your IT people shouldn't make. Harvard Business Review, 80(11), 84-91.
Rothfeder, J., & Driscoll, L. (1990, February, 26). CIO is starting to stand for `Career is over'. Business Week, (3147) 78-80.
Rousseau, D. (2006). Is there such a thing as "evidence-based management"? Academy of Management Review, 31(2), 256-269.
Rousseau, D., & McCarthy, S. (2007). Educating managers from an evidence-based perspective. Academy of Management Learning & Education, 6(1), 84-101.
291

Sabherwal, R., & Kirs, P. (1992). The alignment between organizational critical success factors and IT capability in academic institutions. Decision Sciences, 25(2), 301. Schaffer, C. J. (2004). The formal educational and career experiences perceived to be
important for the success of a CIO in higher education. Unpublished doctoral dissertation, The University of Toledo.
Schubert, K. D. (2004). CIO survival guide the roles and responsibilities of the chief information officer. Hoboken, New Jersey: John Wiley & Sons, Inc.
Seddon, P. B., Graeser, V., & Willcocks, L. P. (2002). Measuring organizational IS effectiveness: An overview and update of senior management perspectives. The DATA BASE for Advances in Information Systems 33, (2), 11-28.
Smaltz, D. (1999). Antecedents of CIO effectiveness: A role-based perspective. Unpublished Doctoral, Florida State University.
Smet, A. D., Loch, M. A., & Schaninger, W. (2007a). The link between profits and organizational performance. The McKinsey Quarterly, (3), 6-8.
Smet, A. D., Palmer, R., & Schaninger, W. (2007b). The missing link: Connecting organizational and financial performance. Unpublished manuscript.
Smith, G. S. (2006). Straight to the top: Becoming a world-class CIO. Hoboken, New Jersey: John Wiley & Sons, Inc.
Stenzel, J. (Ed.). (2007). CIO best practices: Enabling strategic value with information technology. Hoboken, New Jersey: John Wiley & Sons, Inc.
Stenzel, J., & Stenzel, C. (1997). Implementing IT performance measurement: An interview with Dr. Bruce Kavan. Journal of Strategic Performance Management 1, (6), 14.
Synott, W. R., & Gruber, W. H. (1981). Information resource management: Opportunities and strategies for the 1980's. New York, New York: John Wiley and Sons.
Vavra, M., & Lane, D. (2004). Strategic planning. In D. Lane (Ed.), CIO wisdom: Best practices from Silicon Valley's leading IT experts (pp. 223-251). Upper Saddle River, New Jersey: Prentice Hall.
Waggener, S., & Zoppi, S. (2004). The metrics of IT: Management by measurement. In D. Lane (Ed.), CIO wisdom: Best practices from Silicon Valley's leading IT experts (pp. 355). Upper Saddle River, New Jersey: Prentice Hall.
Wang, C. (1997). Techno vision 2. New York: McGraw-Hill.
292

293
Ward, D., & Hawkins, B. (2003). Presidential leadership for information technology. EDUCAUSE Review, 38(3), 36-47.
Ware, L. (2003a). By the numbers. CIO, 20.
Ware, L. (2003b) The state of the CIO 2003. CIO, 67.
Webb, M. (2004). Foreword. In D. Lane (Ed.), CIO wisdom: Best practices from Silicon Valley's leading IT experts (pp. xxiii). Upper Saddle River, New Jersey: Prentice Hall.
Weill, P., & Ross, J. W. (2004). IT governance: How top performers manage IT decision rights for superior results. Cambridge: Harvard Business School Press.
Weill, P., & Woodham, R. (2002). Don't just lead, govern: Implementing effective IT governance, No. CISR WP No. 326, Cambridge, Massachusetts: MIT Sloan School of Management.
White, T. (2001). Reinventing the IT department. Woburn, MA: Butterworth-Heinemann. Worthen, B. (2002). And now for the good news. CIO Magazine, 54-59.
Zastrocky, M., & Schlier, F. (2000). The higher education CIO in the 21st century. EDUCAUSE Quarterly, (1), 53-59.