Embed Size (px)
Citation preview

MASTER THESIS
STRUCTURAL CHARACTERISATION AND PERFORMANCE
EVALUATION OF THE FAILED MANAFWA HISTORIC
BRIDGE IN UGANDA
MASTER OF SCIENCE IN CIVIL ENGINEERING
(STRUCTURAL OPTION)
IGA DAN - CE300-0006/2015
Thesis Submitted to the Pan African University – Institute of Science, Technology
and Innovation in Partial Fulfilment of the Requirement for Award of the Degree
of Master of Science in Civil Engineering.
MAY 2018

PAUSTI Civil Engineering, Master’s Thesis i
DECLARATION
I, IGA DAN, the undersigned do solemnly declare to the best of my knowledge and effort that
was initiated by me and unless otherwise referenced, the contents have never been submitted to
any university for any academic achievements.
Signature …………………………………. Date ……………………………………...
Iga Dan
This Research Thesis has been submitted with our approval as University supervisors:
Signature……………………………… Date……………………………………
Dr. (Eng.) Timothy Nyomboi
Department of Civil and Structural Engineering, Moi University, Kenya
Signature ………………………………… Date ………………………………….
Prof. (Eng.) Richard Ocharo Onchiri
Department of Building and Civil Engineering, Technical University of Mombasa
Signature ………………………………… Date ………………………………………….
Dr. Moses Matovu
College of Engineering, Design, Art and Technology, Makerere University

PAUSTI Civil Engineering, Master’s Thesis ii
DEDICATION
To
My dear mummy,
Miss Naluyima Miriam N.
She single handedly sacrificed and struggled to bring me thus far; without her, am not. I LOVE U

PAUSTI Civil Engineering, Master’s Thesis iii
ACKNOWLEDGEMENTS
There are very many people I would like to thank, especially the following;
• The Almighty God for having given me the greatest gift of Life to go through the
Research period successfully and for sparing my life to ensure that I finish my studies.
• To the Pan African University – PAU that is committed to the provision of the
opportunity for advanced graduate training and postgraduate research to high-performing
African students through the PAU scholarship grants, without this scholarship I wouldn’t
have gotten the privilege of pursuing this MSc.
• To my Research Project supervisors, Dr. T. Nyomboi, Prof. Richard Ocharo and Dr.
Matovu Moses, am very indebted for the technical advice, support, encouragement,
counsel and guidance.
• To my classmates; Almaleh Abubaker, Leolin Deffo Deffo Rostand, Nathalie Mao,
Idowu Temitope Ezekiel and Ismael Ouedrago; you guys are amazing and I am very
fortunate to have spent my time with great men and lady who will greatly impact the
African Continent with advances in the Civil Engineering fraternity.
• To the entire PAU fraternity, from the Director, all my lecturers, the Structural laboratory
of JKUAT laboratory technicians Mr. Obadiah and Mr. Karugu, the technicians from the
Structural Laboratory of Makerere University Mr. Ntume William and Mr. Kanamwanjje
and my classmates. Thanks for your support.
• My great mother Miss. Naluyima Miriam and my whole family for the great support and
encouragement they offered me. And in addition, my work supervisors Eng. Christopher
Manyindo and Eng. Phillip Kitimba Patrick for your support and counsel. Your
contributions cannot go unnoticed.
PAUSTI Civil Engineering, Master’s Thesis iv
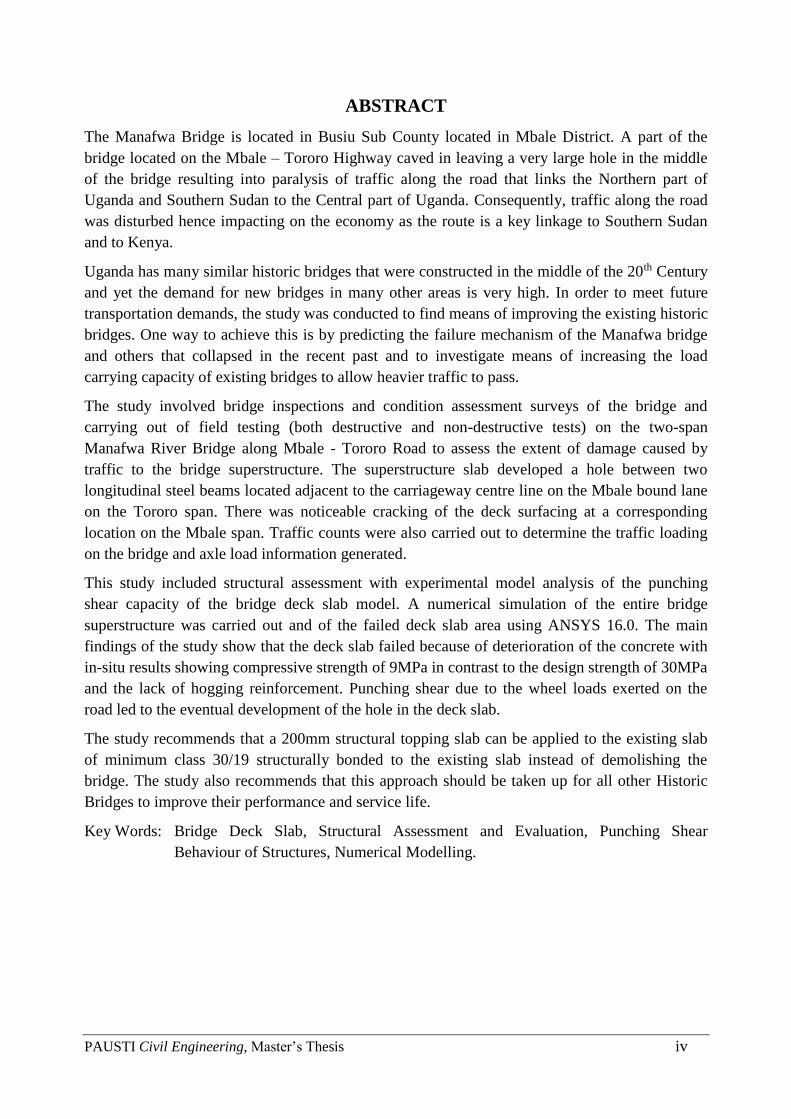
ABSTRACT
The Manafwa Bridge is located in Busiu Sub County located in Mbale District. A part of the
bridge located on the Mbale – Tororo Highway caved in leaving a very large hole in the middle
of the bridge resulting into paralysis of traffic along the road that links the Northern part of
Uganda and Southern Sudan to the Central part of Uganda. Consequently, traffic along the road
was disturbed hence impacting on the economy as the route is a key linkage to Southern Sudan
and to Kenya.
Uganda has many similar historic bridges that were constructed in the middle of the 20th Century
and yet the demand for new bridges in many other areas is very high. In order to meet future
transportation demands, the study was conducted to find means of improving the existing historic
bridges. One way to achieve this is by predicting the failure mechanism of the Manafwa bridge
and others that collapsed in the recent past and to investigate means of increasing the load
carrying capacity of existing bridges to allow heavier traffic to pass.
The study involved bridge inspections and condition assessment surveys of the bridge and
carrying out of field testing (both destructive and non-destructive tests) on the two-span
Manafwa River Bridge along Mbale - Tororo Road to assess the extent of damage caused by
traffic to the bridge superstructure. The superstructure slab developed a hole between two
longitudinal steel beams located adjacent to the carriageway centre line on the Mbale bound lane
on the Tororo span. There was noticeable cracking of the deck surfacing at a corresponding
location on the Mbale span. Traffic counts were also carried out to determine the traffic loading
on the bridge and axle load information generated.
This study included structural assessment with experimental model analysis of the punching
shear capacity of the bridge deck slab model. A numerical simulation of the entire bridge
superstructure was carried out and of the failed deck slab area using ANSYS 16.0. The main
findings of the study show that the deck slab failed because of deterioration of the concrete with
in-situ results showing compressive strength of 9MPa in contrast to the design strength of 30MPa
and the lack of hogging reinforcement. Punching shear due to the wheel loads exerted on the
road led to the eventual development of the hole in the deck slab.
The study recommends that a 200mm structural topping slab can be applied to the existing slab
of minimum class 30/19 structurally bonded to the existing slab instead of demolishing the
bridge. The study also recommends that this approach should be taken up for all other Historic
Bridges to improve their performance and service life.
Key Words: Bridge Deck Slab, Structural Assessment and Evaluation, Punching Shear
Behaviour of Structures, Numerical Modelling.
PAUSTI Civil Engineering, Master’s Thesis v
TABLE OF CONTENTS:
DECLARATION ........................................................................................................................... I
DEDICATION .............................................................................................................................. II
ACKNOWLEDGEMENTS ....................................................................................................... III
ABSTRACT ................................................................................................................................. IV
TABLE OF CONTENTS: ............................................................................................................ V
LIST OF FIGURES ................................................................................................................. VIII
LIST OF PLATES ...................................................................................................................... IX
LIST OF TABLES ........................................................................................................................ X
CHAPTER 1. INTRODUCTION ................................................................................................. 1
1.1 BACKGROUND TO THE STUDY .................................................................................... 1
1.2 STATEMENT OF THE RESEARCH PROBLEM .............................................................. 1
1.3 RESEARCH OBJECTIVES ................................................................................................ 3
1.3.1 Main Objectives ........................................................................................................... 3
1.3.2 Specific Objectives ....................................................................................................... 3
1.4 SCOPE OF WORK .............................................................................................................. 3
1.5 JUSTIFICATION ................................................................................................................ 3
CHAPTER 2. LITERATURE REVIEW ..................................................................................... 5
2.1 INTRODUCTION – BRIDGE TYPES AND CHARACTERISTICS ................................. 5
2.1.1 Simply supported Beam/Girder bridges ...................................................................... 5
2.1.2 Arch bridge .................................................................................................................. 6
2.1.3 The suspension bridge ................................................................................................. 6
2.1.4 Steel truss bridges ........................................................................................................ 7
2.1.5 Types of bridge decks ................................................................................................... 7
2.2 BRIDGE STRUCTURAL ANALYSIS ............................................................................... 8
2.2.1 Common structural and material defects (concrete) in bridge structures .................. 9
2.2.2 Non Destructive Testing of Bridge............................................................................... 9
2.2.3 Schmidt Rebound Hammer Test ................................................................................. 11
2.2.4 Core Test .................................................................................................................... 11
2.3 STRUCTURAL RESPONSE OF REINFORCED CONCRETE SLABS ......................... 12
2.3.1 Failure Modes ............................................................................................................ 12
2.3.2 Punching shear failure mechanism............................................................................ 13
2.3.3 Review of research carried out and experimental model for reinforced concrete
slabs ................................................................................................................................... 14
2.3.4 FIELD TEST OF A BRIDGE DECK SLAB ............................................................... 15
2.4 FINITE ELEMENT METHOD ......................................................................................... 17
2.4.1 The finite element method and element formulations ................................................ 17
2.4.2 Finite element modelling and analysis of reinforced-concrete bridge decks ............ 17
PAUSTI Civil Engineering, Master’s Thesis vi
2.4.3 Finite element modelling and analysis using ABACUS ............................................. 18
2.4.4 Numerical Modelling and Validation of Composite Bridge Decking ........................ 18
2.4.5 Finite element analysis of a composite bridge deck .................................................. 21
2.5 RESEARCH GAP – MANAFWA BRIDGE COMPARISONS TO TESTED BRIDGES 22
CHAPTER 3. RESEARCH METHODOLOGY ...................................................................... 24
3.1 INTRODUCTION ............................................................................................................. 24
3.2 STRUCTURAL CHARACTERIZATION OF THE FAILED HISTORIC BRIDGE ........ 24
3.2.1 Desk study and site reconnaissance of the Manafwa Bridge..................................... 24
3.2.2 Condition Assessment Survey .................................................................................... 25
3.2.3 Non – Destructive Testing using Rebound Hammer .................................................. 25
3.2.4 Destructive Testing using Coring .............................................................................. 27
3.2.5 Structural Steel Reinforcement –Tensile Strength Tests ............................................ 28
3.3 NUMERICAL ANALYSIS OF THE HISTORIC BRIDGE .............................................. 28
3.3.1 Introduction ............................................................................................................... 28
3.3.2 FEM Input Data ......................................................................................................... 29
3.3.3 Bridge Loads determination - Traffic inventory and assessment .............................. 29
3.3.4 ANSYS Modelling ....................................................................................................... 29
3.4 EXPERIMENTAL MODELLING OF THE BRIDGE DECK SLAB .................................................. 31
3.4.1 Definition of the scope of the problem/experimental testing ..................................... 31
3.4.2 Specifying of similitude requirements for geometry, materials and loading ............. 31
3.4.3 Sizing of the physical model....................................................................................... 31
3.4.4 Selection of Model Materials ..................................................................................... 32
3.4.5 Fabrication phase of the Deck Slabs ......................................................................... 32
3.4.6 Instrumentation and recording equipment for displacements and forces ................. 33
3.4.7 Loading Systems and Conditions ............................................................................... 33
CHAPTER 4. RESULTS, DISCUSSION AND ANALYSIS ................................................... 35
4.1 STRUCTURAL CHARACTERIZATION OF THE FAILED HISTORIC BRIDGE ........ 35
4.1.1 Conditional Assessment Survey of the Bridge ........................................................... 35
4.1.2 Bridge Superstructure Geometry ............................................................................... 36
4.1.3 Steel I-Beam Section .................................................................................................. 37
4.1.4 Visual Inspection photography .................................................................................. 38
4.1.5 Schmidt’s Rebound Hammer Test Results ................................................................. 39
4.1.6 Destructive Test Results - Core Test .......................................................................... 40
4.1.7 Structural Steel tensile strength Tests ........................................................................ 41
4.2 STRUCTURAL EVALUATION AND ASSESSMENT ................................................... 43
4.2.1 Superstructure Slab Shear Capacity Under Concentrated Loads ............................. 43
4.2.2 Superstructure Slab Moment Capacity ...................................................................... 46
4.3 EXPERIMENTAL MODEL - LABORATORY RESULTS OBTAINED ........................ 48
4.3.1 Concrete Mix Design for the 30MPa and 13MPa Deck Slabs .................................. 48
4.3.2 28MPa Deck Slab (depicting the Design bridge condition): ..................................... 49
4.3.3 13MPa Deck Slab (depicting the Design bridge condition): ..................................... 51
PAUSTI Civil Engineering, Master’s Thesis vii
4.4 NUMERICAL ANALYSIS OF THE HISTORIC BRIDGE .............................................. 53
4.4.1 Total Deformation of the entire bridge (Global Solution) ......................................... 54
4.4.2 Total Deformation of the Failed Bridge element (Particular Solution) .................... 55
4.5 COMPARISON OF EXPERIMENTAL AND NUMERICAL ANALYSIS RESULTS ... 56
4.5.1 The Numerical analysis of the bridge failure model.................................................. 56
4.5.2 Structural Failure Mechanism using the Experimental Model ................................. 57
CHAPTER 5. CONCLUSION AND RECOMMENDATION ................................................ 59
5.1 CONCLUSIONS ............................................................................................................... 59
5.2 RECOMMENDATIONS ................................................................................................... 59
5.2.1 Recommendations of the Research ............................................................................ 59
5.2.2 Recommended Areas for Further Research ............................................................... 60
REFERENCES............................................................................................................................. 61
APPENDIX ................................................................................................................................... 66
APPENDIX A. STRUCTURAL CHARACTERISATION TEST RESULTS FROM THE
REBOUND HAMMER ............................................................................................................. 66
APPENDIX B. DESTRUCTIVE TEST RESULTS FROM THE CORES TAKEN .................. 68
APPENDIX C. STRUCTURAL STEEL LABORATORY TEST RESULTS ........................... 69
APPENDIX E. NUMERICAL ANALYSIS DATA .................................................................. 71
APPENDIX F. NUMERICAL ANALYSIS RESULTS DURING EVALUATION ................. 72
APPENDIX G. EXPERIMENTAL TEST RESULTS ............................................................... 76
APPENDIX H. STANDARD VEHICLE CLASSIFICATION CHART ................................... 79
APPENDIX I. FORM FOR MANUAL CLASSIFIED TRAFFIC COUNTS ............................ 80
APPENDIX J. TRAFFIC DATA COLLECTED AND ANALYSED ....................................................... 80
APPENDIX K. EQUIPMENT LIST FOR TRAFFIC COUNT AND/OR AXLE LOAD
SURVEY ........................................................................................................................... 82
APPENDIX L. ........ CONCRETE MIX DESIGN – SAMPLE FORM USED AND MATERIAL
RESULTS ........................................................................................................................... 83
APPENDIX M. .... BRIDGE INSPECTION REPORT – FILLED CONDITION ASSESSMENT
SURVEY FORM ....................................................................................................................... 85
PAUSTI Civil Engineering, Master’s Thesis viii
LIST OF FIGURES
Figure 2-1 Simply supported I-girder bridge structure ................................................................... 5
Figure 2-2 The Old Trails Arch Bridge ........................................................................................... 6
Figure 2-3 Nile River suspension bridge being constructed in Uganda ......................................... 6
Figure 2-4 Steel Truss bridge layout ............................................................................................... 7
Figure 2-5 Solid Slab ....................................................................................................................... 7
Figure 2-6 Voided Slab .................................................................................................................... 8
Figure 2-7 Beam and Slab ............................................................................................................... 8
Figure 2-8 Typical composite deck .................................................................................................. 8
Figure 2-10 Punching shear failure section in concrete deck due to concentrated load .............. 13
Figure 2-11 Punching shear failure on the underside of the bridge deck due to concentrated load
....................................................................................................................................................... 13
Figure 2-12 Example of finite element structural analysis model of a double beam bridge ......... 17
Figure 2-2 7600 tri-axle dump trucks used for live-load test. ....................................................... 20
Figure 2-3 Service load deflection................................................................................................. 20
Figure 2-4 Tsai-Hill Index (R) (√ (ITH)) (LRFD) ........................................................................... 21
Figure 2-13 Geometry of the tested bridge (Shu, 2014). ............................................................... 23
Figure 2-14 Failed bridge deck slab after shear failure ............................................................... 23
Figure 3-1 A detailed overview of the research process ............................................................... 24
Figure 3-2 Conversion curve for the average compressive strength measured on cylinders. ...... 26
Figure 3-3 Full bridge model as applied in the ANSYS program (Isometric 3-D view) ............... 30
Figure 3-4 Failed Deck slab Model ............................................................................................... 30
Figure 3-5 Processing of the Mathematical ANSYS solution ongoing .......................................... 31
Figure 4-1 Manafwa River Bridge superstructure cross section .................................................. 36
Figure 4-2 Steel beam cross section .............................................................................................. 37
Figure 4-3 In-Situ Concrete Strength Test Results From The Schmidt Rebound Hammer ........... 39
Figure 4-4 Summary of the core compressive strength results of the deck slab ........................... 40
Figure 4-5 Field Crushing compressive strength of cylindrical cores obtained from the deck slab
of the Manafwa Bridge .................................................................................................................. 41
Figure 4-6 Tensile strength of the reinforcement bars .................................................................. 42
Figure 4-7 Chemical Analysis of Reinforcement Bars Tested in Accordance with BS 4449:2005
....................................................................................................................................................... 43
Figure 4-8 Shear Perimeter ........................................................................................................... 44
Figure 4-9 Sieve analysis result of the sand .................................................................................. 49
Figure 4-10 Sieve analysis result of the gravel ............................................................................. 49
Figure 4-11 Graph for the Experimental mid-span deflection of the 28-day Deck Slab ............... 50
Figure 4-12 Graph for the Experimental mid-span deflection of the 13MPa Deck Slab .............. 53
Figure 4-13 Total Deformation of the superstructure deck slab system (Top view) ..................... 54
Figure 4-14 Total Deformation shown using contour lines of the superstructure deck slab system
....................................................................................................................................................... 54
Figure 4-153 Von Misses Failure Criterion showing maximum stresses concentration .............. 56
PAUSTI Civil Engineering, Master’s Thesis ix
LIST OF PLATES
Plate 1-1 Collapse of the Mitooma Bridge and the Aswa Bridge respectively ................................ 2
Plate 1-2 Failure of the Manafwa Historic bridge .......................................................................... 2
Plate 2-1 Traffic load tests to determine load capacity of composite decking .............................. 19
Plate 3-1 Schmidt Rebound Hammer used for the in-situ testing of the compressive strength ..... 26
Plate 3-2 Core Testing being done on the deck's slab ................................................................... 28
Plate 3-3 Project Schematic indicating completion of the analysis .............................................. 30
Plate 3-4 Experimental model scaled down using a geometric scale of 2 .................................... 32
Plate 3-5 Fabrication process of the Deck Slab model in the laboratory ..................................... 33
Plate 3-6 Transducer being configured prior to testing and Loading using a Load cell. ............. 34
Plate 3-7 Strain gauges connected to the transducer and the LVDT connected to the Loading
Cell to measure deflection at the centre of the slab. ...................................................................... 34
Plate 4-1 Bridge geometry as observed on site ............................................................................. 36
Plate 4-2 No hogging reinforcement in the slab, the concrete looks generally weak with a higher
percentage of coarse materials ...................................................................................................... 37
Plate 4-3 Bridge underside showing steel beams and pier. ........................................................... 38
Plate 4-4 Manafwa River Bridge superstructure cross section immediately after the failure. ..... 38
Plate 4-5 Transverse cracks in deck surfacing and concrete patching. ........................................ 38
Plate 4-6 Opening in superstructure slab showing longitudinal steel beam, bottom reinforcement,
disintegrated concrete layer and gravel layer under surfacing. ................................................... 39
Plate 4-7 Progressive failure of the deck slab with longitudinal cracks increasing in size till
failure. ............................................................................................................................................ 50
Plate 4-8 Failed Deck Slab – design strength of 30MPa. ............................................................. 51
Plate 4-9 Progressive failure of the deck during the testing with punching shear observed ........ 51
Plate 4-10 Total failure of the deck slab indicating that punching shear behaviour observed in
the 13MPa deck slab was the main cause of failure for this model............................................... 52
Plate 4-11 Failed Deck Slab – Indicates that the main cause of failure is punching shear
regardless of the load but rather longitudinal cracking in the deck slab ...................................... 53
Plate 4-12 Total deformations of the failed bridge element .......................................................... 55
Plate 4-13 Failure in the Model compared to the actual failure in the bridge deck slab ............. 57
Plate 4-14 Bottom surface Failure of the Experimental model 13MPa deck slab vs Actual Bridge
structure ......................................................................................................................................... 58
PAUSTI Civil Engineering, Master’s Thesis x
LIST OF TABLES
Table 2-1 Studies undertaken on RC slabs to determine punching shear failure.......................... 14
Table 2-2 Field Experimentation tests of RC bridge deck slabs subjected to shear failure. ......... 15
Table 3-1 Correction factor for length to diameter ratios less than 1.75 ..................................... 27
Table 4-1 Punching shear capacity of existing superstructure slab for loading applied at the
middle point of the slab. ................................................................................................................. 46
Table 4-2 Ultimate Limit State Sagging moment capacity of the Existing slab ............................ 47
Table 4-3 — Ultimate bending moment and shear forces in one-way spanning slabs ................. 47
Table 4-4 Superstructure slab applied moments ........................................................................... 47
PAUSTI Civil Engineering, Master’s Thesis 1
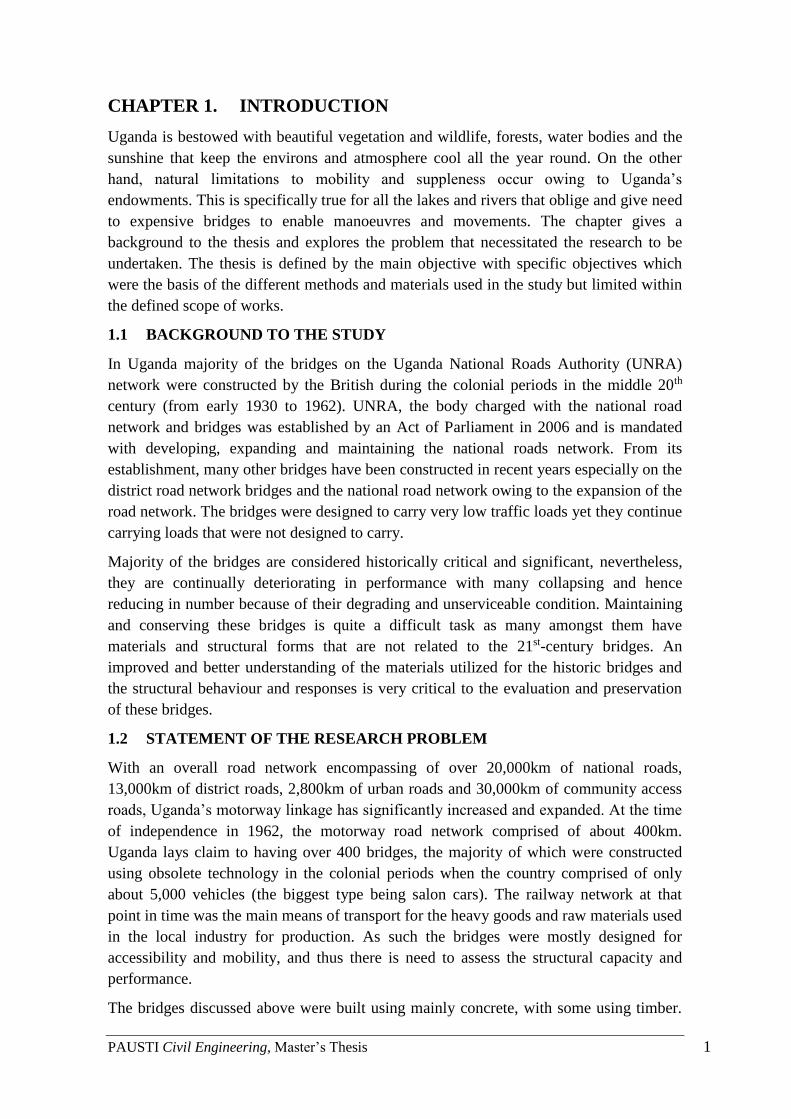
CHAPTER 1. INTRODUCTION
Uganda is bestowed with beautiful vegetation and wildlife, forests, water bodies and the
sunshine that keep the environs and atmosphere cool all the year round. On the other
hand, natural limitations to mobility and suppleness occur owing to Uganda’s
endowments. This is specifically true for all the lakes and rivers that oblige and give need
to expensive bridges to enable manoeuvres and movements. The chapter gives a
background to the thesis and explores the problem that necessitated the research to be
undertaken. The thesis is defined by the main objective with specific objectives which
were the basis of the different methods and materials used in the study but limited within
the defined scope of works.
1.1 BACKGROUND TO THE STUDY
In Uganda majority of the bridges on the Uganda National Roads Authority (UNRA)
network were constructed by the British during the colonial periods in the middle 20th
century (from early 1930 to 1962). UNRA, the body charged with the national road
network and bridges was established by an Act of Parliament in 2006 and is mandated
with developing, expanding and maintaining the national roads network. From its
establishment, many other bridges have been constructed in recent years especially on the
district road network bridges and the national road network owing to the expansion of the
road network. The bridges were designed to carry very low traffic loads yet they continue
carrying loads that were not designed to carry.
Majority of the bridges are considered historically critical and significant, nevertheless,
they are continually deteriorating in performance with many collapsing and hence
reducing in number because of their degrading and unserviceable condition. Maintaining
and conserving these bridges is quite a difficult task as many amongst them have
materials and structural forms that are not related to the 21st-century bridges. An
improved and better understanding of the materials utilized for the historic bridges and
the structural behaviour and responses is very critical to the evaluation and preservation
of these bridges.
1.2 STATEMENT OF THE RESEARCH PROBLEM
With an overall road network encompassing of over 20,000km of national roads,
13,000km of district roads, 2,800km of urban roads and 30,000km of community access
roads, Uganda’s motorway linkage has significantly increased and expanded. At the time
of independence in 1962, the motorway road network comprised of about 400km.
Uganda lays claim to having over 400 bridges, the majority of which were constructed
using obsolete technology in the colonial periods when the country comprised of only
about 5,000 vehicles (the biggest type being salon cars). The railway network at that
point in time was the main means of transport for the heavy goods and raw materials used
in the local industry for production. As such the bridges were mostly designed for
accessibility and mobility, and thus there is need to assess the structural capacity and
performance.
The bridges discussed above were built using mainly concrete, with some using timber.
PAUSTI Civil Engineering, Master’s Thesis 2
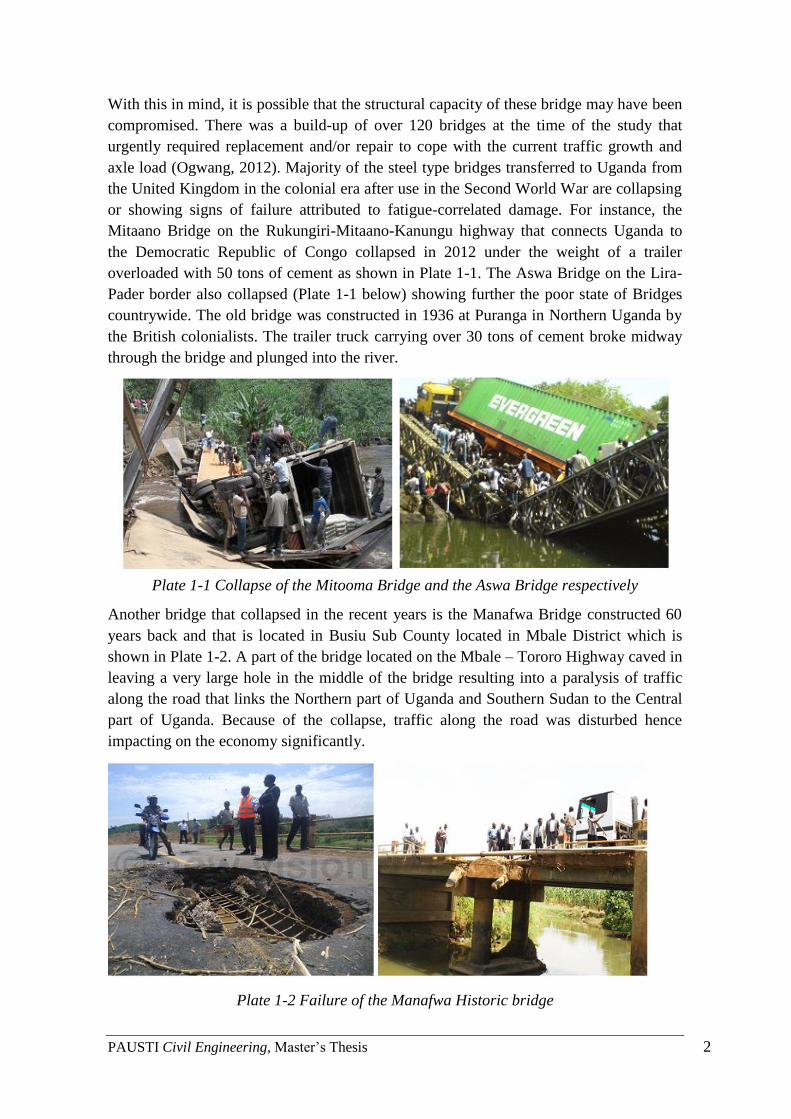
With this in mind, it is possible that the structural capacity of these bridge may have been
compromised. There was a build-up of over 120 bridges at the time of the study that
urgently required replacement and/or repair to cope with the current traffic growth and
axle load (Ogwang, 2012). Majority of the steel type bridges transferred to Uganda from
the United Kingdom in the colonial era after use in the Second World War are collapsing
or showing signs of failure attributed to fatigue-correlated damage. For instance, the
Mitaano Bridge on the Rukungiri-Mitaano-Kanungu highway that connects Uganda to
the Democratic Republic of Congo collapsed in 2012 under the weight of a trailer
overloaded with 50 tons of cement as shown in Plate 1-1. The Aswa Bridge on the Lira-
Pader border also collapsed (Plate 1-1 below) showing further the poor state of Bridges
countrywide. The old bridge was constructed in 1936 at Puranga in Northern Uganda by
the British colonialists. The trailer truck carrying over 30 tons of cement broke midway
through the bridge and plunged into the river.
Plate 1-1 Collapse of the Mitooma Bridge and the Aswa Bridge respectively
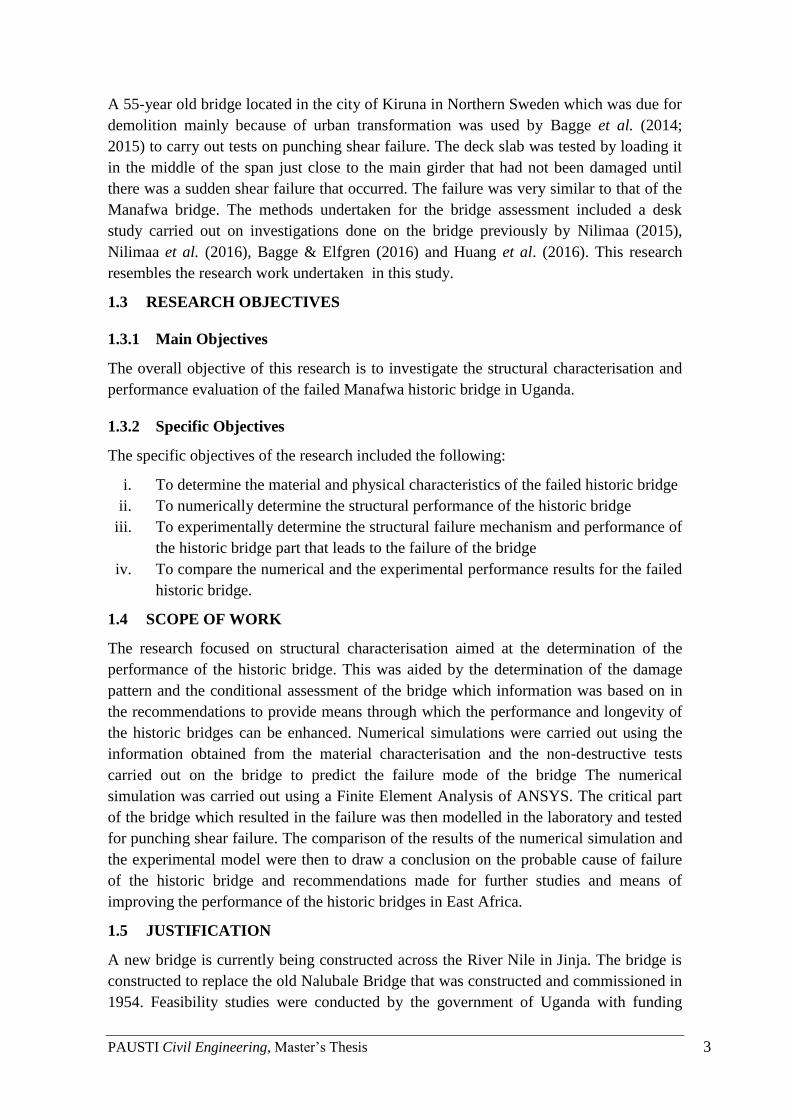
Another bridge that collapsed in the recent years is the Manafwa Bridge constructed 60
years back and that is located in Busiu Sub County located in Mbale District which is
shown in Plate 1-2. A part of the bridge located on the Mbale – Tororo Highway caved in
leaving a very large hole in the middle of the bridge resulting into a paralysis of traffic
along the road that links the Northern part of Uganda and Southern Sudan to the Central
part of Uganda. Because of the collapse, traffic along the road was disturbed hence
impacting on the economy significantly.
Plate 1-2 Failure of the Manafwa Historic bridge
PAUSTI Civil Engineering, Master’s Thesis 3
A 55-year old bridge located in the city of Kiruna in Northern Sweden which was due for
demolition mainly because of urban transformation was used by Bagge et al. (2014;
2015) to carry out tests on punching shear failure. The deck slab was tested by loading it
in the middle of the span just close to the main girder that had not been damaged until
there was a sudden shear failure that occurred. The failure was very similar to that of the
Manafwa bridge. The methods undertaken for the bridge assessment included a desk
study carried out on investigations done on the bridge previously by Nilimaa (2015),
Nilimaa et al. (2016), Bagge & Elfgren (2016) and Huang et al. (2016). This research
resembles the research work undertaken in this study.
1.3 RESEARCH OBJECTIVES
1.3.1 Main Objectives
The overall objective of this research is to investigate the structural characterisation and
performance evaluation of the failed Manafwa historic bridge in Uganda.
1.3.2 Specific Objectives
The specific objectives of the research included the following:
i. To determine the material and physical characteristics of the failed historic bridge
ii. To numerically determine the structural performance of the historic bridge
iii. To experimentally determine the structural failure mechanism and performance of
the historic bridge part that leads to the failure of the bridge
iv. To compare the numerical and the experimental performance results for the failed
historic bridge.
1.4 SCOPE OF WORK
The research focused on structural characterisation aimed at the determination of the
performance of the historic bridge. This was aided by the determination of the damage
pattern and the conditional assessment of the bridge which information was based on in
the recommendations to provide means through which the performance and longevity of
the historic bridges can be enhanced. Numerical simulations were carried out using the
information obtained from the material characterisation and the non-destructive tests
carried out on the bridge to predict the failure mode of the bridge The numerical
simulation was carried out using a Finite Element Analysis of ANSYS. The critical part
of the bridge which resulted in the failure was then modelled in the laboratory and tested
for punching shear failure. The comparison of the results of the numerical simulation and
the experimental model were then to draw a conclusion on the probable cause of failure
of the historic bridge and recommendations made for further studies and means of
improving the performance of the historic bridges in East Africa.
1.5 JUSTIFICATION
A new bridge is currently being constructed across the River Nile in Jinja. The bridge is
constructed to replace the old Nalubale Bridge that was constructed and commissioned in
1954. Feasibility studies were conducted by the government of Uganda with funding

PAUSTI Civil Engineering, Master’s Thesis 4
from the government of Japan to determine the suitability of the Old Nalubale Bridge.
The findings of the studies and the field surveys indicated distinct deteriorations of the
old bridge due to the ageing and could not rule out the possibility and danger of any
spontaneous future collapse. The feasibility study report recommended that immediate
repairs of the existing bridge were paramount or an alternative bridge constructed as soon
as possible. Based on the findings of the report, there was validity for project
implementation but does raise concerns with regards to other bridges that were
constructed earlier or in the same time period of the Nalubale Bridge that is being
reconstructed. A number of bridges have already collapsed leading to severe
repercussions to the economy of the country and leading to loss of life.
There is a great need to study and forward means of evaluating the state in which most of
the historic bridges are in and as a result put forth recommendations. The undertaking of
this research study was also prompted by a number of factors, as described in the problem
statement above that are summarized herewith;
a) Changing Bridge construction practice all over the world in comparison to the local
bridge practice
b) Widespread damage, collapse and failure of Bridge structures and box culverts
c) Lack of sufficient data to facilitate an engineering characterisation of the bridges
constructed in the earlier years by the British during colonisation of Uganda
d) Predicted urban population growth of the Uganda and high growth rates of the
economy implying much higher traffic and the rise in the tonnage and quantities of
loads (axle loads) being carried. Also, the Southern Sudan autonomy and discovery of
oil and other mineral resources in different parts of Uganda have subjected the
bridges to much more stress
e) Predicted growth of services and industrial activities in the country
The research on the failure of bridges is the first to be undertaken at PAUSTI, it therefore
is a good opportunity for all those enrolling in the course to undertake further research on
the topic. The findings and the recommendations form good input to the implementing
agencies charged with construction of bridges and their respective maintenance in the
East African Community where many historic bridges are still functional.
PAUSTI Civil Engineering, Master’s Thesis 5
CHAPTER 2. LITERATURE REVIEW
2.1 INTRODUCTION – BRIDGE TYPES AND CHARACTERISTICS
Bridges have been part of a human settlement for thousands of years. Historic bridges
stand as evidence of the power and influence of past societies. They vary greatly in style
and reflect the culture and engineering innovation of their society. The improvement of
the performance and efficiency of bridges is a constant task of engineering design. Recent
developments in concrete material properties have renewed the research interest for this
topic (Muttoni, & Fernandez, 2008). In the context of this research, efficient structures
are defined as structures that satisfy the design requirements with a minimum amount of
materials, enabling easy and rational construction. Existing structures are investigated to
identify the most successful shapes combining these properties. Structural analysis of
bridges is a process to analyze a structural system to predict its responses and behaviors
by using physical laws and mathematical equations. The main objective of structural
analysis is to determine internal forces, stresses and deformations of structures under
various load effects (Plos, et al, 2016).
Types of bridges include the following:
2.1.1 Simply supported Beam/Girder bridges
These consist of horizontal beams and/or girders that are simply supported (also referred
to as pinned) at each end by piers (also known as columns) or abutments (bridge landing
end supports) depending on the span. In consideration of structural analysis, the longer
the spans of this type of beam, the weaker the structure becomes (Luttrell, 1987).
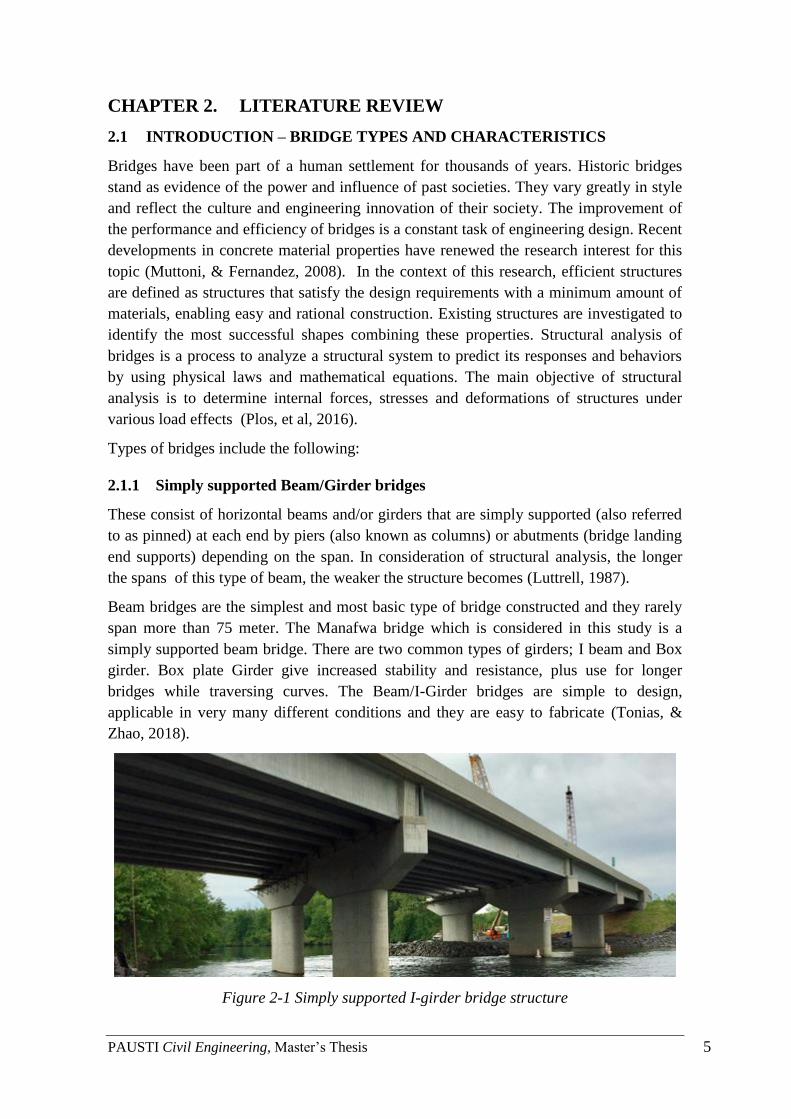
Beam bridges are the simplest and most basic type of bridge constructed and they rarely
span more than 75 meter. The Manafwa bridge which is considered in this study is a
simply supported beam bridge. There are two common types of girders; I beam and Box
girder. Box plate Girder give increased stability and resistance, plus use for longer
bridges while traversing curves. The Beam/I-Girder bridges are simple to design,
applicable in very many different conditions and they are easy to fabricate (Tonias, &
Zhao, 2018).
Figure 2-1 Simply supported I-girder bridge structure
PAUSTI Civil Engineering, Master’s Thesis 6
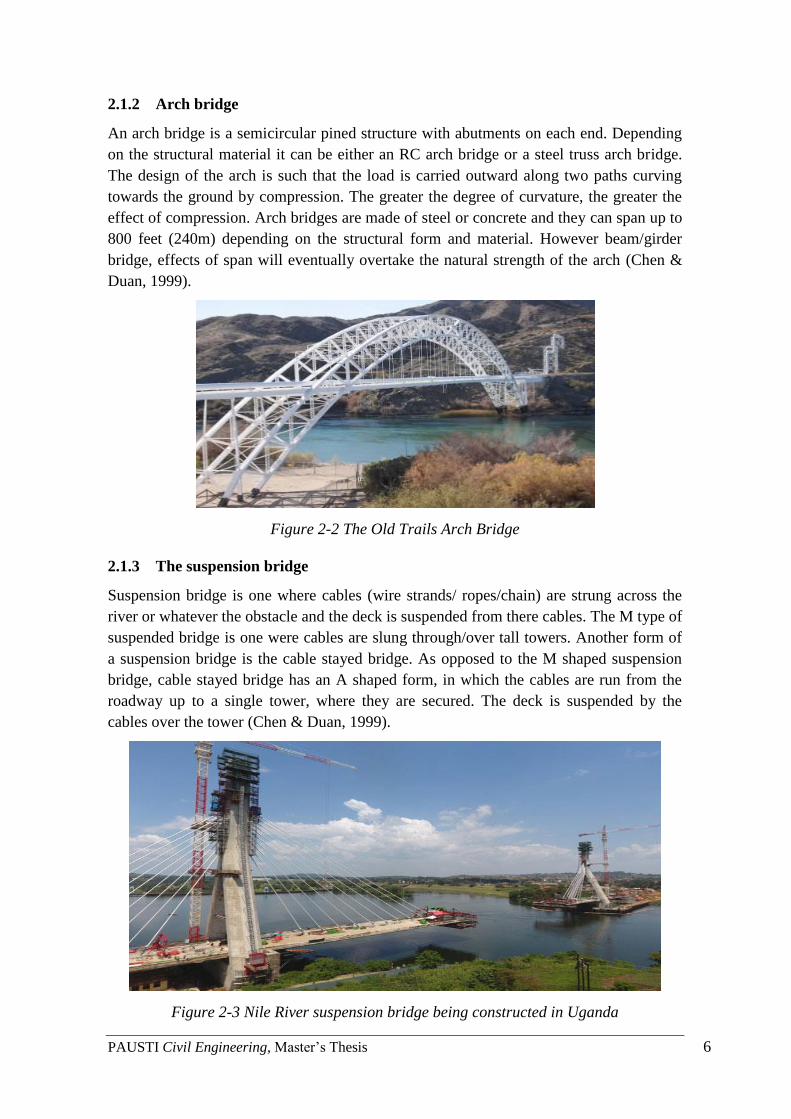
2.1.2 Arch bridge
An arch bridge is a semicircular pined structure with abutments on each end. Depending
on the structural material it can be either an RC arch bridge or a steel truss arch bridge.
The design of the arch is such that the load is carried outward along two paths curving
towards the ground by compression. The greater the degree of curvature, the greater the
effect of compression. Arch bridges are made of steel or concrete and they can span up to
800 feet (240m) depending on the structural form and material. However beam/girder
bridge, effects of span will eventually overtake the natural strength of the arch (Chen &
Duan, 1999).
Figure 2-2 The Old Trails Arch Bridge
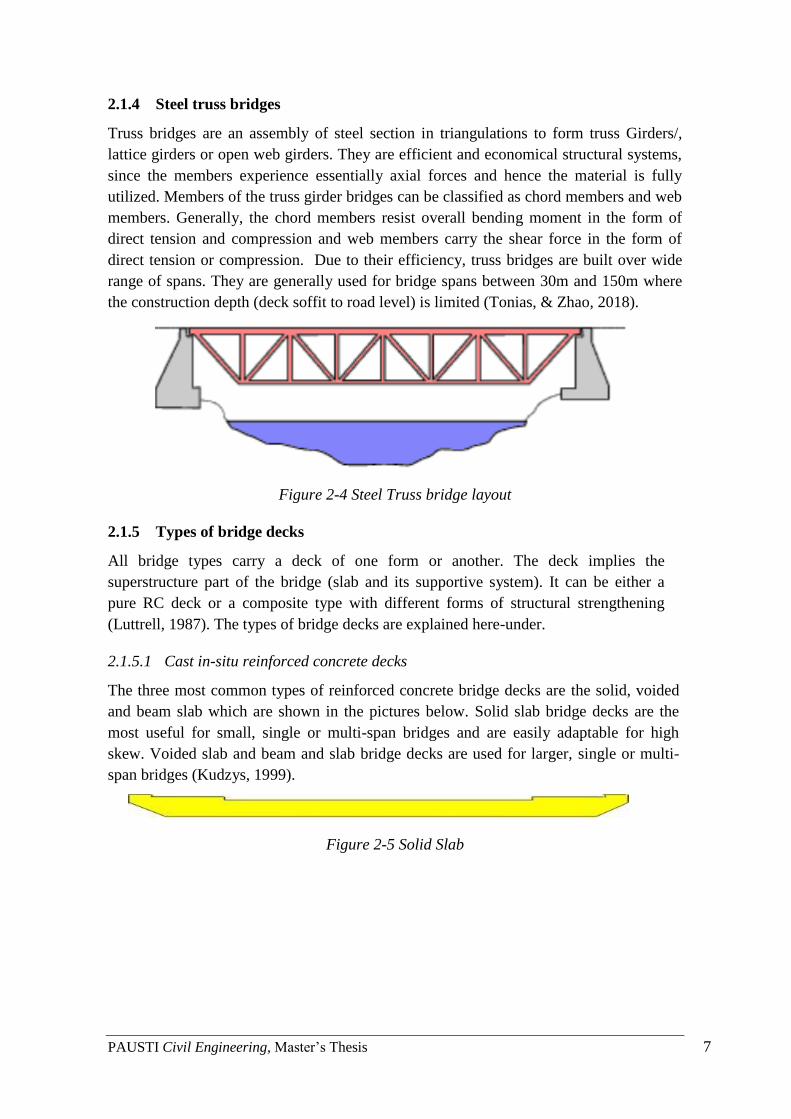
2.1.3 The suspension bridge
Suspension bridge is one where cables (wire strands/ ropes/chain) are strung across the
river or whatever the obstacle and the deck is suspended from there cables. The M type of
suspended bridge is one were cables are slung through/over tall towers. Another form of
a suspension bridge is the cable stayed bridge. As opposed to the M shaped suspension
bridge, cable stayed bridge has an A shaped form, in which the cables are run from the
roadway up to a single tower, where they are secured. The deck is suspended by the
cables over the tower (Chen & Duan, 1999).
Figure 2-3 Nile River suspension bridge being constructed in Uganda
PAUSTI Civil Engineering, Master’s Thesis 7
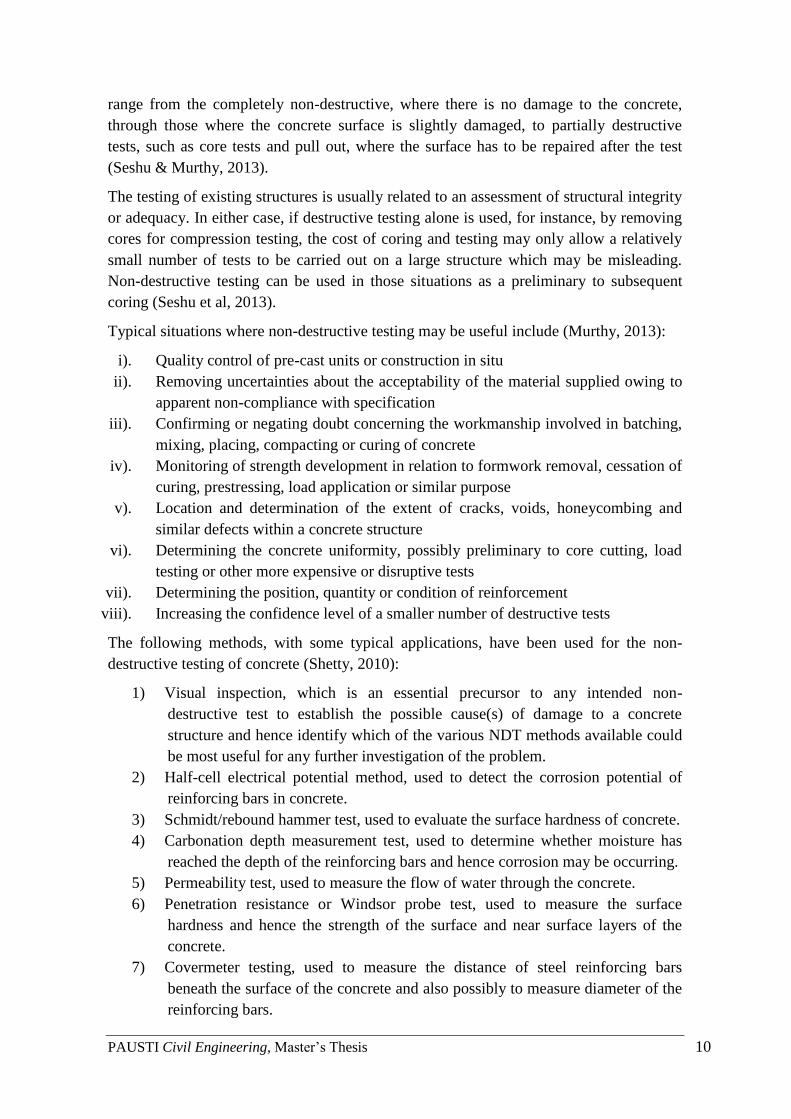
2.1.4 Steel truss bridges
Truss bridges are an assembly of steel section in triangulations to form truss Girders/,
lattice girders or open web girders. They are efficient and economical structural systems,
since the members experience essentially axial forces and hence the material is fully
utilized. Members of the truss girder bridges can be classified as chord members and web
members. Generally, the chord members resist overall bending moment in the form of
direct tension and compression and web members carry the shear force in the form of
direct tension or compression. Due to their efficiency, truss bridges are built over wide
range of spans. They are generally used for bridge spans between 30m and 150m where
the construction depth (deck soffit to road level) is limited (Tonias, & Zhao, 2018).
Figure 2-4 Steel Truss bridge layout
2.1.5 Types of bridge decks
All bridge types carry a deck of one form or another. The deck implies the
superstructure part of the bridge (slab and its supportive system). It can be either a
pure RC deck or a composite type with different forms of structural strengthening
(Luttrell, 1987). The types of bridge decks are explained here-under.
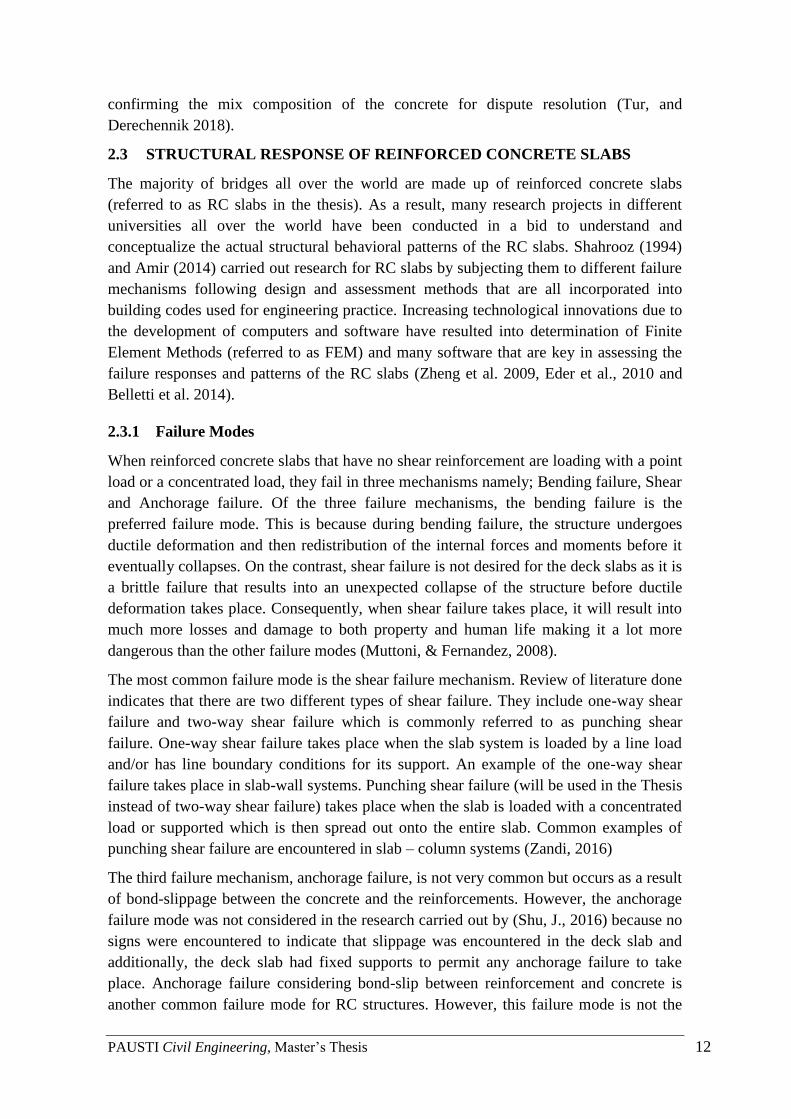
2.1.5.1 Cast in-situ reinforced concrete decks
The three most common types of reinforced concrete bridge decks are the solid, voided
and beam slab which are shown in the pictures below. Solid slab bridge decks are the
most useful for small, single or multi-span bridges and are easily adaptable for high
skew. Voided slab and beam and slab bridge decks are used for larger, single or multi-
span bridges (Kudzys, 1999).
Figure 2-5 Solid Slab

PAUSTI Civil Engineering, Master’s Thesis 8
Figure 2-6 Voided Slab
Figure 2-7 Beam and Slab
2.1.5.2 Pre-stressed concrete decks ( often pre-cast)
These comprise Pre-tensioned beams with in-situ concrete deck (voided or solid) and
Post-tensioned concrete beams with in-situ concrete deck (voided or solid). The term
pre-tensioning is used to describe a method of pre-stressing in which the tendons are
tensioned before the concrete is placed, and the pre-stress is transferred to the concrete
when suitable compressive strength is reached. Post-tensioning is a method of pre-
stressing in which the tendon is tensioned after the concrete has reached a suitable
strength (Chen, 1999).
2.1.5.3 Composite decks
Composite bridge decks refer to all decks designed and constructed in such a way that
there is interaction in load transfer between in-situ reinforced concrete (usually the
slab deck) and structural steel (Luttrell, 1987). The three main economic advantages of
composite construction include smaller depth of beam, reduced cross-sectional area of
the steel top flange and reduction in transverse stiffening for the top compression
flange of the steel beam can be reduced because the restraint against buckling is
provided by the concrete deck. The Manafwa bridge is a composite deck type.
Figure 2-8 Typical composite deck
2.2 BRIDGE STRUCTURAL ANALYSIS

PAUSTI Civil Engineering, Master’s Thesis 9
2.2.1 Common structural and material defects (concrete) in bridge structures
Concrete is used in structures as mass concrete or normally it is combined with steel
reinforcement or with prestressing steel. Defects in concrete are often related to the lack
of durability resulting from the composition of the concrete, poor placement practices,
poor quality control, insufficient curing or the aggressive environment in which it is
placed (Wang, 2006).
a) Cracking: It is recognised that in reinforced concrete, cracks will form in tension
zones. These fine structural cracks are considered harmless but as reinforcement is
further stressed the initial cracks open up and progressively spread to longer and
wider cracks. Further cracking can result in blocks forming and at this stage a detailed
inspection is required. Cracks should be photographed to enable historical recording
of crack propagation and growth.
b) Spalling: A spall is a fragment of concrete detached from the structure between
fracture surfaces. Spalling is a continuation of the corrosion process and represents a
serious defect in the concrete, in that the reinforcement is heavily corroded.
c) Delamination: Delamination is defined as a discontinuity in the surface concrete
which is substantially separated but not completely detached from the adjoining
concrete. Visibly it may appear as a solid surface but can be identified by the hollow
sound when tapping with a light hammer. Delamination generally begins with the
corrosion of reinforcement and subsequent cracking of the concrete parallel to the
exterior surface.
d) Patching or Other Repairs: The condition of the repair or patch will indicate
whether the underlying problem has been solved or if it has been merely covered up
and is actively continuing under the repair. Cracking, delamination, rust stains or
spalling around the patch indicates the problem still exists and further investigations
and repairs are needed.
e) Corrosion of Reinforcement: The concrete alkalinity protects the reinforcement
from corrosion but when moisture, air and/or chloride ions above a certain
concentration penetrate through the concrete to the reinforcement, this protection
breaks down and corrosion commences. In the initial stages, corrosion may appear as
rust stains on the concrete surface. In the advanced stages, the surface concrete
cracks, delaminates and spalls exposing heavily corroded reinforcement. Spalling and
delamination are indications of advanced corrosion. In prestressed concrete
structures, any indication of corroding prestressing steel is very serious as the failure
of the strand or wire may lead to a non-ductile or catastrophic failure of the
component.
2.2.2 Non Destructive Testing of Bridge
It is often necessary to test concrete structures after the concrete has hardened to
determine whether the structure is suitable for its designed use. Ideally such testing
should be done without damaging the concrete. The tests available for testing concrete
PAUSTI Civil Engineering, Master’s Thesis 10
range from the completely non-destructive, where there is no damage to the concrete,
through those where the concrete surface is slightly damaged, to partially destructive
tests, such as core tests and pull out, where the surface has to be repaired after the test
(Seshu & Murthy, 2013).
The testing of existing structures is usually related to an assessment of structural integrity
or adequacy. In either case, if destructive testing alone is used, for instance, by removing
cores for compression testing, the cost of coring and testing may only allow a relatively
small number of tests to be carried out on a large structure which may be misleading.
Non-destructive testing can be used in those situations as a preliminary to subsequent
coring (Seshu et al, 2013).
Typical situations where non-destructive testing may be useful include (Murthy, 2013):
i). Quality control of pre-cast units or construction in situ
ii). Removing uncertainties about the acceptability of the material supplied owing to
apparent non-compliance with specification
iii). Confirming or negating doubt concerning the workmanship involved in batching,
mixing, placing, compacting or curing of concrete
iv). Monitoring of strength development in relation to formwork removal, cessation of
curing, prestressing, load application or similar purpose
v). Location and determination of the extent of cracks, voids, honeycombing and
similar defects within a concrete structure
vi). Determining the concrete uniformity, possibly preliminary to core cutting, load
testing or other more expensive or disruptive tests
vii). Determining the position, quantity or condition of reinforcement
viii). Increasing the confidence level of a smaller number of destructive tests
The following methods, with some typical applications, have been used for the non-
destructive testing of concrete (Shetty, 2010):
1) Visual inspection, which is an essential precursor to any intended non-
destructive test to establish the possible cause(s) of damage to a concrete
structure and hence identify which of the various NDT methods available could
be most useful for any further investigation of the problem.
2) Half-cell electrical potential method, used to detect the corrosion potential of
reinforcing bars in concrete.
3) Schmidt/rebound hammer test, used to evaluate the surface hardness of concrete.
4) Carbonation depth measurement test, used to determine whether moisture has
reached the depth of the reinforcing bars and hence corrosion may be occurring.
5) Permeability test, used to measure the flow of water through the concrete.
6) Penetration resistance or Windsor probe test, used to measure the surface
hardness and hence the strength of the surface and near surface layers of the
concrete.
7) Covermeter testing, used to measure the distance of steel reinforcing bars
beneath the surface of the concrete and also possibly to measure diameter of the
reinforcing bars.

PAUSTI Civil Engineering, Master’s Thesis 11
8) Radiographic testing, used to detect voids in the concrete.
9) Ultrasonic pulse velocity testing, mainly used to measure the sound velocity of
the concrete and hence the compressive strength of the concrete.
10) Sonic methods using an instrumented hammer providing both sonic echo and
transmission methods.
11) Impact echo testing, used to detect voids, delamination and other anomalies in
concrete.
12) Ground penetrating radar or impulse radar testing, used to detect the position of
reinforcing bars or stressing ducts.
13) Infrared thermography, used to detect voids, delamination and other anomalies
in concrete and also detect water entry points in buildings.
Additionally, any one of the following tests will be used depending on the availability in
cases where the three above methods are not sufficient to determination of all the
parameters required for the Research.
2.2.3 Schmidt Rebound Hammer Test
The Schmidt rebound hammer is principally a surface hardness tester. It works on the
principle that the rebound of an elastic mass depends on the hardness of the surface
against which the mass impinges. There is little apparent theoretical relationship between
the strength of concrete and the rebound number of the hammer. However, within limits,
empirical correlations have been established between strength properties and the rebound
number (Troxell et al, 2018).
2.2.4 Core Test
In most structural investigations or diagnoses extraction of core samples is unavoidable
and often essential. Cores are usually extracted by drilling using a diamond tipped core
cutter cooled with water. Broken samples, for example, due to popping, spalling and
delamination, are also commonly retrieved for further analysis as these samples may
provide additional evidence as to the cause of distress. The selection of the locations for
extraction of core samples is made after non-destructive testing which can give guidance
on the most suitable sampling areas. For instance, a cover meter can be used to ensure
there are no reinforcing bars where the core is to be taken; or the ultrasonic pulse velocity
test can be used to establish the areas of maximum and minimum pulse velocity that
could indicate the highest and lowest compressive strength areas in the structure (Tur,
and Derechennik 2018).
Moreover, using non-destructive tests, the number of cores that need to be taken can be
reduced or minimized. This is often an advantage since coring is frequently viewed as
being destructive. Also the cost of extracting cores is quite high and the damage to the
concrete is severe. The extracted cores can be subjected to a series of tests and serve
multiple functions such as: confirming the findings of the non-destructive test, identifying
the presence of deleterious matter in the concrete, ascertaining the strength of the
concrete for design purposes, predicting the potential durability of the concrete and
PAUSTI Civil Engineering, Master’s Thesis 12
confirming the mix composition of the concrete for dispute resolution (Tur, and
Derechennik 2018).
2.3 STRUCTURAL RESPONSE OF REINFORCED CONCRETE SLABS
The majority of bridges all over the world are made up of reinforced concrete slabs
(referred to as RC slabs in the thesis). As a result, many research projects in different
universities all over the world have been conducted in a bid to understand and
conceptualize the actual structural behavioral patterns of the RC slabs. Shahrooz (1994)
and Amir (2014) carried out research for RC slabs by subjecting them to different failure
mechanisms following design and assessment methods that are all incorporated into
building codes used for engineering practice. Increasing technological innovations due to
the development of computers and software have resulted into determination of Finite
Element Methods (referred to as FEM) and many software that are key in assessing the
failure responses and patterns of the RC slabs (Zheng et al. 2009, Eder et al., 2010 and
Belletti et al. 2014).
2.3.1 Failure Modes
When reinforced concrete slabs that have no shear reinforcement are loading with a point
load or a concentrated load, they fail in three mechanisms namely; Bending failure, Shear
and Anchorage failure. Of the three failure mechanisms, the bending failure is the
preferred failure mode. This is because during bending failure, the structure undergoes
ductile deformation and then redistribution of the internal forces and moments before it
eventually collapses. On the contrast, shear failure is not desired for the deck slabs as it is
a brittle failure that results into an unexpected collapse of the structure before ductile
deformation takes place. Consequently, when shear failure takes place, it will result into
much more losses and damage to both property and human life making it a lot more
dangerous than the other failure modes (Muttoni, & Fernandez, 2008).
The most common failure mode is the shear failure mechanism. Review of literature done
indicates that there are two different types of shear failure. They include one-way shear
failure and two-way shear failure which is commonly referred to as punching shear
failure. One-way shear failure takes place when the slab system is loaded by a line load
and/or has line boundary conditions for its support. An example of the one-way shear
failure takes place in slab-wall systems. Punching shear failure (will be used in the Thesis
instead of two-way shear failure) takes place when the slab is loaded with a concentrated
load or supported which is then spread out onto the entire slab. Common examples of
punching shear failure are encountered in slab – column systems (Zandi, 2016)
The third failure mechanism, anchorage failure, is not very common but occurs as a result
of bond-slippage between the concrete and the reinforcements. However, the anchorage
failure mode was not considered in the research carried out by (Shu, J., 2016) because no
signs were encountered to indicate that slippage was encountered in the deck slab and
additionally, the deck slab had fixed supports to permit any anchorage failure to take
place. Anchorage failure considering bond-slip between reinforcement and concrete is
another common failure mode for RC structures. However, this failure mode is not the
PAUSTI Civil Engineering, Master’s Thesis 13
major concern in this study because no signs of slippage were encountered and the deck
slab was fixed in position to enable any anchorage failure (Zandi, 2016).
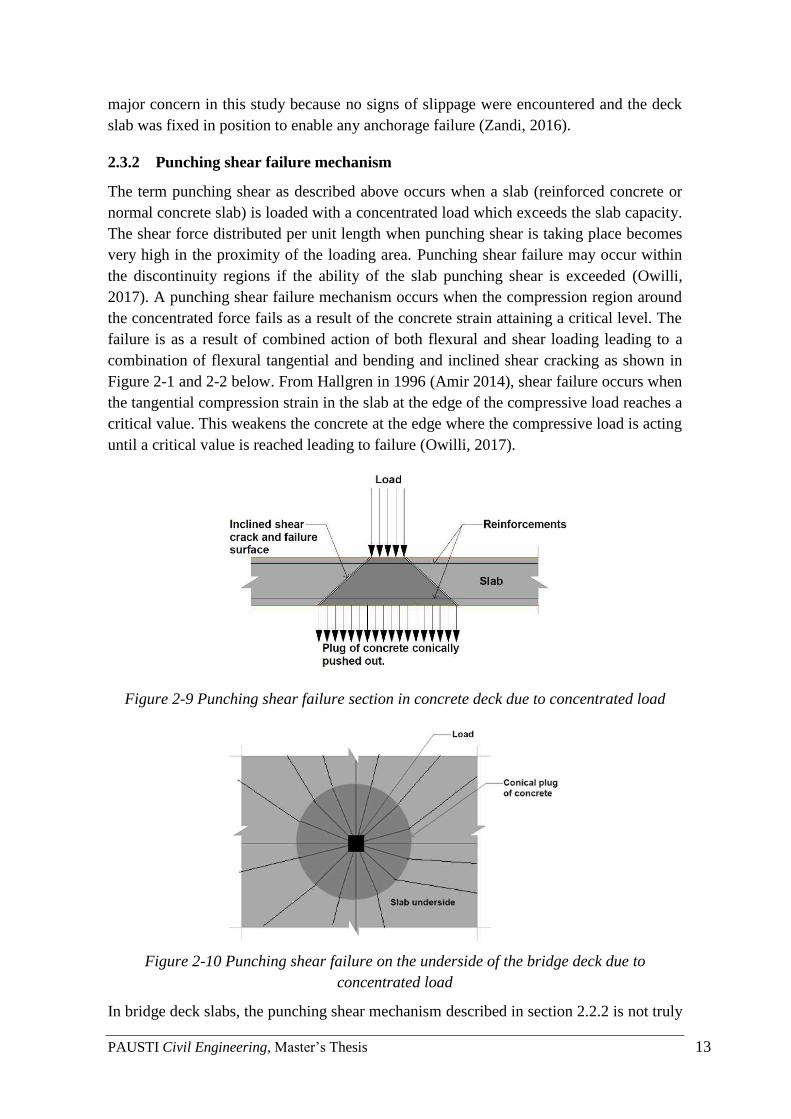
2.3.2 Punching shear failure mechanism
The term punching shear as described above occurs when a slab (reinforced concrete or
normal concrete slab) is loaded with a concentrated load which exceeds the slab capacity.
The shear force distributed per unit length when punching shear is taking place becomes
very high in the proximity of the loading area. Punching shear failure may occur within
the discontinuity regions if the ability of the slab punching shear is exceeded (Owilli,
2017). A punching shear failure mechanism occurs when the compression region around
the concentrated force fails as a result of the concrete strain attaining a critical level. The
failure is as a result of combined action of both flexural and shear loading leading to a
combination of flexural tangential and bending and inclined shear cracking as shown in
Figure 2-1 and 2-2 below. From Hallgren in 1996 (Amir 2014), shear failure occurs when
the tangential compression strain in the slab at the edge of the compressive load reaches a
critical value. This weakens the concrete at the edge where the compressive load is acting
until a critical value is reached leading to failure (Owilli, 2017).
Figure 2-9 Punching shear failure section in concrete deck due to concentrated load
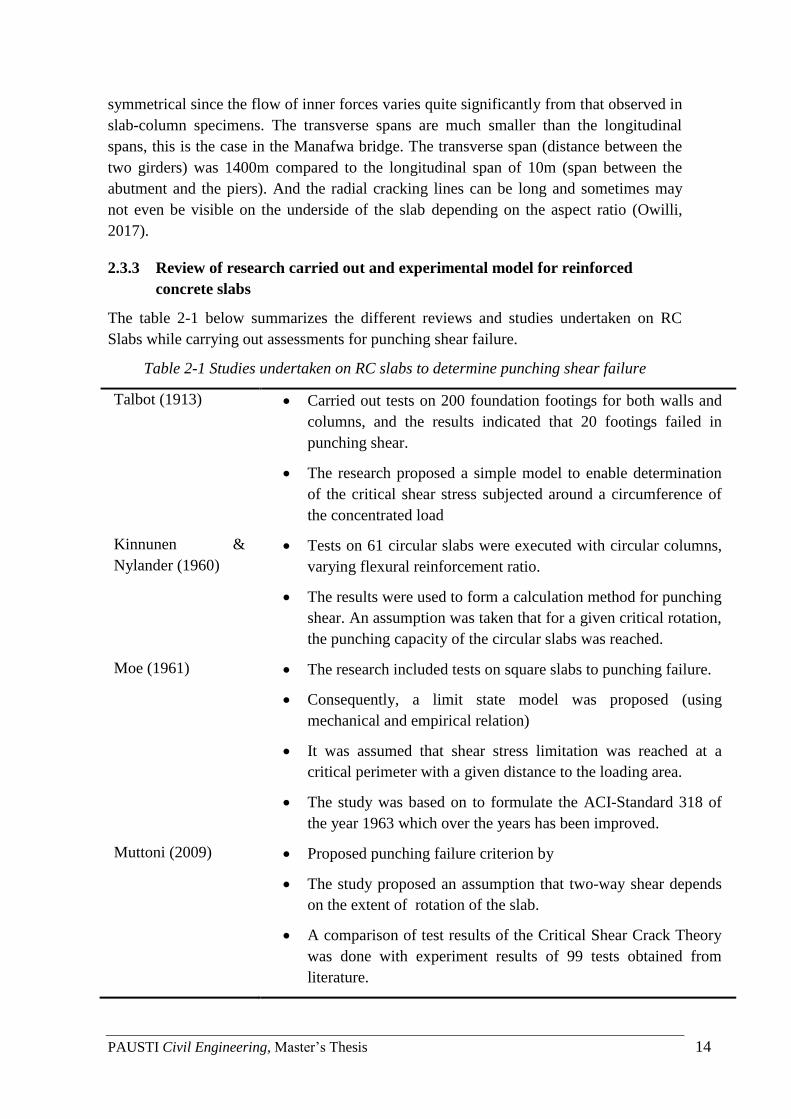
Figure 2-10 Punching shear failure on the underside of the bridge deck due to
concentrated load
In bridge deck slabs, the punching shear mechanism described in section 2.2.2 is not truly
PAUSTI Civil Engineering, Master’s Thesis 14
symmetrical since the flow of inner forces varies quite significantly from that observed in
slab-column specimens. The transverse spans are much smaller than the longitudinal
spans, this is the case in the Manafwa bridge. The transverse span (distance between the
two girders) was 1400m compared to the longitudinal span of 10m (span between the
abutment and the piers). And the radial cracking lines can be long and sometimes may
not even be visible on the underside of the slab depending on the aspect ratio (Owilli,
2017).
2.3.3 Review of research carried out and experimental model for reinforced
concrete slabs
The table 2-1 below summarizes the different reviews and studies undertaken on RC
Slabs while carrying out assessments for punching shear failure.
Table 2-1 Studies undertaken on RC slabs to determine punching shear failure
Talbot (1913) • Carried out tests on 200 foundation footings for both walls and
columns, and the results indicated that 20 footings failed in
punching shear.
• The research proposed a simple model to enable determination
of the critical shear stress subjected around a circumference of
the concentrated load
Kinnunen &
Nylander (1960)
• Tests on 61 circular slabs were executed with circular columns,
varying flexural reinforcement ratio.
• The results were used to form a calculation method for punching
shear. An assumption was taken that for a given critical rotation,
the punching capacity of the circular slabs was reached.
Moe (1961) • The research included tests on square slabs to punching failure.
• Consequently, a limit state model was proposed (using
mechanical and empirical relation)
• It was assumed that shear stress limitation was reached at a
critical perimeter with a given distance to the loading area.
• The study was based on to formulate the ACI-Standard 318 of
the year 1963 which over the years has been improved.
Muttoni (2009) • Proposed punching failure criterion by
• The study proposed an assumption that two-way shear depends
on the extent of rotation of the slab.
• A comparison of test results of the Critical Shear Crack Theory
was done with experiment results of 99 tests obtained from
literature.
PAUSTI Civil Engineering, Master’s Thesis 15
Muttoni (2003) • Carried out 253 shear tests in the study
• Formulated the Critical Shear Crack Theory basing on the
results of the 253 shear tests done.
• The study assumed that shear strength was directly dependent on
the extent of the roughness and the width of the “Critical Shear
Crack”.
2.3.4 Field Test of a Bridge Deck Slab
From the literature review carried out, it is quite evident that very few field tests have
been carried out on in-situ (real) bridge deck slabs. In Table 2-2 below, the field tests
conducted on reinforced concrete deck slabs are summarized in the table below that were
subjected to shear through use of vehicular wheel loads and consequently failed by
punching shear.
Table 2-2 Field Experimentation tests of RC bridge deck slabs subjected to shear failure.
Miller et al. (1994) • Miller conducted multiple tests on the deck slab until of a 38
year old bridge that had been abandoned to the point of
failure.
• The bridge portrayed vast similarities with the Manafwa
bridge as the concrete in the shoulder area should signs of
deterioration and the reinforcement bars were exposed and as
such should signs of corrosion.
• The bridge failed in shear after being subjected to
concentrated loads. However, it did not reach its theoretical
bending capacity.
Pressley et al.
(2004)
• Conducted two destructive bending tests and two destructive
punching shear tests on a 33-year old Reinforced Concrete
flat slab bridge “No 1049”.
• The results indicated that in order to attain maximum load
carrying capacity and load distribution of the deck slab to
maximumly bear the punching shear, the pile-soil interactions
needed to be modelled.
Lantsoght et al.
(2016)
• Lantsohgth carried out a number of tests on an old reinforced
concrete slab bridge (which was 42 years old at the time of
testing) and is located on the “N924” highway in Sweden.
• The results indicated that the bridge failed in bending yet the
theoretical computations based on Eurocode 2 estimated that

PAUSTI Civil Engineering, Master’s Thesis 16
the bridge would fail in punching shear.
• Furthermore the study concentrated on determining the
contribution of the type of reinforcement bars (smooth
reinforcement bars verses ribbed reinforcement bars) and as
such cut the bridge deck slab into a number of beams that
were tested in the laboratory.
2.3.4.1 Non-Destructive Testing of Bridge
Concrete structures often need to be tested when the concrete has hardened over the years
to be able to ascertain if the concrete meets the design parameters and is suitable for use.
The testing must not be destructive to the structure for the continued use of the structure.
As such non-destructive testing is a very important attribute for concrete structures
(Miller, et al, 1994). Many tests have been developed and they range from those that are
non-destructive (where no damage whatsoever to the concrete takes place), to those that
are partially destructive (concrete surface is distorted and/or slightly damaged while
carrying out the test) and to those that very destructive. Some of the partially destructive
tests include the coring test which was also used in this study, pull-out and pull-off tests.
In these tests, the concrete surface is always repaired after the test is done (Seshu &
Murthy, 2013).
There is always need to determine the structural performance and integrity of existing
structures and as such the testing of these parameters must be carried out especially when
the design life of the structure is done or when signs of deterioration are observed. For
determination of the structural integrity or adequacy of the structure, destructive testing
alone is not sufficient to determine this. This is because the destructive testing is limited
and as such only a small number of tests can be carried. For instance if core testing is to
be used on a large structure, few cores will be taken as the cost of coring and testing is
high and the work is very laborious. The results consequently may be misleading. From
this, it is therefore important for non-destructive testing to be carried out as a preliminary
testing measure, upon which subsequent coring can be planned and carried out for the
areas of weakness as indicated by the non-destructive testing (Seshu & Murthy, 2013).
2.3.4.2 Schmidt’s Rebound Hammer Test
The objective of using the Schmidt Rebound hammer method was to assess the
compressive strength of concrete with the help of suitable co-relations between rebound
index and compressive strength of the superstructure (deck slab and parapet wall) and
substructure (piers, abutments and the footing). As such, it was also possible to assess the
uniformity of the concrete, and the quality of the concrete in one element in relation to
the standard requirements and concrete in other areas (Seshu, & Murthy, 2013). The test
was used based on the principle that the rebound of the elastic mass in the hammer
depends upon the relative hardness of the surface that it is used against. As such, each
time the plunger of the hammer was pressed against the concrete surface, the mass
rebounded and the extent of the rebound depended on the surface hardness which is a
PAUSTI Civil Engineering, Master’s Thesis 17
relative measure of the compressive strength of the concrete. Thus, a low strength low
stiffness concrete will absorb more energy than high strength concrete and will give a
lower rebound number (Miller, et al, 1994).
2.4 FINITE ELEMENT METHOD
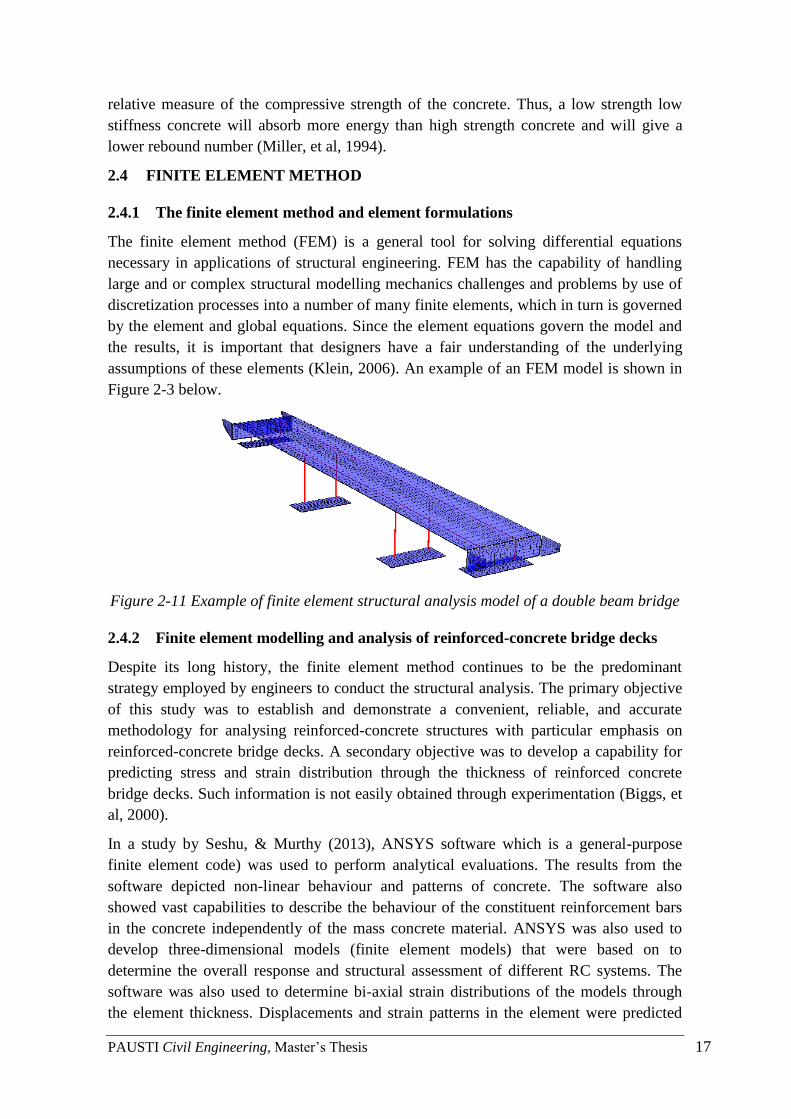
2.4.1 The finite element method and element formulations
The finite element method (FEM) is a general tool for solving differential equations
necessary in applications of structural engineering. FEM has the capability of handling
large and or complex structural modelling mechanics challenges and problems by use of
discretization processes into a number of many finite elements, which in turn is governed
by the element and global equations. Since the element equations govern the model and
the results, it is important that designers have a fair understanding of the underlying
assumptions of these elements (Klein, 2006). An example of an FEM model is shown in
Figure 2-3 below.
Figure 2-11 Example of finite element structural analysis model of a double beam bridge
2.4.2 Finite element modelling and analysis of reinforced-concrete bridge decks
Despite its long history, the finite element method continues to be the predominant
strategy employed by engineers to conduct the structural analysis. The primary objective
of this study was to establish and demonstrate a convenient, reliable, and accurate
methodology for analysing reinforced-concrete structures with particular emphasis on
reinforced-concrete bridge decks. A secondary objective was to develop a capability for
predicting stress and strain distribution through the thickness of reinforced concrete
bridge decks. Such information is not easily obtained through experimentation (Biggs, et
al, 2000).
In a study by Seshu, & Murthy (2013), ANSYS software which is a general-purpose
finite element code) was used to perform analytical evaluations. The results from the
software depicted non-linear behaviour and patterns of concrete. The software also
showed vast capabilities to describe the behaviour of the constituent reinforcement bars
in the concrete independently of the mass concrete material. ANSYS was also used to
develop three-dimensional models (finite element models) that were based on to
determine the overall response and structural assessment of different RC systems. The
software was also used to determine bi-axial strain distributions of the models through
the element thickness. Displacements and strain patterns in the element were predicted
PAUSTI Civil Engineering, Master’s Thesis 18
with a high accuracy degree. The accuracy of the results of the modelling were verified
using o theoretical calculations and using response data from the laboratory testing that
was carried out.
Basing on these models that were developed, Seshu (2013) was able to evaluate the
structural integrity of the Route 621 Bridge located on the Willis River. Similarly to the
study undertaken in this thesis, the software was used to determine the global response of
the steel girders and the RC deck slab. The reason why ANSYS was used for this
research is because it was used before as in this study and yielded positive results which
were verified and found consistent.
2.4.3 Finite element modelling and analysis using ABACUS
Biggs, Gomez and McKeel carried out a study to establish and demonstrate a convenient,
reliable, and accurate methodology for analysing reinforced-concrete structures with
particular emphasis on reinforced-concrete bridge decks in 2000. A secondary objective
was to develop a capability for predicting stress and strain distribution through the
thickness of reinforced concrete bridge decks. Such information is not easily obtained
through experimentation. A specific objective of the analytical evaluation included the
development of a finite element model that could correctly represent global bridge
behaviour and accurately predict strains, stresses, and displacements in the deck.
Dynamic, fatigue, and thermal analyses, although certainly worth investigating in future
project phases, were not included in this study (Biggs, Barton et al, 2000)
Analytical evaluations were performed with the commercial, general-purpose finite
element code ABAQUS, which can effectively depict the nonlinear behaviour of
concrete. It also has the unique capability of describing the behaviour of reinforcing bars
independently of the concrete material. Three-dimensional finite element models were
developed to determine the overall structural response of several reinforced-concrete
systems. Biaxial strain distribution through the element thickness, longitudinal normal
girder strains, and displacements were predicted with reasonable accuracy. The accuracy
of the model was verified with hand calculations or response data acquired from
laboratory testing. The validated finite element models of the structural systems were
used to evaluate the Route 621 Bridge over the Willis River, specifically, the composite
action and global response of the reinforced-concrete deck and steel girders.
2.4.4 Numerical Modelling and Validation of Composite Bridge Decking
In a study by O'Connor in 2013, Deck panels were made by combining consistent-quality
pultruded subcomponents with a vacuum-infused outer wrap. The strength and stiffness
were first determined analytically using finite element methods, then validated
independently with extensive full-scale laboratory testing. Load testing further added to
the calibration of the finite element model, so there was a high level of confidence that
the numerical model was reliable. The study was mainly aiming at ascertaining and
indicating the performance of lightweight decks on moveable bridges, historic bridges,
and other structures that were not designed for heavy concrete decks. Many existing
bridges were built with open steel grating, but long-term durability of the deck has been a
PAUSTI Civil Engineering, Master’s Thesis 19
maintenance problem because of corrosion and fatigue cracking. Furthermore, there was
testing of subcomponents and full-scale structural panels to validate finite models, and
the installation and evaluation of the installation procedures. The project also entailed a
finite element analysis of the bridge stringers and the complete deck system plus the
railing system (O'Connor, 2013).
The first step included surveying the available materials and hence forth coming up with
a light weight FRP deck system. The process used involved the first phase that entailed
development of a design report on the selection of the suitable materials for use in the
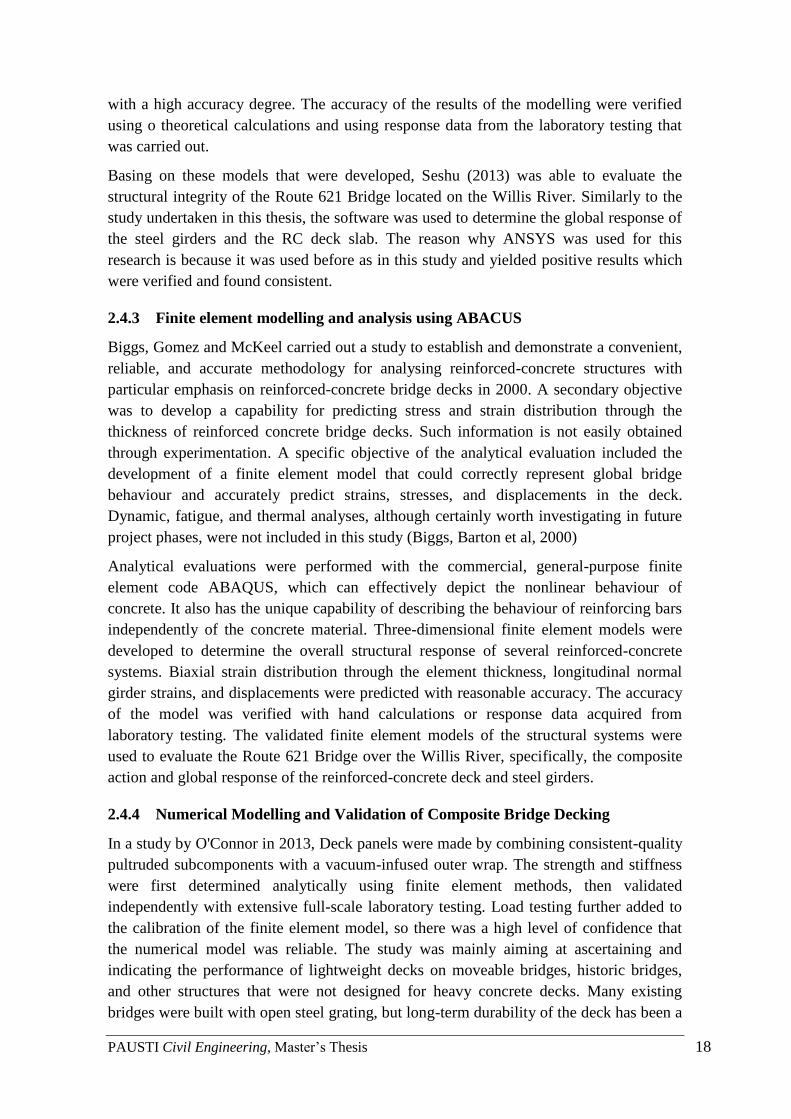
deck structure. The Deck system installed was subjected to moving traffic load tests so as
to determine the load capacity of the bridge; which in most cases is not used or needed to
assess the deck as indicated in the figure below. The purpose of the live-load testing was
to enable collection of data (i.e. strains and deflections) on the performance of the FRP
bridge deck that was installed in Bolivar, NY. The information was then used to
complement the information that was derived from the finite element model. The finite
element model used property values that were primarily derived from the physical testing
of the as-fabricated composite specimens (O'Connor, 2013).
Plate 2-1 Traffic load tests to determine load capacity of composite decking
PAUSTI Civil Engineering, Master’s Thesis 20
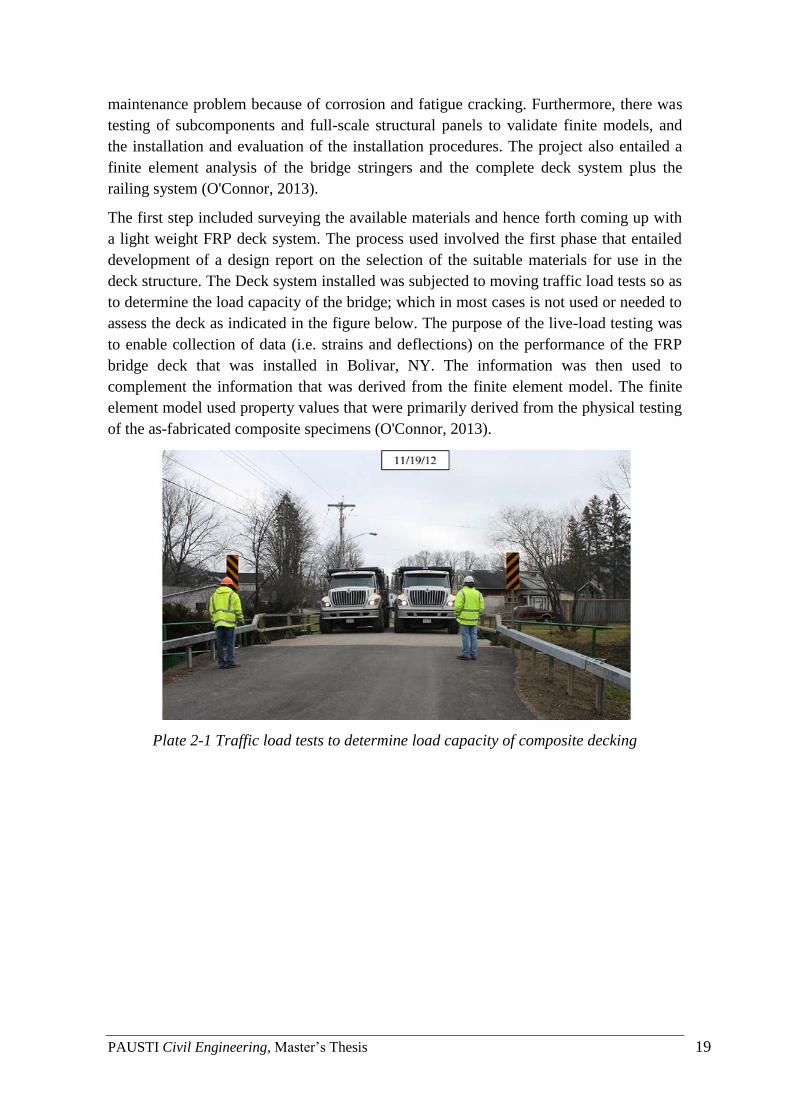
Figure 2-12 7600 tri-axle dump trucks used for live-load test.
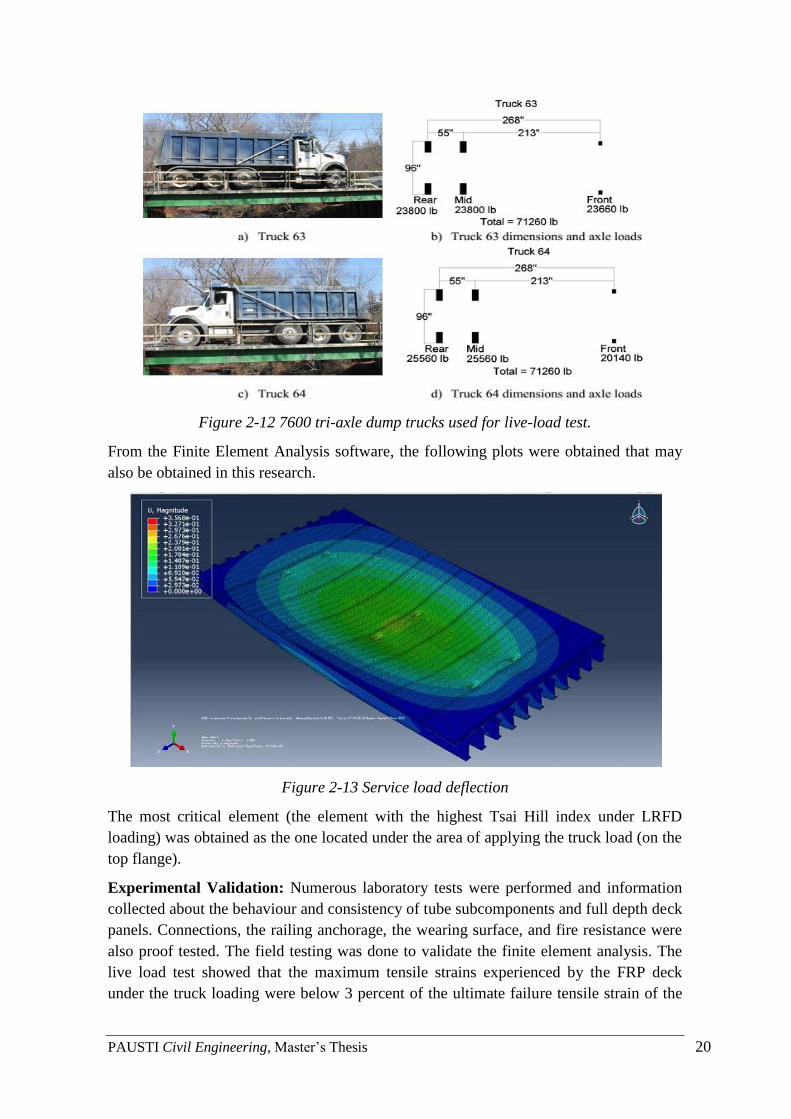
From the Finite Element Analysis software, the following plots were obtained that may
also be obtained in this research.
Figure 2-13 Service load deflection
The most critical element (the element with the highest Tsai Hill index under LRFD
loading) was obtained as the one located under the area of applying the truck load (on the
top flange).
Experimental Validation: Numerous laboratory tests were performed and information
collected about the behaviour and consistency of tube subcomponents and full depth deck
panels. Connections, the railing anchorage, the wearing surface, and fire resistance were
also proof tested. The field testing was done to validate the finite element analysis. The
live load test showed that the maximum tensile strains experienced by the FRP deck
under the truck loading were below 3 percent of the ultimate failure tensile strain of the
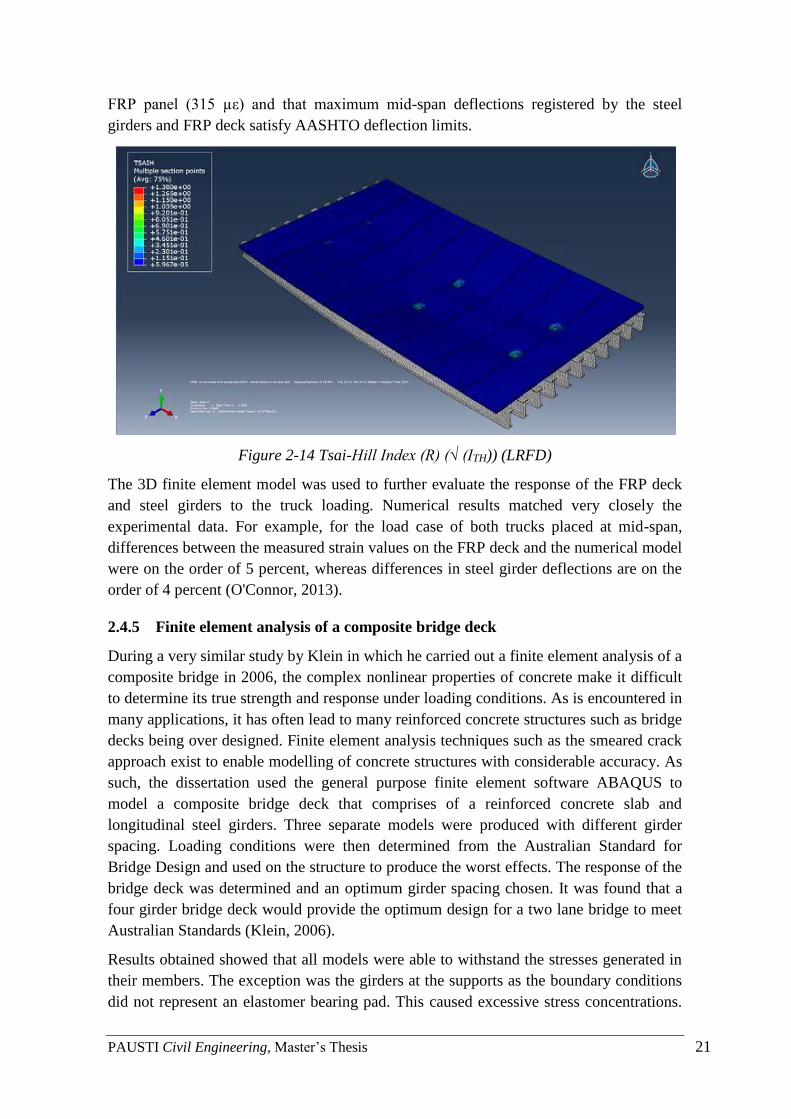
PAUSTI Civil Engineering, Master’s Thesis 21
FRP panel (315 µε) and that maximum mid-span deflections registered by the steel
girders and FRP deck satisfy AASHTO deflection limits.
Figure 2-14 Tsai-Hill Index (R) (√ (ITH)) (LRFD)
The 3D finite element model was used to further evaluate the response of the FRP deck
and steel girders to the truck loading. Numerical results matched very closely the
experimental data. For example, for the load case of both trucks placed at mid-span,
differences between the measured strain values on the FRP deck and the numerical model
were on the order of 5 percent, whereas differences in steel girder deflections are on the
order of 4 percent (O'Connor, 2013).
2.4.5 Finite element analysis of a composite bridge deck
During a very similar study by Klein in which he carried out a finite element analysis of a
composite bridge in 2006, the complex nonlinear properties of concrete make it difficult
to determine its true strength and response under loading conditions. As is encountered in
many applications, it has often lead to many reinforced concrete structures such as bridge
decks being over designed. Finite element analysis techniques such as the smeared crack
approach exist to enable modelling of concrete structures with considerable accuracy. As
such, the dissertation used the general purpose finite element software ABAQUS to
model a composite bridge deck that comprises of a reinforced concrete slab and
longitudinal steel girders. Three separate models were produced with different girder
spacing. Loading conditions were then determined from the Australian Standard for
Bridge Design and used on the structure to produce the worst effects. The response of the
bridge deck was determined and an optimum girder spacing chosen. It was found that a
four girder bridge deck would provide the optimum design for a two lane bridge to meet
Australian Standards (Klein, 2006).
Results obtained showed that all models were able to withstand the stresses generated in
their members. The exception was the girders at the supports as the boundary conditions
did not represent an elastomer bearing pad. This caused excessive stress concentrations.
PAUSTI Civil Engineering, Master’s Thesis 22
Both three and four girder bridges exceed the deflection limits for serviceability
requirements making them unsuitable designs. The optimum girder spacing chosen was
the four girder model for a two lane bridge to meet Australian Standards. Even though
this did not meet deflection requirements it proved the most efficient design with the use
of its materials. The maximum deflection was only slightly larger than the limit so it
could be easily improved by increasing the girder size (Klein, 2006). There are a number
of areas of this project where further work could be conducted and as such in carrying out
this research, these areas will be given attention:
i. The supports for the girders were modelled as if they were fixed to a completely
rigid structure. This caused excessive stresses in the girders at these locations.
Elastomer bearing pads could be modelled at these locations. This would remove
the localised stresses on the girders and it would also be useful to find out how
effective a typical bearing pad is at providing a smooth transition of stress from
the girders to the supports.
ii. The nonlinear geometry of the structure was not analysed with the models,
therefore buckling effects were not considered. Nonlinear geometry could be used
to ensure the separate models analysed are not subjected to these buckling effects.
iii. The four girder bridge deck was chosen as being the optimum girder spacing.
However, the deck was well over designed with very small stress values recorded
in the reinforcement and in the concrete. Additional trial models could be
produced with varying deck thicknesses and reinforcement areas. This would
allow the optimum deck thickness for the four girder bridge-deck to be
determined.
2.5 RESEARCH GAP – MANAFWA BRIDGE COMPARISONS TO TESTED
BRIDGES
Tests on punching shear failure were carried out by Bagge et al. (2014; 2015) on a 55-
year old bridge located in the city of Kiruna in Northern Sweden which was due for
demolition mainly because of urban transformation (and not because it had deteriorated).
The processes and methods undertaken for the bridge assessment involved carrying out of
a desk study encompassing all investigations done on the bridge previously by Nilimaa
(2015), Nilimaa et al. (2016), and Huang et al. (2016). Further, conditional study and
destructive tests were conducted on the bridge before its eventual demolition. The
research is very similar to the study undertaken in this research for the Manafwa Bridge.
Whereas investigations had been carried out on this bridge and documented, no studies
have been done on the Manafwa bridge prior to its eventual collapse.
The study provided the geometry (including the dimensions and the configuration) of the
bridge which are shown in the figure 2-1 below. The research was undertaken in this
thesis also sought to determine the configurations and dimensions which entails the
physical characterization of the bridge. The study done by Bagge et al. (2014; 2015)
entailed the bridge being tested to failure in between two of the main girders which
closely resembles the actual failure of the Manafwa bridge. The deck slab was thereafter
tested by loading it in the middle of the bridge span just close to the main girder that had
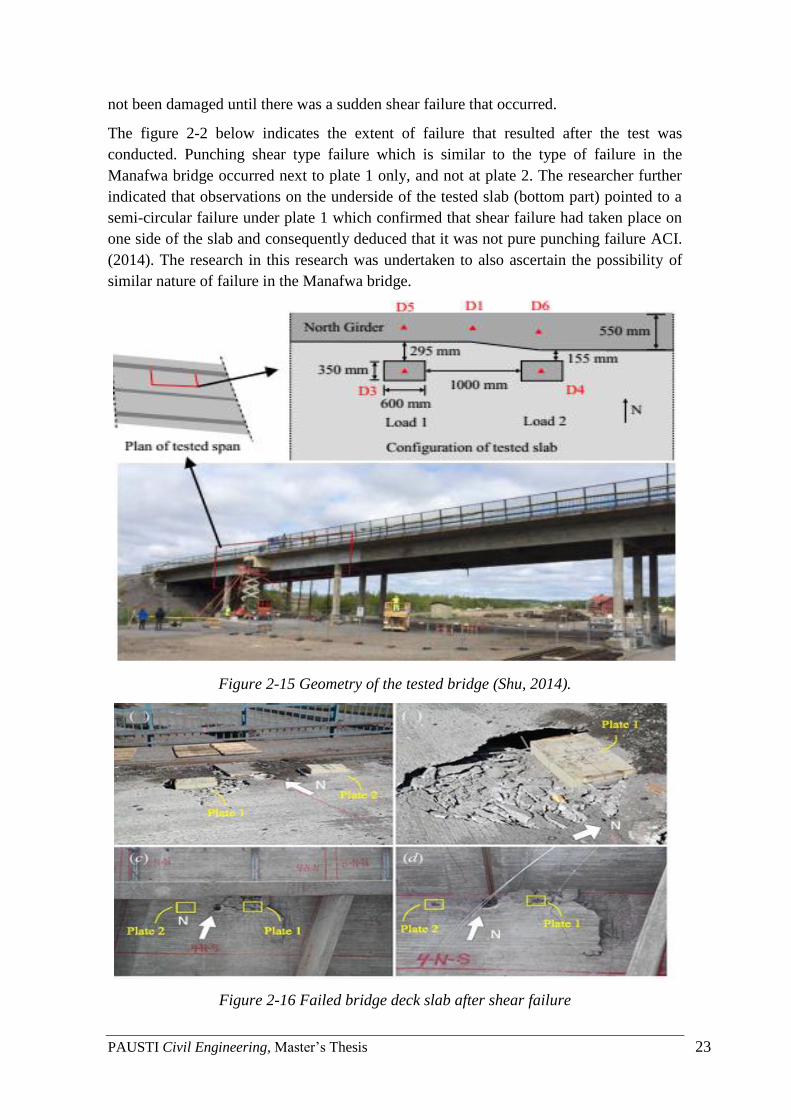
PAUSTI Civil Engineering, Master’s Thesis 23
not been damaged until there was a sudden shear failure that occurred.
The figure 2-2 below indicates the extent of failure that resulted after the test was
conducted. Punching shear type failure which is similar to the type of failure in the
Manafwa bridge occurred next to plate 1 only, and not at plate 2. The researcher further
indicated that observations on the underside of the tested slab (bottom part) pointed to a
semi-circular failure under plate 1 which confirmed that shear failure had taken place on
one side of the slab and consequently deduced that it was not pure punching failure ACI.
(2014). The research in this research was undertaken to also ascertain the possibility of
similar nature of failure in the Manafwa bridge.
Figure 2-15 Geometry of the tested bridge (Shu, 2014).
Figure 2-16 Failed bridge deck slab after shear failure
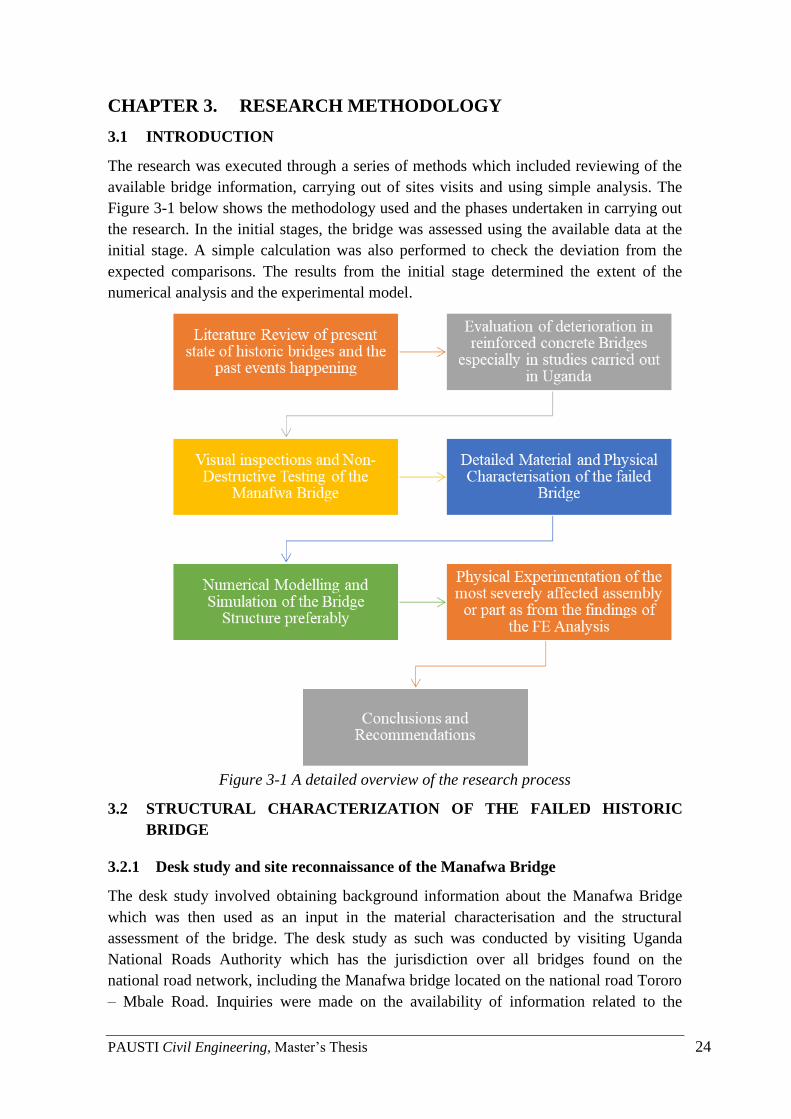
PAUSTI Civil Engineering, Master’s Thesis 24
CHAPTER 3. RESEARCH METHODOLOGY
3.1 INTRODUCTION
The research was executed through a series of methods which included reviewing of the
available bridge information, carrying out of sites visits and using simple analysis. The
Figure 3-1 below shows the methodology used and the phases undertaken in carrying out
the research. In the initial stages, the bridge was assessed using the available data at the
initial stage. A simple calculation was also performed to check the deviation from the
expected comparisons. The results from the initial stage determined the extent of the
numerical analysis and the experimental model.
Figure 3-1 A detailed overview of the research process
3.2 STRUCTURAL CHARACTERIZATION OF THE FAILED HISTORIC
BRIDGE
3.2.1 Desk study and site reconnaissance of the Manafwa Bridge
The desk study involved obtaining background information about the Manafwa Bridge
which was then used as an input in the material characterisation and the structural
assessment of the bridge. The desk study as such was conducted by visiting Uganda
National Roads Authority which has the jurisdiction over all bridges found on the
national road network, including the Manafwa bridge located on the national road Tororo
– Mbale Road. Inquiries were made on the availability of information related to the
PAUSTI Civil Engineering, Master’s Thesis 25
Manafwa bridge such as structural designs, inspection reports, design reviews and others.
Unfortunately, because UNRA was only formulated in 2006, not much data was available
with regards to this bridge and other historic bridges. Design protocols used by UNRA
were given to me to enable comprehensive analysis in line with the standards and
specifications of the country
3.2.2 Condition Assessment Survey
The conditional assessment survey of the Manafwa Bridge was carried out in accordance
with Overseas Road Note 7 Vol 1 – A guide to Bridge inspection and data systems for
District Engineers. The data was obtained using a template form in Bridge Inspection
Report Form which is attached (one page of the filled form) in Appendix L. The
Manafwa bridge was closed to traffic as a diversion bridge had been constructed to
enable construction works of a replacement bridge to take place hence making the
process of carrying out the study easy and unhindered. The steps undertaken in carrying
out the conditional survey of the reinforced concrete bridge structure are looked at in the
sections below;
Visual inspections were carried out on the bridge structure coinciding with the time
period when the traffic counts were also carried out. The existing two-span bridge was
assessed putting into consideration mainly the present condition of the bridge and the
extent of damage that the bridge superstructure had incurred owing to the traffic flow on
the bridge. The visual inspections were focused on:
a) checking the overall safety and performance of the bridge structure.
b) identification of any significant events leading to deterioration of the bridge such as
major accident damage or other incidents or any other obvious failures of the
components.
c) Identification of potentially critical defects, for instance, cracks in deck slab etc.
d) Photographic Records were taken of the bridge in the study capturing all the essential
components of the bridge.
3.2.3 Non – Destructive Testing using Rebound Hammer
The primary purpose of the non-destructive testing carried out in this research project
was to assess the properties of concrete limited to in-situ strength properties position, the
condition of the steel reinforcement, concrete cover over the reinforcement and detection
of defects of concrete members and the extent of visible cracks. Due to limitations in
terms of financial resources and lack of equipment available, the research did not
determine the durability, moisture content, extent of corrosion, presence of deleterious
matter and chemical composition of the bridge.
The Rebound hammer method was the main method employed and was conducted as
indicated below: following methods were used:
• The surface of the concrete was cleaned ensuring that it was smooth, clean and dry.
The loose material was ground off and rough areas from poor compaction, grout
loss, spalling or tooling were avoided as much as possible.
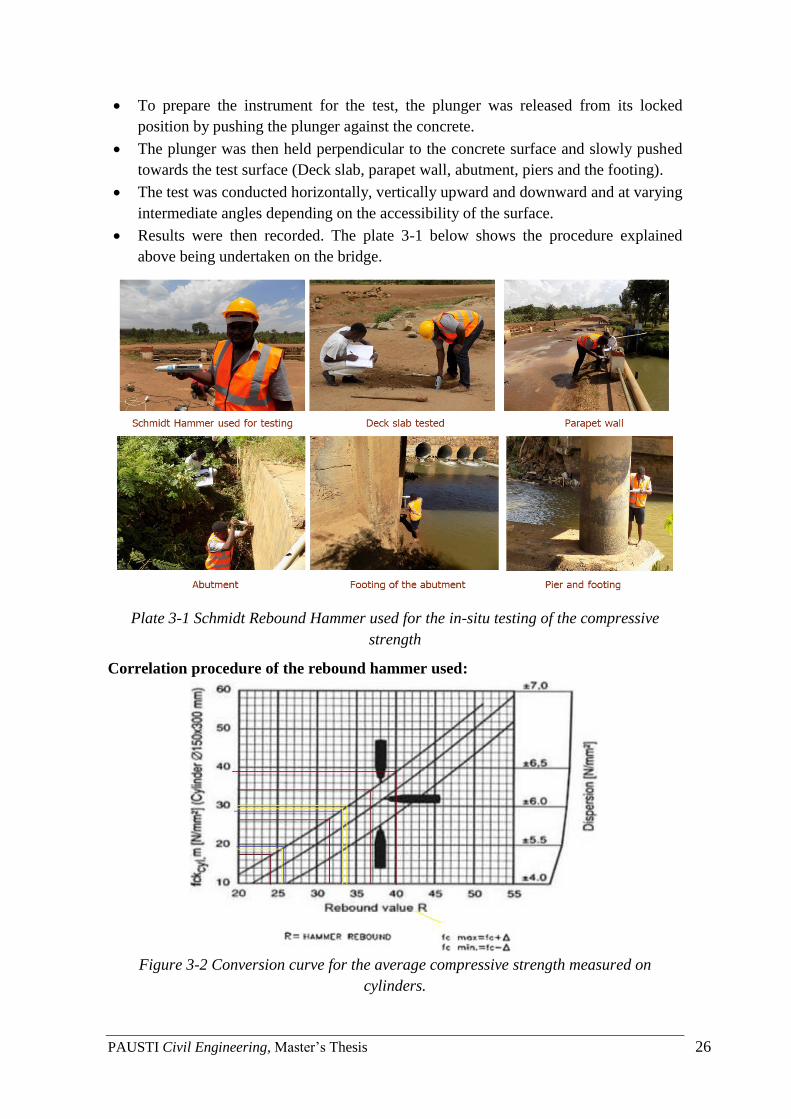
PAUSTI Civil Engineering, Master’s Thesis 26
• To prepare the instrument for the test, the plunger was released from its locked
position by pushing the plunger against the concrete.
• The plunger was then held perpendicular to the concrete surface and slowly pushed
towards the test surface (Deck slab, parapet wall, abutment, piers and the footing).
• The test was conducted horizontally, vertically upward and downward and at varying
intermediate angles depending on the accessibility of the surface.
• Results were then recorded. The plate 3-1 below shows the procedure explained
above being undertaken on the bridge.
Plate 3-1 Schmidt Rebound Hammer used for the in-situ testing of the compressive
strength
Correlation procedure of the rebound hammer used:
Figure 3-2 Conversion curve for the average compressive strength measured on
cylinders.
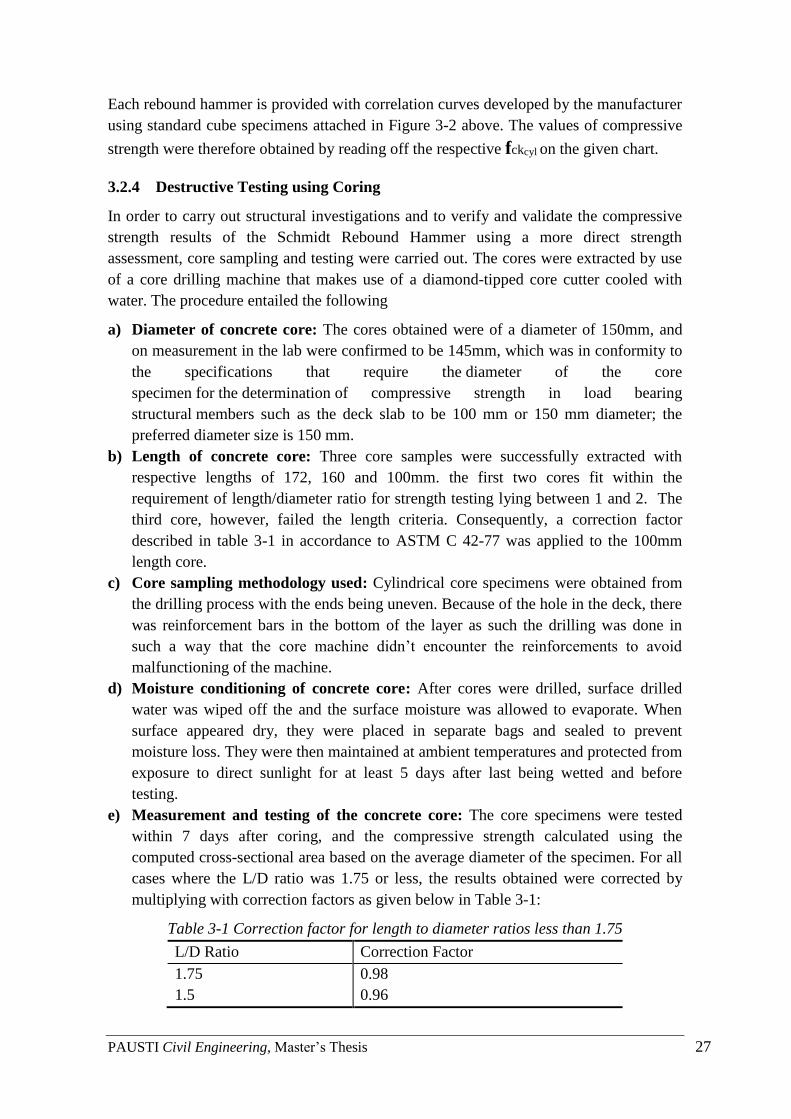
PAUSTI Civil Engineering, Master’s Thesis 27
Each rebound hammer is provided with correlation curves developed by the manufacturer
using standard cube specimens attached in Figure 3-2 above. The values of compressive
strength were therefore obtained by reading off the respective fckcyl on the given chart.
3.2.4 Destructive Testing using Coring
In order to carry out structural investigations and to verify and validate the compressive
strength results of the Schmidt Rebound Hammer using a more direct strength
assessment, core sampling and testing were carried out. The cores were extracted by use
of a core drilling machine that makes use of a diamond-tipped core cutter cooled with
water. The procedure entailed the following
a) Diameter of concrete core: The cores obtained were of a diameter of 150mm, and
on measurement in the lab were confirmed to be 145mm, which was in conformity to
the specifications that require the diameter of the core
specimen for the determination of compressive strength in load bearing
structural members such as the deck slab to be 100 mm or 150 mm diameter; the
preferred diameter size is 150 mm.
b) Length of concrete core: Three core samples were successfully extracted with
respective lengths of 172, 160 and 100mm. the first two cores fit within the
requirement of length/diameter ratio for strength testing lying between 1 and 2. The
third core, however, failed the length criteria. Consequently, a correction factor
described in table 3-1 in accordance to ASTM C 42-77 was applied to the 100mm
length core.
c) Core sampling methodology used: Cylindrical core specimens were obtained from
the drilling process with the ends being uneven. Because of the hole in the deck, there
was reinforcement bars in the bottom of the layer as such the drilling was done in
such a way that the core machine didn’t encounter the reinforcements to avoid
malfunctioning of the machine.
d) Moisture conditioning of concrete core: After cores were drilled, surface drilled
water was wiped off the and the surface moisture was allowed to evaporate. When
surface appeared dry, they were placed in separate bags and sealed to prevent
moisture loss. They were then maintained at ambient temperatures and protected from
exposure to direct sunlight for at least 5 days after last being wetted and before
testing.
e) Measurement and testing of the concrete core: The core specimens were tested
within 7 days after coring, and the compressive strength calculated using the
computed cross-sectional area based on the average diameter of the specimen. For all
cases where the L/D ratio was 1.75 or less, the results obtained were corrected by
multiplying with correction factors as given below in Table 3-1:
Table 3-1 Correction factor for length to diameter ratios less than 1.75
L/D Ratio Correction Factor
1.75 0.98
1.5 0.96

PAUSTI Civil Engineering, Master’s Thesis 28
1.25 0.93
1.0 0.87
The pictures of the core sampling and cores obtained are attached in Plate 3-2 below:
Plate 3-2 Core Testing being done on the deck's slab
3.2.5 Structural Steel Reinforcement –Tensile Strength Tests
During the coring process, a number of steel reinforcement bars exposed by the open hole
were cut and taken to the laboratory in addition to the concrete cores. The steel was cut in
such a way to have appropriate depth for the test to be carried out. The samples were used
in the laboratory to determine the following:
a. The size (diameter) of the steel rebars used in the deck slab using Vernier
Callipers
b. The ultimate tensile strength of the two main types of reinforcement using the
materials testing machine at the Makerere University mechanical laboratory
c. The chemical composition of the steel reinforcement bars to determine the extent
of carbonation, and other chemical properties pertinent in investigating the failure
mechanism of the deck slab.
3.3 NUMERICAL ANALYSIS OF THE HISTORIC BRIDGE
3.3.1 Introduction
During the Numerical simulation, the bridge structure was analysed as a composite
structure, as the girders were clearly made of steel while the deck is concrete. The
software used for the carrying out the simulations of the bridge was ANSYS 16.0 which
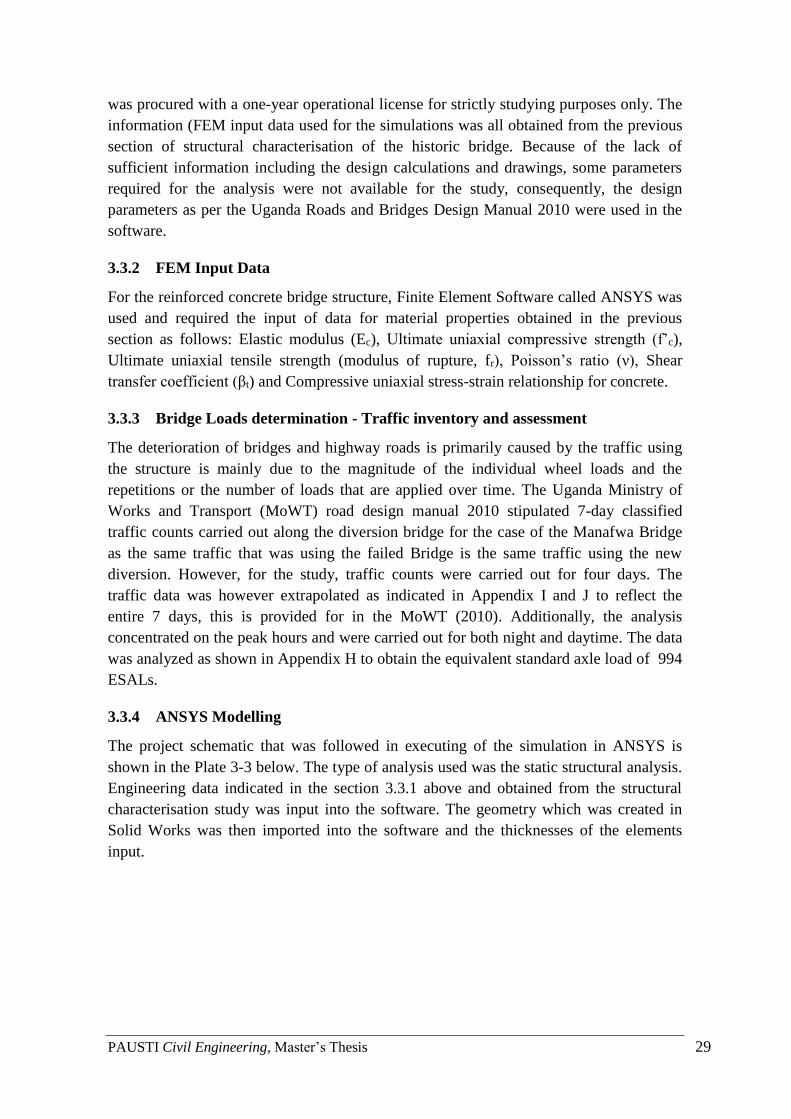
PAUSTI Civil Engineering, Master’s Thesis 29
was procured with a one-year operational license for strictly studying purposes only. The
information (FEM input data used for the simulations was all obtained from the previous
section of structural characterisation of the historic bridge. Because of the lack of
sufficient information including the design calculations and drawings, some parameters
required for the analysis were not available for the study, consequently, the design
parameters as per the Uganda Roads and Bridges Design Manual 2010 were used in the
software.
3.3.2 FEM Input Data
For the reinforced concrete bridge structure, Finite Element Software called ANSYS was
used and required the input of data for material properties obtained in the previous
section as follows: Elastic modulus (Ec), Ultimate uniaxial compressive strength (f’c),
Ultimate uniaxial tensile strength (modulus of rupture, fr), Poisson’s ratio (ν), Shear
transfer coefficient (βt) and Compressive uniaxial stress-strain relationship for concrete.
3.3.3 Bridge Loads determination - Traffic inventory and assessment
The deterioration of bridges and highway roads is primarily caused by the traffic using
the structure is mainly due to the magnitude of the individual wheel loads and the
repetitions or the number of loads that are applied over time. The Uganda Ministry of
Works and Transport (MoWT) road design manual 2010 stipulated 7-day classified
traffic counts carried out along the diversion bridge for the case of the Manafwa Bridge
as the same traffic that was using the failed Bridge is the same traffic using the new
diversion. However, for the study, traffic counts were carried out for four days. The
traffic data was however extrapolated as indicated in Appendix I and J to reflect the
entire 7 days, this is provided for in the MoWT (2010). Additionally, the analysis
concentrated on the peak hours and were carried out for both night and daytime. The data
was analyzed as shown in Appendix H to obtain the equivalent standard axle load of 994
ESALs.
3.3.4 ANSYS Modelling
The project schematic that was followed in executing of the simulation in ANSYS is
shown in the Plate 3-3 below. The type of analysis used was the static structural analysis.
Engineering data indicated in the section 3.3.1 above and obtained from the structural
characterisation study was input into the software. The geometry which was created in
Solid Works was then imported into the software and the thicknesses of the elements
input.
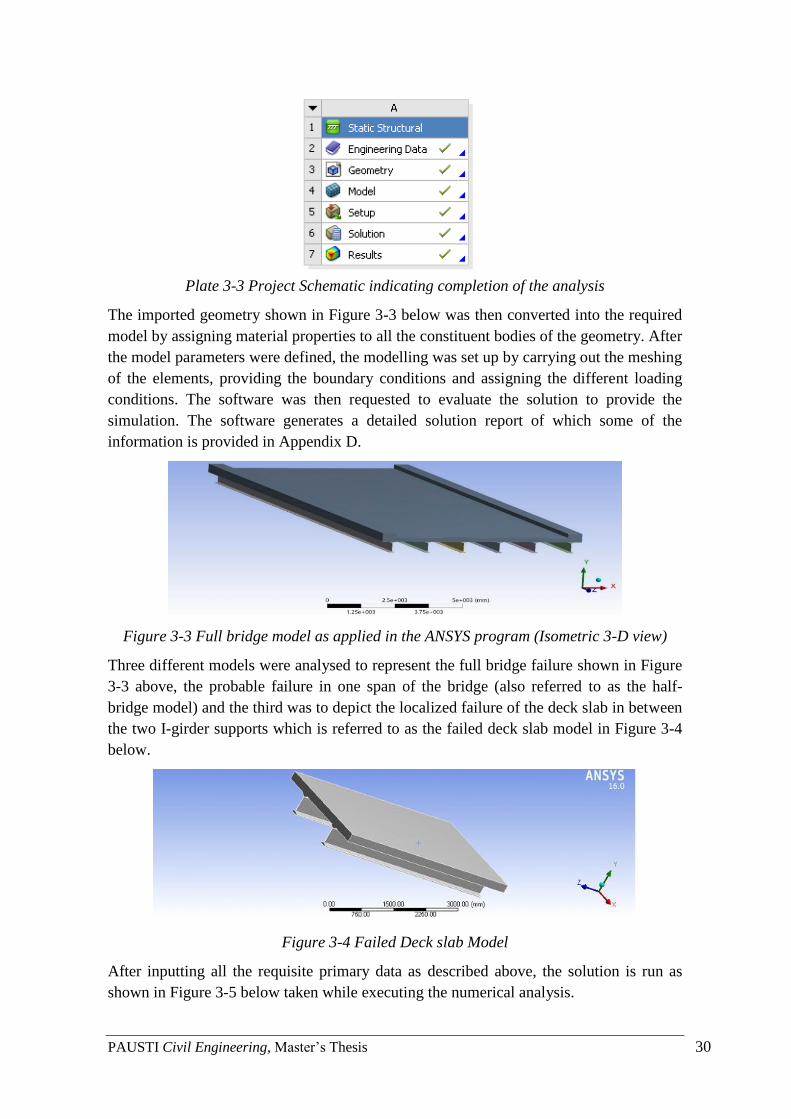
PAUSTI Civil Engineering, Master’s Thesis 30
Plate 3-3 Project Schematic indicating completion of the analysis
The imported geometry shown in Figure 3-3 below was then converted into the required
model by assigning material properties to all the constituent bodies of the geometry. After
the model parameters were defined, the modelling was set up by carrying out the meshing
of the elements, providing the boundary conditions and assigning the different loading
conditions. The software was then requested to evaluate the solution to provide the
simulation. The software generates a detailed solution report of which some of the
information is provided in Appendix D.
Figure 3-3 Full bridge model as applied in the ANSYS program (Isometric 3-D view)
Three different models were analysed to represent the full bridge failure shown in Figure
3-3 above, the probable failure in one span of the bridge (also referred to as the half-
bridge model) and the third was to depict the localized failure of the deck slab in between
the two I-girder supports which is referred to as the failed deck slab model in Figure 3-4
below.
Figure 3-4 Failed Deck slab Model
After inputting all the requisite primary data as described above, the solution is run as
shown in Figure 3-5 below taken while executing the numerical analysis.
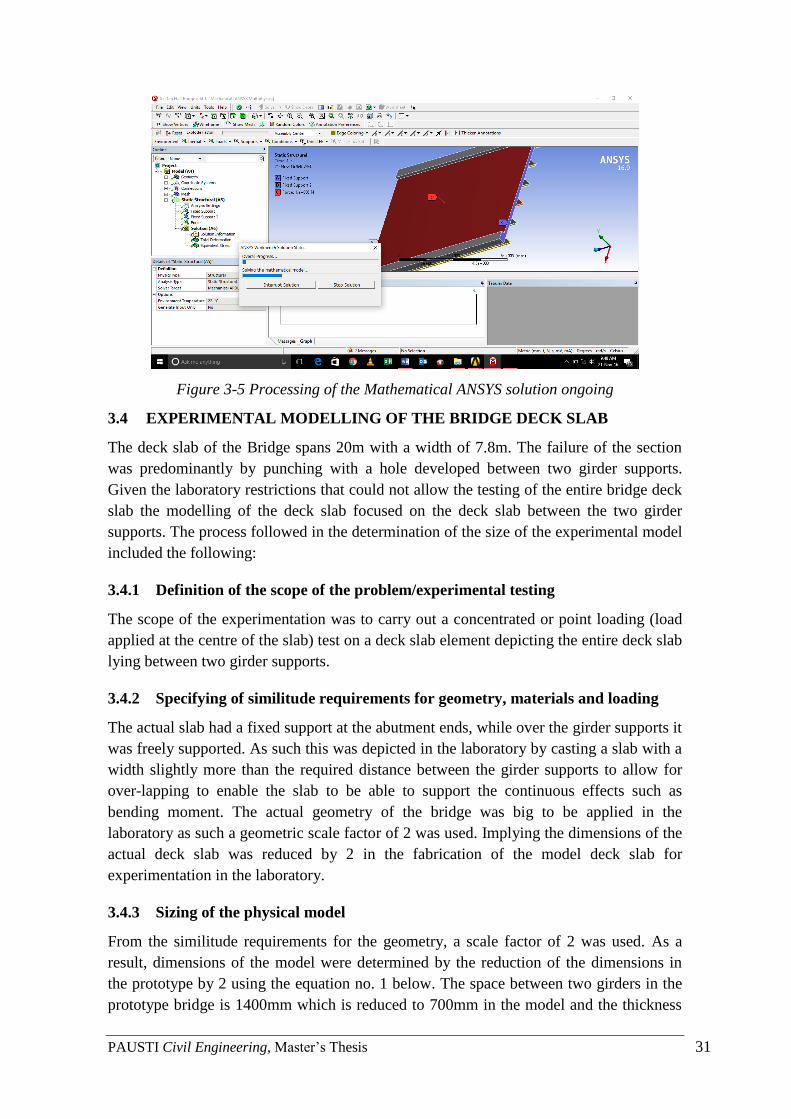
PAUSTI Civil Engineering, Master’s Thesis 31
Figure 3-5 Processing of the Mathematical ANSYS solution ongoing
3.4 EXPERIMENTAL MODELLING OF THE BRIDGE DECK SLAB
The deck slab of the Bridge spans 20m with a width of 7.8m. The failure of the section
was predominantly by punching with a hole developed between two girder supports.
Given the laboratory restrictions that could not allow the testing of the entire bridge deck
slab the modelling of the deck slab focused on the deck slab between the two girder
supports. The process followed in the determination of the size of the experimental model
included the following:
3.4.1 Definition of the scope of the problem/experimental testing
The scope of the experimentation was to carry out a concentrated or point loading (load
applied at the centre of the slab) test on a deck slab element depicting the entire deck slab
lying between two girder supports.
3.4.2 Specifying of similitude requirements for geometry, materials and loading
The actual slab had a fixed support at the abutment ends, while over the girder supports it
was freely supported. As such this was depicted in the laboratory by casting a slab with a
width slightly more than the required distance between the girder supports to allow for
over-lapping to enable the slab to be able to support the continuous effects such as
bending moment. The actual geometry of the bridge was big to be applied in the
laboratory as such a geometric scale factor of 2 was used. Implying the dimensions of the
actual deck slab was reduced by 2 in the fabrication of the model deck slab for
experimentation in the laboratory.
3.4.3 Sizing of the physical model
From the similitude requirements for the geometry, a scale factor of 2 was used. As a
result, dimensions of the model were determined by the reduction of the dimensions in
the prototype by 2 using the equation no. 1 below. The space between two girders in the
prototype bridge is 1400mm which is reduced to 700mm in the model and the thickness
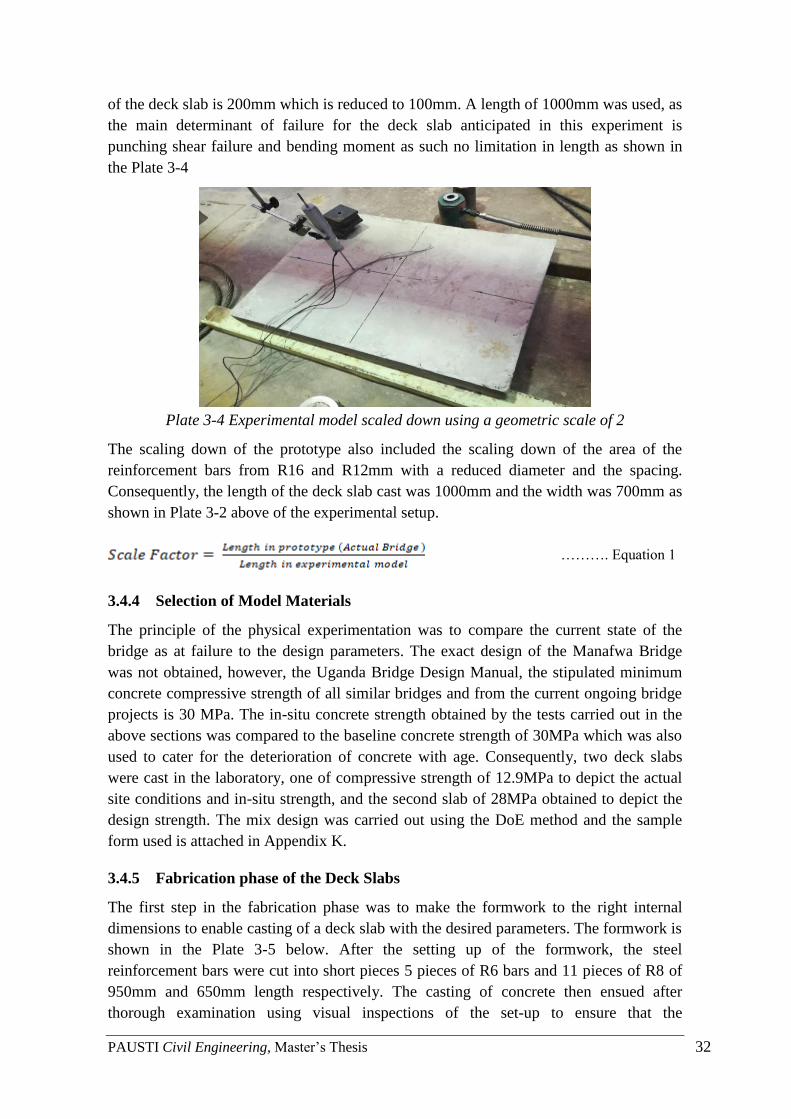
PAUSTI Civil Engineering, Master’s Thesis 32
of the deck slab is 200mm which is reduced to 100mm. A length of 1000mm was used, as
the main determinant of failure for the deck slab anticipated in this experiment is
punching shear failure and bending moment as such no limitation in length as shown in
the Plate 3-4
Plate 3-4 Experimental model scaled down using a geometric scale of 2
The scaling down of the prototype also included the scaling down of the area of the
reinforcement bars from R16 and R12mm with a reduced diameter and the spacing.
Consequently, the length of the deck slab cast was 1000mm and the width was 700mm as
shown in Plate 3-2 above of the experimental setup.
………. Equation 1
3.4.4 Selection of Model Materials
The principle of the physical experimentation was to compare the current state of the
bridge as at failure to the design parameters. The exact design of the Manafwa Bridge
was not obtained, however, the Uganda Bridge Design Manual, the stipulated minimum
concrete compressive strength of all similar bridges and from the current ongoing bridge
projects is 30 MPa. The in-situ concrete strength obtained by the tests carried out in the
above sections was compared to the baseline concrete strength of 30MPa which was also
used to cater for the deterioration of concrete with age. Consequently, two deck slabs
were cast in the laboratory, one of compressive strength of 12.9MPa to depict the actual
site conditions and in-situ strength, and the second slab of 28MPa obtained to depict the
design strength. The mix design was carried out using the DoE method and the sample
form used is attached in Appendix K.
3.4.5 Fabrication phase of the Deck Slabs
The first step in the fabrication phase was to make the formwork to the right internal
dimensions to enable casting of a deck slab with the desired parameters. The formwork is
shown in the Plate 3-5 below. After the setting up of the formwork, the steel
reinforcement bars were cut into short pieces 5 pieces of R6 bars and 11 pieces of R8 of
950mm and 650mm length respectively. The casting of concrete then ensued after
thorough examination using visual inspections of the set-up to ensure that the
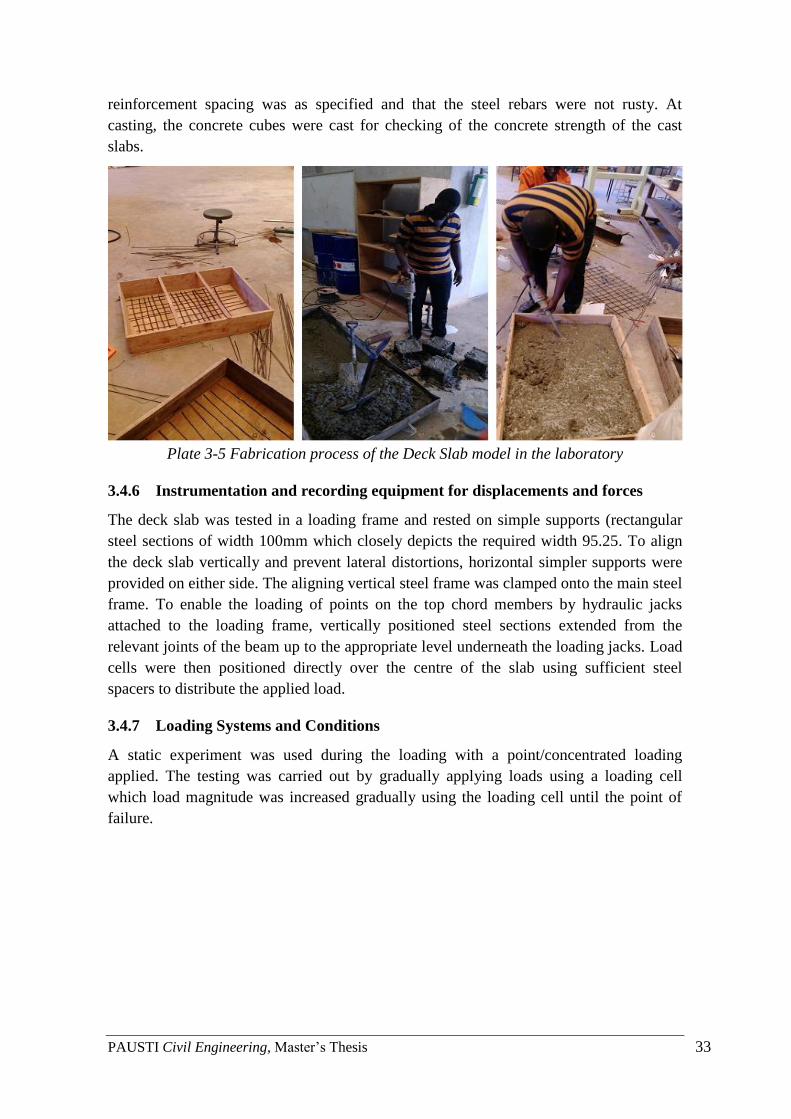
PAUSTI Civil Engineering, Master’s Thesis 33
reinforcement spacing was as specified and that the steel rebars were not rusty. At
casting, the concrete cubes were cast for checking of the concrete strength of the cast
slabs.
Plate 3-5 Fabrication process of the Deck Slab model in the laboratory
3.4.6 Instrumentation and recording equipment for displacements and forces
The deck slab was tested in a loading frame and rested on simple supports (rectangular
steel sections of width 100mm which closely depicts the required width 95.25. To align
the deck slab vertically and prevent lateral distortions, horizontal simpler supports were
provided on either side. The aligning vertical steel frame was clamped onto the main steel
frame. To enable the loading of points on the top chord members by hydraulic jacks
attached to the loading frame, vertically positioned steel sections extended from the
relevant joints of the beam up to the appropriate level underneath the loading jacks. Load
cells were then positioned directly over the centre of the slab using sufficient steel
spacers to distribute the applied load.
3.4.7 Loading Systems and Conditions
A static experiment was used during the loading with a point/concentrated loading
applied. The testing was carried out by gradually applying loads using a loading cell
which load magnitude was increased gradually using the loading cell until the point of
failure.
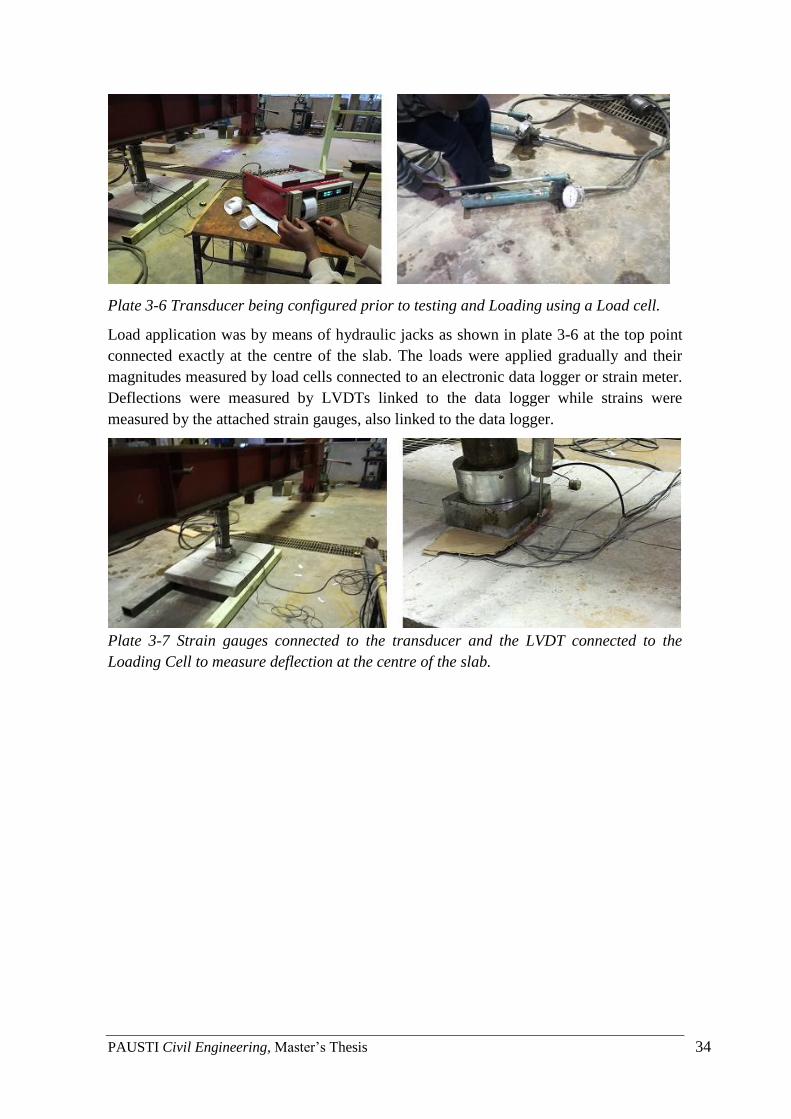
PAUSTI Civil Engineering, Master’s Thesis 34
Plate 3-6 Transducer being configured prior to testing and Loading using a Load cell.
Load application was by means of hydraulic jacks as shown in plate 3-6 at the top point
connected exactly at the centre of the slab. The loads were applied gradually and their
magnitudes measured by load cells connected to an electronic data logger or strain meter.
Deflections were measured by LVDTs linked to the data logger while strains were
measured by the attached strain gauges, also linked to the data logger.
Plate 3-7 Strain gauges connected to the transducer and the LVDT connected to the
Loading Cell to measure deflection at the centre of the slab.
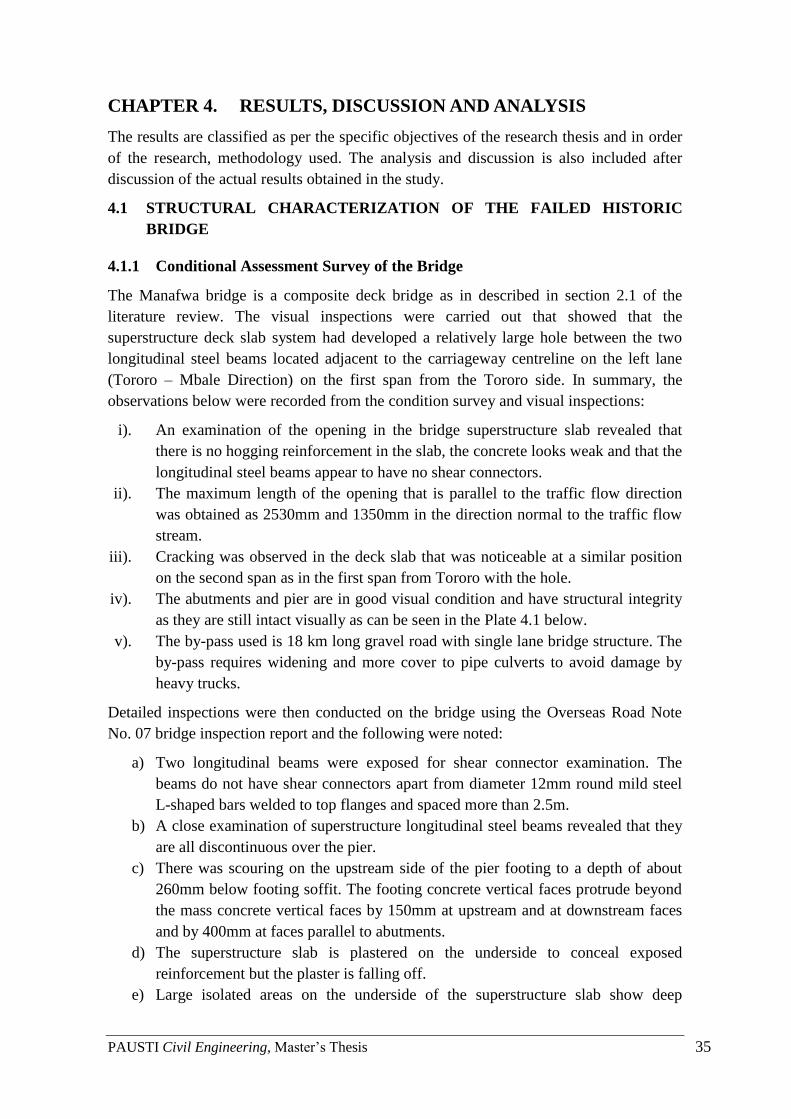
PAUSTI Civil Engineering, Master’s Thesis 35
CHAPTER 4. RESULTS, DISCUSSION AND ANALYSIS
The results are classified as per the specific objectives of the research thesis and in order
of the research, methodology used. The analysis and discussion is also included after
discussion of the actual results obtained in the study.
4.1 STRUCTURAL CHARACTERIZATION OF THE FAILED HISTORIC
BRIDGE
4.1.1 Conditional Assessment Survey of the Bridge
The Manafwa bridge is a composite deck bridge as in described in section 2.1 of the
literature review. The visual inspections were carried out that showed that the
superstructure deck slab system had developed a relatively large hole between the two
longitudinal steel beams located adjacent to the carriageway centreline on the left lane
(Tororo – Mbale Direction) on the first span from the Tororo side. In summary, the
observations below were recorded from the condition survey and visual inspections:
i). An examination of the opening in the bridge superstructure slab revealed that
there is no hogging reinforcement in the slab, the concrete looks weak and that the
longitudinal steel beams appear to have no shear connectors.
ii). The maximum length of the opening that is parallel to the traffic flow direction
was obtained as 2530mm and 1350mm in the direction normal to the traffic flow
stream.
iii). Cracking was observed in the deck slab that was noticeable at a similar position
on the second span as in the first span from Tororo with the hole.
iv). The abutments and pier are in good visual condition and have structural integrity
as they are still intact visually as can be seen in the Plate 4.1 below.
v). The by-pass used is 18 km long gravel road with single lane bridge structure. The
by-pass requires widening and more cover to pipe culverts to avoid damage by
heavy trucks.
Detailed inspections were then conducted on the bridge using the Overseas Road Note
No. 07 bridge inspection report and the following were noted:
a) Two longitudinal beams were exposed for shear connector examination. The
beams do not have shear connectors apart from diameter 12mm round mild steel
L-shaped bars welded to top flanges and spaced more than 2.5m.
b) A close examination of superstructure longitudinal steel beams revealed that they
are all discontinuous over the pier.
c) There was scouring on the upstream side of the pier footing to a depth of about
260mm below footing soffit. The footing concrete vertical faces protrude beyond
the mass concrete vertical faces by 150mm at upstream and at downstream faces
and by 400mm at faces parallel to abutments.
d) The superstructure slab is plastered on the underside to conceal exposed
reinforcement but the plaster is falling off.
e) Large isolated areas on the underside of the superstructure slab show deep
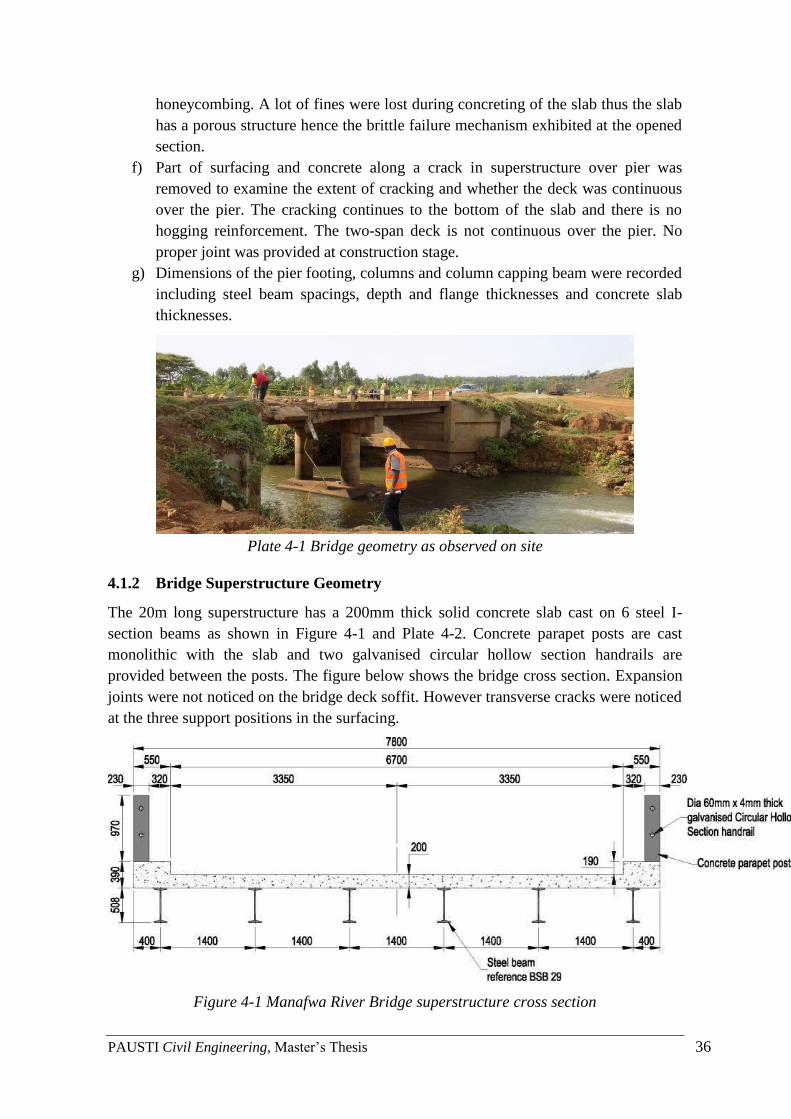
PAUSTI Civil Engineering, Master’s Thesis 36
honeycombing. A lot of fines were lost during concreting of the slab thus the slab
has a porous structure hence the brittle failure mechanism exhibited at the opened
section.
f) Part of surfacing and concrete along a crack in superstructure over pier was
removed to examine the extent of cracking and whether the deck was continuous
over the pier. The cracking continues to the bottom of the slab and there is no
hogging reinforcement. The two-span deck is not continuous over the pier. No
proper joint was provided at construction stage.
g) Dimensions of the pier footing, columns and column capping beam were recorded
including steel beam spacings, depth and flange thicknesses and concrete slab
thicknesses.
Plate 4-1 Bridge geometry as observed on site
4.1.2 Bridge Superstructure Geometry
The 20m long superstructure has a 200mm thick solid concrete slab cast on 6 steel I-
section beams as shown in Figure 4-1 and Plate 4-2. Concrete parapet posts are cast
monolithic with the slab and two galvanised circular hollow section handrails are
provided between the posts. The figure below shows the bridge cross section. Expansion
joints were not noticed on the bridge deck soffit. However transverse cracks were noticed
at the three support positions in the surfacing.
Figure 4-1 Manafwa River Bridge superstructure cross section
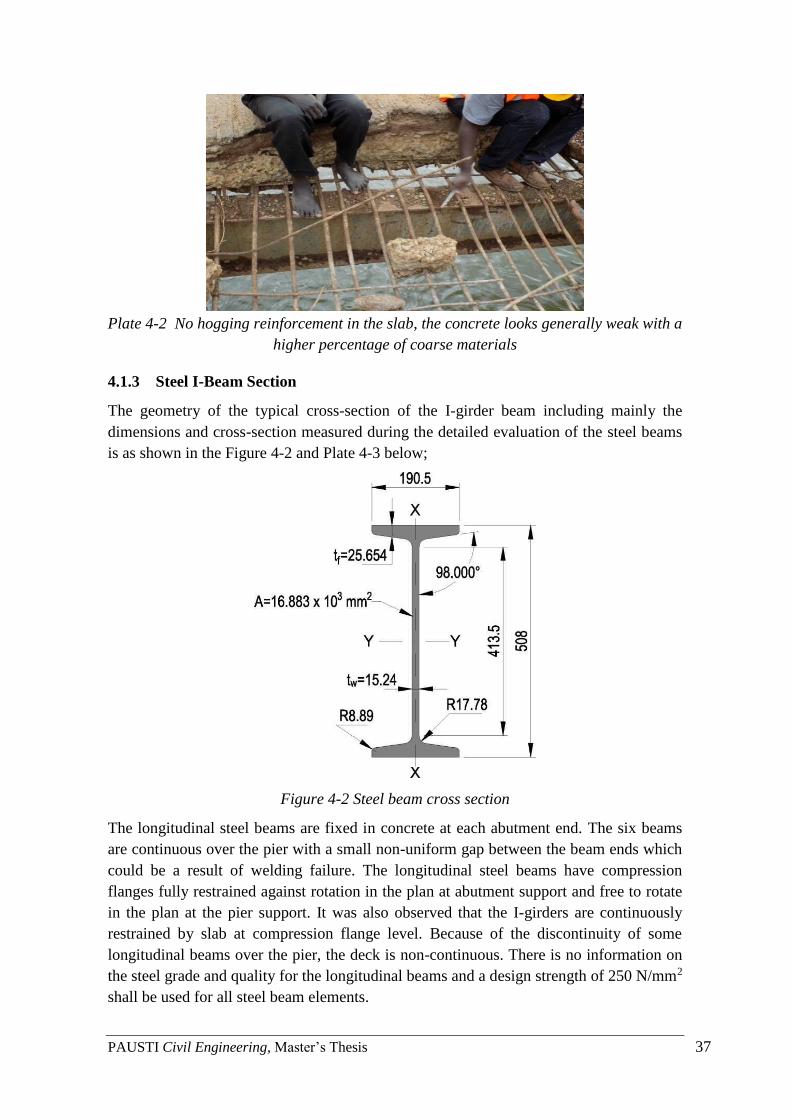
PAUSTI Civil Engineering, Master’s Thesis 37
Plate 4-2 No hogging reinforcement in the slab, the concrete looks generally weak with a
higher percentage of coarse materials
4.1.3 Steel I-Beam Section
The geometry of the typical cross-section of the I-girder beam including mainly the
dimensions and cross-section measured during the detailed evaluation of the steel beams
is as shown in the Figure 4-2 and Plate 4-3 below;
Figure 4-2 Steel beam cross section
The longitudinal steel beams are fixed in concrete at each abutment end. The six beams
are continuous over the pier with a small non-uniform gap between the beam ends which
could be a result of welding failure. The longitudinal steel beams have compression
flanges fully restrained against rotation in the plan at abutment support and free to rotate
in the plan at the pier support. It was also observed that the I-girders are continuously
restrained by slab at compression flange level. Because of the discontinuity of some
longitudinal beams over the pier, the deck is non-continuous. There is no information on
the steel grade and quality for the longitudinal beams and a design strength of 250 N/mm2
shall be used for all steel beam elements.
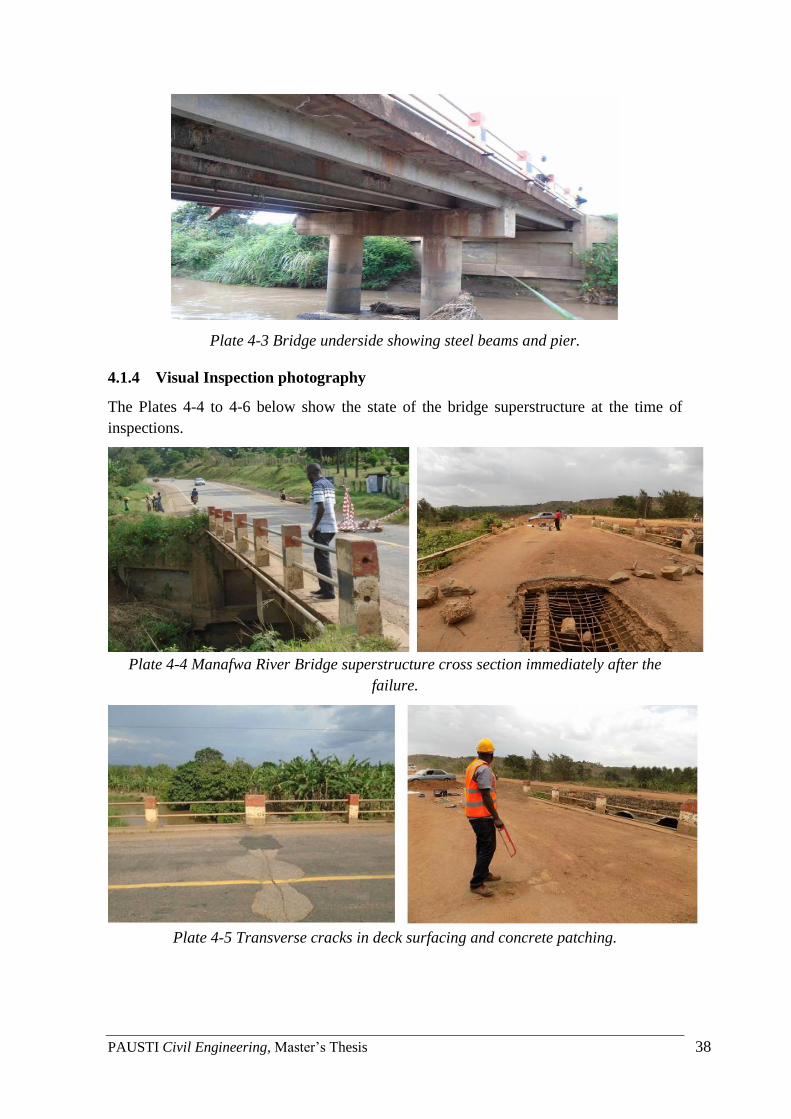
PAUSTI Civil Engineering, Master’s Thesis 38
Plate 4-3 Bridge underside showing steel beams and pier.
4.1.4 Visual Inspection photography
The Plates 4-4 to 4-6 below show the state of the bridge superstructure at the time of
inspections.
Plate 4-4 Manafwa River Bridge superstructure cross section immediately after the
failure.
Plate 4-5 Transverse cracks in deck surfacing and concrete patching.
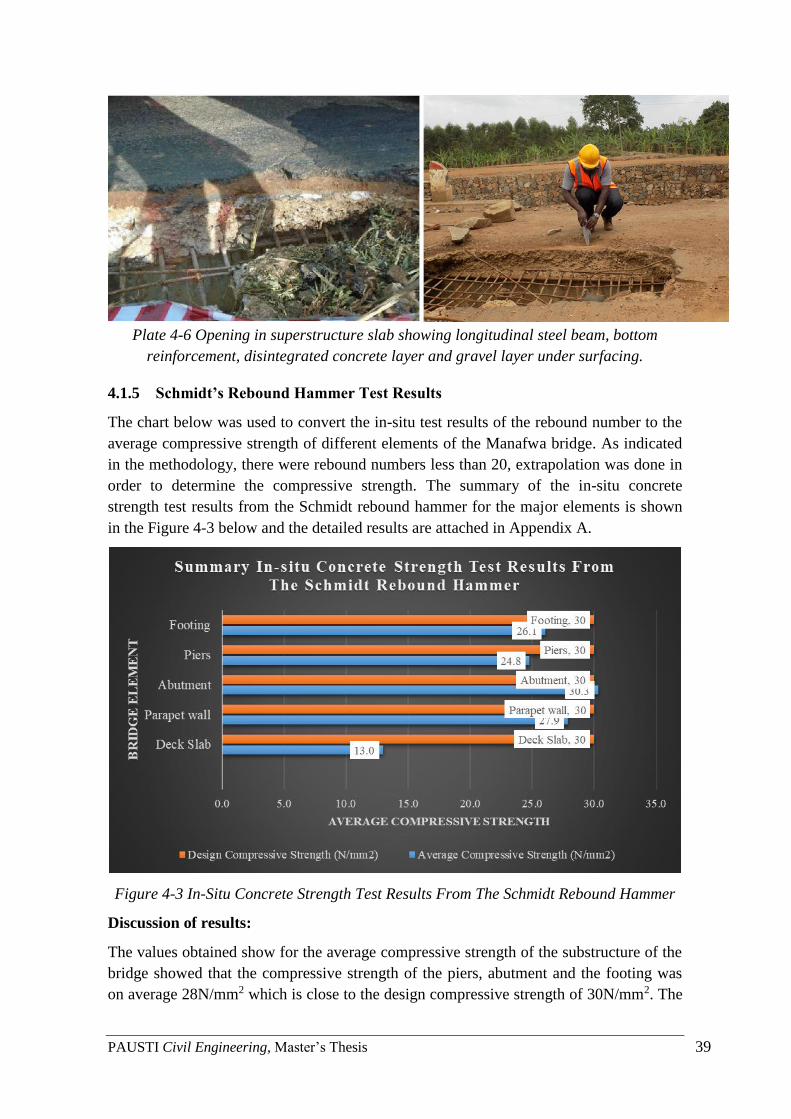
PAUSTI Civil Engineering, Master’s Thesis 39
Plate 4-6 Opening in superstructure slab showing longitudinal steel beam, bottom
reinforcement, disintegrated concrete layer and gravel layer under surfacing.
4.1.5 Schmidt’s Rebound Hammer Test Results
The chart below was used to convert the in-situ test results of the rebound number to the
average compressive strength of different elements of the Manafwa bridge. As indicated
in the methodology, there were rebound numbers less than 20, extrapolation was done in
order to determine the compressive strength. The summary of the in-situ concrete
strength test results from the Schmidt rebound hammer for the major elements is shown
in the Figure 4-3 below and the detailed results are attached in Appendix A.
Figure 4-3 In-Situ Concrete Strength Test Results From The Schmidt Rebound Hammer
Discussion of results:
The values obtained show for the average compressive strength of the substructure of the
bridge showed that the compressive strength of the piers, abutment and the footing was
on average 28N/mm2 which is close to the design compressive strength of 30N/mm2. The

PAUSTI Civil Engineering, Master’s Thesis 40
variation in the strength can be attributed to ageing and fatigue as the bridge has been in
existence for over 80 years since construction. These results also indicate that the
substructure did not suffer any form of failure and can be maintained for further use as it
still has its structural integrity.
The compressive strength of the deck slab obtained from the rebound hammer test was,
however, very low of 13N/mm2 in comparison to the design concrete strength class. The
concrete also exhibited a lot of coarse materials and was loose which was evidence to
support the loss strength results. The results formed the basis for carrying out the
destructive testing on the deck slab to further ascertain the low concrete strength and to
provide an input to the numerical modelling undertaken.
4.1.6 Destructive Test Results - Core Test
The compressive strength values of the bridge deck obtained from the testing of the three
core samples obtained from the field are summarised as in the Figure 4-4 below. The
detailed results are attached in Appendix B.
Figure 4-4 Summary of the core compressive strength results of the deck slab
Discussion of results
The compressive strengths of the three cores obtained from the deck slab are shown in
figure 4-4 above. The mean compressive strength of the Deck Slab is very low (9.6
N/mm2) as shown in Figure 4-5 below. The results of the rebound hammer correspond
with the core tests as both shown that the deck slab had a very low compressive strength.
This is one of the reasons why the deck slab failed by punching shear. Because of this
observation, the punching shear capacity was determined in the next section 4.2 to
ascertain if the decreased concrete strength could not cope with the punching shear
capacity of the deck slab.
In addition, it is possible that the concrete weakening at the point of failure could have
been a result of the fatigue and corrosion behaviour described in section 2.2 of common
causes of structural failure in bridges that could have weakened the concrete over time
hence resulting into the failure of the Bridge. Therefore, the major failure can be
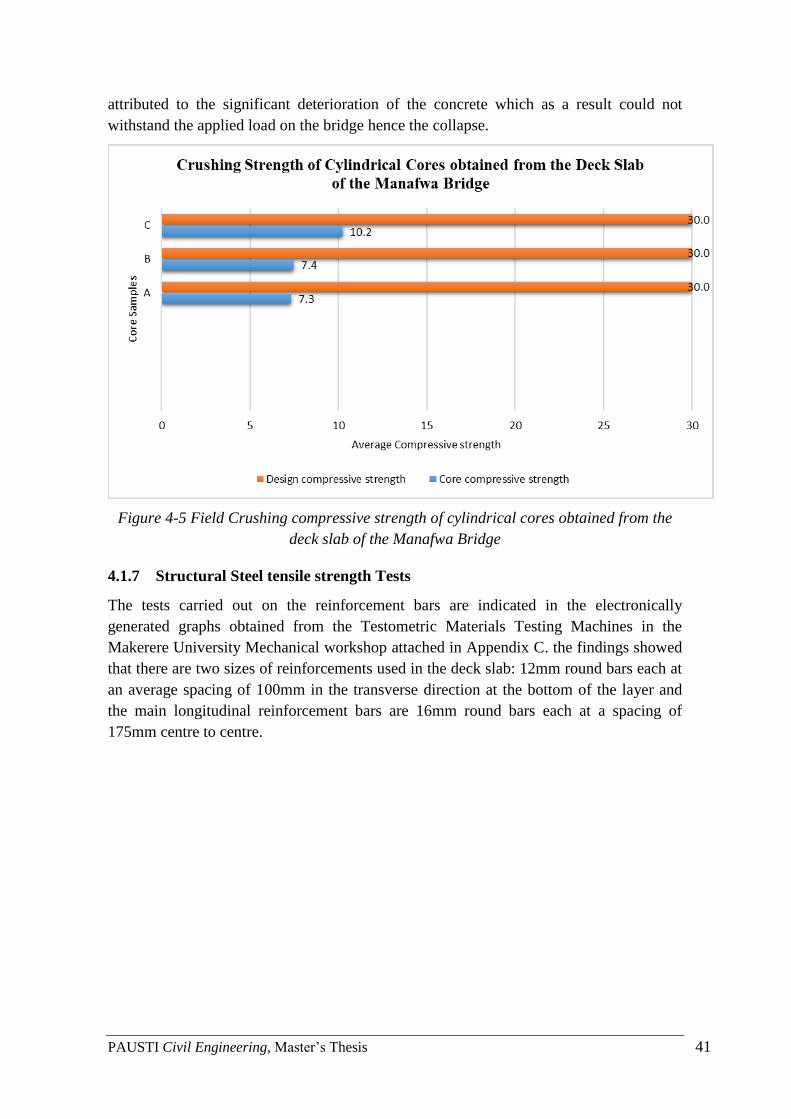
PAUSTI Civil Engineering, Master’s Thesis 41
attributed to the significant deterioration of the concrete which as a result could not
withstand the applied load on the bridge hence the collapse.
Figure 4-5 Field Crushing compressive strength of cylindrical cores obtained from the
deck slab of the Manafwa Bridge
4.1.7 Structural Steel tensile strength Tests
The tests carried out on the reinforcement bars are indicated in the electronically
generated graphs obtained from the Testometric Materials Testing Machines in the
Makerere University Mechanical workshop attached in Appendix C. the findings showed
that there are two sizes of reinforcements used in the deck slab: 12mm round bars each at
an average spacing of 100mm in the transverse direction at the bottom of the layer and
the main longitudinal reinforcement bars are 16mm round bars each at a spacing of
175mm centre to centre.
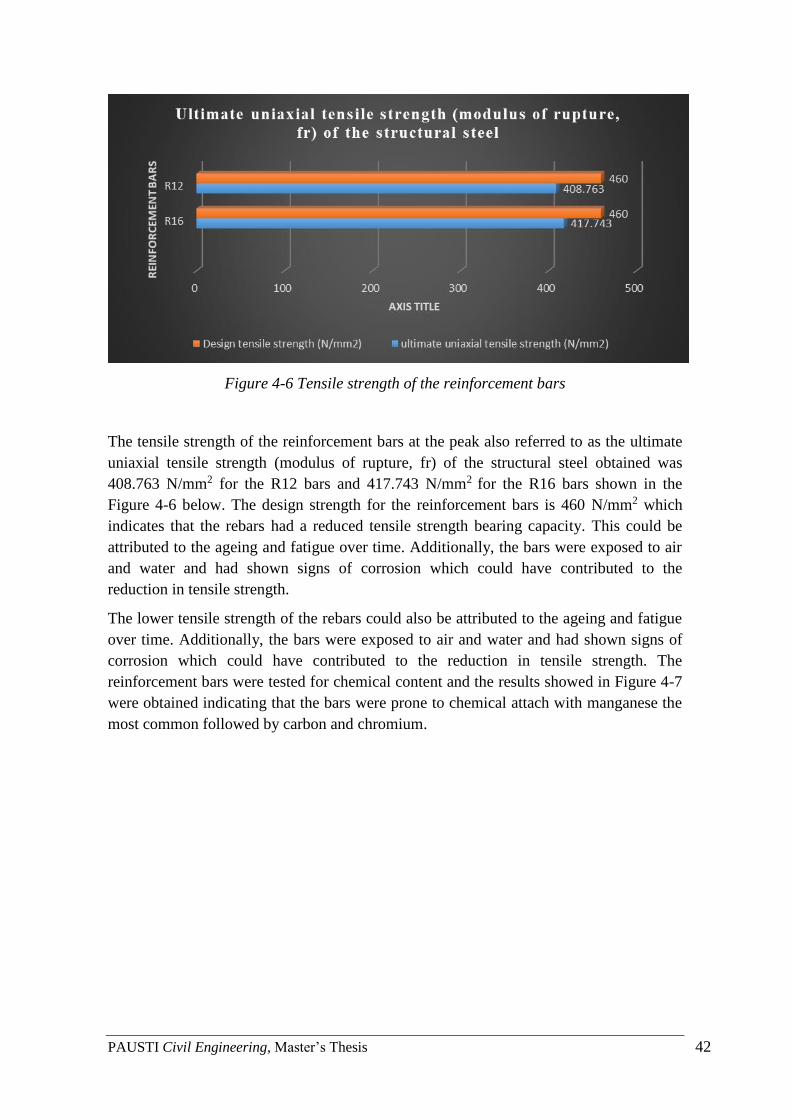
PAUSTI Civil Engineering, Master’s Thesis 42
Figure 4-6 Tensile strength of the reinforcement bars
The tensile strength of the reinforcement bars at the peak also referred to as the ultimate
uniaxial tensile strength (modulus of rupture, fr) of the structural steel obtained was
408.763 N/mm2 for the R12 bars and 417.743 N/mm2 for the R16 bars shown in the
Figure 4-6 below. The design strength for the reinforcement bars is 460 N/mm2 which
indicates that the rebars had a reduced tensile strength bearing capacity. This could be
attributed to the ageing and fatigue over time. Additionally, the bars were exposed to air
and water and had shown signs of corrosion which could have contributed to the
reduction in tensile strength.
The lower tensile strength of the rebars could also be attributed to the ageing and fatigue
over time. Additionally, the bars were exposed to air and water and had shown signs of
corrosion which could have contributed to the reduction in tensile strength. The
reinforcement bars were tested for chemical content and the results showed in Figure 4-7
were obtained indicating that the bars were prone to chemical attach with manganese the
most common followed by carbon and chromium.
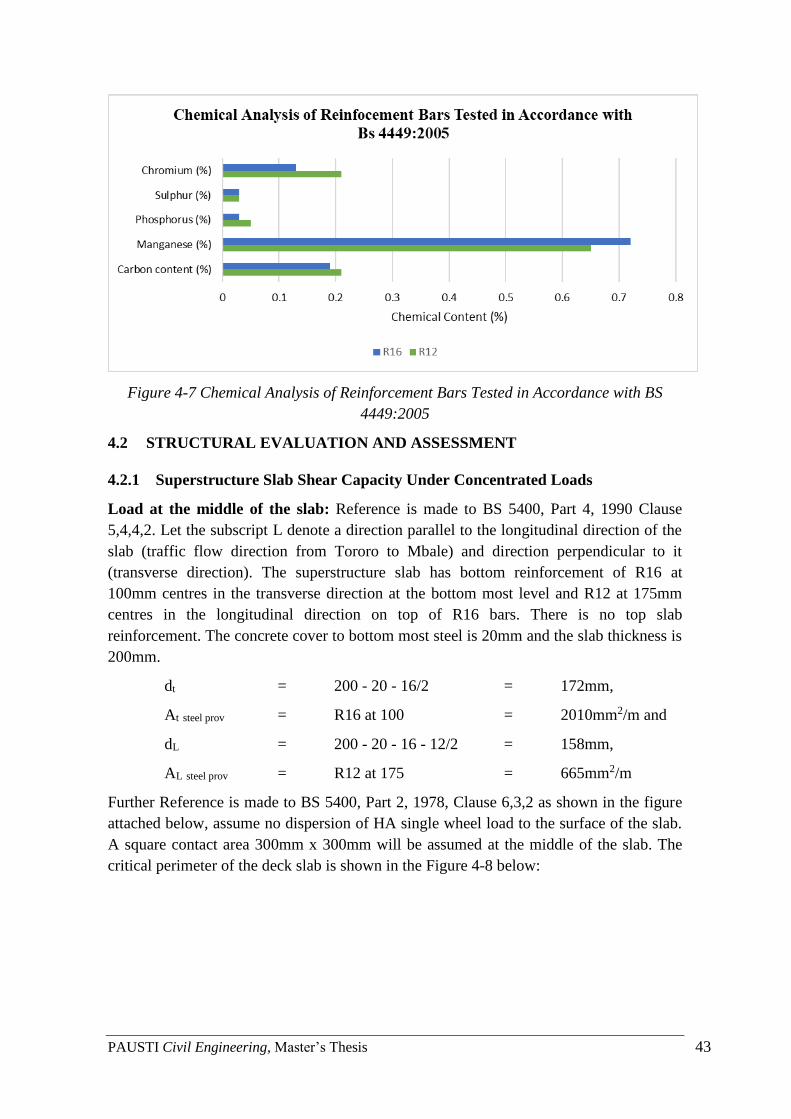
PAUSTI Civil Engineering, Master’s Thesis 43
Figure 4-7 Chemical Analysis of Reinforcement Bars Tested in Accordance with BS
4449:2005
4.2 STRUCTURAL EVALUATION AND ASSESSMENT
4.2.1 Superstructure Slab Shear Capacity Under Concentrated Loads
Load at the middle of the slab: Reference is made to BS 5400, Part 4, 1990 Clause
5,4,4,2. Let the subscript L denote a direction parallel to the longitudinal direction of the
slab (traffic flow direction from Tororo to Mbale) and direction perpendicular to it
(transverse direction). The superstructure slab has bottom reinforcement of R16 at
100mm centres in the transverse direction at the bottom most level and R12 at 175mm
centres in the longitudinal direction on top of R16 bars. There is no top slab
reinforcement. The concrete cover to bottom most steel is 20mm and the slab thickness is
200mm.
dt = 200 - 20 - 16/2 = 172mm,
At steel prov = R16 at 100 = 2010mm2/m and
dL = 200 - 20 - 16 - 12/2 = 158mm,
AL steel prov = R12 at 175 = 665mm2/m
Further Reference is made to BS 5400, Part 2, 1978, Clause 6,3,2 as shown in the figure
attached below, assume no dispersion of HA single wheel load to the surface of the slab.
A square contact area 300mm x 300mm will be assumed at the middle of the slab. The
critical perimeter of the deck slab is shown in the Figure 4-8 below:
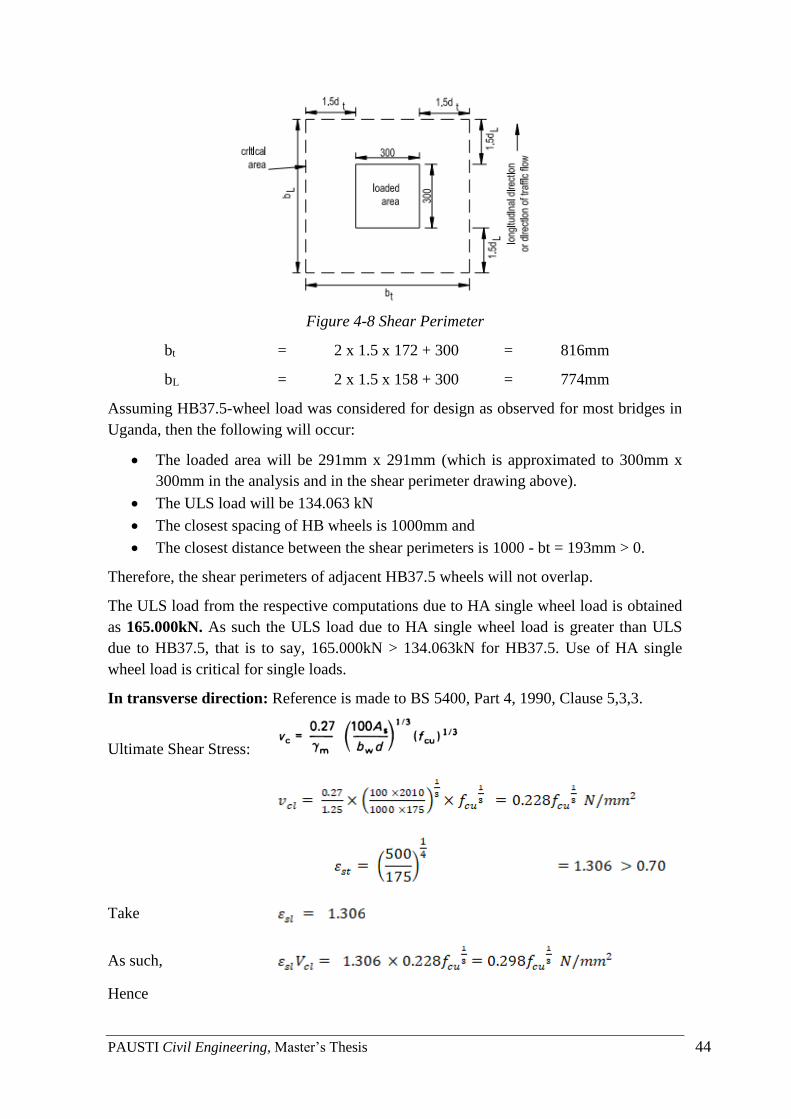
PAUSTI Civil Engineering, Master’s Thesis 44
Figure 4-8 Shear Perimeter
bt = 2 x 1.5 x 172 + 300 = 816mm
bL = 2 x 1.5 x 158 + 300 = 774mm
Assuming HB37.5-wheel load was considered for design as observed for most bridges in
Uganda, then the following will occur:
• The loaded area will be 291mm x 291mm (which is approximated to 300mm x
300mm in the analysis and in the shear perimeter drawing above).
• The ULS load will be 134.063 kN
• The closest spacing of HB wheels is 1000mm and
• The closest distance between the shear perimeters is 1000 - bt = 193mm > 0.
Therefore, the shear perimeters of adjacent HB37.5 wheels will not overlap.
The ULS load from the respective computations due to HA single wheel load is obtained
as 165.000kN. As such the ULS load due to HA single wheel load is greater than ULS
due to HB37.5, that is to say, 165.000kN > 134.063kN for HB37.5. Use of HA single
wheel load is critical for single loads.
In transverse direction: Reference is made to BS 5400, Part 4, 1990, Clause 5,3,3.
Ultimate Shear Stress:
Take
As such,
Hence

PAUSTI Civil Engineering, Master’s Thesis 45
In longitudinal direction
Ultimate Shear Stress:
Take
As such,
Hence
Shear resistance at the critical slab section
Ultimate limit state shear load (ULS) exerted by the HA single wheel load is:
ULS HA = 100 kN x 1.5 x 1.1 = 165kN
ULS dead load of slab within the shear perimeter
ULS Dead Load = 0.816m x 0.774m x 0.2m x 25kN/m3 x 1.32
= 4.168 kN
ULS superimposed dead load due to the 100mm thick asphalt concrete surfacing
ULS Asphalt surfacing = 0.816m x 0.774m x 0.100m x 25kN/m3 x 1.925
= 3.039 kN
The shear force acting on the critical slab section
Shear force, V = 165kN + 4.168kN + 3.039kN
= 172.207 kN
Maximum shear stress allowed in the slab, τ, is lesser of or 4.75 N/mm2
Maximum Allowable Shear,
Va = τ (2btdL + 2bLdt)

PAUSTI Civil Engineering, Master’s Thesis 46
= 524.112 τ kN > Vc > V
The condition Va > V should be satisfied
And No shear reinforcement is required when Vc > V
Table 4-1 Punching shear capacity of existing superstructure slab for loading applied at
the middle point of the slab.
Concrete
strength, fcu,
(N/mm2)
Maximum
allowable
shear, Va,
(kN)
Shear
capacity,
Vc, (kN)
Applied
shear, V,
(kN)
Comment
5 878.963 230.917 172.207 No reinforcement required
10 1243.041 290.937 172.207 No reinforcement required
15 1522.408 333.040 172.207 No reinforcement required
20 1757.925 366.558 172.207 No reinforcement required
25 1965.420 394.862 172.207 No reinforcement required
30 2153.010 419.604 172.207 No reinforcement required
The above results in Table 4-1 show that the existing slab is adequate in punching shear
for the different range of concrete strengths (including the current strength obtained from
the non-destructive testing carried out) considered as such could not have failed due to
punching shear.
Load at the edge of the slab: The carriageway portion of the superstructure slab is
bounded by longitudinal beams and transverse abutment concrete wall into which the
superstructure longitudinal beams are encased at ends hence there is no need to check for
shear due to concentrated loads.
4.2.2 Superstructure Slab Moment Capacity
4.2.2.1 Moment capacity of the Existing slab
For a given amount of tension steel, As, of design characteristic strength, fy, and effective
depth, d, the ultimate limit state, ULS, moment capacity of a reinforced rectangular
concrete section with no compression reinforcement, is obtained from the formula below
obtained from a typical Bridge design example (derived from BS 8110):
Where
fcu = characteristic strength of concrete and b = width of concrete section.
Let the subscript L denote a direction parallel to the longitudinal direction of the slab
(traffic flow direction) and t a direction perpendicular to it (transverse direction) as
described in the previous section. The superstructure slab has bottom reinforcement of
R16 at 100mm centres in the transverse direction at bottom most level and R12 at 175mm
centres in longitudinal direction on top of R16 bars. There is no top slab reinforcement.
The concrete cover to bottom most steel is 20mm and the slab thickness is 200mm.
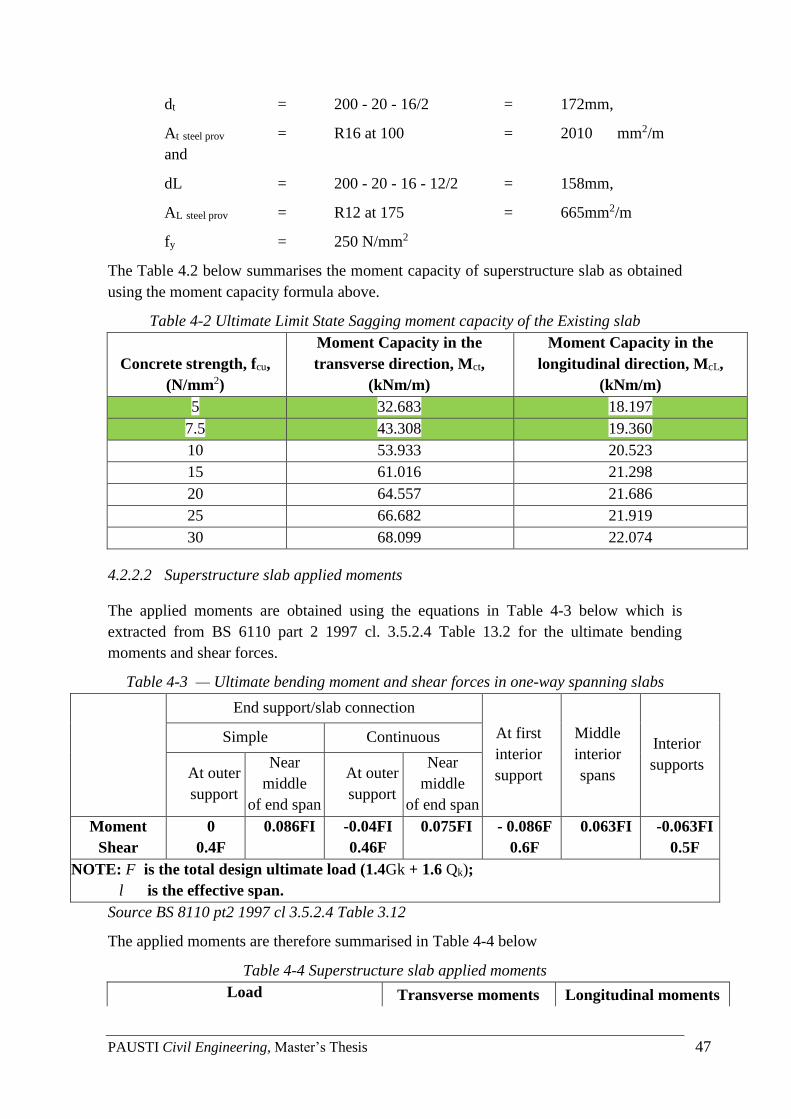
PAUSTI Civil Engineering, Master’s Thesis 47
dt = 200 - 20 - 16/2 = 172mm,
At steel prov = R16 at 100 = 2010 mm2/m
and
dL = 200 - 20 - 16 - 12/2 = 158mm,
AL steel prov = R12 at 175 = 665mm2/m
fy = 250 N/mm2
The Table 4.2 below summarises the moment capacity of superstructure slab as obtained
using the moment capacity formula above.
Table 4-2 Ultimate Limit State Sagging moment capacity of the Existing slab
Concrete strength, fcu,
(N/mm2)
Moment Capacity in the
transverse direction, Mct,
(kNm/m)
Moment Capacity in the
longitudinal direction, McL,
(kNm/m)
5 32.683 18.197
7.5 43.308 19.360
10 53.933 20.523
15 61.016 21.298
20 64.557 21.686
25 66.682 21.919
30 68.099 22.074
4.2.2.2 Superstructure slab applied moments
The applied moments are obtained using the equations in Table 4-3 below which is
extracted from BS 6110 part 2 1997 cl. 3.5.2.4 Table 13.2 for the ultimate bending
moments and shear forces.
Table 4-3 — Ultimate bending moment and shear forces in one-way spanning slabs
End support/slab connection
At first
interior
support
Middle
interior
spans
Interior
supports
Simple Continuous
At outer
support
Near
middle
of end span
At outer
support
Near
middle
of end span
Moment
Shear
0
0.4F
0.086FI -0.04FI
0.46F
0.075FI - 0.086F
0.6F
0.063FI -0.063FI
0.5F
NOTE: F is the total design ultimate load (1.4Gk + 1.6 Qk);
l is the effective span.
Source BS 8110 pt2 1997 cl 3.5.2.4 Table 3.12
The applied moments are therefore summarised in Table 4-4 below
Table 4-4 Superstructure slab applied moments
Load Transverse moments Longitudinal moments
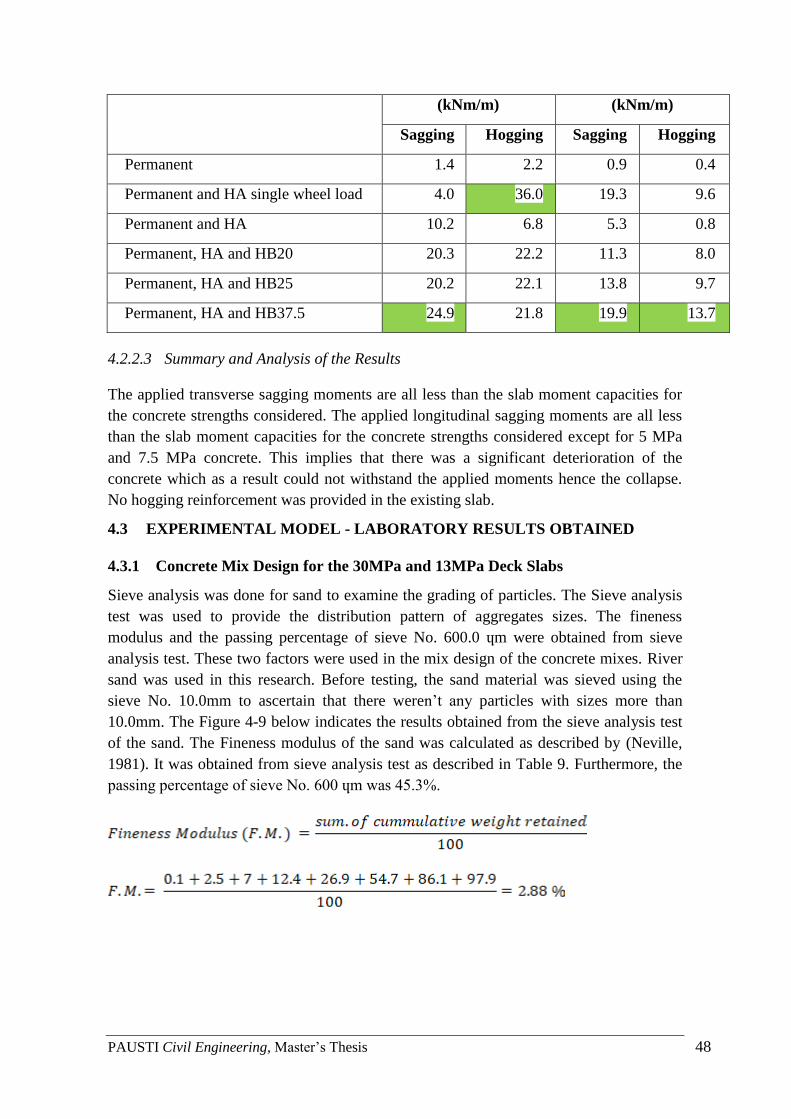
PAUSTI Civil Engineering, Master’s Thesis 48
(kNm/m) (kNm/m)
Sagging Hogging Sagging Hogging
Permanent 1.4 2.2 0.9 0.4
Permanent and HA single wheel load 4.0 36.0 19.3 9.6
Permanent and HA 10.2 6.8 5.3 0.8
Permanent, HA and HB20 20.3 22.2 11.3 8.0
Permanent, HA and HB25 20.2 22.1 13.8 9.7
Permanent, HA and HB37.5 24.9 21.8 19.9 13.7
4.2.2.3 Summary and Analysis of the Results
The applied transverse sagging moments are all less than the slab moment capacities for
the concrete strengths considered. The applied longitudinal sagging moments are all less
than the slab moment capacities for the concrete strengths considered except for 5 MPa
and 7.5 MPa concrete. This implies that there was a significant deterioration of the
concrete which as a result could not withstand the applied moments hence the collapse.
No hogging reinforcement was provided in the existing slab.
4.3 EXPERIMENTAL MODEL - LABORATORY RESULTS OBTAINED
4.3.1 Concrete Mix Design for the 30MPa and 13MPa Deck Slabs
Sieve analysis was done for sand to examine the grading of particles. The Sieve analysis
test was used to provide the distribution pattern of aggregates sizes. The fineness
modulus and the passing percentage of sieve No. 600.0 ɥm were obtained from sieve
analysis test. These two factors were used in the mix design of the concrete mixes. River
sand was used in this research. Before testing, the sand material was sieved using the
sieve No. 10.0mm to ascertain that there weren’t any particles with sizes more than
10.0mm. The Figure 4-9 below indicates the results obtained from the sieve analysis test
of the sand. The Fineness modulus of the sand was calculated as described by (Neville,
1981). It was obtained from sieve analysis test as described in Table 9. Furthermore, the
passing percentage of sieve No. 600 ɥm was 45.3%.
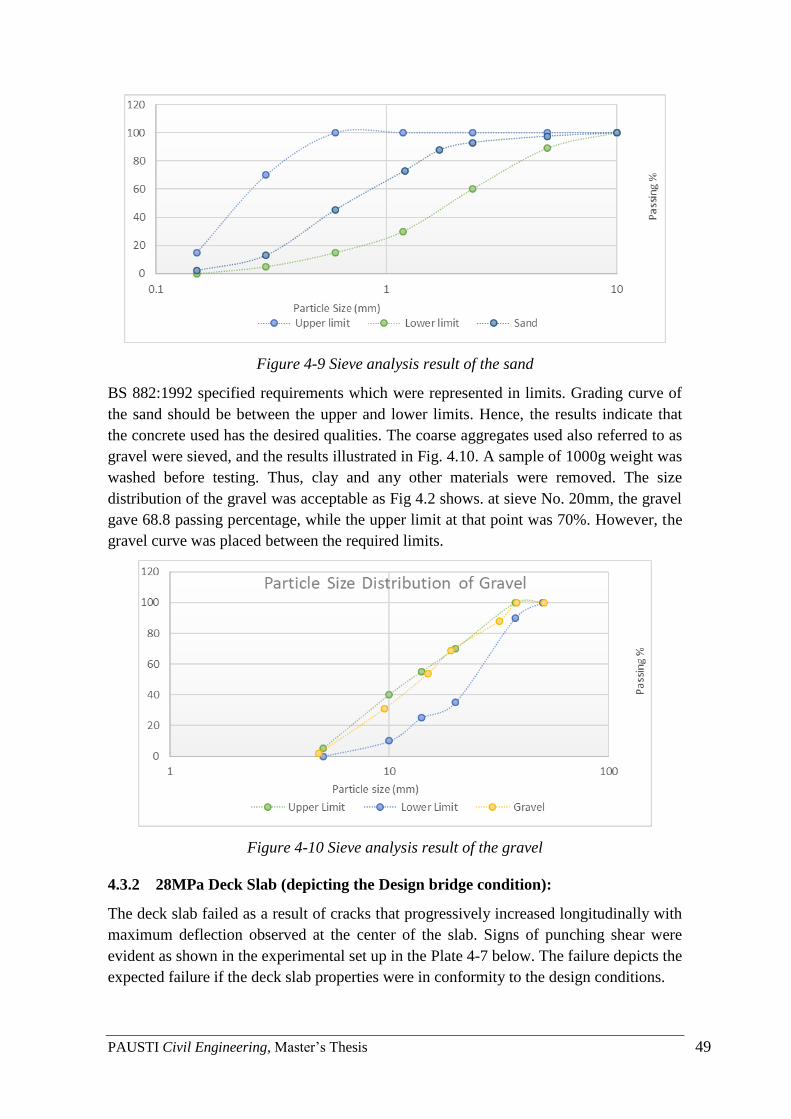
PAUSTI Civil Engineering, Master’s Thesis 49
Figure 4-9 Sieve analysis result of the sand
BS 882:1992 specified requirements which were represented in limits. Grading curve of
the sand should be between the upper and lower limits. Hence, the results indicate that
the concrete used has the desired qualities. The coarse aggregates used also referred to as
gravel were sieved, and the results illustrated in Fig. 4.10. A sample of 1000g weight was
washed before testing. Thus, clay and any other materials were removed. The size
distribution of the gravel was acceptable as Fig 4.2 shows. at sieve No. 20mm, the gravel
gave 68.8 passing percentage, while the upper limit at that point was 70%. However, the
gravel curve was placed between the required limits.
Figure 4-10 Sieve analysis result of the gravel
4.3.2 28MPa Deck Slab (depicting the Design bridge condition):
The deck slab failed as a result of cracks that progressively increased longitudinally with
maximum deflection observed at the center of the slab. Signs of punching shear were
evident as shown in the experimental set up in the Plate 4-7 below. The failure depicts the
expected failure if the deck slab properties were in conformity to the design conditions.
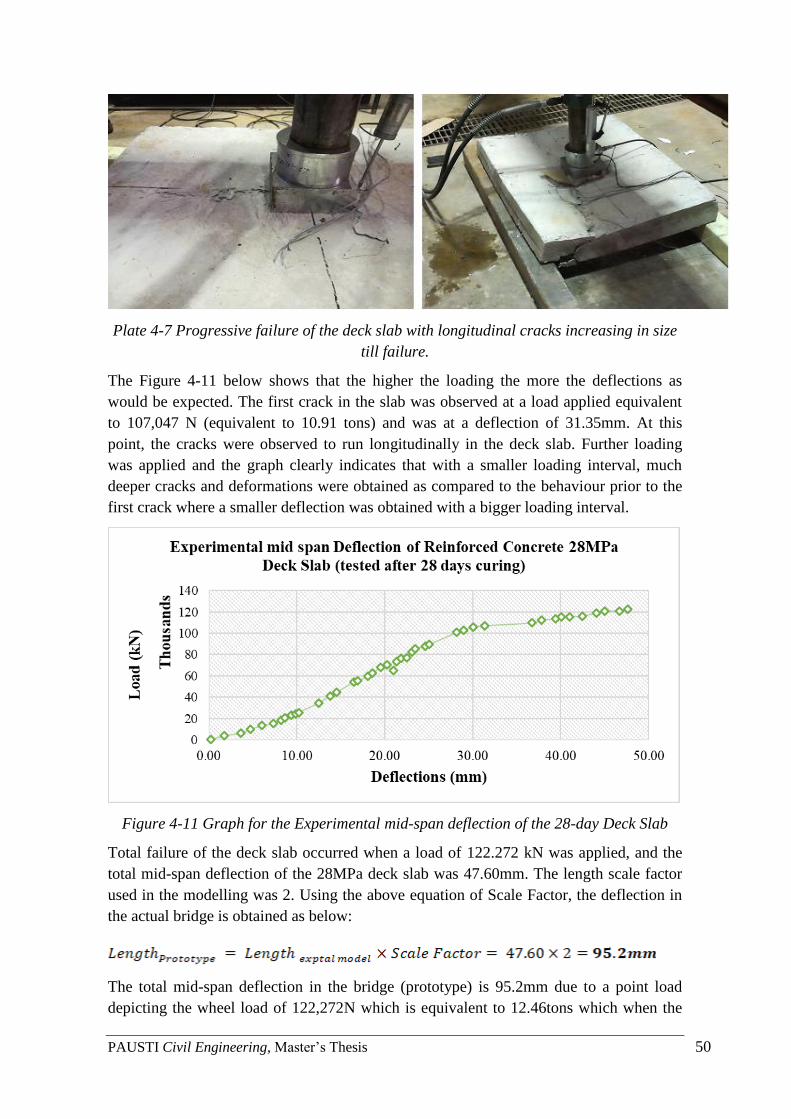
PAUSTI Civil Engineering, Master’s Thesis 50
Plate 4-7 Progressive failure of the deck slab with longitudinal cracks increasing in size
till failure.
The Figure 4-11 below shows that the higher the loading the more the deflections as
would be expected. The first crack in the slab was observed at a load applied equivalent
to 107,047 N (equivalent to 10.91 tons) and was at a deflection of 31.35mm. At this
point, the cracks were observed to run longitudinally in the deck slab. Further loading
was applied and the graph clearly indicates that with a smaller loading interval, much
deeper cracks and deformations were obtained as compared to the behaviour prior to the
first crack where a smaller deflection was obtained with a bigger loading interval.
Figure 4-11 Graph for the Experimental mid-span deflection of the 28-day Deck Slab
Total failure of the deck slab occurred when a load of 122.272 kN was applied, and the
total mid-span deflection of the 28MPa deck slab was 47.60mm. The length scale factor
used in the modelling was 2. Using the above equation of Scale Factor, the deflection in
the actual bridge is obtained as below:
The total mid-span deflection in the bridge (prototype) is 95.2mm due to a point load
depicting the wheel load of 122,272N which is equivalent to 12.46tons which when the
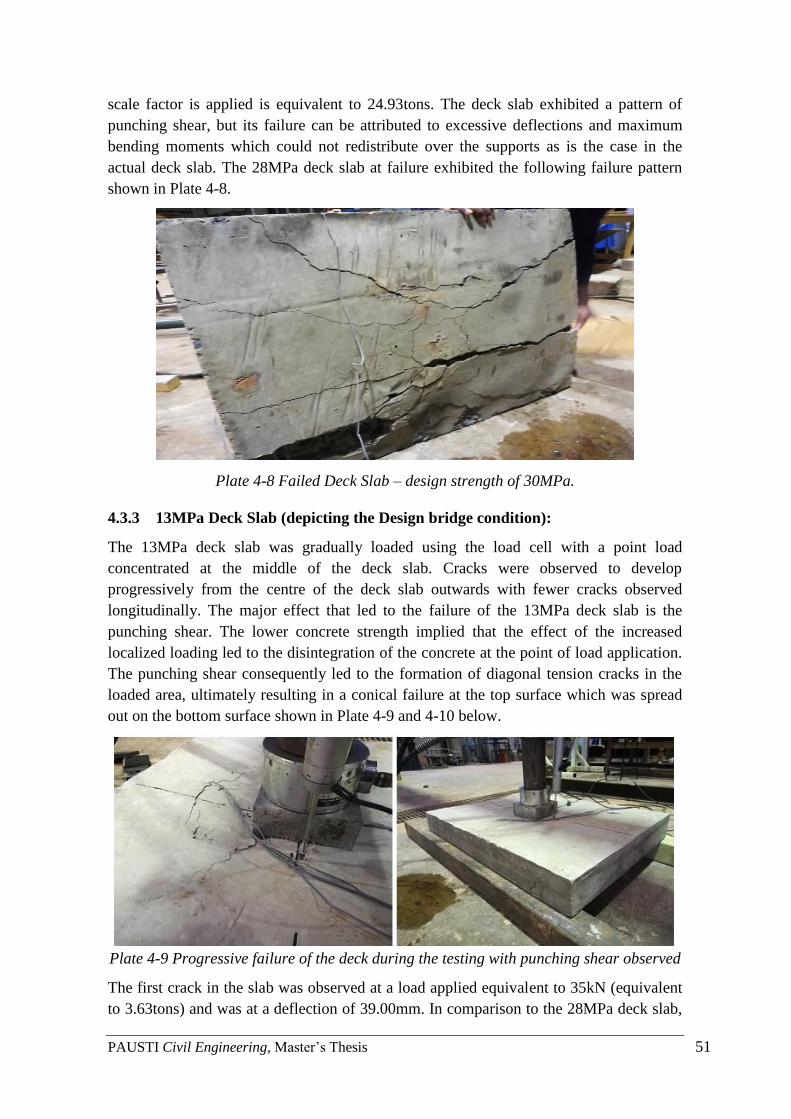
PAUSTI Civil Engineering, Master’s Thesis 51
scale factor is applied is equivalent to 24.93tons. The deck slab exhibited a pattern of
punching shear, but its failure can be attributed to excessive deflections and maximum
bending moments which could not redistribute over the supports as is the case in the
actual deck slab. The 28MPa deck slab at failure exhibited the following failure pattern
shown in Plate 4-8.
Plate 4-8 Failed Deck Slab – design strength of 30MPa.
4.3.3 13MPa Deck Slab (depicting the Design bridge condition):
The 13MPa deck slab was gradually loaded using the load cell with a point load
concentrated at the middle of the deck slab. Cracks were observed to develop
progressively from the centre of the deck slab outwards with fewer cracks observed
longitudinally. The major effect that led to the failure of the 13MPa deck slab is the
punching shear. The lower concrete strength implied that the effect of the increased
localized loading led to the disintegration of the concrete at the point of load application.
The punching shear consequently led to the formation of diagonal tension cracks in the
loaded area, ultimately resulting in a conical failure at the top surface which was spread
out on the bottom surface shown in Plate 4-9 and 4-10 below.
Plate 4-9 Progressive failure of the deck during the testing with punching shear observed
The first crack in the slab was observed at a load applied equivalent to 35kN (equivalent
to 3.63tons) and was at a deflection of 39.00mm. In comparison to the 28MPa deck slab,
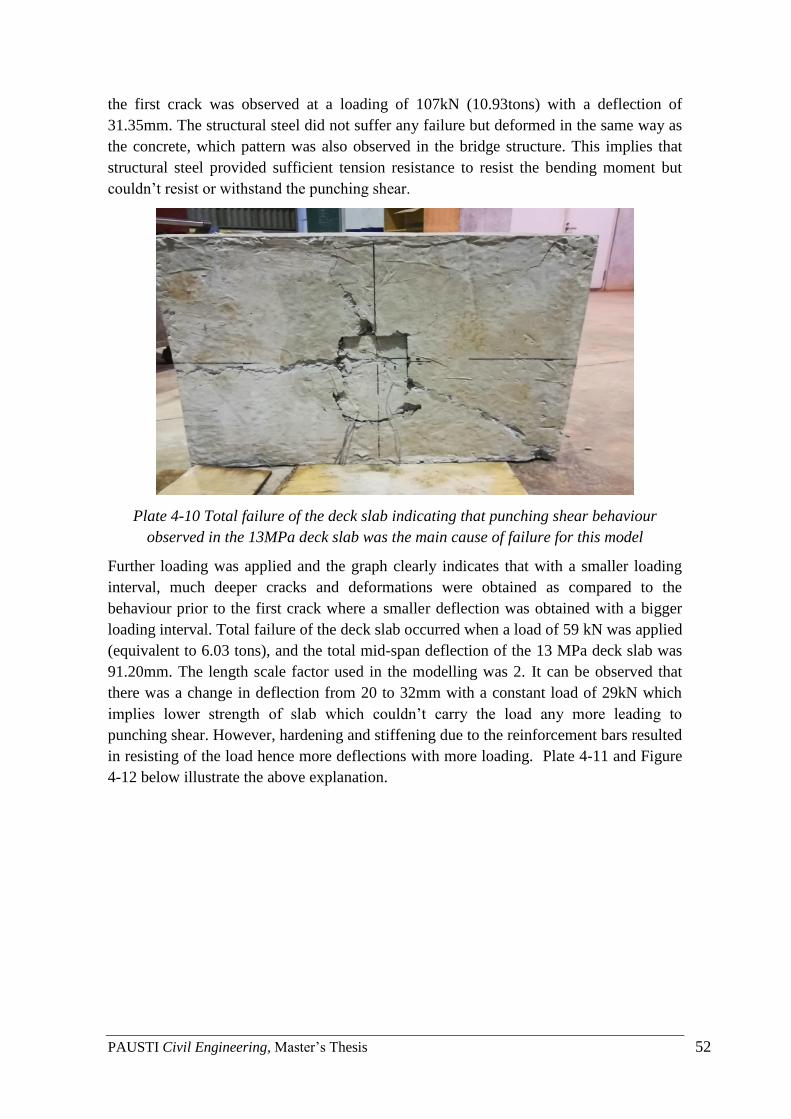
PAUSTI Civil Engineering, Master’s Thesis 52
the first crack was observed at a loading of 107kN (10.93tons) with a deflection of
31.35mm. The structural steel did not suffer any failure but deformed in the same way as
the concrete, which pattern was also observed in the bridge structure. This implies that
structural steel provided sufficient tension resistance to resist the bending moment but
couldn’t resist or withstand the punching shear.
Plate 4-10 Total failure of the deck slab indicating that punching shear behaviour
observed in the 13MPa deck slab was the main cause of failure for this model
Further loading was applied and the graph clearly indicates that with a smaller loading
interval, much deeper cracks and deformations were obtained as compared to the
behaviour prior to the first crack where a smaller deflection was obtained with a bigger
loading interval. Total failure of the deck slab occurred when a load of 59 kN was applied
(equivalent to 6.03 tons), and the total mid-span deflection of the 13 MPa deck slab was
91.20mm. The length scale factor used in the modelling was 2. It can be observed that
there was a change in deflection from 20 to 32mm with a constant load of 29kN which
implies lower strength of slab which couldn’t carry the load any more leading to
punching shear. However, hardening and stiffening due to the reinforcement bars resulted
in resisting of the load hence more deflections with more loading. Plate 4-11 and Figure
4-12 below illustrate the above explanation.
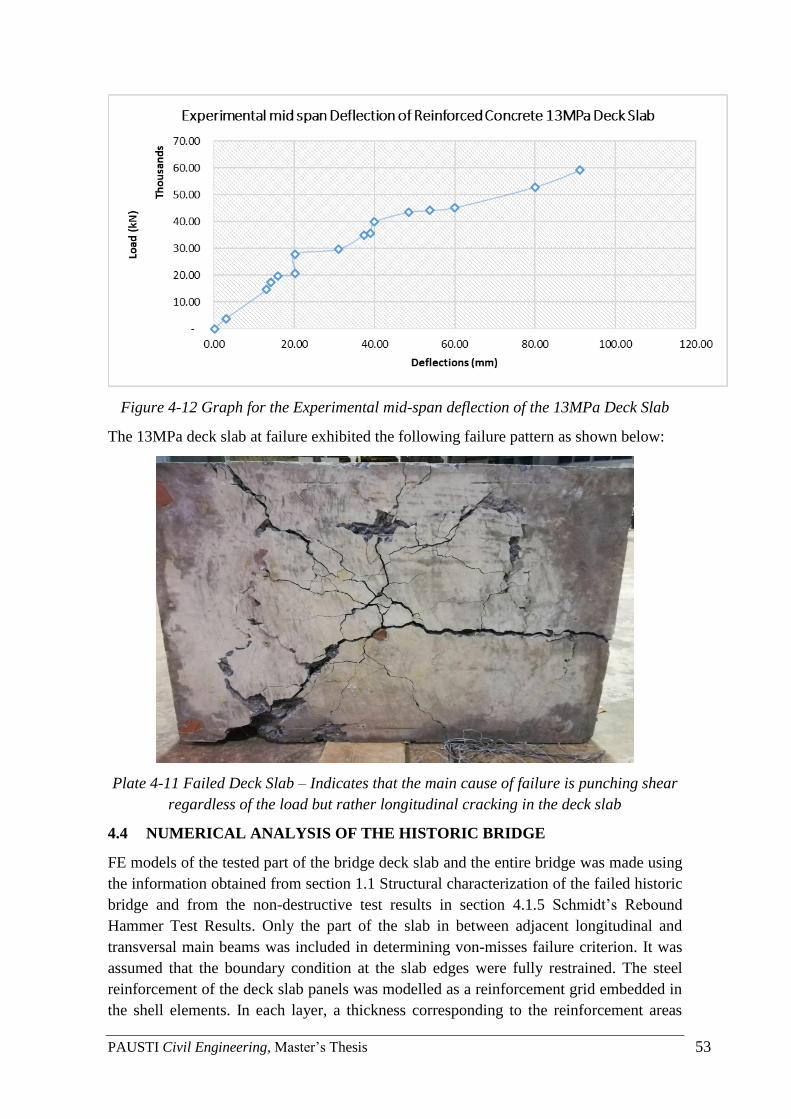
PAUSTI Civil Engineering, Master’s Thesis 53
Figure 4-12 Graph for the Experimental mid-span deflection of the 13MPa Deck Slab
The 13MPa deck slab at failure exhibited the following failure pattern as shown below:
Plate 4-11 Failed Deck Slab – Indicates that the main cause of failure is punching shear
regardless of the load but rather longitudinal cracking in the deck slab
4.4 NUMERICAL ANALYSIS OF THE HISTORIC BRIDGE
FE models of the tested part of the bridge deck slab and the entire bridge was made using
the information obtained from section 1.1 Structural characterization of the failed historic
bridge and from the non-destructive test results in section 4.1.5 Schmidt’s Rebound
Hammer Test Results. Only the part of the slab in between adjacent longitudinal and
transversal main beams was included in determining von-misses failure criterion. It was
assumed that the boundary condition at the slab edges were fully restrained. The steel
reinforcement of the deck slab panels was modelled as a reinforcement grid embedded in
the shell elements. In each layer, a thickness corresponding to the reinforcement areas
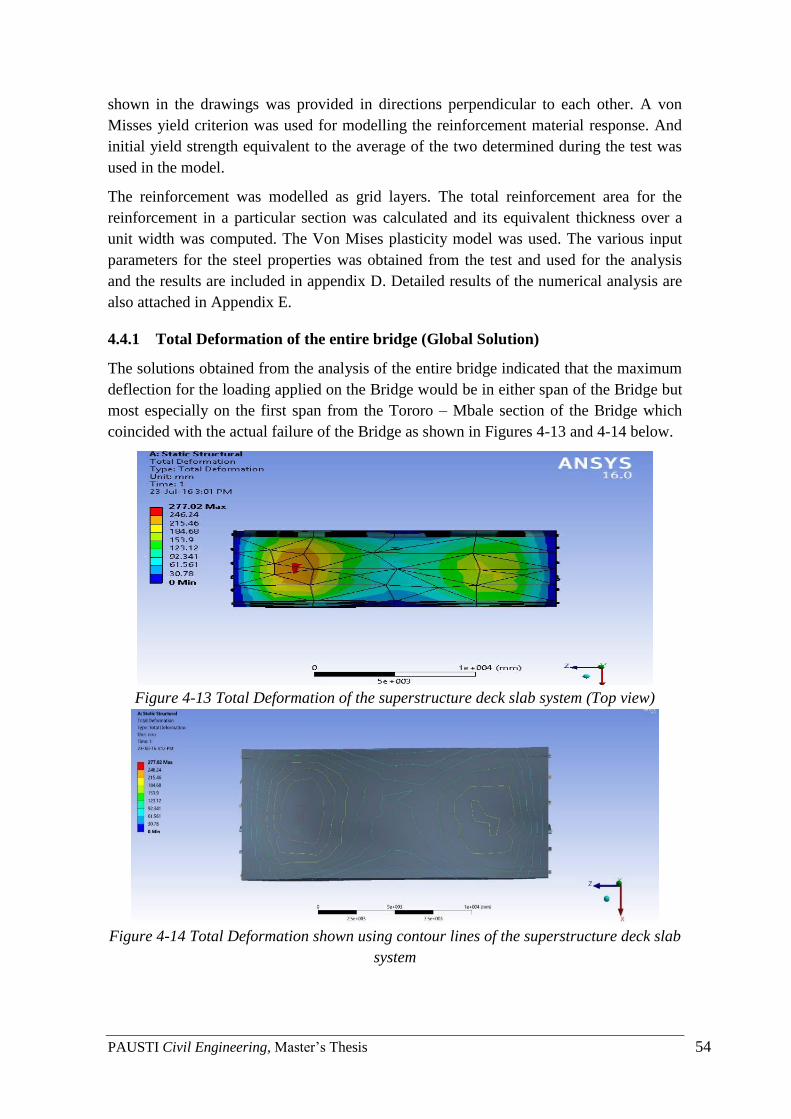
PAUSTI Civil Engineering, Master’s Thesis 54
shown in the drawings was provided in directions perpendicular to each other. A von
Misses yield criterion was used for modelling the reinforcement material response. And
initial yield strength equivalent to the average of the two determined during the test was
used in the model.
The reinforcement was modelled as grid layers. The total reinforcement area for the
reinforcement in a particular section was calculated and its equivalent thickness over a
unit width was computed. The Von Mises plasticity model was used. The various input
parameters for the steel properties was obtained from the test and used for the analysis
and the results are included in appendix D. Detailed results of the numerical analysis are
also attached in Appendix E.
4.4.1 Total Deformation of the entire bridge (Global Solution)
The solutions obtained from the analysis of the entire bridge indicated that the maximum
deflection for the loading applied on the Bridge would be in either span of the Bridge but
most especially on the first span from the Tororo – Mbale section of the Bridge which
coincided with the actual failure of the Bridge as shown in Figures 4-13 and 4-14 below.
Figure 4-13 Total Deformation of the superstructure deck slab system (Top view)
Figure 4-14 Total Deformation shown using contour lines of the superstructure deck slab
system
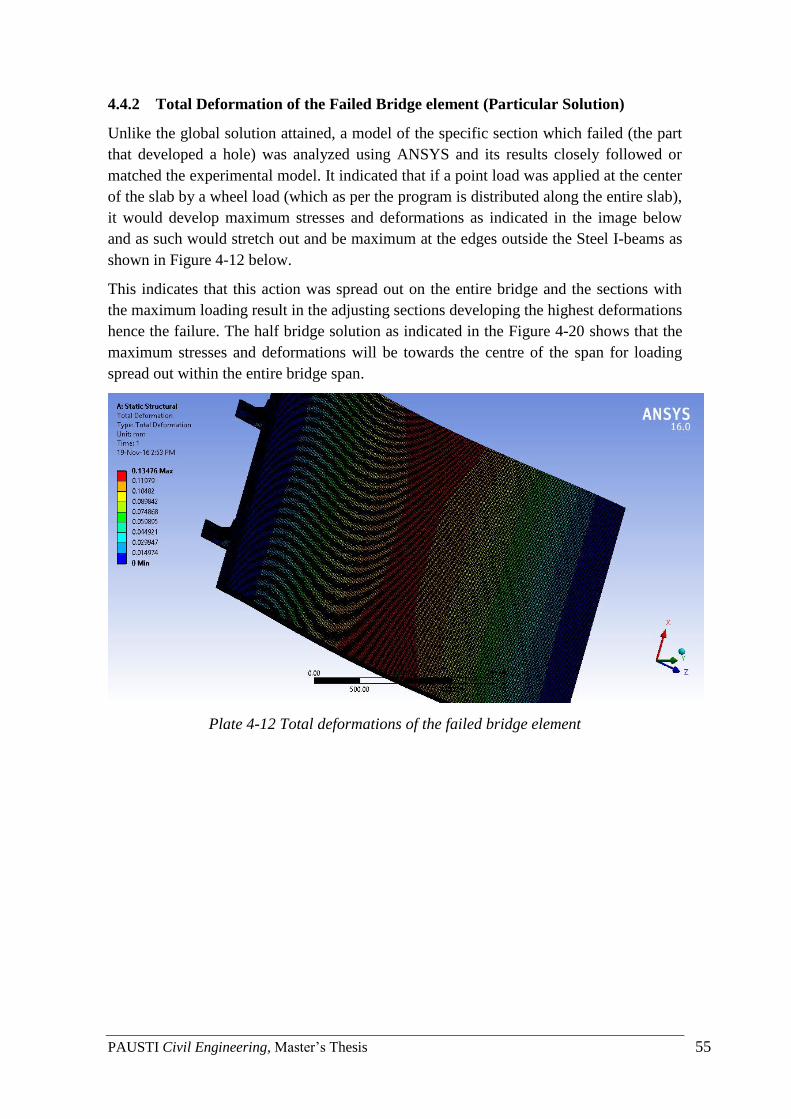
PAUSTI Civil Engineering, Master’s Thesis 55
4.4.2 Total Deformation of the Failed Bridge element (Particular Solution)
Unlike the global solution attained, a model of the specific section which failed (the part
that developed a hole) was analyzed using ANSYS and its results closely followed or
matched the experimental model. It indicated that if a point load was applied at the center
of the slab by a wheel load (which as per the program is distributed along the entire slab),
it would develop maximum stresses and deformations as indicated in the image below
and as such would stretch out and be maximum at the edges outside the Steel I-beams as
shown in Figure 4-12 below.
This indicates that this action was spread out on the entire bridge and the sections with
the maximum loading result in the adjusting sections developing the highest deformations
hence the failure. The half bridge solution as indicated in the Figure 4-20 shows that the
maximum stresses and deformations will be towards the centre of the span for loading
spread out within the entire bridge span.
Plate 4-12 Total deformations of the failed bridge element
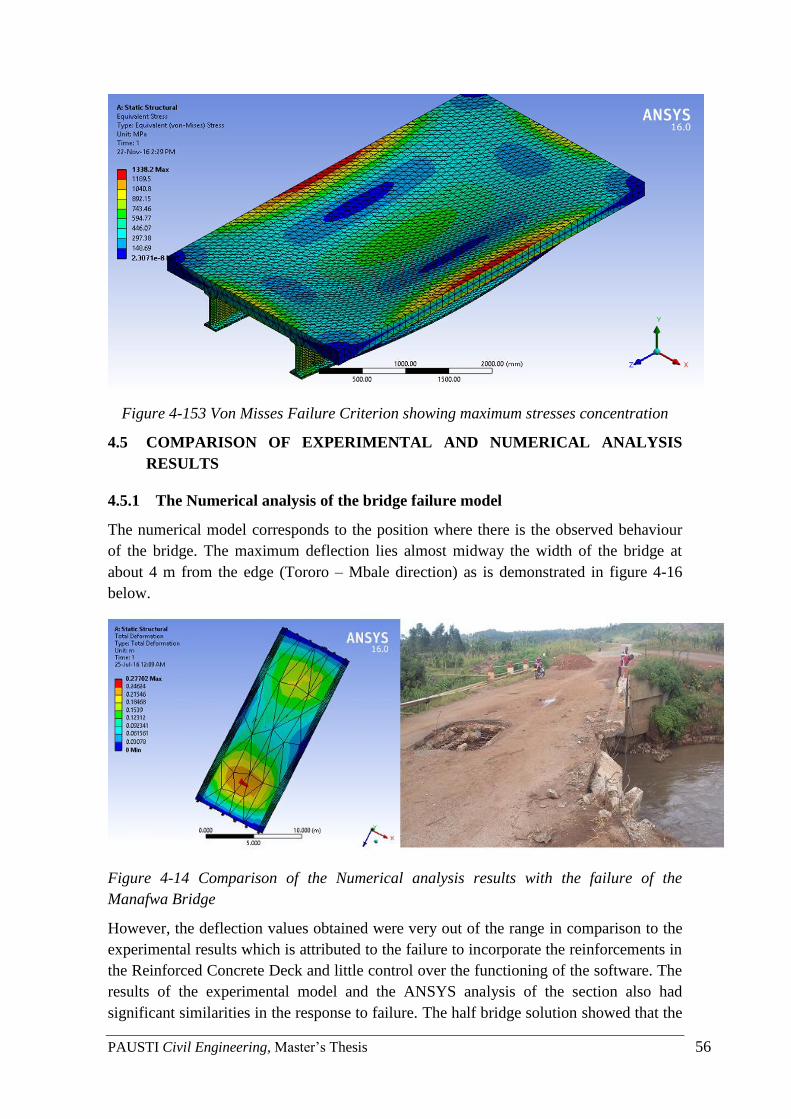
PAUSTI Civil Engineering, Master’s Thesis 56
Figure 4-153 Von Misses Failure Criterion showing maximum stresses concentration
4.5 COMPARISON OF EXPERIMENTAL AND NUMERICAL ANALYSIS
RESULTS
4.5.1 The Numerical analysis of the bridge failure model
The numerical model corresponds to the position where there is the observed behaviour
of the bridge. The maximum deflection lies almost midway the width of the bridge at
about 4 m from the edge (Tororo – Mbale direction) as is demonstrated in figure 4-16
below.
Figure 4-14 Comparison of the Numerical analysis results with the failure of the
Manafwa Bridge
However, the deflection values obtained were very out of the range in comparison to the
experimental results which is attributed to the failure to incorporate the reinforcements in
the Reinforced Concrete Deck and little control over the functioning of the software. The
results of the experimental model and the ANSYS analysis of the section also had
significant similarities in the response to failure. The half bridge solution showed that the
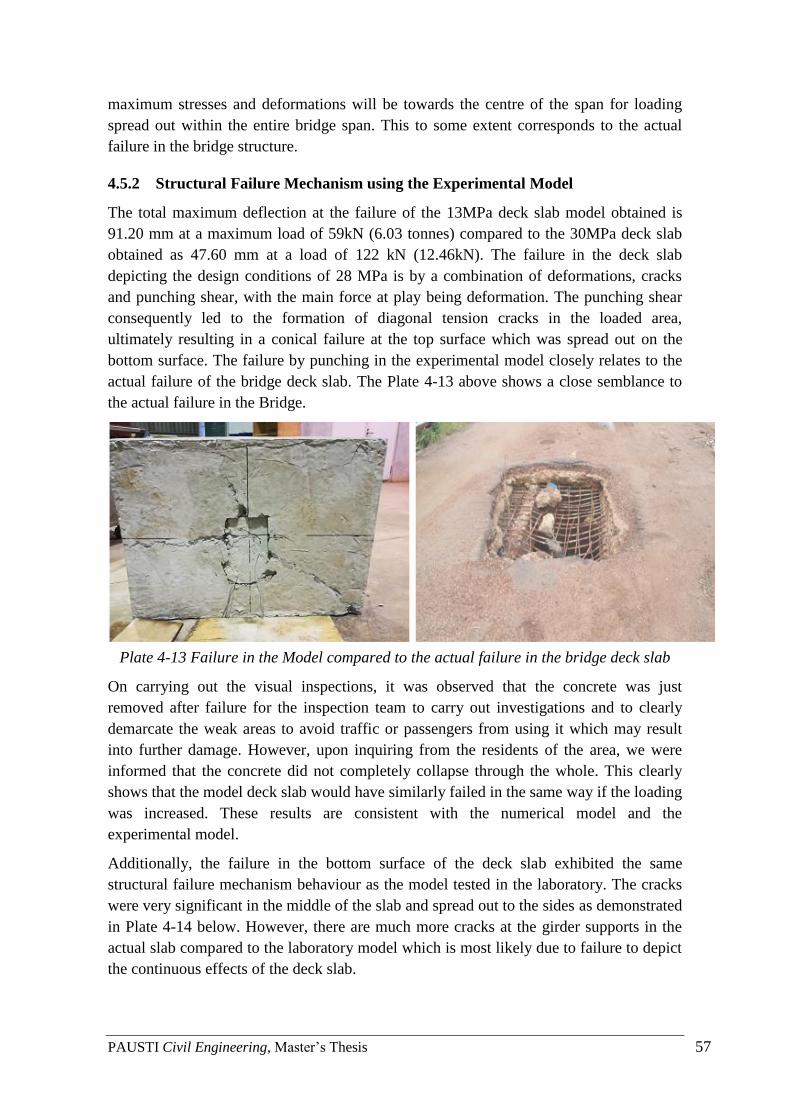
PAUSTI Civil Engineering, Master’s Thesis 57
maximum stresses and deformations will be towards the centre of the span for loading
spread out within the entire bridge span. This to some extent corresponds to the actual
failure in the bridge structure.
4.5.2 Structural Failure Mechanism using the Experimental Model
The total maximum deflection at the failure of the 13MPa deck slab model obtained is
91.20 mm at a maximum load of 59kN (6.03 tonnes) compared to the 30MPa deck slab
obtained as 47.60 mm at a load of 122 kN (12.46kN). The failure in the deck slab
depicting the design conditions of 28 MPa is by a combination of deformations, cracks
and punching shear, with the main force at play being deformation. The punching shear
consequently led to the formation of diagonal tension cracks in the loaded area,
ultimately resulting in a conical failure at the top surface which was spread out on the
bottom surface. The failure by punching in the experimental model closely relates to the
actual failure of the bridge deck slab. The Plate 4-13 above shows a close semblance to
the actual failure in the Bridge.
Plate 4-13 Failure in the Model compared to the actual failure in the bridge deck slab
On carrying out the visual inspections, it was observed that the concrete was just
removed after failure for the inspection team to carry out investigations and to clearly
demarcate the weak areas to avoid traffic or passengers from using it which may result
into further damage. However, upon inquiring from the residents of the area, we were
informed that the concrete did not completely collapse through the whole. This clearly
shows that the model deck slab would have similarly failed in the same way if the loading
was increased. These results are consistent with the numerical model and the
experimental model.
Additionally, the failure in the bottom surface of the deck slab exhibited the same
structural failure mechanism behaviour as the model tested in the laboratory. The cracks
were very significant in the middle of the slab and spread out to the sides as demonstrated
in Plate 4-14 below. However, there are much more cracks at the girder supports in the
actual slab compared to the laboratory model which is most likely due to failure to depict
the continuous effects of the deck slab.
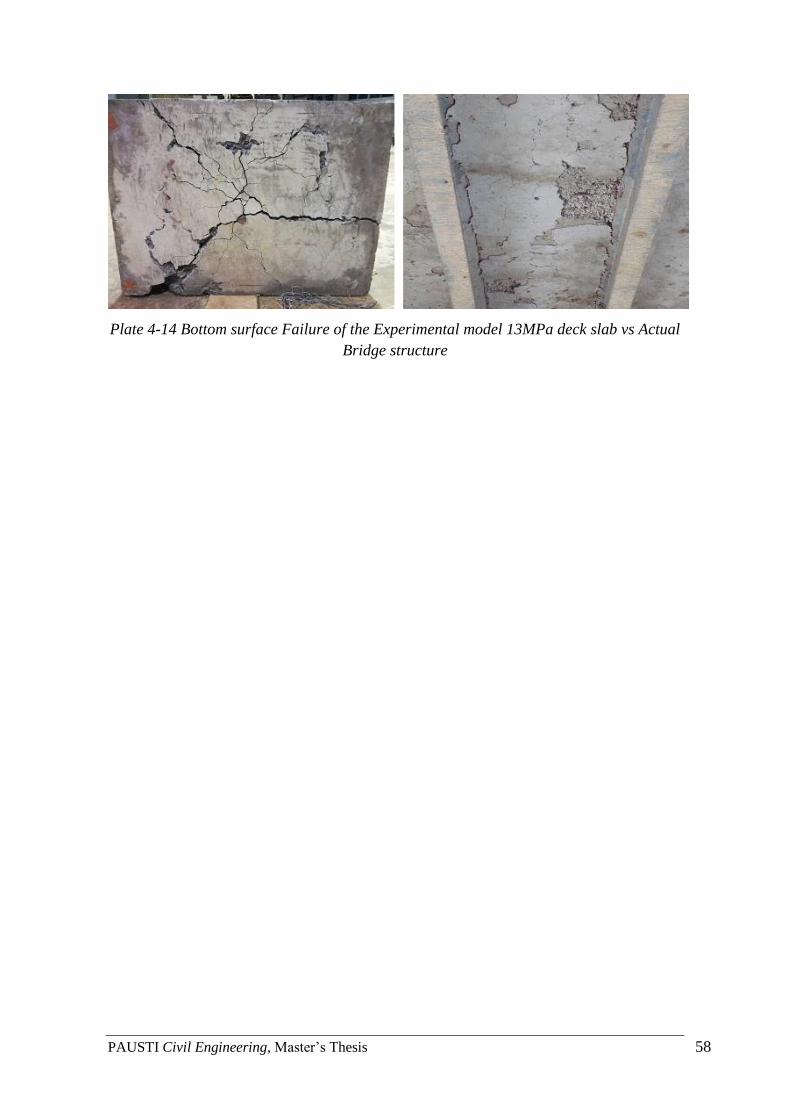
PAUSTI Civil Engineering, Master’s Thesis 58
Plate 4-14 Bottom surface Failure of the Experimental model 13MPa deck slab vs Actual
Bridge structure
PAUSTI Civil Engineering, Master’s Thesis 59
CHAPTER 5. CONCLUSION AND RECOMMENDATION
5.1 CONCLUSIONS
The Manafwa Bridge is comprised of a 20m long superstructure with a 200mm thick
solid concrete slab cast on 6 steel I-section beams. The compressive strength of the deck
slab had deteriorated and field results showed the low compressive strength of 13N/mm2
in comparison to the design concrete strength class of 30N/mm2. Additionally, the tensile
strength of the reinforcement bars had reduced from the design strength of 460N/mm2 to
408.763 N/mm2 for the R12 bars and 417.743 N/mm2 for the R16 bars.
The study also demonstrated that the existing deck slab for the Manafwa Bridge was not
adequate in punching shear for the in-situ concrete strength of 9.6N/mm2 obtained but
was adequate for the design strength of 30N/mm2 and concluded that the Bridge could
not have failed due to punching shear. The applied transverse sagging moments were all
less than the slab moment capacities for the in-situ concrete strengths considered. This
implies that there was a significant deterioration of the concrete which as a result could
not withstand the applied moments hence the collapse. No hogging reinforcement was
provided in the existing slab.
In the experimental modelling it was concluded that that main cause of failure of the deck
slab was punching shear through the deteriorated concrete. At low load levels, flexural
cracks developed at the bottom of the deck slab models directly under the loading area,
within and around the loading perimeter. With load increase, radial cracks, that from
literature review can be attributed to tangential moments, distributed out from the
perimeter of the concentrated loading, breaking the slab into a fan-like fashion. When
maximum load carrying capacity of the deck slab was reached as was the case for the
Manafwa Bridge, shear cracking occurred from the tangential bending cracks and start
building up a cone-like plug and ultimately into the hole that developed in the deck slab.
The numerical simulation of the failed deck slab section showed deflection patterns
which were corresponding to the failure mode of the experimental model. The von misses
failure criterion used for the stresses showed that the maximum stress concentration and
deflection was in the centre of the deck slab which corresponded to the Manafwa Bridge
failure positioning. Consequently, the numerical analysis using ANSYS adequately
validated the results of the experimental modelling and the above-mentioned reasons for
the failure of the Bridge.
5.2 RECOMMENDATIONS
5.2.1 Recommendations of the Research
The bridge should be repaired by providing a structural concrete topping slab of
minimum class 30/25 structurally bonded to existing slab through use of shear
connectors. Additionally, top hogging reinforcements should be provided. However, the
Bridge was demolished. This is a very high cost to the country, and as such taking up
this recommendation would have ensured the bridge serves for a much longer cost and
priority given to new areas that require new bridges.
PAUSTI Civil Engineering, Master’s Thesis 60
For other similarly constructed bridges that are still functional, the following should be
done to enable them to be functional for an extended period:
• There is need to examine the provided shear connectors in the existing slab in
order to reach a firm conclusion on whether the beams in these bridges are
designed as composite sections or non-composite.
• The concrete strength of the existing slab should also be examined occasionally.
• A structural topping slab of 200mm thickness can be applied to the existing slab.
The topping concrete should be of minimum Class 30/19 concrete structurally
bonded to the existing slab. Top hogging reinforcement should be provided in the
topping concrete with a concrete cover to the reinforcement of 40mm.
There is need to invest a lot more resources in acquiring of Numerical Analysis Software
such as ANSYS, ABAQUS, DYNA and many others. In addition, it needs to source for
personnel to train future students to ensure research is continuous.
5.2.2 Recommended Areas for Further Research
The destructive testing carried out in situ on the bridge was the coring test which had
some limitations. The cores were used to only investigate the compressive strength of the
concrete. In order to have a broader range of results and to understand in detail the failure
mechanisms of the historic bridges, the extracted cores should be subjected to many other
tests including chemical composition, durability tests of the concrete, fatigue analysis and
they should be checked for the presence of deleterious matter. These parameters should
then be incorporated into the numerical analysis and results reviewed for more detailed
analysis of the failure mechanism as it has not been captured in this research.
PAUSTI Civil Engineering, Master’s Thesis 61
REFERENCES
ACI. (2014). Building Code Requirements for Structural Concrete and Commentary.
Farmington Hills, Mich: ACI American Concrete Institute.
Alenius, M., 2003. Finite element modelling of composite bridge stability (Doctoral
dissertation, MSc Thesis Stockholm).
Alexander, S., & Simmonds, S. (1986). Shear-Moment Transfer in Slab Column
Connections. University of Alberta. Edmonton.
Amir, S. (2014). Compressive membrane action in prestressed concrete deck slabs. PhD
Thesis. Delft University of Technology, Delft.
Aswa Bridge collapses. (2015, October 21). Retrieved December 11, 2015, from
http://www.newvision.co.ug/news/674734-aswa-bridge-collapses.html
Bagge, N. (2014). Assessment of Concrete Bridges. Lulea University of Technology,
Lulea, Sweden.
Bagge, N., & Elfgren, L. (2016). Structural performance and failure loading of a 55 year-
old prestressed concrete bridge. In Maintenance, Moniring, Safety, Risk and
Resilience of Bridges and Bridge Networks. (pp. 2225-2232). Lulea University of
Technology: CRC Press, Taylor & Francis Group.
Bagge, N., Nilimaa, J., Blanksvard, T., & Elfgren, L. (2014). Instrumentation and Full-
Scale Test of a Post-Tensioned Concrete Bridge. Nordic Concrete Research, 51,
63-83.
Bagge, N., Shu, J., Plos, M., & Elfgren, L. (2015). Punching Capacity of a Reinforced
Concrete Bridge Deck Slab Loaded to Failure. In Nordic Concrete Research:
Residual Capacity of Deteriorated Concrete Structures (pp. 57-60). Oslo,
Norway.
Biggs, R.M., Barton, F.W., Gomez, J.P., Massarelli, P.J. and McKeel Jr, W.T.,
2000. Finite element modelling and analysis of reinforced-concrete bridge
decks (No. FHWA/VTRC 01-R4,).
CEN. (2004). Eurocode 2: Design of concrete structures - part 1-1: General rules and
rules for buildings. Brussels, Belgium: CEN European Committee for
Standardization.
Chen, W. (Ed.), Duan, L. (Ed.). (1999). Bridge Engineering Handbook. Boca Raton:
CRC Press.
Fall, D., Shu, J., Rempling, R., Lundgren, K., & Zandi, K. (2014). Two-way Slabs:
Experimental Investigation of Load Redistributions in Steel Fibre Reinforced
Concrete. Engineering Structures, 80, 61-74.
Fall, D., Shu, J., Rempling, R., Lundgren, K., & Zandi, K. (2014). Two-way Slabs:
Experimental Investigation of Load Redistributions in Steel Fibre Reinforced
Concrete. Engineering Structures, 80, 61-74.

PAUSTI Civil Engineering, Master’s Thesis 62
IS 13311 (Part-2) (1992) Methods of Non-Destructive Testing of Concrete: Part-2:
Rebound Hammer
IS 456 2000. Code of Practice for Plain and Reinforced Concrete,
Kazungu, D. 2015. Manafwa Bridge develops cracks. Retrieved December 11, 2015,
from http://www.monitor.co.ug/News/National/Manafwa-Bridge-develops-
cracks/-/688334/2617436/-/nwixowz/-/index.html
Kinnunen, S., & Nylander, H. (1960). Punching of concrete slabs without shear
reinforcement. Transactions of the Royal Institute of Technology, No. 158,
Stockholm, Sweden.
Kudzys, a. (1999). Verification analysis of cast-in-situ reinforced concrete structures of
framed multistory buildings. Statyba, 5(3), pp.193-199.
Lantsoght, E., Veen, C., & Walraven, J. (2014). Shear in One-Way Slabs under
Concentrated Load Close to Support. ACI Structural Journal, (110), 275-284.
Li, H., 2012. Study on Durability Design and Critical Construction Technology for
Concrete Bridges. Master Thesis. Zhengzhou, China: Zhengzhou Univerisy.
Luttrell, L. (1987). Design manual for composite decks, form decks and roof decks.
[Canton, Ohio]: The Institute.
Miller, R., Aktan, A. F., & Shahrooz, B. M. (1994). Destructive Testing of
Decommissioned Concrete Slab Bridge. ASCE J Struct Div, 120(7'), 2176-2198.
Moe, J. (1961). Shearing strength of reinforced concrete slabs andfootings under
concentrated loads. Skokie, Ill.: Portland Cement Association, Research and
Development Laboratories.
Muttoni, A. & Fernandez Ruiz, M. (2008). Shear strength in one- and two-way slabs
according to the Critical Shear Crack Theory. Tailor Made Concrete Structures,
(1960), pp.559-563.
Neville, A.M. (1981) Properties of Concrete. Longman Scientific & Technical, Pitman
Publishing, London.
Nilimaa, J. (2015). Concrete bridges: Improved load capacity. Ph.D. Thesis, Lulea
University of Technology, Lulea.
Nilimaa, J., Bagge, N., Blanksvard, T., & Taljsten, B. (2016). NSM CFRP Strengthening
and Failure Loading of a Posttensioned Concrete Bridge. Journal of Composites
for Construction, 20(3).
Ogwang, J. (2012, July 2). UNRA prioritises repair, building of bridges. Retrieved
December 11, 2015, from
http://www.newvision.co.ug/newvision_cms/newsimages/file/edwin%20l/8.pdf&
usg=AFQjCNHP6MhKRG7FOltMPjLgk_EOCmM7
Owilli, B., 2017. Punching Shear Capacity of a Tested RC Bridge Deck Slab in Kiruna,
Sweden. Master’s. Gothenburg, Sweden: Chalmers University Of Technology.
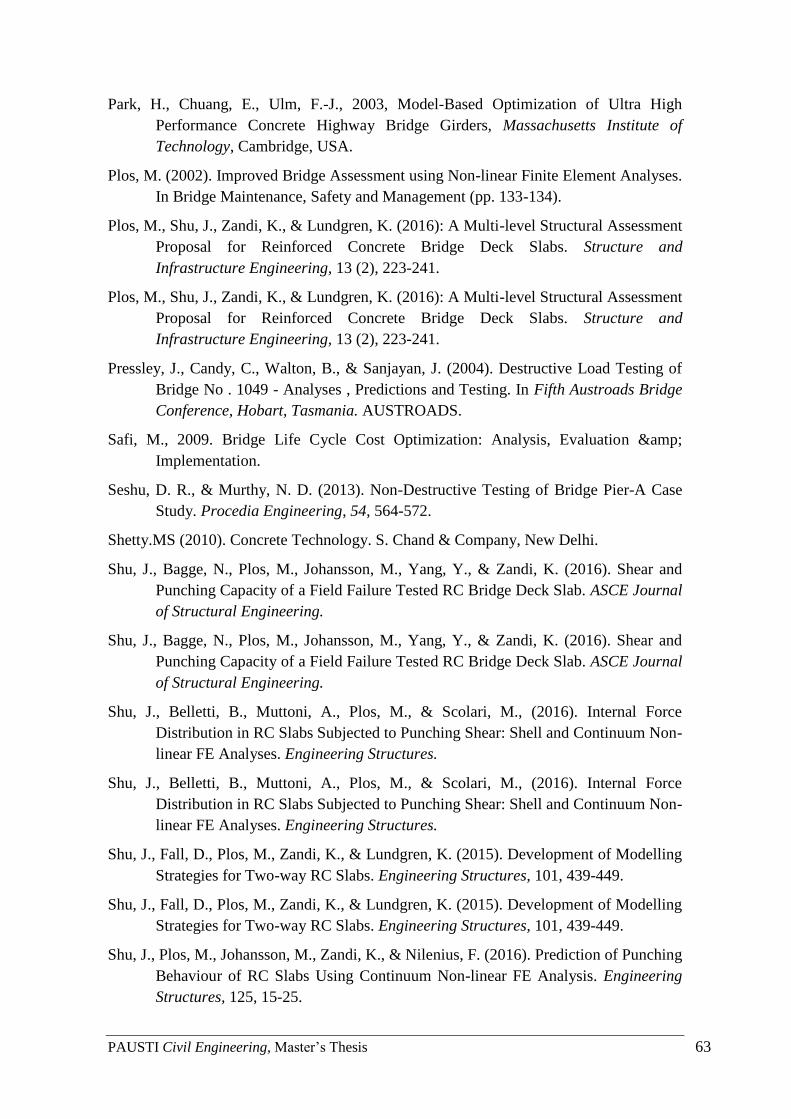
PAUSTI Civil Engineering, Master’s Thesis 63
Park, H., Chuang, E., Ulm, F.-J., 2003, Model-Based Optimization of Ultra High
Performance Concrete Highway Bridge Girders, Massachusetts Institute of
Technology, Cambridge, USA.
Plos, M. (2002). Improved Bridge Assessment using Non-linear Finite Element Analyses.
In Bridge Maintenance, Safety and Management (pp. 133-134).
Plos, M., Shu, J., Zandi, K., & Lundgren, K. (2016): A Multi-level Structural Assessment
Proposal for Reinforced Concrete Bridge Deck Slabs. Structure and
Infrastructure Engineering, 13 (2), 223-241.
Plos, M., Shu, J., Zandi, K., & Lundgren, K. (2016): A Multi-level Structural Assessment
Proposal for Reinforced Concrete Bridge Deck Slabs. Structure and
Infrastructure Engineering, 13 (2), 223-241.
Pressley, J., Candy, C., Walton, B., & Sanjayan, J. (2004). Destructive Load Testing of
Bridge No . 1049 - Analyses , Predictions and Testing. In Fifth Austroads Bridge
Conference, Hobart, Tasmania. AUSTROADS.
Safi, M., 2009. Bridge Life Cycle Cost Optimization: Analysis, Evaluation &
Implementation.
Seshu, D. R., & Murthy, N. D. (2013). Non-Destructive Testing of Bridge Pier-A Case
Study. Procedia Engineering, 54, 564-572.
Shetty.MS (2010). Concrete Technology. S. Chand & Company, New Delhi.
Shu, J., Bagge, N., Plos, M., Johansson, M., Yang, Y., & Zandi, K. (2016). Shear and
Punching Capacity of a Field Failure Tested RC Bridge Deck Slab. ASCE Journal
of Structural Engineering.
Shu, J., Bagge, N., Plos, M., Johansson, M., Yang, Y., & Zandi, K. (2016). Shear and
Punching Capacity of a Field Failure Tested RC Bridge Deck Slab. ASCE Journal
of Structural Engineering.
Shu, J., Belletti, B., Muttoni, A., Plos, M., & Scolari, M., (2016). Internal Force
Distribution in RC Slabs Subjected to Punching Shear: Shell and Continuum Non-
linear FE Analyses. Engineering Structures.
Shu, J., Belletti, B., Muttoni, A., Plos, M., & Scolari, M., (2016). Internal Force
Distribution in RC Slabs Subjected to Punching Shear: Shell and Continuum Non-
linear FE Analyses. Engineering Structures.
Shu, J., Fall, D., Plos, M., Zandi, K., & Lundgren, K. (2015). Development of Modelling
Strategies for Two-way RC Slabs. Engineering Structures, 101, 439-449.
Shu, J., Fall, D., Plos, M., Zandi, K., & Lundgren, K. (2015). Development of Modelling
Strategies for Two-way RC Slabs. Engineering Structures, 101, 439-449.
Shu, J., Plos, M., Johansson, M., Zandi, K., & Nilenius, F. (2016). Prediction of Punching
Behaviour of RC Slabs Using Continuum Non-linear FE Analysis. Engineering
Structures, 125, 15-25.
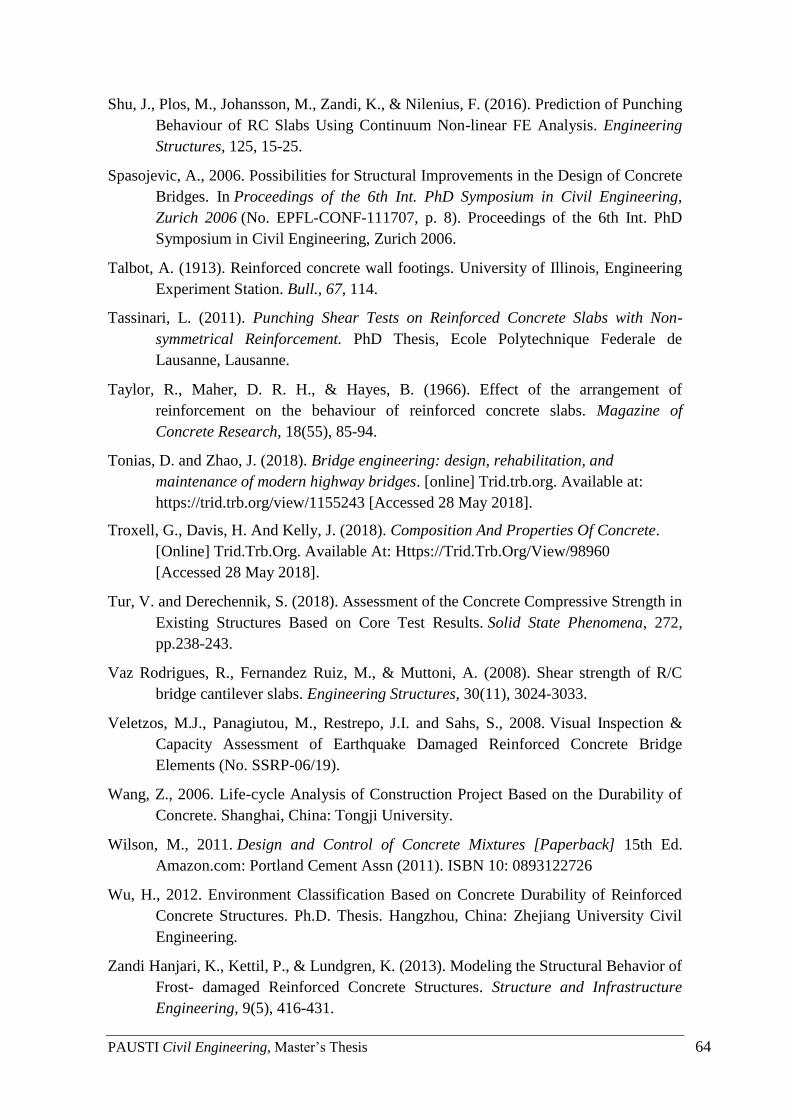
PAUSTI Civil Engineering, Master’s Thesis 64
Shu, J., Plos, M., Johansson, M., Zandi, K., & Nilenius, F. (2016). Prediction of Punching
Behaviour of RC Slabs Using Continuum Non-linear FE Analysis. Engineering
Structures, 125, 15-25.
Spasojevic, A., 2006. Possibilities for Structural Improvements in the Design of Concrete
Bridges. In Proceedings of the 6th Int. PhD Symposium in Civil Engineering,
Zurich 2006 (No. EPFL-CONF-111707, p. 8). Proceedings of the 6th Int. PhD
Symposium in Civil Engineering, Zurich 2006.
Talbot, A. (1913). Reinforced concrete wall footings. University of Illinois, Engineering
Experiment Station. Bull., 67, 114.
Tassinari, L. (2011). Punching Shear Tests on Reinforced Concrete Slabs with Non-
symmetrical Reinforcement. PhD Thesis, Ecole Polytechnique Federale de
Lausanne, Lausanne.
Taylor, R., Maher, D. R. H., & Hayes, B. (1966). Effect of the arrangement of
reinforcement on the behaviour of reinforced concrete slabs. Magazine of
Concrete Research, 18(55), 85-94.
Tonias, D. and Zhao, J. (2018). Bridge engineering: design, rehabilitation, and
maintenance of modern highway bridges. [online] Trid.trb.org. Available at:
https://trid.trb.org/view/1155243 [Accessed 28 May 2018].
Troxell, G., Davis, H. And Kelly, J. (2018). Composition And Properties Of Concrete.
[Online] Trid.Trb.Org. Available At: Https://Trid.Trb.Org/View/98960
[Accessed 28 May 2018].
Tur, V. and Derechennik, S. (2018). Assessment of the Concrete Compressive Strength in
Existing Structures Based on Core Test Results. Solid State Phenomena, 272,
pp.238-243.
Vaz Rodrigues, R., Fernandez Ruiz, M., & Muttoni, A. (2008). Shear strength of R/C
bridge cantilever slabs. Engineering Structures, 30(11), 3024-3033.
Veletzos, M.J., Panagiutou, M., Restrepo, J.I. and Sahs, S., 2008. Visual Inspection &
Capacity Assessment of Earthquake Damaged Reinforced Concrete Bridge
Elements (No. SSRP-06/19).
Wang, Z., 2006. Life-cycle Analysis of Construction Project Based on the Durability of
Concrete. Shanghai, China: Tongji University.
Wilson, M., 2011. Design and Control of Concrete Mixtures [Paperback] 15th Ed.
Amazon.com: Portland Cement Assn (2011). ISBN 10: 0893122726
Wu, H., 2012. Environment Classification Based on Concrete Durability of Reinforced
Concrete Structures. Ph.D. Thesis. Hangzhou, China: Zhejiang University Civil
Engineering.
Zandi Hanjari, K., Kettil, P., & Lundgren, K. (2013). Modeling the Structural Behavior of
Frost- damaged Reinforced Concrete Structures. Structure and Infrastructure
Engineering, 9(5), 416-431.

PAUSTI Civil Engineering, Master’s Thesis 65
Zhang, H., 2012. Research on Improving Structural Durability of Highway Concrete.
Master Thesis. Jinan, China: Shandong University.
Zheng, Y., Robinson, D., Taylor, S., & Cleland, D. (2009). Finite element investigation
of the structural behaviour of deck slabs in composite bridges. Engineering
Structures, 31(8), 1762-1776.
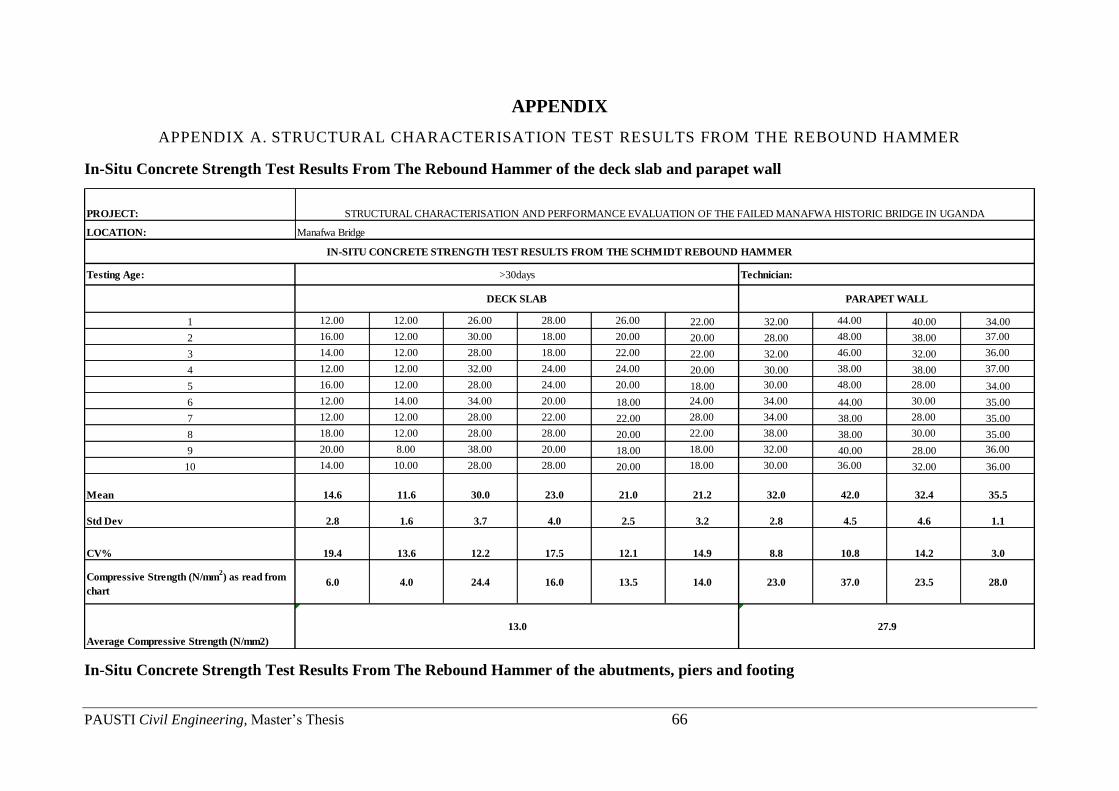
PAUSTI Civil Engineering, Master’s Thesis 66
APPENDIX
APPENDIX A. STRUCTURAL CHARACTERISATION TEST RESULTS FROM THE REBOUND HAMMER
In-Situ Concrete Strength Test Results From The Rebound Hammer of the deck slab and parapet wall
PROJECT:
LOCATION:
Testing Age:
1 12.00 12.00 26.00 28.00 26.00 22.00 32.00 44.00 40.00 34.00
2 16.00 12.00 30.00 18.00 20.00 20.00 28.00 48.00 38.00 37.00
3 14.00 12.00 28.00 18.00 22.00 22.00 32.00 46.00 32.00 36.00
4 12.00 12.00 32.00 24.00 24.00 20.00 30.00 38.00 38.00 37.00
5 16.00 12.00 28.00 24.00 20.00 18.00 30.00 48.00 28.00 34.00
6 12.00 14.00 34.00 20.00 18.00 24.00 34.00 44.00 30.00 35.00
7 12.00 12.00 28.00 22.00 22.00 28.00 34.00 38.00 28.00 35.00
8 18.00 12.00 28.00 28.00 20.00 22.00 38.00 38.00 30.00 35.00
9 20.00 8.00 38.00 20.00 18.00 18.00 32.00 40.00 28.00 36.00
10 14.00 10.00 28.00 28.00 20.00 18.00 30.00 36.00 32.00 36.00
Mean 14.6 11.6 30.0 23.0 21.0 21.2 32.0 42.0 32.4 35.5
Std Dev 2.8 1.6 3.7 4.0 2.5 3.2 2.8 4.5 4.6 1.1
CV% 19.4 13.6 12.2 17.5 12.1 14.9 8.8 10.8 14.2 3.0
Compressive Strength (N/mm2) as read from
chart6.0 4.0 24.4 16.0 13.5 14.0 23.0 37.0 23.5 28.0
Average Compressive Strength (N/mm2)
DECK SLAB PARAPET WALL
13.0 27.9
Manafwa Bridge
IN-SITU CONCRETE STRENGTH TEST RESULTS FROM THE SCHMIDT REBOUND HAMMER
>30days Technician:
STRUCTURAL CHARACTERISATION AND PERFORMANCE EVALUATION OF THE FAILED MANAFWA HISTORIC BRIDGE IN UGANDA
In-Situ Concrete Strength Test Results From The Rebound Hammer of the abutments, piers and footing
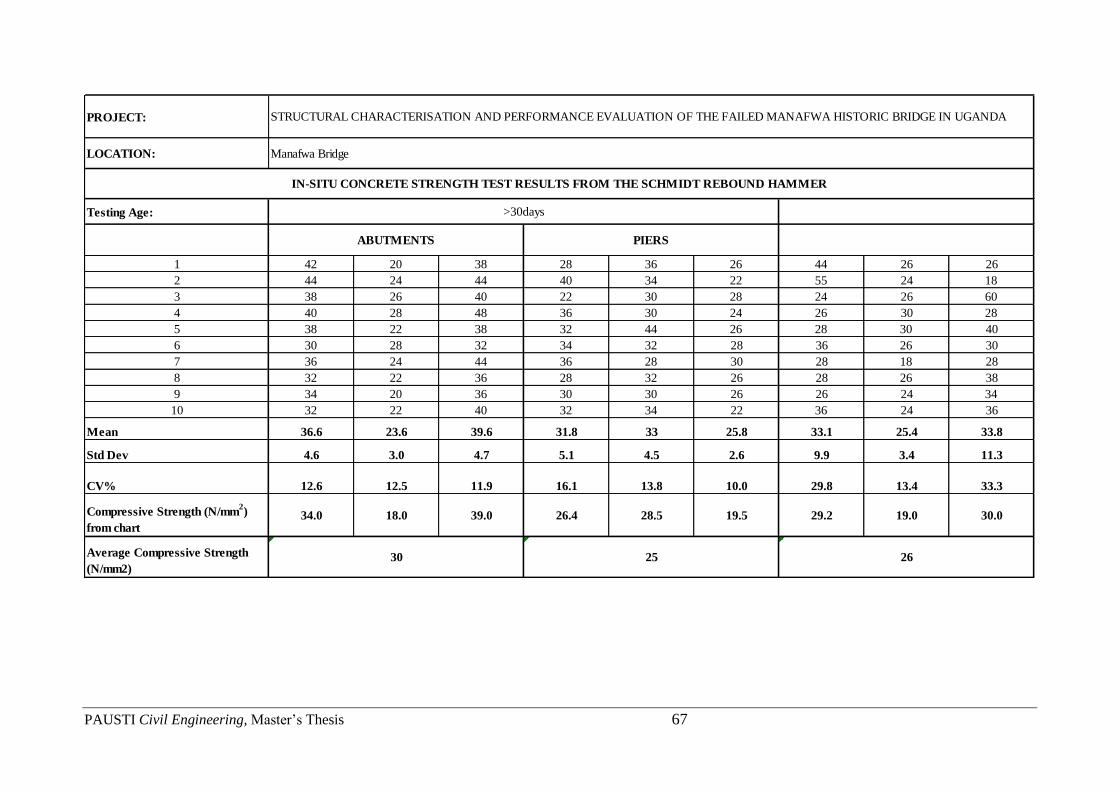
PAUSTI Civil Engineering, Master’s Thesis 67
PROJECT:
LOCATION:
Testing Age:
1 42 20 38 28 36 26 44 26 26
2 44 24 44 40 34 22 55 24 18
3 38 26 40 22 30 28 24 26 60
4 40 28 48 36 30 24 26 30 28
5 38 22 38 32 44 26 28 30 40
6 30 28 32 34 32 28 36 26 30
7 36 24 44 36 28 30 28 18 28
8 32 22 36 28 32 26 28 26 38
9 34 20 36 30 30 26 26 24 34
10 32 22 40 32 34 22 36 24 36
Mean 36.6 23.6 39.6 31.8 33 25.8 33.1 25.4 33.8
Std Dev 4.6 3.0 4.7 5.1 4.5 2.6 9.9 3.4 11.3
CV% 12.6 12.5 11.9 16.1 13.8 10.0 29.8 13.4 33.3
Compressive Strength (N/mm2)
from chart34.0 18.0 39.0 26.4 28.5 19.5 29.2 19.0 30.0
Average Compressive Strength
(N/mm2)26
ABUTMENTS PIERS
30 25
Manafwa Bridge
IN-SITU CONCRETE STRENGTH TEST RESULTS FROM THE SCHMIDT REBOUND HAMMER
>30days
STRUCTURAL CHARACTERISATION AND PERFORMANCE EVALUATION OF THE FAILED MANAFWA HISTORIC BRIDGE IN UGANDA
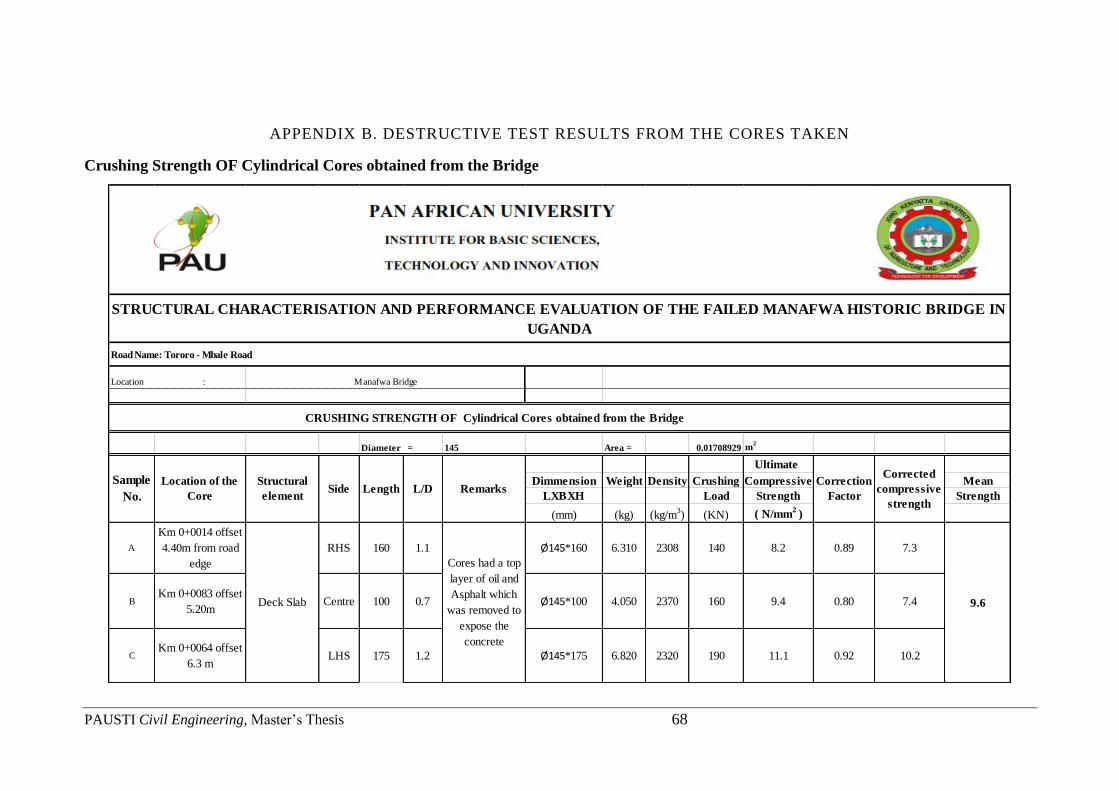
PAUSTI Civil Engineering, Master’s Thesis 68
APPENDIX B. DESTRUCTIVE TEST RESULTS FROM THE CORES TAKEN
Crushing Strength OF Cylindrical Cores obtained from the Bridge
Diameter = 145 Area = 0.01708929 m2
Ultimate
Dimmension Weight Density Crushing Compressive Mean
LXBXH Load Strength Strength
(mm) (kg) (kg/m3) (KN) ( N/mm
2 )
A
Km 0+0014 offset
4.40m from road
edge
RHS 160 1.1 Ø145*160 6.310 2308 140 8.2 0.89 7.3
BKm 0+0083 offset
5.20mCentre 100 0.7 Ø145*100 4.050 2370 160 9.4 0.80 7.4
CKm 0+0064 offset
6.3 mLHS 175 1.2 Ø145*175 6.820 2320 190 11.1 0.92 10.2
Sample
No.
CRUSHING STRENGTH OF Cylindrical Cores obtained from the Bridge
Correction
FactorRemarks
Location : Manafwa Bridge
STRUCTURAL CHARACTERISATION AND PERFORMANCE EVALUATION OF THE FAILED MANAFWA HISTORIC BRIDGE IN
UGANDA
Road Name: Tororo - Mbale Road
Location of the
Core
Structural
elementSide
Deck Slab 9.6
Cores had a top
layer of oil and
Asphalt which
was removed to
expose the
concrete
Corrected
compressive
strength
L/DLength
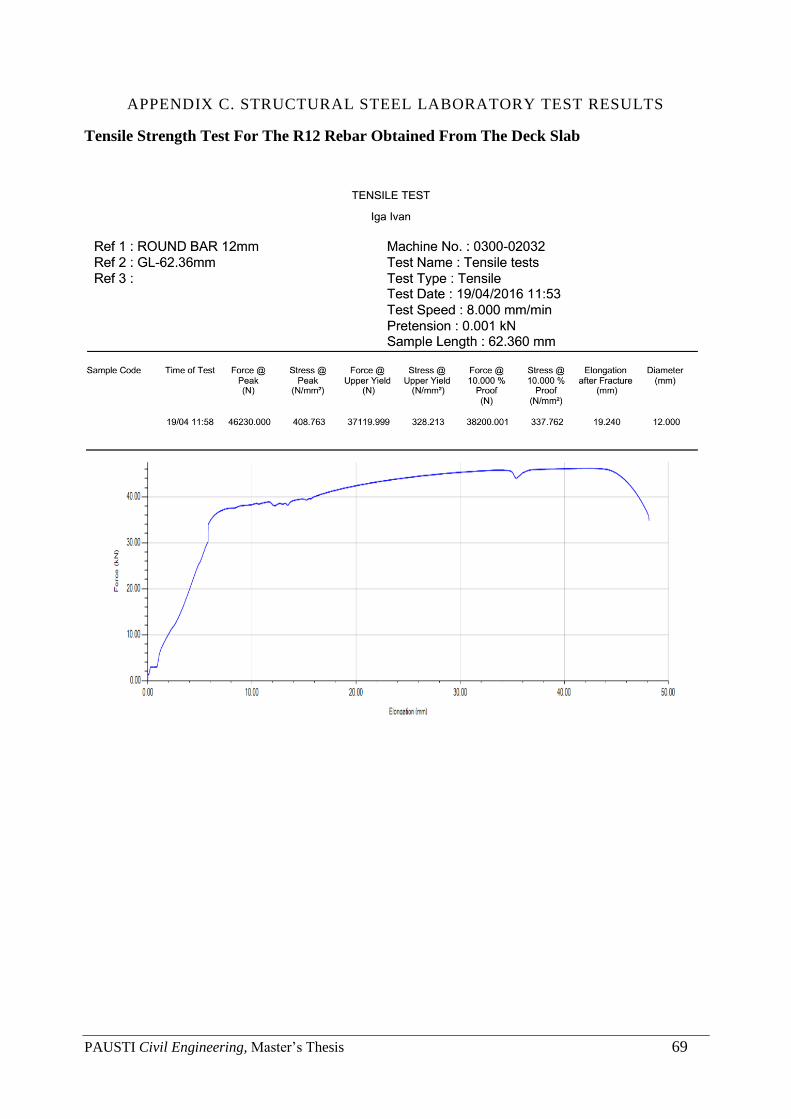
PAUSTI Civil Engineering, Master’s Thesis 69
APPENDIX C. STRUCTURAL STEEL LABORATORY TEST RESULTS
Tensile Strength Test For The R12 Rebar Obtained From The Deck Slab
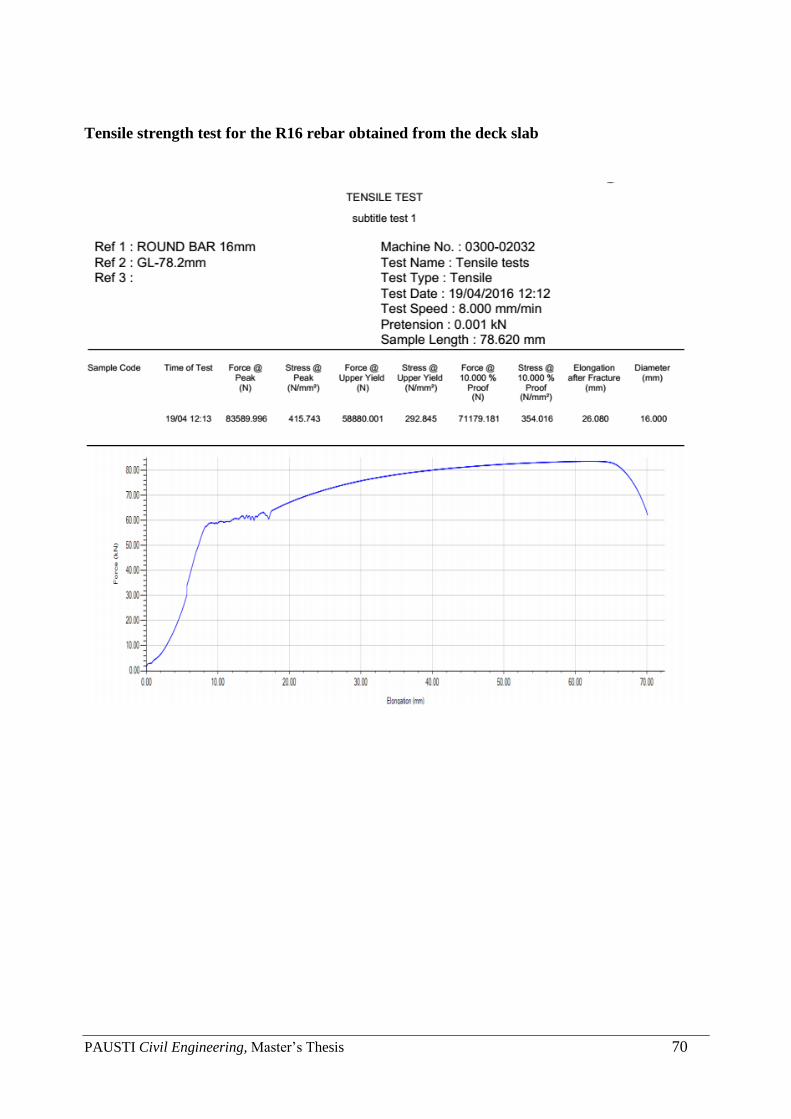
PAUSTI Civil Engineering, Master’s Thesis 70
Tensile strength test for the R16 rebar obtained from the deck slab
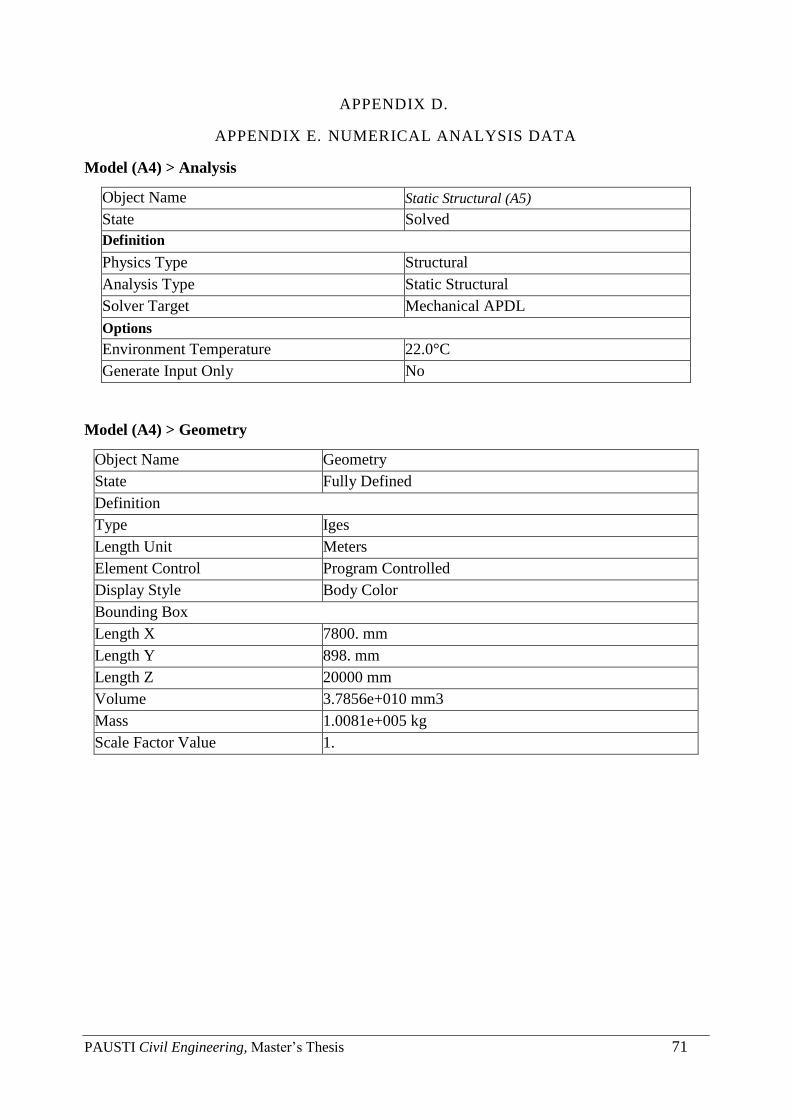
PAUSTI Civil Engineering, Master’s Thesis 71
APPENDIX D.
APPENDIX E. NUMERICAL ANALYSIS DATA
Model (A4) > Analysis
Object Name Static Structural (A5)
State Solved
Definition
Physics Type Structural
Analysis Type Static Structural
Solver Target Mechanical APDL
Options
Environment Temperature 22.0°C
Generate Input Only No
Model (A4) > Geometry
Object Name Geometry
State Fully Defined
Definition
Type Iges
Length Unit Meters
Element Control Program Controlled
Display Style Body Color
Bounding Box
Length X 7800. mm
Length Y 898. mm
Length Z 20000 mm
Volume 3.7856e+010 mm3
Mass 1.0081e+005 kg
Scale Factor Value 1.
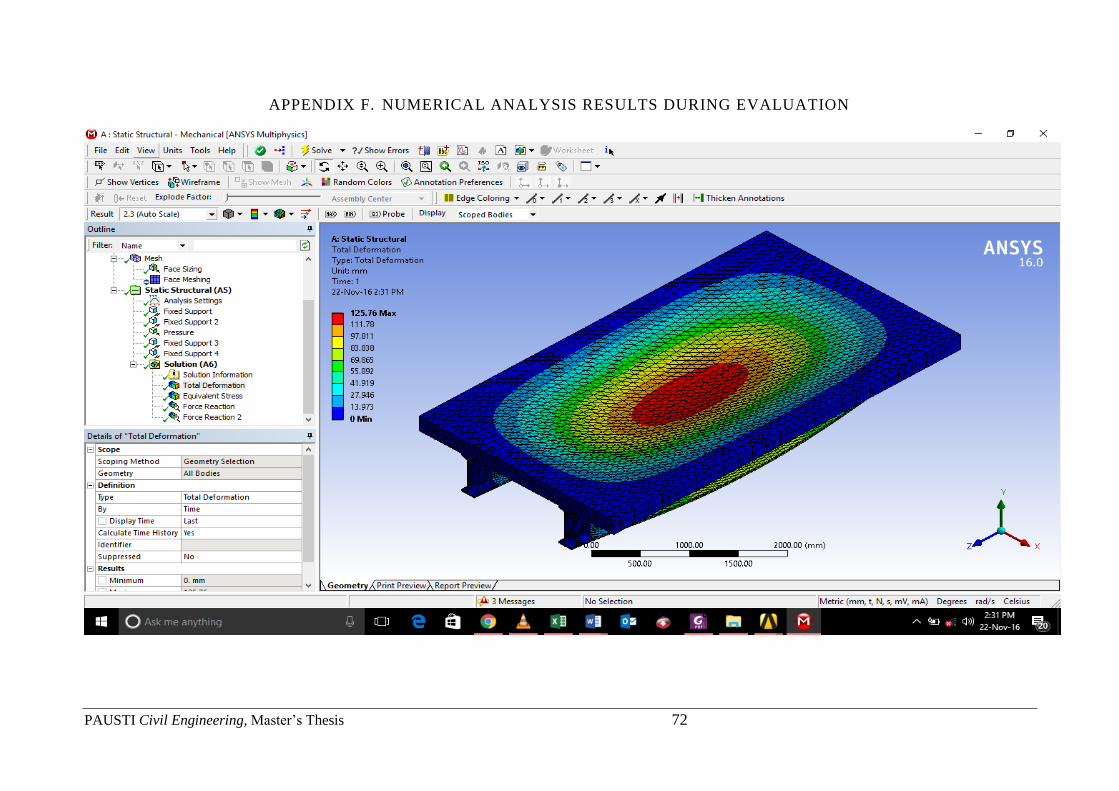
PAUSTI Civil Engineering, Master’s Thesis 72
APPENDIX F. NUMERICAL ANALYSIS RESULTS DURING EVALUATION
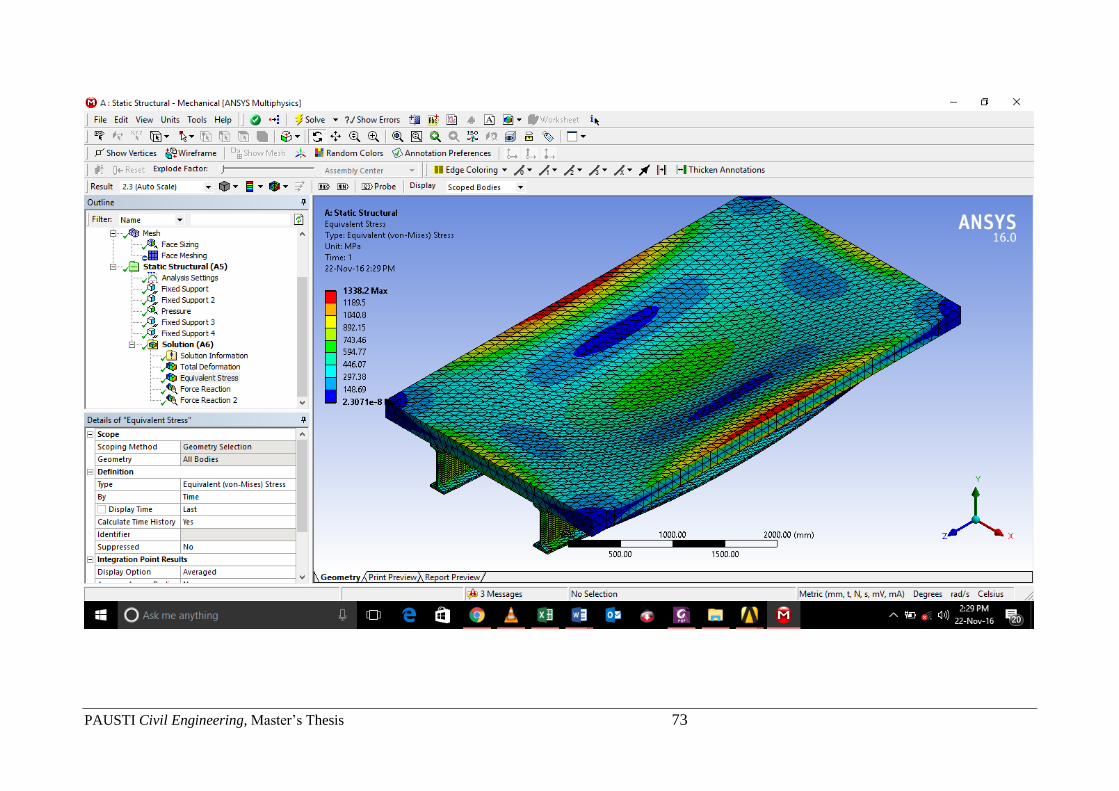
PAUSTI Civil Engineering, Master’s Thesis 73
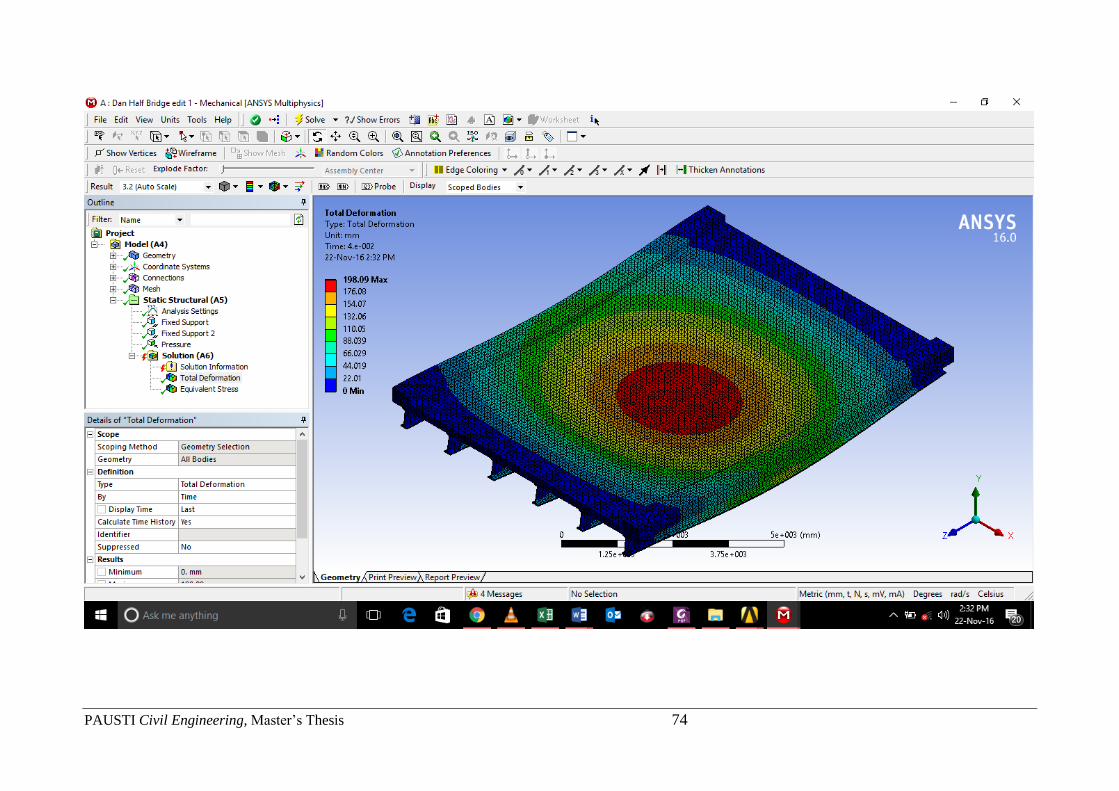
PAUSTI Civil Engineering, Master’s Thesis 74
PAUSTI Civil Engineering, Master’s Thesis 75
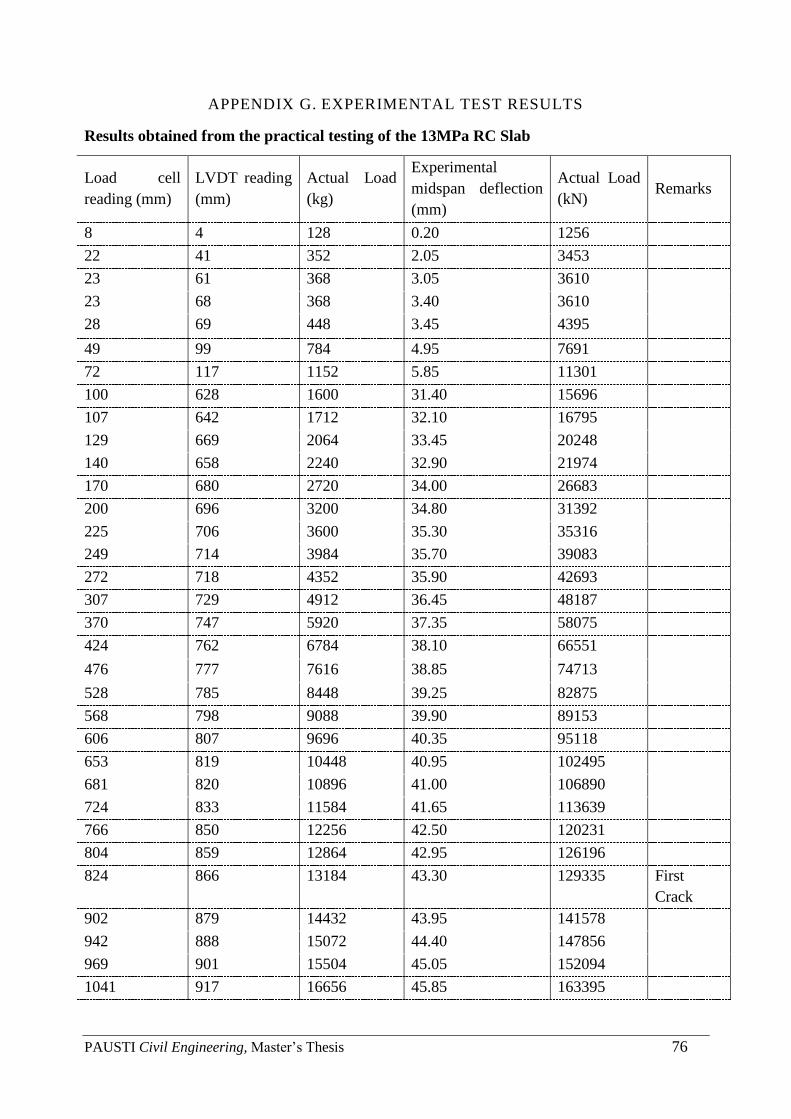
PAUSTI Civil Engineering, Master’s Thesis 76
APPENDIX G. EXPERIMENTAL TEST RESULTS
Results obtained from the practical testing of the 13MPa RC Slab
Load cell
reading (mm)
LVDT reading
(mm)
Actual Load
(kg)
Experimental
midspan deflection
(mm)
Actual Load
(kN) Remarks
8 4 128 0.20 1256
22 41 352 2.05 3453
23 61 368 3.05 3610
23 68 368 3.40 3610
28 69 448 3.45 4395
49 99 784 4.95 7691
72 117 1152 5.85 11301
100 628 1600 31.40 15696
107 642 1712 32.10 16795
129 669 2064 33.45 20248
140 658 2240 32.90 21974
170 680 2720 34.00 26683
200 696 3200 34.80 31392
225 706 3600 35.30 35316
249 714 3984 35.70 39083
272 718 4352 35.90 42693
307 729 4912 36.45 48187
370 747 5920 37.35 58075
424 762 6784 38.10 66551
476 777 7616 38.85 74713
528 785 8448 39.25 82875
568 798 9088 39.90 89153
606 807 9696 40.35 95118
653 819 10448 40.95 102495
681 820 10896 41.00 106890
724 833 11584 41.65 113639
766 850 12256 42.50 120231
804 859 12864 42.95 126196
824 866 13184 43.30 129335 First
Crack
902 879 14432 43.95 141578
942 888 15072 44.40 147856
969 901 15504 45.05 152094
1041 917 16656 45.85 163395
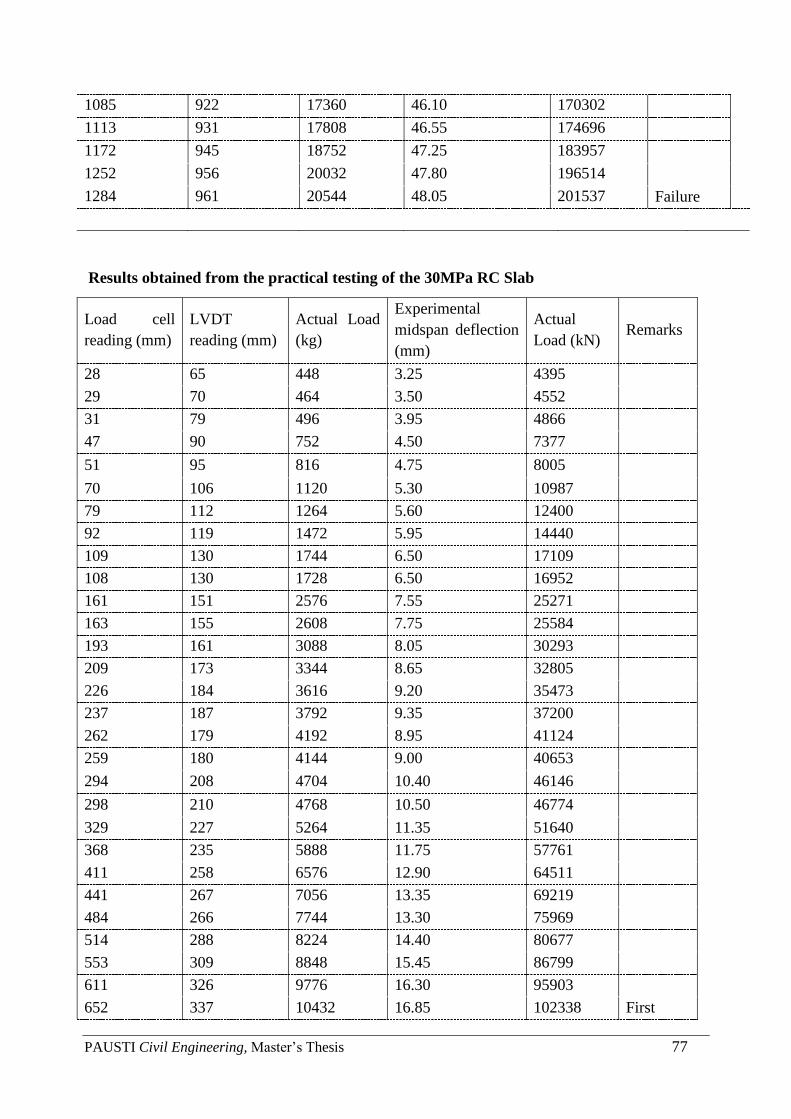
PAUSTI Civil Engineering, Master’s Thesis 77
1085 922 17360 46.10 170302
1113 931 17808 46.55 174696
1172 945 18752 47.25 183957
1252 956 20032 47.80 196514
1284 961 20544 48.05 201537 Failure
Results obtained from the practical testing of the 30MPa RC Slab
Load cell
reading (mm)
LVDT
reading (mm)
Actual Load
(kg)
Experimental
midspan deflection
(mm)
Actual
Load (kN) Remarks
28 65 448 3.25 4395
29 70 464 3.50 4552
31 79 496 3.95 4866
47 90 752 4.50 7377
51 95 816 4.75 8005
70 106 1120 5.30 10987
79 112 1264 5.60 12400
92 119 1472 5.95 14440
109 130 1744 6.50 17109
108 130 1728 6.50 16952
161 151 2576 7.55 25271
163 155 2608 7.75 25584
193 161 3088 8.05 30293
209 173 3344 8.65 32805
226 184 3616 9.20 35473
237 187 3792 9.35 37200
262 179 4192 8.95 41124
259 180 4144 9.00 40653
294 208 4704 10.40 46146
298 210 4768 10.50 46774
329 227 5264 11.35 51640
368 235 5888 11.75 57761
411 258 6576 12.90 64511
441 267 7056 13.35 69219
484 266 7744 13.30 75969
514 288 8224 14.40 80677
553 309 8848 15.45 86799
611 326 9776 16.30 95903
652 337 10432 16.85 102338 First
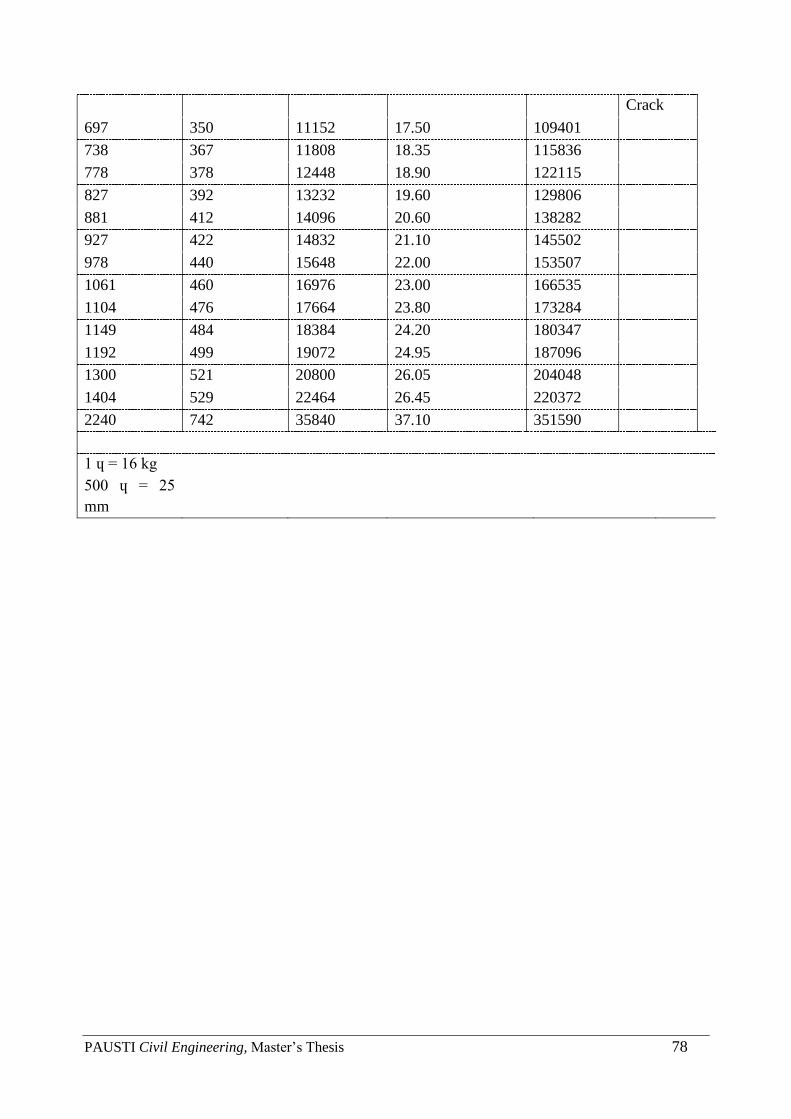
PAUSTI Civil Engineering, Master’s Thesis 78
Crack
697 350 11152 17.50 109401
738 367 11808 18.35 115836
778 378 12448 18.90 122115
827 392 13232 19.60 129806
881 412 14096 20.60 138282
927 422 14832 21.10 145502
978 440 15648 22.00 153507
1061 460 16976 23.00 166535
1104 476 17664 23.80 173284
1149 484 18384 24.20 180347
1192 499 19072 24.95 187096
1300 521 20800 26.05 204048
1404 529 22464 26.45 220372
2240 742 35840 37.10 351590
1 ɥ = 16 kg
500 ɥ = 25
mm
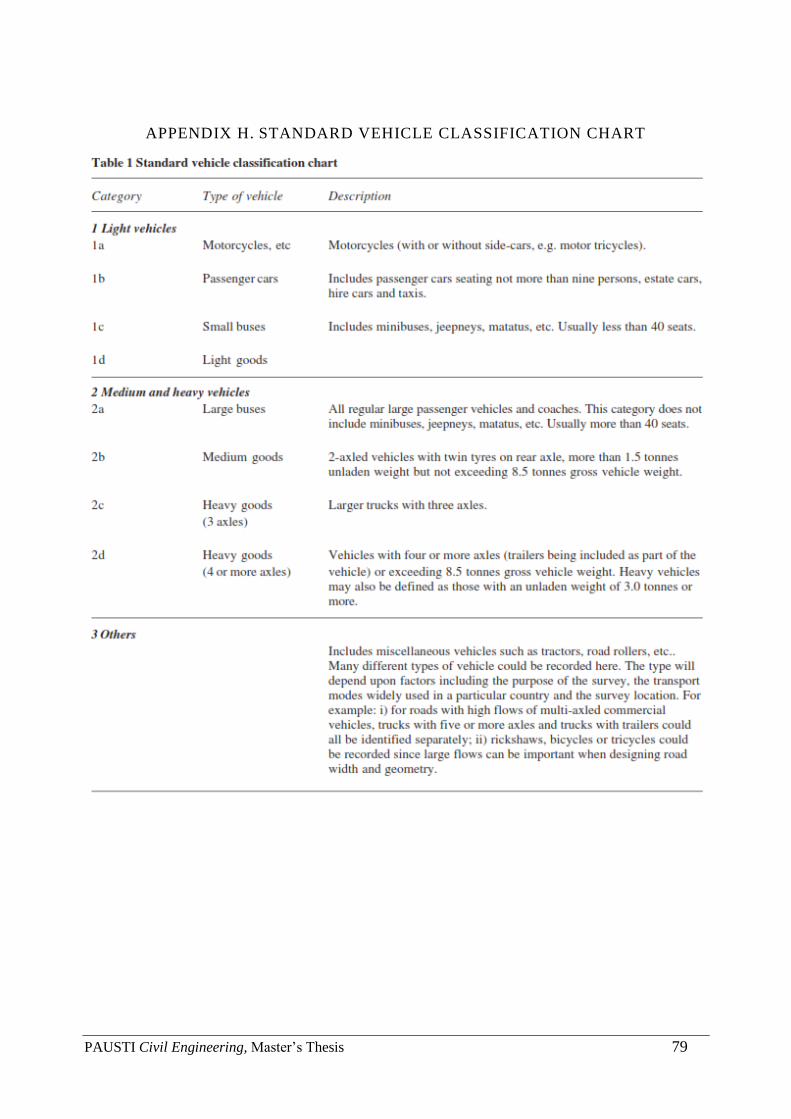
PAUSTI Civil Engineering, Master’s Thesis 79
APPENDIX H. STANDARD VEHICLE CLASSIFICATION CHART
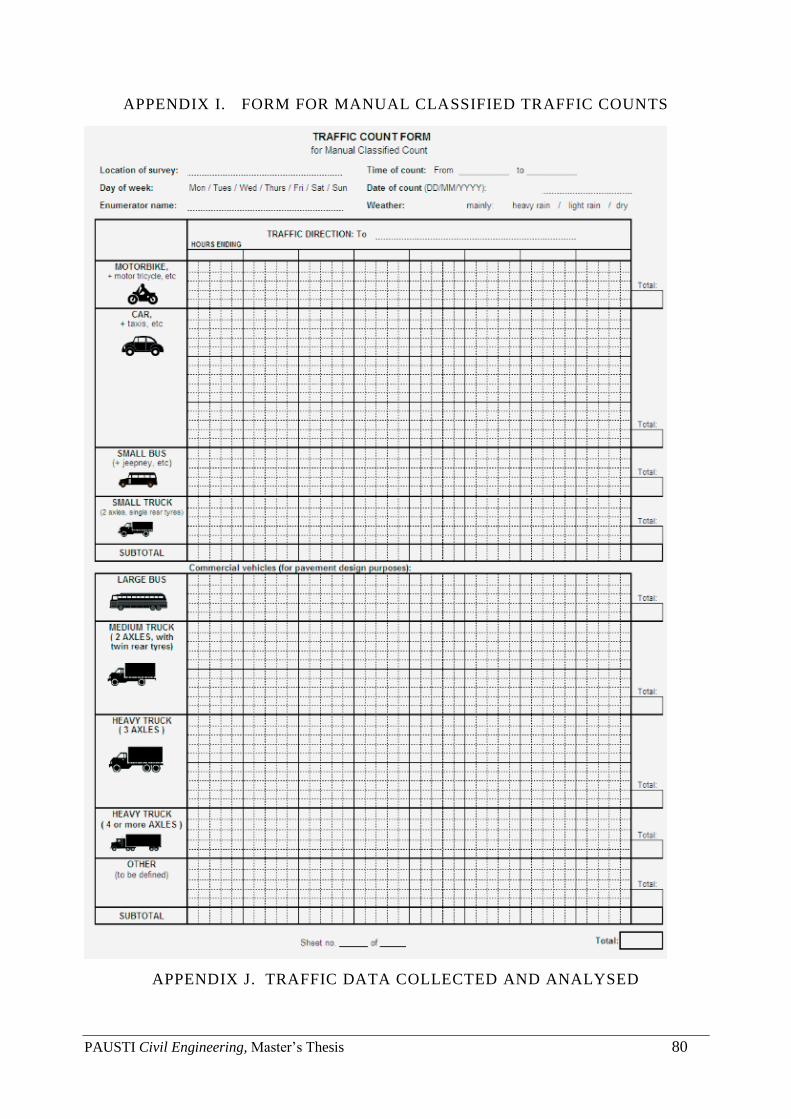
PAUSTI Civil Engineering, Master’s Thesis 80
APPENDIX I. FORM FOR MANUAL CLASSIFIED TRAFFIC COUNTS
APPENDIX J. TRAFFIC DATA COLLECTED AND ANALYSED
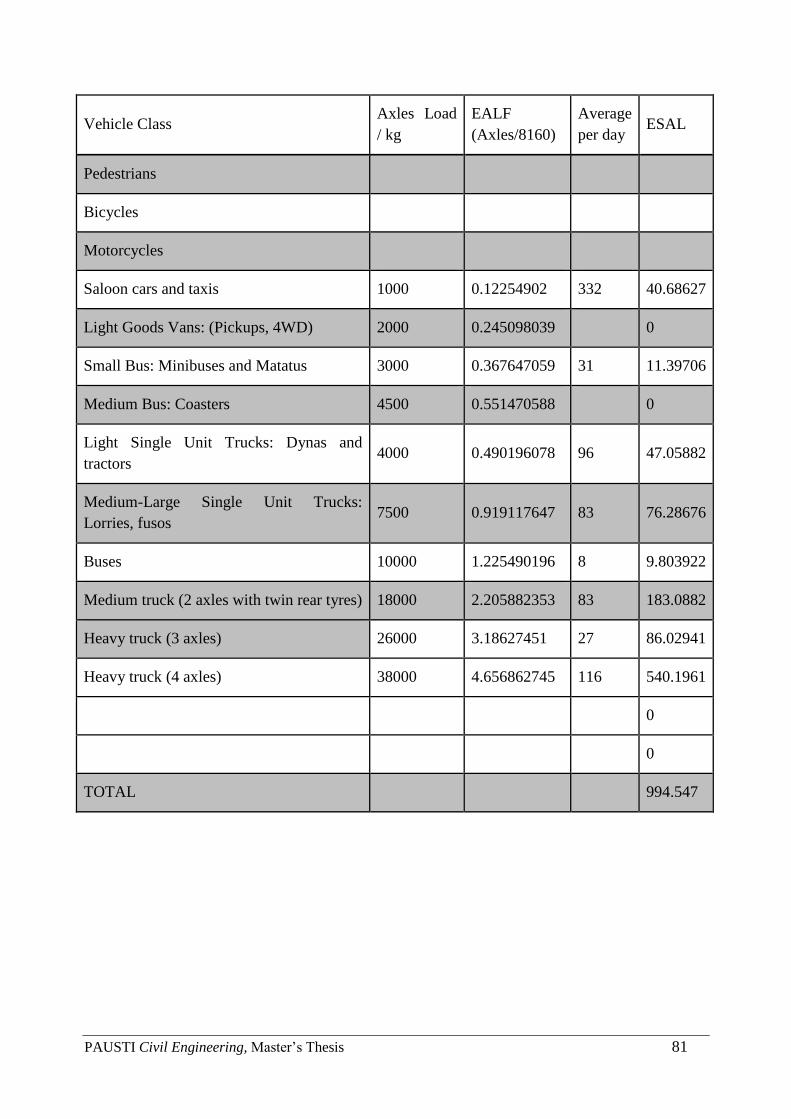
PAUSTI Civil Engineering, Master’s Thesis 81
Vehicle Class Axles Load
/ kg
EALF
(Axles/8160)
Average
per day ESAL
Pedestrians
Bicycles
Motorcycles
Saloon cars and taxis 1000 0.12254902 332 40.68627
Light Goods Vans: (Pickups, 4WD) 2000 0.245098039 0
Small Bus: Minibuses and Matatus 3000 0.367647059 31 11.39706
Medium Bus: Coasters 4500 0.551470588 0
Light Single Unit Trucks: Dynas and
tractors 4000 0.490196078 96 47.05882
Medium-Large Single Unit Trucks:
Lorries, fusos 7500 0.919117647 83 76.28676
Buses 10000 1.225490196 8 9.803922
Medium truck (2 axles with twin rear tyres) 18000 2.205882353 83 183.0882
Heavy truck (3 axles) 26000 3.18627451 27 86.02941
Heavy truck (4 axles) 38000 4.656862745 116 540.1961
0
0
TOTAL 994.547
PAUSTI Civil Engineering, Master’s Thesis 82
APPENDIX K. EQUIPMENT LIST FOR TRAFFIC COUNT AND/OR AXLE LOAD
SURVEY
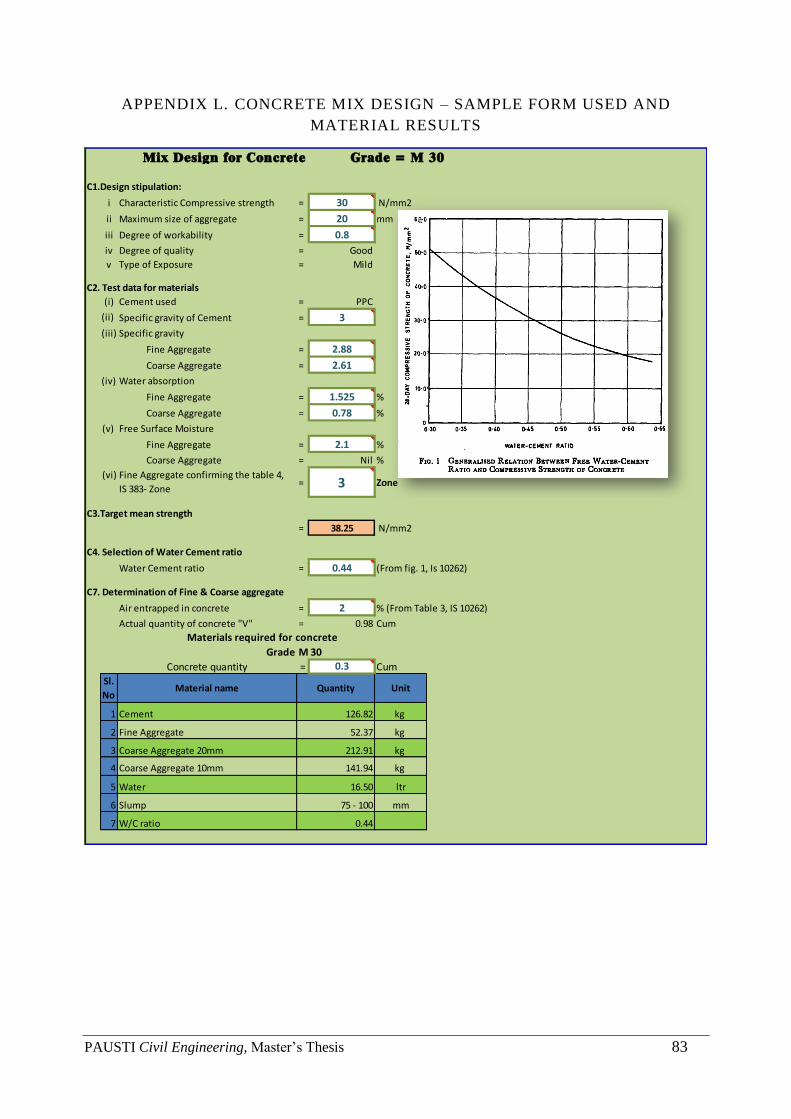
PAUSTI Civil Engineering, Master’s Thesis 83
APPENDIX L. CONCRETE MIX DESIGN – SAMPLE FORM USED AND
MATERIAL RESULTS
Grade = M 30
C1.Design stipulation:
i Characteristic Compressive strength = 30 N/mm2
ii Maximum size of aggregate = 20 mm
iii Degree of workability = 0.8
iv Degree of quality = Good
v Type of Exposure = Mild
C2. Test data for materials
(i) Cement used = PPC
(ii) Specific gravity of Cement = 3
(iii) Specific gravity
Fine Aggregate = 2.88
Coarse Aggregate = 2.61
(iv) Water absorption
Fine Aggregate = 1.525 %
Coarse Aggregate = 0.78 %
(v) Free Surface Moisture
Fine Aggregate = 2.1 %
Coarse Aggregate = Nil %
(vi) Fine Aggregate confirming the table 4,
IS 383- Zone= 3 Zone
C3.Target mean strength
= 38.25 N/mm2
C4. Selection of Water Cement ratio
Water Cement ratio = 0.44 (From fig. 1, Is 10262)
C7. Determination of Fine & Coarse aggregate
Air entrapped in concrete = 2 % (From Table 3, IS 10262)
Actual quantity of concrete "V" = 0.98 Cum
Grade M 30
Concrete quantity = 0.3 CumSl.
NoMaterial name Unit
1 Cement kg
2 Fine Aggregate kg
3 Coarse Aggregate 20mm kg
4 Coarse Aggregate 10mm kg Prepared by,
5 Water ltr
6 Slump mm
7 W/C ratio +91 8894770272
Mix Design for Concrete
Sathiyaseelan
212.91
Materials required for concrete
Quantity
126.82
52.37
141.94
16.50
75 - 100
0.44
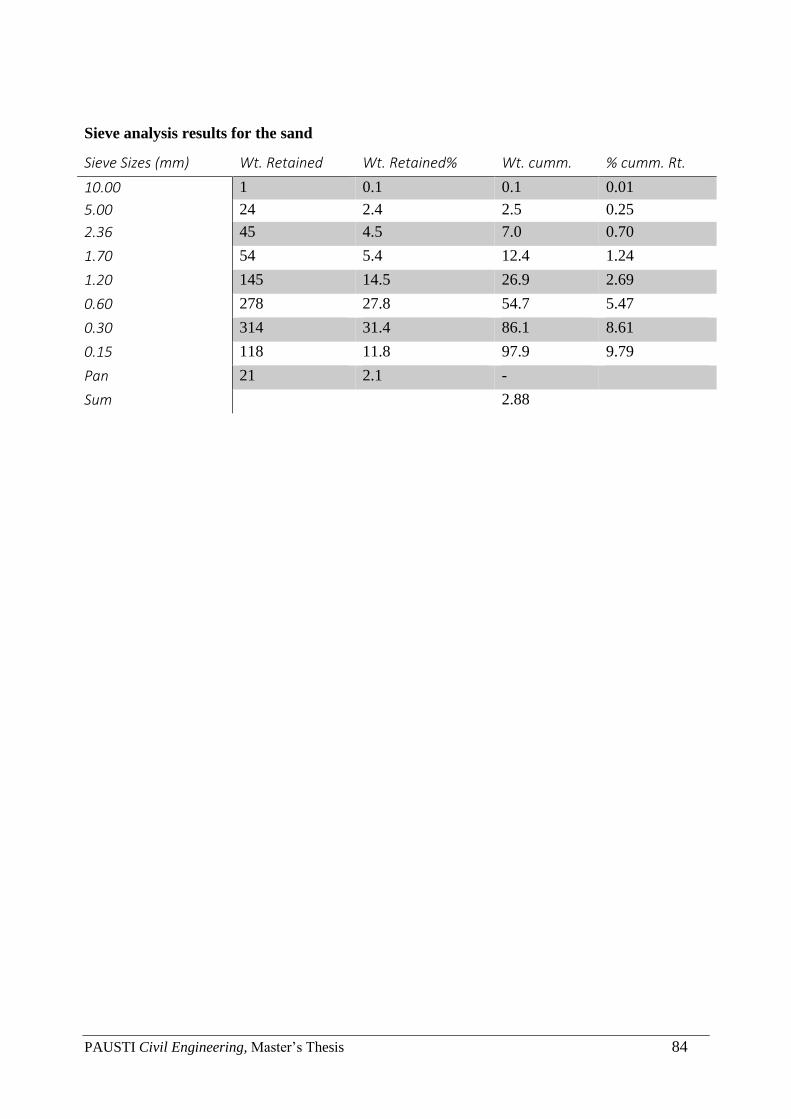
PAUSTI Civil Engineering, Master’s Thesis 84
Sieve analysis results for the sand
Sieve Sizes (mm) Wt. Retained Wt. Retained% Wt. cumm. % cumm. Rt.
10.00 1 0.1 0.1 0.01
5.00 24 2.4 2.5 0.25
2.36 45 4.5 7.0 0.70
1.70 54 5.4 12.4 1.24
1.20 145 14.5 26.9 2.69
0.60 278 27.8 54.7 5.47
0.30 314 31.4 86.1 8.61
0.15 118 11.8 97.9 9.79
Pan 21 2.1 -
Sum 2.88

PAUSTI Civil Engineering, Master’s Thesis 85
APPENDIX M. BRIDGE INSPECTION REPORT – FILLED CONDITION
ASSESSMENT SURVEY FORM