Embed Size (px)
Citation preview
Information Technology and Organizational Design:
Evidence from Micro Data
October, 1998
Erik Brynjolfsson
MIT Sloan School of [email protected]
Lorin M. Hitt
The Wharton SchoolUniversity of [email protected]
While many theories about the relationship between information technology (IT) andorganizational design have been proposed, there is little empirical evidence on the issue.We examine the influence of organizational design on the demand for IT and theproductivity of IT investments, using data from approximately 380 US firms. We findgreater demand for IT in firms with greater decentralization of decision rights (especiallythe use of self-managing teams), and greater investments in human capital, includingtraining and screening by education. In addition, IT has a greater contribution to output infirms that adopt a more decentralized and human capital-intensive work system. Thisrelationship is robust to alternative measures of IT and of work systems, as well asalternative specifications for demand and for productivity. These findings lend support tothe idea that organizational practices are important determinants of IT demand andproductivity.
This research has been generously funded by the National Science Foundation (Grant IIS-9733877), TheOrganization for Economic Cooperation and Development, the Stanford Computer Industry Project, theIndustrial Performance Center and the Center for Coordination Science at MIT and NationsBancMontgomery Securities.
We are grateful to Susan Athey, Eric Clemons, Zvi Griliches, Bengt Holmstrom, Tom Hubbard, MaryellenKelley, Thomas Kochan, Thomas Malone, Roy Radner, Jim Rebitzer, Kathryn Shaw, and Albert Wenger aswell as to seminar participants at Carnegie-Mellon University, MIT, the National Bureau of EconomicResearch, New York University, Stanford University, and the Wharton School for valuable comments onearlier versions ofthis paper. We would also like to thank Incon Research, the Center for Survey Research,Computer Intelligence Infocorp and Informationweek magazine for providing or collecting essential data.
IT and Organizational Design Page 1
Information Technology and Organizational Design:
Evidence from Micro Data
While many theories about the relationship between information technology (IT) andorganizational design have been proposed, there is little empirical evidence on the issue.We examine the influence of organizational design on the demand for IT and theproductivity of IT investments, using data from approximately 380 US firms. We findgreater demand for IT in firms with greater decentralization of decision rights (especiallythe use of self-managing teams), and greater investments in human capital, includingtraining and screening by education. In addition, IT has a greater contribution to output infirms that adopt a more decentralized and human capital-intensive work system. Thisrelationship is robust to alternative measures of IT and of work systems, as well asalternative specifications for demand and for productivity. These findings lend support tothe idea that organizational practices are important determinants of IT demand andproductivity.
IT and Organizational Design Page 1
1. Introduction
Technological innovation is rarely neutral in its effect on different organizational forms.
In the early 20th century, small electric motors provided the greatest benefit to “horizontal” factory
designs that distributed machinery and work (David, 1990). On a larger scale, the transition from
handicraft work to machine production has been associated with a shift to a system of more
hierarchical control and Taylorist work practices (Piore and Sabel, 1984).
The diffusion of information technology (IT) into the modern workplace may also benefit some types
of organizations more than others. The nature of the relationship between IT and organizational
design is of increasing concern to managers and numerous authors have developed theories and
predictions.1 For instance, Malone, Yates, and Benjamin (1987) hypothesize that IT will favor more
decentralized decision-making relative to centralized hierarchies. Milgrom and Roberts (1990) argue
that the exogenous price decline of IT as a key driver that has favored “modern manufacturing”
relative to “mass production.” While the number of theories about IT’s organizational impacts
continues to grow, there is much less empirical evidence on this question. Case studies of particular
companies or industries have provided valuable insight into particular uses of IT, but we know
surprisingly little about whether there are any more general patterns that relate IT adoption and
organizational design.
As a general-purpose technology, IT has diffused broadly into many different industries and
applications. The basic components of the technology are similar, regardless of where they are
used,2 just as the task of information processing in organizations has many commonalities regardless
of industry, product line, or location (Galbraith, 1977). However, some types of organizations may
benefit disproportionately from technical advances in computing and communications. While
energy-intensive methods of production are favored when the price of energy declines, so one would
expect that “information intensive” methods of production would be favored when the price of
1 A partial list includes Anand and Mendelson, 1997; Applegate, Cash and Mills, 1988; Attewell and Rule,1984; Bolton and Dewatripont, 1994; Bresnahan, 1997; Brynjolfsson and Mendelson, 1993; Brynjolfsson,1994; George and King, 1991; Hubbard, 1997; Kelley, 1994; Malone, 1987; Malone Yates and Benjamin,1987; Malone, 1997; Nault, 1997; Orlikowski, 1992; Van Zandt, 1997; Wyner and Malone, 1996; Zuboff, 1988.See van Alstyne, 1997; Crowston and Malone, 1988; and Van Zandt, 1997a, for surveys.2 A recent overview in the Monthly Labor Review (McConnel, 1996) summarized several industry studiesand concluded: “In sum, computer technology is changing the nature and number of jobs. Its impact isextensive because the technology, network systems, and software is similar across firms and industries.”
IT and Organizational Design Page 2
(computer-generated) information declines. Organizations that choose to incur higher IT expenses
presumably expect compensating benefits, such as the ability to respond more quickly and
accurately to changes in their environment or to use less of other resources. As the price of IT
declines, these trade-offs will increasingly favor strategies and structures that use IT more
intensively. In particular, Malone, Yates, and Benjamin (1987) have specifically predicted that
declines in the costs of IT will tend to favor decentralized “coordination-intensive” structures over
more centralized ways of organizing, which economize in coordination costs at the expense of
efficient resource use and flexibility. They argue that while all types of firms will benefit in absolute
terms from a decline in the price of IT, firms in which IT represents a larger share of inputs have
the most to gain.
However, we do not have a good understanding of what types of organizations are the most
intensive users of IT. Empirical research has been hampered by a scarcity of meaningful,
generalizable data on organizational design. As a result, theories about IT’s organizational impacts
are often only loosely grounded in empirical evidence and, inevitably, different theories sometimes
come to opposite conclusions about how IT affects organizations. For instance, the question of
whether IT will tend to favor centralized decision-making or decentralization has been debated for
almost 40 years (Leavitt and Whisler, 1958; George and King, 1991).
This paper explores the relationship between IT and organizational design using new data from a
broad cross section of firms. We empirically examine the relationship between organizational design
and IT use, and how the combination of IT and organizational design affects firm productivity. This
is accomplished by matching detailed data on IT use and productivity with a new survey of
organizational practices for approximately 380 large U.S. firms.
We find that organizational practices are predictive of both firms’ demand for IT and the
contribution of IT investment to firm output. In particular, demand for IT is greatest in firms that
delegate more decision-making to line workers, use self-managing teams more extensively, use
group-oriented incentive systems, hire more educated workers, and invest more in training than other
firms in the same industry. Furthermore, these organizational practices are all correlated with one
another, suggesting that firms can usefully be characterized as choosing different points on a single-
dimension that, at the risk of oversimplification, we label centralization-decentralization. We also
IT and Organizational Design Page 3
find evidence that firms using more decentralized work systems derive higher benefits from their IT
investments, and this result is robust to alternative measures of decentralization and changes in the
productivity specification.
While a comprehensive theory of the role of information in organizations remains elusive, our
empirical results are more supportive of some classes of theories than others. In particular, the
results are most supportive of those theories that predict that lower information processing and
communications costs will be especially beneficial for organizations that distribute decision-making.
In contrast, theories that predict greater centralization can be reconciled with our results only if
some additional assumptions are made about unobserved factors in the environment.
In the next section, we briefly review some of the relevant literature, including theories of the
relationship between IT and organization. Section 3 describes the empirical methodology and data.
Section 4 presents the results, and we conclude the paper with a brief summary and discussion in
Section 5.
2. Previous Literature
This research relates to a number of different areas of the management literature. The work
systems we identify are similar to what has been termed “high performance work systems”
(Ichniowski, Kochan, Levine, Olson, and Strauss, 1996); our findings may help explain both the
increasing diffusion and performance impact of this type of work organization. This paper also
builds on earlier work on information systems management that has found differential effects of IT
on alternative systems for organizing work,3 and recent work that has found substantial productivity
benefits from the use of IT at the firm level (Brynjolfsson and Hitt, 1995; 1996; 1997; Lichtenberg,
1995). There have also been several papers that examined the industry-level determinants of the
demand for IT, mainly as a function of price and output (Brynjolfsson, 1996; Gurbaxani, 1992;
Gurbaxani and Mendelson, 1990) and the demand for mainframes and client-server computing
(Bresnahan and Greenstein, 1997; Greenstein, 1996). Finally, portions of the empirical approach
3 See George and King, (1991) and Crowston and Malone (1988) for reviews.
IT and Organizational Design Page 4
draw on the economics of complementarities (Athey and Stern, 1997; Milgrom and Roberts, 1990;
Holmstrom and Milgrom, 1994).
2.1 New Work Systems
A number of empirical studies have examined the relationship between organizational practices and
firm performance (Dunlop and Weil, 1993; Huselid, 1994; Ichniowski, Shaw, and Prunnushi, 1994;
Lawler, Mohrman, and Ledford, 1995; MacDuffie, 1995). In particular, attention has been focused
on a cluster of organizational design choices labeled “high performance work practices.” These can
include the use of team-based production, the allocation of decision authority to workers, higher skill
levels and training, broader job responsibilities, use of quality circles, adoption of total quality
management, team-oriented incentive systems, and pre-employment screening practices (Ichniowski
et. al., 1996). Several of these studies have recently found large economic benefits from the use of
clusters of these practices leading Osterman (1994) to question why they are not more widespread.
Ichniowski et. al. suggest that the need to coordinate changes in multiple practices, including IT use,
may be part of the difficulty.
However, while there is some general consistency among the studies, they differ substantially with
respect to their theoretical justification, setting, and operationalization of work systems. A
comparison of work systems components that have been used in prior work appears in Appendix B.
Management theorists and, to a lesser extent, economists, have also voiced a perception that the
trade-offs among different organizational designs has changed in recent years. In particular,
hierarchy, centralized control, and bureaucracy seem increasingly out of favor. For instance,
Drucker (1988) argues that we are in the midst of a “third period of change: the shift from the
command-and-control organization...to the information-based organization."
Similarly, Aoki (1990) writes
the tendency towards the delegation of decision-making to the lower levels of organizationalhierarchies, where economically useful on-the- spot information is available, as well as thenon-hierarchical communication among operating units, is becoming a more discerniblephenomena on a world-wide scale, wherever conditions permit.
IT and Organizational Design Page 5
It is important to note that the emerging doctrine of broadly delegating decision-making differs
strikingly from the Taylorist tradition that helped make Henry Ford’s factories successful earlier in
this century. This tradition can be characterized by a rigid distinction made between the decision-
maker and the workers, the "separation of conceptualization and execution" (Sabel at al., 1989).
The philosophy is epitomized by the modestly titled "First Law of Scientific Management" laid down
at the beginning of the century:
"It is necessary in any activity to have a complete knowledge of what is to be done and toprepare instructions as to what is to be done before the work is started...The laborer hasonly to follow instructions. He need not stop to think." (Meyers, 1914)
Holmstrom and Milgrom (1994) venture a possible explanation for the change in received wisdom:
It is notable that the specific criticisms we hear today – that bureaucracy impedesinnovation, that it is hopelessly slow, that it limits communication, that it prevents personalgrowth, and so on – are all problems that have been with bureaucracy from its inception.… To the extent that there is a need for reduced bureaucracy today, it may be because theenvironment has changed. Our modeling approach identifies some of the environmentalchanges that could account for the current trend toward greater worker responsibility(‘empowerment’).
A former CEO of General Motors links the change more specifically to new technologies:
Manufacturing technology is undergoing tremendous change. The whole approach isundergoing a big revolution... You've got to get decision-making pushed down to where theaction is. ("Roger Smith Reflects", 1990)
However, there is no unanimity regarding the causes, or even the existence, of any new trade-offs
among organizational designs, which suggests a role for more detailed data collection and analysis.
2.2 Trends in Information Technology Use
Driven by advances in microelectronics, the quality-adjusted price of IT hardware has dropped by
20-30% annually for the last thirty years (Berndt and Griliches, 1990; Gordon, 1990). This has led to
over a hundredfold increase in share of computers in the real capital stock since 1970. The
availability of the personal computer in the 1980s shifted the location of computing power from large
centralized “utilities” to workers’ desktops. In 1987 there was a personal computer (PC) for every
IT and Organizational Design Page 6
30 employees in large firms; by 1994 there was one PC for every six.4 What may be more
important is that many other employees interact directly or indirectly with computers through
terminals, embedded computing technologies or by using computer-generated information and
reports. At the same time, significant growth in “coordination technologies”, such as local area
networks, databases, and electronic mail has reduced the costs of communication and collaboration
among workers.
Studies using firm level data typically have found unexpectedly strong correlations between IT and
productivity. In these studies, the marginal benefit of the increase in output associated with an
increase IT investment appears to be larger than the marginal costs of IT (Brynjolfsson and Hitt,
1995, 1996, 1997; Lichtenberg, 1995). This has led Gordon (1994) to ask “if IT has excess returns,
what is the hidden force that prevents greater investments?”
As with high-performance work organization, one possible answer is the difficulties associated with
coordinated changes in multiple components of a broader system (termed “adjustment costs” by
economists). In fact, individual firm-effects appear to account for up to half of the apparent excess
returns to IT (Brynjolfsson and Hitt, 1995), and the returns to IT are substantially greater in long
differences (5 to 7 years) than in short differences (1 year) (Brynjolfsson and Hitt, 1997). This
suggests that some hidden, slowly changing, firm characteristics are correlated with IT and have
important effects on productivity but are not counted in the standard inputs used to estimate
productivity. In fact, one can think of the adjustment costs incurred in integrating IT into a work
system as investments in an intangible, yet nonetheless valuable, asset (Hayashi, 1982).
The importance of integrating technology and organization has become more apparent as computers
move from their traditional role in the “back-office” to supporting the day-to-day activities of line
workers and managers, particularly those involved in knowledge work. The development of
decentralized computing technologies has also coincided with the increased attention to business
process redesign, emphasizing the interaction of work organization and investments in information
systems (Davenport and Short 1990; Hammer, 1990). However, redesigning organizations is
4 This number was computed from one of our datasets on computer expenditures. It refers to the largest 800US firms with publicly reported employment information.

IT and Organizational Design Page 7
apparently not easy; firms that require a greater degree of organizational redesign appear to adopt
new types of IT more slowly (Bresnahan and Greenstein, 1997).
IT and Organizational Design Page 8
2.3 Information Systems and Organization
While the relationship between information and information processing capability and organization
has a long history in economic thought, there is no consensus on a theoretical model that captures all
of the relevant relationships. However, there is a substantial body of literature that provides
different perspectives on how IT and organizational design might be related. By conducting
empirical analyses, we may be able to demonstrate which of these perspectives are more promising
in modeling actual firm behavior.
Brynjolfsson and Mendelson (1993) stress that the information systems and decision-making
structure of organizations are jointly determined. To the extent that computers lower the cost of
lateral communication, enable firms to obtain more information to process, or increase the
capabilities of line workers to perform information processing tasks, a variety of models would
predict an association between computers and greater levels of decentralized authority. For
example, Wyner and Malone (1996) present a model in which decreased communications costs
enable firms to utilize decentralized organizational structures. Similarly, Radner’s (1993) finding that
hierarchical decision-making minimizes communications costs suggests that the benefits of hierarchy
diminish as communication becomes less expensive. In the literature on "bounded rationality," Van
Zandt (1997) provides a model in which firms will optimally decentralize decision-making as the flow
rate of new information increases relative to the capabilities of the central information processors.
Mendelson and Pillai (forthcoming) argue that organizations in industries characterized by rapid
change will invest in both technological and organizational factors to reduce information overload.
Furthermore, the location of knowledge within the organization also may influence organizational
design: if critical specific knowledge is held by line workers, organizations would optimally choose
delegated decision making (Anand and Mendelson, 1997; Aoki, 1986), as long as the
communications and coordination costs do not outweigh the benefits of more efficient utilization of
knowledge and information.5
However, studies that have emphasized vertical communication and the coordination advantages of
centralized control often lead to the conclusion that information technology should lead to greater
IT and Organizational Design Page 9
reliance on hierarchy and central planning. For instance, Bolton and Dewatripoint (1994) argue that
lower communication costs make it easier for a central decision-maker to coordinate without having
to delegate decision-making to middle managers. Others have also argued that technology may also
improve the capabilities of central decision-makers (Leavitt and Whistler, 1958), enabling them to
process more information without suffering from information overload.
Previous empirical studies have linked computers to shifts in employment toward higher skilled
workers, increased employment in "knowledge work" and “information work” occupations, higher
wages for computer-using employees, and increased income inequality (Wolff, 1996; Krueger, 1993;
Autor, Katz and Krueger, 1997; Berman, Bound, and Griliches, 1994). Bresnahan (1997)
hypothesizes that the economic effects of computerization reflect the emergence of a broader
system of work; this system includes not only computers, but also new types of work organization
and new levels of product and service quality. A growing body of case studies supports this view6
and there is also some evidence from studies of larger samples. For instance, Kelley (1994) found
that computerized machinery was also disproportionately associated with modern work in
metalworking plants. In an exploratory study of firm-level data, Hitt and Brynjolfsson (1997) report
that decentralized work practices are often correlated with increased use of IT. However,
Pinsonneault and Kraemer (1997) found that whether IT led to greater centralization or
decentralization in a sample of government organizations depended significantly on organizational
politics.
In this paper, we extend the earlier work in this area by 1) explicitly estimating demand equations at
the firm-level, rather than correlations, 2) considering the performance effects of the IT-organization
relationship at the firm-level, and 3) evaluating alternative explanations for the results. In part, our
more detailed analysis is made possible because we employ a substantially larger firm-level data set
than earlier studies and analyze a richer set of measures for IT and organizational design.
3. Empirical Implementation
5 See also VanZandt (1997), Radner (1993), Malone, Yates and Benjamin (1987) ; George and King, 1991;Gurbaxani and Whang, 1991; Malone, 1997; Wyner and Malone, 1996; Pinsonneault and Kraemer, 1997.
IT and Organizational Design Page 10
3.1 Firm-level, Multi-industry Data
The relationships between IT and organizational design are explored using multi-industry, firm-level
data on IT characteristics, work practices, and organizational performance. Production functions
are used for performance measurement since they have a well-established theoretical framework
and has been used in previous work on IT and firm performance (Brynjolfsson and Hitt, 1995; 1996;
Lichtenberg, 1995).
The level of analysis was chosen to strike a balance between focused case studies and research on
broader trends in the economy. Case studies can provide insight into the mechanisms by which IT
and organizational design interact but lack generalizability, while economy-wide or industry-based
studies have the opposite strengths and weaknesses.
The analysis focuses on firm level data, rather than plant-level data for a number of reasons. First,
when comparing the costs and benefits of alternative work systems, it is important to define clearly
the boundaries of the unit of analysis. For many of the relevant costs and benefits, it may not be
meaningful to treat establishments within a firm as separate entities. IT networks often span
multiple establishments within the same firms, as do managerial decision-making activities, yet
neither is likely to be fully reflected in the accounting ledgers of the individual establishments. The
common management and technology infrastructure of establishments within a firm may be
associated with common human resource practices, work systems, and “corporate culture”
(Milgrom and Roberts, 1992). More generally, incomplete contracts theory (Grossman and Hart,
1986; Hart, 1988) argues that because firm boundaries are set to address problems of contractual
incompleteness, the presence of multiple establishments in a single integrated firm suggests some
difficulty that prevents these establishments from operating on a stand-alone basis.
Partly as a result of these factors, substantially more data are publicly available on firms than on
plants or business units. This information is important for various parts of this analysis, particularly
6 For example, see case studies on Phillips 66 (HBS 9-189-006), the Tiger Creek Mill (HBS 9-485-057 andZuboff, 1988), Macromed (Brynjolfsson, VanAlstyne and Renshaw, 1997) and InfoCorp (Gallivan, Goh, Hittand Wyner, 1994).
IT and Organizational Design Page 11
for performance measurement. Unlike firms, individual establishments do not have audited financial
statements and the data that are available at an unconsolidated level are subject to intra-firm
reporting biases that can add substantial error (Kaplan, 1989).
A multi-industry approach is used because it makes it easier to generalize the findings. Previous
case-based or industry-specific studies have left open the question of whether findings generalize to
the broader economy (Ichniowski et al., 1996). The relationship between IT and organizational
design may differ on a case by case basis, depending on unobserved, idiosyncratic factors in a
particular company or industry.7 Broader trends, if any exist, may be more apparent in a more
diverse sample.
3.2 Data Sources
The data set used for this analysis is a cross sectional survey of organizational practices conducted
in 1995 and 1996 matched to a panel of IT spending and productivity metrics over the 1987-1994
time period. A brief description of each data source follows with additional detail in Appendix A.
Computer Technology: The measures of IT use were derived from the Computer Intelligence
Infocorp installation database that details IT spending by site for companies in the Fortune 1000
(approximately 25,000 sites were aggregated to form the measures for the 1000 companies that
represent the total population in any given year). This database is compiled from telephone surveys
that detail the ownership for IT equipment and related products. Most sites are updated at least
annually with greater sampling for larger sites. The year-end state of the database from 1987 to
1994 was used for the IT measures. These data include variables capturing the total capital stock of
IT (central processors, personal computers [PCs], and peripherals) as well as measures of
computing power and the number of PCs. The IT data do not include all types of information
processing or communication equipment and are likely to miss that portion of computer equipment
7 Indeed, counter-examples for most, if not all, hypotheses about the relationship between IT andorganizational structure can often be found in the case literature,. This has led some researchers to suggestthat it is hopeless to find any general relationship (Attewell and Rule, 1984). By using a larger data set, thispaper provides a stronger test of the null hypothesis that there is no statistical relationship between IT andorganizational design.
IT and Organizational Design Page 12
that is purchased by individuals or departments without the knowledge of information systems
personnel.8
Compustat. Compustat data was used to construct various performance metrics and provide
additional firm information not covered by other sources. For the calculation of productivity, we
followed the procedures in Hall (1990) and Brynjolfsson and Hitt (1997). Measures were created
for output, capital, labor, and value added in order to calculate a production function relationship
between value added and the various inputs.
Organizational Practices: There are no publicly available data on the organizational characteristics
of interest and we therefore undertook a new survey. This survey was based on the organizational
characteristics identified in prior literature and adapted questions from prior surveys on human
resource practices and workplace transformation (Huselid, 1994; Ichniowski, Shaw and Prunnushi,
1997; Osterman, 1994). These questions address the allocation of various types of decision-making
authority, the use of self-managing teams, investments in training and education, incentives and
promotion criteria, the extent of computerization and other miscellaneous characteristics of the
workplace (further detail appears in the Results section).
Administered to senior human resource managers or their designees, the survey asked questions
about organizational practices at the most typical establishment. The approach of Osterman (1994)
was followed in focusing on a single class of employee, termed “production employees” (which
corresponds to Osterman’s “core employee”). A production employee was defined as “non-
managerial, non-supervisory personnel directly involved in producing a firm’s product or delivering
its service.”
Organizational data were collected in three waves, covering most of the Fortune 1000. A total of
416 firms provided at least some data for the study, including 93 from the first survey, conducted in
Summer, 1995, 138 from a survey administered in Fall, 1995 and 199 from a survey in Summer,
8 Another potential source of error in this regard is the outsourcing of computer facilities. Fortunately, tothe extent that the computers reside on the client site, they will still be properly counted by CII’s census.Furthermore, in 1992 a similar sample of firms reported that they outsource an average of approximately 5%of their total IS budgets (Brynjolfsson and Hitt, 1995).
IT and Organizational Design Page 13
1996.9 Because some firms on the HR practices survey do not have complete matching data from
CII and Compustat or have missing data on key questions on the survey, most analyses are
conducted using a sample size of 379 firms. After the first wave of data was collected, the survey
instrument was shortened to improve the response rate, and several of the survey questions were
rephrased for clarity. The overall response rate was 52%. The most common explanations for non-
response were “company policy” or “didn’t have time.”
In interpreting the results, it is important to keep in mind the limitations of the study design. By
matching cross-sectional data on organizational characteristics to panel data on productivity, this
approach is consistent with the attempt to use workplace characteristics to explain long-run
differences in productivity. However, it does limit the ability to address issues of causality. While it
would have been ideal to have panel data on organizational characteristics as well, these data were
unavailable historically, and extensive retrospective surveying was deemed too unreliable.
Summary statistics on the sample respondents are provided in Table 1 for firms that have a
complete set of production inputs and outputs (value added, capital, labor, and IT capital) from CII
and Compustat. The main difference between the firms in the sample and the rest of the Fortune
1000 is that included firms tend to be slightly larger and more capital-intensive. Approximately 55%
of the sample are from the manufacturing, mining, or construction sectors and 45% are in services.
One potential difficulty of our sampling approach is that the practices reported by the respondent
may not be representative of the work practices across the entire firm. To address this issue, the
revised instrument contained questions about how representative production workers were in terms
of total employment and the uniformity of work practices for this category of workers. Overall, for
the average firm in the second survey subsample, production workers account for about two-thirds
of total employment and organizational practices are found to be fairly uniform: 65% of respondents
said that all workers have the same work practices. Furthermore, 82% reported that at least 80%
of workers had the same work practices, and 92% reported that at least 40% had the same work
practices.
9 Data for 14 firms could not be matched to either CII or Compustat data and had to be dropped from theanalysis. Furthermore, some the remaining firms provided only partially complete data or were missing datafrom Compustat, reducing the sample size for many of the analyses, as noted in the tables.
IT and Organizational Design Page 14
Another concern is that, even if production workers are important and fairly uniform within the firm,
our survey instrument may not accurately capture the important organizational design
characteristics. Unlike employment or wages, there are no clear metrics for measuring concepts
like “decentralization.” However, our results appear to be consistent whether we measure
decentralization as a system of work practices, the use of specific work practices (e.g., teams), or
examine the specific delegation of authority for different types of tasks. Moreover, these alternative
measures of work systems are all highly correlated, suggesting internal validity of our survey
instrument. Given that the various work practices that are complementary to IT (both the ones we
measure and those that we do not) are likely to be complements themselves, it is probably better to
interpret our measures as capturing a piece of a broader work system that includes these
components rather than focusing on the measured practices themselves.
4. Results
4.1 Organizational Design and the Demand for IT
What types of organizations are most likely to gain from future declines in the cost of IT? Clearly, a
given percentage decrease in the cost of IT will benefit firms that are more IT-intensive more than
firms that rely less heavily on IT. We find that decentralized organizations tend to be more IT-
intensive, regardless of whether we look at the demand for IT or IT’s output elasticity (roughly, the
increase in output associated with a 1% increase in IT).
4.1.1 Correlations with Work Practices
In this section, we examine the correlation between IT and decentralization and related practices.
All correlational analysis is done using Spearman rank order correlations10 between various
measures of IT and the work system variables, controlling for firm size (employment), production
10 Results are similar when probit or ordered probit regression is used. We report Spearman rank ordercorrelations because they are easier to interpret given the non-metric nature of most of our work systemvariables.
IT and Organizational Design Page 15
worker occupation, and industry.11 Six different measures of IT are used. Three are from CII,
which include total value of IT installed base (ITCAP), total central processing power12 in millions
of instructions per second (MIPS), and number of personal computers (TOTPC), which captures
decentralized computing. Three additional measures are obtained from the organizational practices
survey: the percentage of production workers that use general purpose computers, the percentage of
the work force that uses electronic mail, and a five-point scale of the computerization of the
workplace (COMP). Multiple measures are employed because they capture slightly different
aspects of computerization (for example, MIPS measures centralized computing, while TOTPC
measures decentralized computing).
The three measures of IT taken from the organizational practices survey have the advantage that
they focus on the technology in use by the same production workers covered by the work systems
data, but the disadvantage that some respondents might let their answers to some questions
influence their answers to other questions. On the other hand, the three IT measures derived from
CII data have the advantage that they are collected by a separate census of different individuals
(with different job titles), but the disadvantage that they apply to the whole firm, not necessarily the
specific portion described by the work practices survey. Thus, some additional noise is likely to be
introduced when the organizational practice variables are matched to the CII-based measures.
As discussed in Section 2, there is an ongoing debate about whether IT is associated with
centralized decision-making, decentralization, both, or neither. While there are case studies that
bolster each of these views, there has been no broader evidence about whether IT is more strongly
correlated with centralization or decentralization. The survey addresses several aspects of this
question, including the use of structures that decentralize authority, such as self-managing teams,
employee involvement groups, and broader duties assigned to line workers. It also asks directly
about the allocation of individual decisions on various aspects of the production process, such as the
pace or method of work and the locus of responsibility for various types of decisions. Finally, we
11 Included are separate controls for mining/construction, high technology manufacturing (instruments,transportation, electronics, computers), process manufacturing (paper, chemicals, petroleum), other non-durable manufacturing, other durable manufacturing, transport, utilities, trade, finance, and services.12 Total central processing power does not include the processing power of personal computers.
IT and Organizational Design Page 16
consider practices associated with decentralization, such as team-oriented incentives and measures
to increase human capital (training, pre-employment screening).
The correlations of these measures with IT are shown in Table 2a. In terms of structural
decentralization, the results show strong correlations between the use of self-managing teams and
IT as well as some evidence that high IT firms employ broader job classifications and make greater
use of employee involvement groups. There is also evidence that firms use supporting incentives for
team-based organization, either through promotion incentives or team building exercises.13 Finally,
IT-intensive firms also train a larger fraction of their staff and screen new employees more
extensively for education.
The individual decentralization measures also show a substantial correlation with IT. Firms that use
more IT are also more likely to give their line workers discretion over the methods used in their
work. For the second and third survey, we expanded the individual decision authority scale to cover
seven distinct types of decisions and broadened the scale from 3 points to 5. Of the 42 pairs of IT
measure and decision-making type, 41 show positive correlations and 74% of the correlations are
significant at p<.05 (Table 2b). Firms in which workers, not managers, are responsible for deciding
the “best way to perform tasks” are especially likely to have higher demand for IT. This suggests
that IT is less of a tool for monitoring compliance with management decisions than for enabling
workers to make better decisions independently.
As a summary statistic, we created a composite decentralization scale by summing the standardized
values of the seven decision authority variables (Cronbach’s alpha=.73).14 We find a consistent
positive correlation between IT and decentralization, significant at p<.01 for four of the six IT
measures. Finally, an alternative measure that simply asks directly for “the extent to which workers
are provided individual control and decision making responsibility” shows similar results when
correlated with IT.
13 Team building exercises include activities designed to foster allegience toward fellow workers which cancreate peer pressure for performance. Kandel and Lazear (1992) argue that these can be useful incentiveinstruments when effort is not directly observable to management.14 This approach requires the strong assumption that the decision authority variables, which are measuredon a five point scale, can be treated as metric variables. This is standard practice in the psychometricresearch literature.
IT and Organizational Design Page 17
On balance, there is substantial evidence that IT is broadly related to decentralized authority, both in
terms of teams as well as individual decision rights. The results are consistent across IT measures,
although the IT measures derived from the organizational practices survey show particularly strong
correlations.
4.1.2 Correlations with Aggregate Measure of the Work System
The results indicate that IT is correlated with a collection of practices that includes team-based
organization, decentralization of decision rights, and acquisition of human capital. If one identifies
the firm with a system of complementarity practices (Holmstrom and Milgrom, 1994), then these
practices will not be chosen in isolation. Instead, all of these factors are likely to be correlated,
suggesting that a single measure can be constructed that captures the adoption of these practices as
a system.
To examine whether these practices tend to be adopted together as the theory would predict, a
principal components analysis of the eight relevant measures of work practices was conducted
(Table 2d). A Scree plot (Figure 1) suggests that the first principal component is the only non-noise
factor. The factor loadings are consistent with the work system arguments and the weights on the
practices are .4 or higher. Based on this analysis, a proxy for organizational decentralization is
constructed (ORG) by summing the sum of the sign-corrected standardized values of all variables
included in the factor analysis. The resulting Cronbach’s alpha is .71, which indicates adequate
reliability. To facilitate interpretation when this measure is used in regression analyses, this variable
is standardized to a mean of zero and a variance of 1, with higher values indicating firms that are
more “decentralized.”
We find that all measures of IT are significantly correlated with the ORG variable (Table 2e). It is
possible that this relationship is due to work force composition or industry rather than a direct
relationship with IT. Firms that employ a disproportionate number of professionals are likely
candidates for both increased use of IT as well as the adoption of decentralized work structures.
IT and Organizational Design Page 18
To explore this possibility, the correlations are repeated first without controls and then successively
controlling for firm size (employment), production worker occupation, and industry and then the
measures of human capital: skills, education, and work force composition. The correlations tend to
decline somewhat as additional control variables are added. However, considering the risk of
“overcontrolling” for factors that should be free to vary with ORG, the correlations remain fairly
high. This suggests that the results do not appear to be driven only by differences in work force
composition or human capital across firm, or at least not to the extent that we are able to measure
such differences.
As an alternative, we also examine results when we chose a single measure as the representative of
the work system scale. Use of a single variable avoids assumptions required for aggregating non-
metric scales. The variable “self-managing teams” had the highest factor loading in the principal
components analysis and was selected as the representative. As reported in Table 2a, self-
managing teams is highly correlated with all measures of IT after controlling for size, industry, and
production worker occupation. In addition, we find that the correlations between the six measures
of computerization and self-managing teams are positive and generally significant, even when the
full set of controls are added, including those for skills, education, and work force composition. Four
of the six correlations are significant at p<.05 and five are significant at p<.1.
4.1.3 Demand Equations for IT
A more structured way to analyze these relationships is to estimate demand equations for IT. We
relate the logarithm of IT input quantity to changes in the price of IT and the prices of other factors,
and demand shifters, such as industry, year, organizational design, and scale. This simple demand
structure is consistent with prior work on IT demand (Brynjolfsson, 1994; Gurbaxani, 1992) and
yields coefficients that can be easily interpreted in terms of demand elasticities. In addition, results
are similar when we use the factor demand structure implied by a generalized Leontief or
trancendental logarithmic cost function.15 Because the prices paid for IT and other inputs are
15 The factor demand equation is the first order condition of cost minimization given a cost function andconstant factor prices. If the cost function is Generalized Leontief, this yields the following factor demandequation:
IT and Organizational Design Page 19
essentially invariant across firms, the time dummy variables will capture both price effects and any
other economy-wide changes in demand.
Our previous arguments have suggested that IT and ORG are complements, and in the long run we
would expect that they influence each other. However, in the short run it is much easier to adjust
the level of IT investment than it is to make major organizational changes. Thus, for our
econometric analyses we make the assumption that ORG is not influenced by changes in IT over
our sample frame, and therefore exogeneous relative to IT investment. This assumption allows us to
identify the effect of ORG on IT demand. In a later section, we probe this assumption using other
survey measures and instrumental variables regression and generally find that although there is
evidence that ORG has changed slightly over our sample period for some firms, these changes do
not appear to affect the conclusions of the paper.
Using the demand structure outline above and our identifying assumption about ORG being fixed
relative to IT investment, the basic estimating equation is:
where: ORG is the measure of decentralization, VA is value added, IT is IT capital, and T is a set of
time dummy variables.
Given the earlier results, it is not surprising that we find that the more decentralized firms have a
higher demand for IT (Table 3). Interestingly, the effect of ORG on IT demand is roughly the same
magnitude when we control for industry and overall work force composition.16 An examination of
IT
OutputORG VA T controlsD VA t
tt= + + + + +
=∑β β β β ε0
87
94
log
If the cost function is assumed to be transcendental logarithmic, the dependent variable is changed to theratio of nominal IT input quantity to total nominal cost while the rest of the equation remains the same(although the coefficients now have a different interpretation). The primary result that IT demand isincreasing as organizations become decentralized is consistent across all demand specifications weexamined.16 Results are also similar when we explicitly use factor prices instead of time dummies, interact the timedummies with industry (allowing price effects to vary by industry), using PC capital stock instead of totalcomputer capital stock, or use IT cost share (implied by a trancendental logarithmic cost function) as thedependent variable.
log( ) logIT ORG VA T controlsD VA tt
t= + + + + +=∑β β β β ε0
87
94
IT and Organizational Design Page 20
the industry dummy variables indicates that demand for IT is highest in finance and high-tech
manufacturing, which is consistent with previous estimates using industry-level data (Gurbaxani,
1992).
The effect of ORG on the demand for IT is similar when the industry controls are replaced with
variables representing the proportion of the firm in each industry17 rather than a pure 0-1 dummy
variable for the firm’s primary industry (Table 3, column 5). Thus, even though the firms in our
sample span multiple industries, this also does not appear to substantially alter the results. This
provides further evidence that the relationship between IT and organization is capturing a system of
work practices that is widely applicable across production settings and industries. We also
examined the influence of whether organizational decentralization is related to the use of
decentralized computer architectures and find that the results are similar irrespective of what types
of computing are measured.
When we examine the demand for IT over time, we find that not only do decentralized firms have
higher demand, but they also increase their demand for IT at a faster rate than centralized firms.
This is illustrated in Figure 2, which plots “demand curves” for two hypothetical organizations, one
which is one standard deviation above the mean in ORG and one which is one standard deviation
below the mean. Both the intercept and the slope of the demand curve are allowed to vary by
organizational type, but changes are constrained to be constant for all years. As in the specification
in which slopes did not vary, we find that high ORG firms have about a 20% higher demand than low
ORG firms (t = 8.6). In addition, we find that their elasticity of demand is 9.4% higher (t = 2.25),
although as discussed above, this may simply reflect a better matching of the ORG variable to IT at
the end of the sample period than at the beginning of the sample period.
4.1.4 Interpretations of the Demand Pattern for IT
It has long been recognized that differences in profitability can be a major determinant of the rate of
diffusion of a technology (Griliches, 1957), and so one might expect that new investments in IT
17 For each site of the firms in our sample, CII also reports an industry code (4-digit SIC) and number ofemployees. These data were used to computer employment shares by industry.
IT and Organizational Design Page 21
would occur first where they are most profitable. Thus, one explanation for the correlation we find
between IT and decentralized work systems is that firms that decentralized enjoy greater benefits
from adopting IT.
However, several other explanations are also possible. A second possibility is that decentralized
firms might be more likely to duplicate IT investments or make wasteful IT investments. According
to this argument, centralized firms may spend less on computing, but they are not necessarily getting
any fewer benefits.
A third explanation is that decentralized firms may have lower adjustment costs. If firms are not all
at their optimal level of investment, then the firms with lower adjustment costs may temporarily have
greater adoption of IT. In fact, decentralized firms do tend to have more educated workers, and
past research (e.g., Bartel and Lichtenberg, 1987) has indicated that educated workers may have an
advantage in implementing new technologies.
A fourth possibility is that there may be systematic mismeasurement that leads us to overestimate
the amount of IT in decentralized firms relative to centralized firms. However, the consistency of
the results, regardless of which measure of IT was used, is not very supportive of this interpretation.
Finally, the correlations can also be explained by the existence of a variety of third factors that might
simultaneously lead firms to use more IT and adopt decentralized structures without there being any
direct link between the two. For instance, firms in a turbulent environment might choose to increase
IT and also to rely more on decentralized decision-making, while those in static environments might
have less demand for IT and choose greater centralization. In general, if exogenous factors that
influence IT use (except for decentralization) and exogenous factors that influence decentralization
(except for IT) are affiliated,18 then IT and decentralization can show positive covariation without
any relationship between the two (Athey and Stern, 1997; Holmstrom and Milgrom, 1994).
Under any of the first three explanations, a continuing decline in the costs of IT will tend to benefit
decentralized firms disproportionately. In particular, the demand equations indicate that a firm with
IT and Organizational Design Page 22
one standard deviation above average in ORG will have about 20% higher demand for IT at any
given price. This implies that they will get about 20% more “manna” every time the price of IT
declines, as long as this does not increase their other costs in an offsetting way. If their demand
elasticity is higher as well, as some evidence suggests, then this benefit will grow even larger over
time.
Examining the productivity impact of various combinations of decentralization and IT can help one to
distinguish among some of these explanations. In particular, if decentralized firms’ higher IT
investments are indicative of their actual benefits, then the output elasticity of IT should also be
higher for these firms. In contrast, the hypotheses that decentralized firms’ higher IT investments
are symptoms of mismeasurement, wasteful duplication, or lower adjustment costs each imply that
the output elasticity of IT will not be proportionately higher in decentralized firms.19
Differences in output elasticity will not necessarily rule out the existence of unmeasured, third
factors. It is possible that a third factor, which is correlated with productivity, may also be
disproportionately associated with firms that adopt both IT and decentralization. However, it is not
sufficient that they simply adopt more of everything; for this result to be consistent with our
analysis, high productivity in some firms must also be correlated with decreased adoption of IT and
increasing which is a much more difficult set of conditions. Second, investing in more centralized
computers (e.g. mainframes) and undergoing wrenching organizational changes does not appear to
be a rational way to consumer excess cash flow which makes stories of managerial agency less
plausible as a source of spurious correlation (see e.g. Brynjolfsson, Bresnehan and Hitt, 1998).
Ultimately, statistical evidence regarding patterns of IT adoption and productivity must be combined
with evidence from other sources, such as cases and theory, to build a comprehensive understanding
of IT’s effects.
18 Two variables are affliated if they show positive correlations under any monotonic transformation. Inpractice, this means that they show positive rank order correlation.19 Lower adjustment costs will be assocaited with a lower gross marginal product of IT in equilibrium. As aresult, a testable prediction of this hypothesis is that the output elasticity should not grow as rapidly as theinput share for high ORG firms.
IT and Organizational Design Page 23
4.2 IT and Work Systems: Evidence from Performance Analyses
To examine whether the measured output of IT varies with organizational structure, we adopt the
standard approach employed to study the effects of inputs, such as R&D on firm performance
(Griliches, 1986). This framework has also been applied in previous work on the relationship
between IT and output (Brynjolfsson and Hitt, 1995; 1996; Lichtenberg, 1995).
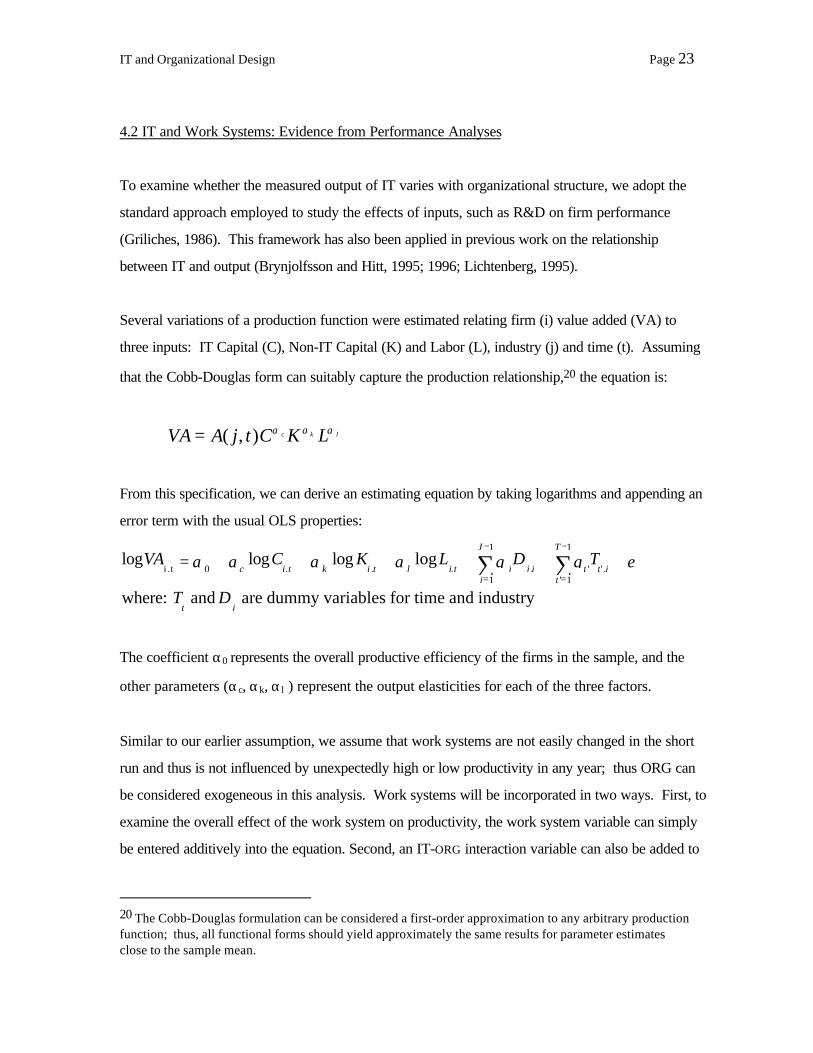
Several variations of a production function were estimated relating firm (i) value added (VA) to
three inputs: IT Capital (C), Non-IT Capital (K) and Labor (L), industry (j) and time (t). Assuming
that the Cobb-Douglas form can suitably capture the production relationship,20 the equation is:
VA A j t C K Lc k l= ( , ) α α α
From this specification, we can derive an estimating equation by taking logarithms and appending an
error term with the usual OLS properties:
log log log log, , , , ' ' ,
'
VA C K L D T
T D
c i t k i t l i t j j i t t it
T
j
J
t j
i ,t
where: and are dummy variables for time and industry
= + + + + + +=
−
=
−
∑∑α α α α γ γ ε01
1
1
1
The coefficient α0 represents the overall productive efficiency of the firms in the sample, and the
other parameters (αc, αk, αl ) represent the output elasticities for each of the three factors.
Similar to our earlier assumption, we assume that work systems are not easily changed in the short
run and thus is not influenced by unexpectedly high or low productivity in any year; thus ORG can
be considered exogeneous in this analysis. Work systems will be incorporated in two ways. First, to
examine the overall effect of the work system on productivity, the work system variable can simply
be entered additively into the equation. Second, an IT-ORG interaction variable can also be added to
20 The Cobb-Douglas formulation can be considered a first-order approximation to any arbitrary productionfunction; thus, all functional forms should yield approximately the same results for parameter estimatesclose to the sample mean.
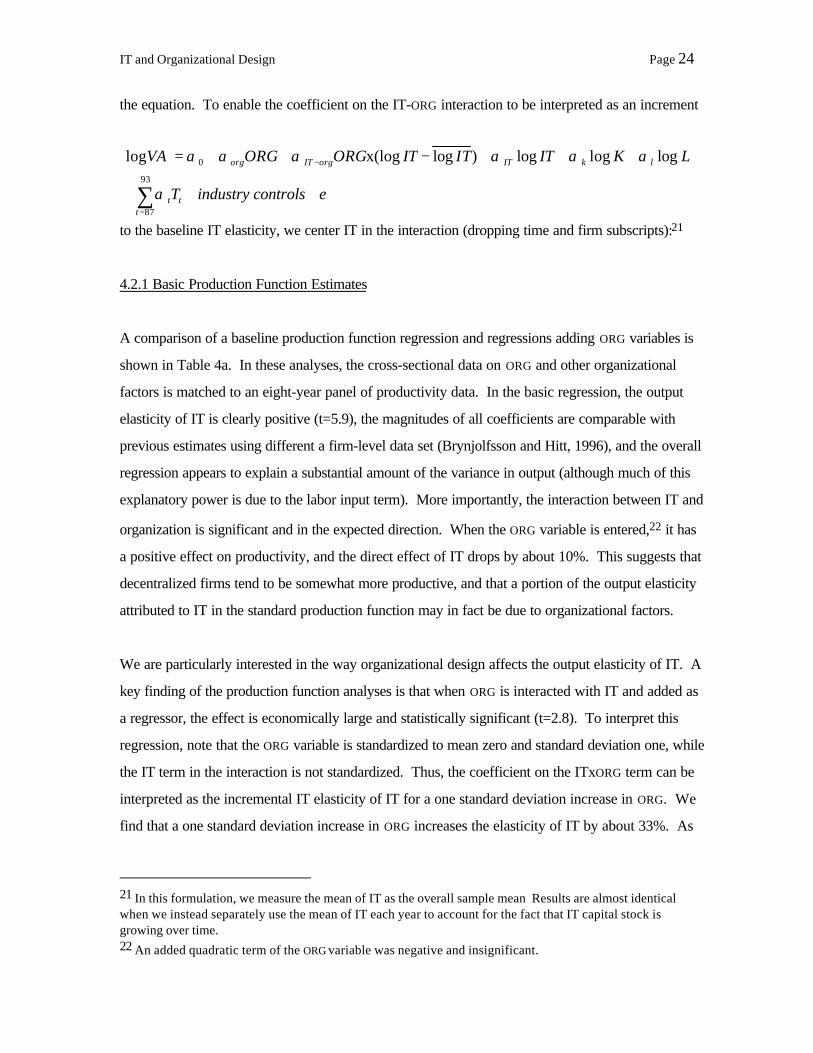
IT and Organizational Design Page 24
the equation. To enable the coefficient on the IT-ORG interaction to be interpreted as an increment
to the baseline IT elasticity, we center IT in the interaction (dropping time and firm subscripts):21
4.2.1 Basic Production Function Estimates
A comparison of a baseline production function regression and regressions adding ORG variables is
shown in Table 4a. In these analyses, the cross-sectional data on ORG and other organizational
factors is matched to an eight-year panel of productivity data. In the basic regression, the output
elasticity of IT is clearly positive (t=5.9), the magnitudes of all coefficients are comparable with
previous estimates using different a firm-level data set (Brynjolfsson and Hitt, 1996), and the overall
regression appears to explain a substantial amount of the variance in output (although much of this
explanatory power is due to the labor input term). More importantly, the interaction between IT and
organization is significant and in the expected direction. When the ORG variable is entered,22 it has
a positive effect on productivity, and the direct effect of IT drops by about 10%. This suggests that
decentralized firms tend to be somewhat more productive, and that a portion of the output elasticity
attributed to IT in the standard production function may in fact be due to organizational factors.
We are particularly interested in the way organizational design affects the output elasticity of IT. A
key finding of the production function analyses is that when ORG is interacted with IT and added as
a regressor, the effect is economically large and statistically significant (t=2.8). To interpret this
regression, note that the ORG variable is standardized to mean zero and standard deviation one, while
the IT term in the interaction is not standardized. Thus, the coefficient on the ITxORG term can be
interpreted as the incremental IT elasticity of IT for a one standard deviation increase in ORG. We
find that a one standard deviation increase in ORG increases the elasticity of IT by about 33%. As
21 In this formulation, we measure the mean of IT as the overall sample mean Results are almost identicalwhen we instead separately use the mean of IT each year to account for the fact that IT capital stock isgrowing over time.22 An added quadratic term of the ORG variable was negative and insignificant.
log (log log ) log log logVA ORG ORG IT IT IT K L
T industry controls
org IT org IT k l
t tt
= + + − + + +
+ + +
−
=∑
α α α α α α
α ε
0
87
93
x
IT and Organizational Design Page 25
in the demand analysis, results are similar if we use industry share controls rather than industry
dummies: the coefficient rises even further to .0157 (44% above the base elasticity).
This indicates that firms adopting both high levels of IT use and more decentralized work systems
have disproportionately greater output than firms that just adopt one or the other. Centralized
firms do not increase their output as much as decentralized firms do when they boost IT levels.
This provides further evidence that decentralized firms are more IT-intensive than centralized firms
and suggests an explanation for this empirical result. The increase in IT’s output elasticity is not
consistent with the hypothesis that the higher IT levels that we found in decentralized firms is a
measurement artifact or represents wasteful duplication. The results are also not supportive of the
hypothesis that decentralized firms have invested more in IT because of lower adjustment costs –
there is no evidence that the marginal product of IT is lower in decentralized firms. If anything, the
marginal product of IT appears to be higher in decentralized firms since the output elasticity
increases more than the factor share with decentralization (33% vs. 9% for a one standard deviation
increase in ORG).23 This is consistent with the hypothesis that decentralized firms receive greater
benefits from IT per unit of investment, rather than simply being larger IT users. Alternatively, the
observation that the output elasticity increases even more rapidly than the IT factor share for
decentralized firms may be evidence that these firms tend to have more unmeasured,
complementary investments associated with each dollar of measured IT capital. Under either
interpretation, the high measured marginal product of IT, particularly in high ORG firms, is not
necessarily inconsistent with equilibrium.
To help guard against the possibility that our basic results are an artifact of our functional form
assumptions, and to provide an alternative perspective of these results, we also examine the data in
a simpler, non-parametric way. Specifically, we divide the sample firms into four groups based on
computerization (high or low, relative to median firm) and decentralization (high or low, relative to
median firm). We then compare the number of firms and their average productivity in each
23 A straightforward calculation yields the marginal product of computer capital (MPc) based on the Cobb-Douglas production function specification used earlier:MP VA
CVAC
VAC
VACc c= = =∂
∂∂∂
αloglog
IT and Organizational Design Page 26
quadrant at the beginning and end of our time period (Tables 5a and 5b). 24 In 1987, the firms in the
high-high and low-low quadrants are both more productive than those in the off diagonals. By 1994,
the high-high firms are the only ones with disproportionately high productivity, while none of the
differences among the other quadrants are statistically significant. Similar results are found in 1994
when we restrict the sample to only those firms also present in 1987 (Table 5c).
In each of the years between 1987 and 1994, a disproportionate number of the more decentralized
firms also have high IT intensity, and vice-versa. Interestingly, in 1987, when the productivity
differences are most pronounced, we see only slight evidence that firms are disproportionately
locating on the diagonal, based on a Pearson chi-square test of association. However, by 1994,
firms are more clearly lining up on the diagonal, but the productivity differences are less substantial.
One interpretation of this shift is that between 1987 and 1994 many firms adjusted their IT levels to
better match organizational designs, thereby capturing additional productivity benefits.
4.2.2 Robustness of the Production Function Estimates
To test whether this positive interaction of ORG is unique to IT or is present for all input factors, the
model is reestimated, including interaction terms with ordinary capital and labor. Both of these
terms are insignificant and negative, while the IT interaction rises noticeably (Table 4a, column 4).
This supports the hypothesis that the effects of work systems are unique to the IT term. However,
because of multicollinearity between the interaction terms, the point estimates should be interpreted
with caution.
The fact that multiple waves of the survey were sent out and initially analyzed separately can
provide a second robustness check and help guard against data-snooping biases. Several seminar
presentations of the main results in this paper were given before the third wave of data was
received and reported similar reasoning and results.25 More formally, when additional terms are
Thus, marginal product is the ratio of the elasticity to the factor share.24 Productivity is computed as the average across the entire eight year sample, while number of firms iscomputed for the year in which the sample split is based.25 In late 1995 and early 1996, a presentation titled “IT and High Performance Work Practices: Are ThereComplementarities?” based on the first two waves of data was given at MIT, the National Bureau ofEconomic Research, the Wharton School, and Carnegie-Mellon University.
IT and Organizational Design Page 27
added to capture survey differences (ORG x Survey ID and IT x ORG x Survey ID) the two added
terms are not significant individually or jointly [F(2,2233)=1.22, p<.30]. This suggests that the results
are equally strong “out of sample” and that differences among the surveys have not influenced the
results.
As noted above, the team variable had the highest factor loading in the ORG construct. Thus, as a
third robustness check, we replaced the ORG variable in the production function by three dummy
variables representing no use of teams, slight to moderate team use, and heavy use of teams as a
proxy for decentralized work systems. In our sample, 39% report no use of teams, 50% report
slight to moderate use or teams, and 11% report heavy use of teams. Estimating the equation using
multiple dummy variables avoids the econometric assumptions involved in aggregating discrete
variables to form a scale, such as ORG, although at the cost of some loss in statistical power. The
results are broadly similar to those with the ORG variable, although it appears that teams by
themselves may have a negative impact on productivity before the interaction with IT is considered
(Table 4b). As with the ORG variable, the interaction between teams and IT is positive and
significant. The elasticity of IT increases monotonically with increased adoption of teams, with the
two ends of the scale being statistically different, t = 2.6).
As a fourth robustness check, we consider the possibility that different types of information
technology may have a disproportionate effect on output. As with our correlational and demand
analysis, we find that the type of IT investment considered (PCs versus mainframes) has no effect
on our results.
One difficulty of using the three input Cobb-Douglas production function is that the overall
explanatory power in the regression is dominated by the input terms, particularly labor. Furthermore,
it is quite possible that labor is at least partially endogenous in this regression since firms with
unexpectedly high or low demand may be able to adjust their labor input within a single year. This
would lead to a correlation between labor and the error term in the productivity regressions and
possible unknown biases in the other estimates. To correct for this possibility, we estimate a partial
IT and Organizational Design Page 28
productivity specification that fixes the elasticity of labor at its theoretical value26 as well as a "semi-
reduced form" regression where labor is dropped entirely (Griliches and Mairesse, 1984).27 The
results of this analysis are similar to those reported earlier although somewhat stronger in terms of
statistical significance.28
As a final robustness check, we examine the key assumption that a firm’s organizational
characteristics remain fixed over our sample period, or that at least any biases introduced by
changes in work systems over time are small. Approximately 29% of the sample reported that
some sort of internal restructuring occurred within our sample period. However, based on content
analysis of change descriptions, 8% (33 firms) reported a change toward team-based organization
and only one firm reported a move toward centralization. Most of the other changes were more
localized, such as changing an executive. This suggests that while restructuring was occurring
during our sample period, work system change is a gradual process.
To examine the effect of work system changes econometrically, we compare firms that report a
restructuring of any sort during our sample frame in three ways. First, the analysis is conducted
separately for firms that restructured and those that did not. Second, the two samples are pooled
and analyzed with separate coefficients on the IT-ORG interaction for the restructuring and non-
restructuring group. Finally, the panel structure of our data is used to refine the estimate by adding
two interaction terms, one that includes all the points post-restructuring (and zero for firms that did
not restructure or for points in restructuring firms before the event) and a second interaction that
includes all the pre-restructuring points (and zero following restructuring). Thus, the sample is split
into two parts, but the split point (in time) potentially occurs at a different point for each firm. In all
three analyses, the results are consistent. The magnitudes of the interaction terms do not differ
26 The theoretical value for the labor elasticity is its factor share, defined as average labor, divided byaverage output. To be conservative, we also allow for a 10% return to labor which places the elasticity at.61, where the actual factor share is .55. Regressions using a labor elasticity of .55 show a higher return tocapital and IT.27 The semi-reduced form regression treats both output and labor as endogenous, and computers andcapital as exogenous for each year. The specification is the same as the Cobb-Douglas production functionwithout labor included as a regressor except the coefficients on capital and computers now represent theratio of their elasticities to one minus the labor elasticity.
IT and Organizational Design Page 29
significantly from the earlier estimates in any analysis and are not significantly different from each
other. Again, this suggests that the results do not appear to be substantially biased by within-sample
changes.
4.2.3 Instrumental Variables
In order for the production function analyses to have any statistical power, it must be possible to
observe firms with different combinations of IT and work practices. There are two possible reasons
why we could expect to find different combinations in practice: some firms are not fully optimizing,
or firms face different conditions.
There is reason to believe both effects are present in practice. Case studies have shown that
neither practitioners nor researchers fully understand the links between IT and organization. This
can lead firms to be late adopters or make incorrect adoption choices. Many of the technologies
and applications are new and have complex organizational implications and so their effects are not
well understood. As one CEO succinctly stated, “The benefits of information technology occur in
many unforeseen directions.”29
Firms may also face very different costs of organizational change, so some adopt these changes
faster than others. As discussed above, firms that have highly skilled, educated, or white collar
work forces may be able to adapt better to organizational change (Bartel, Lichtenberg and Vaughan,
1989). From our earlier analysis, we found that existing levels of human capital are correlated with
IT use.30
Accordingly, we treat IT and ORG as endogenous and use skill levels, education, and work force
composition as instruments. In addition, time and industry are included as well as their interaction
28 A Hausman test indicates that both labor and capital are endogenous when using twice lagged capitaland labor as instruments. However, in terms of economic effect, the difference in the estimates is small, andlagged variables are not preferred instruments when there is serial correlation or fixed effects.29 As quoted in a presentation by Michael Addicut at the Stanford Graduate School of Business, October29, 1997.
IT and Organizational Design Page 30
with skills and education. Interestingly, the IV regressions (Table 4c), the coefficients on both IT
and its interaction with ORG rise substantially. This effect appears to be present whether or not
capital is assumed to be exogenous or endogenous and whether or not we use lagged input levels as
instruments.31 While it is still possible that these instruments are also correlated with unobserved
drivers of IT investment and possibly ORG, we have no evidence that these biases, if present, would
change the conclusions of our analyses.
5. Summary and Discussion
This paper argued that the diffusion of low-cost IT may be related to a substantial shift in the
economics of organizations toward greater use of teams and more decentralized decision-making.
Using data on organizational practices for approximately 380 large firms, we find two types of
support for this hypothesis: 1) firms that report the use of a decentralized work system have higher
demand for IT; and 2) firms that use decentralized work systems show greater output from their IT
investments. These findings are robust to alternative work system measures, IT measures, demand
specifications, and productivity specifications.
A parsimonious explanation of our results is that IT is most effective in decentralized work systems.
However, several alternative explanations are also possible. One possibility is that unobserved
factors, such as “management” or “business opportunities” are the true sources of the differences in
demand and output elasticity that we find. For instance, suppose that “good” managers are of two
types, those with a taste for both IT and decentralization and those with a taste for neither. If this
were the case, then it is possible that IT and ORG could covary in the data and also exhibit the
observed effect on output, but they would not necessarily be complements.
Another possibility is that the IT is most valuable in the presence of other unmeasured organizational
characteristics, such as information assets or worker expertise (Brynjolfsson and Yang, 1997). In
turn, these hidden organizational characteristics may be complementary to decentralized work
30 To the extent that labor markets are competitive we would expect that variations in human capital will bereflected in wages, and thus should not have a differential effect on productivity when labor costs areincluded as an input.
IT and Organizational Design Page 31
systems. In this case, it would be inappropriate to attribute all of the impact of such a system (IT,
decentralization, information assets) to the subset of components that are measured in this study.
However, the underlying argument and impacts are very similar: certain types of firms (e.g., those
rich in information assets) benefit disproportionately from the fall in IT price and these firms tend to
use decentralized work systems.
In summary, this study provides some of the first large-sample evidence of a broad relationship
between decentralized work systems and IT use. The empirical facts uncovered by this study are
exploratory rather than confirmatory. They can provide both guidance and constraints for theories
about the interaction of IT and organizational design, but do not offer definitive “tests.” For a
“general purpose technology,” such as IT, even more than for most other inputs to production, the
specific circumstances of implementation and the idiosyncrasies of particular firms may significantly
affect the way the IT is used and its effects on the organization of work. However, the data do
provide more support for those theories that predict that lower information processing and
communications costs will typically be especially beneficial for organizations that distribute decision-
making.
While our study focused on how organizational factors influence the adoption and productivity of IT,
our results also imply that organizational design can and should change to fit with the technology. In
particular, certain types of organizational structures were found to use IT more intensively than
others. Because the quality-adjusted price of IT is likely to decrease by an order of magnitude over
the next a decade, IT-intensive organizational forms can be expected to benefit disproportionately in
the future.
31 If capital is assumed to be quasi-fixed, as it is sometimes modeled, it can be used as an instrument for theother factors.
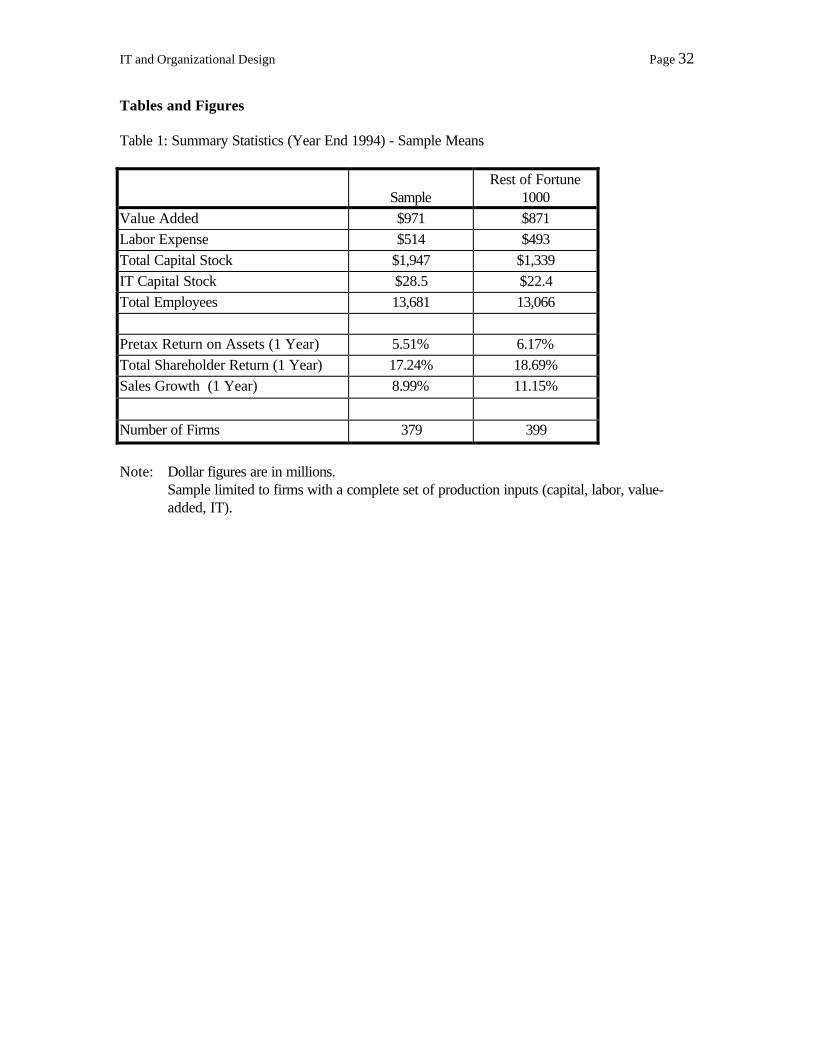
IT and Organizational Design Page 32
Tables and Figures
Table 1: Summary Statistics (Year End 1994) - Sample Means
SampleRest of Fortune
1000Value Added $971 $871Labor Expense $514 $493Total Capital Stock $1,947 $1,339IT Capital Stock $28.5 $22.4Total Employees 13,681 13,066
Pretax Return on Assets (1 Year) 5.51% 6.17%Total Shareholder Return (1 Year) 17.24% 18.69%Sales Growth (1 Year) 8.99% 11.15%
Number of Firms 379 399
Note: Dollar figures are in millions.Sample limited to firms with a complete set of production inputs (capital, labor, value-added, IT).
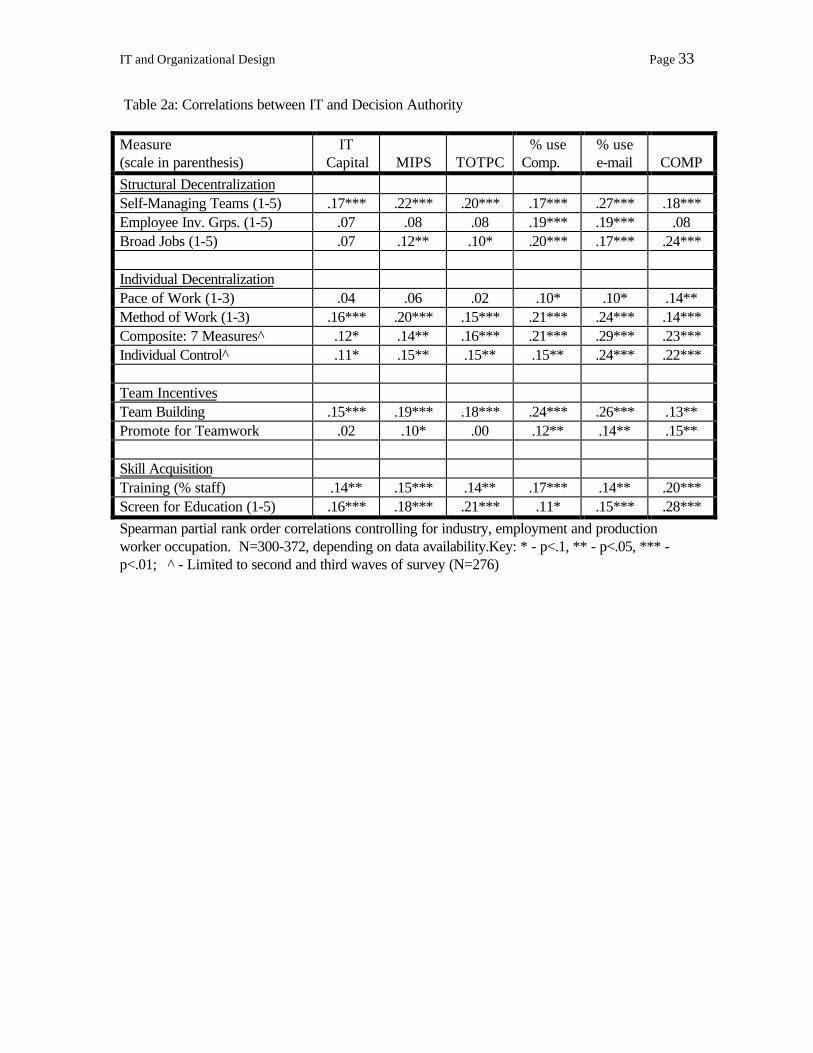
IT and Organizational Design Page 33
Table 2a: Correlations between IT and Decision Authority
Measure(scale in parenthesis)
ITCapital MIPS TOTPC
% useComp.
% usee-mail COMP
Structural DecentralizationSelf-Managing Teams (1-5) .17*** .22*** .20*** .17*** .27*** .18***Employee Inv. Grps. (1-5) .07 .08 .08 .19*** .19*** .08Broad Jobs (1-5) .07 .12** .10* .20*** .17*** .24***
Individual DecentralizationPace of Work (1-3) .04 .06 .02 .10* .10* .14**Method of Work (1-3) .16*** .20*** .15*** .21*** .24*** .14***Composite: 7 Measures^ .12* .14** .16*** .21*** .29*** .23***Individual Control^ .11* .15** .15** .15** .24*** .22***
Team IncentivesTeam Building .15*** .19*** .18*** .24*** .26*** .13**Promote for Teamwork .02 .10* .00 .12** .14** .15**
Skill AcquisitionTraining (% staff) .14** .15*** .14** .17*** .14** .20***Screen for Education (1-5) .16*** .18*** .21*** .11* .15*** .28***Spearman partial rank order correlations controlling for industry, employment and productionworker occupation. N=300-372, depending on data availability.Key: * - p<.1, ** - p<.05, *** -p<.01; ^ - Limited to second and third waves of survey (N=276)
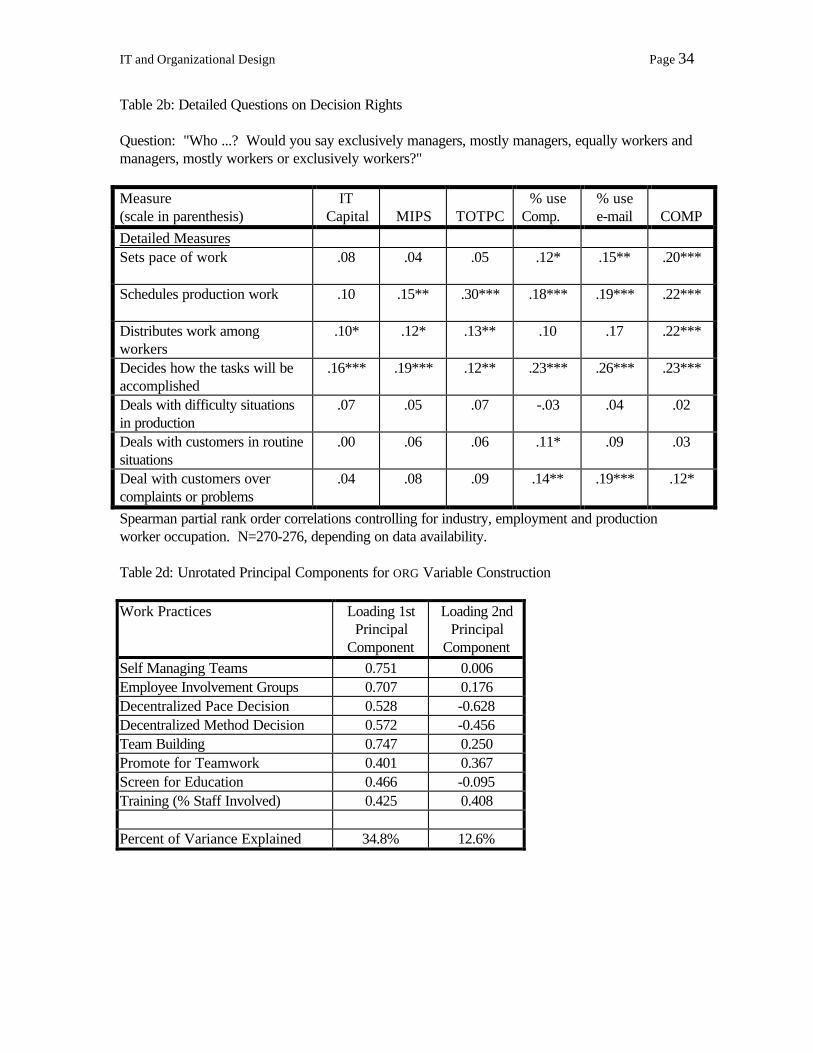
IT and Organizational Design Page 34
Table 2b: Detailed Questions on Decision Rights
Question: "Who ...? Would you say exclusively managers, mostly managers, equally workers andmanagers, mostly workers or exclusively workers?"
Measure(scale in parenthesis)
ITCapital MIPS TOTPC
% useComp.
% usee-mail COMP
Detailed MeasuresSets pace of work .08 .04 .05 .12* .15** .20***
Schedules production work .10 .15** .30*** .18*** .19*** .22***
Distributes work amongworkers
.10* .12* .13** .10 .17 .22***
Decides how the tasks will beaccomplished
.16*** .19*** .12** .23*** .26*** .23***
Deals with difficulty situationsin production
.07 .05 .07 -.03 .04 .02
Deals with customers in routinesituations
.00 .06 .06 .11* .09 .03
Deal with customers overcomplaints or problems
.04 .08 .09 .14** .19*** .12*
Spearman partial rank order correlations controlling for industry, employment and productionworker occupation. N=270-276, depending on data availability.
Table 2d: Unrotated Principal Components for ORG Variable Construction
Work Practices Loading 1stPrincipal
Component
Loading 2ndPrincipal
ComponentSelf Managing Teams 0.751 0.006Employee Involvement Groups 0.707 0.176Decentralized Pace Decision 0.528 -0.628Decentralized Method Decision 0.572 -0.456Team Building 0.747 0.250Promote for Teamwork 0.401 0.367Screen for Education 0.466 -0.095Training (% Staff Involved) 0.425 0.408
Percent of Variance Explained 34.8% 12.6%
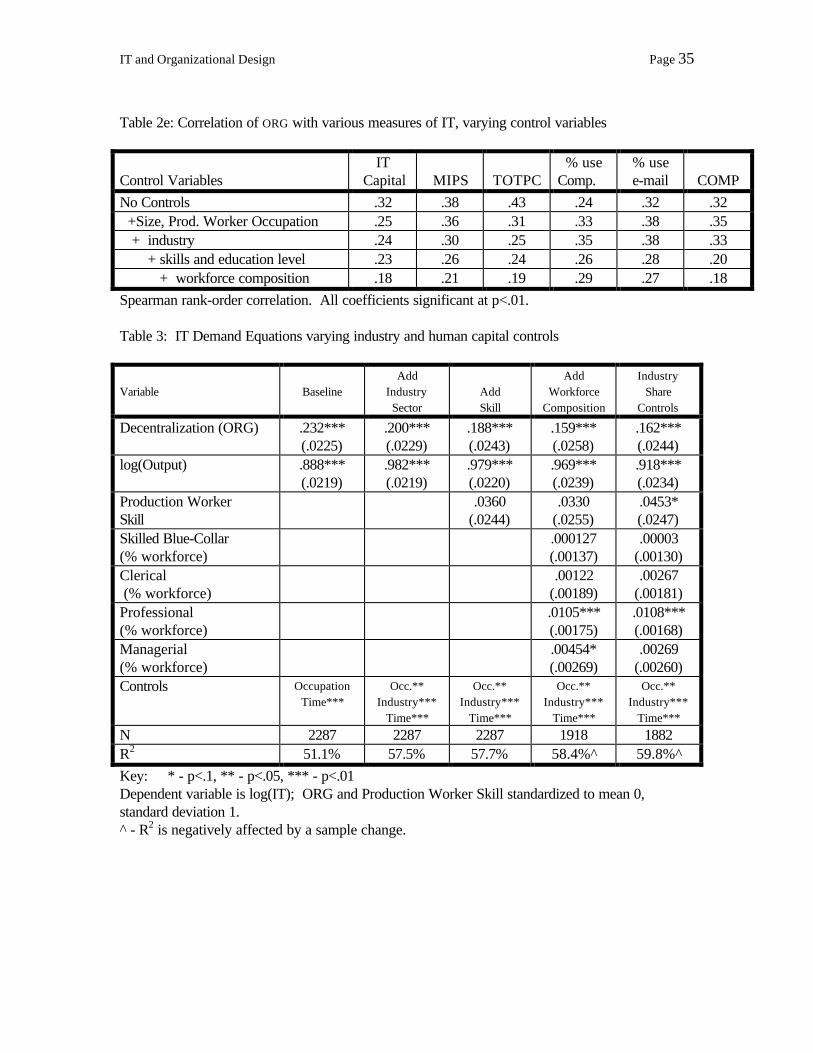
IT and Organizational Design Page 35
Table 2e: Correlation of ORG with various measures of IT, varying control variables
Control VariablesIT
Capital MIPS TOTPC% use
Comp.% usee-mail COMP
No Controls .32 .38 .43 .24 .32 .32 +Size, Prod. Worker Occupation .25 .36 .31 .33 .38 .35 + industry .24 .30 .25 .35 .38 .33 + skills and education level .23 .26 .24 .26 .28 .20 + workforce composition .18 .21 .19 .29 .27 .18Spearman rank-order correlation. All coefficients significant at p<.01.
Table 3: IT Demand Equations varying industry and human capital controls
Variable BaselineAdd
IndustrySector
AddSkill
AddWorkforce
Composition
IndustryShare
Controls
Decentralization (ORG) .232***(.0225)
.200***(.0229)
.188***(.0243)
.159***(.0258)
.162***(.0244)
log(Output) .888***(.0219)
.982***(.0219)
.979***(.0220)
.969***(.0239)
.918***(.0234)
Production WorkerSkill
.0360(.0244)
.0330(.0255)
.0453*(.0247)
Skilled Blue-Collar(% workforce)
.000127(.00137)
.00003(.00130)
Clerical (% workforce)
.00122(.00189)
.00267(.00181)
Professional(% workforce)
.0105***(.00175)
.0108***(.00168)
Managerial(% workforce)
.00454*(.00269)
.00269(.00260)
Controls OccupationTime***
Occ.**Industry***
Time***
Occ.**Industry***
Time***
Occ.**Industry***
Time***
Occ.**Industry***
Time***N 2287 2287 2287 1918 1882R2 51.1% 57.5% 57.7% 58.4%^ 59.8%^Key: * - p<.1, ** - p<.05, *** - p<.01Dependent variable is log(IT); ORG and Production Worker Skill standardized to mean 0,standard deviation 1.^ - R2 is negatively affected by a sample change.
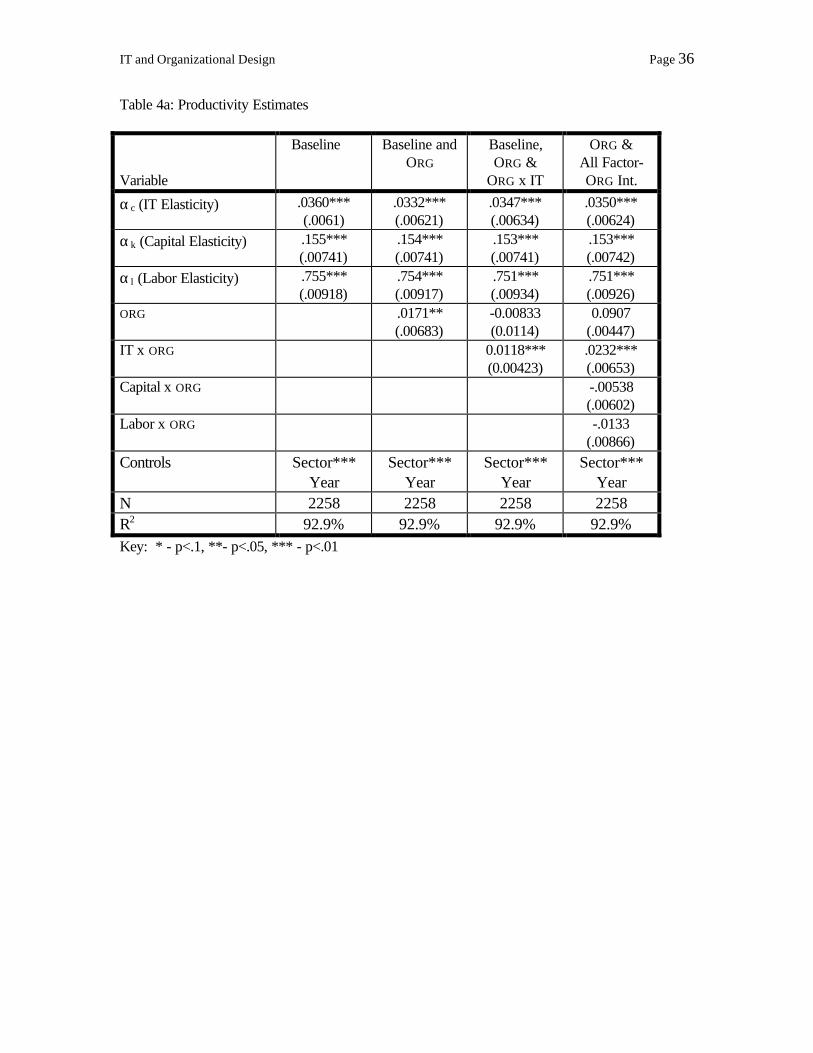
IT and Organizational Design Page 36
Table 4a: Productivity Estimates
Variable
Baseline Baseline andORG
Baseline,ORG &
ORG x IT
ORG &All Factor-ORG Int.
αc (IT Elasticity) .0360***(.0061)
.0332***(.00621)
.0347***(.00634)
.0350***(.00624)
αk (Capital Elasticity) .155***(.00741)
.154***(.00741)
.153***(.00741)
.153***(.00742)
α l (Labor Elasticity) .755***(.00918)
.754***(.00917)
.751***(.00934)
.751***(.00926)
ORG .0171**(.00683)
-0.00833(0.0114)
0.0907(.00447)
IT x ORG 0.0118***(0.00423)
.0232***(.00653)
Capital x ORG -.00538(.00602)
Labor x ORG -.0133(.00866)
Controls Sector***Year
Sector***Year
Sector***Year
Sector***Year
N 2258 2258 2258 2258R2 92.9% 92.9% 92.9% 92.9%Key: * - p<.1, **- p<.05, *** - p<.01
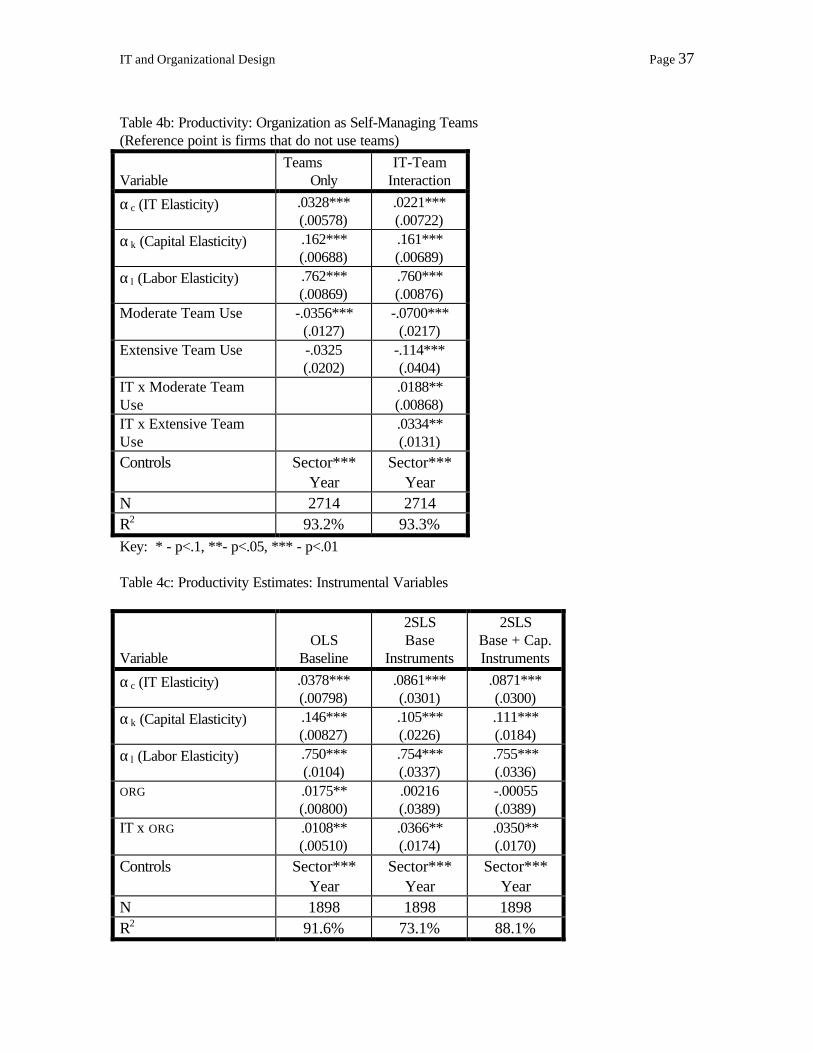
IT and Organizational Design Page 37
Table 4b: Productivity: Organization as Self-Managing Teams(Reference point is firms that do not use teams)
VariableTeams
OnlyIT-Team
Interaction
αc (IT Elasticity) .0328***(.00578)
.0221***(.00722)
αk (Capital Elasticity) .162***(.00688)
.161***(.00689)
α l (Labor Elasticity) .762***(.00869)
.760***(.00876)
Moderate Team Use -.0356***(.0127)
-.0700***(.0217)
Extensive Team Use -.0325(.0202)
-.114***(.0404)
IT x Moderate TeamUse
.0188**(.00868)
IT x Extensive TeamUse
.0334**(.0131)
Controls Sector***Year
Sector***Year
N 2714 2714R2 93.2% 93.3%Key: * - p<.1, **- p<.05, *** - p<.01
Table 4c: Productivity Estimates: Instrumental Variables
VariableOLS
Baseline
2SLSBase
Instruments
2SLSBase + Cap.Instruments
αc (IT Elasticity) .0378***(.00798)
.0861***(.0301)
.0871***(.0300)
αk (Capital Elasticity) .146***(.00827)
.105***(.0226)
.111***(.0184)
α l (Labor Elasticity) .750***(.0104)
.754***(.0337)
.755***(.0336)
ORG .0175**(.00800)
.00216(.0389)
-.00055(.0389)
IT x ORG .0108**(.00510)
.0366**(.0174)
.0350**(.0170)
Controls Sector***Year
Sector***Year
Sector***Year
N 1898 1898 1898R2 91.6% 73.1% 88.1%

IT and Organizational Design Page 38
Key: * - p<.1, **- p<.05, *** - p<.01
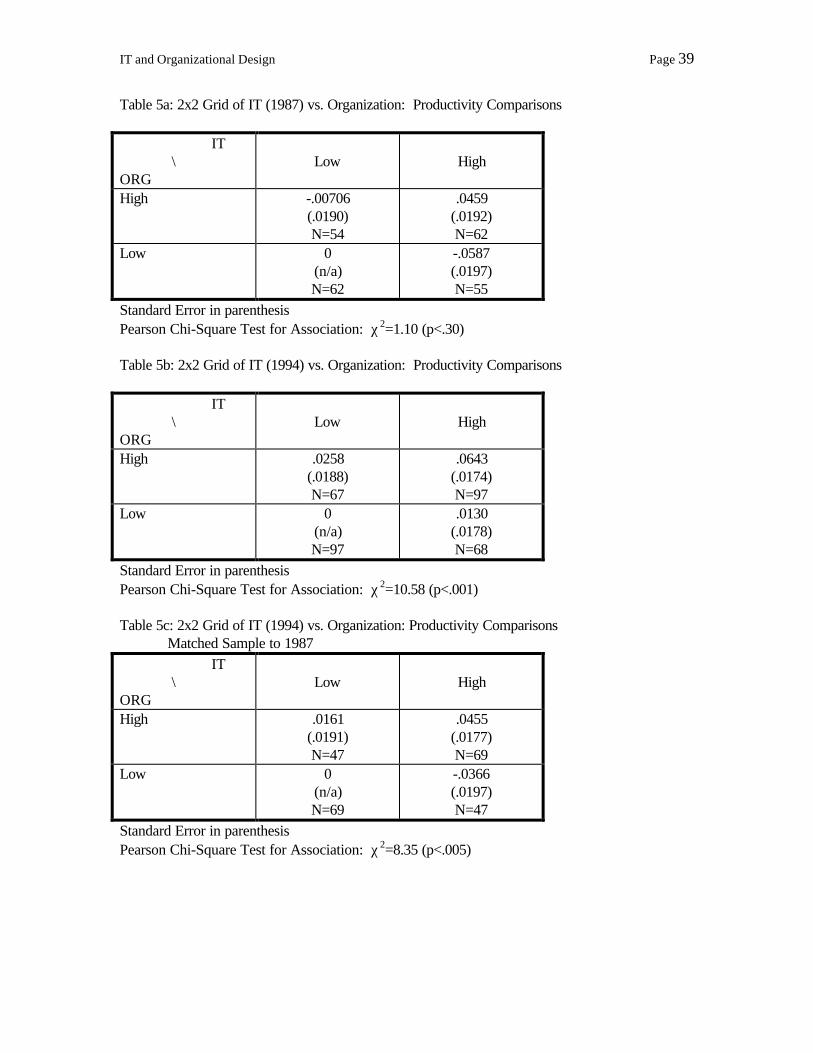
IT and Organizational Design Page 39
Table 5a: 2x2 Grid of IT (1987) vs. Organization: Productivity Comparisons
IT \ORG
Low High
High -.00706(.0190)N=54
.0459(.0192)N=62
Low 0(n/a)N=62
-.0587(.0197)N=55
Standard Error in parenthesisPearson Chi-Square Test for Association: χ2=1.10 (p<.30)
Table 5b: 2x2 Grid of IT (1994) vs. Organization: Productivity Comparisons
IT \ORG
Low High
High .0258(.0188)N=67
.0643(.0174)N=97
Low 0(n/a)N=97
.0130(.0178)N=68
Standard Error in parenthesisPearson Chi-Square Test for Association: χ2=10.58 (p<.001)
Table 5c: 2x2 Grid of IT (1994) vs. Organization: Productivity ComparisonsMatched Sample to 1987
IT \ORG
Low High
High .0161(.0191)N=47
.0455(.0177)N=69
Low 0(n/a)N=69
-.0366(.0197)N=47
Standard Error in parenthesisPearson Chi-Square Test for Association: χ2=8.35 (p<.005)
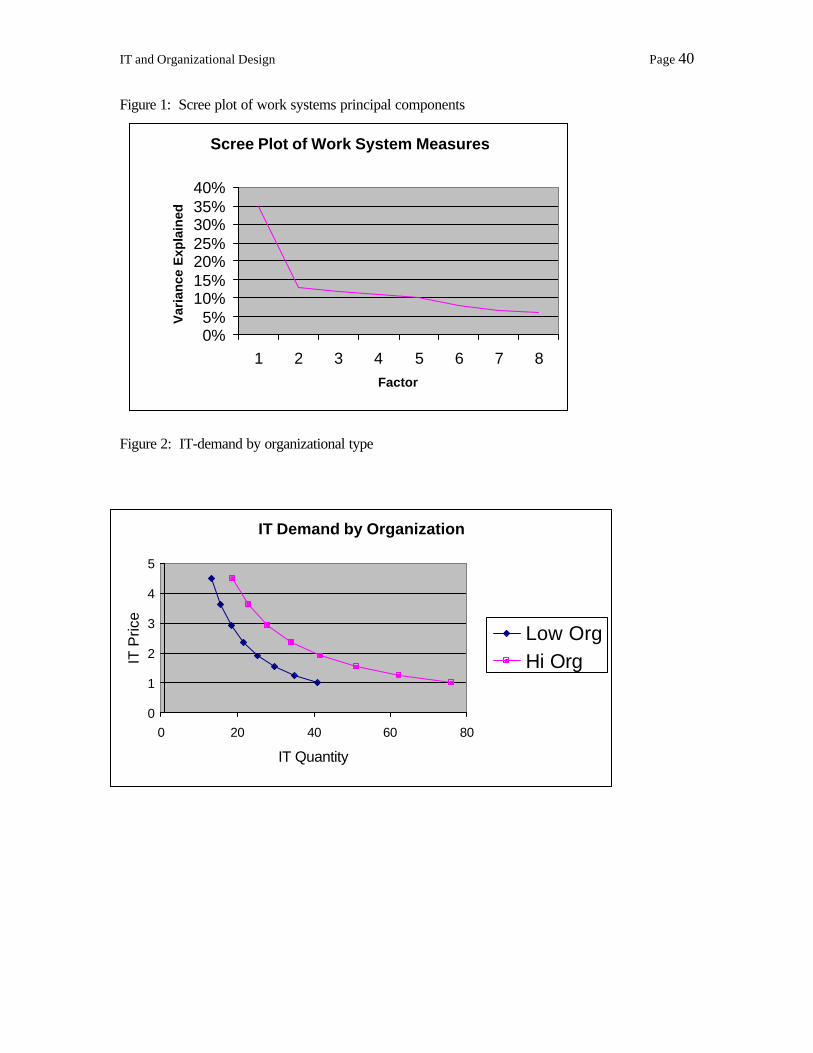
IT and Organizational Design Page 40
Figure 1: Scree plot of work systems principal components
Figure 2: IT-demand by organizational type
IT Demand by Organization
0
1
2
3
4
5
0 20 40 60 80
IT Quantity
IT P
rice
Low OrgHi Org
Scree Plot of Work System Measures
0%5%
10%15%20%25%30%35%40%
1 2 3 4 5 6 7 8Factor
Var
ian
ce E
xpla
ined
IT and Organizational Design Page 41
Bibliography
Anand, K. and H. Mendelson (1995). Information and Organization for HorizontalMultimarket Coordination. Management Science, December, 1997.
Aoki, M. (1986) Horizontal vs. vertical information structure of the firm. AmericanEconomic Review, 76, 971-983.
Aoki, M., (1990) "The Participatory Generation of Information Rents and the Theory ofthe Firm", pp. 26-52 in The Firm as a Nexus of Treaties, Aoki, M., B. Gustafssonand O. Williamson (ed.), Sage Publications, London.
Applegate, L., J. Cash and D. Q. Mills (1988). “Information Technology and Tomorrow'sManager.” Harvard Business Review (November-December): 128-136.
Athey, S. and S. Stern, (1997) "An Empirical Framework for Testing Theories aboutComplementarities in Organizational Design.” Mimeo. MIT.
Attewell, P. and J. Rule (1984). “Computing and Organizations: What We Know andWhat We Don't Know.” Communications of the ACM 27(December): 1184-1192.
Autor, D. L. Katz, and A. Kreuger (1997) “Computing Inequality: Have ComputersChanged the Labor Market?”, Mimeo, Harvard.
Bartel, A. and Lichtenberg, (1987) “The Comparative Advantage of Educated Workers inImplementing New Technology”, Review of Economics and Statistics, 64 1-11.
Bartel, A. P., F. R. Lichtenberg and R. J. Vaughan (1989). Technological Change, Trade,and the Need for Educated Employees: Implications for Economic Policy.Washington, D.C., U.S. Department of Education.
Berman, E. J. Bound and Z. Griliches (1994) “Changes in the Demand for Skilled Laborwithin U.S. Manufacturing Industries,”, Quarterly Journal of Economics, May, 109,367-98.
Berndt, E. and Z. Griliches (1990). Price Indexes for Microcomputers: An ExploratoryStudy. NBER Working Paper 3378.
Black, S.E. and Lynch, L.M., "How to Compete: The Impact of Workplace Practicesand Information Technology on Productivity", Harvard University, Cambridge, MAand US Department of Labor, Washington, D.C. September, (1996)
Bolton, P. and Dewatripont, M. (1994). The firm as a communication network. QuarterlyJournal of Economics, 109, 809-839.
Bresnahan, T. (1997) “Computerization and Wage Dispersion: An AnalyticReinterpretation.” Mimeo. Stanford University.
Bresnahan, T. and S. Greenstein. (1997) “Technical Progress in Computers and in theUses of Computers,” Brookings Papers on Economic Activity, Micro. In press.
Brynjolfsson, E. (1996) “The Contribution of Information Technology to ConsumerWelfare,” Information Systems Research, September.
IT and Organizational Design Page 42
Brynjolfsson, E. (1994). Information Technology and the 'New Managerial Work'. inOrganizational Learning and Experience Transfer. J. Moe. ed., Trondheim, Norway,Norwegian Academy of Technological Sciences: 27-101.
Brynjolfsson, E. and L. Hitt (1995). “Information Technology as a Factor of Production:The Role of Differences Among Firms.” Economics of Innovation and NewTechnology 3(4) - Special Issue on Information Technology and ProductivityParadox): 183-200.
Brynjolfsson, E. and L. Hitt (1996). “Paradox Lost? Firm-level Evidence on the Returnsto Information Systems Spending.” Management Science (April).
Brynjolfsson, E. and L. Hitt (1997). “Computing Productivity: Are Computer Pulling TheirWeight?.” Mimeo, MIT.
Brynjolfsson, E. and Mendelson, H.. (1993) “Information Systems and the Organization ofModern Enterprise.” Journal of Organizational Computing. December.
Brynjolfsson, E., A. Renshaw and M. V. Alstyne. (1997) “The Matrix of Change,” SloanManagement Review, Winter.
Brynjolfsson, E. and S. Yang (1997) “The Intangible Costs and Benefits of ComputerInvestments: Evidence from Financial Markets”, Proceedings of the InternationalConference on Information Systems, December.
Crowston, K. and T. Malone. (1988) "Information Technology and Work Organization"Handbook of Human-Computer Interaction, M. Helander, ed., New York: ElsevierScience Publishers,.
Davenport, Thomas H., and James E. Short. (1990) “The New Industrial Engineering:Information Technology and Business Process Redesign.” Sloan ManagementReview 31.4: 11-27.
David, P. A. (1990). “The Dynamo and the Computer and Dynamo: A HistoricalPerspective on the Modern Productivity Paradox.” American Economic ReviewPapers and Proceedings 80(2 (May)): 355-361.
Drucker, P. F. (1988). “The Coming of the New Organization.” Harvard BusinessReview(January-February): 45-53.
Dunlop, J. T. and D. Weil (1993). The Diffusion of Human Resource Innovations:Lessons from the Apparel Industry. Harvard University Working Paper.
Galbraith, J. (1977) Organizational Design, Reading, MA: Addison-Wesley,.
Gallivan, M., C. H. Goh, L. M. Hitt and G. Wyner (1993). Incident Tracking at Infocorp:Case Study of a Pilot Notes Implementation. MIT Center for Coordination ScienceWorking Paper 149.
George, J. F. and J. L. King (1991). “Examining the Computing and CentralizationDebate.” Communications of the ACM 34(7): 63-72.
Gordon, R. J. (1990). The Measurement of Durable Goods Prices. Chicago, University ofChicago Press (for NBER).
IT and Organizational Design Page 43
Gordon, R. J. (1994), Comment on Oliner, S, D. and Sichel, D.E. “Computers and OutputGrowth Revisited: How Big is the Puzzle?” Brookings Papers on Economic Activity,1994(2): 273-334.
Greenstein, S. (1996) “From Super-minis to Super-computers: Estimating Surplus in theComputing Market” The Economics of New Goods, T. Bresnahan and R. GordonEditors, NBER Studies in Income and Wealth, Vol. 58. University of Chicago Press.
Griliches, Zvi (1957 ) “Hybrid Corn: An Exploration in the Economics of TechnologicalChange Econometrica, Vol. 25, No. 4. (Oct.):. 501-522.
Griliches, Z. (1986). “Productivity, R&D, and Basic Research at the Firm Level in the1970's.” American Economic Review 76(1 (March)): 141-155.
Griliches, Z. and J. Mairesse (1984). Productivity and R&D at the Firm Level. in R&D,Patents and Productivity. Z. Griliches. Chicago, University of Chicago Press: 339-374.
Grossman, S. and O. Hart (1986). “The Costs and Benefits of Ownership: A Theory ofVertical and Lateral Integration.” Journal of Political Economy 24(4): 691-717.
Gurbaxani, V., (1992) “The Demand for Information Technology Capital: An EmpiricalAnalysis”, Decision Support Systems, 8 (September): 387-403.
Gurbaxani, V. and H. Mendelson, (1990) “An Integrative Model of Information SystemsSpending Growth”, Information Systems Research, 1 (1): 23-46.
Gurbaxani, V. and S. Whang (1991). “The Impact of Information Systems onOrganizations and Markets.” Communications of the ACM 34(1): 59-73.
Hall, B. H. (1990). The Manufacturing Sector Master File: 1959-1987, Documentation.NBER Working Paper 3366.
Hammer, M. (1990). “Reengineering Work: Don't Automate, Obliterate.” HarvardBusiness Review (July-August): 104-112.
Hart, O. D. (1988). “Incomplete Contracts and the Theory of the Firm.” Journal of Law,Economics and Organization (Spring): 119-139.
Harvard Business School (1984). The Expense Tracking System at Tiger Creek. HBSCase 9-485-057.
Harvard Business School (1988). Phillips 66: Controlling a Company Through Crisis.HBS Case 9-189-006.
Hayashi, F. (1982). “Tobin's Marginal q and Average q: Neoclassical Interpretation.”Econometrica 50(January): 213-224.
Hitt, L. and E. Brynjolfsson (1997) "Information Technology and Internal FirmOrganization: An Exploratory Analysis," Journal of Management InformationSystems, Fall.
Holmstrom, B. and P. Milgrom (1994). “The Firm as an Incentive System.” AmericanEconomic Review 84(4, September): 972-991.
IT and Organizational Design Page 44
Hubbard, T. (1997) “Why Are Process Monitoring Technologies Valuable? The Use ofTrip Recorders and Electronic Vehicle Management Systems in the TruckingIndustry.” Paper presented at NBER IO summer workshop, August.
Huselid, M. (1994). “The Impact of Human Resource Management Practices onTurnover, Productivity, and Corporate Financial Performance.” Academy ofManagement Journal.
Ichniowski, C.. T.A. Kochan, D. Levine, C.Olson, and G.Strauss (1996). “WhatWorks at Work: Overview and Assessment.” Industrial Relations. 35(3): 299-333.
Ichniowski, C., K. Shaw and G. Prennushi, "The Effects of Human ResourceManagement Practices on Productivity." American Economic Review, June, 1997.
Kandel, E. and E. P. Lazear (1992). “Peer Pressure and Partnership.” Journal of PoliticalEconomy 100: 801-817.
Kaplan, R. (1989). “Management Accounting for Advanced TechnologicalEnvironments.” Science 245(September): 819-823.
Kreuger, A. (1993) “How Computers Have Changed the Wage Structure: Evidence fromMicrodata, 1984-89” Quarterly Journal of Economics, February, 108, 33-60.
Lawler, E. E., S. A. Mohrman and G. E. Ledford (1995). Creating High PerformanceOrganizations. San Francisco, Jossey-Bass.
Leavitt, H. J. and T. L. Whisler (1958). “Management in the 1980s.” Harvard BusinessReview (November-December).
Lichtenberg, F. R. (1995). “The Output Contributions of Computer Equipment andPersonal: A Firm-Level Analysis.” Journal of Economics of Innovation and NewTechnology 3: 201-217.
Lucas, H. C. (1995) The T-Form Organization, Jossey Bass Publishers, San Francisco.
MacDuffie, J. P. (1995). “Human Resource Bundles and Manufacturing Performance:Organizational Logic and Flexible Production Systems in the World Auto Industry.”Industrial and Labor Relations Review(January).
Malone, Thomas W. (1987) "Modelling Coordination in Organizations and Markets,"Management Science, 33, 1317-1332,.
Malone, T. W., J. Yates and R. I. Benjamin (1987). “Electronic Markets and ElectronicHierarchies.” Communications of the ACM 30(6): 484-497.
Malone, T. W. “ Is ‘Empowerment’ just a Fad? Control, Decision-making, andInformation Technology.” Sloan Management Review, 1997, 38 (2), 23-35.
McConnel, S. (1996). “The Role of Computers in Reshaping the Work Force,” MonthlyLabor Review. (August) p. 3-5.
Mendelson, H. and Pillai, R. (forthcoming). “Clockspeed and Informational Response:Evidence from the Information Technology Industry,” Information SystemsResearch.
Meyers, G.J., "The Science of Management", in Clarence Bertrand Thompson, ed.,Scientific Management. Cambridge: Harvard University Press, 134, 1914.
IT and Organizational Design Page 45
Milgrom, P. and J. Roberts (1990). “The Economics of Modern Manufacturing:Technology, Strategy, and Organization.” American Economic Review 80(3): 511-528.
Milgrom, P. and J. Roberts (1992). Economics, Organization and Management, Prentice-Hall.
Nault, B.R., (1997) "Information Technology and Organizational Design: LocatingDecisions and Information," Management Science. (in press)
Orlikowski, W. J. (1992). Learning from Notes: Organizational Issues in GroupwareImplementation. in Conference on Computer Supported Cooperative Work. J. Turnerand R. Kraut. Toronto, Association for Computing Machinery: 362-369.
Osterman, P. (1994). “How Common is Workplace Transformation and Who Adopts It?”Industrial and Labor Relations Review 47(2): 173-188.
Pinsonneault, A. and K. Kraemer (1997) “Middle Management Downsizing: An EmpiricalInvestigation of the Impact of Information Technology” Management Science. Vol.43. No. 5. (May): 659-679.
Piore, M. and C. Sabel, The Second Industrial Divide, Basic Books, New York, (1984).
Radner, R. (1993) “The Organization of Decentralized Information Processing”Econometrica, 62, 1109-1146.
Radner, R. and T. Van Zandt (1992) “Informaton Processing in Firms and Returns toScale.” Annales d’Economie et de Statistique, 25/26, 265-298.
"Roger Smith Reflects," Wall Street Journal, p. 51, July 31, 1990.
Sabel, Charles F., Horst Kern and Gary Herrigel. (1989) "Collaborative Manufacturing:New Supplier Relations in the Automobile Industry and the Redefinition of theIndustrial Corporation," Mimeo, MIT, March.
Simon, Herbert A. (1976) Administrative Behavior, New York: The Free Press, 3rd
Edition.
Van Alstyne, M. (1997 ) “The State of Network Organization: A Survey in ThreeFrameworks,” Journal of Organizational Computing, (forthcoming)
Van Zandt, T. (1997a) “Real Time Hierarchical Resource Allocation with QuadraticCosts,” Mimeo, Princeton, July.
Van Zandt, T. (1997b) “Decentralized Information Processing in the Theory ofOrganizations” Contemporary Economic Development Reviewed, Volume 4: TheEnterprise and its Environment, edited by Murat Sertel. London: MacMillan PressLtd.
Wolff, E. (1996) “The growth of information workers in the U.S. economy, 1950-1990:The role of technological change, computerization, and structural change.” Technicalreport, RR 96-41, Department of Economics, NYU.

IT and Organizational Design Page 46
Wyner, G. M., & Malone, T. W. “Cowboys or Commanders: Does InformationTechnology Lead to Decentralization?” Proceedings of the International Conferenceon Information Systems, Columbus, OH, December 15-18, 1996.
Zuboff, S. (1988). In the Age of the Smart Machine: The Future of Work and Power.New York, Basic Books, Inc.
IT and Organizational Design Page 47
Appendix A: Data and Variable Construction
This appendix is divided into three sections. Section I contains the survey questions andvariable definitions for items obtained from the human resource practices survey. Section IIcontains the data construction procedures for variables obtained from Computer IntelligenceInfocorp (CI). Section III contains the data construction procedures for variables derived fromCompustat. Section IV contains a table of formulas for composite variables.
I. Organizational Practices Survey
The organizational practices survey was designed to be administered over the phone and took,on average, 30 minutes for the respondent to complete. The questions relevant to this analysisare shown below.
I.A. Data Validation Questions
PWPCT. To the nearest 10%, what percentage of your firm’s employees are productionworkers?
_____%
PWSAME. In terms of the whole firm, please estimate to the nearest 20% the percentage of allproduction employees covered by the same human resource practices as those at your mosttypical establishment? Would you say 20%, 40%, 60%, 80% of 100%?
______%
I.B. Survey: Production Worker Practices/Characteristics
PRBL, PRCL, PRPF. Can you name three titles of employees you consider to be productionworkers at that establishment:_____________________________________________________________________
Variables are coded by determining the fraction (out of 3) of jobs listed that are blue collarclerical or professional.
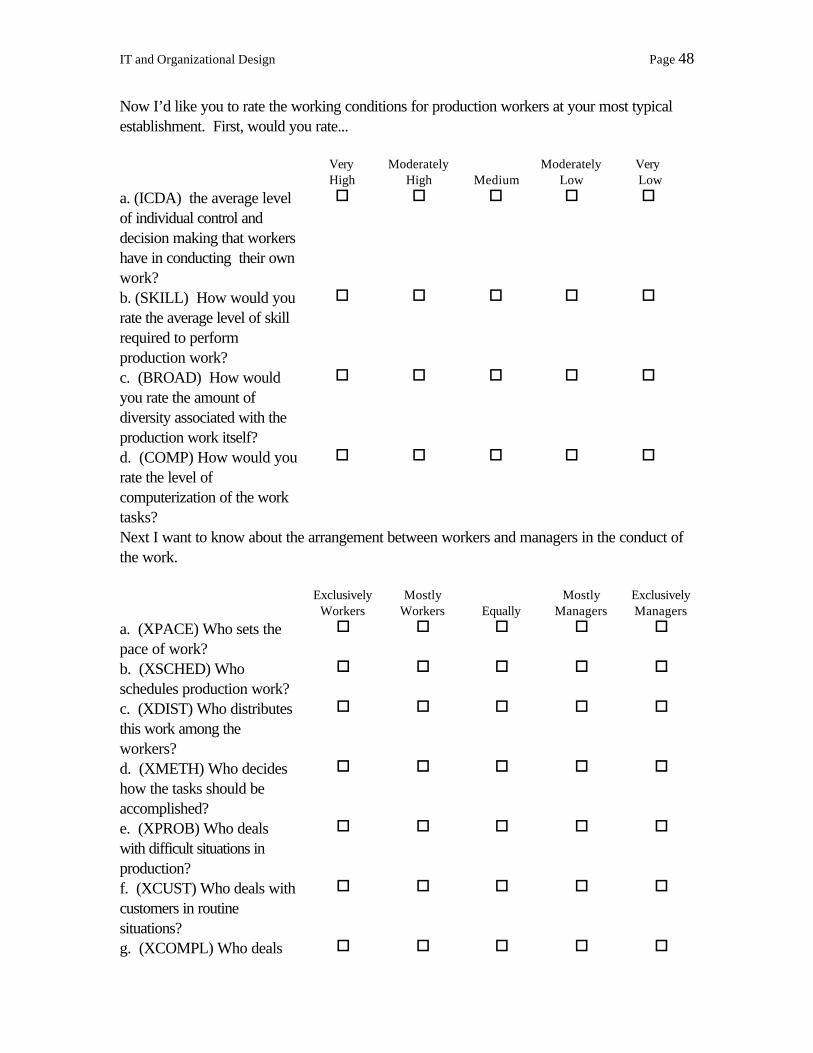
IT and Organizational Design Page 48
Now I’d like you to rate the working conditions for production workers at your most typicalestablishment. First, would you rate...
VeryHigh
ModeratelyHigh Medium
ModeratelyLow
Very Low
a. (ICDA) the average levelof individual control anddecision making that workershave in conducting their ownwork?
o o o o o
b. (SKILL) How would yourate the average level of skillrequired to performproduction work?
o o o o o
c. (BROAD) How wouldyou rate the amount ofdiversity associated with theproduction work itself?
o o o o o
d. (COMP) How would yourate the level ofcomputerization of the worktasks?
o o o o o
Next I want to know about the arrangement between workers and managers in the conduct ofthe work.
ExclusivelyWorkers
MostlyWorkers Equally
MostlyManagers
ExclusivelyManagers
a. (XPACE) Who sets thepace of work?
o o o o o
b. (XSCHED) Whoschedules production work?
o o o o o
c. (XDIST) Who distributesthis work among theworkers?
o o o o o
d. (XMETH) Who decideshow the tasks should beaccomplished?
o o o o o
e. (XPROB) Who dealswith difficult situations inproduction?
o o o o o
f. (XCUST) Who deals withcustomers in routinesituations?
o o o o o
g. (XCOMPL) Who deals o o o o o
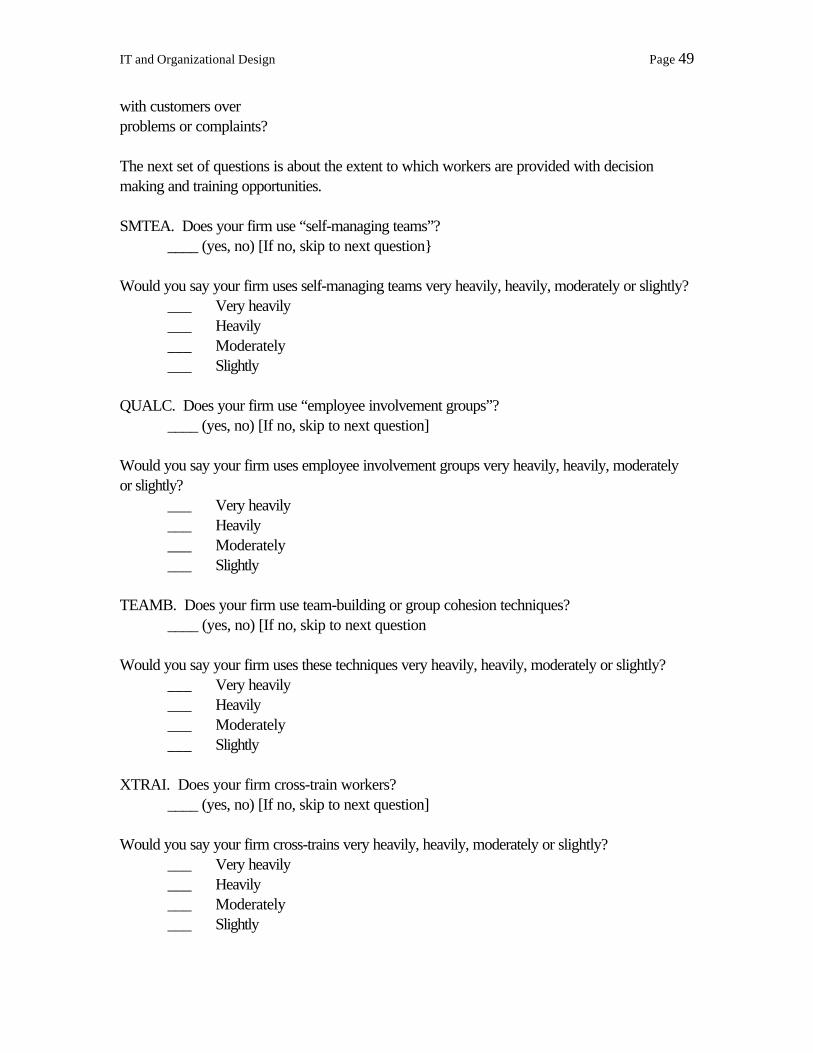
IT and Organizational Design Page 49
with customers overproblems or complaints?
The next set of questions is about the extent to which workers are provided with decisionmaking and training opportunities.
SMTEA. Does your firm use “self-managing teams”?____ (yes, no) [If no, skip to next question}
Would you say your firm uses self-managing teams very heavily, heavily, moderately or slightly?___ Very heavily___ Heavily___ Moderately___ Slightly
QUALC. Does your firm use “employee involvement groups”?____ (yes, no) [If no, skip to next question]
Would you say your firm uses employee involvement groups very heavily, heavily, moderatelyor slightly?
___ Very heavily___ Heavily___ Moderately___ Slightly
TEAMB. Does your firm use team-building or group cohesion techniques?____ (yes, no) [If no, skip to next question
Would you say your firm uses these techniques very heavily, heavily, moderately or slightly?___ Very heavily___ Heavily___ Moderately___ Slightly
XTRAI. Does your firm cross-train workers?____ (yes, no) [If no, skip to next question]
Would you say your firm cross-trains very heavily, heavily, moderately or slightly?___ Very heavily___ Heavily___ Moderately___ Slightly
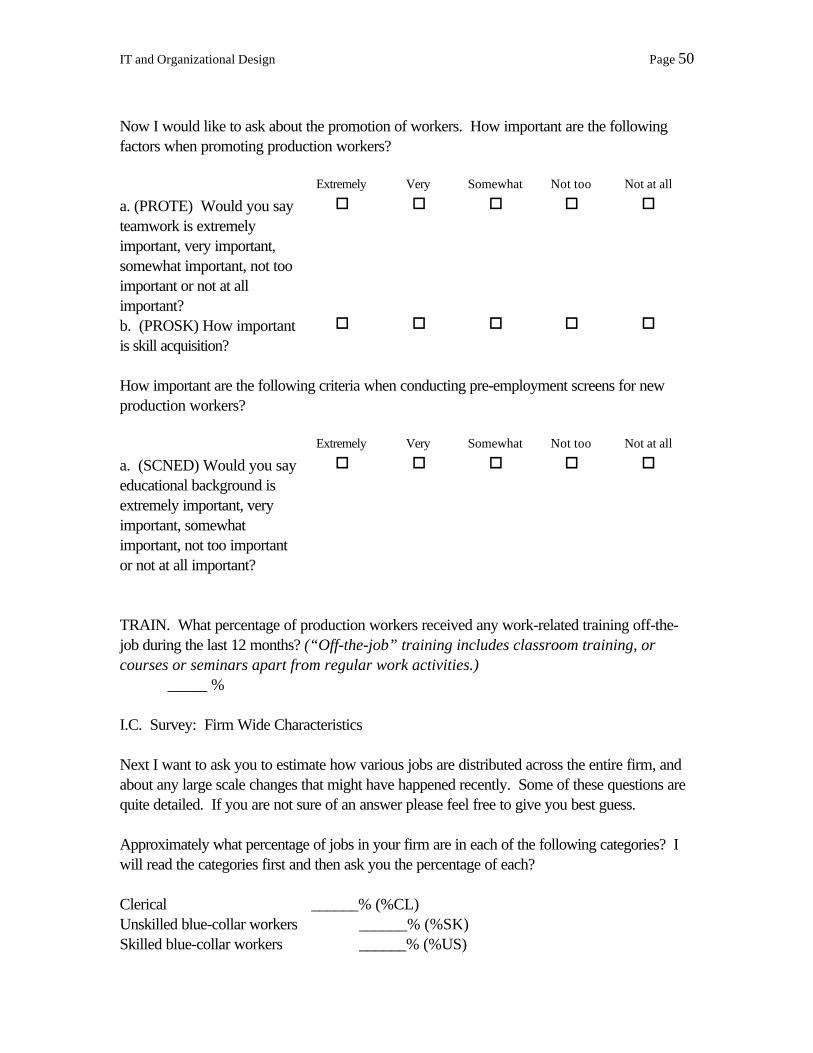
IT and Organizational Design Page 50
Now I would like to ask about the promotion of workers. How important are the followingfactors when promoting production workers?
Extremely Very Somewhat Not too Not at all
a. (PROTE) Would you sayteamwork is extremelyimportant, very important,somewhat important, not tooimportant or not at allimportant?
o o o o o
b. (PROSK) How importantis skill acquisition?
o o o o o
How important are the following criteria when conducting pre-employment screens for newproduction workers?
Extremely Very Somewhat Not too Not at all
a. (SCNED) Would you sayeducational background isextremely important, veryimportant, somewhatimportant, not too importantor not at all important?
o o o o o
TRAIN. What percentage of production workers received any work-related training off-the-job during the last 12 months? (“Off-the-job” training includes classroom training, orcourses or seminars apart from regular work activities.)
_____ %
I.C. Survey: Firm Wide Characteristics
Next I want to ask you to estimate how various jobs are distributed across the entire firm, andabout any large scale changes that might have happened recently. Some of these questions arequite detailed. If you are not sure of an answer please feel free to give you best guess.
Approximately what percentage of jobs in your firm are in each of the following categories? Iwill read the categories first and then ask you the percentage of each?
Clerical ______% (%CL)Unskilled blue-collar workers ______% (%SK)Skilled blue-collar workers ______% (%US)
IT and Organizational Design Page 51
Managers and supervisors ______% (%MG)Non-managerial professionals ______% (%PF)Total 100%
(CHG) Have there been any major organizational changes in the last five years___ Yes ___ No
(CHGDT) If, yes, when did the change occur: ______Month/Year. Please describe thechange.
(%GP). What fraction of your employees use a general purpose computer in the course oftheir regular work?
_____%
(%EMAIL). What fraction of your employees use electronic mail (e-mail) in the course of theirregular work?
_____%
II. Computer Intelligence Variables
IT Capital (LITCAP). We take total purchase value of computer equipment as reported byComputer Intelligence Corp. (CI) and deflate it using an extrapolation of Gordon’s (1990)deflator for computers (price change -19.3% per year). The total purchase value representsthe current market value of mainframes, minicomputers and peripherals as well as personalcomputers during the 1991-1994 portion of our sample period. Prior to 1991, the purchasevalue only represented the value of mainframes, minicomputers and peripherals, but excludedpersonal computers.
Central Processing Power (MIPS). This variable is taken straight from the CI database andrepresents the total processing power of central processors, measured in millions of instructionsper second (PCs are not included in this calculation).
Personal Computers (TOTPC). This is also taken straight from the CI database andrepresents the total number of personal computers in use at the firm.
III. Compustat-based Variables
Output (OUTPUT). Total Sales as reported on Compustat [Item #12, Sales (Net)] deflated by2-digit industry level deflators from Gross Output and Related Series by Industry from the BEAfor 1988-1992, and estimated for 1993-1994 using five-year average inflation rate by industry.
IT and Organizational Design Page 52
When an industry deflator is not available, the sector level producer price index for intermediatematerials, supplies and components is used (Council of Economic Advisors, 1995).
Ordinary Capital (NITCAP). This figure was computed from total book value of capital(equipment, structures and all other capital) following the method in (Hall, 1990). Gross bookvalue of capital stock [Compustat Item #7 - Property, Plant and Equipment (Total - Gross)]was deflated by the GDP implicit price deflator for fixed investment. The deflator was appliedat the calculated average age of the capital stock, based on the three year average of the ratio oftotal accumulated depreciation [calculated from Compustat item #8 - Property, Plant &Equipment (Total - Net)] to current depreciation [Compustat item #14 - Depreciation andAmortization]. The calculation of average age differs slightly from the method in Hall (1990)who made a further adjustment for current depreciation. The constant dollar value of IT capital(as calculated above) was subtracted from this result. Thus, the sum of ordinary capital andITcapital equals total capital stock.
Labor Expense (LABOR). Labor expense was either taken directly from Compustat (Item#42 - Labor and related expenses) or calculated as a sector average labor cost per employeemultiplied by total employees (Compustat Item #29 - Employees) when labor expense was notavailable, and deflated by the price index for Total Compensation (Council of EconomicAdvisors, 1995). The average labor expense per employee was taken from BLS data onhourly cost of workers (including benefits) for 10 sectors of the economy. For firms which hadlabor expense directly reported on Compustat which did not include benefits (identified byCompustat Item - Labor Expense Footnote), we adjusted the labor figure by multiplyingreported labor expense by the total compensation/wages ratio for each sector as reported byBLS.
Employees (EMPLOY). Number of employees was taken directly from Compustat (Item#29 - Employees). No adjustments were made to this figure.
Materials (MATL). Only used in computations. Materials was calculated by subtractingundeflated labor expenses (calculated above) from total expense and deflating by the industrylevel output deflator. Total expense was computed as the difference between OperatingIncome Before Depreciation (Compustat Item #13), and Sales (Net) (Compustat Item #12).
Value-Added (VA). Computed from deflated Output (as calculated above) less deflatedMaterials.
Sector Dummy Variables. The industry controls used in this most analyses in this papercorrespond to an intermediate level between 1-digit and 2-digit SIC codes. Based on thereported primary SIC code on Compustat we construct the following variables:
Mining /Construction (MI) – SIC 11xx - 20xxProcess Manufacturing (PR) – SIC 26xx, 28xx and 29xx
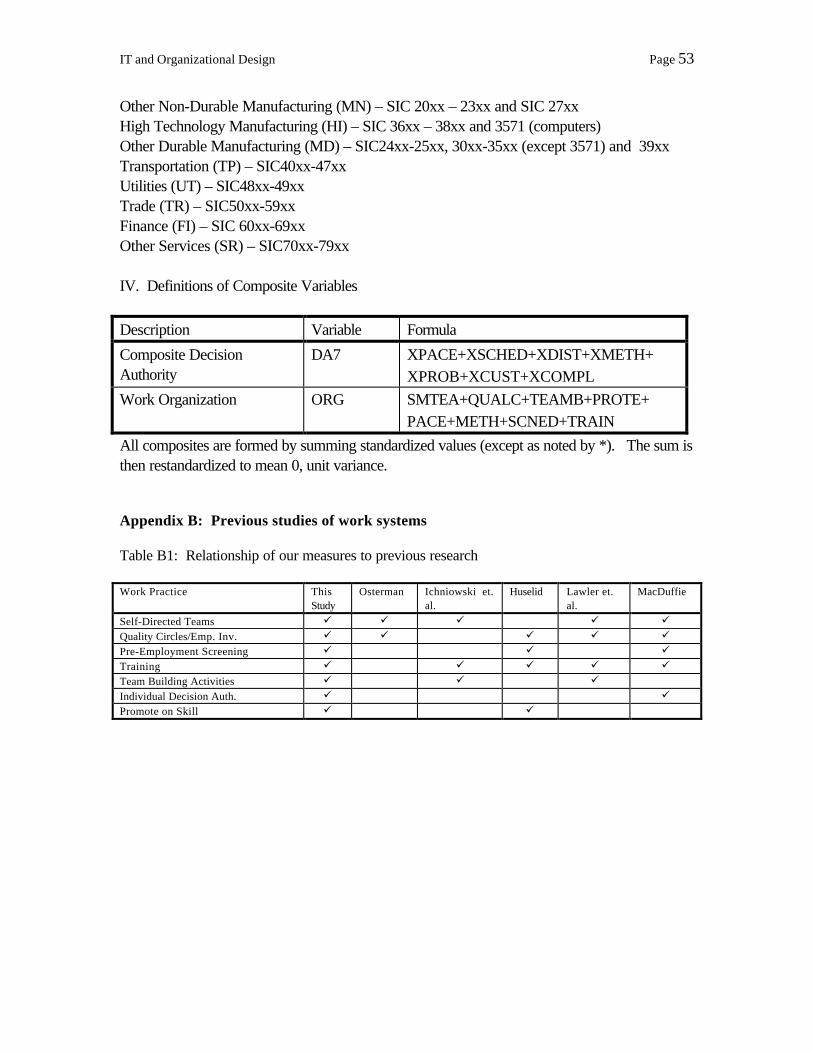
IT and Organizational Design Page 53
Other Non-Durable Manufacturing (MN) – SIC 20xx – 23xx and SIC 27xxHigh Technology Manufacturing (HI) – SIC 36xx – 38xx and 3571 (computers)Other Durable Manufacturing (MD) – SIC24xx-25xx, 30xx-35xx (except 3571) and 39xxTransportation (TP) – SIC40xx-47xxUtilities (UT) – SIC48xx-49xxTrade (TR) – SIC50xx-59xxFinance (FI) – SIC 60xx-69xxOther Services (SR) – SIC70xx-79xx
IV. Definitions of Composite Variables
Description Variable Formula
Composite DecisionAuthority
DA7 XPACE+XSCHED+XDIST+XMETH+XPROB+XCUST+XCOMPL
Work Organization ORG SMTEA+QUALC+TEAMB+PROTE+PACE+METH+SCNED+TRAIN
All composites are formed by summing standardized values (except as noted by *). The sum isthen restandardized to mean 0, unit variance.
Appendix B: Previous studies of work systems
Table B1: Relationship of our measures to previous research
Work Practice ThisStudy
Osterman Ichniowski et.al.
Huselid Lawler et.al.
MacDuffie
Self-Directed Teams ü ü ü ü üQuality Circles/Emp. Inv. ü ü ü ü üPre-Employment Screening ü ü üTraining ü ü ü ü üTeam Building Activities ü ü üIndividual Decision Auth. ü üPromote on Skill ü ü
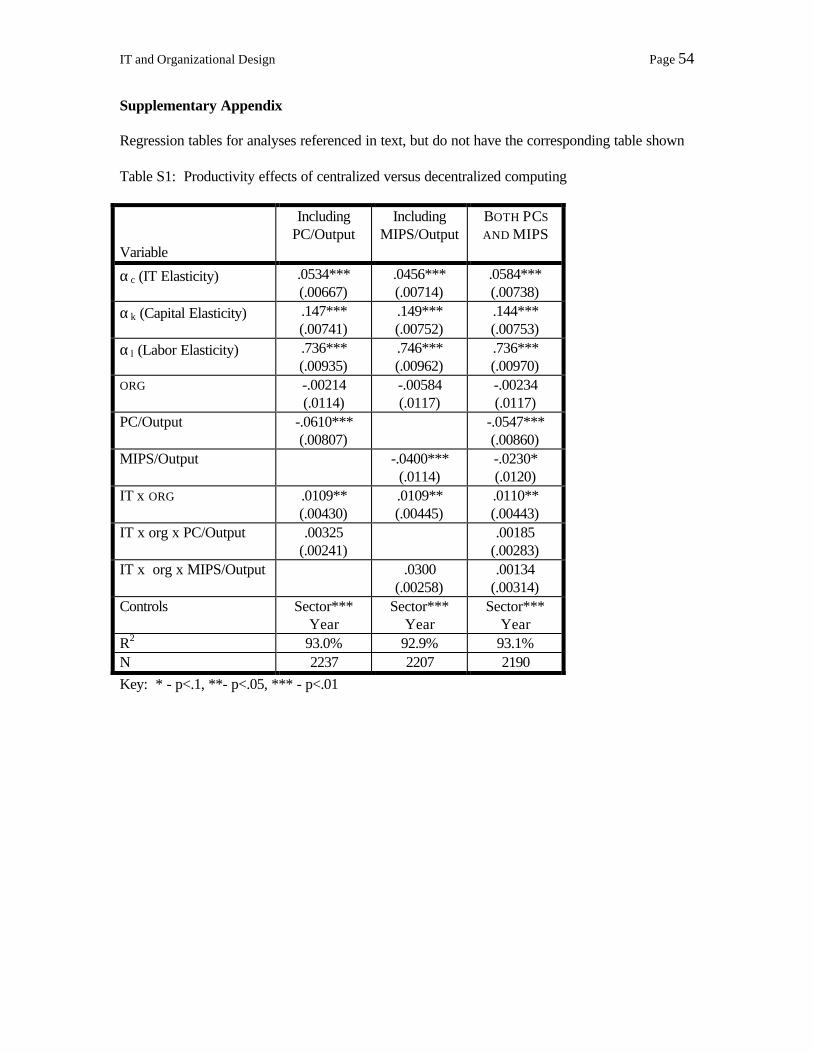
IT and Organizational Design Page 54
Supplementary Appendix
Regression tables for analyses referenced in text, but do not have the corresponding table shown
Table S1: Productivity effects of centralized versus decentralized computing
Variable
IncludingPC/Output
IncludingMIPS/Output
BOTH PCSAND MIPS
αc (IT Elasticity) .0534***(.00667)
.0456***(.00714)
.0584***(.00738)
αk (Capital Elasticity) .147***(.00741)
.149***(.00752)
.144***(.00753)
α l (Labor Elasticity) .736***(.00935)
.746***(.00962)
.736***(.00970)
ORG -.00214(.0114)
-.00584(.0117)
-.00234(.0117)
PC/Output -.0610***(.00807)
-.0547***(.00860)
MIPS/Output -.0400***(.0114)
-.0230*(.0120)
IT x ORG .0109**(.00430)
.0109**(.00445)
.0110**(.00443)
IT x org x PC/Output .00325(.00241)
.00185(.00283)
IT x org x MIPS/Output .0300(.00258)
.00134(.00314)
Controls Sector***Year
Sector***Year
Sector***Year
R2 93.0% 92.9% 93.1%N 2237 2207 2190Key: * - p<.1, **- p<.05, *** - p<.01
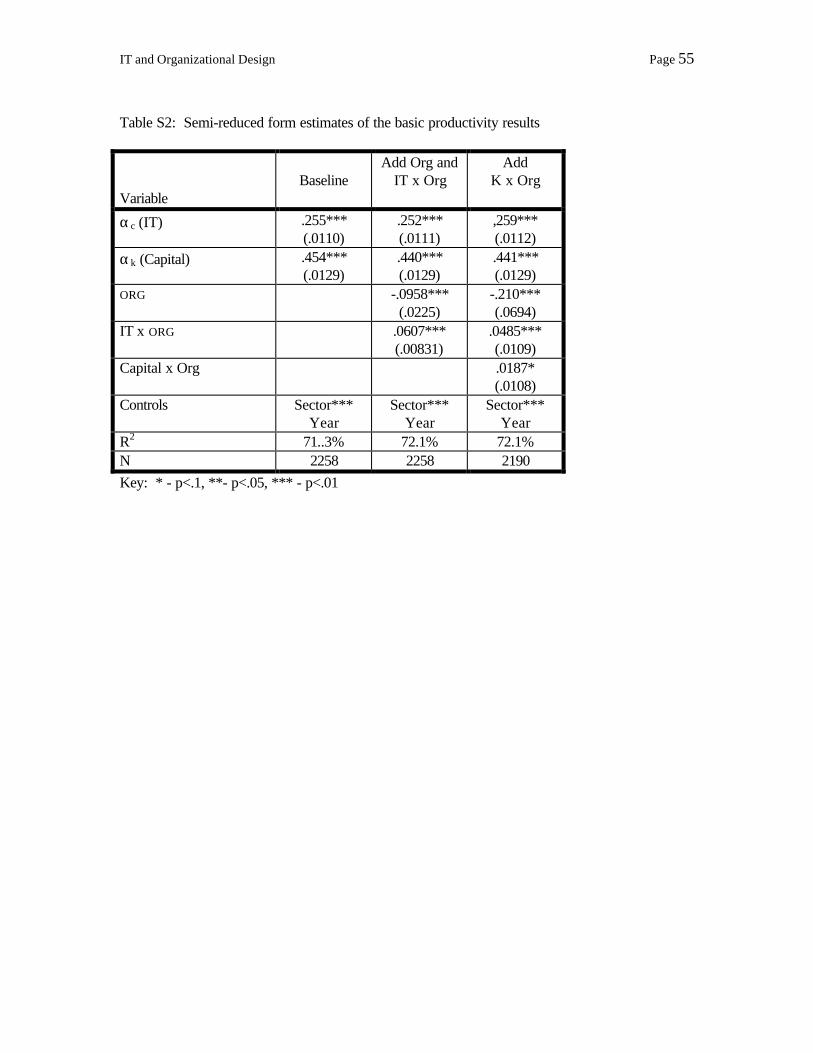
IT and Organizational Design Page 55
Table S2: Semi-reduced form estimates of the basic productivity results
VariableBaseline
Add Org andIT x Org
AddK x Org
αc (IT) .255***(.0110)
.252***(.0111)
,259***(.0112)
αk (Capital) .454***(.0129)
.440***(.0129)
.441***(.0129)
ORG -.0958***(.0225)
-.210***(.0694)
IT x ORG .0607***(.00831)
.0485***(.0109)
Capital x Org .0187*(.0108)
Controls Sector***Year
Sector***Year
Sector***Year
R2 71..3% 72.1% 72.1%N 2258 2258 2190Key: * - p<.1, **- p<.05, *** - p<.01
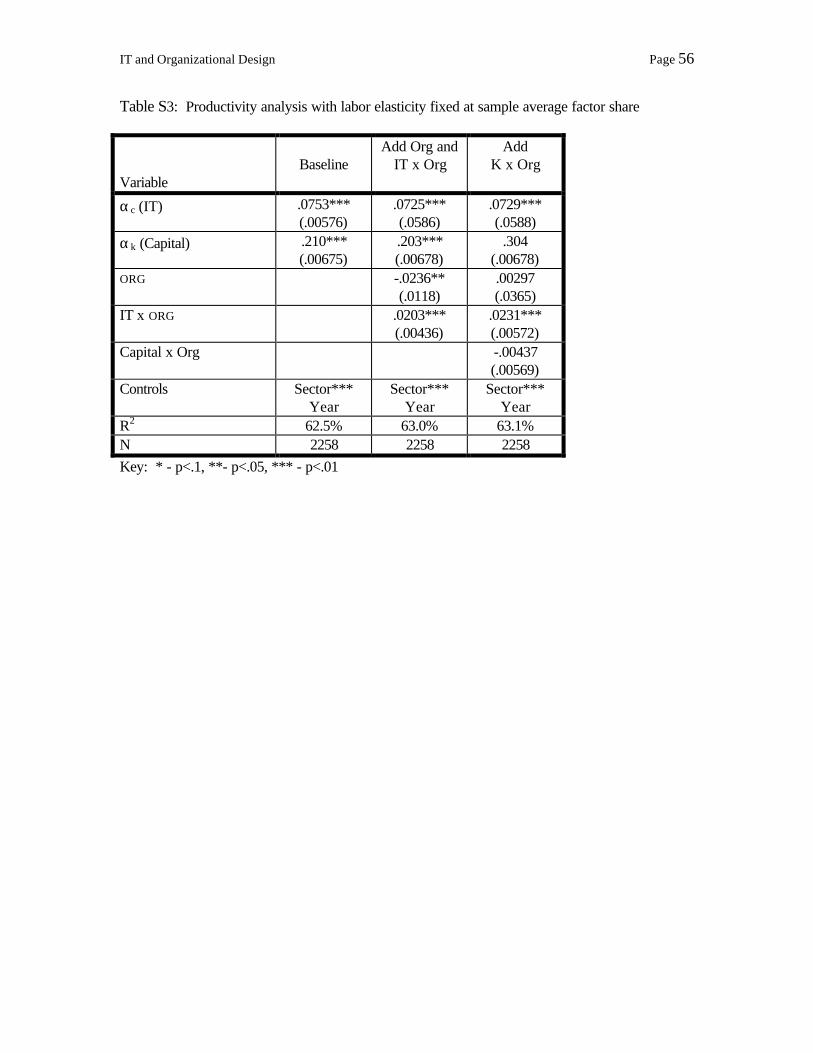
IT and Organizational Design Page 56
Table S3: Productivity analysis with labor elasticity fixed at sample average factor share
VariableBaseline
Add Org andIT x Org
AddK x Org
αc (IT) .0753***(.00576)
.0725***(.0586)
.0729***(.0588)
αk (Capital) .210***(.00675)
.203***(.00678)
.304(.00678)
ORG -.0236**(.0118)
.00297(.0365)
IT x ORG .0203***(.00436)
.0231***(.00572)
Capital x Org -.00437(.00569)
Controls Sector***Year
Sector***Year
Sector***Year
R2 62.5% 63.0% 63.1%N 2258 2258 2258Key: * - p<.1, **- p<.05, *** - p<.01
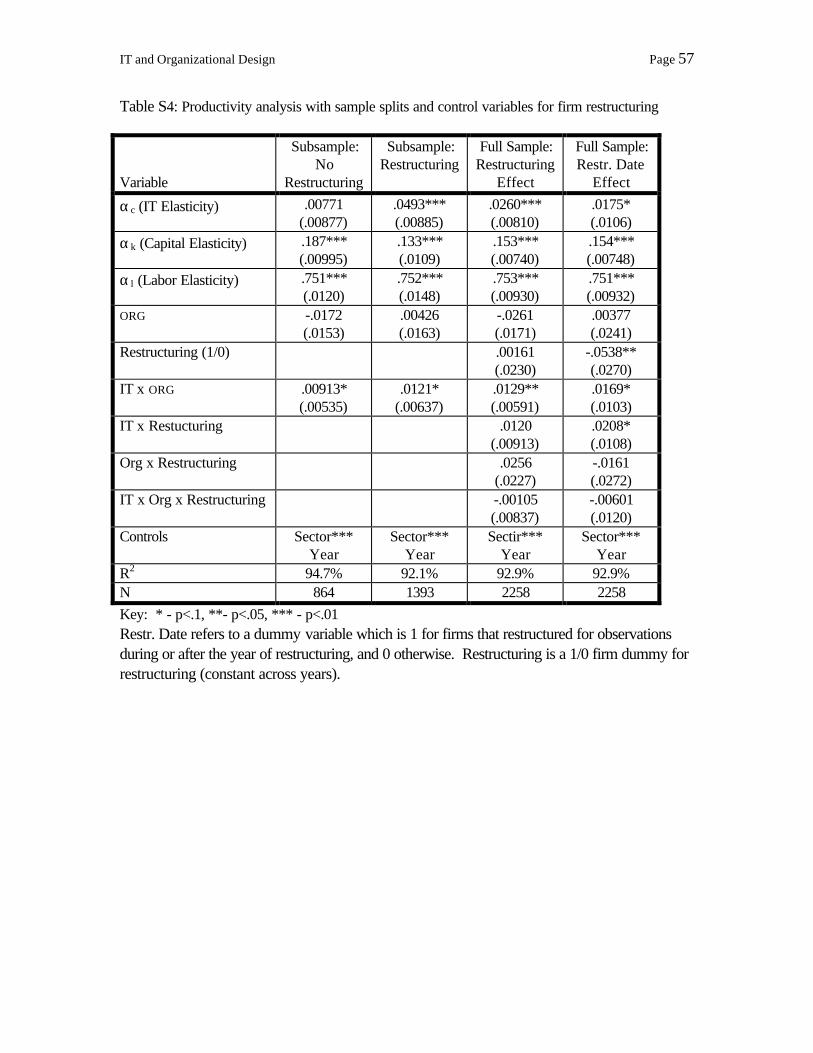
IT and Organizational Design Page 57
Table S4: Productivity analysis with sample splits and control variables for firm restructuring
Variable
Subsample:No
Restructuring
Subsample:Restructuring
Full Sample:Restructuring
Effect
Full Sample:Restr. Date
Effect
αc (IT Elasticity) .00771(.00877)
.0493***(.00885)
.0260***(.00810)
.0175*(.0106)
αk (Capital Elasticity) .187***(.00995)
.133***(.0109)
.153***(.00740)
.154***(.00748)
α l (Labor Elasticity) .751***(.0120)
.752***(.0148)
.753***(.00930)
.751***(.00932)
ORG -.0172(.0153)
.00426(.0163)
-.0261(.0171)
.00377(.0241)
Restructuring (1/0) .00161(.0230)
-.0538**(.0270)
IT x ORG .00913*(.00535)
.0121*(.00637)
.0129**(.00591)
.0169*(.0103)
IT x Restucturing .0120(.00913)
.0208*(.0108)
Org x Restructuring .0256(.0227)
-.0161(.0272)
IT x Org x Restructuring -.00105(.00837)
-.00601(.0120)
Controls Sector***Year
Sector***Year
Sectir***Year
Sector***Year
R2 94.7% 92.1% 92.9% 92.9%N 864 1393 2258 2258Key: * - p<.1, **- p<.05, *** - p<.01Restr. Date refers to a dummy variable which is 1 for firms that restructured for observationsduring or after the year of restructuring, and 0 otherwise. Restructuring is a 1/0 firm dummy forrestructuring (constant across years).