Embed Size (px)
Citation preview
Information-Rich Virtual Environments:Theory, Tools, and Research Agenda
Doug A. Bowman, Chris North, Jian Chen, Nicholas F. Polys, Pardha S. Pyla, and UmurYilmaz
Department of Computer Science and Center for Human-Computer InteractionVirginia Tech
Blacksburg, Virginia, USA1-540-231-2058
{bowman, north, jichen8, npolys, ppyla, uyilmaz}@vt.edu
ABSTRACTVirtual environments (VEs) allow users to experience andinteract with a rich sensory environment, but most virtual worldscontain only sensory information similar to that which weexperience in the physical world. Information-rich virtualenvironments (IRVEs) combine the power of VEs andinformation visualization, augmenting VEs with additionalabstract information such as text, numbers, or graphs. IRVEs canbe useful in many contexts, such as education, medicine, orconstruction. In our work, we are developing a theoreticalfoundation for the study of IRVEs and tools for theirdevelopment and evaluation. We present a working definition ofIRVEs, a discussion of information display and interaction inIRVEs. We also describe a software framework for IRVEdevelopment and a testbed enabling evaluation of text displaytechniques for IRVEs. Finally, we present a research agenda forthis area.
Categories and Subject DescriptorsI.3.7 [Computer Graphics]: Three-Dimensional Graphics andRealism - Virtual reality.
H.5.1 [Information Interfaces and Presentation]: MultimediaInformation Systems - Artificial, augmented, and virtual realities.
General TermsHuman Factors.
KeywordsInformation-rich virtual environments, information visualization.
1. INTRODUCTIONVirtual environments (VEs) can be quite effective in immersingthe user within a realistic three-dimensional world, and in
providing a high level of sensory “richness” to the user. Thus, anart student can find herself transported back to ancient Greece,where she can experience for herself what it would be like towalk through one of the famous temples. In most VEs, however,this sensory experience would be the extent of the informationpresented to the user – the VE would contain no descriptive textor audio, data about the materials used in the temple’sconstruction, or historical context for the building.
In our work, we are developing and studying information-richvirtual environments (IRVEs). In a nutshell, IRVEs are acombination of traditional VEs and information visualization;that is, they provide a realistic sensory experience that isenhanced with some representation of related abstractinformation (a more precise definition is given in section 3.1). Inthis way, they can provide for a better understanding of therelationships between perceptual and abstract information,improved learning of educational material, greater enjoyment andengagement with the VE, and a decreased dependence on othertools for the viewing of abstract data.
The basic concept of IRVEs is not new; many VE andvisualization applications have included related abstractinformation. However, there has been a lack of precise definition,systematic research, and development tools for IRVEs. Ourresearch generalizes from prior work to define the area andproduces principles and tools for the development of effectiveand usable IRVEs.
Some of our prior research has established that IRVEs can beuseful in domains such as design education [13]. In this paper, wedescribe the steps we are taking to establish a more systematicstudy of IRVEs. After discussing some related research, wepresent a theoretical framework for IRVE research, two tools wehave developed to allow the implementation and evaluation ofIRVEs, and a research agenda for this relatively unexplored field.
2. RELATED WORKMany systems have been developed that use a three–dimensional(3D) space to present some form of information to the user. Theseinclude both immersive virtual reality systems and desktop 3Dapplications. Let us consider two categories of such systems:information and scientific visualizations.
3D information visualizations take a complex and abstract datasetand organize it into an understandable visual representation,which can be navigated and accessed by the user (e.g. [6, 17, 28,29]). Here abstract properties of the data are mapped into
Permission to make digital or hard copies of all or part of this work forpersonal or classroom use is granted without fee provided that copiesare not made or distributed for profit or commercial advantage and thatcopies bear this notice and the full citation on the first page. To copyotherwise, or republish, to post on servers or to redistribute to lists,requires prior specific permission and/or a fee.
VRST’03, October 1-3, 2003, Osaka, Japan
Copyright 2003 ACM 1-58113-530-0/02/0011…$5.00
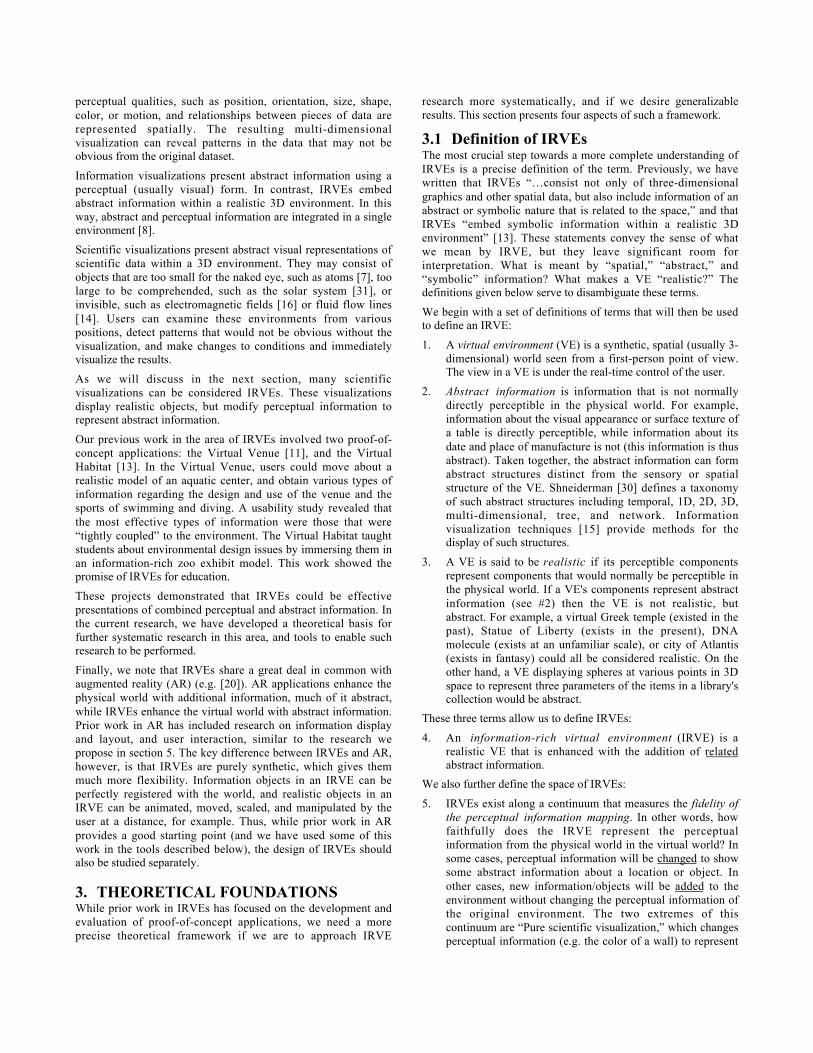
perceptual qualities, such as position, orientation, size, shape,color, or motion, and relationships between pieces of data arerepresented spatially. The resulting multi-dimensionalvisualization can reveal patterns in the data that may not beobvious from the original dataset.
Information visualizations present abstract information using aperceptual (usually visual) form. In contrast, IRVEs embedabstract information within a realistic 3D environment. In thisway, abstract and perceptual information are integrated in a singleenvironment [8].
Scientific visualizations present abstract visual representations ofscientific data within a 3D environment. They may consist ofobjects that are too small for the naked eye, such as atoms [7], toolarge to be comprehended, such as the solar system [31], orinvisible, such as electromagnetic fields [16] or fluid flow lines[14]. Users can examine these environments from variouspositions, detect patterns that would not be obvious without thevisualization, and make changes to conditions and immediatelyvisualize the results.
As we will discuss in the next section, many scientificvisualizations can be considered IRVEs. These visualizationsdisplay realistic objects, but modify perceptual information torepresent abstract information.
Our previous work in the area of IRVEs involved two proof-of-concept applications: the Virtual Venue [11], and the VirtualHabitat [13]. In the Virtual Venue, users could move about arealistic model of an aquatic center, and obtain various types ofinformation regarding the design and use of the venue and thesports of swimming and diving. A usability study revealed thatthe most effective types of information were those that were“tightly coupled” to the environment. The Virtual Habitat taughtstudents about environmental design issues by immersing them inan information-rich zoo exhibit model. This work showed thepromise of IRVEs for education.
These projects demonstrated that IRVEs could be effectivepresentations of combined perceptual and abstract information. Inthe current research, we have developed a theoretical basis forfurther systematic research in this area, and tools to enable suchresearch to be performed.
Finally, we note that IRVEs share a great deal in common withaugmented reality (AR) (e.g. [20]). AR applications enhance thephysical world with additional information, much of it abstract,while IRVEs enhance the virtual world with abstract information.Prior work in AR has included research on information displayand layout, and user interaction, similar to the research wepropose in section 5. The key difference between IRVEs and AR,however, is that IRVEs are purely synthetic, which gives themmuch more flexibility. Information objects in an IRVE can beperfectly registered with the world, and realistic objects in anIRVE can be animated, moved, scaled, and manipulated by theuser at a distance, for example. Thus, while prior work in ARprovides a good starting point (and we have used some of thiswork in the tools described below), the design of IRVEs shouldalso be studied separately.
3. THEORETICAL FOUNDATIONSWhile prior work in IRVEs has focused on the development andevaluation of proof-of-concept applications, we need a moreprecise theoretical framework if we are to approach IRVE
research more systematically, and if we desire generalizableresults. This section presents four aspects of such a framework.
3.1 Definition of IRVEsThe most crucial step towards a more complete understanding ofIRVEs is a precise definition of the term. Previously, we havewritten that IRVEs “…consist not only of three-dimensionalgraphics and other spatial data, but also include information of anabstract or symbolic nature that is related to the space,” and thatIRVEs “embed symbolic information within a realistic 3Denvironment” [13]. These statements convey the sense of whatwe mean by IRVE, but they leave significant room forinterpretation. What is meant by “spatial,” “abstract,” and“symbolic” information? What makes a VE “realistic?” Thedefinitions given below serve to disambiguate these terms.
We begin with a set of definitions of terms that will then be usedto define an IRVE:
1. A virtual environment (VE) is a synthetic, spatial (usually 3-dimensional) world seen from a first-person point of view.The view in a VE is under the real-time control of the user.
2. Abstract information is information that is not normallydirectly perceptible in the physical world. For example,information about the visual appearance or surface texture ofa table is directly perceptible, while information about itsdate and place of manufacture is not (this information is thusabstract). Taken together, the abstract information can formabstract structures distinct from the sensory or spatialstructure of the VE. Shneiderman [30] defines a taxonomyof such abstract structures including temporal, 1D, 2D, 3D,multi-dimensional, tree, and network. Informationvisualization techniques [15] provide methods for thedisplay of such structures.
3. A VE is said to be realistic if its perceptible componentsrepresent components that would normally be perceptible inthe physical world. If a VE's components represent abstractinformation (see #2) then the VE is not realistic, butabstract. For example, a virtual Greek temple (existed in thepast), Statue of Liberty (exists in the present), DNAmolecule (exists at an unfamiliar scale), or city of Atlantis(exists in fantasy) could all be considered realistic. On theother hand, a VE displaying spheres at various points in 3Dspace to represent three parameters of the items in a library'scollection would be abstract.
These three terms allow us to define IRVEs:
4. An information-rich virtual environment (IRVE) is arealistic VE that is enhanced with the addition of relatedabstract information.
We also further define the space of IRVEs:
5. IRVEs exist along a continuum that measures the fidelity ofthe perceptual information mapping. In other words, howfaithfully does the IRVE represent the perceptualinformation from the physical world in the virtual world? Insome cases, perceptual information will be changed to showsome abstract information about a location or object. Inother cases, new information/objects will be added to theenvironment without changing the perceptual information ofthe original environment. The two extremes of thiscontinuum are “Pure scientific visualization,” which changesperceptual information (e.g. the color of a wall) to represent
some abstract information (e.g. the air pressure at each pointon the wall), and “Information-enhanced VEs,” whichrepresent the physical environment with as much perceptualfidelity as possible, and add additional abstract informationin the form of text, audio, video, graphs, etc.
6. Other dimensions in the space of IRVEs include the varietyof abstract information types present in the environment,and the density of abstract information in the environment.Density will be very hard to define quantitatively, but itcould still be useful as a qualitative measure.
7. “Pure information visualization” (e.g. a 3D scatterplot ofcensus data) is not an IRVE because the VE is abstract, notrealistic. All of the information in the environment isabstract information that has been mapped to a perceptualform. IRVEs, on the other hand, add informationvisualization to realistic VEs to provide richness.
To make this definition more concrete, consider the example ofVEs for design and review in building construction. Architectsneed to design and review complex plans for the construction of ahome. Good plans must take into account the spatial layout of thehome as well as other information such as cost, materials, andschedule. The spatial and abstract information are tightlyinterrelated, and must be considered and understood together bythe architect or contractor. Users of such an application need a)immersion in the space for perceptual fidelity, b) access to relatedabstract information, and c) an understanding of the relationshipsbetween the perceptual and abstract information. Typically, userswant to examine abstract information within context in the space.In some cases, they may also use abstract information as an indexinto space. For example, from a display of the productionschedule, elements to be completed by a certain date are selectedby the architect. The VE responds by highlighting those elementsin the 3D architectural plan, or temporarily filtering otherelements from the plan.
An IRVE addressing home design review would allow users toperform tasks such as “navigate to the northwest corner of themaster bedroom,” or “attach a note for the client saying that thiswall could be thinned to reduce cost.” It would also provideanswers to questions such as: “How can we reduce the cost of thisroom? Which items are most costly? Are these columns aestheticor essential for load bearing support?”
3.2 Design Space for Information Display inIRVEsResearch in VEs and information visualization provides methodsfor the display of perceptual and abstract informationrespectively. However, further new methods are needed for thedisplay of the combination of these information types in IRVEs.We have identified three major decisions designers must makewhen embedding abstract information in a perceptual VE. Figures1 and 2 illustrate some of the possible options.
3.2.1 Display LocationWhere should abstract information be displayed? Following fromthe AR work of Feiner and colleagues [18], we divide displaylocations into world-fixed, display-fixed, object-fixed, and user-fixed categories. World-fixed information is attached to a specific3D (world-coordinate) location in the VE. Display-fixedinformation remains at the same location on the display (screen)surface. Information that stays attached to an object in theenvironment (even if that object is moved) is termed object-fixed.
Finally, information may be fixed to the user’s view, so that it’salways available as the user navigates the environment. In somedisplay systems, such as head-mounted displays, display-fixedand user-fixed may be equivalent.
When abstract information is world- or object-fixed, we canchoose to represent it in at least two ways. We can embed theinformation by adding a sensory representation (usually a visibleobject) of it to the VE. The new objects can represent the abstractinformation as text, glyphs, graphs, and other visualizations, orthrough audio clips or haptic feedback. For example, each wall inan architectural VE might have a label or small glyph hovering infront of it representing the wall’s cost. Alternatively, we canembed the abstract information by changing the appearance of theassociated existing objects in the VE. For example, the color ofthe walls in the architectural VE could represent their cost.
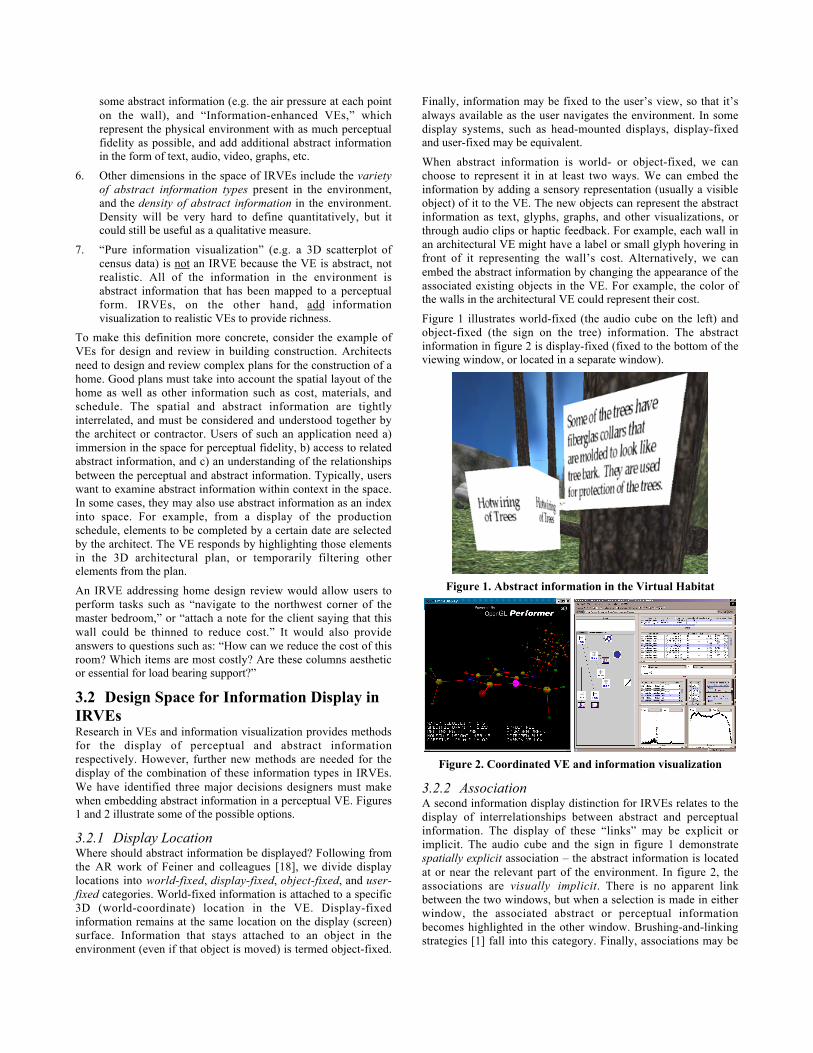
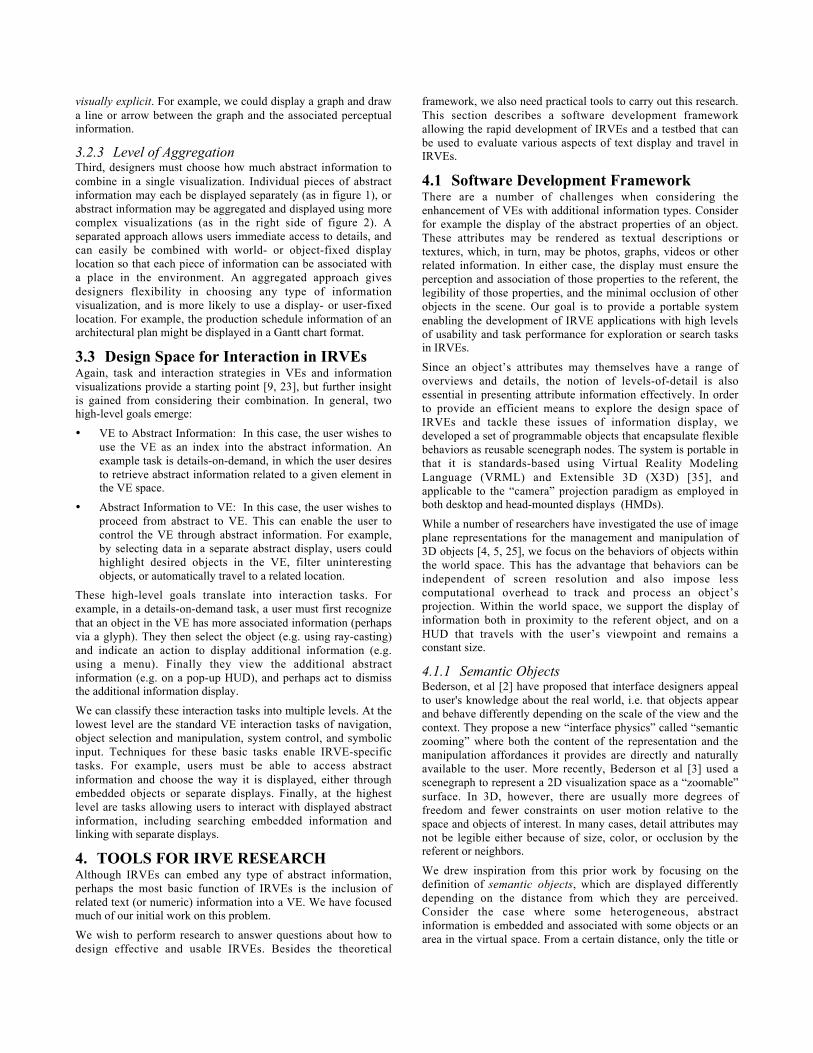
Figure 1 illustrates world-fixed (the audio cube on the left) andobject-fixed (the sign on the tree) information. The abstractinformation in figure 2 is display-fixed (fixed to the bottom of theviewing window, or located in a separate window).
Figure 1. Abstract information in the Virtual Habitat
Figure 2. Coordinated VE and information visualization
3.2.2 AssociationA second information display distinction for IRVEs relates to thedisplay of interrelationships between abstract and perceptualinformation. The display of these “links” may be explicit orimplicit. The audio cube and the sign in figure 1 demonstratespatially explicit association – the abstract information is locatedat or near the relevant part of the environment. In figure 2, theassociations are visually implicit. There is no apparent linkbetween the two windows, but when a selection is made in eitherwindow, the associated abstract or perceptual informationbecomes highlighted in the other window. Brushing-and-linkingstrategies [1] fall into this category. Finally, associations may be
visually explicit. For example, we could display a graph and drawa line or arrow between the graph and the associated perceptualinformation.
3.2.3 Level of AggregationThird, designers must choose how much abstract information tocombine in a single visualization. Individual pieces of abstractinformation may each be displayed separately (as in figure 1), orabstract information may be aggregated and displayed using morecomplex visualizations (as in the right side of figure 2). Aseparated approach allows users immediate access to details, andcan easily be combined with world- or object-fixed displaylocation so that each piece of information can be associated witha place in the environment. An aggregated approach givesdesigners flexibility in choosing any type of informationvisualization, and is more likely to use a display- or user-fixedlocation. For example, the production schedule information of anarchitectural plan might be displayed in a Gantt chart format.
3.3 Design Space for Interaction in IRVEsAgain, task and interaction strategies in VEs and informationvisualizations provide a starting point [9, 23], but further insightis gained from considering their combination. In general, twohigh-level goals emerge:
• VE to Abstract Information: In this case, the user wishes touse the VE as an index into the abstract information. Anexample task is details-on-demand, in which the user desiresto retrieve abstract information related to a given element inthe VE space.
• Abstract Information to VE: In this case, the user wishes toproceed from abstract to VE. This can enable the user tocontrol the VE through abstract information. For example,by selecting data in a separate abstract display, users couldhighlight desired objects in the VE, filter uninterestingobjects, or automatically travel to a related location.
These high-level goals translate into interaction tasks. Forexample, in a details-on-demand task, a user must first recognizethat an object in the VE has more associated information (perhapsvia a glyph). They then select the object (e.g. using ray-casting)and indicate an action to display additional information (e.g.using a menu). Finally they view the additional abstractinformation (e.g. on a pop-up HUD), and perhaps act to dismissthe additional information display.
We can classify these interaction tasks into multiple levels. At thelowest level are the standard VE interaction tasks of navigation,object selection and manipulation, system control, and symbolicinput. Techniques for these basic tasks enable IRVE-specifictasks. For example, users must be able to access abstractinformation and choose the way it is displayed, either throughembedded objects or separate displays. Finally, at the highestlevel are tasks allowing users to interact with displayed abstractinformation, including searching embedded information andlinking with separate displays.
4. TOOLS FOR IRVE RESEARCHAlthough IRVEs can embed any type of abstract information,perhaps the most basic function of IRVEs is the inclusion ofrelated text (or numeric) information into a VE. We have focusedmuch of our initial work on this problem.
We wish to perform research to answer questions about how todesign effective and usable IRVEs. Besides the theoretical
framework, we also need practical tools to carry out this research.This section describes a software development frameworkallowing the rapid development of IRVEs and a testbed that canbe used to evaluate various aspects of text display and travel inIRVEs.
4.1 Software Development FrameworkThere are a number of challenges when considering theenhancement of VEs with additional information types. Considerfor example the display of the abstract properties of an object.These attributes may be rendered as textual descriptions ortextures, which, in turn, may be photos, graphs, videos or otherrelated information. In either case, the display must ensure theperception and association of those properties to the referent, thelegibility of those properties, and the minimal occlusion of otherobjects in the scene. Our goal is to provide a portable systemenabling the development of IRVE applications with high levelsof usability and task performance for exploration or search tasksin IRVEs.
Since an object’s attributes may themselves have a range ofoverviews and details, the notion of levels-of-detail is alsoessential in presenting attribute information effectively. In orderto provide an efficient means to explore the design space ofIRVEs and tackle these issues of information display, wedeveloped a set of programmable objects that encapsulate flexiblebehaviors as reusable scenegraph nodes. The system is portable inthat it is standards-based using Virtual Reality ModelingLanguage (VRML) and Extensible 3D (X3D) [35], andapplicable to the “camera” projection paradigm as employed inboth desktop and head-mounted displays (HMDs).
While a number of researchers have investigated the use of imageplane representations for the management and manipulation of3D objects [4, 5, 25], we focus on the behaviors of objects withinthe world space. This has the advantage that behaviors can beindependent of screen resolution and also impose lesscomputational overhead to track and process an object’sprojection. Within the world space, we support the display ofinformation both in proximity to the referent object, and on aHUD that travels with the user’s viewpoint and remains aconstant size.
4.1.1 Semantic ObjectsBederson, et al [2] have proposed that interface designers appealto user's knowledge about the real world, i.e. that objects appearand behave differently depending on the scale of the view and thecontext. They propose a new “interface physics” called “semanticzooming” where both the content of the representation and themanipulation affordances it provides are directly and naturallyavailable to the user. More recently, Bederson et al [3] used ascenegraph to represent a 2D visualization space as a “zoomable”surface. In 3D, however, there are usually more degrees offreedom and fewer constraints on user motion relative to thespace and objects of interest. In many cases, detail attributes maynot be legible either because of size, color, or occlusion by thereferent or neighbors.
We drew inspiration from this prior work by focusing on thedefinition of semantic objects, which are displayed differentlydepending on the distance from which they are perceived.Consider the case where some heterogeneous, abstractinformation is embedded and associated with some objects or anarea in the virtual space. From a certain distance, only the title or
name of an object may be visible. As a user navigates closer orzooms into smaller scales, he or she may receive more detailabout that object such as a full text or numerical description. Inorder to account for differences in the number of geometrical andabstract attribute definitions for a semantic object, weimplemented a Level-of-Detail (LOD) technique that separatesthe functional descriptions of the 3D object and its abstractattributes.
Semantic objects may also carry affordances similar to Bedersonet al.’s notion of an information lens and Shneiderman’s mantraof details-on-demand [30]. As a user explores the IRVE, she maypoint to an object and receive an overview description of theobject in her HUD. When the user selects an object with a buttonpress, detail information is displayed in the HUD (figure 3).
4.1.2 Level of Detail TechniquesOur software design attempts to improve techniques andtechnologies for managing the rendered form and context ofinformation objects over wide ranges of scale. There are existingspecifications and implementations for level-of-detail (LOD)scenegraph nodes, but they have typically only been applied to anobject's geometric resolution – not to multiple information typessuch as annotations or numbers associated with that object.
The VRML97 LOD was designed to address network, memory,and performance tradeoffs in managing a VE’s complexity.Related work on managing LOD in wide-scale geographicmodels has been done [19, 26], but we want to improve theseapproaches in the context of IRVEs. In addition, few of thecurrent approaches balance the detail and scale with respect to theuser's scale and viewing frustum, especially as concerns thelayout and legibility of text or textures. The semantic objectapproach integrates and manages geometry details and attributedetails simultaneously.
4.1.3 ImplementationOur implementation uses VRML and X3D PROTOTYPE nodesto define labels and semantic objects that can be easily populatedfrom a database or XML (e.g. using XSL Transformations(XSLT)). Authors simply declare the EXTERNPROTO’s filelocation and interface, and semantic objects may be instantiatedin any scene. Semantic objects can be animated with set methodsfor position and orientation.
The label object, or Text Panel, is a basic unit in our system thatcan support arbitrary lines of text aligned left, center, or right,normal, bolded, or italic. The text can be further customized bycolor, transparency, or serif or sans serif font. Text Panels may ormay not have a panel background. If they do, this background isautomatically sized to cover the span of the text; the panelbackground can also be customized for color and transparency,aiding legibility in a variety of environments. In addition, wedefined a simple Image Panel object to support textualannotations.
World authors have a great degree of flexibility in defining thebehavior of semantic objects with our framework. There areseparate distance ranges and description levels for informationand geometry LODs. The label is associated to its referent by anoptional connector line and by its proximity to the referent in 3Dspace. The connector line may be colored and its origin on thereferent’s geometry customized.
In order to support legibility over a variety of distances andangles, information labels are defined as true 3D billboards which
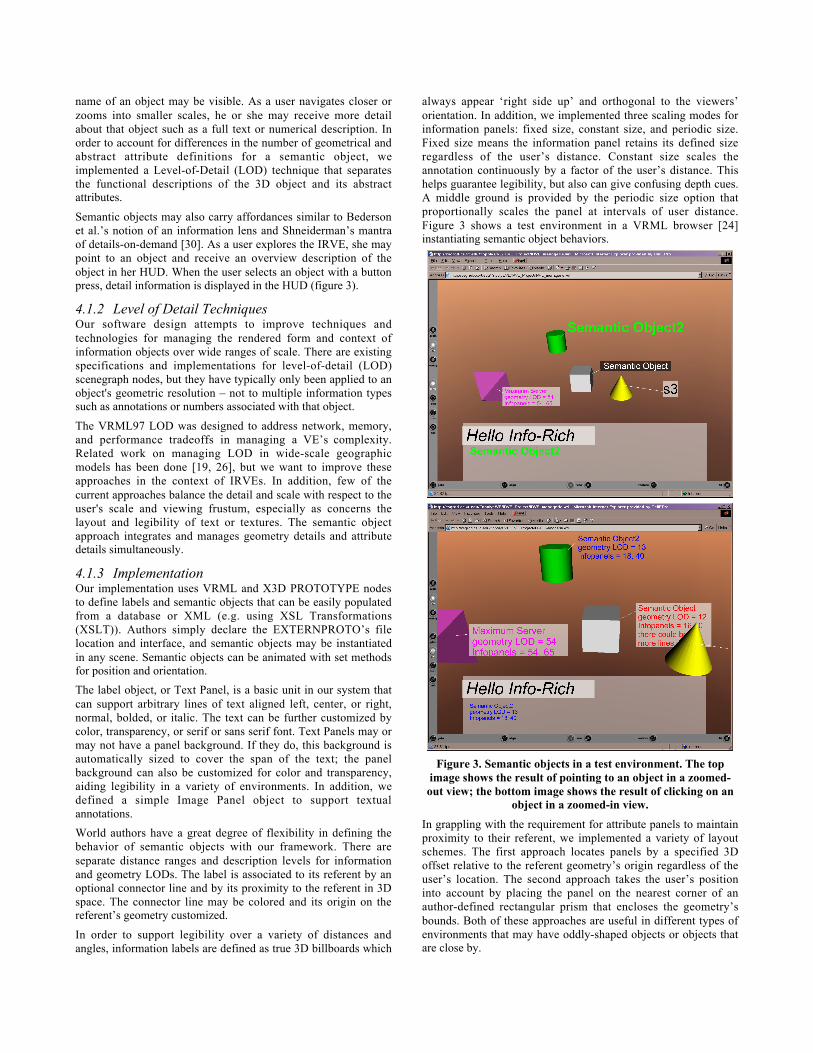
always appear ‘right side up’ and orthogonal to the viewers’orientation. In addition, we implemented three scaling modes forinformation panels: fixed size, constant size, and periodic size.Fixed size means the information panel retains its defined sizeregardless of the user’s distance. Constant size scales theannotation continuously by a factor of the user’s distance. Thishelps guarantee legibility, but also can give confusing depth cues.A middle ground is provided by the periodic size option thatproportionally scales the panel at intervals of user distance.Figure 3 shows a test environment in a VRML browser [24]instantiating semantic object behaviors.
Figure 3. Semantic objects in a test environment. The topimage shows the result of pointing to an object in a zoomed-out view; the bottom image shows the result of clicking on an
object in a zoomed-in view.
In grappling with the requirement for attribute panels to maintainproximity to their referent, we implemented a variety of layoutschemes. The first approach locates panels by a specified 3Doffset relative to the referent geometry’s origin regardless of theuser’s location. The second approach takes the user’s positioninto account by placing the panel on the nearest corner of anauthor-defined rectangular prism that encloses the geometry’sbounds. Both of these approaches are useful in different types ofenvironments that may have oddly-shaped objects or objects thatare close by.
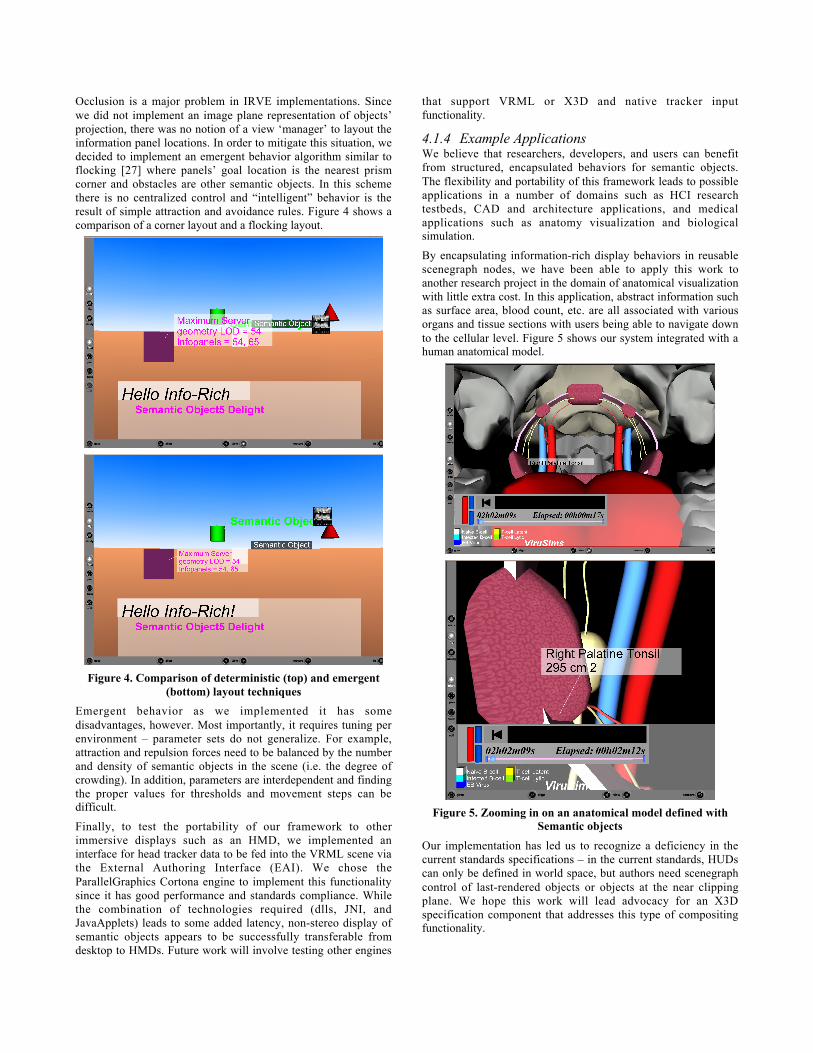
Occlusion is a major problem in IRVE implementations. Sincewe did not implement an image plane representation of objects’projection, there was no notion of a view ‘manager’ to layout theinformation panel locations. In order to mitigate this situation, wedecided to implement an emergent behavior algorithm similar toflocking [27] where panels’ goal location is the nearest prismcorner and obstacles are other semantic objects. In this schemethere is no centralized control and “intelligent” behavior is theresult of simple attraction and avoidance rules. Figure 4 shows acomparison of a corner layout and a flocking layout.
Figure 4. Comparison of deterministic (top) and emergent(bottom) layout techniques
Emergent behavior as we implemented it has somedisadvantages, however. Most importantly, it requires tuning perenvironment – parameter sets do not generalize. For example,attraction and repulsion forces need to be balanced by the numberand density of semantic objects in the scene (i.e. the degree ofcrowding). In addition, parameters are interdependent and findingthe proper values for thresholds and movement steps can bedifficult.
Finally, to test the portability of our framework to otherimmersive displays such as an HMD, we implemented aninterface for head tracker data to be fed into the VRML scene viathe External Authoring Interface (EAI). We chose theParallelGraphics Cortona engine to implement this functionalitysince it has good performance and standards compliance. Whilethe combination of technologies required (dlls, JNI, andJavaApplets) leads to some added latency, non-stereo display ofsemantic objects appears to be successfully transferable fromdesktop to HMDs. Future work will involve testing other engines
that support VRML or X3D and native tracker inputfunctionality.
4.1.4 Example ApplicationsWe believe that researchers, developers, and users can benefitfrom structured, encapsulated behaviors for semantic objects.The flexibility and portability of this framework leads to possibleapplications in a number of domains such as HCI researchtestbeds, CAD and architecture applications, and medicalapplications such as anatomy visualization and biologicalsimulation.
By encapsulating information-rich display behaviors in reusablescenegraph nodes, we have been able to apply this work toanother research project in the domain of anatomical visualizationwith little extra cost. In this application, abstract information suchas surface area, blood count, etc. are all associated with variousorgans and tissue sections with users being able to navigate downto the cellular level. Figure 5 shows our system integrated with ahuman anatomical model.
Figure 5. Zooming in on an anatomical model defined withSemantic objects
Our implementation has led us to recognize a deficiency in thecurrent standards specifications – in the current standards, HUDscan only be defined in world space, but authors need scenegraphcontrol of last-rendered objects or objects at the near clippingplane. We hope this work will lead advocacy for an X3Dspecification component that addresses this type of compositingfunctionality.
While our system has shown some useful applications andpromising approaches, more work is needed to identify optimaldisplay and interaction conditions for successful IRVEs.
4.2 IRVE Travel TestbedAnother useful tool for IRVE research is an environment for theevaluation of various display or interaction techniques. We choseto implement a testbed environment to serve this purpose. Theadvantages of testbed evaluations are that they combine multipletasks, multiple independent variables, and multiple responsemeasures to obtain a more complete picture of interactiontechnique performance and usability.
Specifically, our testbed allows the evaluation of traveltechniques for IRVEs with embedded text information. There isat least one travel testbed existing for traditional VE evaluations[12]. Using this testbed, seven different travel techniques(pointing, torso-directed steering, HOMER travel, 2D mapdragging, ray-casting travel, and Go-Go travel) were studied forspeed, accuracy, spatial awareness, ease of learning, ease of use,information gathering ability, and presence.
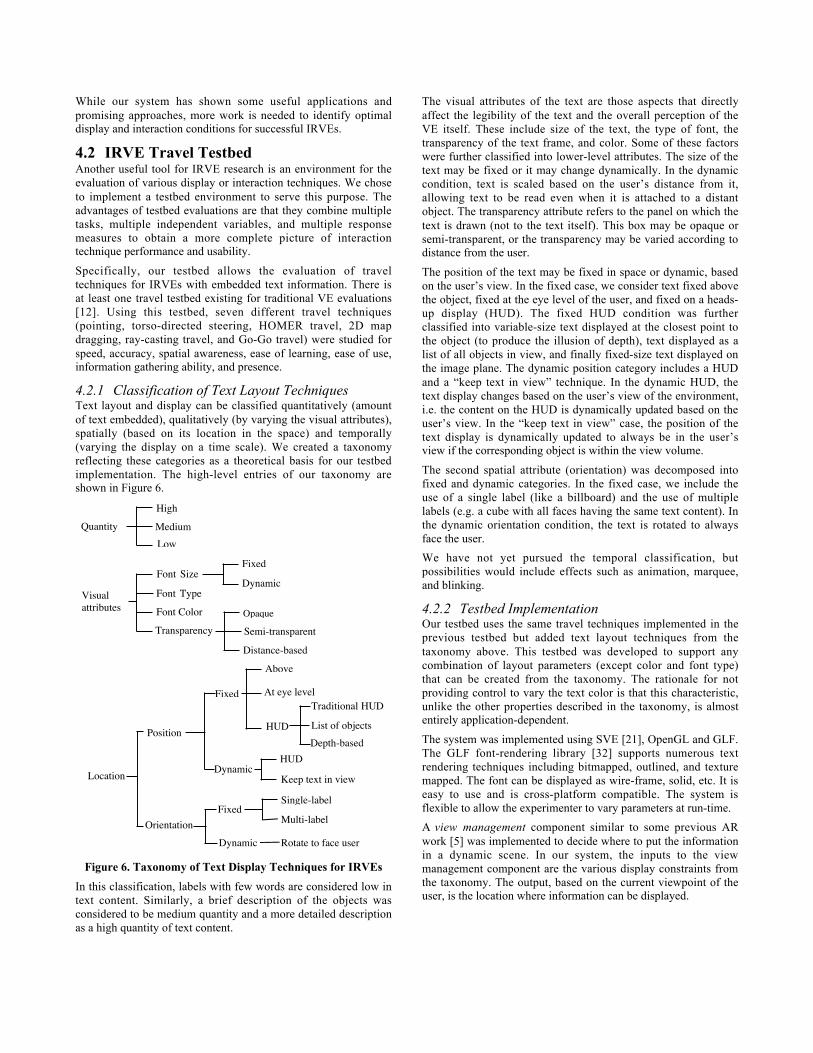
4.2.1 Classification of Text Layout TechniquesText layout and display can be classified quantitatively (amountof text embedded), qualitatively (by varying the visual attributes),spatially (based on its location in the space) and temporally(varying the display on a time scale). We created a taxonomyreflecting these categories as a theoretical basis for our testbedimplementation. The high-level entries of our taxonomy areshown in Figure 6.
QuantityHigh
MediumLow
Visualattributes
Font Type
Font Color
Font SizeFixed
Dynamic
Distance-based
Opaque
Semi-transparentTransparency
Location
Position
Fixed
Above
At eye level
HUD List of objectsDepth-based
Traditional HUD
DynamicKeep text in view
HUD
OrientationRotate to face userDynamic
Single-label
Multi-labelFixed
Figure 6. Taxonomy of Text Display Techniques for IRVEs
In this classification, labels with few words are considered low intext content. Similarly, a brief description of the objects wasconsidered to be medium quantity and a more detailed descriptionas a high quantity of text content.
The visual attributes of the text are those aspects that directlyaffect the legibility of the text and the overall perception of theVE itself. These include size of the text, the type of font, thetransparency of the text frame, and color. Some of these factorswere further classified into lower-level attributes. The size of thetext may be fixed or it may change dynamically. In the dynamiccondition, text is scaled based on the user’s distance from it,allowing text to be read even when it is attached to a distantobject. The transparency attribute refers to the panel on which thetext is drawn (not to the text itself). This box may be opaque orsemi-transparent, or the transparency may be varied according todistance from the user.
The position of the text may be fixed in space or dynamic, basedon the user’s view. In the fixed case, we consider text fixed abovethe object, fixed at the eye level of the user, and fixed on a heads-up display (HUD). The fixed HUD condition was furtherclassified into variable-size text displayed at the closest point tothe object (to produce the illusion of depth), text displayed as alist of all objects in view, and finally fixed-size text displayed onthe image plane. The dynamic position category includes a HUDand a “keep text in view” technique. In the dynamic HUD, thetext display changes based on the user’s view of the environment,i.e. the content on the HUD is dynamically updated based on theuser’s view. In the “keep text in view” case, the position of thetext display is dynamically updated to always be in the user’sview if the corresponding object is within the view volume.
The second spatial attribute (orientation) was decomposed intofixed and dynamic categories. In the fixed case, we include theuse of a single label (like a billboard) and the use of multiplelabels (e.g. a cube with all faces having the same text content). Inthe dynamic orientation condition, the text is rotated to alwaysface the user.
We have not yet pursued the temporal classification, butpossibilities would include effects such as animation, marquee,and blinking.
4.2.2 Testbed ImplementationOur testbed uses the same travel techniques implemented in theprevious testbed but added text layout techniques from thetaxonomy above. This testbed was developed to support anycombination of layout parameters (except color and font type)that can be created from the taxonomy. The rationale for notproviding control to vary the text color is that this characteristic,unlike the other properties described in the taxonomy, is almostentirely application-dependent.
The system was implemented using SVE [21], OpenGL and GLF.The GLF font-rendering library [32] supports numerous textrendering techniques including bitmapped, outlined, and texturemapped. The font can be displayed as wire-frame, solid, etc. It iseasy to use and is cross-platform compatible. The system isflexible to allow the experimenter to vary parameters at run-time.
A view management component similar to some previous ARwork [5] was implemented to decide where to put the informationin a dynamic scene. In our system, the inputs to the viewmanagement component are the various display constraints fromthe taxonomy. The output, based on the current viewpoint of theuser, is the location where information can be displayed.
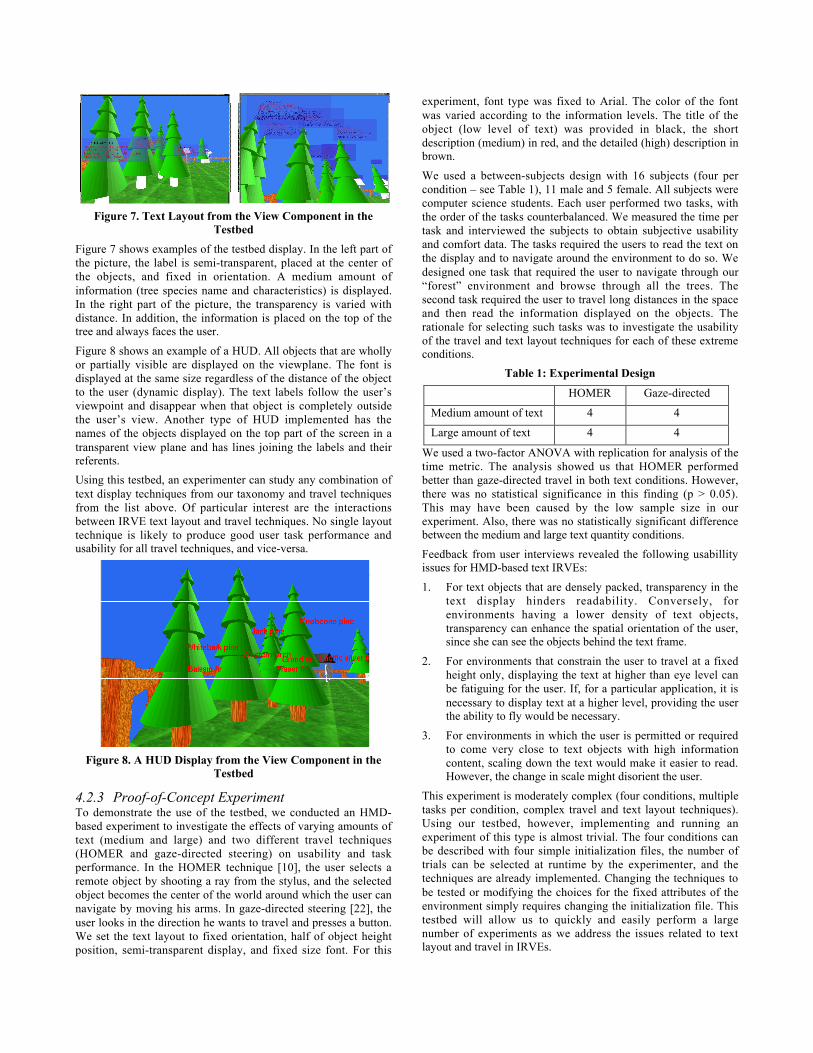
Figure 2. Text Layout from the View Component in theTestbed
Figure 7. Text Layout from the View Component in theTestbed
Figure 7 shows examples of the testbed display. In the left part ofthe picture, the label is semi-transparent, placed at the center ofthe objects, and fixed in orientation. A medium amount ofinformation (tree species name and characteristics) is displayed.In the right part of the picture, the transparency is varied withdistance. In addition, the information is placed on the top of thetree and always faces the user.
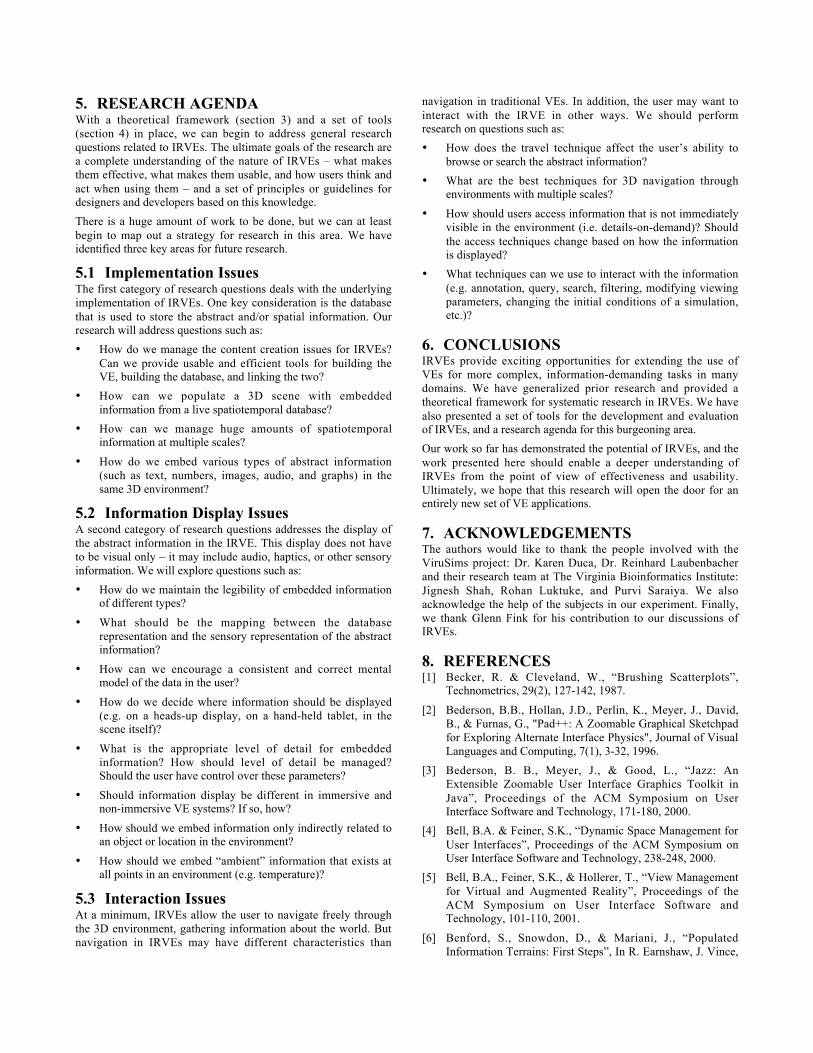
Figure 8 shows an example of a HUD. All objects that are whollyor partially visible are displayed on the viewplane. The font isdisplayed at the same size regardless of the distance of the objectto the user (dynamic display). The text labels follow the user’sviewpoint and disappear when that object is completely outsidethe user’s view. Another type of HUD implemented has thenames of the objects displayed on the top part of the screen in atransparent view plane and has lines joining the labels and theirreferents.
Using this testbed, an experimenter can study any combination oftext display techniques from our taxonomy and travel techniquesfrom the list above. Of particular interest are the interactionsbetween IRVE text layout and travel techniques. No single layouttechnique is likely to produce good user task performance andusability for all travel techniques, and vice-versa.
Figure 3. A HUDDisplay from the ViewComponent in the
Figure 8. A HUD Display from the View Component in theTestbed
4.2.3 Proof-of-Concept ExperimentTo demonstrate the use of the testbed, we conducted an HMD-based experiment to investigate the effects of varying amounts oftext (medium and large) and two different travel techniques(HOMER and gaze-directed steering) on usability and taskperformance. In the HOMER technique [10], the user selects aremote object by shooting a ray from the stylus, and the selectedobject becomes the center of the world around which the user cannavigate by moving his arms. In gaze-directed steering [22], theuser looks in the direction he wants to travel and presses a button.We set the text layout to fixed orientation, half of object heightposition, semi-transparent display, and fixed size font. For this
experiment, font type was fixed to Arial. The color of the fontwas varied according to the information levels. The title of theobject (low level of text) was provided in black, the shortdescription (medium) in red, and the detailed (high) description inbrown.
We used a between-subjects design with 16 subjects (four percondition – see Table 1), 11 male and 5 female. All subjects werecomputer science students. Each user performed two tasks, withthe order of the tasks counterbalanced. We measured the time pertask and interviewed the subjects to obtain subjective usabilityand comfort data. The tasks required the users to read the text onthe display and to navigate around the environment to do so. Wedesigned one task that required the user to navigate through our“forest” environment and browse through all the trees. Thesecond task required the user to travel long distances in the spaceand then read the information displayed on the objects. Therationale for selecting such tasks was to investigate the usabilityof the travel and text layout techniques for each of these extremeconditions.
Table 1: Experimental Design
HOMER Gaze-directed
Medium amount of text 4 4
Large amount of text 4 4
We used a two-factor ANOVA with replication for analysis of thetime metric. The analysis showed us that HOMER performedbetter than gaze-directed travel in both text conditions. However,there was no statistical significance in this finding (p > 0.05).This may have been caused by the low sample size in ourexperiment. Also, there was no statistically significant differencebetween the medium and large text quantity conditions.
Feedback from user interviews revealed the following usabillityissues for HMD-based text IRVEs:
1. For text objects that are densely packed, transparency in thetext display hinders readability. Conversely, forenvironments having a lower density of text objects,transparency can enhance the spatial orientation of the user,since she can see the objects behind the text frame.
2. For environments that constrain the user to travel at a fixedheight only, displaying the text at higher than eye level canbe fatiguing for the user. If, for a particular application, it isnecessary to display text at a higher level, providing the userthe ability to fly would be necessary.
3. For environments in which the user is permitted or requiredto come very close to text objects with high informationcontent, scaling down the text would make it easier to read.However, the change in scale might disorient the user.
This experiment is moderately complex (four conditions, multipletasks per condition, complex travel and text layout techniques).Using our testbed, however, implementing and running anexperiment of this type is almost trivial. The four conditions canbe described with four simple initialization files, the number oftrials can be selected at runtime by the experimenter, and thetechniques are already implemented. Changing the techniques tobe tested or modifying the choices for the fixed attributes of theenvironment simply requires changing the initialization file. Thistestbed will allow us to quickly and easily perform a largenumber of experiments as we address the issues related to textlayout and travel in IRVEs.
5. RESEARCH AGENDAWith a theoretical framework (section 3) and a set of tools(section 4) in place, we can begin to address general researchquestions related to IRVEs. The ultimate goals of the research area complete understanding of the nature of IRVEs – what makesthem effective, what makes them usable, and how users think andact when using them – and a set of principles or guidelines fordesigners and developers based on this knowledge.
There is a huge amount of work to be done, but we can at leastbegin to map out a strategy for research in this area. We haveidentified three key areas for future research.
5.1 Implementation IssuesThe first category of research questions deals with the underlyingimplementation of IRVEs. One key consideration is the databasethat is used to store the abstract and/or spatial information. Ourresearch will address questions such as:
• How do we manage the content creation issues for IRVEs?Can we provide usable and efficient tools for building theVE, building the database, and linking the two?
• How can we populate a 3D scene with embeddedinformation from a live spatiotemporal database?
• How can we manage huge amounts of spatiotemporalinformation at multiple scales?
• How do we embed various types of abstract information(such as text, numbers, images, audio, and graphs) in thesame 3D environment?
5.2 Information Display IssuesA second category of research questions addresses the display ofthe abstract information in the IRVE. This display does not haveto be visual only – it may include audio, haptics, or other sensoryinformation. We will explore questions such as:
• How do we maintain the legibility of embedded informationof different types?
• What should be the mapping between the databaserepresentation and the sensory representation of the abstractinformation?
• How can we encourage a consistent and correct mentalmodel of the data in the user?
• How do we decide where information should be displayed(e.g. on a heads-up display, on a hand-held tablet, in thescene itself)?
• What is the appropriate level of detail for embeddedinformation? How should level of detail be managed?Should the user have control over these parameters?
• Should information display be different in immersive andnon-immersive VE systems? If so, how?
• How should we embed information only indirectly related toan object or location in the environment?
• How should we embed “ambient” information that exists atall points in an environment (e.g. temperature)?
5.3 Interaction IssuesAt a minimum, IRVEs allow the user to navigate freely throughthe 3D environment, gathering information about the world. Butnavigation in IRVEs may have different characteristics than
navigation in traditional VEs. In addition, the user may want tointeract with the IRVE in other ways. We should performresearch on questions such as:
• How does the travel technique affect the user’s ability tobrowse or search the abstract information?
• What are the best techniques for 3D navigation throughenvironments with multiple scales?
• How should users access information that is not immediatelyvisible in the environment (i.e. details-on-demand)? Shouldthe access techniques change based on how the informationis displayed?
• What techniques can we use to interact with the information(e.g. annotation, query, search, filtering, modifying viewingparameters, changing the initial conditions of a simulation,etc.)?
6. CONCLUSIONSIRVEs provide exciting opportunities for extending the use ofVEs for more complex, information-demanding tasks in manydomains. We have generalized prior research and provided atheoretical framework for systematic research in IRVEs. We havealso presented a set of tools for the development and evaluationof IRVEs, and a research agenda for this burgeoning area.
Our work so far has demonstrated the potential of IRVEs, and thework presented here should enable a deeper understanding ofIRVEs from the point of view of effectiveness and usability.Ultimately, we hope that this research will open the door for anentirely new set of VE applications.
7. ACKNOWLEDGEMENTSThe authors would like to thank the people involved with theViruSims project: Dr. Karen Duca, Dr. Reinhard Laubenbacherand their research team at The Virginia Bioinformatics Institute:Jignesh Shah, Rohan Luktuke, and Purvi Saraiya. We alsoacknowledge the help of the subjects in our experiment. Finally,we thank Glenn Fink for his contribution to our discussions ofIRVEs.
8. REFERENCES[1] Becker, R. & Cleveland, W., “Brushing Scatterplots”,
Technometrics, 29(2), 127-142, 1987.
[2] Bederson, B.B., Hollan, J.D., Perlin, K., Meyer, J., David,B., & Furnas, G., "Pad++: A Zoomable Graphical Sketchpadfor Exploring Alternate Interface Physics", Journal of VisualLanguages and Computing, 7(1), 3-32, 1996.
[3] Bederson, B. B., Meyer, J., & Good, L., “Jazz: AnExtensible Zoomable User Interface Graphics Toolkit inJava”, Proceedings of the ACM Symposium on UserInterface Software and Technology, 171-180, 2000.
[4] Bell, B.A. & Feiner, S.K., “Dynamic Space Management forUser Interfaces”, Proceedings of the ACM Symposium onUser Interface Software and Technology, 238-248, 2000.
[5] Bell, B.A., Feiner, S.K., & Hollerer, T., “View Managementfor Virtual and Augmented Reality”, Proceedings of theACM Symposium on User Interface Software andTechnology, 101-110, 2001.
[6] Benford, S., Snowdon, D., & Mariani, J., “PopulatedInformation Terrains: First Steps”, In R. Earnshaw, J. Vince,
& H. Jones (Eds.), Virtual Reality Applications, 27-39,Academic Press, 1995.
[7] Bergman, L., Richardson, J., Richardson, D., & Brooks, F.,“VIEW - An Exploratory Molecular Visualization Systemwith User-Definable Interaction Sequences”, ComputerGraphics (Proceedings of SIGGRAPH 1993), 27, 117-126,1993.
[8] Bolter, J., Hodges, L.F., Meyer, T., & Nichols, A.,“Integrating Perceptual and Symbolic Information in VR”,IEEE Computer Graphics and Applications, 15(4), 8-11,1995.
[9] Bowman, D., “Principles for the Design of Performance-Oriented Interaction Techniques”, In Handbook of VirtualEnvironment, K.M. Stanney (Ed), Lawrence ErlbaumAssociates, 2002.
[10] Bowman, D., & Hodges, L. “An Evaluation of Techniquesfor Grabbing and Manipulating Remote Objects inImmersive Virtual Environments.” Proceedings of the ACMSymposium on Interactive 3D Graphics, 35-38, 1997.
[11] Bowman, D., Hodges, L.F., & Bolter, J., “The VirtualVenue: User-Computer Interaction in an Information-RichVirtual Environment”, Presence: Teleoperators and VirtualEnvironments, 7(5), 478-493, 1998.
[12] Bowman, D., Johnson, D., & Hodges, L.F., “TestbedEvaluation of Virtual Environment Interaction Techniques”,Presence: Teleoperators and Virtual Environments, 10(1),75-95, 2001.
[13] Bowman, D., Wineman, J., Hodges, L., & Allison, D. “TheEducational Value of an Information-Rich VirtualEnvironment.” Presence: Teleoperators and VirtualEnvironments, 8(3), 317-331, 1999.
[14] Bryson, S. & Levit, C., “The Virtual Wind Tunnel”, IEEEComputer Graphics and Applications, 12(4), 25-34, 1992.
[15] Card, S., Mackinlay, J., & Shneiderman, B. (Eds),“Information Visualization: Using Vision to Think”, MorganKaufmann, 1999.
[16] Dede, C., Salzman, M., & Loftin, R., “ScienceSpace: VirtualRealities for Learning Complex and Abstract ScientificConcept”, Proceedings of the Virtual Reality AnnualInternational Symposium, 246-252, 1996.
[17] Fairchild, K.M., Poltrock, S.E., & Furnas, G.W., “Semnet:Three-Dimensional Graphic Representations of LargeKnowledge Bases”, Cognitive Science and its Applicationsfor Human-Computer Interaction, Lawrence ErlbaumAssociates, 201-233, 1988.
[18] Feiner, S., Macintyre, B., Haupt, M., & Solomon, E.“Windows on the World: 2D Windows for 3D AugmentedReality”, Proceedings of the ACM Symposium on UserInterface Software and Technology, 145-155, 1993.
[19] GeoVRML, http://www.geovrml.org (Available May 2003).
[20] Hoellerer, T., Feiner, S., Terauchi, T., Rashid, G., &Hallaway, D., “Exploring MARS: Developing Indoor andOutdoor User Interfaces to a Mobile Augmented RealitySystem.” Computers and Graphics, 23(6), 779-785, 1999.
[21] Kessler, G.D., Bowman, D., & Hodges, L.F., “The SimpleVirtual Environment Library: An Extensible Framework forBuilding VE Applications”. Presence: Teleoperators andVirtual Environments, 9(2), 187-208, 2000.
[22] Mine, M., “Virtual Environment Interaction Techniques.”Technical Report TR95-018, UNC Chapel Hill CS Dept,1995.
[23] North, C., “Multiple Views and Tight Coupling inVisualization: A Language, Taxonomy, and System”, Proc.CSREA CISST Workshop of Fundamental Issues inVisualization, 626-632, 2001.
[24] Paral le l Graphics Cortona VRML browserhttp://www.parallelgraphics.com. (Available May 2003).
[25] Pierce, J.S., Forsberg, A., Conway, M.G., Hong, S.,Zeleznik, R., & Mine, M.R., “Image-Plane InteractionTechniques in 3D Immersive Environments”, Proceedings ofthe ACM Symposium on Interactive 3D Graphics, 39-43,1997.
[26] Reddy, M., Iverson, L., & Leclerc, Y.G., “Under the Hoodof GeoVRML 1.0”, Proceedings of VRML0 Symposium,2000.
[27] Reynolds, C.W., “Flocks, Herds, and Schools: A DistributedBehavioral Model”, Computer Graphics (Proceedings ofSIGGRAPH 1987), 21(4), 25-34, 1987.
[28] Risch, J., May, R., Thomas, J., & Dowson, S., “InteractiveInformation Visualization for Exploratory Intelligence DataAnalysis”, Proceedings of the Virtual Reality AnnualInternational Symposium, 230-238, 1996.
[29] Robertson, G., Card, S., & Mackinlay, J., “InformationVisualization Using 3D Interactive Animation”,Communications of the ACM, 36(4), 57-71, 1993.
[30] Shneiderman, B., “The eyes have it: A task by data typetaxonomy for information visualizations”, Proceedings ofIEEE Visual Languages, 336-343, 1996.
[31] Song, D. & Norman, M., “Cosmic Explorer: A VirtualReality Environment for Exploring Cosmic Data”,Proceedings of the IEEE Symposium on Research Frontiersin Virtual Reality, 75-79, 1993.
[32] S u r v e y o f O p e n G L F o n t T e c h n o l o g y ,http://www.opengl.org/developers/code/features/fontsurvey/(Available May 2003).
[33] Web3D Consortium, http://www.web3d.org; Specifications:http://www.web3d.org/fs_specifications.htm (Available May2003).