Embed Size (px)
Citation preview
Information Retrieval Visualization
CPSC 533c Class Presentation
Qixing Zheng
March 22, 2004
Purpose of Information Retrieval (IR)
“The purpose of information retrieval is to help users effectively access large collections of objects with the goal of satisfying users’ stated information needs.”
-- W. Bruce Croft
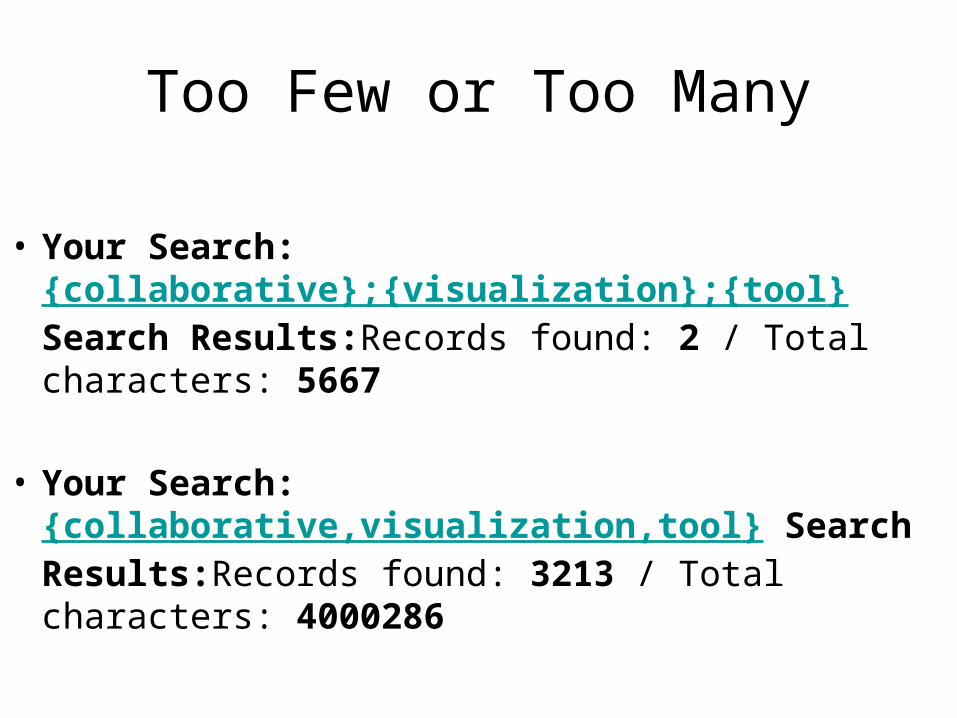
Too Few or Too Many
• Your Search:{collaborative};{visualization};{tool} Search Results:Records found: 2 / Total characters: 5667
• Your Search:{collaborative,visualization,tool} Search Results:Records found: 3213 / Total characters: 4000286
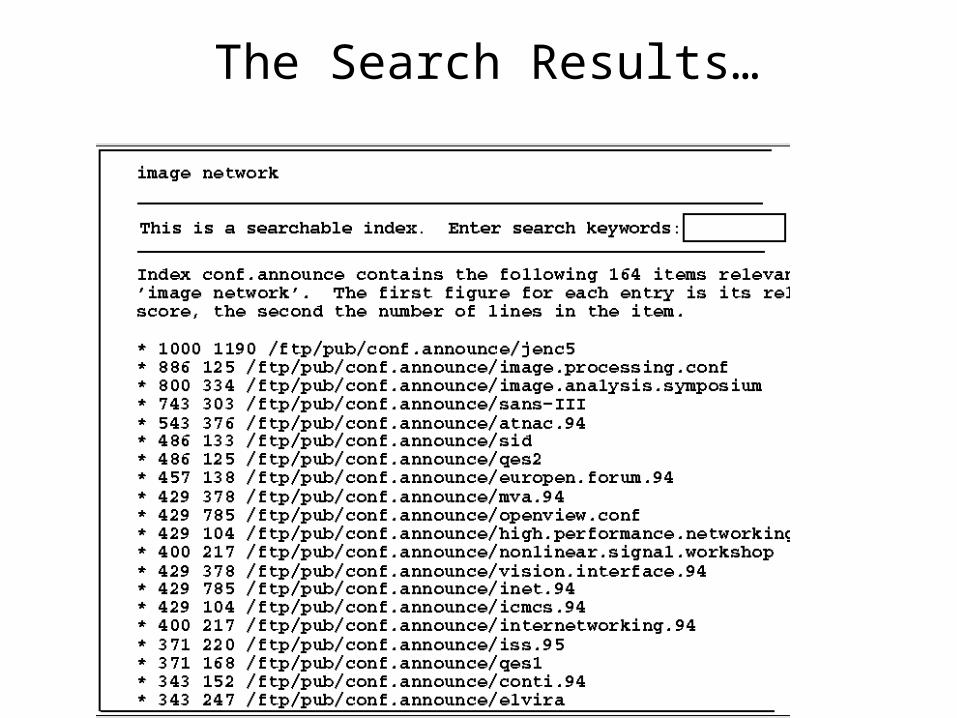
The Search Results…
Outline
• Background on IR
• InfoCrystal (Spoerri, 1993)
• TileBars (Hearst, 1995)
• Evaluation of a Tool for Visualization of Information Retrieval Results (Veerasamy & Belkin, 1996)
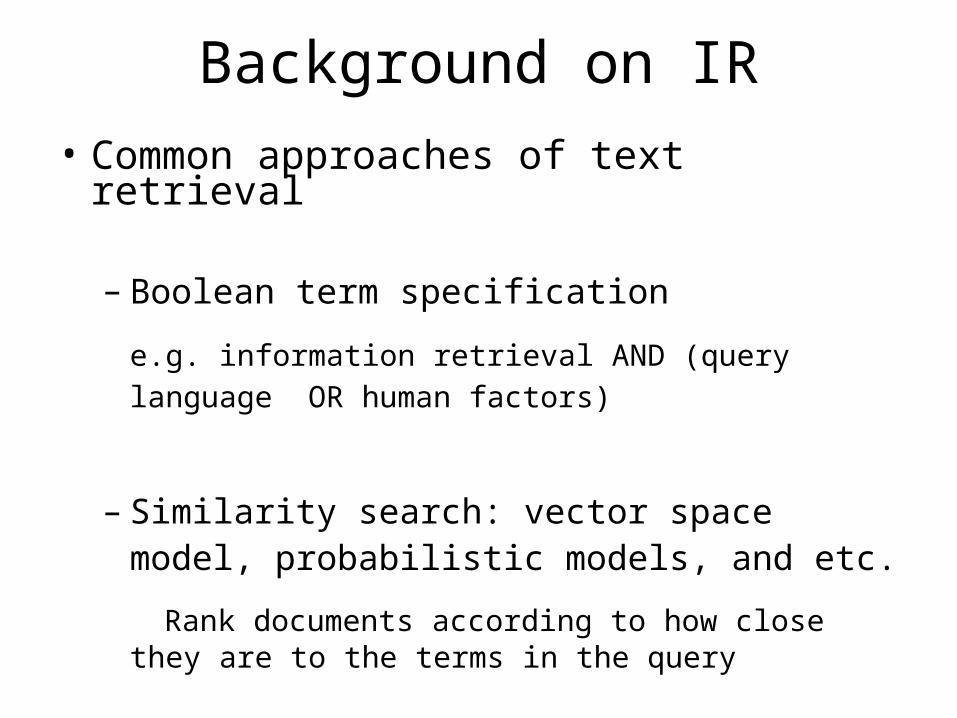
Background on IR
• Common approaches of text retrieval
– Boolean term specification
e.g. information retrieval AND (query language OR
human factors)
– Similarity search: vector space model, probabilistic models, and etc.
Rank documents according to how close they are to the terms in the query
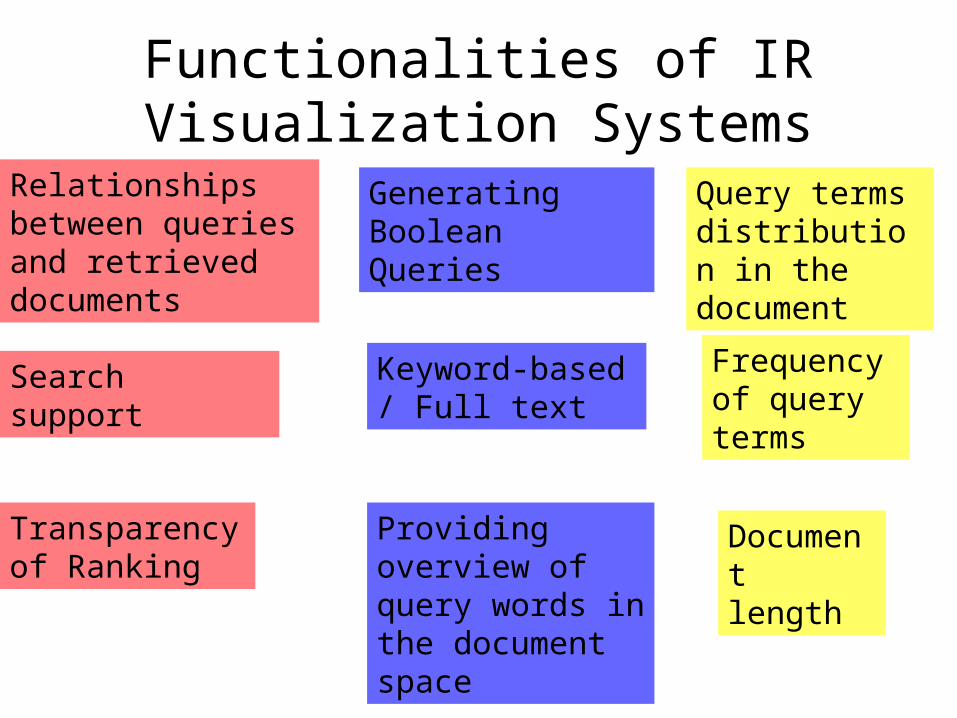
Functionalities of IR Visualization SystemsGenerating Boolean Queries
Keyword-based / Full text
Relationships between queries and retrieved documents
Search support
Providing overview of query words in the document space
Document length
Frequency of query terms
Query terms distribution in the document
Transparency of Ranking

Outline
• Background on IR
• InfoCrystal (Spoerri, 1993)
• TileBars (Hearst, 1995)
• Evaluation of a Tool for Visualization of Information Retrieval Results (Veerasamy & Belkin, 1996)
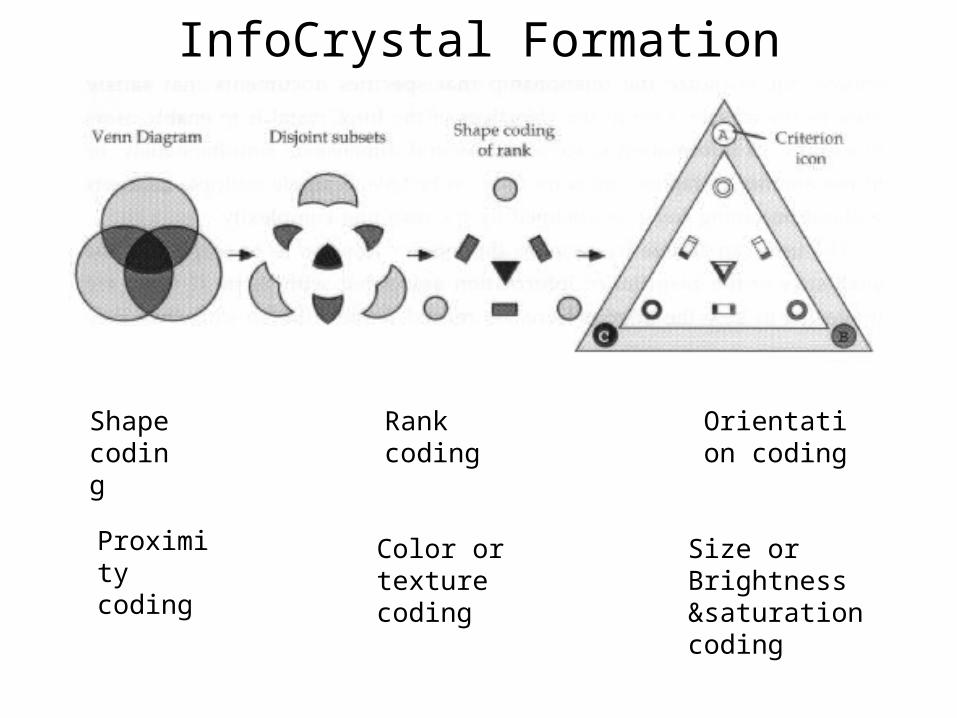
InfoCrystal Formation
Shape coding
Proximity coding
Rank coding
Color or texture coding
Orientation coding
Size or Brightness &saturation coding
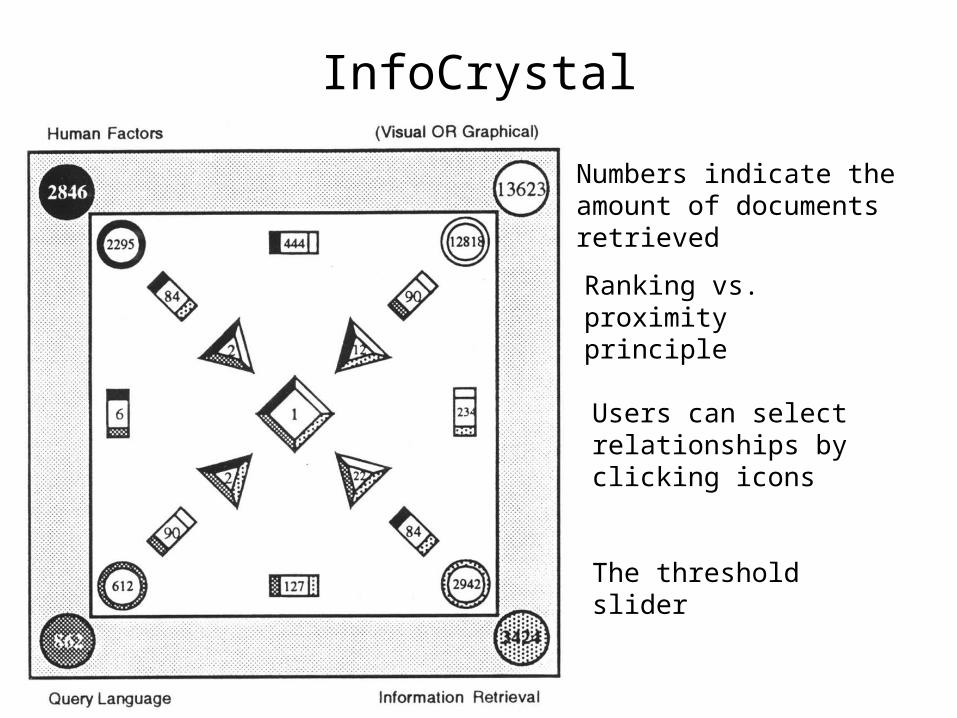
InfoCrystal
Numbers indicate the amount of documents retrieved
Ranking vs. proximity principle
Users can select relationships by clicking icons
The threshold slider
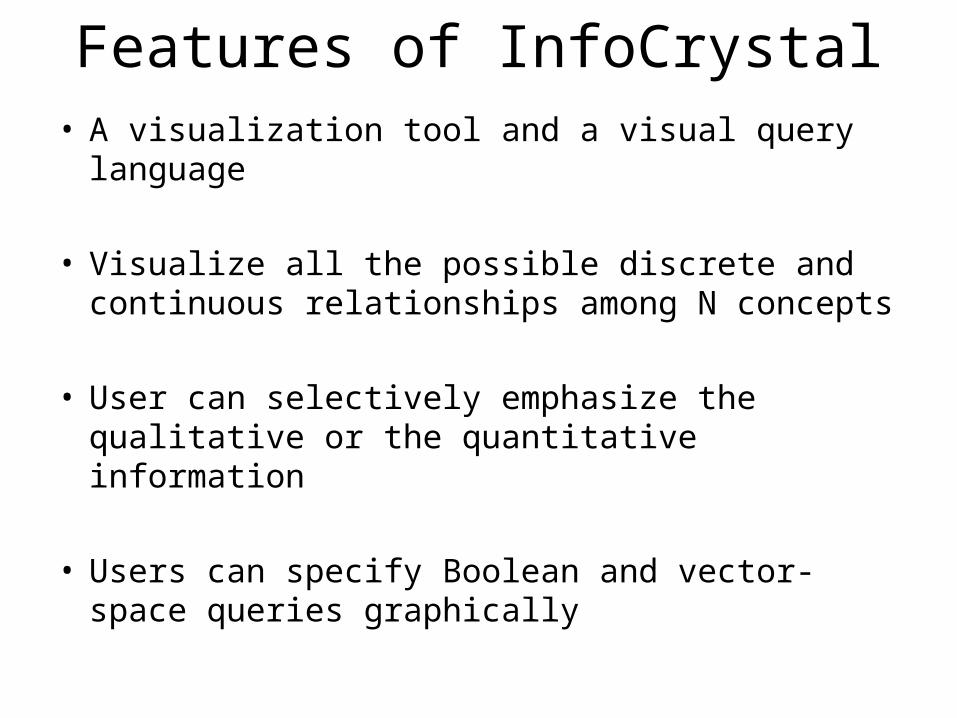
Features of InfoCrystal• A visualization tool and a visual query language
• Visualize all the possible discrete and continuous relationships among N concepts
• User can selectively emphasize the qualitative or the quantitative information
• Users can specify Boolean and vector-space queries graphically
Functionality Check
Generating Boolean Queries
Keyword-based / Full text
Relationships between queries and retrieved documents
Search support
Providing overview of query words in the document space
Document length
Frequency of query terms
Query terms distribution in the document
Transparency of Ranking
Critique
• Pros– Very smart idea
– Nice comparison with relevant previous work
• Cons– No user studies to test
the effectiveness of the visualization
– Concentrate on the short comings all other systems
Outline
• Background on IR
• InfoCrystal (Spoerri, 1993)
• TileBars (Hearst, 1995)
• Evaluation of a Tool for Visualization of Information Retrieval Results (Veerasamy & Belkin, 1996)
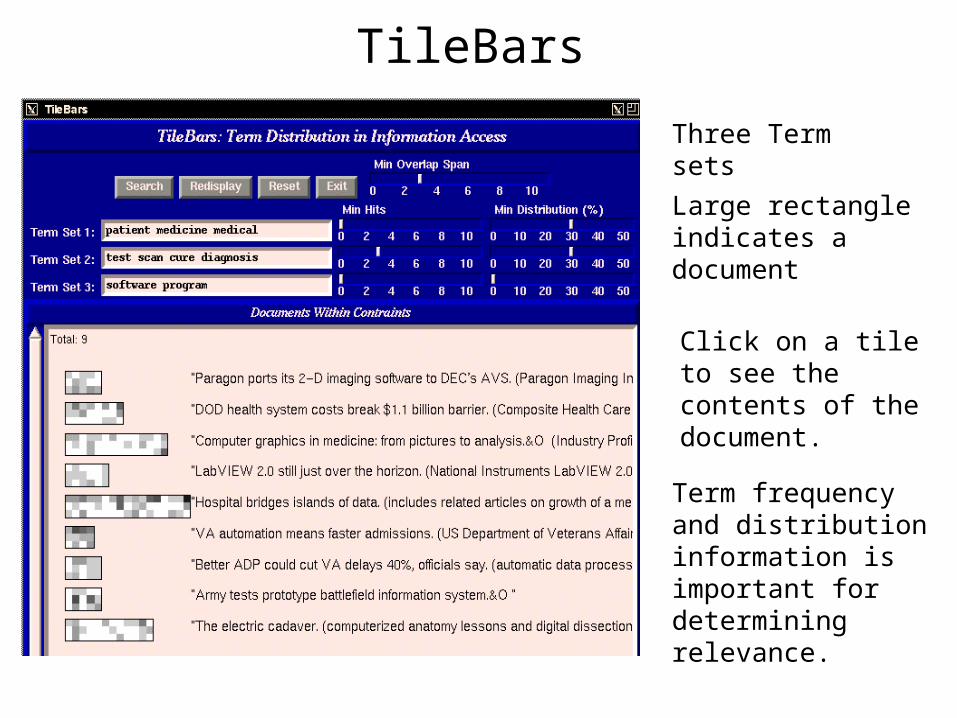
TileBars
Three Term sets
Click on a tile to see the contents of the document.
Term frequency and distribution information is important for determining relevance.
Large rectangle indicates a document
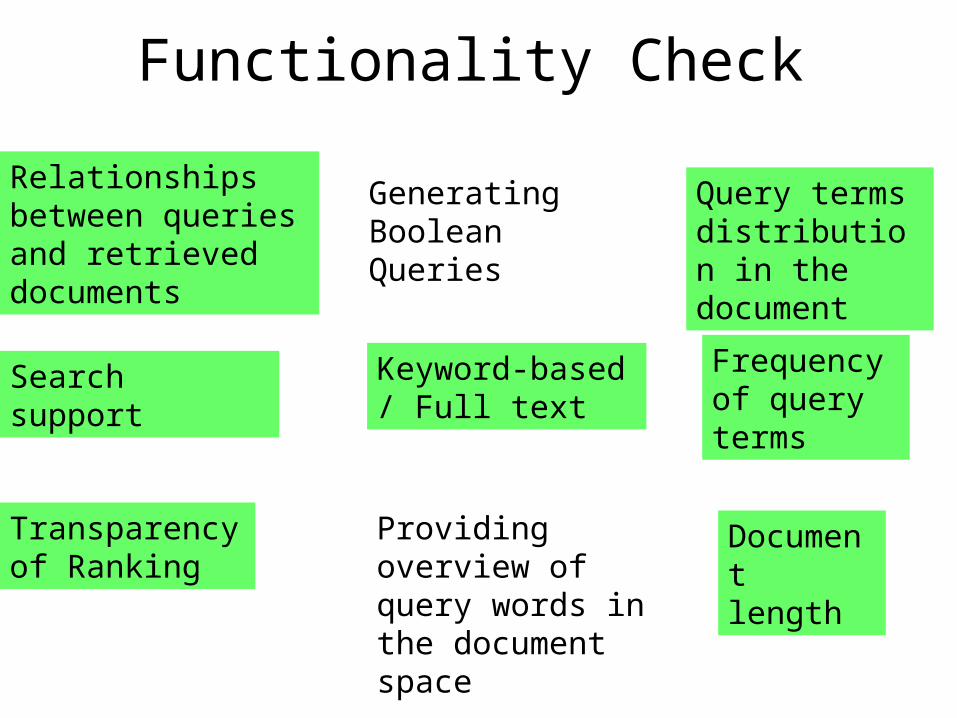
Functionality Check
Generating Boolean Queries
Keyword-based / Full text
Relationships between queries and retrieved documents
Search support
Providing overview of query words in the document space
Document length
Frequency of query terms
Query terms distribution in the document
Transparency of Ranking
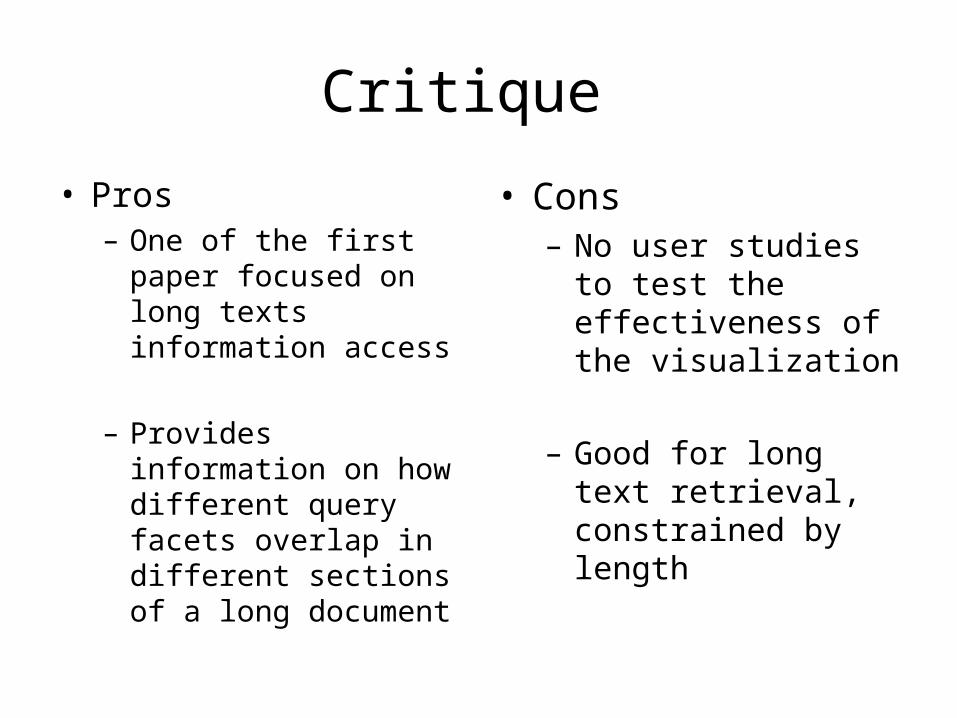
Critique
• Pros– One of the first paper
focused on long texts information access
– Provides information on how different query facets overlap in different sections of a long document
• Cons– No user studies to test
the effectiveness of the visualization
– Good for long text retrieval, constrained by length

Outline
• Background on IR
• InfoCrystal (Spoerri, 1993)
• TileBars (Hearst, 1995)
• Evaluation of a Tool for Visualization of Information Retrieval Results (Veerasamy & Belkin, 1996)
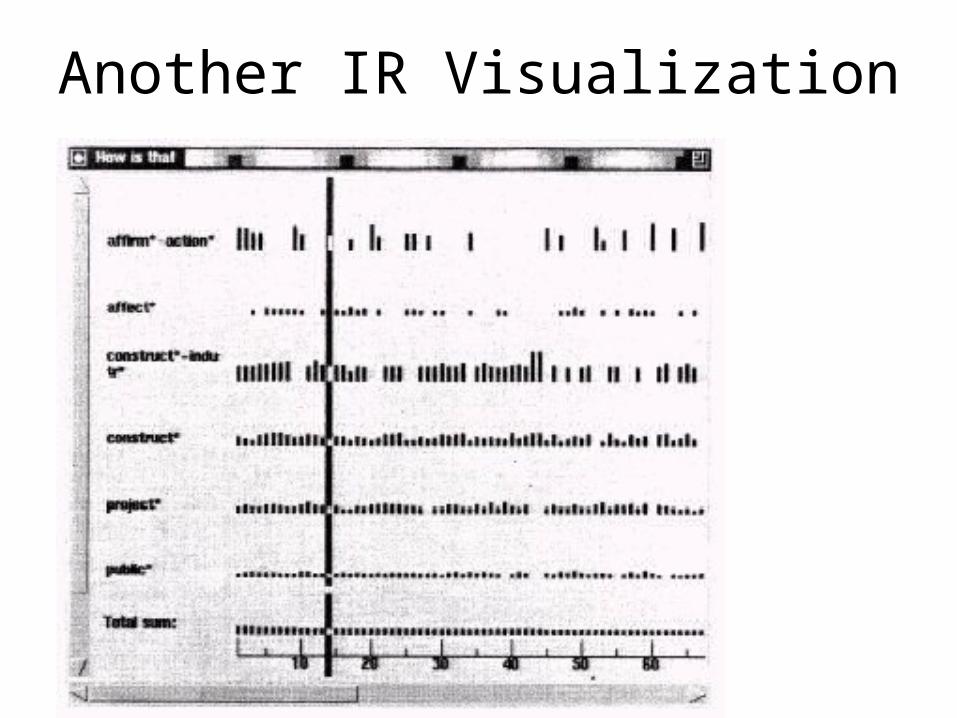
Another IR Visualization
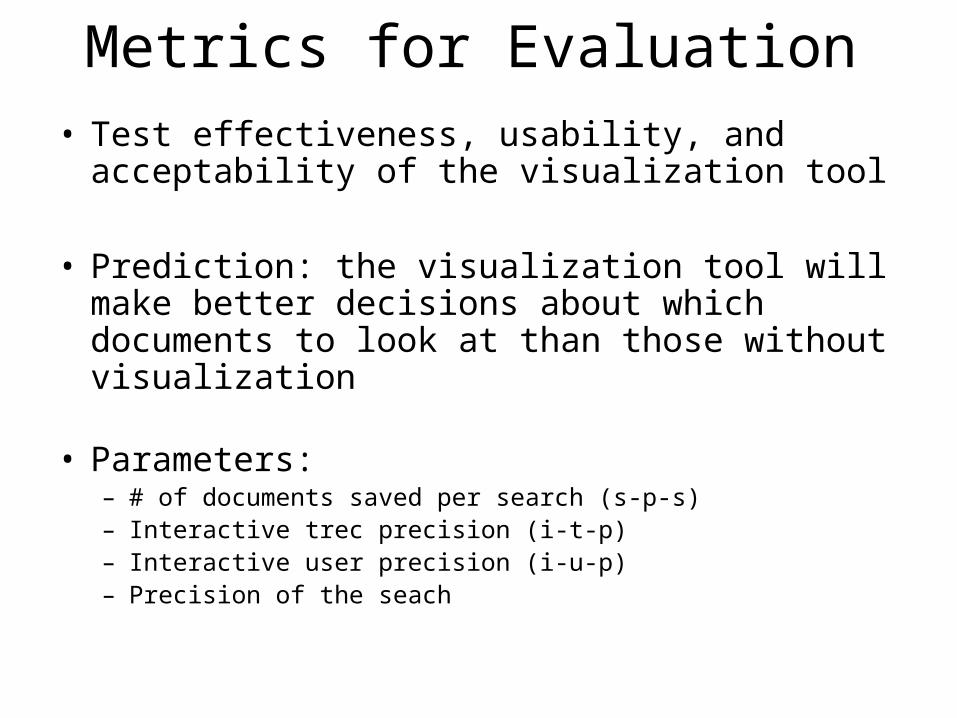
Metrics for Evaluation• Test effectiveness, usability, and acceptability of
the visualization tool
• Prediction: the visualization tool will make better decisions about which documents to look at than those without visualization
• Parameters: – # of documents saved per search (s-p-s)– Interactive trec precision (i-t-p)– Interactive user precision (i-u-p)– Precision of the seach
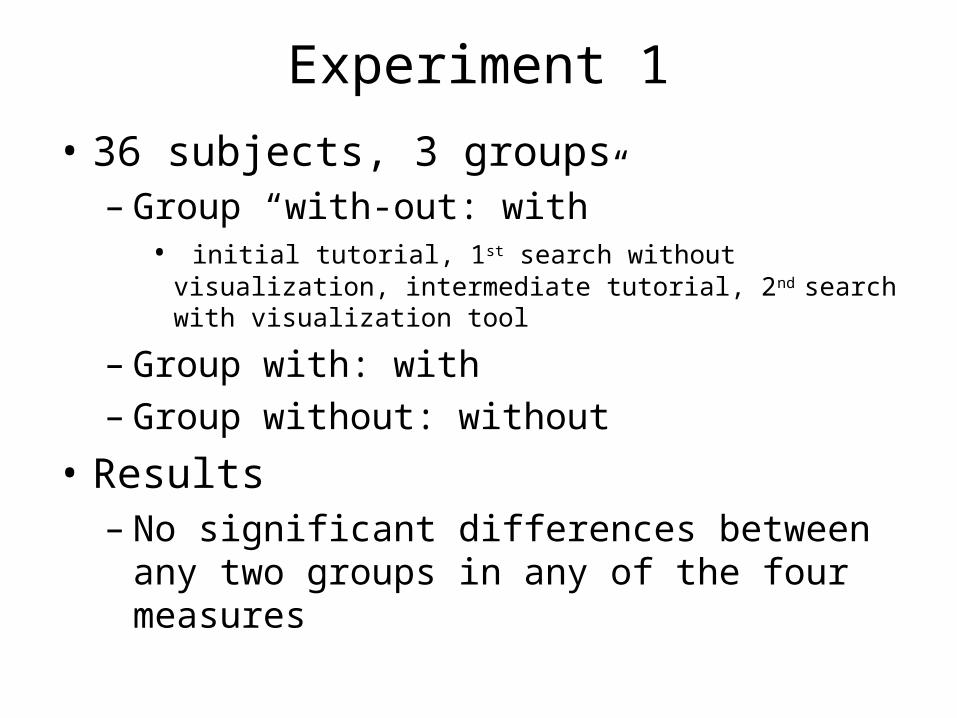
Experiment 1
• 36 subjects, 3 groups– Group “with-out: with”
• initial tutorial, 1st search without visualization, intermediate tutorial, 2nd search with visualization tool
– Group with: with– Group without: without
• Results– No significant differences between any two
groups in any of the four measures
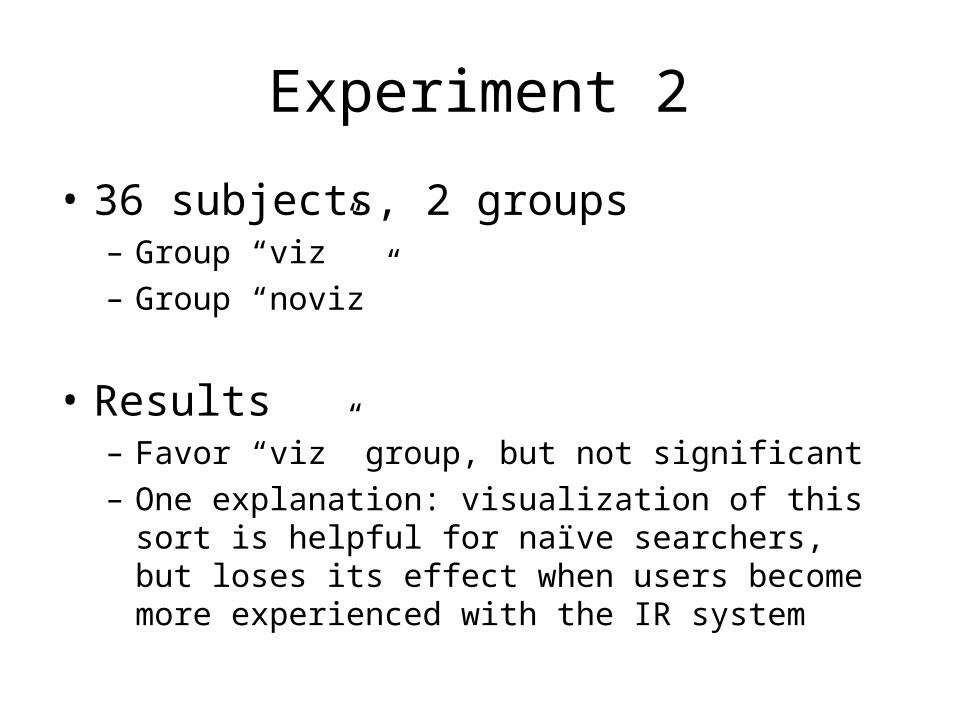
Experiment 2
• 36 subjects, 2 groups– Group “viz”– Group “noviz”
• Results– Favor “viz” group, but not significant– One explanation: visualization of this sort is helpful for
naïve searchers, but loses its effect when users become more experienced with the IR system
Critique
• Pros– Initial attempt to
evaluate visualization tool for IR
– Generate possible metrics for evaluation
• Cons– Many confounds in the
experiment
– No user feedback was reported
– Did not state why the authors decided to choose the particular vis tool to evaluate
Conclusion • How can we use visualization to help us to filter
the huge information collection?
• What are the key features that make a IR visualization useful?
• How can we design better user studies to test these systems?
• Would the combination of IR visualization tools and IR intelligent agents be more powerful, and can assists users better?