Embed Size (px)
Citation preview

Information Produced by Research and Statistics Team
For Adults & Older People
Information Produced by Research and Information Section Community Health and Social Care Directorate
Crompton House
PAF Indicators Performance Family Group Comparison
Report 2005/6
Information Produced by Research and Statistics Team
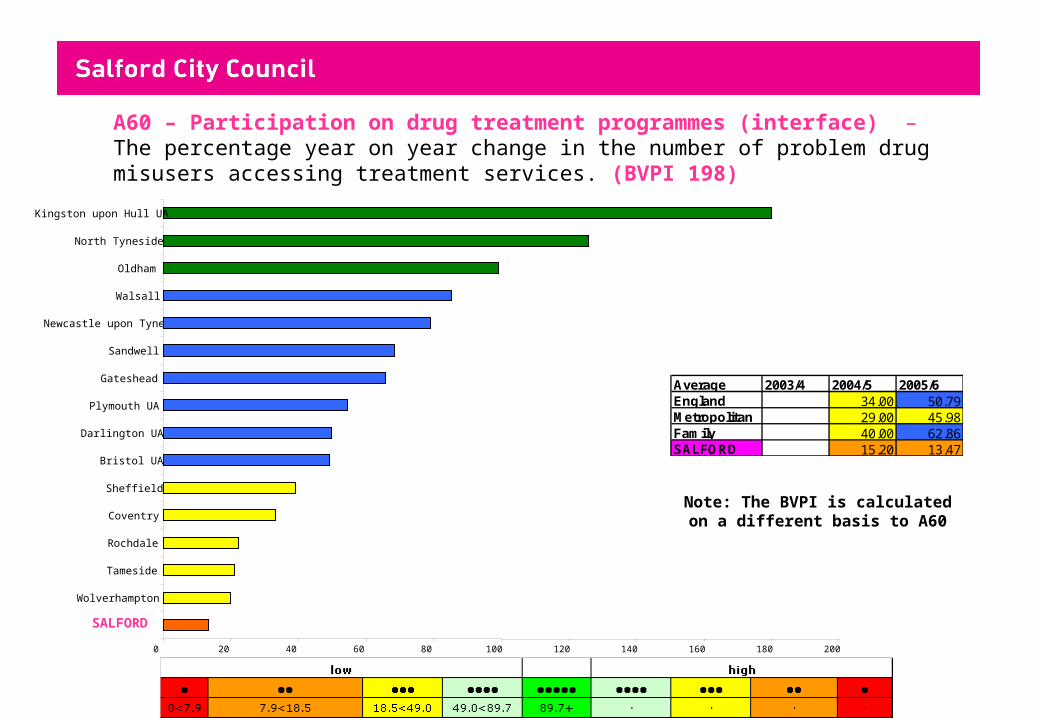
A60 – Participation on drug treatment programmes (interface) – The percentage year on year change in the number of problem drug misusers accessing treatment services. (BVPI 198)
0 20 40 60 80 100 120 140 160 180 200
SALFORD
Wolverhampton
Tameside
Rochdale
Coventry
Sheffield
Bristol UA
Darlington UA
Plymouth UA
Gateshead
Sandwell
Newcastle upon Tyne
Walsall
Oldham
North Tyneside
Kingston upon Hull UA
Average 2003/4 2004/5 2005/6England 34.00 50.79Metropolitan 29.00 45.98Family 40.00 62.86SALFORD 15.20 13.47
Note: The BVPI is calculated on a different basis to A60
Information Produced by Research and Statistics Team
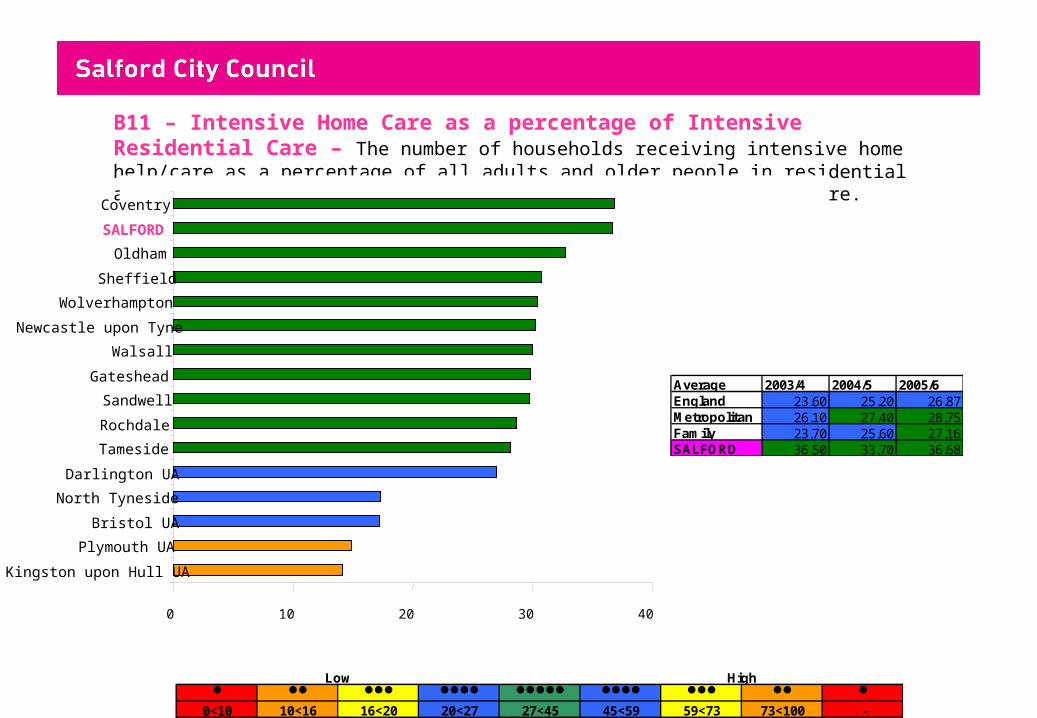
B11 – Intensive Home Care as a percentage of Intensive Residential Care – The number of households receiving intensive home help/care as a percentage of all adults and older people in residential and nursing care and households receiving intensive home help/care.
0<10 10<16 16<20 20<27 27<45 45<59 59<73 73<100 -
Low High
0 10 20 30 40
Kingston upon Hull UA
Plymouth UA
Bristol UA
North Tyneside
Darlington UA
Tameside
Rochdale
Sandwell
Gateshead
Walsall
Newcastle upon Tyne
Wolverhampton
Sheffield
Oldham
SALFORD
Coventry
Average 2003/4 2004/5 2005/6England 23.60 25.20 26.87Metropolitan 26.10 27.40 28.75Family 23.70 25.60 27.16SALFORD 36.50 33.70 36.68
Information Produced by Research and Statistics Team
0 100 200 300 400 500 600 700
Darlington UA
North Tyneside
Tameside
Sheffield
Kingston upon Hull UA
Newcastle upon Tyne
Oldham
Plymouth UA
Walsall
SALFORD
Gateshead
Sandwell
Wolverhampton
Coventry
Bristol UA
Rochdale
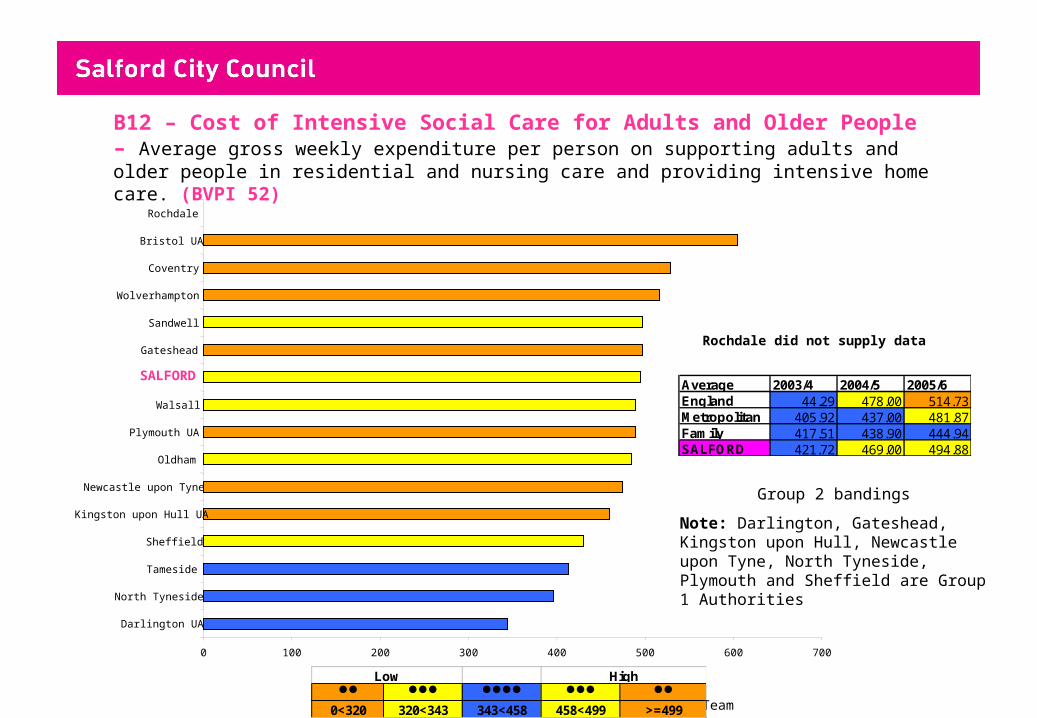
B12 – Cost of Intensive Social Care for Adults and Older People – Average gross weekly expenditure per person on supporting adults and older people in residential and nursing care and providing intensive home care. (BVPI 52)
0<320 320<343 343<458 458<499 >=499
Low High
Rochdale did not supply data
Average 2003/4 2004/5 2005/6England 44.29 478.00 514.73Metropolitan 405.92 437.00 481.87Family 417.51 438.90 444.94SALFORD 421.72 469.00 494.88
Group 2 bandings
Note: Darlington, Gateshead, Kingston upon Hull, Newcastle upon Tyne, North Tyneside, Plymouth and Sheffield are Group 1 Authorities
Information Produced by Research and Statistics Team
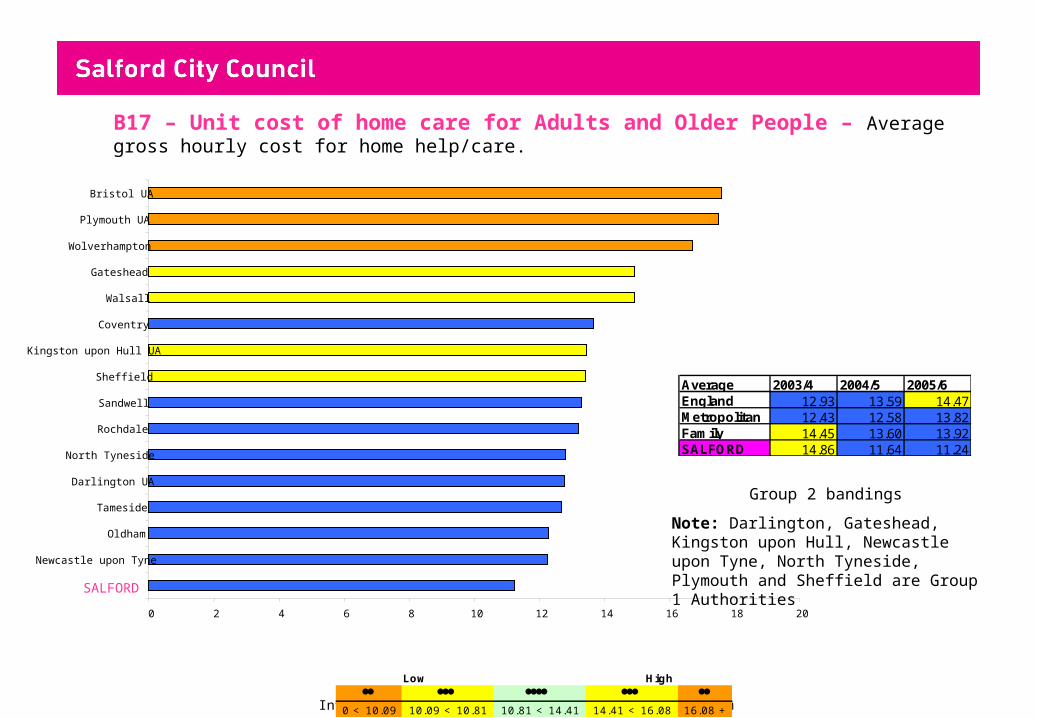
B17 – Unit cost of home care for Adults and Older People – Average gross hourly cost for home help/care.
Low
0 < 10.09 10.09 < 10.81 10.81 < 14.41 14.41 < 16.08 16.08 +
High
0 2 4 6 8 10 12 14 16 18 20
SALFORD
Newcastle upon Tyne
Oldham
Tameside
Darlington UA
North Tyneside
Rochdale
Sandwell
Sheffield
Kingston upon Hull UA
Coventry
Walsall
Gateshead
Wolverhampton
Plymouth UA
Bristol UA
Average 2003/4 2004/5 2005/6England 12.93 13.59 14.47Metropolitan 12.43 12.58 13.82Family 14.45 13.60 13.92SALFORD 14.86 11.64 11.24
Group 2 bandings
Note: Darlington, Gateshead, Kingston upon Hull, Newcastle upon Tyne, North Tyneside, Plymouth and Sheffield are Group 1 Authorities
Information Produced by Research and Statistics Team
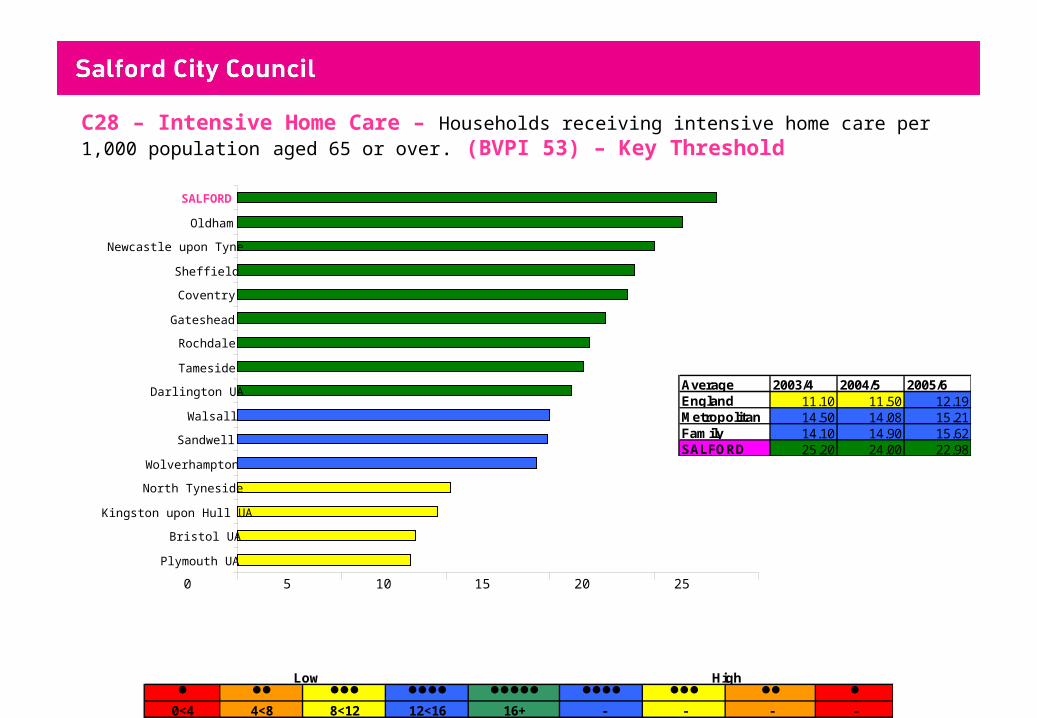
C28 – Intensive Home Care – Households receiving intensive home care per 1,000 population aged 65 or over. (BVPI 53) – Key Threshold
0<4 4<8 8<12 12<16 16+ - - - -
Low High
0 5 10 15 20 25
Plymouth UA
Bristol UA
Kingston upon Hull UA
North Tyneside
Wolverhampton
Sandwell
Walsall
Darlington UA
Tameside
Rochdale
Gateshead
Coventry
Sheffield
Newcastle upon Tyne
Oldham
SALFORD
Average 2003/4 2004/5 2005/6England 11.10 11.50 12.19Metropolitan 14.50 14.08 15.21Family 14.10 14.90 15.62SALFORD 25.20 24.00 22.98
Information Produced by Research and Statistics Team
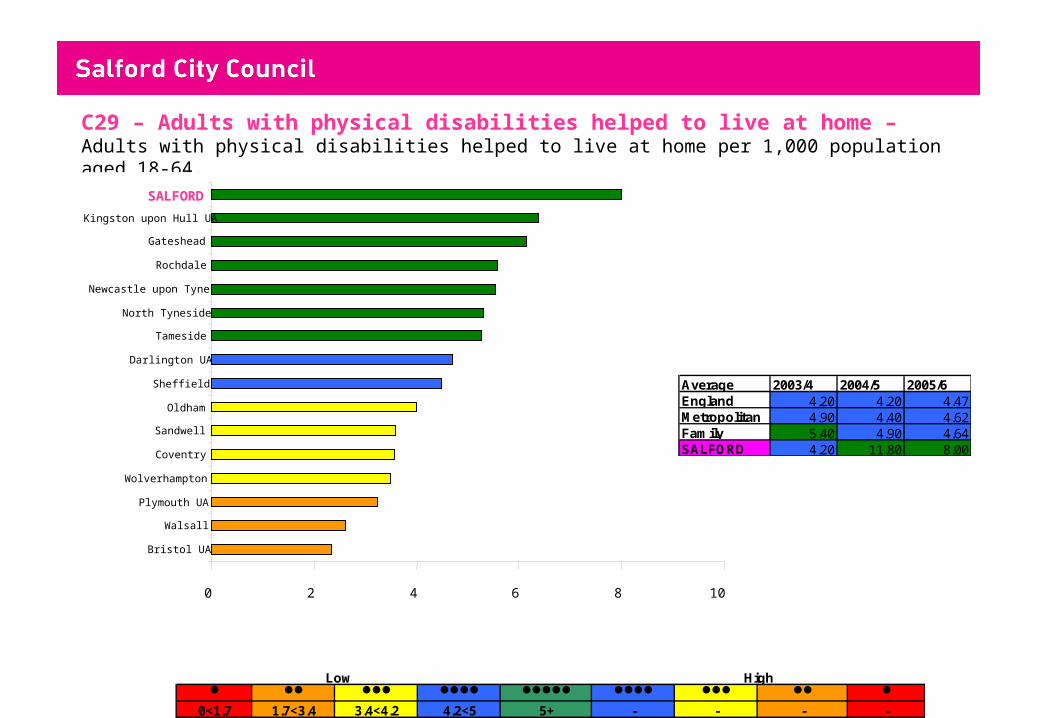
C29 – Adults with physical disabilities helped to live at home – Adults with physical disabilities helped to live at home per 1,000 population aged 18-64.
0<1.7 1.7<3.4 3.4<4.2 4.2<5 5+ - - - -
Low High
0 2 4 6 8 10
Bristol UA
Walsall
Plymouth UA
Wolverhampton
Coventry
Sandwell
Oldham
Sheffield
Darlington UA
Tameside
North Tyneside
Newcastle upon Tyne
Rochdale
Gateshead
Kingston upon Hull UA
SALFORD
Average 2003/4 2004/5 2005/6England 4.20 4.20 4.47Metropolitan 4.90 4.40 4.62Family 5.40 4.90 4.64SALFORD 4.20 11.80 8.00
Information Produced by Research and Statistics Team
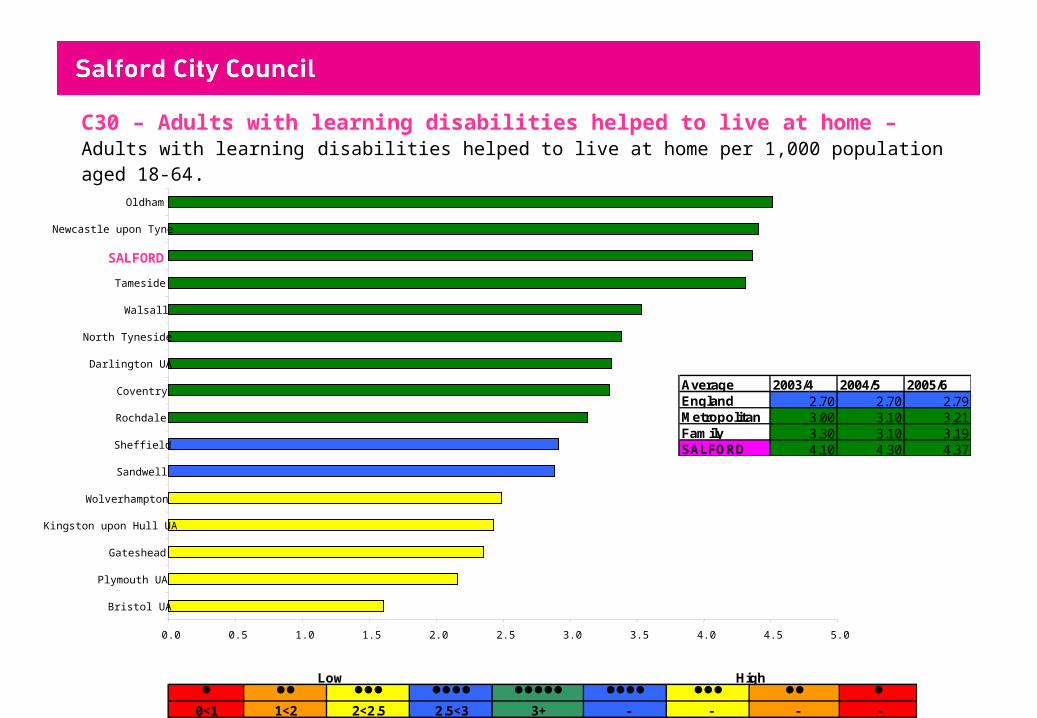
C30 – Adults with learning disabilities helped to live at home – Adults with learning disabilities helped to live at home per 1,000 population aged 18-64.
0<1 1<2 2<2.5 2.5<3 3+ - - - -
Low High
0.0 0.5 1.0 1.5 2.0 2.5 3.0 3.5 4.0 4.5 5.0
Bristol UA
Plymouth UA
Gateshead
Kingston upon Hull UA
Wolverhampton
Sandwell
Sheffield
Rochdale
Coventry
Darlington UA
North Tyneside
Walsall
Tameside
SALFORD
Newcastle upon Tyne
Oldham
Average 2003/4 2004/5 2005/6England 2.70 2.70 2.79Metropolitan 3.00 3.10 3.21Family 3.30 3.10 3.19SALFORD 4.10 4.30 4.37
Information Produced by Research and Statistics Team
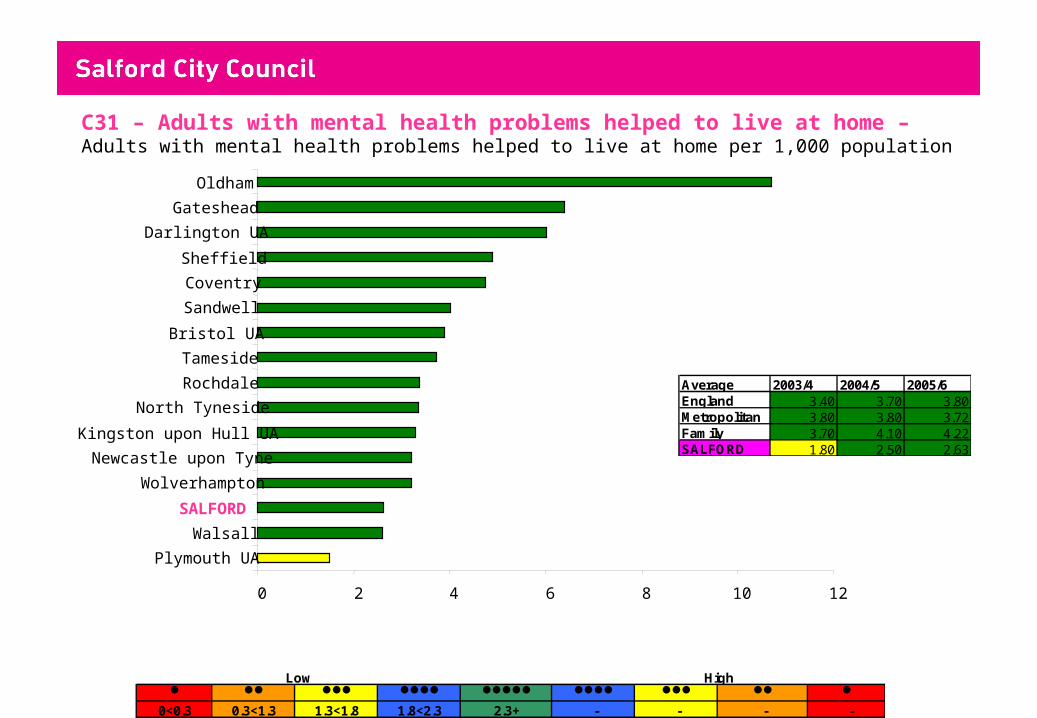
C31 – Adults with mental health problems helped to live at home – Adults with mental health problems helped to live at home per 1,000 population aged 18-64.
0<0.3 0.3<1.3 1.3<1.8 1.8<2.3 2.3+ - - - -
Low High
0 2 4 6 8 10 12
Plymouth UA
Walsall
SALFORD
Wolverhampton
Newcastle upon Tyne
Kingston upon Hull UA
North Tyneside
Rochdale
Tameside
Bristol UA
Sandwell
Coventry
Sheffield
Darlington UA
Gateshead
Oldham
Average 2003/4 2004/5 2005/6England 3.40 3.70 3.80Metropolitan 3.80 3.80 3.72Family 3.70 4.10 4.22SALFORD 1.80 2.50 2.63
Information Produced by Research and Statistics Team
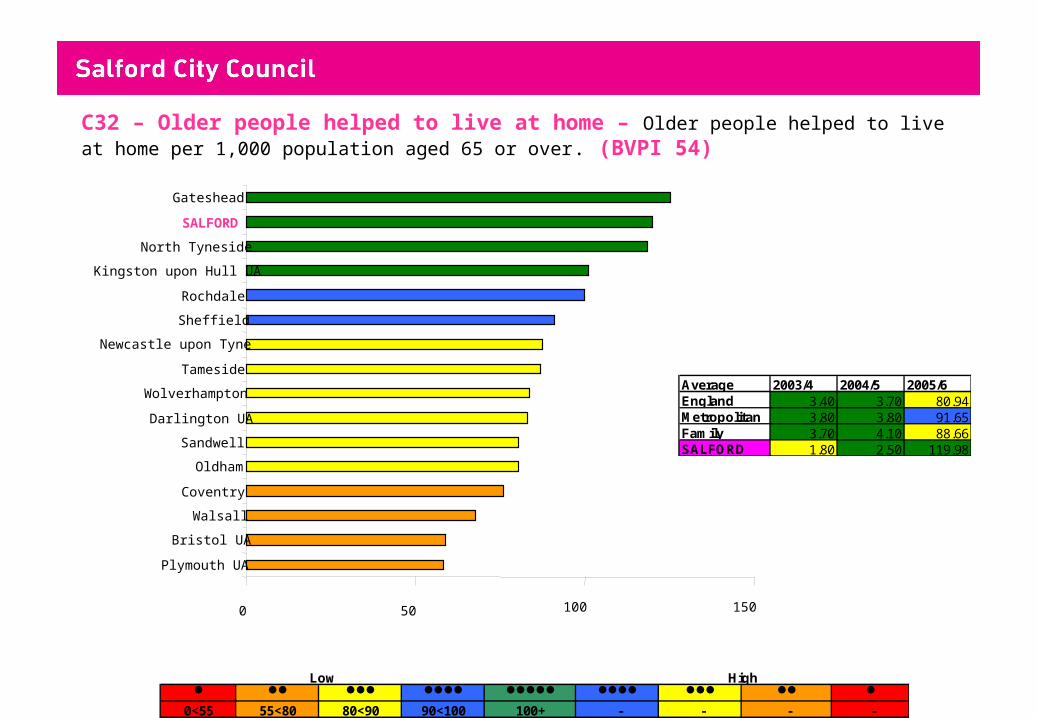
C32 – Older people helped to live at home – Older people helped to live at home per 1,000 population aged 65 or over. (BVPI 54)
0<55 55<80 80<90 90<100 100+ - - - -
Low High
0 50 100 150
Plymouth UA
Bristol UA
Walsall
Coventry
Oldham
Sandwell
Darlington UA
Wolverhampton
Tameside
Newcastle upon Tyne
Sheffield
Rochdale
Kingston upon Hull UA
North Tyneside
SALFORD
Gateshead
Average 2003/4 2004/5 2005/6England 3.40 3.70 80.94Metropolitan 3.80 3.80 91.65Family 3.70 4.10 88.66SALFORD 1.80 2.50 119.98
Information Produced by Research and Statistics Team
0<15 15<30 30<90 90<150 150+ - - - -
Low High
0 50 100 150 200
RochdalePlymouth UA
TamesideBristol UA
WolverhamptonKingston upon Hull
GatesheadNorth Tyneside
WalsallSandwell
Newcastle upon TyneOldham
SALFORDDarlington UA
SheffieldCoventry
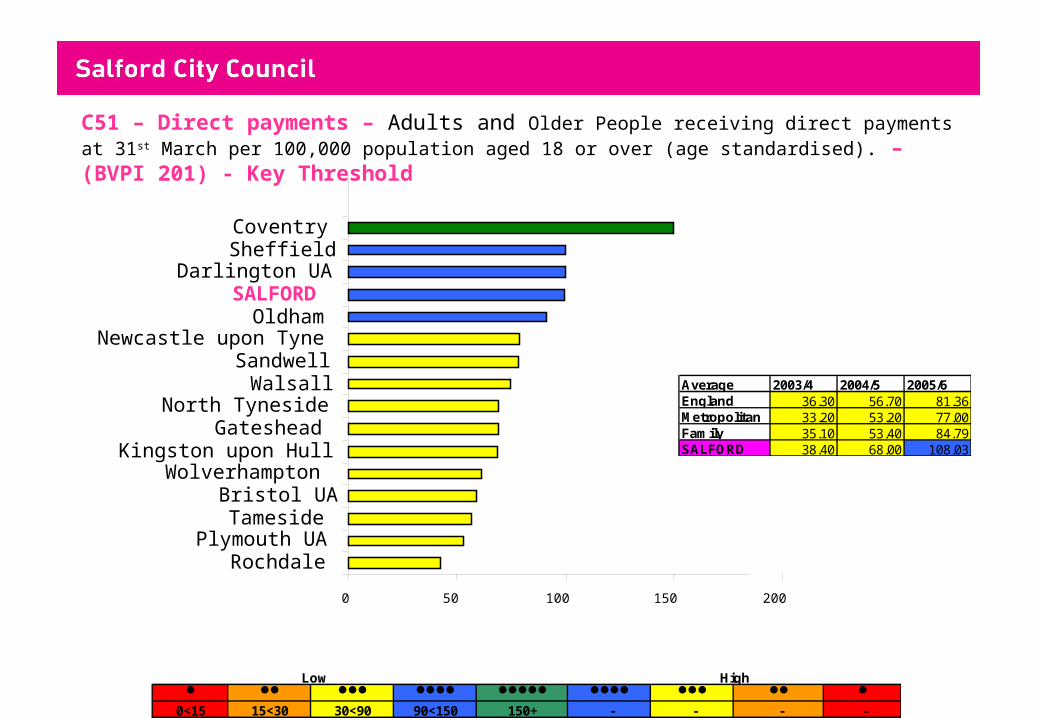
Average 2003/4 2004/5 2005/6England 36.30 56.70 81.36Metropolitan 33.20 53.20 77.00Family 35.10 53.40 84.79SALFORD 38.40 68.00 108.03
C51 – Direct payments – Adults and Older People receiving direct payments at 31st March per 100,000 population aged 18 or over (age standardised). – (BVPI 201) - Key Threshold
Information Produced by Research and Statistics Team
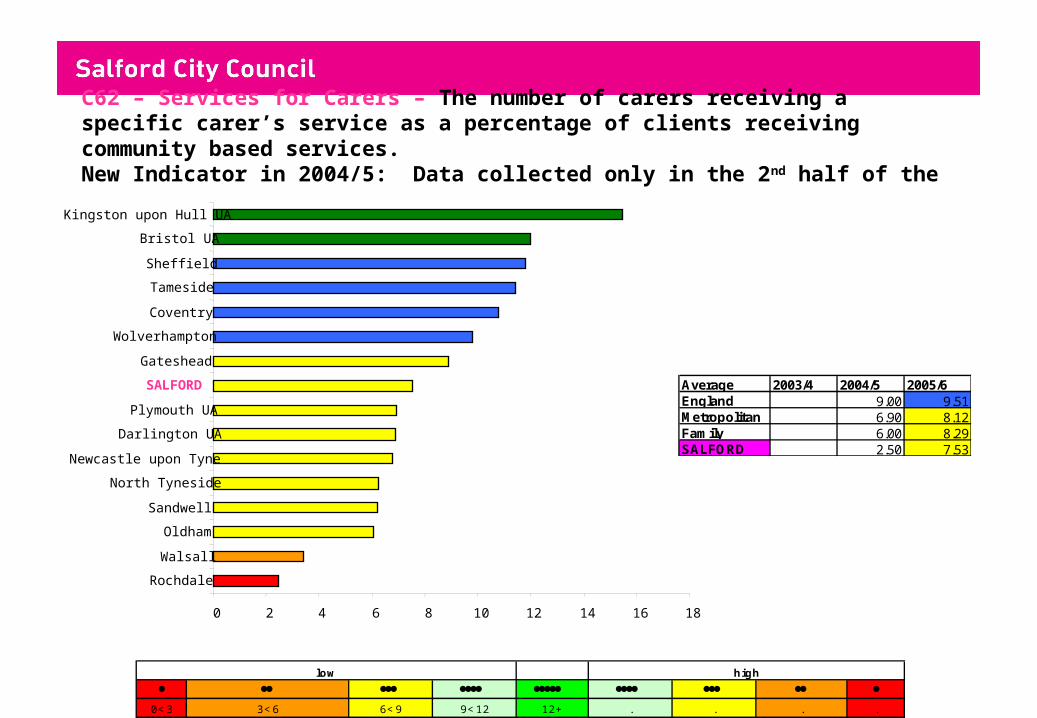
C62 – Services for Carers – The number of carers receiving a specific carer’s service as a percentage of clients receiving community based services.New Indicator in 2004/5: Data collected only in the 2nd half of the year - Unbanded
0 2 4 6 8 10 12 14 16 18
Rochdale
Walsall
Oldham
Sandwell
North Tyneside
Newcastle upon Tyne
Darlington UA
Plymouth UA
SALFORD
Gateshead
Wolverhampton
Coventry
Tameside
Sheffield
Bristol UA
Kingston upon Hull UA
Average 2003/4 2004/5 2005/6England 9.00 9.51Metropolitan 6.90 8.12Family 6.00 8.29SALFORD 2.50 7.53
low high
0<3 3<6 6<9 9<12 12+ . . . .
Information Produced by Research and Statistics Team
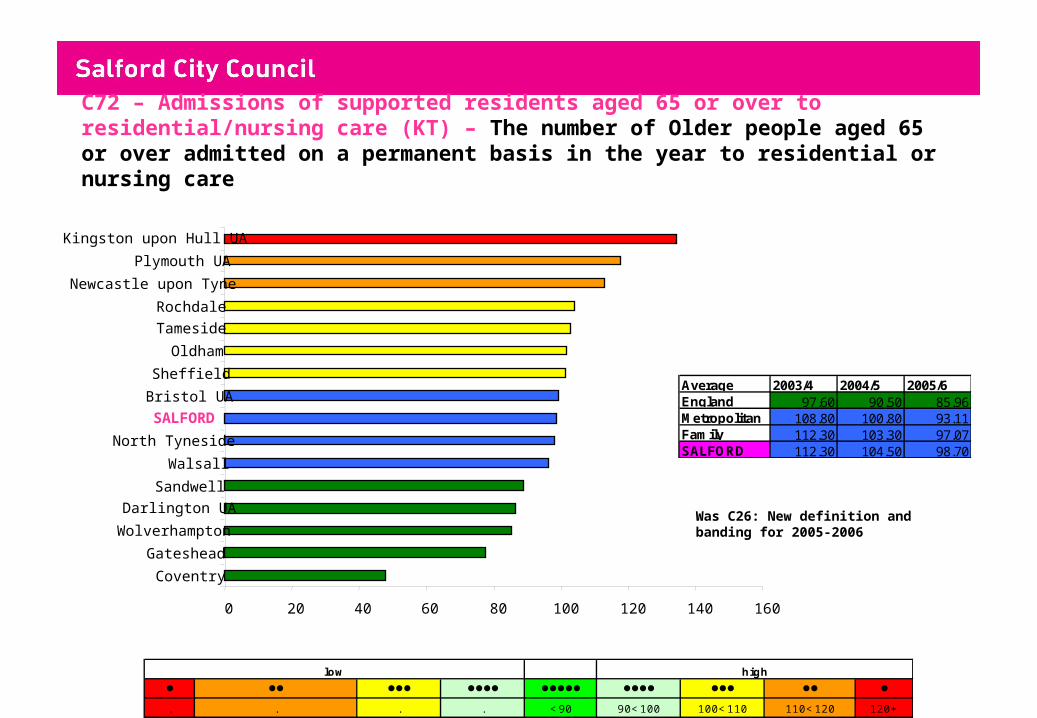
C72 – Admissions of supported residents aged 65 or over to residential/nursing care (KT) – The number of Older people aged 65 or over admitted on a permanent basis in the year to residential or nursing care
low high
. . . . <90 90<100 100<110 110<120 120+
0 20 40 60 80 100 120 140 160
Coventry
Gateshead
Wolverhampton
Darlington UA
Sandwell
Walsall
North Tyneside
SALFORD
Bristol UA
Sheffield
Oldham
Tameside
Rochdale
Newcastle upon Tyne
Plymouth UA
Kingston upon Hull UA
Average 2003/4 2004/5 2005/6England 97.60 90.50 85.96Metropolitan 108.80 100.80 93.11Family 112.30 103.30 97.07SALFORD 112.30 104.50 98.70
Was C26: New definition and banding for 2005-2006
Information Produced by Research and Statistics Team
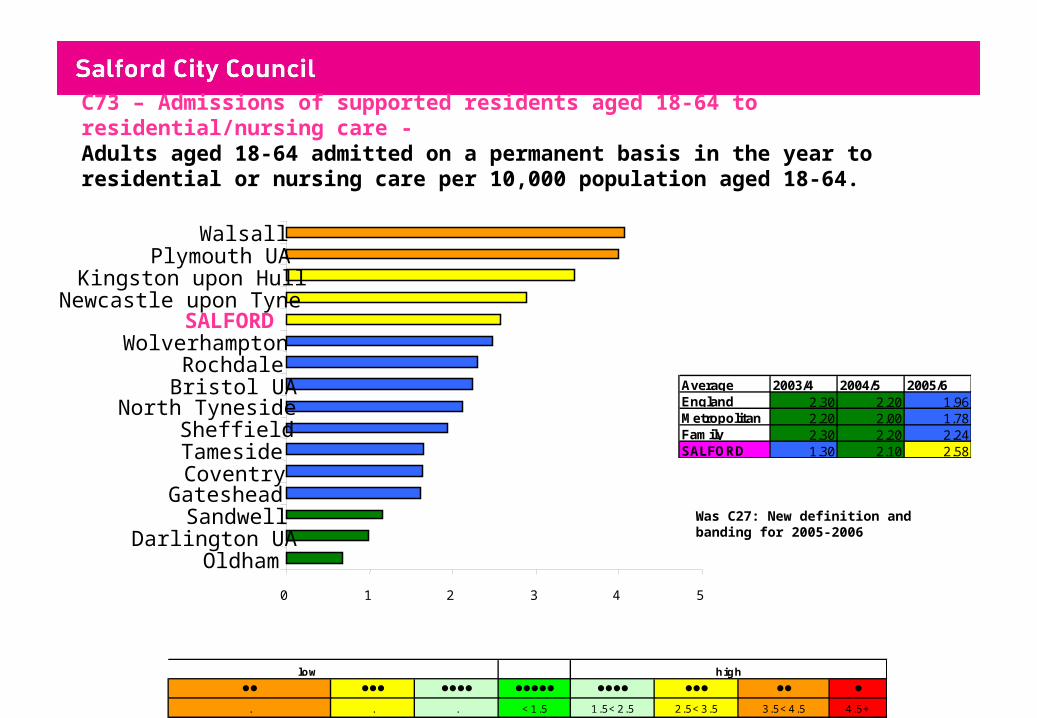
C73 – Admissions of supported residents aged 18-64 to residential/nursing care - Adults aged 18-64 admitted on a permanent basis in the year to residential or nursing care per 10,000 population aged 18-64.
low high
. . . <1.5 1.5<2.5 2.5<3.5 3.5<4.5 4.5+
0 1 2 3 4 5
OldhamDarlington UA
SandwellGateshead
CoventryTamesideSheffield
North TynesideBristol UARochdale
WolverhamptonSALFORD
Newcastle upon TyneKingston upon Hull
Plymouth UAWalsall
Average 2003/4 2004/5 2005/6England 2.30 2.20 1.96Metropolitan 2.20 2.00 1.78Family 2.30 2.20 2.24SALFORD 1.30 2.10 2.58
Was C27: New definition and banding for 2005-2006
Information Produced by Research and Statistics Team
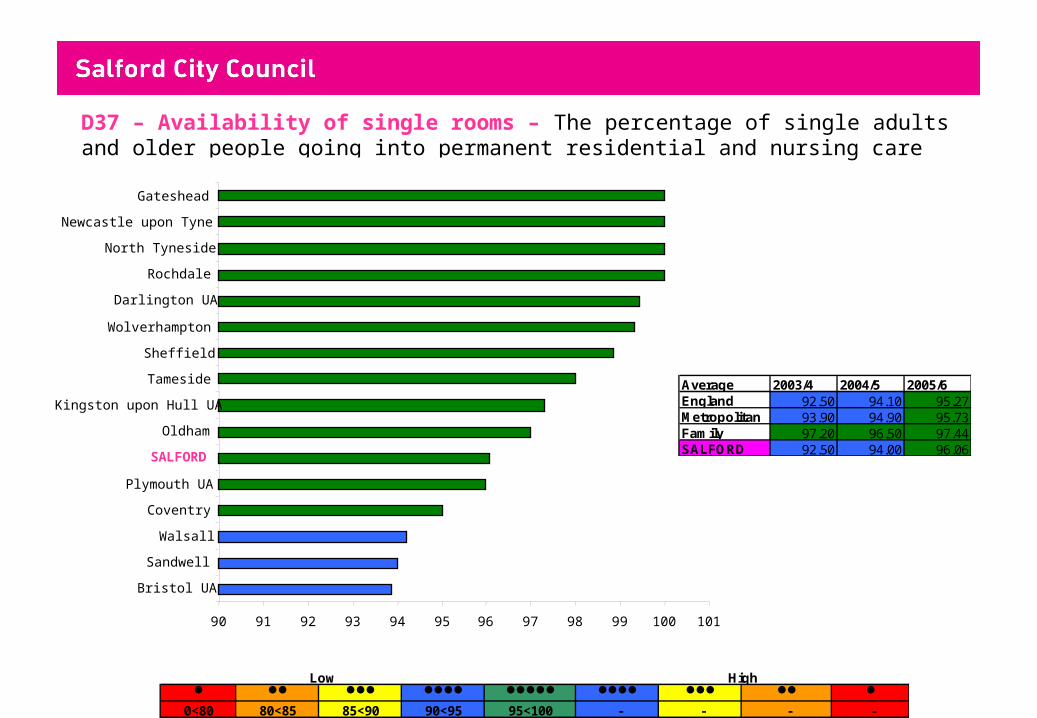
D37 – Availability of single rooms – The percentage of single adults and older people going into permanent residential and nursing care who were allocated single rooms.
0<80 80<85 85<90 90<95 95<100 - - - -
Low High
90 91 92 93 94 95 96 97 98 99 100 101
Bristol UA
Sandwell
Walsall
Coventry
Plymouth UA
SALFORD
Oldham
Kingston upon Hull UA
Tameside
Sheffield
Wolverhampton
Darlington UA
Rochdale
North Tyneside
Newcastle upon Tyne
Gateshead
Average 2003/4 2004/5 2005/6England 92.50 94.10 95.27Metropolitan 93.90 94.90 95.73Family 97.20 96.50 97.44SALFORD 92.50 94.00 96.06
Information Produced by Research and Statistics Team
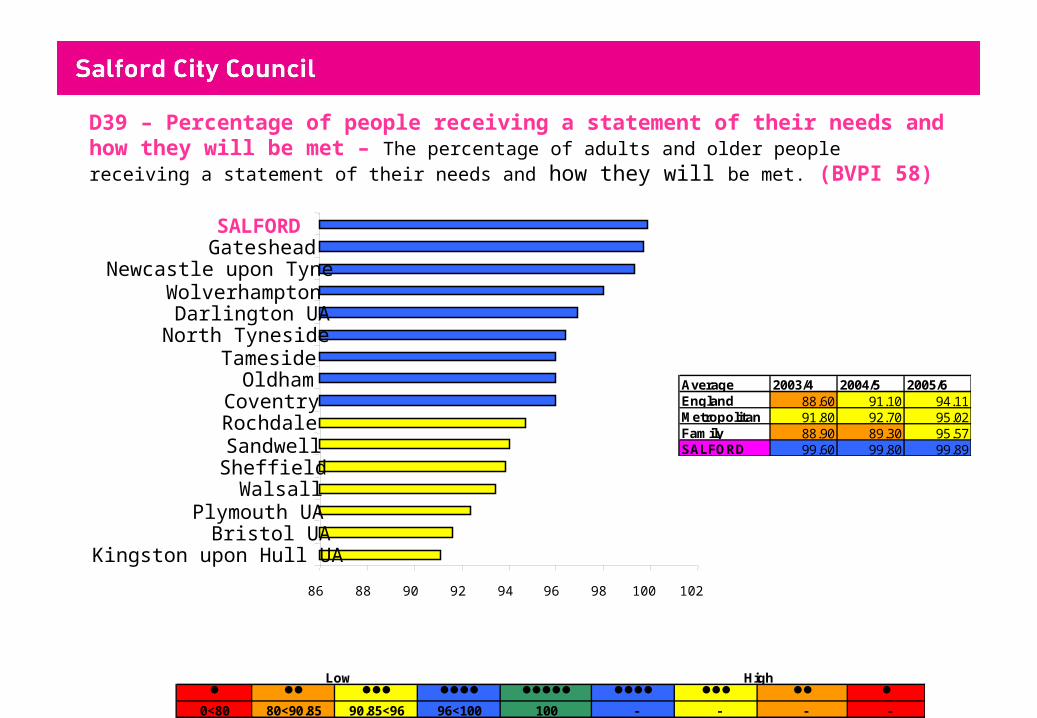
D39 – Percentage of people receiving a statement of their needs and how they will be met – The percentage of adults and older people receiving a statement of their needs and how they will be met. (BVPI 58)
0<80 80<90.85 90.85<96 96<100 100 - - - -
Low High
86 88 90 92 94 96 98 100 102
Kingston upon Hull UABristol UA
Plymouth UAWalsall
SheffieldSandwell
RochdaleCoventry
OldhamTameside
North TynesideDarlington UA
WolverhamptonNewcastle upon Tyne
GatesheadSALFORD
Average 2003/4 2004/5 2005/6England 88.60 91.10 94.11Metropolitan 91.80 92.70 95.02Family 88.90 89.30 95.57SALFORD 99.60 99.80 99.89
Information Produced by Research and Statistics Team
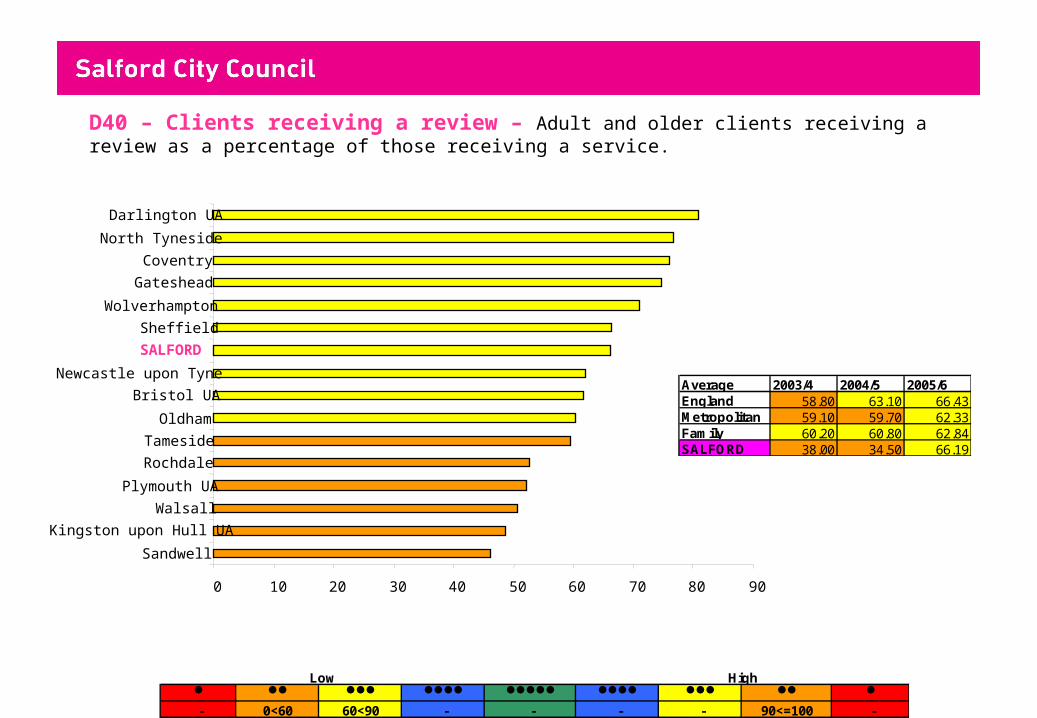
D40 – Clients receiving a review – Adult and older clients receiving a review as a percentage of those receiving a service.
- 0<60 60<90 - - - - 90<=100 -
Low High
0 10 20 30 40 50 60 70 80 90
Sandwell
Kingston upon Hull UA
Walsall
Plymouth UA
Rochdale
Tameside
Oldham
Bristol UA
Newcastle upon Tyne
SALFORD
Sheffield
Wolverhampton
Gateshead
Coventry
North Tyneside
Darlington UA
Average 2003/4 2004/5 2005/6England 58.80 63.10 66.43Metropolitan 59.10 59.70 62.33Family 60.20 60.80 62.84SALFORD 38.00 34.50 66.19
Information Produced by Research and Statistics Team
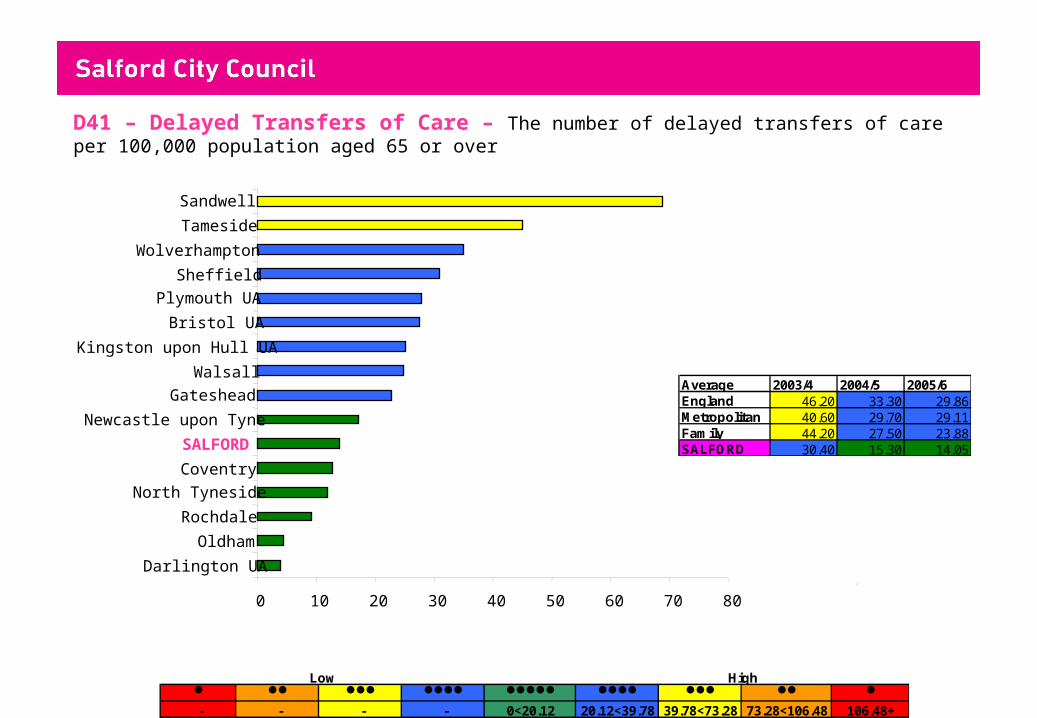
D41 – Delayed Transfers of Care – The number of delayed transfers of care per 100,000 population aged 65 or over
- - - - 0<20.12 20.12<39.78 39.78<73.28 73.28<106.48 106.48+
Low High
0 10 20 30 40 50 60 70 80
Darlington UA
Oldham
Rochdale
North Tyneside
Coventry
SALFORD
Newcastle upon Tyne
Gateshead
Walsall
Kingston upon Hull UA
Bristol UA
Plymouth UA
Sheffield
Wolverhampton
Tameside
Sandwell
Average 2003/4 2004/5 2005/6England 46.20 33.30 29.86Metropolitan 40.60 29.70 29.11Family 44.20 27.50 23.88SALFORD 30.40 15.30 14.05

Information Produced by Research and Statistics Team
D52 – Older people home care user survey - satisfaction with services – Percentage of respondents to older people receiving home care survey claiming they were 'extremely satisfied' or 'very satisfied' with help form Social Services in their own home
- - - - 0<20.12 20.12<39.78 39.78<73.28 73.28<106.48 106.48+
Low High
0 10 20 30 40 50 60 70 80
Darlington UA
Oldham
Rochdale
North Tyneside
Coventry
SALFORD
Newcastle upon Tyne
Gateshead
Walsall
Kingston upon Hull UA
Bristol UA
Plymouth UA
Sheffield
Wolverhampton
Tameside
Sandwell
Average 2003/4 2004/5 2005/6England 46.20 33.30 29.86Metropolitan 40.60 29.70 29.11Family 44.20 27.50 23.88SALFORD 30.40 15.30 14.05
Information Produced by Research and Statistics Team
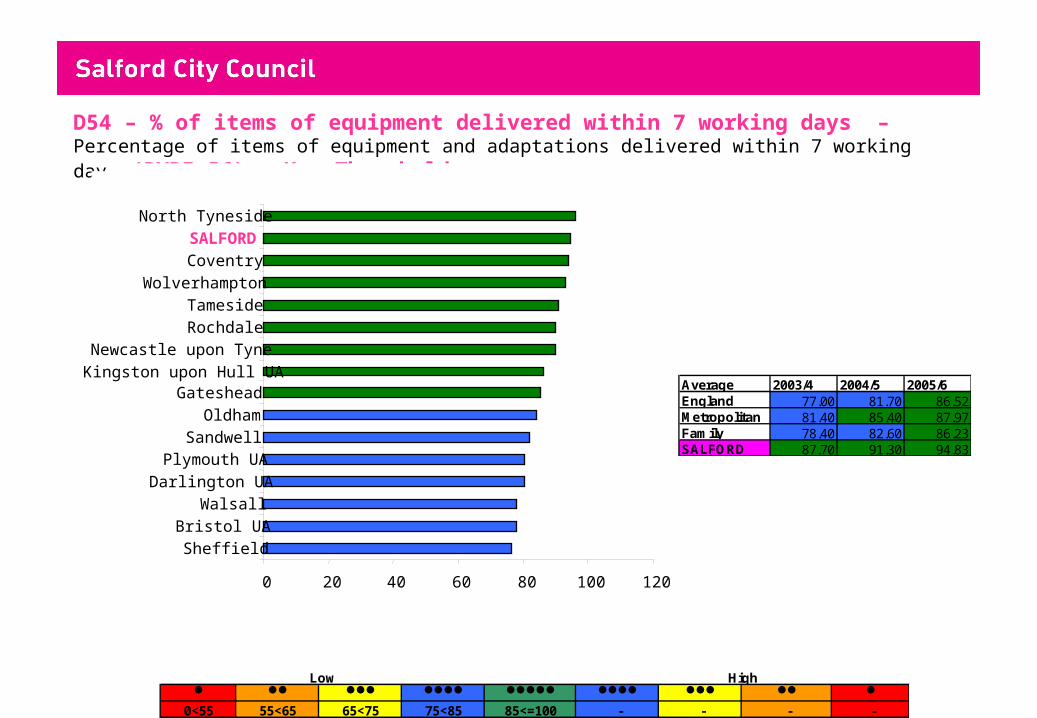
D54 – % of items of equipment delivered within 7 working days – Percentage of items of equipment and adaptations delivered within 7 working days (BVPI 56) – Key Threshold
0<55 55<65 65<75 75<85 85<=100 - - - -
Low High
0 20 40 60 80 100 120
Sheffield
Bristol UA
Walsall
Darlington UA
Plymouth UASandwell
Oldham
GatesheadKingston upon Hull UA
Newcastle upon Tyne
RochdaleTameside
Wolverhampton
Coventry
SALFORD
North Tyneside
Average 2003/4 2004/5 2005/6England 77.00 81.70 86.52Metropolitan 81.40 85.40 87.97Family 78.40 82.60 86.23SALFORD 87.70 91.30 94.83
Information Produced by Research and Statistics Team
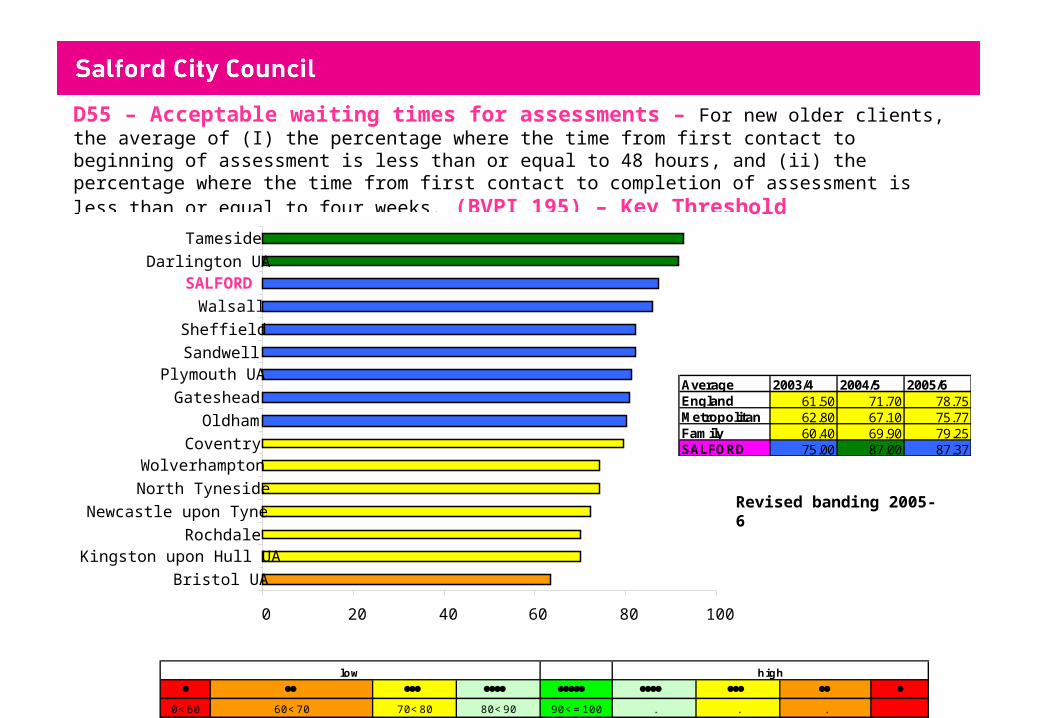
D55 – Acceptable waiting times for assessments – For new older clients, the average of (I) the percentage where the time from first contact to beginning of assessment is less than or equal to 48 hours, and (ii) the percentage where the time from first contact to completion of assessment is less than or equal to four weeks. (BVPI 195) – Key Threshold
0 20 40 60 80 100
Bristol UA
Kingston upon Hull UARochdale
Newcastle upon Tyne
North Tyneside
WolverhamptonCoventry
Oldham
Gateshead
Plymouth UASandwell
Sheffield
Walsall
SALFORDDarlington UA
Tameside
Average 2003/4 2004/5 2005/6England 61.50 71.70 78.75Metropolitan 62.80 67.10 75.77Family 60.40 69.90 79.25SALFORD 75.00 87.00 87.37
low high
0<60 60<70 70<80 80<90 90<=100 . . . .
Revised banding 2005-6
Information Produced by Research and Statistics Team
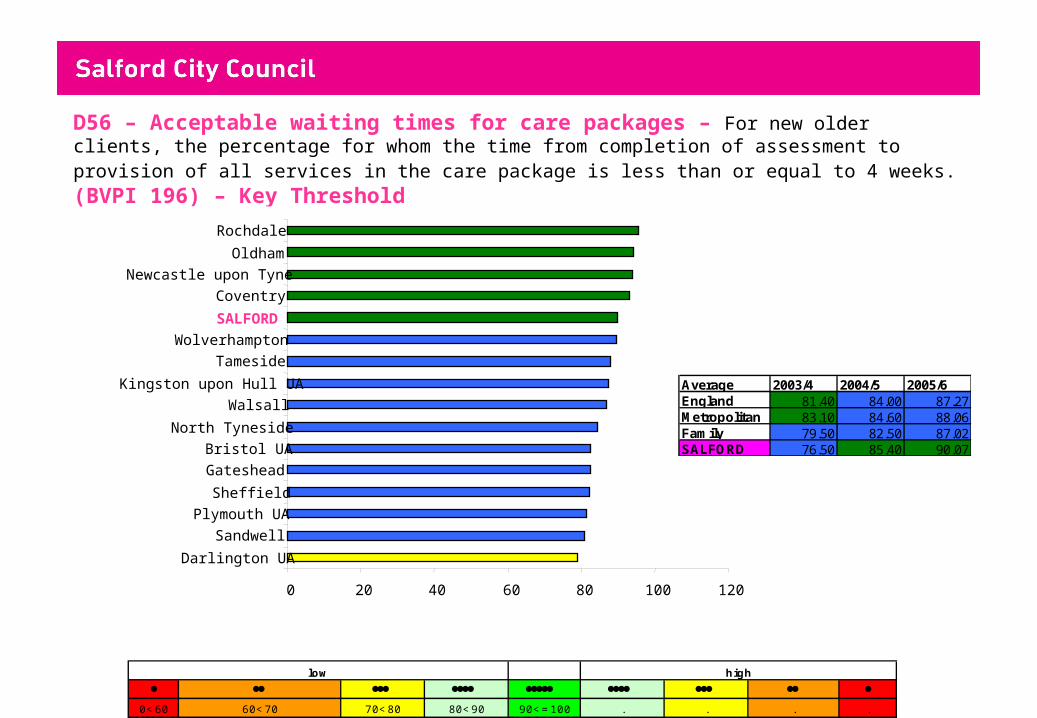
D56 – Acceptable waiting times for care packages – For new older clients, the percentage for whom the time from completion of assessment to provision of all services in the care package is less than or equal to 4 weeks. (BVPI 196) – Key Threshold
0 20 40 60 80 100 120
Darlington UA
Sandwell
Plymouth UA
Sheffield
Gateshead
Bristol UA
North Tyneside
Walsall
Kingston upon Hull UA
Tameside
Wolverhampton
SALFORD
Coventry
Newcastle upon Tyne
Oldham
Rochdale
Average 2003/4 2004/5 2005/6England 81.40 84.00 87.27Metropolitan 83.10 84.60 88.06Family 79.50 82.50 87.02SALFORD 76.50 85.40 90.07
low high
0<60 60<70 70<80 80<90 90<=100 . . . .
Information Produced by Research and Statistics Team
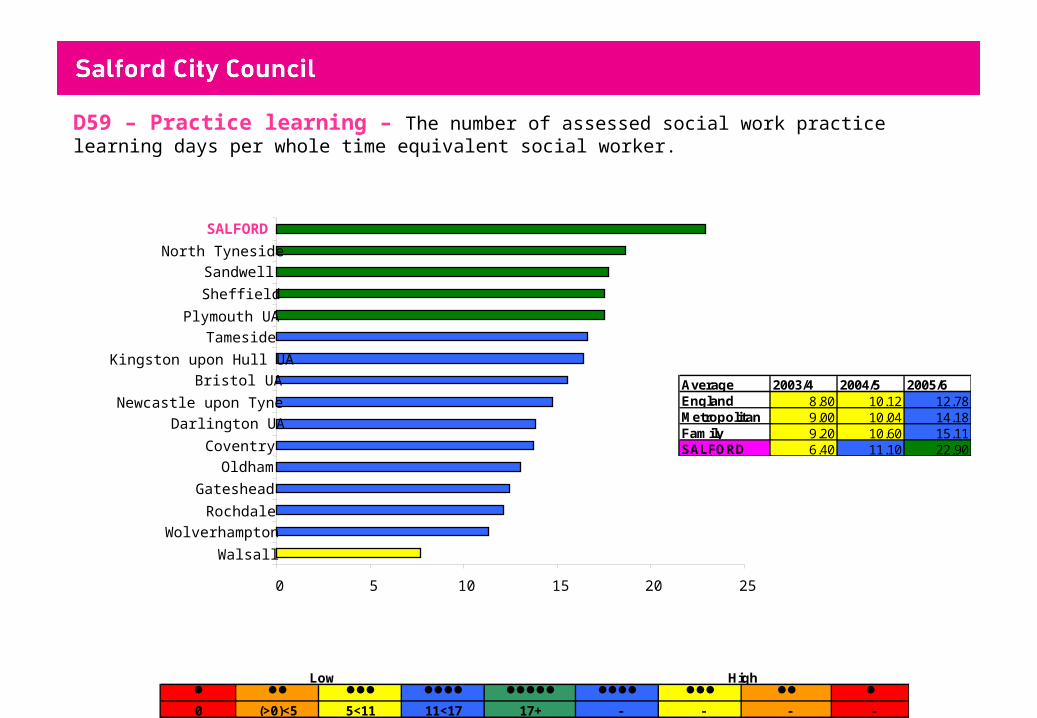
D59 – Practice learning – The number of assessed social work practice learning days per whole time equivalent social worker.
0 (>0)<5 5<11 11<17 17+ - - - -
Low High
0 5 10 15 20 25
Walsall
Wolverhampton
Rochdale
Gateshead
Oldham
Coventry
Darlington UA
Newcastle upon Tyne
Bristol UA
Kingston upon Hull UA
Tameside
Plymouth UA
Sheffield
Sandwell
North Tyneside
SALFORD
Average 2003/4 2004/5 2005/6England 8.80 10.12 12.78Metropolitan 9.00 10.04 14.18Family 9.20 10.60 15.11SALFORD 6.40 11.10 22.90
Information Produced by Research and Statistics Team
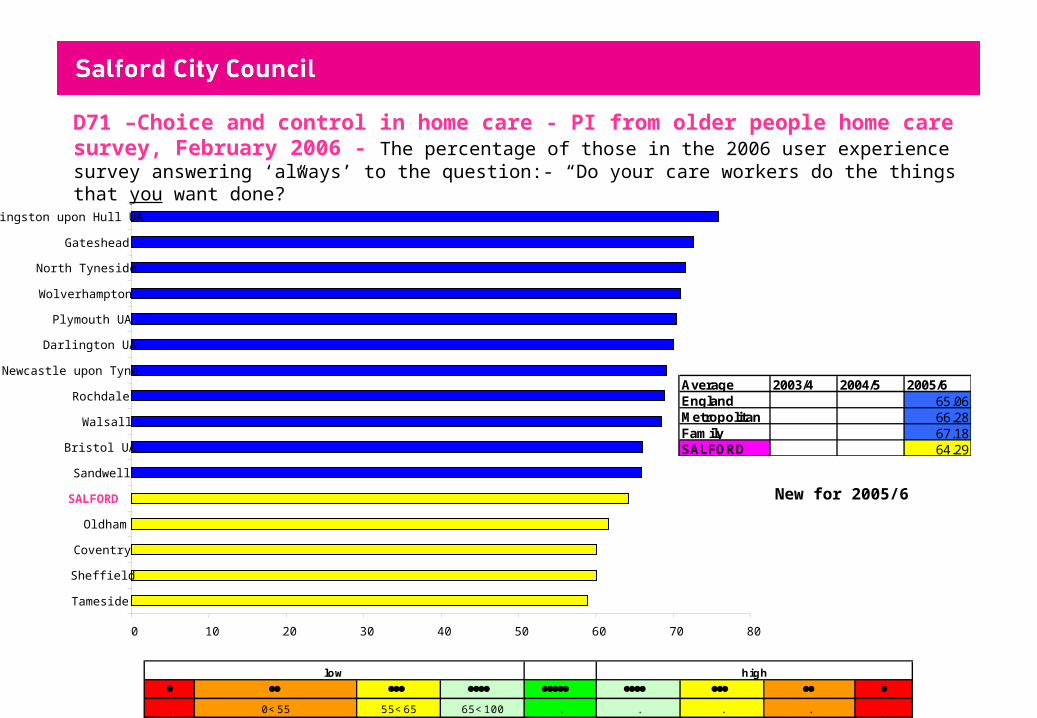
D71 –Choice and control in home care - PI from older people home care survey, February 2006 - The percentage of those in the 2006 user experience survey answering ‘always’ to the question:- “Do your care workers do the things that you want done?”
low high
. 0<55 55<65 65<100 . . . . .
New for 2005/6
0 10 20 30 40 50 60 70 80
Tameside
Sheffield
Coventry
Oldham
SALFORD
Sandwell
Bristol UA
Walsall
Rochdale
Newcastle upon Tyne
Darlington UA
Plymouth UA
Wolverhampton
North Tyneside
Gateshead
Kingston upon Hull UA
Average 2003/4 2004/5 2005/6England 65.06Metropolitan 66.28Family 67.18SALFORD 64.29
Information Produced by Research and Statistics Team
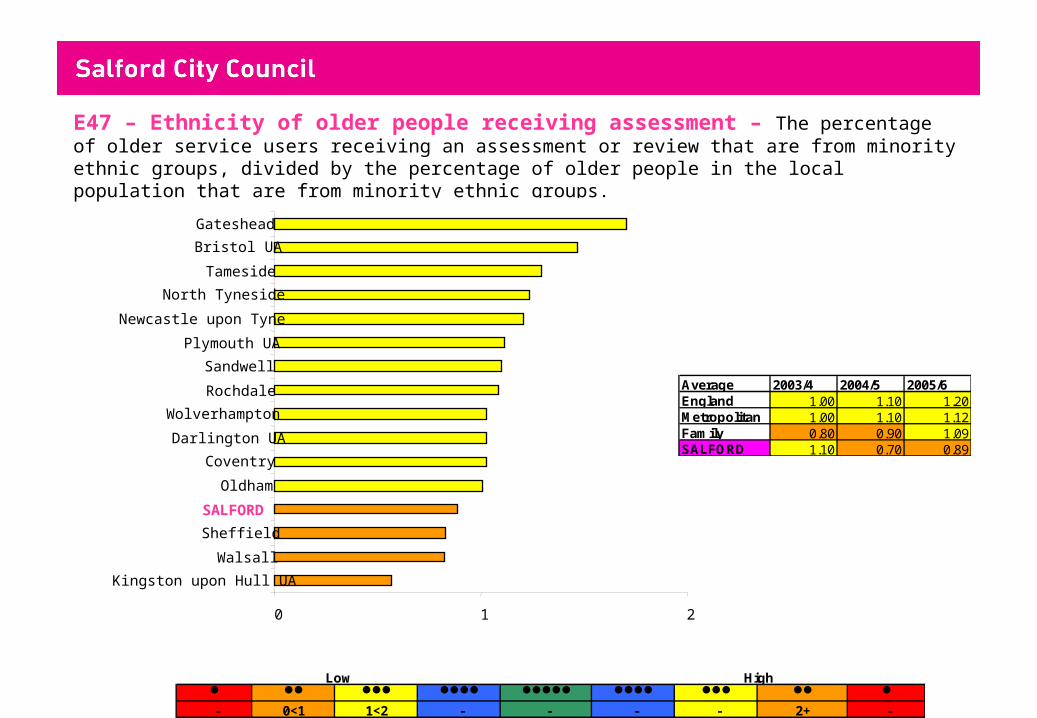
E47 – Ethnicity of older people receiving assessment – The percentage of older service users receiving an assessment or review that are from minority ethnic groups, divided by the percentage of older people in the local population that are from minority ethnic groups.
- 0<1 1<2 - - - - 2+ -
Low High
0 1 2
Kingston upon Hull UA
Walsall
Sheffield
SALFORD
Oldham
Coventry
Darlington UA
Wolverhampton
Rochdale
Sandwell
Plymouth UA
Newcastle upon Tyne
North Tyneside
Tameside
Bristol UA
Gateshead
Average 2003/4 2004/5 2005/6England 1.00 1.10 1.20Metropolitan 1.00 1.10 1.12Family 0.80 0.90 1.09SALFORD 1.10 0.70 0.89
Information Produced by Research and Statistics Team
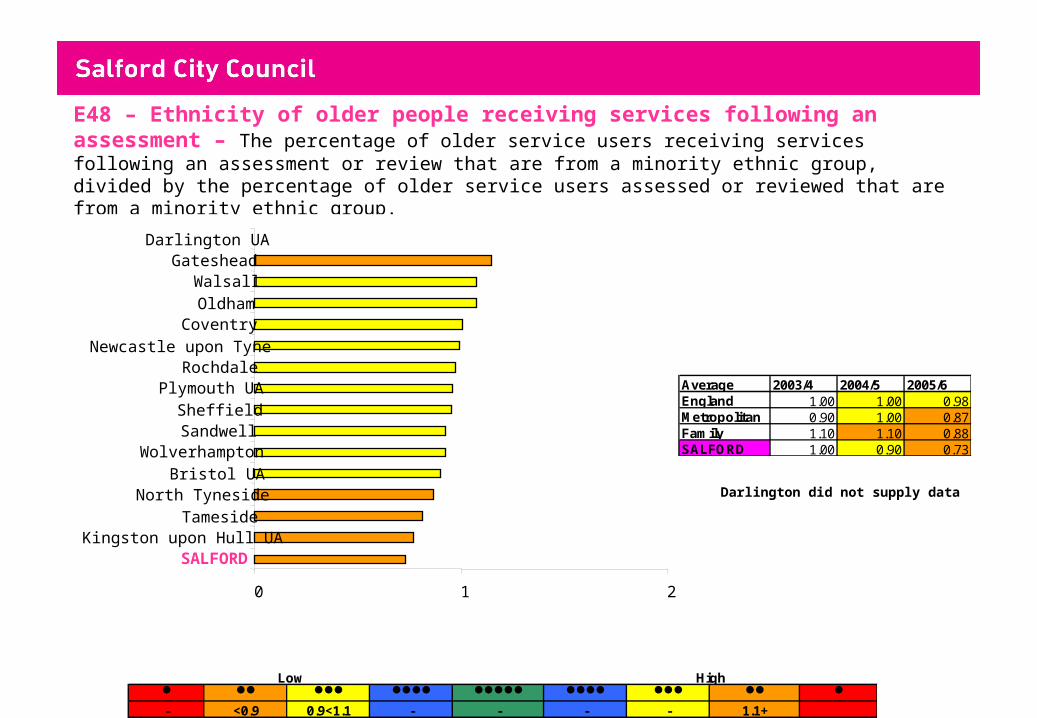
E48 – Ethnicity of older people receiving services following an assessment – The percentage of older service users receiving services following an assessment or review that are from a minority ethnic group, divided by the percentage of older service users assessed or reviewed that are from a minority ethnic group.
- <0.9 0.9<1.1 - - - - 1.1+
Low High
Darlington did not supply data
0 1 2
SALFORDKingston upon Hull UA
TamesideNorth Tyneside
Bristol UA
WolverhamptonSandwellSheffield
Plymouth UARochdale
Newcastle upon TyneCoventry
Oldham
WalsallGateshead
Darlington UA
Average 2003/4 2004/5 2005/6England 1.00 1.00 0.98Metropolitan 0.90 1.00 0.87Family 1.10 1.10 0.88SALFORD 1.00 0.90 0.73
Information Produced by Research and Statistics Team
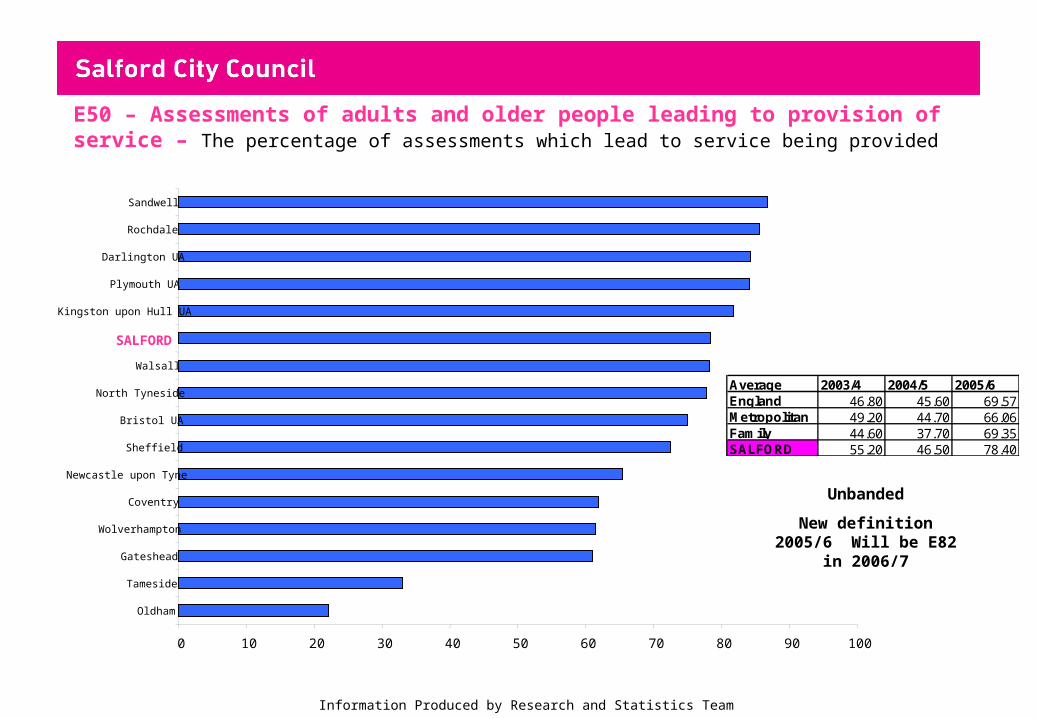
E50 – Assessments of adults and older people leading to provision of service – The percentage of assessments which lead to service being provided
0 10 20 30 40 50 60 70 80 90 100
Oldham
Tameside
Gateshead
Wolverhampton
Coventry
Newcastle upon Tyne
Sheffield
Bristol UA
North Tyneside
Walsall
SALFORD
Kingston upon Hull UA
Plymouth UA
Darlington UA
Rochdale
Sandwell
Average 2003/4 2004/5 2005/6England 46.80 45.60 69.57Metropolitan 49.20 44.70 66.06Family 44.60 37.70 69.35SALFORD 55.20 46.50 78.40
Unbanded
New definition 2005/6 Will be E82 in 2006/7