Embed Size (px)
Citation preview

Information Is Power Inside The Global Brain
Aleksander Fafuła, PhD, Chief Data Scientist MarketPsych Data LLC

Presentation outline
1.Brief information about MarketPsych
2.Data production process
3.Seven social media and news data
secrets revealed
• MARKETPSYCH HAS BEEN
DEVELOPING FINANCIAL SENTIMENT-
BASED INVESTMENT MODELS SINCE
2004.
• Team has experts in natural language
processing, cloud computing and behavioral
economics.
• Published research in academic journals,
textbooks, and two award-winning books.
• Frequent appearances in financial media
including WSJ, CNBC, FT and Bloomberg.
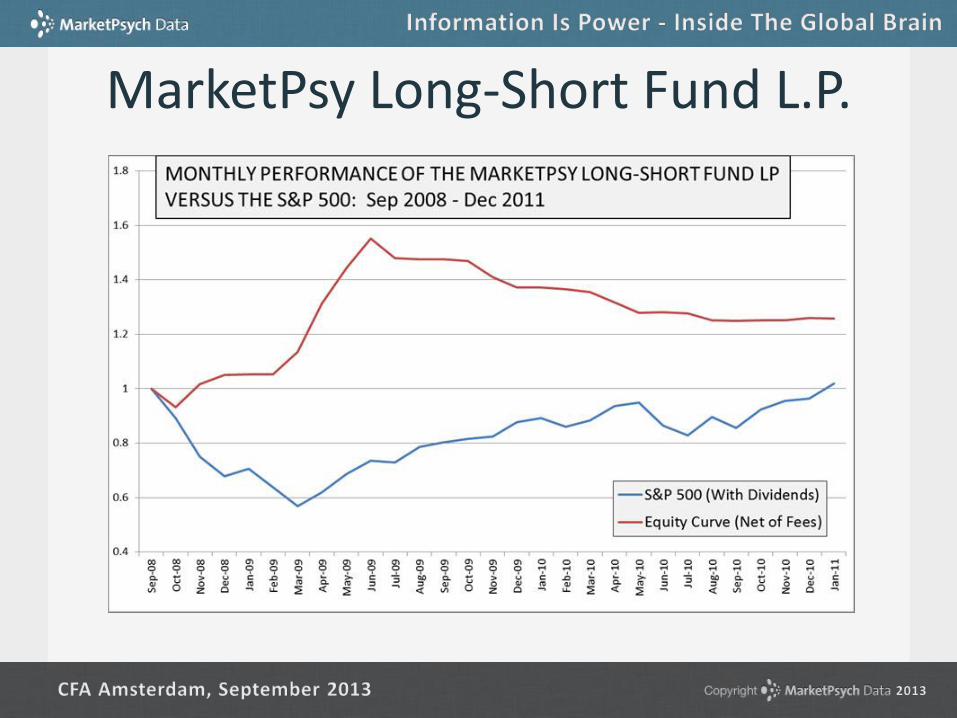
MarketPsy Long-Short Fund L.P.

MarketPsych Macro Feed

The process behind MARKETPSYCH text analytics

The content inside the data feed.
professional news social media
Thomson Reuters MarketPsych
Indices
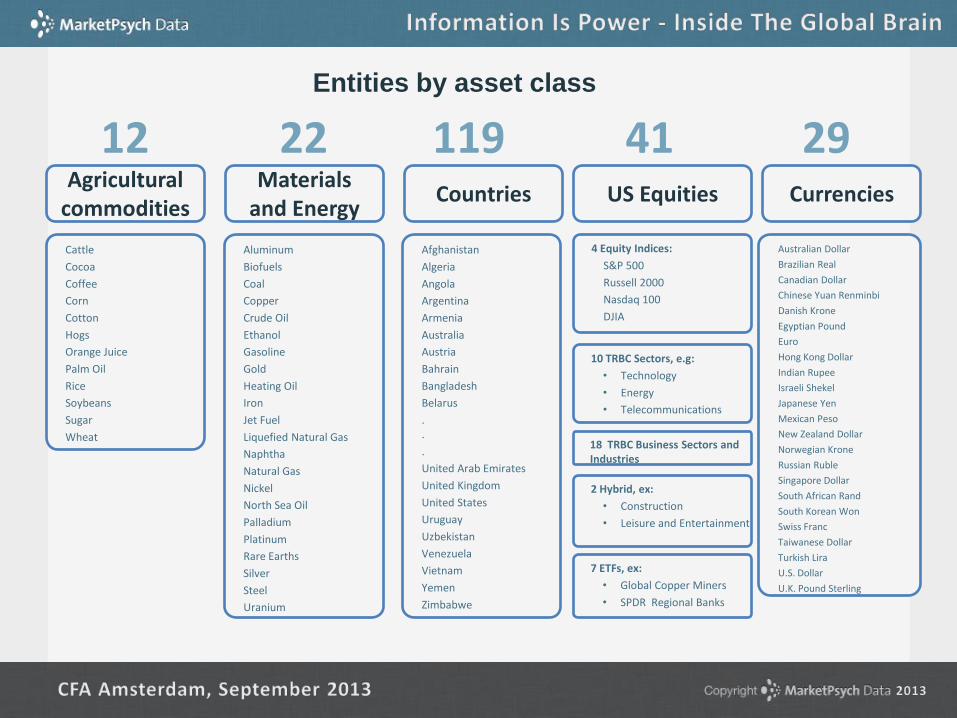
Entities by asset class
US Equities Currencies Agricultural
commodities Materials
and Energy Countries
41 119 29 12 22
Afghanistan
Algeria
Angola
Argentina
Armenia
Australia
Austria
Bahrain
Bangladesh
Belarus
.
.
.
United Arab Emirates
United Kingdom
United States
Uruguay
Uzbekistan
Venezuela
Vietnam
Yemen
Zimbabwe
Australian Dollar
Brazilian Real
Canadian Dollar
Chinese Yuan Renminbi
Danish Krone
Egyptian Pound
Euro
Hong Kong Dollar
Indian Rupee
Israeli Shekel
Japanese Yen
Mexican Peso
New Zealand Dollar
Norwegian Krone
Russian Ruble
Singapore Dollar
South African Rand
South Korean Won
Swiss Franc
Taiwanese Dollar
Turkish Lira
U.S. Dollar
U.K. Pound Sterling
Cattle
Cocoa
Coffee
Corn
Cotton
Hogs
Orange Juice
Palm Oil
Rice
Soybeans
Sugar
Wheat
Aluminum
Biofuels
Coal
Copper
Crude Oil
Ethanol
Gasoline
Gold
Heating Oil
Iron
Jet Fuel
Liquefied Natural Gas
Naphtha
Natural Gas
Nickel
North Sea Oil
Palladium
Platinum
Rare Earths
Silver
Steel
Uranium
4 Equity Indices:
S&P 500
Russell 2000
Nasdaq 100
DJIA
10 TRBC Sectors, e.g:
• Technology
• Energy
• Telecommunications
18 TRBC Business Sectors and Industries
2 Hybrid, ex:
• Construction
• Leisure and Entertainment
7 ETFs, ex:
• Global Copper Miners
• SPDR Regional Banks

US Equities Currencies Agricultural
commodities Materials
and Energy Countries
Shared Fields: Sentiment, Optimism, Fear, Joy, Trust, Violence, Conflict, Urgency, Uncertainty
Price
PriceForecast
ConsumptionVolume
ProductionVolume
RegulatoryIssues
SupplyVsDemandForecast
Surplus
AcreageCultivated
AgDisease
Subsidies
SubsidiesSentiment
WeatherDamage
Price
PriceForecast
CarryTrade
CurrencyPegInstability
PriceMomentum
MarketRisk
BudgetDeficit
CentralBank
ConsumerSentiment
CreditConditions
Default
EconomicConflict
EconomicGrowth
EconomicUncertainty
ElectionSentiment
FinancialSystemInstability
FiscalPolicy
GovernmentAnger
GovernmentCorruption
GovernmentInstability
Inflation
InterestRate
InvestmentFlows
MonetaryPolicy
NaturalDisasters
RegimeChange
SocialInequality
SocialUnrest
TradeBalance
Unemployment
Price
PriceForecast
MarketRisk
AnalystRating
Anger
EarningsForecast
FundamentalStrength
Gloom
Innovation
Layoffs
Litigation
Mergers
Stress
Volatility
Price
PriceForecast
ConsumptionVolume
ProductionVolume
RegulatoryIssues
SupplyVsDemandForecast
Surplus
NewExploration
ProductionCost
SafetyAccident
TRMI FOR EACH ASSET CLASS

Data sample
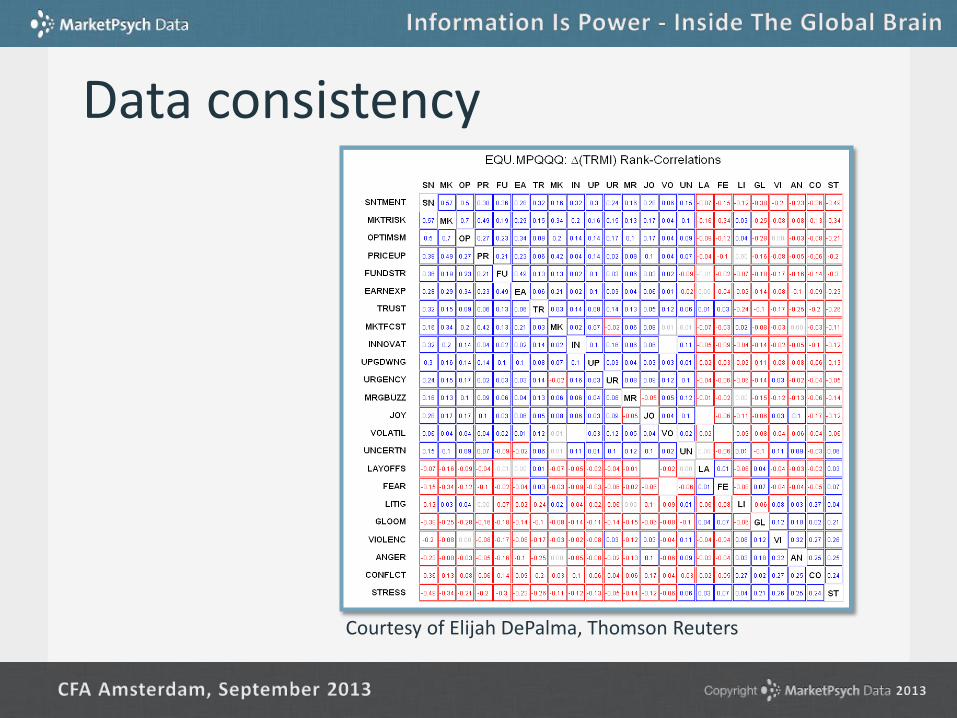
Data consistency
Courtesy of Elijah DePalma, Thomson Reuters

7 SECRETS REVEALED
1. Various sectors and their pictures
2. Seasons for emotions
3. Advisors from Twitter
4. Earning Calls and communication styles
5. MACD indicators
6. Country and currency rotation strategies
7. GDP forecasts

2011 TRMI EXAMPLES: Technology (IYT), Energy (XLE), Airlines (FAA)
Medium
Medium
High
Low
Low High
Fundamental Strength
Sto
ck P
rice
Fo
reca
st
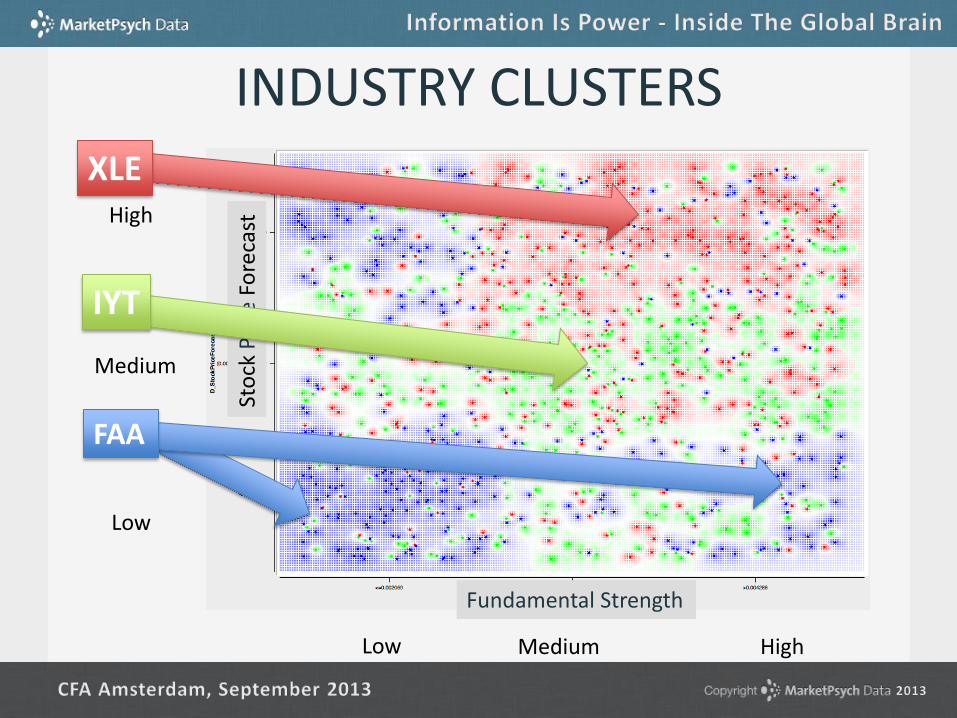
INDUSTRY CLUSTERS
Sto
ck P
rice
Fo
reca
st
Medium
Medium
High
Low
IYT
XLE
Low High
FAA
Fundamental Strength

PRICE SERIES AND SENTIMENTS
FAA
IYT
XLE
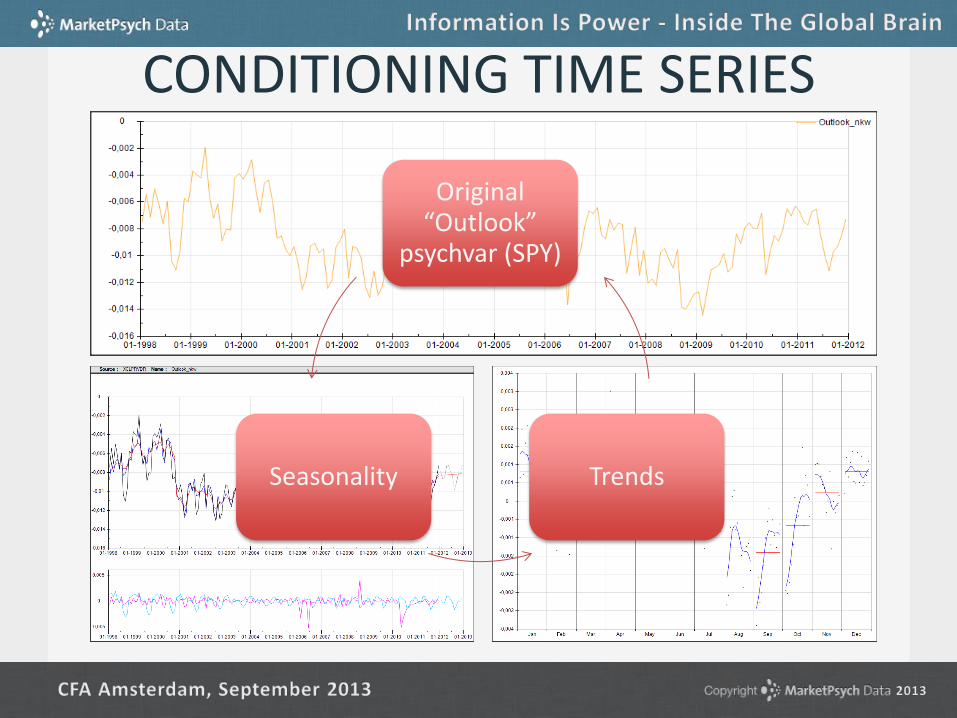
CONDITIONING TIME SERIES
Original “Outlook”
psychvar (SPY)
Seasonality Trends
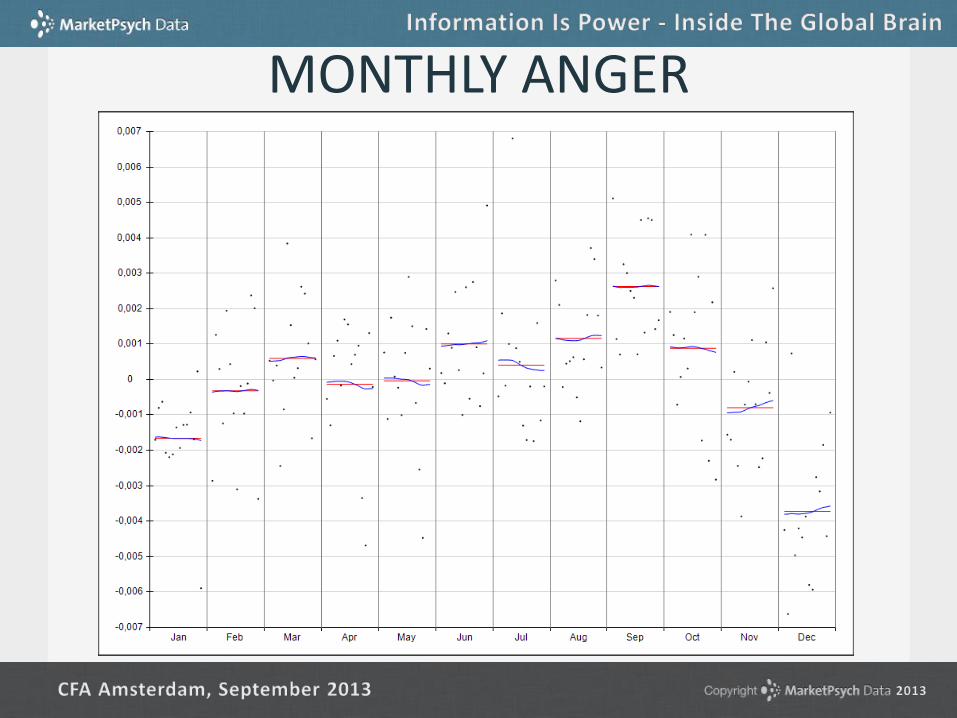
MONTHLY ANGER
What is the most hated month?

MONTHLY JOY
Which month is the most joyful?

Retail investors and their posts
2 693 779 signals
7 792 “StockUp”
14 728 predictions:
6 936 “StockDown”
120 days
R1?
QQQ

Predictions from Message Boards
39%
61%
StockDown
Positive Negative
41%
59%
StockUp
Positive Negative
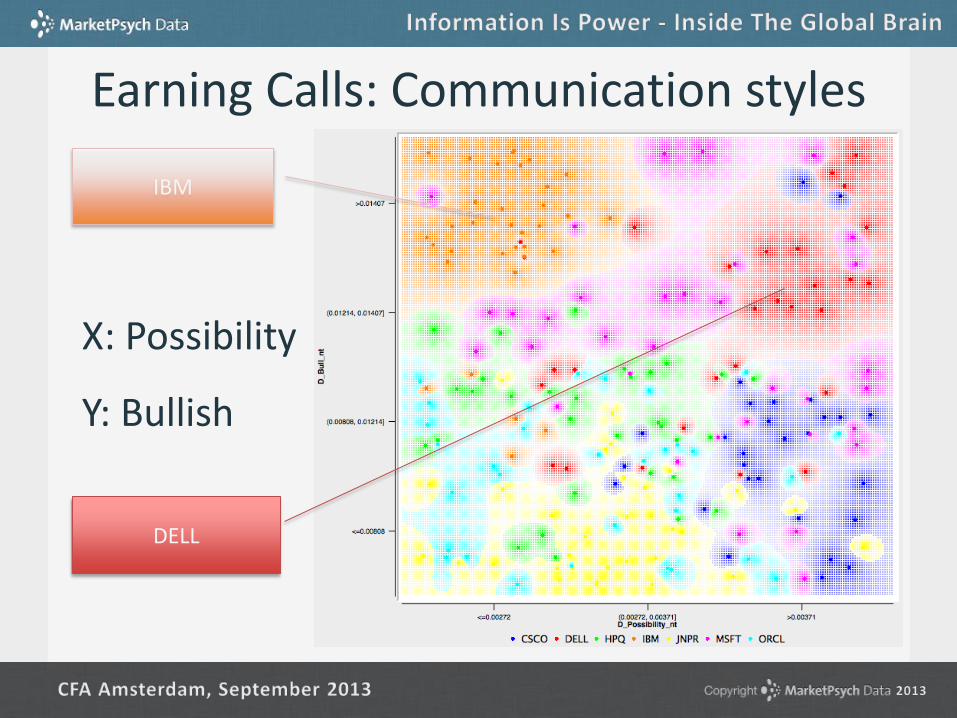
Earning Calls: Communication styles
Y: Bullish
X: Possibility
IBM
DELL

MACD indicators

Global perception: Market Risk 2013-08-31
Country data derived from textual analysis of global social media and news.
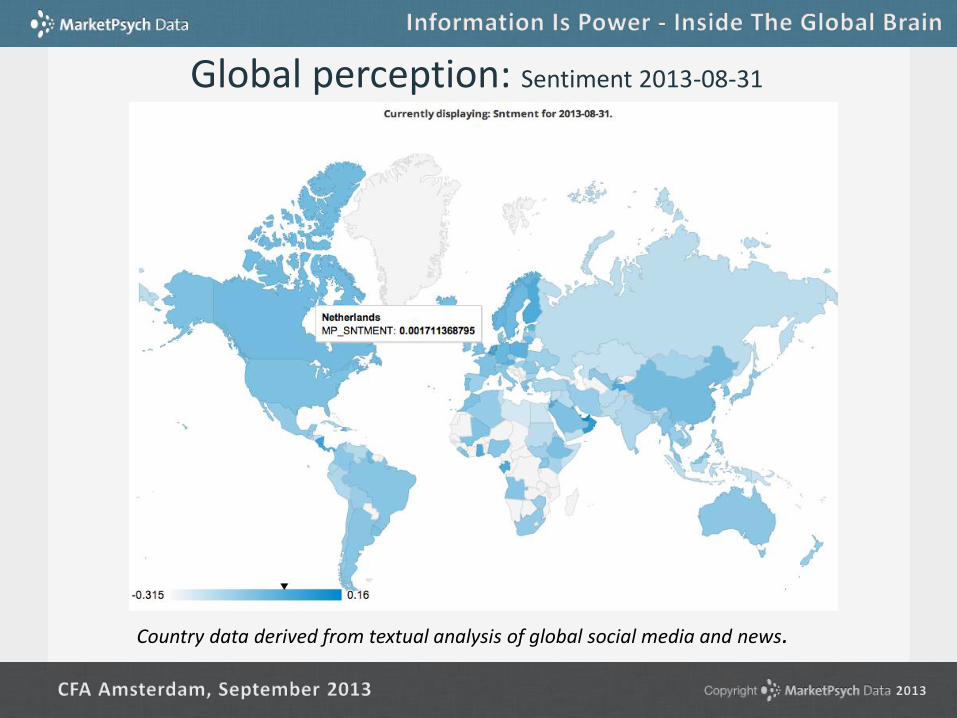
Global perception: Sentiment 2013-08-31
Country data derived from textual analysis of global social media and news.

Country Rotation – Macro Indexes

Country Rotation
• “Buy to the sound of cannons, sell to the sound of trumpets”
• ~ Baron Nathan Rothschild, 1812.
FINDINGS
Over longer periods, extreme sentiments are typically followed by contrarian reversals. Primary indicators are Joy, Urgency, Government Instability.
ROTATIONAL STRATEGIES
Long-short portfolios are formed each observation, taking positions of country indexes at the extremes of sentiment with high Buzz.
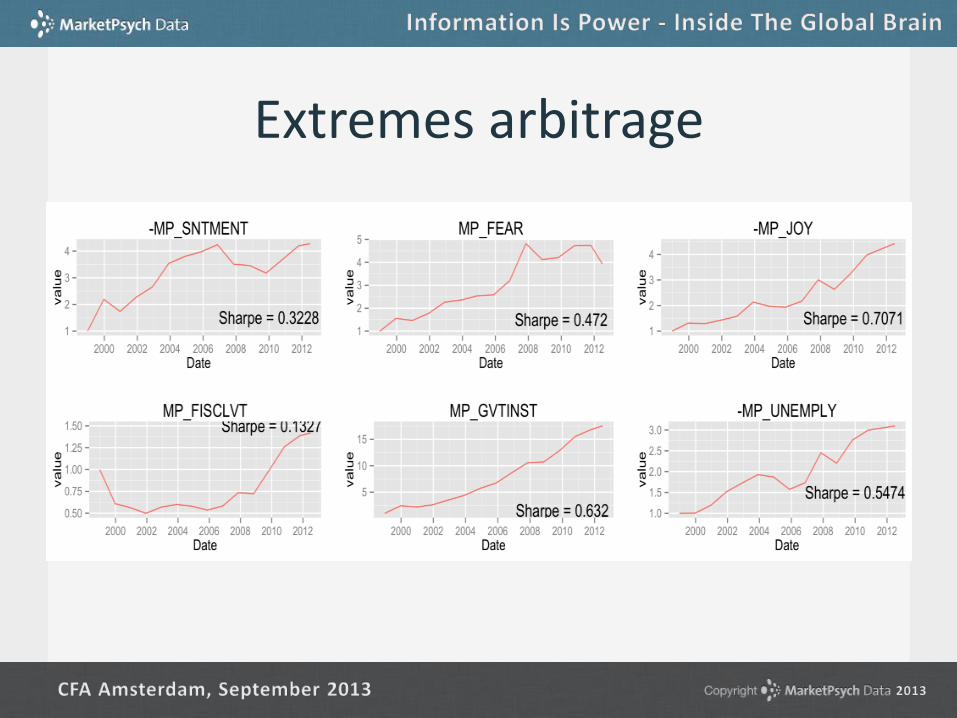
Extremes arbitrage
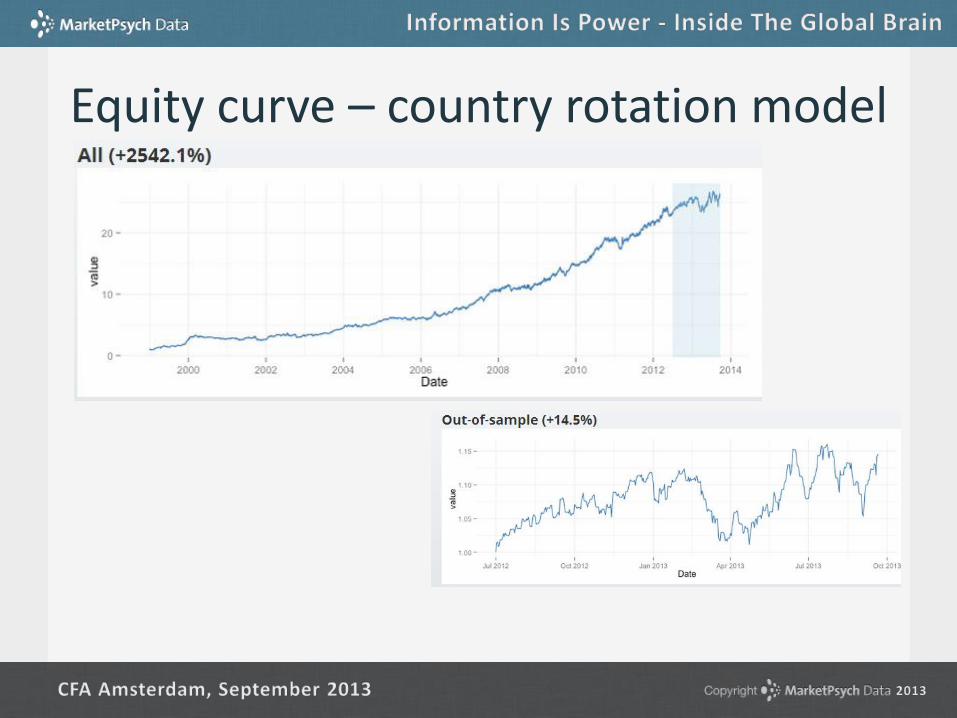
Equity curve – country rotation model

Currency Rotation
FINDINGS
Extreme sentiment movements in the short-term typically follows momentum while long-term shows reversion. Notable indicators are Market Forecast, Optimism, Trust, Uncertainty.
ROTATIONAL STRATEGIES
Long-short portfolios are formed each observation, taking positions of currencies (against USD) at the extremes of sentiment with high Buzz, including the country’s sentiment.
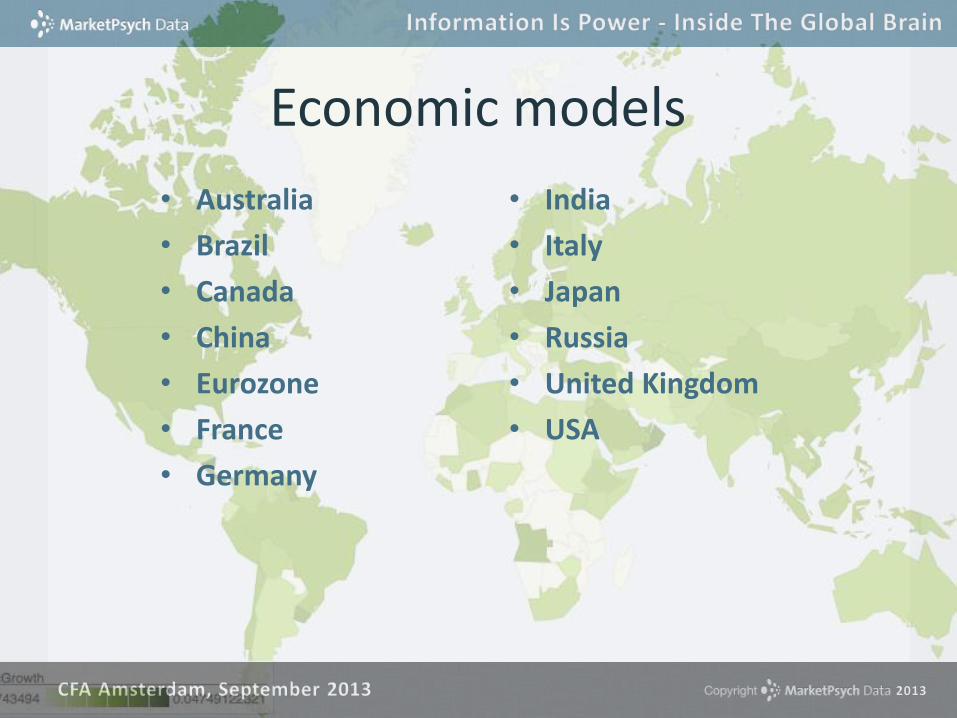
• Australia
• Brazil
• Canada
• China
• Eurozone
• France
• Germany
• India
• Italy
• Japan
• Russia
• United Kingdom
• USA
Economic models
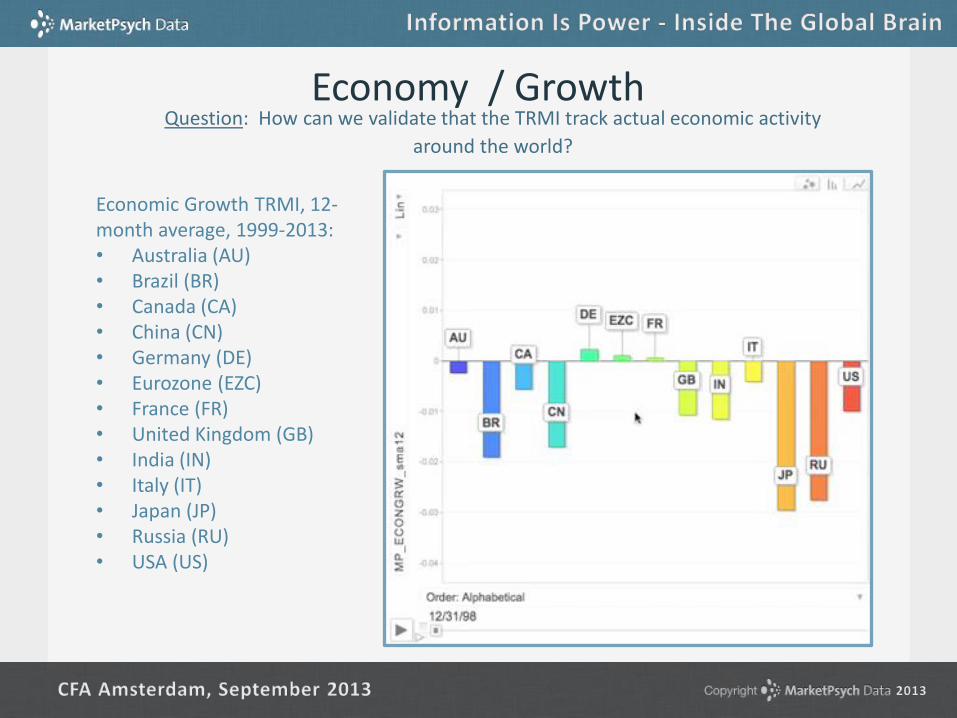
Economy / Growth
Economic Growth TRMI, 12-month average, 1999-2013: • Australia (AU) • Brazil (BR) • Canada (CA) • China (CN) • Germany (DE) • Eurozone (EZC) • France (FR) • United Kingdom (GB) • India (IN) • Italy (IT) • Japan (JP) • Russia (RU) • USA (US)
Question: How can we validate that the TRMI track actual economic activity
around the world?
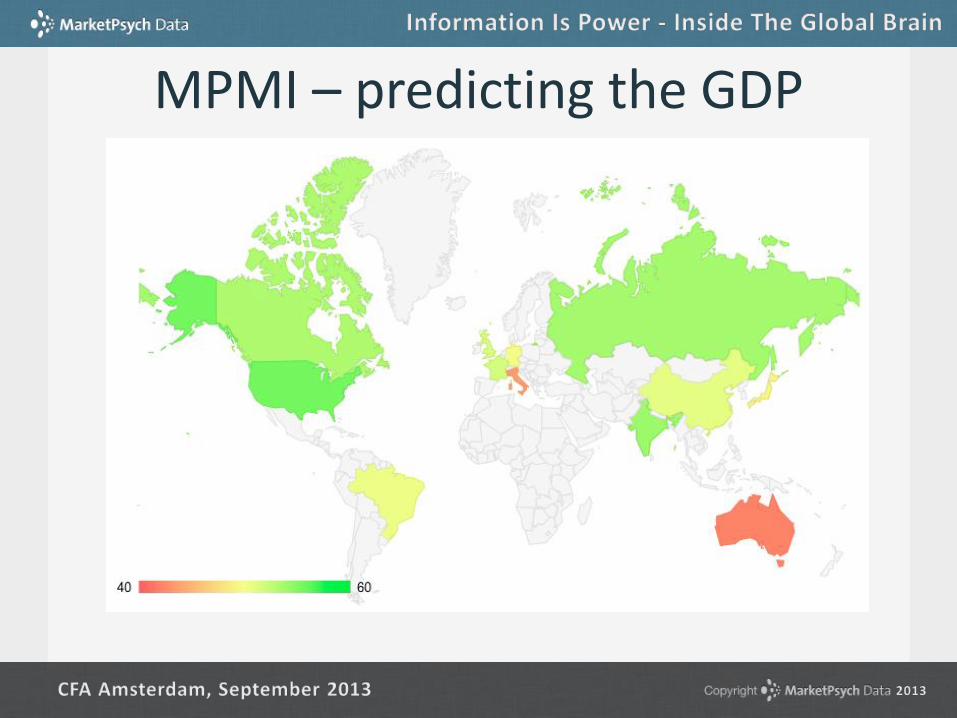
MPMI – predicting the GDP

MPMI – predicting the GDP
• Models are updated daily • Huge coverage

Economic model /U.S. Statistics
Model R2 = 0.97 Min 1Q Median 3Q Max
-2.25 -0.65 0.22 0.73 2.22
Table: Residuals of the model 2008-2013
Negative influence
Positive influence
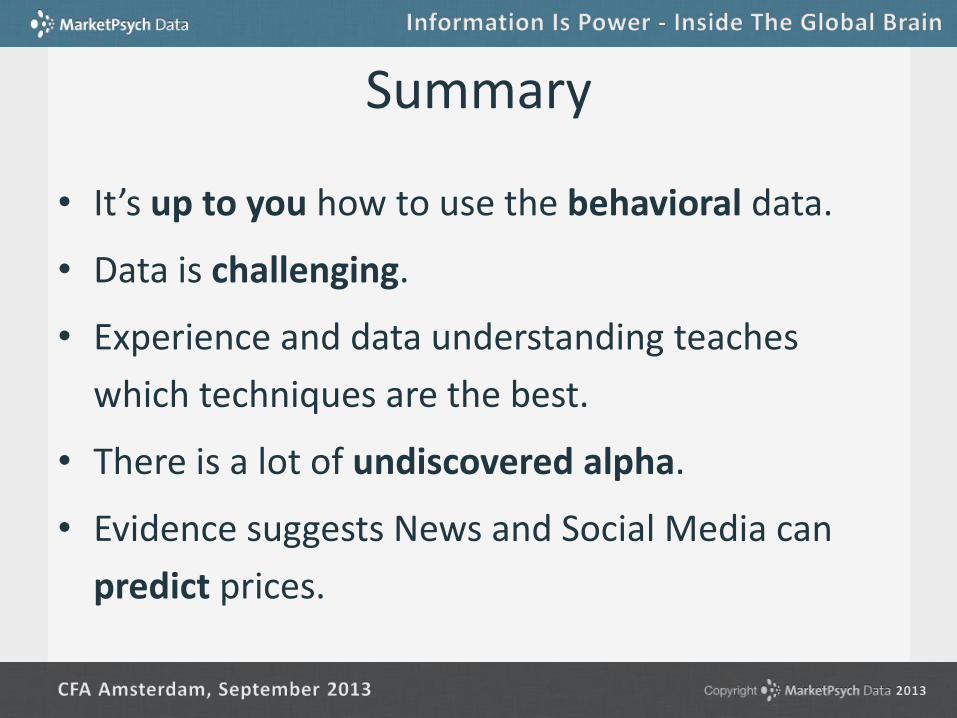
Summary
• It’s up to you how to use the behavioral data.
• Data is challenging.
• Experience and data understanding teaches
which techniques are the best.
• There is a lot of undiscovered alpha.
• Evidence suggests News and Social Media can
predict prices.

USING SENTIMENT IN DISCRETIONARY DECISION-MAKING
36
Newsletter - (START HERE)
www.marketpsych.com
Sentiment tools, dashboards,
charts, strategies, indicators
Knowledge base

YOUR QUESTIONS
37

THANK YOU! The MarketPsych Data Team
Richard Peterson, M.D.
Aleksander Fafula, Ph.D.
Changjie Liu, MFE
Diego Gutierrez, CTO
Nareg Khoshafian
Eugene Smolanka
Zulma Cao
Brandon Smietana
Marcelo Sousa
Alex Verinikin
Alexey Karakulov
Mike Klein
Jacob Kozinn
And many interns…


![Wysadzic Rosje [Aleksander Litwinienki, Jurii Felsztynski]](https://img.pdfslide.us/doc/110x75/5571f9db4979599169909812/wysadzic-rosje-aleksander-litwinienki-jurii-felsztynski.jpg)