Embed Size (px)
Citation preview

PostDeyr2016/17
Shabelle & BanadirNutrition Situation19th Jan 2016
Information for Better Livelihoods

Main Livelihood Groups Sources of Food and Income
Livelihood Groups & Main Sources of Food and Income:
• Riverine gravity G.I livelihood: q Primary sources of income of poor: sale of
crops, agr icultural Labour, and sel f employment.
q Primary food sources of poor: Own crop and purchase.
q Primary livelihood asset of poor: Agriculture land
• Agro pastoral Livelihoods (Lower Shabelle southern rain- fed - Maize/cattle, coastal deeh, Cowpea belt)
q Primary sources of income of poor: crop sale, agricultural labor, livestock and livestock product sales, self-employment (fodder sales, firewood, construction materials, etc); main sources of food of poor: Own production (maize) and purchase.
q Shabelle red sorghum high potential agropastoral: Primary sources of income of poor: crop sale, agricultural labor, livestock and livestock product sales, self-employment (fodder sales, firewood, construction materials, etc); main sources of food : own production(Sorghum) and purchase.
• Pastoral Livelihoods (Southern Inland Pastoral) q Primary sources of income of poor: sale of livestock & livestock products q Primary sources of food of poor: purchase

SurveyDetailsDeyr206/17
Popula7onsurveyed Typeofsurvey #clusters #of
household
#ofchildren6-59m
Boys Girls
MogadishuIDPs
ComprehensiveWHZ-SMART
37 425 676 345 331Shabelle
AgropastrolComprehensiveWHZ-SMART 29 456 499 250 249
ShabelleRiverine
ComprehensiveWHZ-SMART
29 459 589 305 284
Total 95 1340 1764 900 864

MogadishuIDPs,SummaryofFindingsOutcomeIndicator Deyr’15(n=825) Gu’2016(n=689 Deyr’16(n=676)
Plausibility 10% 4% 1%
GAM(WHZ<-2oroedema)-WHO/UNICEF 11.4(8.8-14.6 14.7(11.6-18.4)
16.6(13.7-19.9)
SAM(WHZ<-3oroedema)–FSNAU 2.5(1.5-4.2) 3.5(2.4-5.0)4.0(2.8-5.7)
Oedema 0.4 0.0 0.0
MeanofWHZ±SD -0.72±1.05 -0.87±1.08 -0.98±1.08
DEFF 1.00 1.55 1.14
MUAC(<12.5cmoroedema)-FSNAU 7.6(5.7-10.1 6.2 ( 3.9- 9.8) 11.3(7.9-16.0)
SevereMUAC(<11.5cm)-FSNAU 2.0(1.4-2.91.4 ( 0.7- 3.0) 1.0(0.5-2.1)
14.9(11.3-19.5) 12.4 ( 8.4-17.8) 11.8 (8.5-16.0) 15.6(11.9-20.1 17.2 (12.8-22.8) 16.7(13.2-20.8)
CrudedeathRate–SPHERE 0.40(0.20-0.80) 0.33 (0.16-0.70) 0.61(0.34-1.11)
Under5deathRate-SPHERE 1.5(0.49-2.60) 0.99 (0.37-2.65) 0.74(0.30-1.81)
NUTRITIONSITUATION-WHO/UNICEF Serious Serious Cri^cal
Risk/UnderlyingFactors
Morbiditybasedon2wkrecall 29.7 44.6 29.6
VitaminAMeaslesVac
44.139.5
39.3
27.8
38.8
30.1
HHS N/A N/A 14%Moderate/severe
FCS 95% N/A 21%poor/Borderline
MeanCSI 54.0 66.3 37%
FoodSecurityPhase-IPCCrisis
CrisisCrisis

30
20.5
9.6
16
12.6
8.2
18.9
13.414.9
11.4
14.716.6
10
3.7 3.6 2.91.6
5.5
2.5 3.3 2.53.5 4
0
5
10
15
20
25
30
35
2011Gu 2011Deyr 2012Gu 2012Deyr 2013Gu 2013Deyr 2014Gu 2014Deyr 2015Gu 2015Deyr 2016GU DEYR2016
TrendsinGAMandSAMprevalenceamongMogadishuIDPs
GAM SAM
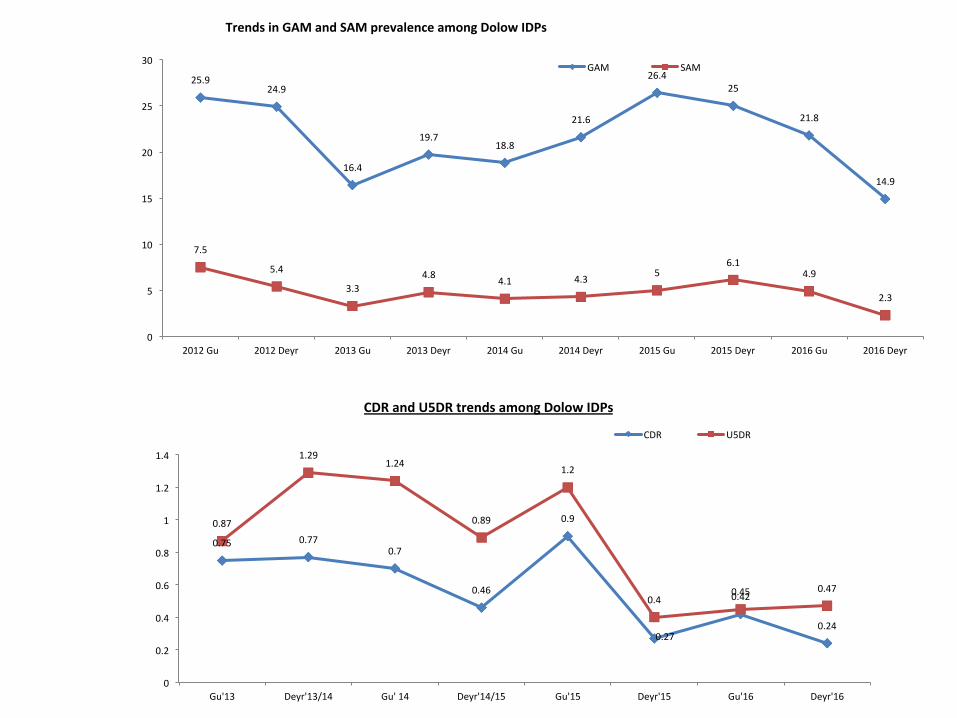
0.75 0.770.7
0.46
0.9
0.27
0.42
0.24
0.87
1.291.24
0.89
1.2
0.40.45 0.47
0
0.2
0.4
0.6
0.8
1
1.2
1.4
Gu'13 Deyr'13/14 Gu'14 Deyr'14/15 Gu'15 Deyr'15 Gu'16 Deyr'16
CDRandU5DRtrendsamongDolowIDPs
CDR U5DR
25.924.9
16.4
19.718.8
21.6
26.425
21.8
14.9
7.5
5.4
3.34.8 4.1 4.3 5
6.14.9
2.3
0
5
10
15
20
25
30
2012Gu 2012Deyr 2013Gu 2013Deyr 2014Gu 2014Deyr 2015Gu 2015Deyr 2016Gu 2016Deyr
TrendsinGAMandSAMprevalenceamongDolowIDPs
GAM SAM
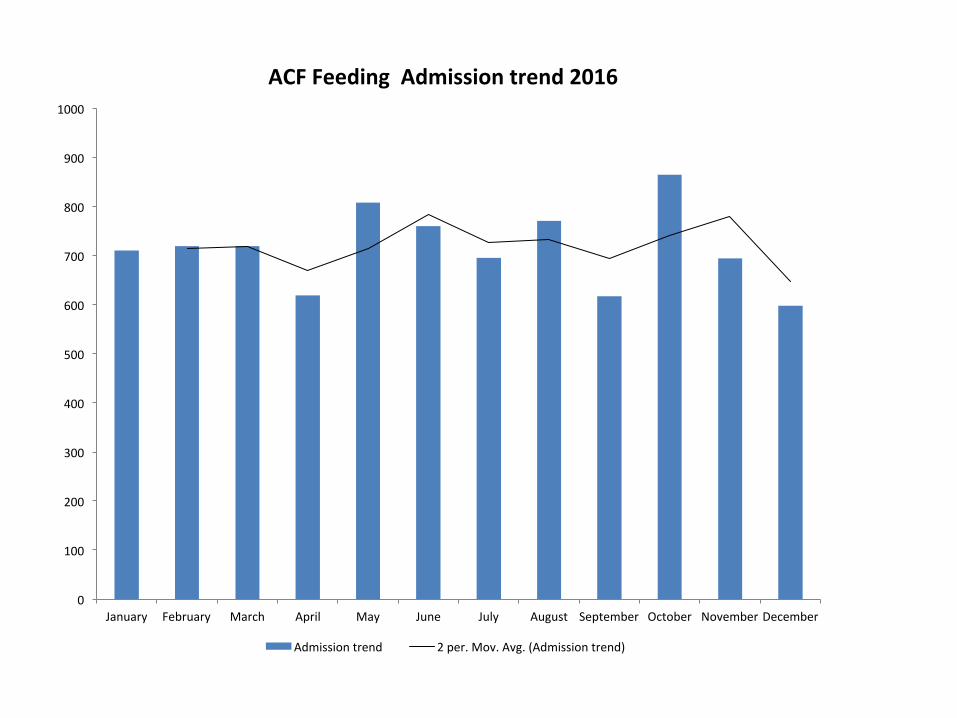
0
100
200
300
400
500
600
700
800
900
1000
January February March April May June July August September October NovemberDecember
ACFFeedingAdmissiontrend2016
Admissiontrend 2per.Mov.Avg.(Admissiontrend)

OutcomeIndicator Deyr015/16(n=760) Gu’2016(n=578) Deyr2016/17(n=499)
Plausibility 13Good 6Excellent 12good
GAM(WHZ<-2oroedema)-WHO/UNICEF 14.3(10.8-18.7) 14.5(11.0-19.0) 14.9(10.1-21.6)SAM(WHZ<-3oroedema)-FSNAU 1.4(0.7-2.9) 2.4(1.2-4.9) 4.0(2.3-7.0)
Oedema 0.0 0.2% 0.0MeanofWHZ±SD -0.74±1.12 -0.73±1.13 -0.71±1.15
DEFF 2.28 1.73 3.01MUAC(<12.5cmoroedema)–FSNAU 8.4(6.1-11.5) 11.4(8.3-15.5) 10.0(5.9-16.4)SevereMUAC(<11.5cm)–FSNAU 0.9(0.4-2.1) 0.9(0.3-2.3) 1.8(0.7-4.7)Stun7ng(HAZ-2)-WHO/UNICEF 8.7(6.6-11.4) 7.5(5.1-11.0) 7.9(5.4-11.4)
Underweight(WAZ-2)-WHO/UNICEF 11.3(8.7-14.5) 14.7(10.9-19.6) 12.1(7.9-18.1)Malnutri7onTrends(HIS)–FSNAU >10andfluctua^ngtrend >20andfluctua^ngtrend >20andfluctua^ng
CrudedeathRate–SPHERE 0.32(0.16-0.63) 0.32(0.18-0.58) 0.32(0.14-0.73)Under5deathRate–SPHERE 0.64(0.25-1.64) 0.56(0.24-1.30) 1.07(0.46-2.49)
NUTRITIONSITUATION-WHO/UNICEF Serious Serious Serious
Risk/UnderlyingFactorsMorbiditybasedon2wkrecall 24.6 36.2 37.3
VitaminAMeaslesVaccina7on
18.138.6
19.86.3
20.215.2
CSI 12.8 12
HHS 14%Moderate/severe 14%Moderate/severe
FCS3% 1%poor/Borderline
FoodSecurityPhase–IPC Stressed
Stressed Stressed
ShabelleAgropastoral,SummaryFindings

0.0
10.0
20.0
30.0
40.0
50.0
60.0
Jan Feb Mar Apr May Jun Jul Aug Sep Oct Nov Dec
Pro
porti
on o
f mal
nour
ishe
d ch
ildre
n
HIS Malnutrition Trends in Shabelle Agropastoral MCHs 2016 (Source: Swiss-kalmo)
2015 2016 2 per. Mov. Avg. (2015) 2 per. Mov. Avg. (2016)

Outcome Indicator Deyr’ 15/16 (n=718) Gu’ 2016 (n=601) Deyr’ 16/17 (n= 589 )
Plausibility 13 Good 11 Good 12 Good
GAM (WHZ<-2 or oedema) - WHO 11.4 ( 8.6-15.1) 12.5(8.6-17.7) 14.0(9.6-20.1)
SAM (WHZ<-3 or oedema) - FSNAU 2.1 ( 1.2- 3.6) 2.2(1.3-3.7) 3.2(1.7-6.0)Oedema 0.0 0.0% 0.0% Mean of WHZ ±SD -0.63±1.13 -0.64±1.11 -0.68±1.15 DEFF 1.77 2.67 3.014 MUAC (<12.5 cm/ oedema) - FSNAU 8.9 ( 6.7-11.9) 7.9(5.0-12.3) 10.5(7.4-14.8)Severe MUAC (<11.5cm) - FSNAU 1.9 ( 1.0- 3.8) 1.3(0.7-2.4) 2.2(1.4-3.4)
Stunting (HAZ-2) - WHO/UNICEF 9.5 ( 6.9-13.0) 5.3(3.2-8.6) 6.1(3.5-10.4)
Under weight (WAZ-2) W HO/UNICEF 12.6 ( 8.8-17.6) 9.7(6.9-13.4) 11.7(8.0-16.9)
Malnutrition Trends (HIS) – FSNAU > 15 and fluctuating trend > 15 and fluctuating trend > 15 and fluctuating
Crude death Rate - SPHERE 0.28 (0.15-0.52) 0.34(0.20-0.57) 0.31 (0.11-0.86)
Under 5 death Rate – SPHERE 0.42 (0.14-1.26 0.44(0.17-1.16) 1.09(0.44-2.66)
NUTRITION SITUATION Serious Serious Serious Risk/Underlying Factors
Morbidity based on 2wk recall 26.3 28.7 22.1 Vitamin A supp. Measles Vaccine
30.4 29.0
18.69.9
4.42.2
CSI N/A 9.33 12 HHS N/A 1%Moderate/severe 3% Moderate/severe FCS 1% 4% poor/Borderline
Food Security Phase – IPC Stressed Stressed Stressed
Shabelle Riverine, Summary of Findings

0.0 5.0
10.0 15.0 20.0 25.0 30.0 35.0 40.0 45.0 50.0 55.0 60.0 65.0 70.0 75.0 80.0 85.0 90.0 95.0
100.0
Jan Feb Mar Apr May Jun Jul Aug Sep Oct Nov Dec
Pro
porti
on o
f mal
nour
ishe
d ch
ildre
n
HIS Malnutrition Trends in Shabelle Riverine MCHs 2015 (Source: Swiss-Kalmo)
2015 2016 2 per. Mov. Avg. (2015) 2 per. Mov. Avg. (2016)

Area Aggrava7ngfactors Mi7ga7ngfactors
ShabelleAgro-pastoral
• HighMorbidity:37.3%• VeryLowImmuniza7onCoverage.• OutbreakAWD• Lowhumanitarianinterven7ons• Limitedaccesstohealthservice• Conflictsandsecurityconcerns
• Socialsupport.• Nutri7onalinterven7onsites.• AverageLaborwageavailable,• Milkavailabilitywasaverage
ShabelleRiverine
• HighMorbidity:22.1%• LowImmuniza^onCoverage• Poorfeedingprac^ces• OutbreakAWD• LimitedHumanitarianassistance• Conflictsandsecurityconcerns
• Socialsupport/Remikance• Nutri^onalinterven^oninsomesites.• Labouravailability
MogadishuIDPs
• Highmorbidity(29.6%)inMogadishuIDPs.• Con^nuedevic^onofIDPsfrompublicandprivate
landbuilding.• LowImmuniza^onCoverage(VitaminA,and
Measlesvaccina^on<40%)• Arrival new IDPs. • Limited labor opportunity • Seasonal diseases like AWD • Decreased interventions
• Socialsupport.• Nutri^onalinterven^onsites(limited)
KeyDrivingFactors

SEZoneNutri7onSitua7onCurrentandProjected
CurrentNutri7onSitua7on,DeyrJan2017
Thenutri7onsitua7on:BothShabelleAgro-pastoralandShabelleRiverinelivelihoodshassustainedSerious.MogadishuIDPdeterioratedfromSerioustocri^calProjec7onfornext3months:BothShabelleRiverineandShabelleAgropastoralarelikelydeterioratetoCri7cal.MogadishuIDPislikelytosustaincri7cal
Projec7onNutri7onSitua7onFeb-April2017
,
Nutri7onSitua7on,Gu,2016
Photosforshabelle


Acknowledgements
• MOH• SWISS-Kalmo• INTERSOS• ZAMZAM• SORDO• SOYDA• Surveyareacommikees• SurveyTeams• FSNAUfieldStaff•FSNAUNutri^onTeaminNairobi• Nutri^onCluster-Somalia

ThankYou Ques^ons/Comments
SE-TeamMoalimMohamed,BashirMohamed
Weyrah,andAbukarYusuf