Embed Size (px)
Citation preview

WHO Efforts to Enhance Access to Vaccine Supply
Information for Access
Tania Cernuschi, Vaccine Supply | Supply, Technologies, and Financing
Expanded Programme on Immunization (EPI) | Department of Immunization, Vaccines and Biologicals (IVB)
www.who.int
UNICEF Vaccine Industry Consultation – Copenhagen, October 2017

SUSTAINABLE FINANCING AND SUPPLY FOR IMMUNIZATION – WHO’s work
1 Improving country regulatory environmentNRAs strengthening, streamlining of registration
requirements, PQ programme
2 Guiding vaccine research and development R&D Blueprint – priority pathogens & TPPs, position
papers
3 Financing for vaccines and immunization CMYPs, immunization financing assessments,
monitoring of financial flows & advocacy
4 Strengthening national supply chain systems EVMs, stock-out monitoring, Gavi supply chain
strategy
5 Scaling up innovative products and thermostability CTC, new delivery technologies & packaging, TSE
6 Stockpiling of vaccines for outbreak responseYF, cholera, meningitis, influenza, polio, smallpox
7 Information for accessMarket intelligence for policy making & country
support
Why are we
engaging?
3
WHO’s work in context

4Source: Global Vaccine Market Model (GVMM) Demand Module, Linksbridge, SPC, Bill & Melinda Gates Foundation funded project, July 2017
Global vaccine demand & partner support mapped
Gavi partners shape market
for and fund specific vaccines
in poorer countries (~70)
UNICEF procures
for Gavi-eligible
countries and
some non-Gavi
Middle Income
Countries (~100)
The PAHO RF supports
financing and
procurement in the
American Region (~40
countries)
Self-procuring
countries lack
market information
& support and face
challenges to
access.
Increasing GNI per capita

5Source: WHO GVAP Report 2017 – WUENIC/JRF data
Access to vaccines in MICsNon Gavi MICs represent almost 40% PCV3 unimmunised and 50% of countries with
declining DTP3 coverage
Infants not immunised with PCV3 (2016) Drop in DTP3 Coverage (2010-2016) – non-Gavi MICs

6
Member States have asked WHO to take action
Resolution 54.11 – WHA -May 2001
Obj. 5 Global Vaccine Action Plan -GVAP
SAGE Recommendation - MIC Strategy
Resolution 68.6 – WHA - May 2015
Resolution 69.25 – WHA – May 2016
SAGE Recommendation April 2015

Information for Access in a nutshell
Collecting, analyzing and
distributing
price/procurement/
demand/supply data
Technical assistance to
countries to access supply
Guiding supply and demand
dynamics to address vaccine
shortages
Designing strategies to
enhance affordability
Conducting in depth global
market analysis for vaccines
at risk
Guidelines/tools for country
forecasting & procurement
1
23
What information
do we have and how
can it be used?
8
Global Vaccine Market Intelligence Hub (V3P+)
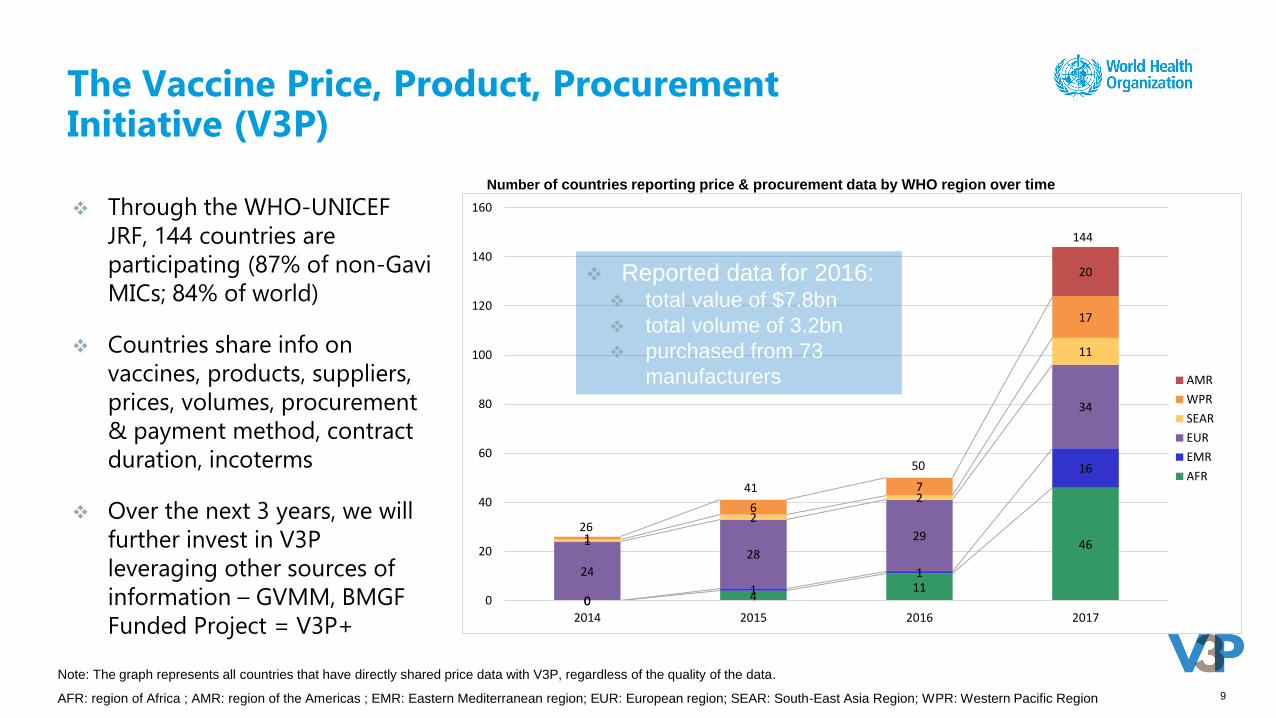
The Vaccine Price, Product, Procurement Initiative (V3P)
Note: The graph represents all countries that have directly shared price data with V3P, regardless of the quality of the data.
AFR: region of Africa ; AMR: region of the Americas ; EMR: Eastern Mediterranean region; EUR: European region; SEAR: South-East Asia Region; WPR: Western Pacific Region 9
Through the WHO-UNICEF
JRF, 144 countries are
participating (87% of non-Gavi
MICs; 84% of world)
Countries share info on
vaccines, products, suppliers,
prices, volumes, procurement
& payment method, contract
duration, incoterms
Over the next 3 years, we will
further invest in V3P
leveraging other sources of
information – GVMM, BMGF
Funded Project = V3P+
0 411
46
01
1
16
24
28
29
34
1
2
2
11
1
6
7
17
20
26
41
50
144
0
20
40
60
80
100
120
140
160
2014 2015 2016 2017
AMR
WPR
SEAR
EUR
EMR
AFR
Number of countries reporting price & procurement data by WHO region over time
Reported data for 2016: total value of $7.8bn
total volume of 3.2bn
purchased from 73
manufacturers

What is the information gap and how can we close it?
10
Identifying price ranges and
supplier, product,
procurement options
Countries lack visibility into vaccine
markets for decision making
Informed planning
& procurement
leading to
sustainable demand
1BENEFITNEED ENABLER
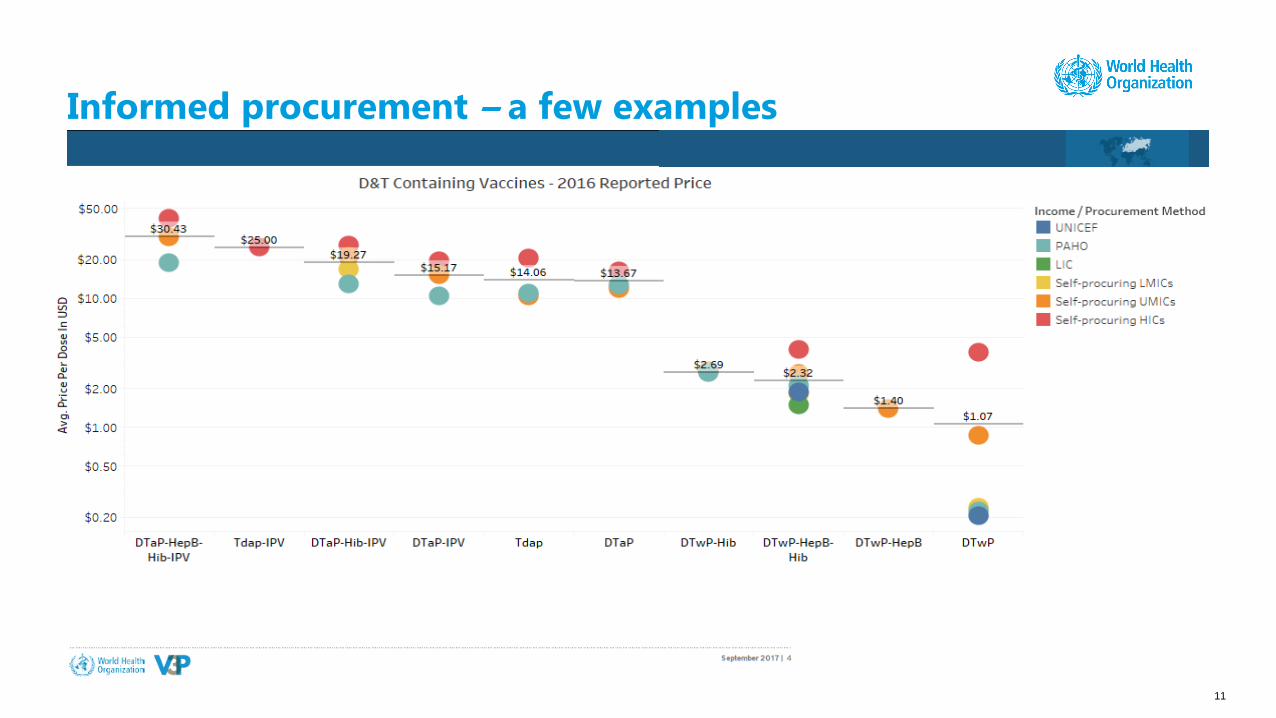
Informed procurement – a few examples
11

What is the information gap and how can we close it?
12
Identifying price ranges and
supplier, product,
procurement options
Complement existing
information on vaccine markets
from Gavi, UNICEF and PAHO RF
Missing global view of vaccine
market preventing risk
management
Countries lack visibility into vaccine
markets for decision making
Informed planning
& procurement
leading to
sustainable demand
Informed risk
identification &
target actions
to manage
vaccine
shortages
1
2
BENEFITNEED ENABLER
27/09/2017 | Information for Access 13
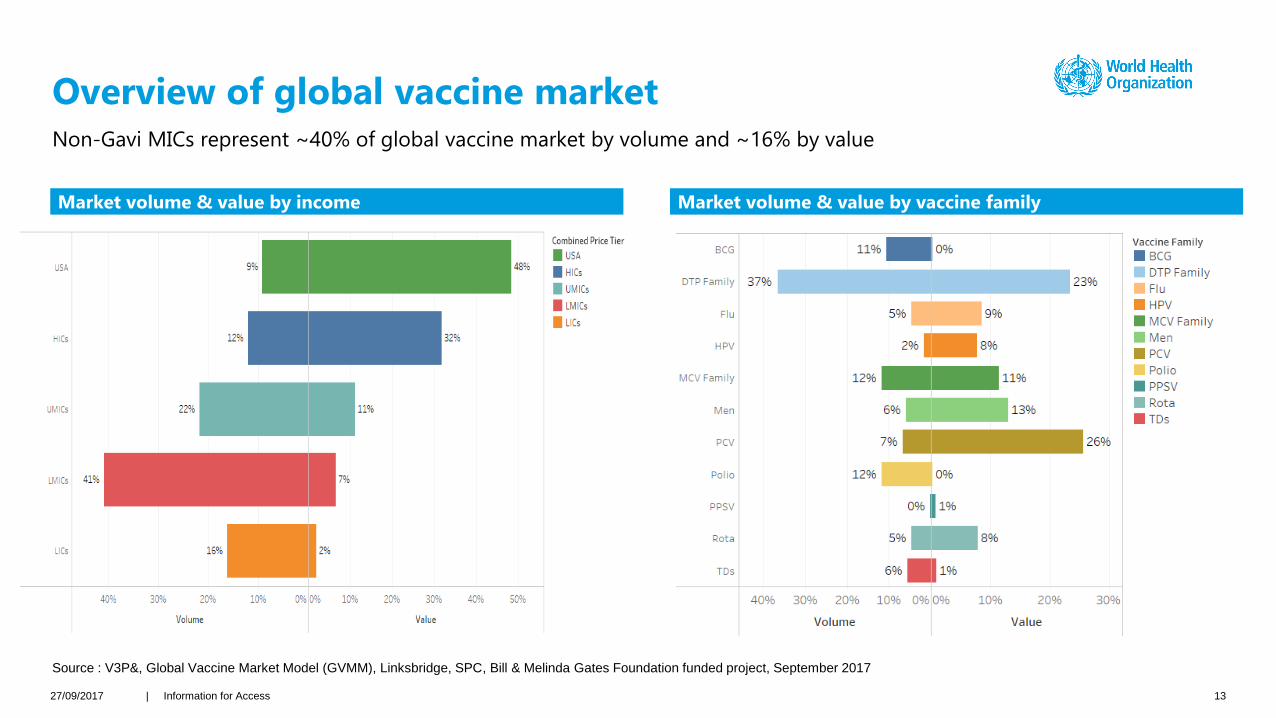
Overview of global vaccine market Non-Gavi MICs represent ~40% of global vaccine market by volume and ~16% by value
Market volume & value by income Market volume & value by vaccine family
Source : V3P&, Global Vaccine Market Model (GVMM), Linksbridge, SPC, Bill & Melinda Gates Foundation funded project, September 2017

What is the information gap and how can we close it?
14
Identifying price ranges and
supplier, product,
procurement options
Complement existing
information on vaccine markets
from Gavi, UNICEF and PAHO RF
Completing understanding
of global pricing dynamics
Several countries cannot access
sustainable & fair pricing
Missing global view of vaccine
market preventing risk
management
Countries lack visibility into vaccine
markets for decision making
Informed planning
& procurement
leading to
sustainable demand
Informed risk
identification &
target actions
to manage
vaccine
shortages
Informed dialogue
on fair pricing
1
2
3
BENEFITNEED ENABLER

Informed dialogue on fair pricing
Note: The boxes on the graph show the median (centre of the box), a box above and below the median for the nearest quartiles, and a set of “whiskers” that extend to the entire data range. 15
There is a clear association
between GNI per capita and
price level
We also observe larger price
variation for higher income:
• non-Gavi MICs, max
price = 14x min
• HICs, max price = 30x
min
We can improve transparency of
pricing strategies and
encourage fair pricing to
strengthen access
Minimum, maximum and median price by country category for PCV, 2016

Fair Pricing Forum
& Humanitarian
Mechanism
27/09/2017 | Information for Access 16
Policies & strategies to enhance access

A global dialogue to explore strategies for establishing fair prices that is sustainable for
health systems and for innovation
Participants: 250 participants from Member states,
IGOs, NGOs, academia and industry
Organized jointly by WHO and the Ministry of
Health, Welfare and Sport of The Netherlands
The Forum took take place in Amsterdam, the
Netherlands on 10-11 May 2017
For more information, please see
http://www.fairpricingforum2017.nl/home
27/09/2017 | Information for Access 17
Source: WHO EMP
Fair Pricing Forum

WHO, UNICEF, MSF and Save the Children have
launched the Humanitarian Mechanism in May 2017
Aim: to facilitate timely access to affordable supply for entities such as Civil Society Organizations,
Governments or UN Agencies who are procuring on behalf of populations facing humanitarian emergencies
The mechanism currently covers access to PCV vaccines
by CSOs and UN agencies from all available
manufacturers at US$ ~ 3 per dose
Since launch, the mechanism has been used 6 times (+3
during pilot phase)
WHO, UNICEF, MSF and Save the Children encourage all
vaccine manufacturers to offer additional relevant
products under the mechanism
27/09/2017 | Information for Access 18
The Humanitarian Mechanism
How do we support
countries?
27/09/2017 | Information for Access 19
Tools for countries

10/10/2017 | Title of the presentation 20
Price, procurement, market fact sheetsWe are testing different tools to share information with countries
Country Fact Sheets Prices for Gavi Transitioning Countries
PCV
Intro
with
Gavia
GSK
2-dose vialbPfizer
1-dose vial
Pfizer
4-dose vial
Angola NE $3.30 $3.10
Armenia NE $3.30 $3.10
Azerbaijan NE $3.30 $3.10
Bhutan X $3.50/3.05c$3.30 NE
Bolivia NE $3.30 $3.10
Congo, Rep NE $3.30 $3.10
Cuba X $3.50/3.05c $3.30 NE
Georgia $3.50/3.05 $3.30 $3.10
Guyana NE $3.30 $3.10
Honduras NE $3.30 $3.10
Indonesia X $3.50/3.05c $3.30 NE
Kiribati NE $3.30 $3.10
Moldova NE $3.30 $3.10
Mongolia NE $3.30 $3.10
Nicaragua NE $3.30 $3.10
PNG NE $3.30 $3.10
Sri Lanka X $3.50/3.05c $3.30 NE
Timor-Leste X $3.50/3.05c $3.30 NE
Ukraine X NE $3.30 NE
Uzbekistan NE $3.30 $3.10
Vietnam X $3.50/3.05c $3.30 NE

How can we best
work together?
27/07/2017 | Information for Access 21
Engaging suppliers

We regularly collect information from countries, UNICEF,
PAHO RF on vaccine procurement
We also collect information from suppliers on ad-hoc
basis. Would manufacturers engage to share information more regularly? E.g. products, registration
Would it be useful to also regularly collect demand forecasts from self-procuring countries?
What other information would suppliers find useful to
enhance access?
How best to share information collected and results of
analysis?
What are the key efforts on supply and demand side that
must accompany V3P?
22
How can we best work together?

www.who.int
Thank you!
Tania Cernuschi, Vaccine SupplySupply, Technologies, and FinancingExpanded Programme on Immunization (EPI)
Dept of Immunization, Vaccines and Biologicals