Embed Size (px)
Citation preview

Statistics for financial sector development and stability
Dr Lau Wee Yeap
Faculty of Economics and Administration, University of Malaya
Information flow between non-deliverable forward, spot
and forward markets in Malaysian currency during the
Pre and Post U.S. QE Exit

Introduction
2
• As an emerging market, Malaysian currency is under the regime of managed float. In other words, the exchangerate of Ringgit-Dollar (MYR/USD) is allowed to fluctuate based on supply and demand, but at times, Bank NegaraMalaysia will intervene to influence the value.
• Ringgit is not an international currency, and hence its value is derived from the major currencies.
• In the spate of 27 months (30 Oct 2014 – 31 Jan 2017) after FOMC ended its asset purchase program during theirmeeting on 29-30 October 2014, Malaysian currency suffered a decline of 26 percent.
• Another observation was when Donald Trump won the U.S. election on 8 November 2016, there was anotherround of decline.
• While external factors such as the decline of oil price and capital outflow cause the decline of Ringgit, the activitiesof offshore Ringgit forward has also been mentioned as one of the causes.
• This issue of NDF became the headline on 2 December 2016 when Bank Negara Malaysia imposed a rule forexporters to convert 75 percent of their proceeds denominated in foreign currency to Ringgit.
• The objective of this policy is to increase the reserve, decrease the volatility and stabilize the value of Ringgit.

3
2.5
3
3.5
4
4.5
3/1/2011 3/1/2012 3/1/2013 3/1/2014 3/1/2015 3/1/2016 3/1/2017
Figure 1: USDMYR Spot Some facts:
• In a spate 27 months from the end October 2014 to
January 2017 after the end of US QE, the value of
Malaysian currency Ringgit dropped 26 percent
relative to the US Dollar (Figure 1)
• Decline of oil price, capital outflow, and the activities
of offshore Ringgit forward contribute to the
depreciation of Ringgit Malaysia.
• NDF has also been claimed to cause the decline of
the value of Malaysian currency.

Research Objective
Transmission channel• This study intends to investigate the relationship
between the spot, forward and NDF in this respect,
and in an extended model, other financial variables
are also being included.
• Hypotheses are developed to test for the
information flow between the variables.
Impulse response• The study will also look into the impulse response
function given the shock to the key variables
identified in the transmission channel.
4
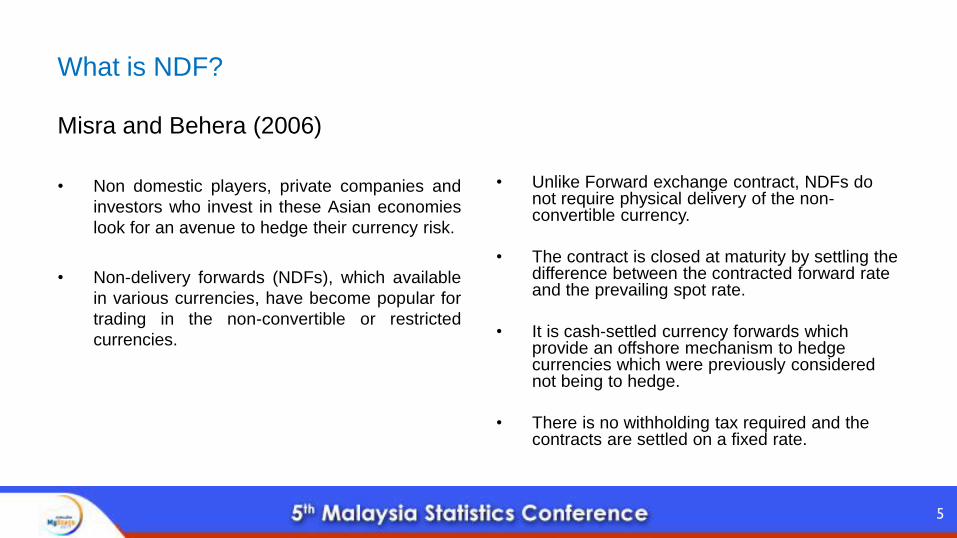
What is NDF?
Misra and Behera (2006)
• Non domestic players, private companies and
investors who invest in these Asian economies
look for an avenue to hedge their currency risk.
• Non-delivery forwards (NDFs), which available
in various currencies, have become popular for
trading in the non-convertible or restricted
currencies.
• Unlike Forward exchange contract, NDFs do not require physical delivery of the non-convertible currency.
• The contract is closed at maturity by settling the difference between the contracted forward rate and the prevailing spot rate.
• It is cash-settled currency forwards which provide an offshore mechanism to hedge currencies which were previously considered not being to hedge.
• There is no withholding tax required and the contracts are settled on a fixed rate.
5

6

Quantitative Easing
7
• Quantitative easing (QE) was widely used by the central bank in advanced countries in the
aftermath of the 2007-08 financial crisis in an attempt to deal with the sluggish economy.
• In November 2008, the U.S. Federal Reserve (Fed) announced to initiate “QE1” by purchasing
$100 billion in government-sponsored enterprises (GSE) debt and $500 billion in mortgage-
backed securities(MBS). It was followed by “QE2” in November 2010 and “QE3” in September
2012 to boost economic activity.
• The FOMC ended its asset purchase program during their meeting on 29-30 October 2014.

8
Literature Review: Overview of NDF
• Patrick Higgins and Owen F. Humpage (2005)
- NDF contract gain popularity among investors since early 1990s. Many use the exchange rate onthese contract as a best guess of where the emerging market currency is headed.
• Ishii, Shogo; Otker-Robe, Inci; Cui, Li (2001)
- The offshore transaction in domestic currency will lead to a reduction in the ability of theauthorities to conduct an independent monetary policy, especially under fixed exchange rate regime.Moreover, offshore transaction have a destabilizing influence on the onshore foreign exchangemarket.
• Lipscomb, L. (2005)
- Once a country moves to a more convertible exchange rate regime and permitted transaction inNDF, NDF market liquidity can potentially contribute to liquidity and volume in onshore currencymarket.
• Ma, G., C. Ho dan R. N. McCauley, (2004)
- Asia’s NDF turnover accounts for the overwhelming majority (70%) of global NDF turnover. NDFvolatilities have been consistently higher than their spot counterparts and the volatility of the AsianNDFs typically increases with maturity.

9
Literature review:
Information transmission and spillover effect of NDF
• Park, J. (2001)
- NDF granger cause spot market in the post-Korea exchange rate reform period. Moreover, mean
and volatility spillover effect from NDF to the spot market in post-reform period can be observed.
• Colavecchio and Funke (2006)
- They use multivariate GARCH method and found that Renminbi NDF has determined several of
Asian currency markets in various levels.
• Mehra, S. dan H. Behera, (2006)
- NDF market in Indian influenced by spot and forward market. Furthermore, mean spillover effect
exist from spot and forward market to NDF market. However, volatility spillover is observed in the
reverse direction.
10
Recent study
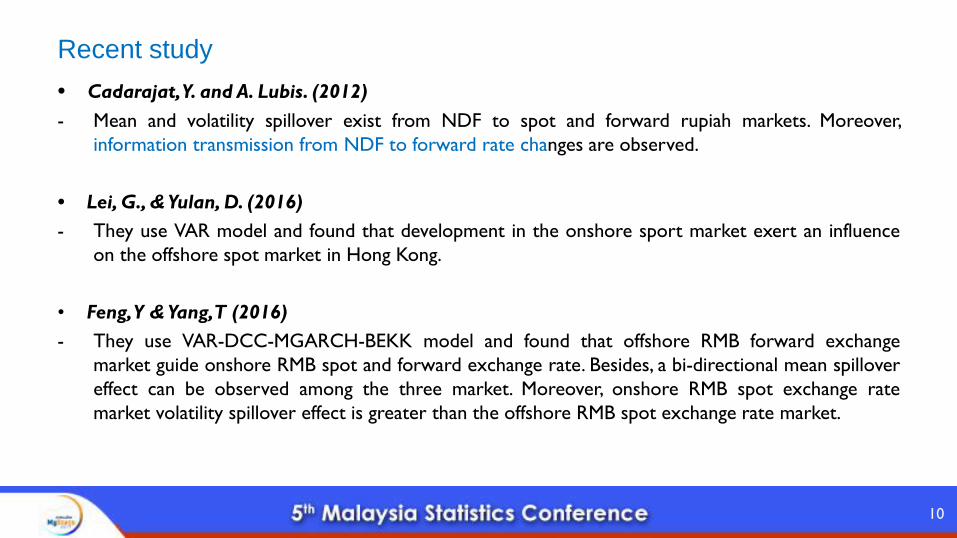
• Cadarajat,Y. and A. Lubis. (2012)
- Mean and volatility spillover exist from NDF to spot and forward rupiah markets. Moreover,
information transmission from NDF to forward rate changes are observed.
• Lei, G., & Yulan, D. (2016)
- They use VAR model and found that development in the onshore sport market exert an influence
on the offshore spot market in Hong Kong.
• Feng,Y & Yang,T (2016)
- They use VAR-DCC-MGARCH-BEKK model and found that offshore RMB forward exchange
market guide onshore RMB spot and forward exchange rate. Besides, a bi-directional mean spillover
effect can be observed among the three market. Moreover, onshore RMB spot exchange rate
market volatility spillover effect is greater than the offshore RMB spot exchange rate market.

Hypothesis development
• H1: In Post-QE period, NDF will affect the spot market.
• H2: In the Post-QE period, NDF will affect the forward market.
• H3: In the Post-QE period, International Reserve will affect the spot market.
• H4: In the Post-QE period, International Reserve will affect the MGS
• H5: In the Post-QE period, Federal Fund Rate will affect the MGS
11

12
Data
Table 1: List of variables

Data
Sample period
• The first model comprises of the daily returns of
spot, forward, non-delivery forward from 3
November 2010 to 1 September 2017.
• The sample period is further divided into two sub-
periods.
• The first sub-period is from 3 November 2010 to 30
September 2014.
• The second sub-period is from 30 October 2014 to
1 September 2017 of which marks the post U.S. QE
period.
• The second model comprises of monthly data from
the same sub-periods.
• Moreover, U.S. Federal Fund Rate, Malaysia
Government Securities 10-year yield and
International Reserve are added.
• International Reserve is a monthly data.
13

14

15
Methodology
• Unit Root Test (ADF and KPSS).
• Vector Autoregressive Model (VAR)
• Granger’s Causality Test
• Impulse Response Function

16
Descriptive Statistics
First data set: 3 November 2010 to 1 September 2017 (Daily data)
Variable Mean (%)Standard deviation
(%)Skewness Kurtosis J-B statistic
US QE period
RSP 0.0006 0.0004 -0.2032 6.2699 461.4481(0.00)
RFWD 0.0005 0.0040 -0.2576 6.4561 518.9422(0.00)
RNDF 0.0006 0.0045 -0.0887 6.2015 436.9682(0.00)
Post -US QE period
RSP 0.0003 0.0053 -0.6064 7.5998 701.5330 (0.00)
RFWD 0.0003 0.0054 -0.5572 7.3779 632.6607 (0.00)
RNDF 0.0003 0.0104 0.6853 125.132 462464.6 (0.00)

17
Unit Root and Stationarity Test Results
Variable
ADF test KPSS test
Level First difference Level First difference
US quantitative easing period
RSP -31.01(0)** 0.05(10)
RFWD -31.40(0)** 0.05(9)
RNDF -33.81(0)** 0.04(11)
Post-US quantitative easing period
RSP -25.72(0)** 0.35(4)
RFWD -25.72(0)** 0.35(5)
RNDF -26.99(0)** 0.29(8)
The asterisks ** denote significance at 5% levelFigures in parentheses are the optimal lag length chosen.
(First data set)

Granger causality test result (First data set)
18

19
Granger Causality
First data set: 3 November 2010 to 1 September 2017

20
Impulse response
First data set After the QE ended
-.001
.000
.001
.002
.003
.004
2 4 6 8 10 12 14 16 18 20 22 24 26 28 30 32
Response of RSP to RNDF
-.002
-.001
.000
.001
.002
.003
.004
.005
.006
2 4 6 8 10 12 14 16 18 20 22 24 26 28 30 32
Response of RSP to RNDF

21
Impulse response- First data set: 3 November 2010 to 1 September 2017
After the QE ended
-.001
.000
.001
.002
.003
.004
2 4 6 8 10 12 14 16 18 20 22 24 26 28 30 32
Response of RFWD to RNDF
-.002
-.001
.000
.001
.002
.003
.004
.005
.006
2 4 6 8 10 12 14 16 18 20 22 24 26 28 30 32
Response of RFWD to RNDF

22
Descriptive Statistics
Second data set: Nov 2010 to Sept 2017

Unit Root and Stationarity Test Results (Second data set)
23

24
Granger causality test result ( Second data set)
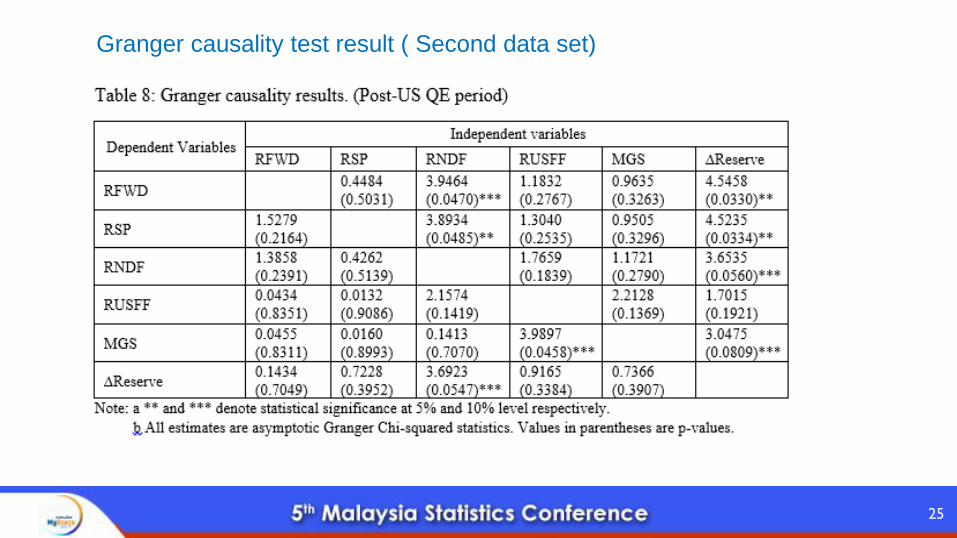
25
Granger causality test result ( Second data set)

26
Granger Causality Test Results
Second data set

27
Impulse response-
Second data set: November 2010 to September 2017

Key results
• H1: In Post-QE period, NDF granger causes the spot market.
• H2: In the Post-QE period, NDF granger causes the forward market.
• H3: In the Post-QE period, International Reserve granger causes the spot market.
• H4: In the Post-QE period, International Reserve granger causes the MGS
• H5: In the Post-QE period, Federal Fund Rate affects the MGS
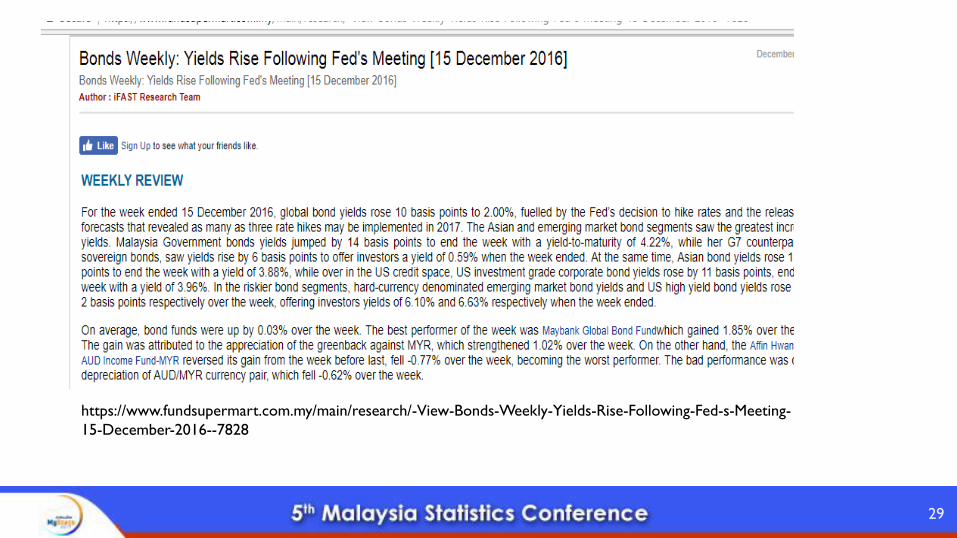
• As interest rates increase, demand for short-term bonds, such as the 2-year, 5-year, and 10-year Treasury bonds decreases. In turn, this has the effect of driving down prices for these instruments and increasing associated yields.
28
29
https://www.fundsupermart.com.my/main/research/-View-Bonds-Weekly-Yields-Rise-Following-Fed-s-Meeting-
15-December-2016--7828
30
Conclusion
• First, during QE, bidirectional causality can be observed between NDF and spot, NDF and
forward, spot and forward.
• Second, NDF offshore market has dictated the movement of spot and forward on onshore
market in post-QE exit period.
• These empirical results underscore that the NDF offshore market has dictated the
movement of spot and forward on onshore market in post QE period.
• In the extended model, it is observed that MGS has important role in Pre-QE period while
International Reserve is a variable that provides feedback to spot, forward and NDF
markets in the post-QE era.
• The policy that aims to enhance the reserve is well justified based on the empirical results.


![__gloabl__ proc(float *arr,float *brr){ float v; __shared__ float shared[L]; shared[threadIdx.x] = brr[threadIdx.x]; __syncthreads(); if(threadIdx.x!=0){](https://img.pdfslide.us/doc/110x75/56649eeb5503460f94bfc7bd/gloabl-procfloat-arrfloat-brr-float-v-shared-float-sharedl.jpg)