Embed Size (px)
Citation preview

Information Communities: The
Network Structure of Communication
_______________
Peter Pal ZUBCSEK
Imran CHOWDHURY
Zsolt KATONA
2008/64/OB/MKT
Information Communities: The Network
Structure of Communication
By
Peter Pal Zubcsek*
Imran Chowdhury**
And
Zsolt Katona***
October 14, 2008
* PhD Candidate in Marketing at INSEAD, Boulevard de Constance 77305 France.Ph: +33 (0) 1 60 72 25 77 Email : [email protected]
** PhD Candidate in Organizational Behaviour at INSEAD, Boulevard de Constance 77305 France.
Email : [email protected] *** Assistant Professor of Marketing at Haas School of Business 2220 Piedmont Avenue (delivery address)
University of California at Berkeley Berkeley, CA 94720-1900 Ph: +1 (510) 643 0658 Email: [email protected]
A working paper in the INSEAD Working Paper Series is intended as a means whereby a faculty researcher's thoughts and findings may be communicated to interested readers. The paper should be considered prel iminary in nature and may require revision. Printed at INSEAD, Fontainebleau, France. Kindly do not reproduce or circulate without permission.
Information Communities:The Network Structure of Communication1
Peter Pal Zubcsek, Imran Chowdhury and Zsolt Katona2
October 14, 2008
1Preliminary version, comments welcome.2Peter Pal Zubcsek is Ph.D. student in Marketing and Imran Chowdhury is Ph.D. student in Organizational Behav-
ior at INSEAD, Bd. de Constance, 77305, Fontainebleau, France. Zsolt Katona is Assistant Professor of Marketingat the Haas School of Business, University of California at Berkeley, Berkeley, California 94720-1900. E-mail: [email protected], [email protected], [email protected]. Tel.: +33 1 60 71 25 77 Fax:+33 1 60 74 55 00.

Abstract
This project gives a general definition of communities in the context of communication networks, an
important and well-studied category of social networks. Our work mathematically justifies the claim that
sparse network ties, as opposed to tightly structured solidarity groups, can form a foundation for locating
social communities. We develop and test a model of communities based on a novel set of assumptions.
Empirical tests in two sets of communication networks show that this model is more useful for identifying
groups of individuals that have strong internal relationships in closed networks than those defined by more
general models of network closure. These findings extend the scope of network closure effects proposed by
other researchers working with communication networks.
Keywords: communities, social networks, communication, network closure
1

1 Introduction
What is the structure of communication in social communities? Prior work in network sociology demon-
strates that geographic boundaries and local solidarities are only part of the story when it comes to deter-
mining how groups of densely-knit individuals come together to form a social community. Analysis of
interpersonal networks, which takes as its starting point the search for social linkages and flows of informa-
tion and resources between individuals, makes possible the discovery of network-based communities which
are not based on geographic proximity or a particular set of solidarity sentiments (e.g., family connections).
Thus, informal links can also serve as conduits for information, companionship, and aid between far-flung
individuals embedded in overlapping interpersonal networks, which form the basis for large-scale social
structures (Wellman 1979, Wellman and Leighton 1979).
A separate line of research, relying on results from graph theory, examines communication patterns in
these larger structures, which are not just limited to the social realm (Girvan and Newman 2002, Jain and
Dubes 1988, Palla, Derényi, Farkas, and Vicsek 2005). In this schema, communities are defined as clusters
of the whole network in which actors are more densely connected to each other than they are to actors in
other communities. While prior work has suggested that connectivity and communication in networks are
worthy of study (Lazer and Friedman 2007, Uzzi and Spiro 2005, Watts 1999), there are several important
theoretical and empirical gaps in our understanding of how communication patterns in large-scale networks
apply to social communities.
This paper links work in community sociology with network research in applied graph theory to expli-
cate communication patterns in large-scale social networks. Building on network closure theory (Burt 2005,
Coleman 1988), we outline a generalized mathematical model for constructing information communities, or
sections of the whole network in which the intensity of communication between individuals is greater than
in other areas of the network. In particular, we concentrate on large-scale organizational networks, espe-
cially those in which the potential benefits of closure for the organization exceed the potential benefits of
brokerage. The method of identifying communities we detail provides greater methodological flexibility to
2

network researchers, who can specify parameters based on substantive criteria pertaining to the specific data
they are working with. The model thus allows communities to become more loosely defined (that is, they
exhibit lower global connectivity) or tightly defined (higher global connectivity) as required by the question
under study.
Three special classes of information communities are presented in this paper: (1) the set of cliques in the
network (Burt 1992, Rowley, Baum, Shipilov, Greve, and Rao 2004); (2) the uniform communities model
defined by Palla et al. (2005); and (3) our model of variable clique overlap, derived from a novel set of
assumptions specifying the structure of social communities.
We empirically test the efficacy of these three models on two separate datasets: (1) a two-year collection
of email data from the now-defunct Enron Corporation of Houston, TX; and (2) 3 months of call records
for approximately 70,000 subscribers to a fixed-line telephone operator in Eastern Europe. Our primary
focus is on determining the extent to which each model is able to identify relationships which may serve
as important communication channels in an organizational context. Results from these studies demonstrate
that in several respects, the variable overlap model outperforms both the clique-only community model and
Palla et al.’s (2005) uniform communities model.
In the next section, we summarize concepts drawn from the sociological literature on communities and
network structure. Section 3 provides the mathematical details of our general model and develops a new
way of looking at communities which builds on research from applied graph theory. Section 4 develops
hypotheses to be tested. In section 5, we apply the three community parameterizations on the two datasets
and present our empirical methods and results. We conclude with a summary of our findings, suggestions
for future research, and potential applications in section 6.
3

2 Theoretical Background
2.1 The Concept of Communities
The issue of communities in sociology, and in particular the social networks literature, is one with deep
theoretical and empirical roots. Originally, the study of communities related most strongly to the impact of
society’s bureaucratization and industrialization on a variety of primary ties between individuals, including
ties between neighbors, family members, co-workers, and other salient groups in the life of an individual. In
this way researchers attempted to link macroscopic social structures to micro-level interactions between indi-
viduals (Jacobs 1961, Wellman 1979), and from their efforts, three primary views of communities emerged.
The first, or “lost” view, focuses on the disorganizing affects of decreased community solidarities. Large
community size is often negatively correlated with behaviors such as formal volunteering, working on public
projects, and informal help to friends and strangers (Putnam 2001). This is related to the fact that individuals
who reside in large communities tend to spend less time socializing with each other on a personal basis
and therefore have fewer opportunities to form the common affiliations with local-level groups, such as
bowling leagues or parent-teacher associations, which are thought to promote social cohesion. The second
view of networks is more “hopeful.” In this “saved” perspective, communal solidarities of neighborhood,
community and kinship persist in the face of increasing industrial bureaucratization due to communal desires
for informal social control and support and sociability (Wellman 1979). The third view of communities is the
“liberated” perspective, which focuses on weak solidarity attachments, rather than tightly-bounded, dense
ties, as the basis of a community (Wellman 1979).
Subsequently, social networks scholars took up the community question with their unique methodolog-
ical approach, focusing primarily on the liberated view of communities. They abandoned the local area as
a starting point for analyzing groups and instead focused directly on the structure of primary ties between
individuals. Wellman and Wortley (1990) define an individual’s personal community network as the set of
active community ties held by a particular individual. This set of contacts is usually socially diverse, spa-
4

tially dispersed, and sparsely knit. Looking at the organizing principles of communities, Wellman (1979)
and other community researchers using network methods thus turned our attention from shared geographi-
cal resources or shared resources of labor division to shared means of communication - in other words, to
consider the connection patterns among individuals in a network.
Extending these findings to communication networks, we show that communities are organized in line
with key principles of network closure theory. In other words, even with sparse ties between cliques of
individuals, redundant contacts within groups can provide wide bandwidth for the flow of information. As
Carley (1991) has noted, interaction between individuals, whether in-person or virtually, leads to shared
knowledge, and this relative shared knowledge leads to even more interaction, a finding that has important
implications for the stability of the group and its interaction with individuals outside its realm. We therefore
dedicate special attention to communication relationships among individuals. This allows us to focus on
basic principles governing the structure of communities in large-scale social networks.
To do this, we now turn to the structural analysis of communities in the literature derived from graph
theory and mathematical networks. In this literature communities are generally viewed as dense subgraphs
of the whole network which allow, via their structure, information transmission through various independent
routes (Guimerà, Mossa, Turtschi, and Amaral 2005). While this definition has proved useful for the kinds
of analyses performed by mathematical social scientists, physicists, and others working with networks in
general, a specific link has yet to be made to the communities literature in sociology. We aim to fill this
gap, and link these two streams of research. Our goal is to achieve a greater understanding of the structural
aspects of communities, and a more individual- and group-oriented view of networks that is grounded in
human interaction. Whereas prior work on communities has looked at community structure in the context of
non-social (biological, physical, etc.) as well as social networks, our research is focused on social networks
in organizations. Following the thread started by Everett and Borgatti (1998), we aim to further develop the
theoretical foundations upon which subsequent applied research on communities can be built.
As noted by Newman and Park (2003), while all networks share some common properties - whether they
5
are networks of people, movie stars, web sites, etc. - social networks are in certain respects systematically
different from non-social networks. The primary differences lie in two areas. In the first instance, in social
networks the total number of connections (i.e., the degree) of adjacent nodes is positively correlated. That
is, as the number of friends an individual has goes up, the number of friends of friends also goes up. This
does not hold for non-social networks, where the degree of adjacent nodes is actually negatively correlated.
A second important difference between social and non-social networks arises from the fact that social
networks have very high degrees of clustering relative to non-social networks. Even where spatial density is
low, certain segments of social networks have a high density of interactions. From this observation it follows
that social networks have a greater tendency to partition themselves into densely-knit community groupings
relative to non-social networks. These groupings create positive degree correlation through their differential
size distribution in the following sense: individuals in smaller groupings will be more likely to be tied to
other individuals in the same grouping and vice versa.
In the context of a social network, we can therefore imagine a community as a tight-knit circle of, for
instance, friends or research group members, which is only loose connected, albeit through a number of
possible routes, to similar groups outside its realm (Girvan and Newman 2002, Palla et al. 2005, Pollner,
Palla, and Vicsek 2006). Theoretically, understanding the nature of these connections will help underscore
the links between network structure and function. Further, a more nuanced view of communities in the
organizational realm may yield numerous practical benefits.
2.2 Network Closure Theory and Social Capital
The structure of tightly-knit groups of individuals can be further broken down by broadly examining group
characteristics and their impact on social behavior. To this end, we briefly turn to the work of Coleman,
who introduced the term “social capital” as a concept to characterize resources arising from the pattern of
relations among individuals (1988). Specifically, Coleman envisioned three sub-types of social capital: (1)
obligations and expectations; (2) the information-flow capability of the social structure; and (3) emergent
6
group norms. In this paper we concentrate on the second form of social capital, namely how the social
structure of a particular network affects information flow and thus influences outcomes and behaviors.
An important property which relates to this second form of social capital is the potential for information
acquisition by means of social relations. Information is important as a basis for action, but its’ acquisition
can be a relatively costly undertaking. Using social relations that exist for other purposes is one way to
bypass these information acquisition costs. For instance, in an organizational setting an employee who is
not greatly interested in the latest behind-the-scenes manoeuvrings in her company but who nevertheless
needs to be “in the loop” for the purposes of performing her job can rely on a co-worker who pays attention
to such matters more carefully.
The relation in this case is valuable for the information it provides, and the individual who provides
news on organizational politics is relatively well-connected to channels of such information (other people
“in the know”) when compared to their co-worker. In other words, they are acting as “broker” between their
co-worker, who requires specific information, and other colleagues, who have the information they need.
This act of brokering information provides potential rewards (i.e., reciprocal information transmission and
influence in the future), and thus increases the social capital of the broker within the network (Burt 1992).
At a structural level, this information acquisition phenomenon is also related to the idea of the clique.
People’s informal social relations tie them into relatively cohesive sub-groupings, or cliques, which possess
their own norms and values, and which may run counter to the formal social structure of the organization
(or other social grouping) within which it is found. Cliques are often among the most important sources of
a person’s identity and sense of belonging and have the potential to strengthen relations between individuals
(Scott 2006). The presence of a third (or fourth, or fifth, etc.) party can curb disagreement and provide a
basis for reaching consensus as a means for maintaining harmony within the group (Krackhardt 1999).
Cliques are important to understanding the concept of network closure. As noted by Burt, networks
in which people are very highly connected to each other, that is, where two actors are both connected to
the same third-parties, are better at transmitting information. As the strength of third-party ties connecting
7
two people increases, the network around them becomes more closed (Burt 2005). Thus, closure in an
organizational setting is measured by the strength of the indirect connections between individuals with
colleagues acting as third parties. In this schema, some individuals are more strongly connected through
third parties than others in the study population. Relationships of such individuals are said to be strongly
embedded in the closed network. One of the important outcomes of strongly embedded close relationships is
an increase in trust between individuals, which can lead to increased information transfer as well (Coleman
1990).
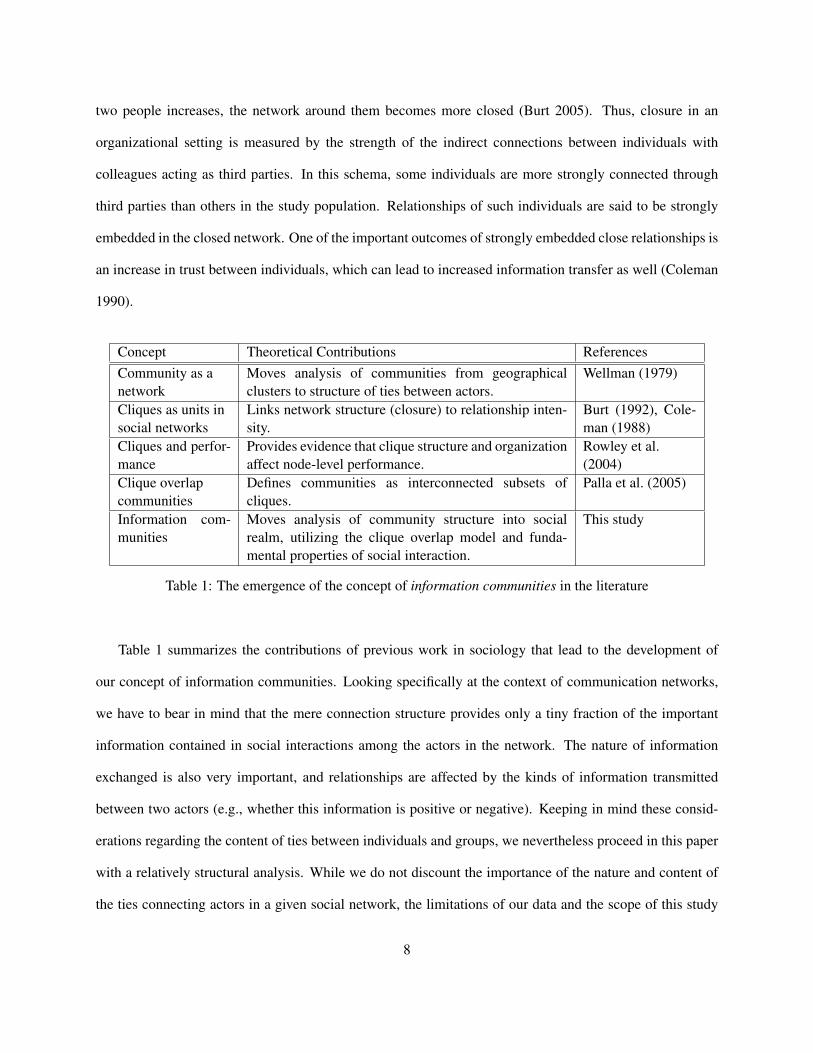
Concept Theoretical Contributions ReferencesCommunity as anetwork
Moves analysis of communities from geographicalclusters to structure of ties between actors.
Wellman (1979)
Cliques as units insocial networks
Links network structure (closure) to relationship inten-sity.
Burt (1992), Cole-man (1988)
Cliques and perfor-mance
Provides evidence that clique structure and organizationaffect node-level performance.
Rowley et al.(2004)
Clique overlapcommunities
Defines communities as interconnected subsets ofcliques.
Palla et al. (2005)
Information com-munities
Moves analysis of community structure into socialrealm, utilizing the clique overlap model and funda-mental properties of social interaction.
This study
Table 1: The emergence of the concept of information communities in the literature
Table 1 summarizes the contributions of previous work in sociology that lead to the development of
our concept of information communities. Looking specifically at the context of communication networks,
we have to bear in mind that the mere connection structure provides only a tiny fraction of the important
information contained in social interactions among the actors in the network. The nature of information
exchanged is also very important, and relationships are affected by the kinds of information transmitted
between two actors (e.g., whether this information is positive or negative). Keeping in mind these consid-
erations regarding the content of ties between individuals and groups, we nevertheless proceed in this paper
with a relatively structural analysis. While we do not discount the importance of the nature and content of
the ties connecting actors in a given social network, the limitations of our data and the scope of this study
8
preclude such an analysis at present.
3 Model
3.1 Communication and the Conductivity of Relationships
Throughout this work we model personal influence as being of a unique type. In particular, we focus on the
information transmitting ability (conductivity) of relationships. To further simplify our model, we assume
that if from two actors, v1 and v2, v1 possesses some information, then for some 0 ≤ δv1v2 < 1, v2 obtains
the same information with probability δv1v2 . We do not focus on the dynamics of the flow of information,
we assume that all communication happens within a single examined period of time.1
Under this probabilistic view, higher conductivity can be understood as increased fault tolerance to
errors in information transfer. Furthermore, as in general we do not possess information revealing the nature
of ties (that is, the magnitude of particular δ -s), fault tolerance can only be associated with redundancy. In
other words, information communities are structures with several independent paths between any pair of
associated actors. Thus, our probabilistic assumptions relate very closely to the fundamentals of brokerage
and closure: when effective communication is a key measure of success in the organization, the most stable
cohesive groups are those with high connectivity. Conversely, no actor can be in a brokering position within
information communities. Along these lines, to completely exclude the possibility of brokerage, we only
allow mutual relationships to be in communities.
Network closure effects peak in cliques - subgroups of actors in which all individuals know each other
and among whom all choices are mutual (Wasserman and Faust 1994).2 It is thus natural to treat the structure
of cliques in a network as a community structure (see Rowley et al. (2004) for an empirical study). The main
limitation of this approach, however, is that forcing so much within-group homogeneity results in very small
groups of actors. For instance, whereas there are social networks with large cliques, the maximum clique
1This is equivalent to assuming that the unit of time is a year and the information is only relevant for a much shorter time period.2In the sociology literature, the term clique refers to maximal structures (in mathematical terms, maximal cliques). For conve-
nience, in this paper we are adopting the terminology of sociology.
9
size in typical communication networks does not exceed 15-30 actors.
A new stream of research on communities aims to tackle this problem. Palla et al. (2005) argue that the
existence of multiple independent paths between any pair of associated nodes is a good basis of node clas-
sification across social and nonsocial networks, including molecular structures and bacterial clusters. They
define communities as collections of cliques. Their model raises restrictions on the number of independent
paths between pairs of (actors in) cliques belonging to the same community.
This approach, however, does not explicitly look at the intensity of interactions between actors within
the network. The analysis is therefore highly structural and static. In terms of our model, the communities
of Palla et al. can be viewed through a different lens. Specifically, we argue that information travels over
sequences of cliques between its source and its destination. We further develop this idea to arrive to a
generalized model of information communities. To do so, we require an additional assumption.
Throughout our work, we treat cliques as inseparable units, emphasizing on the proximity of actors
within. This simplification is natural since in many cases when the source of information is a single actor,
the most closely related actors immediately obtain the same information.3 In other words, we assume that
at the beginning of the examined time period, all members of some clique have some common information,
to be spread in the form of messages. Under this assumption, identifying structures that are capable of
effectively transmitting this message reduces to the task of identifying those cliques which are likely to
obtain the same message.
3.2 From Cliques to Communities
Palla et al. propose that communities be primarily understood as collections of cliques as opposed to being
collections of actors (whereas the mapping from cliques to actors is trivial). They define two cliques to be
adjacent when they share at least c nodes, c being a parameter that they empirically calibrate. Finally, they
take the connected components of the so-built clique-network to be their communities. Below we generalize
3In some cases when this information corresponds to low-involvement behavior, one may analyze the adoption of this behavior.
10
this model. We use the same method to identify information communities, the generalization comes from a
softer necessary condition on clique overlap.
As smaller structures tend to carry greater variance with respect to their properties of interest,4 we
introduce two different types of filtering thresholds. First, we exclude too-small cliques from the clique-
network. Second, we exclude too-small connected components from the set of communities.
Definition. Let S denote a subset of the nodes in a network. We say that S is an information community if
• |S| ≥ p,
• every node is contained in a clique of size of at least q,
• for every pair of cliques in S, there is a series of cliques connecting them so that for consecutive
cliques of size k and l having an overlap of size m, we have f (k, l,m) > r,
where p,q ∈ N,r ∈ R, f (k, l,m) : N×N×N→ R are parameters of the model.
Notice that setting f (k, l,m) = 0, p = q = 3 and r = 1, the resulting community structure becomes the
set of cliques in the network. Naturally, more interesting structures can also be generated by this model.
The communities of Palla et al. arise by taking f (k, l,m) = m (and r = c− 1). As the minimum required
overlap between two cliques does not depend on the size of the cliques, we refer to this model as that
of “uniform” communities. This method is clearly able to discover larger social groups. However, the
enforced homogeneity results in rigid structures. In the next paragraphs, we discuss how to better capture
the underlying communication based solely on the structure of communication relationships. We derive
another clique overlap function f (k, l,m) that, under our probabilistic model of communication, can identify
communities of higher information conductivity. To get a better understanding of the role of the function f ,
we now analyze the role of clique overlap in the transmission of information within a network.
Imagine that two cliques, K and L of sizes k and l, respectively, have m common nodes (see Figure 1).
Assume that the members of the k-clique know some information that they can transmit to the members of4In the empirical section, we focus on communication frequency as dependent measure
11
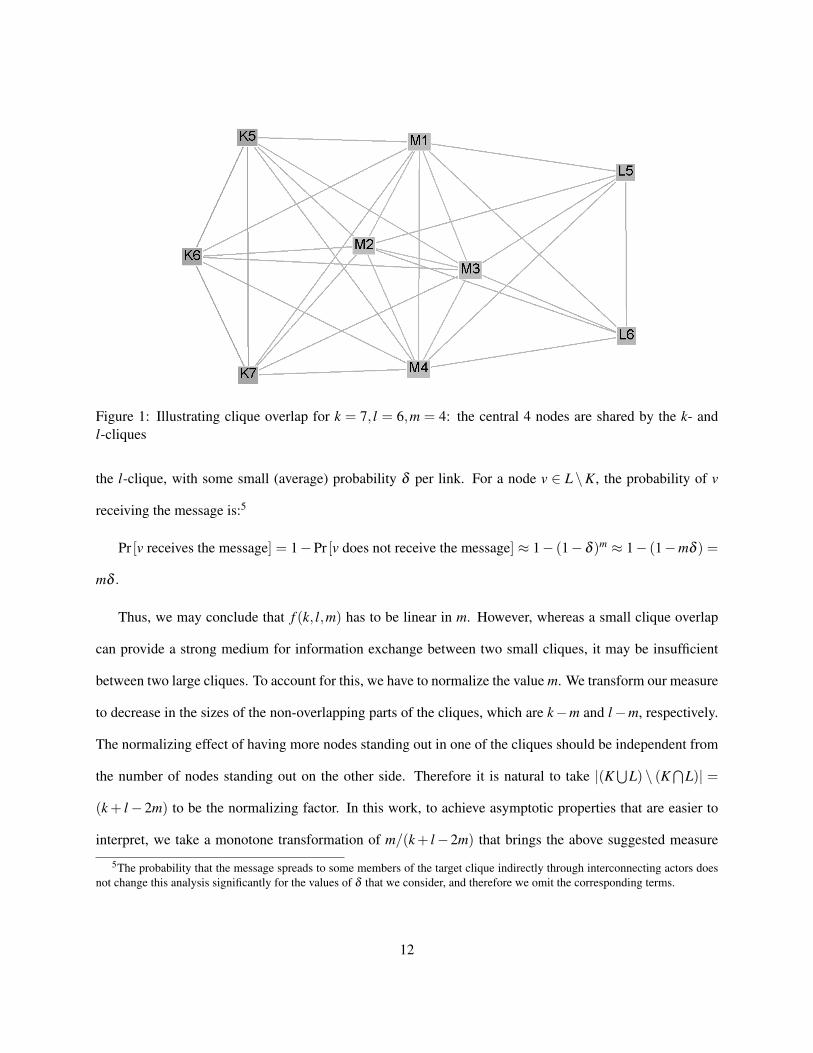
Figure 1: Illustrating clique overlap for k = 7, l = 6,m = 4: the central 4 nodes are shared by the k- andl-cliques
the l-clique, with some small (average) probability δ per link. For a node v ∈ L \K, the probability of v
receiving the message is:5
Pr [v receives the message] = 1−Pr [v does not receive the message] ≈ 1− (1− δ )m ≈ 1− (1−mδ ) =
mδ .
Thus, we may conclude that f (k, l,m) has to be linear in m. However, whereas a small clique overlap
can provide a strong medium for information exchange between two small cliques, it may be insufficient
between two large cliques. To account for this, we have to normalize the value m. We transform our measure
to decrease in the sizes of the non-overlapping parts of the cliques, which are k−m and l−m, respectively.
The normalizing effect of having more nodes standing out in one of the cliques should be independent from
the number of nodes standing out on the other side. Therefore it is natural to take |(K⋃
L) \ (K⋂
L)| =
(k + l− 2m) to be the normalizing factor. In this work, to achieve asymptotic properties that are easier to
interpret, we take a monotone transformation of m/(k + l−2m) that brings the above suggested measure
5The probability that the message spreads to some members of the target clique indirectly through interconnecting actors doesnot change this analysis significantly for the values of δ that we consider, and therefore we omit the corresponding terms.
12

down to a fixed scale - we use m/(k + l).
For a further refinement, we may observe that if k� l or l� k, the transmission of the message is only
efficient in one of the directions, whereas we want to identify structures of high information conductivity
independent from the location of the message source. Thus, to penalize for asymmetry, we introduce the
term kl/(k + l)2. Finally, for convenience we normalize the measure to be in [0,1) by introducing the factor
8 to the numerator.6
In sum, we get:
f (k, l,m) =8klm
(k + l)3 .
Thus, the size of required overlap between two cliques to be considered adjacent varies depending on the
size of the two cliques in question. We therefore refer to this model of communities as that of “variable
(clique) overlap”.
Model Parameterization of thegeneral model
Features References
Cliques ascommunities
f (k, l,m) = 0,r = 1 (not allowing overlaps),p = q≥ 3 (min. clique size)
Baseline model. Defines a largenumber of small and perfectly ho-mogeneous communities.
Burt (1992),Rowley et al.(2004)
Uniformcommunities
f (k, l,m) = m (size ofoverlap),r ≥ 1.5 (size of requiredoverlap)q≥ 3 (min. clique size),p≥ q (min. community size)
Builds communities from over-lapping cliques. Defines com-munities by imposing a fixedminimum number of independentpaths between any two membersof the same community.
Palla et al. (2005),Pollner et al.(2006)
Variablecliqueoverlap
f (k, l,m) = 8klm/(k + l)3
(≈ measure of conductivity),0≤ r < 1 (conductivitythreshold)q≥ 3 (min. clique size),p≥ q (min. community size)
Refines the restriction on inde-pendent communication channelslooking at local network charac-teristics. Minimum required re-dundancy is determined locally,by applying information-theoreticconsiderations.
This study
Table 2: Overview of the sub-classes of information communities discussed in this paper
6We have 0≤m/(k + l) < 1/2 by the fact that neither clique is contained in the other and 0 < kl/(k + l)2 ≤ 1/4 by the inequalitybetween the geometric and arithmetic means.
13
3.3 Measures
In the previous section we outlined three different models of information communities within the same gen-
eral framework that was derived from the organizing principles of network closure. These are the set of all
cliques, the uniform community model of Palla et al. (2005) and our approach, which defines communities
by variable clique overlap. Table 2 gives an overview of the three models. Before moving to hypotheses and
empirical studies, in this section we discuss and define the analytical measures to be used.
To evaluate the performance of their algorithm, Palla et al. (2005) propose looking at the density of
edges going within communities and comparing this to the density of edges in the remaining parts of the
network.7 In this case, the only information captured by the network is the relationship structure. No
other distinguishing features about relationships in the network are available. Further, keeping in mind our
definition of communities, their measure raises issues of endogeneity. For instance, when set of cliques
equals the set of communities, the induced edge density is 1.
Following Burt (2005), we instead take a network where the relationships have scalar weights (rep-
resenting relationship intensity). We then set up mathematical rules to identify relevant structures in this
network on the basis of the relationship structure. Finally, we compare the corresponding scalar weights of
within-structure edges to all other links. Weighting the relationships by communication frequency makes
the above logic applicable. In our empirical studies, we examine two different communication networks
to statistically compare the two models. Below we specify our methods more precisely to then outline our
hypotheses.
Let the term community distribution correspond to the set of communities identified by a certain param-
eterization of the general model. To every such community distribution we assign a measure of its “quality”.
First, we define intra-edges as such relationships in the network that are between actors who share at least
one community membership. Then we consider every relationship that is not an intra-edge to be an inter-
edge. In other words, two actors who do not share any community membership are related through an
7For further details we refer the reader to Palla et al. (2005).
14
inter-edge. Our measure is then the ratio of the average relationship intensity of intra-edges to the average
relationship intensity of inter-edges. That is, if A is the set of actors and X ⊂ A×A the relationships in the
network, and i(xa1a2) is the intensity of the relationship between the actors a1,a2 ∈ A, our quality measure
INTENSITY RATIO becomes
INTENSITY RATIO =∑
x∈Wi(x)/|W |
∑x∈B
i(x)/|B|,
where W denotes the set of intra-edges and B = X \W that of the inter-edges.8
In our empirical studies, we compare our model of variable overlap to the uniform communities in terms
of INTENSITY RATIO. To do so, we allow minimum required clique size and minimum community size
to vary. Whereas the latter is just treating the parameter p as an independent variable, comparing minimum
clique size requires a somewhat more sophisticated approach. To see this, let’s set q = 3. It is revealing
to note that even though we allow for cliques of size 3 through q, by manipulating the overlap threshold
parameter r, one is able to exclude too small cliques from meeting the overlap criterion. In the model of
uniform communities, setting r = c− 1 isolates cliques of no more than c actors. In our model, setting
r ≥ ( j−1)/ j, cliques of size not more than j are isolated as clique-intersections of size not more than
j−1 are excluded of our communities. In sum, the independent variable representing minimum clique size
should also incorporate the effects of r. Therefore, we choose our independent variable of minimum clique
size to be q = br + 2c for the model of uniform communities and q = b(2− r)/(1− r)c for that of variable
overlap.9 This fully specifies the uniform case. For our model, to any q we choose r such that r + 0.0001
would already correspond to q+1.
Finally, since our notion of communities does require redundancy in the overlaps to add a fault tolerance
to the systems, we exclude structures with singleton cut-sets. That is, in no community do we allow for the
presence of such a critical actor who could broker information. In other words, we require m ≥ 2 which
translates to r ≥ 1 in the uniform case and to r ≥ 13 for our model.
8If none or all of the edges are within communities, this measure is not defined. However, distinguishing between the discussedcommunity models on such networks lies beyond our interest.
9This restriction is introduced without loss of generality as long as p≥ q, which again is natural to assume.
15
4 Hypotheses
We can now formulate our hypotheses. First, we put forward that the predictions of network closure theory
relating to relationship intensity hold when looking across the whole network. Namely, we hypothesize that
a stronger restriction on the minimum size of cliques leads to a higher intensity ratio.
H1: The ratio of the average intra-edge intensity to the average inter-edge intensity increases as the
minimum clique size increases.
Our next hypothesis concerns the comparison of the uniform community model to the model based
on our probabilistic assumption of information transmission. We propose that the information communi-
ties defined by the variable clique overlap model better capture those relationships that serve as important
communication channels in the network.
H2: Keeping minimum clique size and minimum community size the same, the ratio of the average intra-
edge intensity to the average inter-edge intensity is larger for the model of variable overlap than for the
model of uniform communities.
In the next section, we empirically test these hypotheses.
5 Empirical Studies
Relying on the measure of quality for communities in communication networks discussed section 3.3, we
construct a test to compare the model of variable clique overlap to that of uniform communities. By estimat-
ing this statistical model, we explore the organizational dynamics embedded in two sets of communication
networks: (1) a two-year collection of email data from the now-defunct Enron Corporation of Houston,
Texas, USA; and (2) a larger dataset of approximately 70,000 subscribers of a fixed-line telephone provider
in Eastern Europe. For the maximum validity of our tests, we vary minimum clique size and minimum com-
munity size in both models of communities and look at the impact of this on the intensity of relationships
within the network. Below we summarize the common methodological details. Data-specific information
16
and results are provided in the sections corresponding to the particular studies. Finally, we compare the
two models to the communities defined as the set of cliques and discuss the potential interpretations of our
findings.
5.1 Methods and Variables
In both studies, we start from datasets containing records of communication. Using these data, we build
our communication network, defining the set of actors and the structure of relationships (detailed in the
corresponding subsections). We then compute the set of communities corresponding to various parame-
terizations of the general model to then record the average intra-edge intensity to the average inter-edge
intensity ratio together with the parameters as an observation for our estimations. Below we give a more
detailed description of all the variables.
Dependent Variable. In the estimation procedure, the dependent variable is the ratio of average intra-
edge intensity to the average inter-edge intensity, referred to as INTENSITY RATIO. For the mathematical
details of computing this ratio, see section 3.3.
Independent Variables.
MINCLQ. This variable represents the size of the smallest clique allowed (q) in the given distribution of
communities. It ranges from 3 to the size of the maximum clique in the network. See also the discussion in
section 3.3.
MINCOM. This variable stands for the minimum required community size (p). For any given value of
MINCLQ, it ranges from MINCLQ to 100. Structures that would meet the clique overlap conditions but do
not measure at least this big are omitted from the community distribution.
MODEL. This is a dummy variable taking 1 for the model of variable clique overlap and 0 for that of
the uniform communities (Palla et al. 2005). For further details, see section 3.2.
17
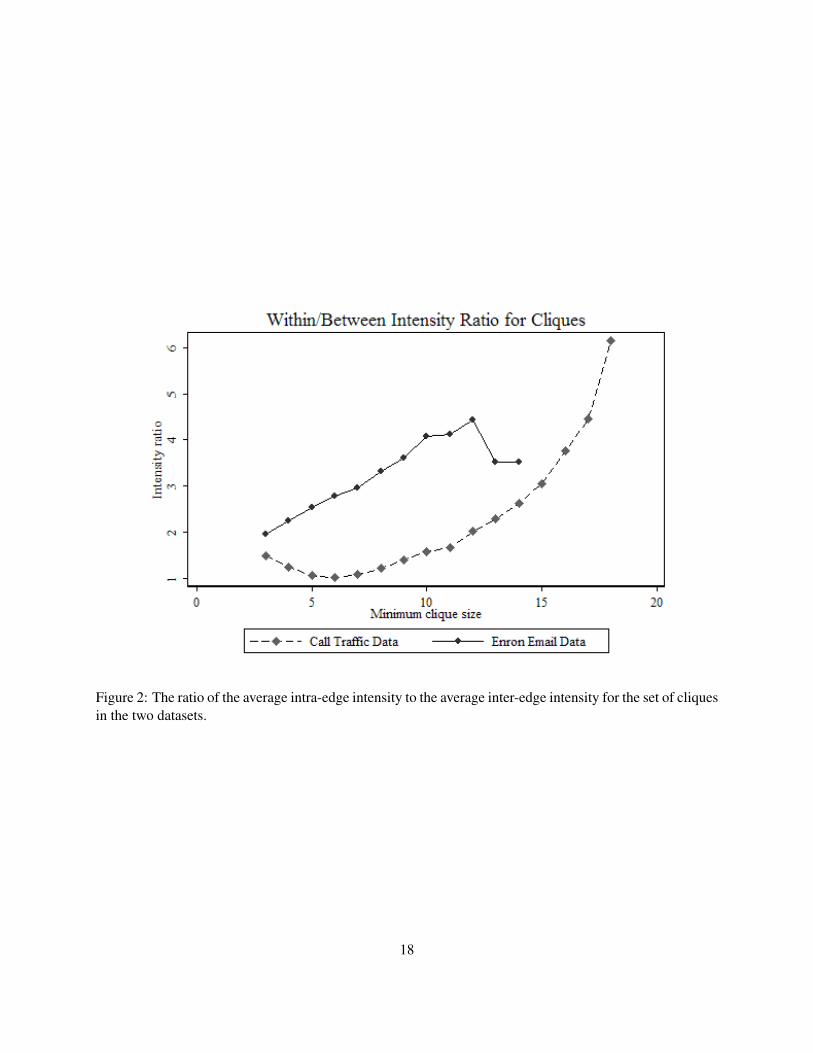
Figure 2: The ratio of the average intra-edge intensity to the average inter-edge intensity for the set of cliquesin the two datasets.
18
Models. To test both H1 and H2 at the same time, we estimate the following pooled OLS model:
INTENSITY RATIOi = α +β1 ·MINCOMi +β2 ·MINCLQi +β3 ·MODELi + εi, (1)
where we assume that the error terms follow the same zero-mean normal distribution, and are distributed
independently.
Figure 2 suggests a potential criticism of the naïve method of pooled OLS, namely that for the set
of cliques, INTENSITY RATIO does not monotonely increase with MINCLQ. As MINCLQ can be an
important determinant of INTENSITY RATIO, we are able to improve the estimation to find more robust
support for H2 by imposing fixed effects on MINCLQ. This leads us to estimate the following model:
INTENSITY RATIOi,q = αq +β1 ·MINCOMi,q +β3 ·MODELi,q + εi,q, (2)
where we again assume the error terms to be independently and identically distributed according to a zero-
mean normal distribution.
5.2 Study 1 - Enron Email Dataset
Traditionally, the study of informal networks (including studies of centrality) is performed via survey
methodology. This process involves administering questionnaires to all members of the social group un-
der study (say, employees in a particular organization), and assuming a high response rate, thereafter putting
together this information to develop a view of the network structure (Friedkin 1991, Rogers 1987). Despite
the widespread use of this method, however, it does have a number of disadvantages.
First, network surveys require a very high response rate to provide meaningful information for analysis.
This tends to therefore bias administration of these surveys in smaller organizations or groups, where partic-
ipation in surveys is more easily enforced, thereby ensuring high-response rates for survey items. Another
problem with surveys is that individuals, especially in organizations, consider subjective elements such as
“political” motives in giving particular answers (for fear of offending potential colleagues, etc.), and thus
tend to provide answers which lead to inaccurate measurement of the network. Finally, it cannot be de-
19

nied that designing and administering network surveys, even to a relatively small group of individuals, is
extremely time- and labor-intensive, and this often precludes their use in various situations.
As electronic communication media have developed, however, an alternative method for the study of
networks has emerged (Guimerà, Danon, Diaz-Guilera, Giralt, and Arenas 2004, Rogers 1987). While
Wellman and colleagues called for the use of electronic data, including emails and other computer data, in
network research as far back as 1996, it is only in recent years that the use of such information has increased
with the availability of various data sets and the development of new analytical tools (Kleinbaum 2006).
The major advantages of using electronic data, in our view, are the flexibility it provides both in relation to
the size of the network that can be studied, and also the levels of analysis at which network studies can be
performed. With increased network size and data availability, it is easy to see how studies of organizational
divisions and teams can be facilitated with the use of electronic data.
To define our first communications network, we accessed the publicly available Enron Email Dataset
(FERC 2003). This database contains 200,869 records of emails and allows the generation of reports related
to specific data queries. Independent of email content, we converted the data into a directed graph. Actors
in the database (as senders or recipients of emails) were defined as nodes. Subsequently, for every email an
edge was generated from senders to all intended recipients. In this context, emails sent to distribution lists
were bypassed. To every directed relationship we assigned the frequency of communication along that link
as weight.
Since our measures are defined on directed networks, we kept the asymmetry of the communication
relationship. As such, by our definition of communities, only those nodes that were both senders and
recipients of emails were extracted for analysis.10 We converted strings of data into names of individuals,
storing trivial solutions in a relational database. Remaining strings were matched to available information,
and new nodes were created when no match was possible. This method allowed us to identify approximately
6,000 individuals within the data set. Subsequently, we matched the recipients of emails to those individuals
10This way we also got rid of spam messages.
20
in our database, narrowing the density of our vertex set down to 3,455 individuals. The number of induced
directed relationships is 50931, at an average intensity (frequency of communication in the direction of the
relationship) of 7.51. In accordance with the objectives of our research, we did not perform dichotomizations
of the relationships, and thus, in what follows, the minimum link intensity is 1, while the maximum intensity
is 676.
It is important to note that while there are a total of almost 3,500 nodes, a number of key organizational
actors - including the one-time CFO Andrew Fastow - are not part of this data set. This is due to a number of
factors, including the fact that some senior executives bypassed emails as a major method of communication,
probably to avoid leaving a written record of potentially-sensitive communications. While certainly this is
one limitation to the data, this sample does include information for former Chairman and CEO Kenneth Lay,
an important organizational actor whose prominence in the network, as calculated by standard centrality
measures, is above the median for the data set.
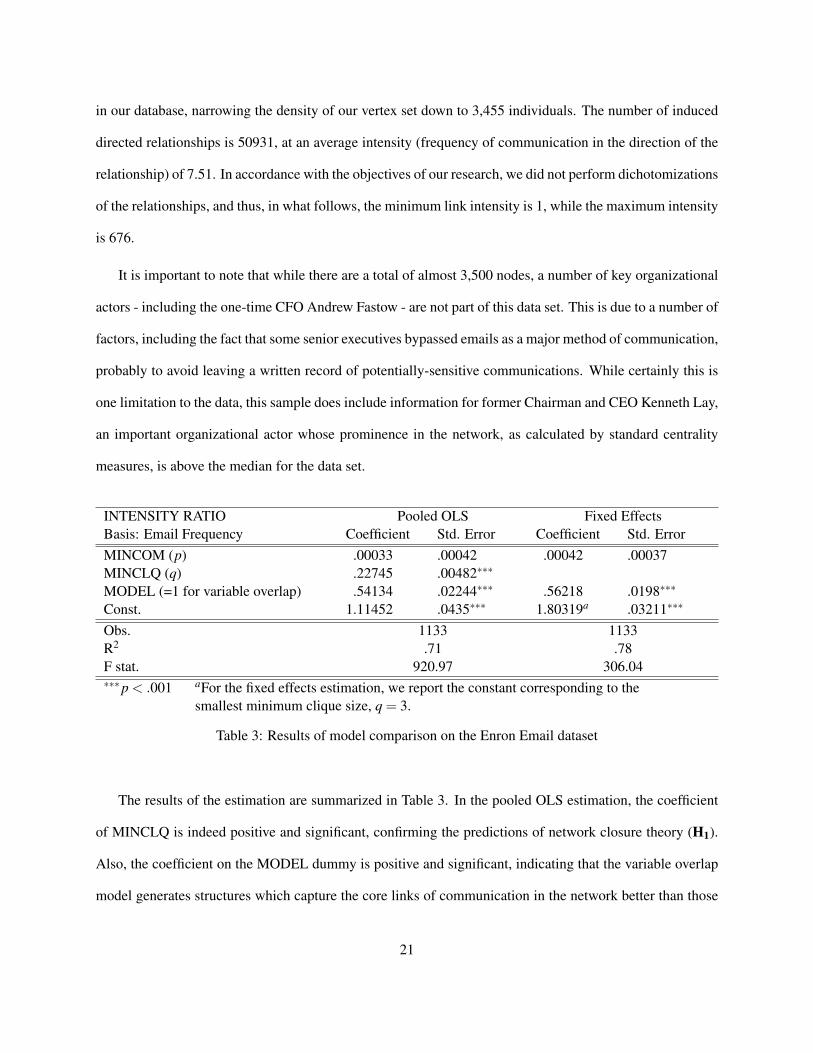
INTENSITY RATIO Pooled OLS Fixed EffectsBasis: Email Frequency Coefficient Std. Error Coefficient Std. ErrorMINCOM (p) .00033 .00042 .00042 .00037MINCLQ (q) .22745 .00482∗∗∗
MODEL (=1 for variable overlap) .54134 .02244∗∗∗ .56218 .0198∗∗∗
Const. 1.11452 .0435∗∗∗ 1.80319a .03211∗∗∗
Obs. 1133 1133R2 .71 .78F stat. 920.97 306.04∗∗∗p < .001 aFor the fixed effects estimation, we report the constant corresponding to the
smallest minimum clique size, q = 3.
Table 3: Results of model comparison on the Enron Email dataset
The results of the estimation are summarized in Table 3. In the pooled OLS estimation, the coefficient
of MINCLQ is indeed positive and significant, confirming the predictions of network closure theory (H1).
Also, the coefficient on the MODEL dummy is positive and significant, indicating that the variable overlap
model generates structures which capture the core links of communication in the network better than those
21
structures generated by the model of uniform communities. For the fixed effects estimation, the larger R-
squared value shows that the imposed restriction on minimum clique size is a major determinant of the
obtained intra-edge to inter-edge intensity ratio. As the coefficient on the MODEL dummy is still positive
and significant under this model, we find robust support for H2.
5.3 Study 2 - Call Traffic Data of a Telephone Network
Our findings on the Enron Email Data are encouraging as they align with our predictions. However, as
our theory was stated in more general terms - for social networks that capture information on any sort
of communication - it is desirable to gain stronger validity to our claims. To this end, we gathered data
representing another communication network - we took call records from a small Eastern European fixed-
line telephone provider. The dataset spans 3 months and contains individual call records of about 70,000
customers (we do not possess information distinguishing private and business subscribers). Each data record
contains the identifier of the calling and called parties, the duration of the phone call in seconds, plus
some marketing variables such as price and price discounts for some calls. Since, nevertheless, the latter
information is not available for every record, we do not use it in our analysis.
The communication network was constructed in a very similar manner to the methods described in the
previous study. Telephone subscribers became actors and to each call we generated a relationship between
the calling and the called parties. However, phone calls differ from emails in a fundamental way: to every
call we can associate an information flow both from the calling to the called party and vice versa. Therefore,
the construction of the communication network to be analyzed differed from the construction of the email
network. In particular, we undirected every relationship. To each pair of related actors we then assigned the
cumulated call duration (in seconds, during the three months considered, in both directions) as the weight
representing the intensity of the relationship between them.11 Finally, we have dropped the isolated actors
corresponding to subscribers who remained inactive during the period of analysis. This left 66,816 actors in
the network, spanning 906,786 undirected relationships. The average relationship intensity (call duration,
11We chose the additive relation between call durations and relationship intensity to keep our analysis as parsimonious as possible.
22

in seconds) is 562.05.12
During the analysis, we follow the same procedure as in Study 1. First we test H1 and H2 jointly,
according to (1). The results of this estimation are summarized in Table 4. As in Study 1, the pooled
OLS supports both the hypothesis corresponding to network closure theory and the hypothesis regarding the
community model comparison. As for the set of cliques, however, the relationship between INTENSITY
RATIO and MINCLQ is not monotone (see Figure 2), again we are able to improve the estimation by
imposing fixed effects on MINCLQ and estimating (2).
INTENSITY RATIO Pooled OLS Fixed EffectsBasis: Cumulated Call Duration Coefficient Std. Error Coefficient Std. ErrorMINCOM (p) -.00388 .00037∗∗∗ -.00078 .00016∗∗∗
MINCLQ (q) .19923 .00252∗∗∗
MODEL (=1 for variable overlap) .22889 .01944∗∗∗ .26848 .00824∗∗∗
Const. -.24044 .03413∗∗∗ .71322b .01683∗∗∗
Obs. 2347 2347R2 .74 .95F stat. 2216.56 2854.56∗∗∗p < .001 bFor the fixed effects estimation, we report the constant corresponding to the
smallest minimum clique size, q = 3.
Table 4: Results of model comparison on the call traffic dataset
The results of the fixed effects estimation are also in Table 4. Just as well as in Study 1, we find a larger
R-squared value indicating the importance of MINCLQ as a determinant of INTENSITY RATIO. Since the
coefficient on the MODEL dummy is still positive and significant under the fixed effects estimation, we
again find robust support for H2.
5.4 Disjoint versus Overlapping Cliques
Discussing the measure of quality that Palla et al. (2005) proposed, we highlighted the fact that taking
edge density as measuring the relevance of a community distribution would favor cliques too much. In
12The total duration of the analyzed calls thus exceeds 16 years.
23
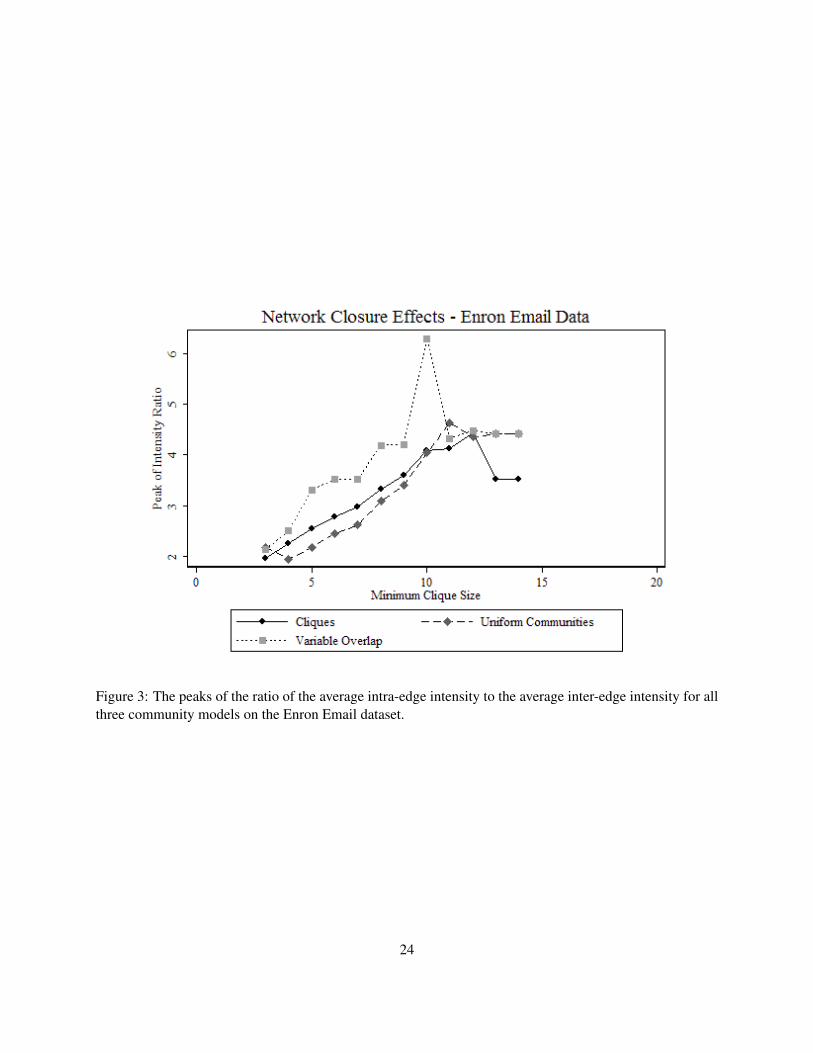
Figure 3: The peaks of the ratio of the average intra-edge intensity to the average inter-edge intensity for allthree community models on the Enron Email dataset.
24
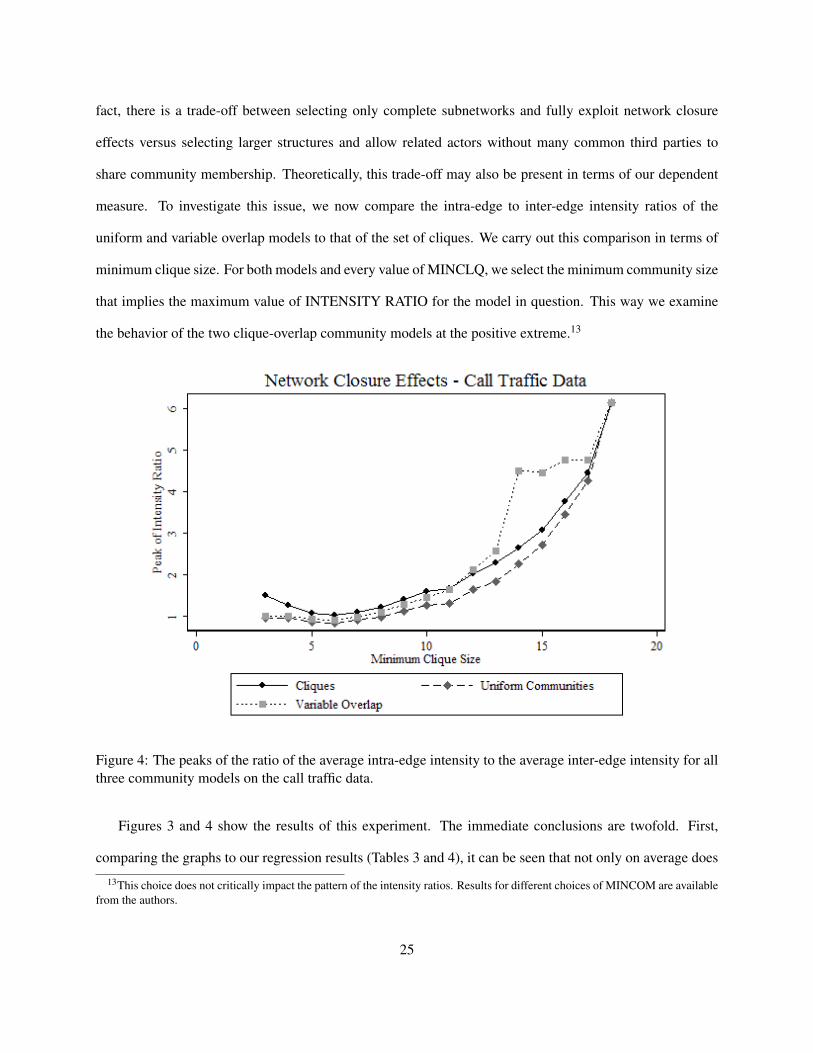
fact, there is a trade-off between selecting only complete subnetworks and fully exploit network closure
effects versus selecting larger structures and allow related actors without many common third parties to
share community membership. Theoretically, this trade-off may also be present in terms of our dependent
measure. To investigate this issue, we now compare the intra-edge to inter-edge intensity ratios of the
uniform and variable overlap models to that of the set of cliques. We carry out this comparison in terms of
minimum clique size. For both models and every value of MINCLQ, we select the minimum community size
that implies the maximum value of INTENSITY RATIO for the model in question. This way we examine
the behavior of the two clique-overlap community models at the positive extreme.13
Figure 4: The peaks of the ratio of the average intra-edge intensity to the average inter-edge intensity for allthree community models on the call traffic data.
Figures 3 and 4 show the results of this experiment. The immediate conclusions are twofold. First,
comparing the graphs to our regression results (Tables 3 and 4), it can be seen that not only on average does
13This choice does not critically impact the pattern of the intensity ratios. Results for different choices of MINCOM are availablefrom the authors.
25
our model outperform that of Palla et al. but that it has a greater potential to capture the core communication
relationships in the network even when the minimum community size can be selected freely. Second, as the
intensity ratio for the variable overlap model exceeds the corresponding benchmark for the set of cliques
for many values of MINCLQ, we can state that the variable overlap model overcomes the trade-off between
community size and implied relationship intensity and thereby successfully extends the findings of network
closure to larger structures. In addition, a closer look at the graphs reveals that the uniform communities
rarely overcome the same trade-off: the implied intra-edge to inter-edge relationship intensity ratios typically
remain below the benchmark ratios corresponding to the community distribution which is the set of cliques.
6 Discussion and Conclusions
6.1 Contributions
The primary theoretical contribution of this paper is to generalize network closure theory to large-scale
structures. We do this by providing a framework to quantify Wellman’s (1979) notion of communities in
communication networks. Thus, our study draws connections between the “liberated” communities concept
of Wellman (1979) - which abandons the local geographic area as a starting point for analyzing groups and
instead focuses directly on the structure of primary ties between individuals - and recent advances in graph
theory and mathematical networks.
Combining concepts in this manner allowed us to test the efficacy of a generalized definition of com-
munities in the context of communication networks. We demonstrated that this conception of information
communities provides researchers a tool to identify groups of individuals that have strong internal relation-
ships in closed social networks (communities). On the methodological side, this presents a means to identify
overlapping community structures, breaking with the traditional clustering approach. Our method, which
looks at the structure of relationships in a network, provides output which carries important information on
the intensity of relations contained in the network. This is achieved by capturing the flow of information in
the network at various levels: at nodes, at cliques, and at the level of communities.
26
Finally, our empirical contributions include reproducing the effects predicted by network closure. We
further demonstrated a novel way to differentiate social networks from non-social networks, and how the
pure mathematical machinery of network analysis used in natural sciences such as physics should be refined
when analyzing social networks, in particular those found within organizations. We did this by examining
contexts where the potential benefits from network closure exceed that of brokerage.
Our definition of communities is based on information flows between cliques in the network. The set
of cliques and the uniform communities of Palla et al. (2005) are both special cases of this general model.
Quantifying Wellman’s (1979) ideas by introducing an information theoretic model of communication, we
proposed a third model called the “variable overlap” model. We empirically compared the performance of
the variable overlap model, as measured by communication intensity, against the two existing models of
communities, focusing on the ability all three models to identify core links in the communication network.
The variable overlap model is significantly better at identifying these links than the uniform communities
model, and often better than the set of cliques in the network in this regard. Further, as the communities
identified by the variable overlap model can be of larger size than the biggest clique in the network, we
showed how to extend the basic concepts of network closure to large-scale networks.
6.2 Limitations and Implications for Future Research
There are several potential directions to extend this research, some of which could address important limita-
tions associated with this study. First, we characterized organizational environments by the relative benefits
of network closure over brokerage. This raises two important issues. On the one hand, discussing reliable
measures and means to identify these relative benefits is very important for the direct applicability of our
findings. On the other hand, if the communities we define are desirable structures within a given organiza-
tional communication system, ensuring the presence of the higher benefits from network closure within the
organization imposes a very important policy making question.
Second, we concentrated on the parsimony of our work. Following the logic of Burt (2005), we iden-
27
tified relevant network structures only based on the connection patterns. The generality of our approach
affects the applicability of our research in several ways. A promising area of future research could examine
the moderating role of communication content to our results. For instance, do implied relationships tend to
be stronger when the connection patterns reflect not only the existence of communication, but also commu-
nication about a particular, narrow, topic? Further, in the organizational setting, if the model could capture
demographic information, aspects of organizational hierarchy and structure, etc. it might provide better
insight into not only the expected communication patterns within a given network, but also how the flow
of information may be utilized at different nodes and within different clusters of individuals. Future work
might attempt to identify how our methods can be refined by including such variables into the analysis.
Third, our work could be applied to identify bottlenecks of organizational communication systems.
These bottlenecks would not necessarily be identified by simple brokerage arguments as our model is more
restrictive concerning the clique overlap. In general, our techniques could be used to optimize the throughput
of organizational communication networks. Combining ideas from the above two paragraphs, it would be
natural to relate our work to knowledge flows in organizations (Cool, Dierickx, and Szulanski 1997, Hansen
2002, Nahapiet and Ghoshal 1998).
The above examples are but a few where our extension of network closure theory can help the orga-
nizational researcher estimate relationship intensity in the absence of data on information traffic, solely
based on connection patterns (which information is clearly easier to obtain than more detailed records on
communication). Another promising area of applications is marketing. As our methods take a step toward
better estimating social influence among members of a communication network based only on the connec-
tion patterns, they can serve two fast developing areas in network marketing. First, the communities defined
by our model can be interpreted as a segmentation of a networked market. It would be interesting to see
future research discover how much the so-defined social groups share consumption patterns, general inter-
ests or specific knowledge. Second, our findings may help marketers identify opinion leaders in networks,
facilitating viral marketing practices. Third, as social influence can lead to extra revenue flows to the firm
28

through word-of-mouth, our work should provide ground for improving the existing customer relationship
management techniques.14
Finally, despite using longitudinal data in our empirical studies, we constructed our networks by col-
lapsing all communication records into one network layer. In a recent paper, Palla, Barabási, and Vicsek
(2007) consider shorter periods of aggregation as they focus on how communities evolve over time. This
idea could be used for analyzing changes in organizational communication systems, ultimately improving
their efficiency. Building on results of Wellman (1979) and Burt (1992), we believe that our theoretical
framework should provide a good basis for improving the analysis of social group evolution.
14These techniques evaluate customer profitability by comparing discounted revenue flows from the customer to the cost ofacquisition and the cumulative cost of retention. For more details, see Bolton (1998).
29
References
Bolton, Ruth N. 1998. A dynamic model of the duration of the customer’s relationship with a continuousservice provider: The role of satisfaction. Marketing Science 17(1) 46–65.
Burt, R. 1992. Structural Holes: The Social Sctructure of Competition. Harvard University Press,Cambridge, MA.
Burt, R. 2005. Brokerage and Closure. Oxford University Press, New York.
Carley, K. M. 1991. A theory of group stability. American Sociological Review 56 331–354.
Coleman, J. S. 1988. Social capital in the creation of human capital. American Journal of Sociology 9495–120.
Coleman, J. S. 1990. Foundations of Social Theory. Bellknap Press, New York.
Cool, K. O., I. Dierickx, G. Szulanski. 1997. Diffusion of innovations within organizations: Electronicswitching in the bell system, 1971-1982. Organization Science 8 543–559.
Everett, M. G., S. P. Borgatti. 1998. Analyzing clique overlap. Connections 21 49–61.
FERC. 2003. Information released in Enron investigation.http://www.ferc.gov/industries/electric/indus-act/wec/enron/info-release.asp.
Friedkin, N. E. 1991. Theoretical foundations for centrality measures. American Journal of Sociology 961478–1504.
Girvan, M., M. E. J. Newman. 2002. Community structure in social and biological networks. Proc. Natl.Acad. Sci. USA 99 8271–8276.
Guimerà, R., L. Danon, A. Diaz-Guilera, F. Giralt, A. Arenas. 2004. The real communication networkbehind the formal chart: community structure in organizations. Working Paper, NorthwesternUniversity, Evanston, IL.
Guimerà, R., S. Mossa, A. Turtschi, L. A. N. Amaral. 2005. The worldwide air transportation network:anomalous centrality, community structure, and cities’ global roles. Proceedings of the NationalAcademy of Sciences 102 7794–7799.
Hansen, M. T. 2002. Knowledge networks: Explaining effective knowledge sharing in multiunitcompanies. Organization Science 13 232–248.
Jacobs, J. 1961. The Death and Life of Great American Cities. Random House, New York.
Jain, A. K., R. C. Dubes. 1988. Algorithms for Clustering Data. Prentice Hall, Englewood Cliffs, NJ.
Kleinbaum, A. M. 2006. Measuring mail: New analyses of e-mail data for the study of cross-divisionalinnovation. Best Paper Proceedings of the Academy of Management 2006.
Krackhardt, D. 1999. The ties that torture: Simmelian tie analysis in organizations. Research in theSociology of Organizations 16 183–210.
30
Lazer, D., A. Friedman. 2007. The network structure of exploration and exploitation. AdministrativeScience Quarterly 52 667–694.
Nahapiet, J., S. Ghoshal. 1998. Social capital, intellectual capital, and the organizational advantage.Academy of Management Review 23 242–266.
Newman, M. E. J., J. Park. 2003. Why social networks are different from other types of networks. Phys.Rev. E 68(3) 036122. doi:10.1103/PhysRevE.68.036122.
Palla, G., A.-L. Barabási, T. Vicsek. 2007. Quantifying social group evolution. Nature 446 664–667.
Palla, G., I. Derényi, I. Farkas, T. Vicsek. 2005. Uncovering the overlapping community structure ofcomplex networks in nature and society. Nature 435 814–818.
Pollner, P., G. Palla, T. Vicsek. 2006. Preferential attachment of communities: The same principle, but ahigher level. J. Europhys. Lett. 73(3) 478–484.
Putnam, R. D. 2001. Bowling Alone: The Collapse and Revival of American Community. Simon &Schuster, New York.
Rogers, E. M. 1987. Progress, problems, and prospects for network research: Investigating relationships inthe age of electronic communication technologies. Social Networks 9(4) 285–310.
Rowley, Tim J., Joel A. C. Baum, Andrew V. Shipilov, Henrich R. Greve, Hayagreeva Rao. 2004.Competing in groups. Managerial and Decision Economics 25(6-7) 453–471.
Scott, J. 2006. Social Network Analysis. Sage Publications, London.
Uzzi, B., J. Spiro. 2005. Collaboration and creativity: The small world problem. American Journal ofSociology 111 447–504.
Wasserman, S., K. Faust. 1994. Social Network Analysis: Methods and Applications. CambridgeUniversity Press, New York.
Watts, D. J. 1999. Networks, dynamics, and the small-world phenomenon. American Journal of Sociology105 493–527.
Wellman, B. 1979. The community question: The intimate networks of East Yorkers. American Journal ofSociology 84(5) 1201–1231.
Wellman, B., B. Leighton. 1979. Networks, neighborhoods and communities: Approaches to the study ofthe community question. Urban Affairs Quarterly 14 363–390.
Wellman, B., J. Salaff, D. Dimitrova, L. Garton, M Gulia, C. Haythornthwaite. 1996. Computer networksas social networks: Collaborative work, telework, and virtual community. Annual Review ofSociology 22 213–238.
Wellman, B., S. Wortley. 1990. Different strokes from different folks: Community ties and social support.American Journal of Sociology 96(3) 558–588.
31