Embed Size (px)
Citation preview
Information Builders enables
agile information solutions with
business intelligence (BI) and
integration technologies.
WebFOCUS – the most widely
utilized business intelligence
platform – connects to any
enterprise system or application
and enables simple and intuitive
interaction with information.
We
bF
OC
US
RS
tat
WebFOCUS RStatPredict the Future and Make
Effective Decisions Today
Traditional reporting provides a clear picture of the past, but has little power to shed light
on the future. WebFOCUS RStat, the market’s first fully integrated business intelligence (BI)
and predictive analytics environment, bridges the gap between backward- and forward-
facing views of business operations by enabling the deployment of predictive models as
scoring applications.
Data mining extracts historical data and applies statistical techniques to build a model to
predict an outcome. A scoring application supports decision-making by providing non-
technical users with an analytic resource for repeated use on new data sets. For example:
A marketing executive can score new mailing lists to distinguish between good and ■
bad prospects
An insurance or bank officer can accurately determine if a client is a good risk ■
A police department can be better prepared to prevent crime if they can predict when ■
and where crimes are likely to occur
Statisticians spend much of their time extracting and querying data. With WebFOCUS RStat,
statisticians can leverage the same infrastructure that BI developers use to create queries
and build models. They can then generate scoring routines from these models that can
be used by the BI developers to build and deploy WebFOCUS scoring applications on any
platform. This approach eliminates the need to work with multiple tools or platforms.
WebFOCUS RStat is a graphical user interface (GUI) front end to the R library of statistical
functions from the ‘R’ Systems open source project, which is maintained by a worldwide
consortium of universities that teach statistics. Information Builders built RStat so that even
business analysts without advanced statistical training can build statistical models. By
building statistical scoring solutions into the WebFOCUS metadata, Information Builders
provides a unique method for deploying them on any computer platform or operating
system, e.g. Windows, Unix, Linux, Z/OS, and i Series, making RStat the simplest predictive
analytics system to deploy in any application.
RStat®
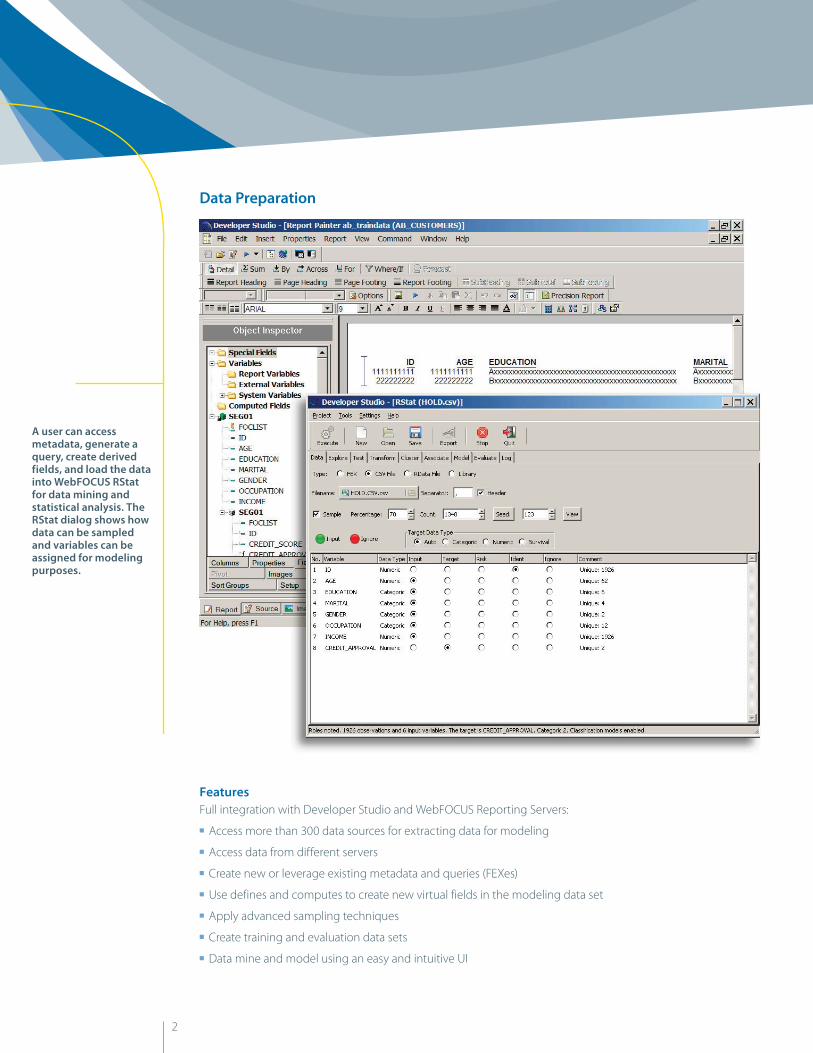
A user can access metadata, generate a query, create derived fields, and load the data into WebFOCUS RStat for data mining and statistical analysis. The RStat dialog shows how data can be sampled and variables can be assigned for modeling purposes.
Data Preparation
Features
Full integration with Developer Studio and WebFOCUS Reporting Servers:
Access more than 300 data sources for extracting data for modeling ■
Access data from different servers ■
Create new or leverage existing metadata and queries (FEXes) ■
Use defines and computes to create new virtual fields in the modeling data set ■
Apply advanced sampling techniques ■
Create training and evaluation data sets ■
Data mine and model using an easy and intuitive UI ■
2
3
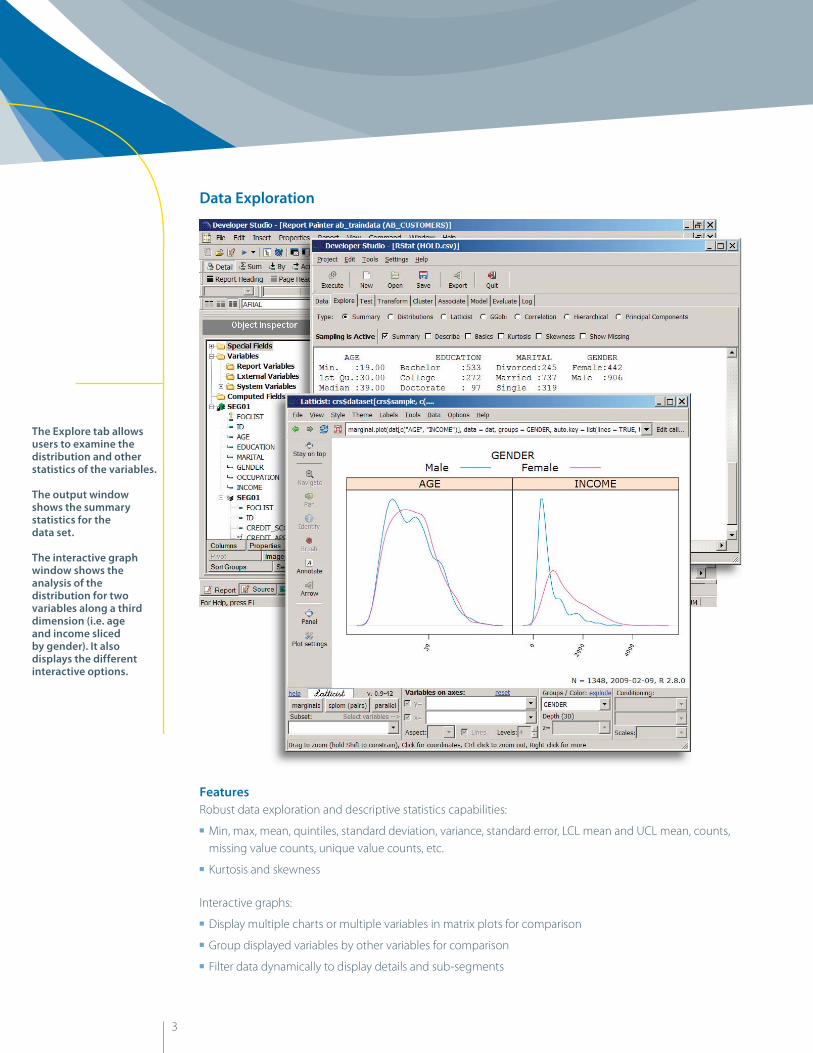
The Explore tab allows users to examine the distribution and other statistics of the variables.
The output window shows the summary statistics for the data set.
The interactive graph window shows the analysis of the distribution for two variables along a third dimension (i.e. age and income sliced by gender). It also displays the different interactive options.
Data Exploration
Features
Robust data exploration and descriptive statistics capabilities:
Min, max, mean, quintiles, standard deviation, variance, standard error, LCL mean and UCL mean, counts, ■
missing value counts, unique value counts, etc.
Kurtosis and skewness ■
Interactive graphs:
Display multiple charts or multiple variables in matrix plots for comparison ■
Group displayed variables by other variables for comparison ■
Filter data dynamically to display details and sub-segments ■
4
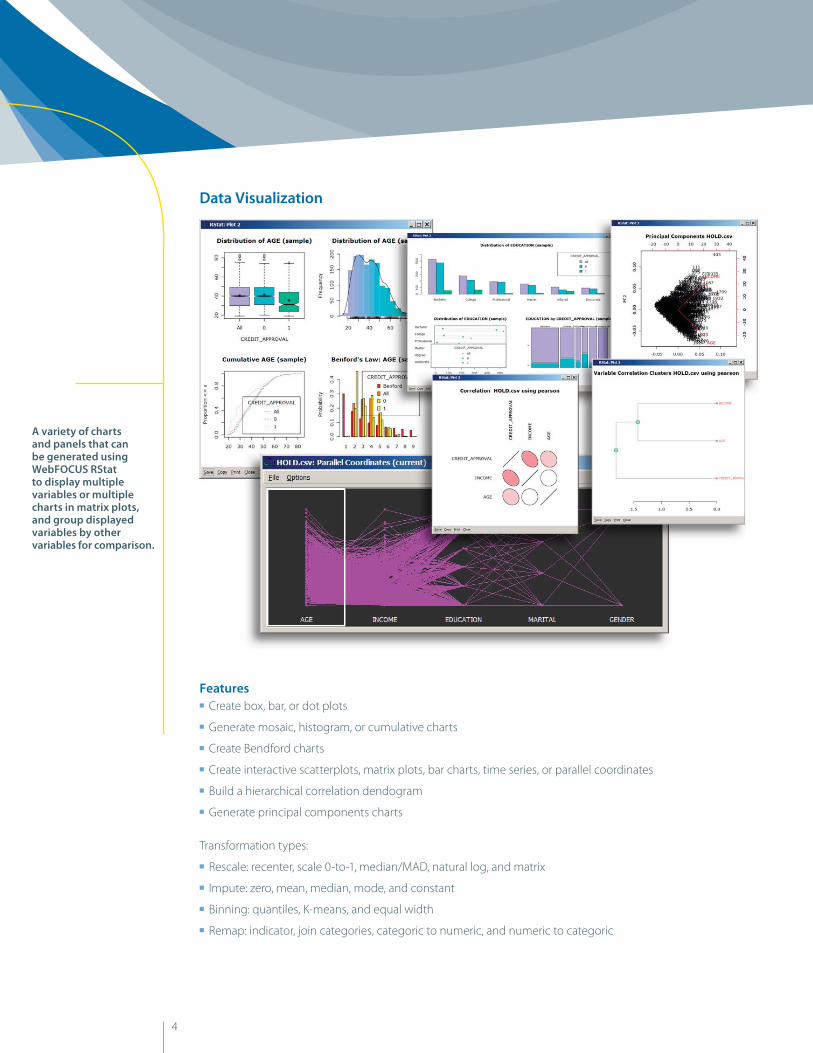
A variety of charts and panels that can be generated using WebFOCUS RStat to display multiple variables or multiple charts in matrix plots, and group displayed variables by other variables for comparison.
Data Visualization
Features
Create box, bar, or dot plots ■
Generate mosaic, histogram, or cumulative charts ■
Create Bendford charts ■
Create interactive scatterplots, matrix plots, bar charts, time series, or parallel coordinates ■
Build a hierarchical correlation dendogram ■
Generate principal components charts ■
Transformation types:
Rescale: recenter, scale 0-to-1, median/MAD, natural log, and matrix ■
Impute: zero, mean, median, mode, and constant ■
Binning: quantiles, K-means, and equal width ■
Remap: indicator, join categories, categoric to numeric, and numeric to categoric ■
5
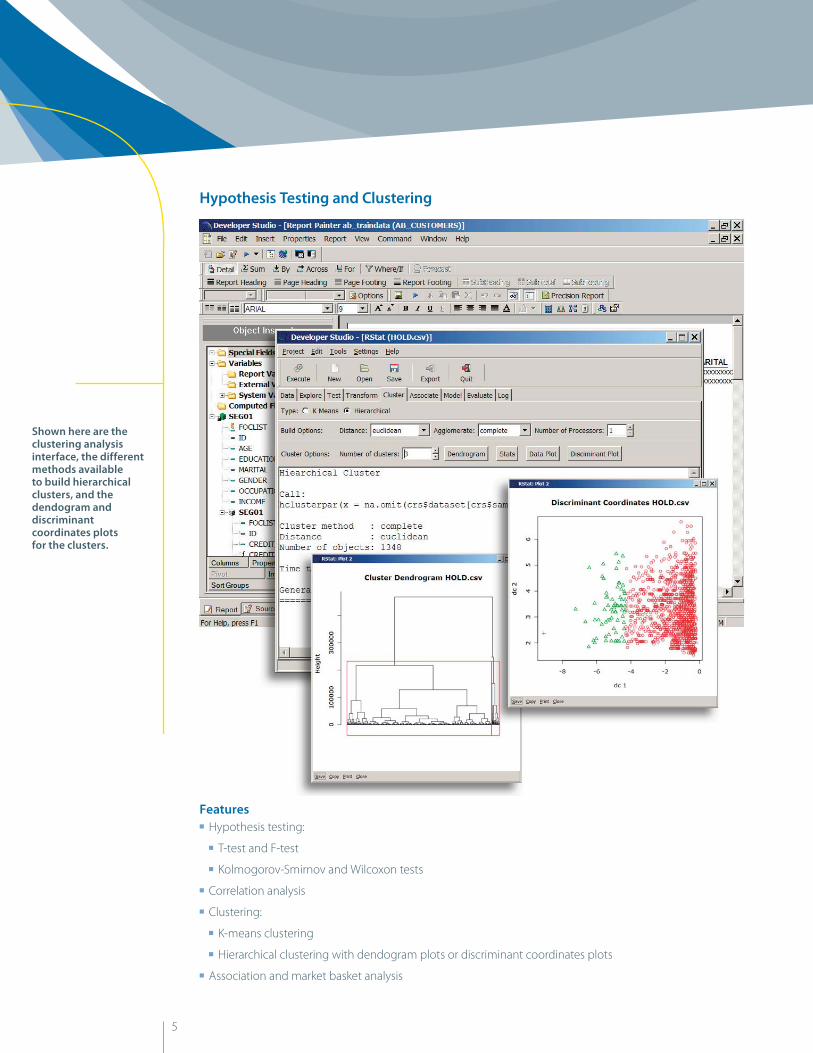
Hypothesis Testing and Clustering
Features
Hypothesis testing: ■
T-test and F-test ■
Kolmogorov-Smirnov and Wilcoxon tests ■
Correlation analysis ■
Clustering: ■
K-means clustering ■
Hierarchical clustering with dendogram plots or discriminant coordinates plots ■
Association and market basket analysis ■
Shown here are the clustering analysis interface, the different methods available to build hierarchical clusters, and the dendogram and discriminant coordinates plots for the clusters.
6
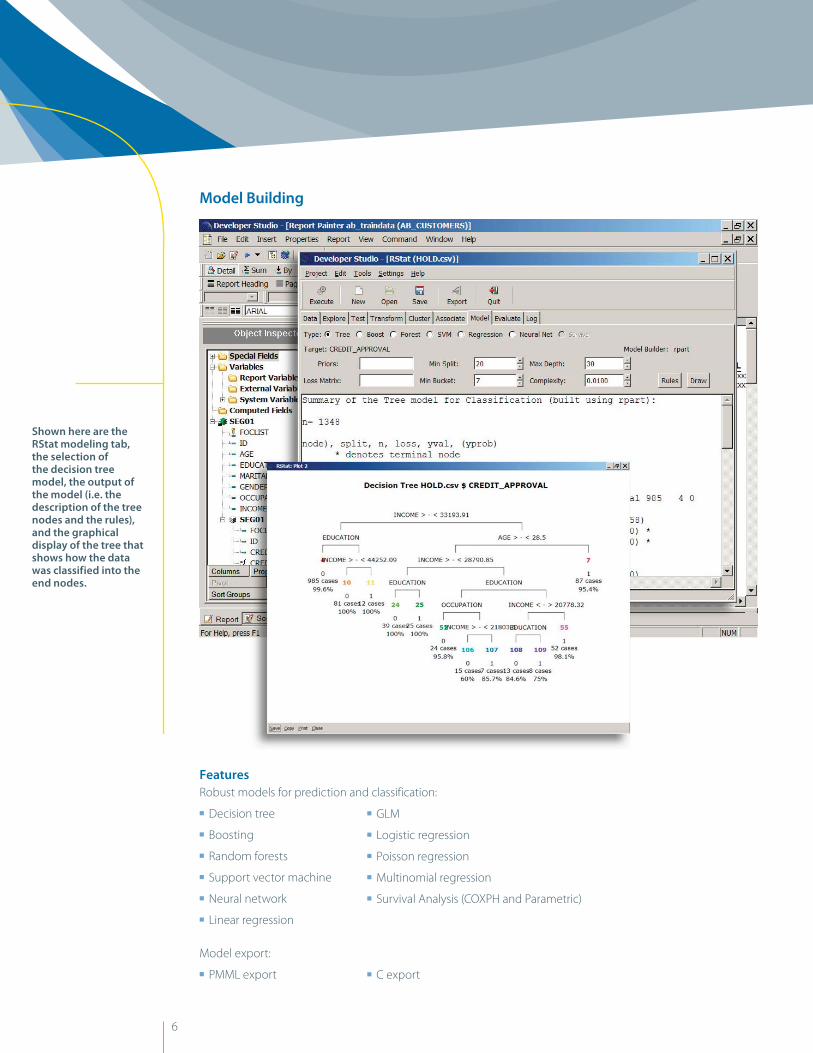
Model Building
Features
Robust models for prediction and classification:
Decision tree ■
Boosting ■
Random forests ■
Support vector machine ■
Neural network ■
Linear regression ■
Model export:
PMML export ■
GLM ■
Logistic regression ■
Poisson regression ■
Multinomial regression ■
Survival Analysis (COXPH and Parametric) ■
C export ■
Shown here are the RStat modeling tab, the selection of the decision tree model, the output of the model (i.e. the description of the tree nodes and the rules), and the graphical display of the tree that shows how the data was classified into the end nodes.
7
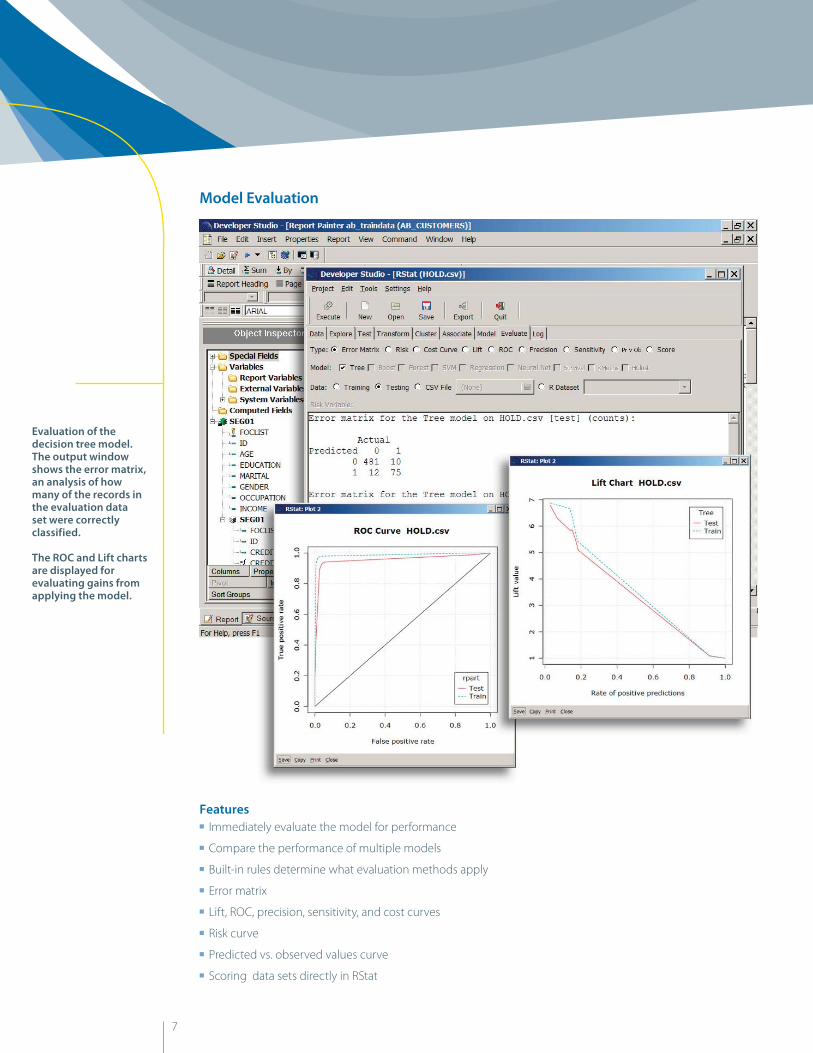
Model Evaluation
Features
Immediately evaluate the model for performance ■
Compare the performance of multiple models ■
Built-in rules determine what evaluation methods apply ■
Error matrix ■
Lift, ROC, precision, sensitivity, and cost curves ■
Risk curve ■
Predicted vs. observed values curve ■
Scoring data sets directly in RStat ■
Evaluation of the decision tree model. The output window shows the error matrix, an analysis of how many of the records in the evaluation data set were correctly classified.
The ROC and Lift charts are displayed for evaluating gains from applying the model.
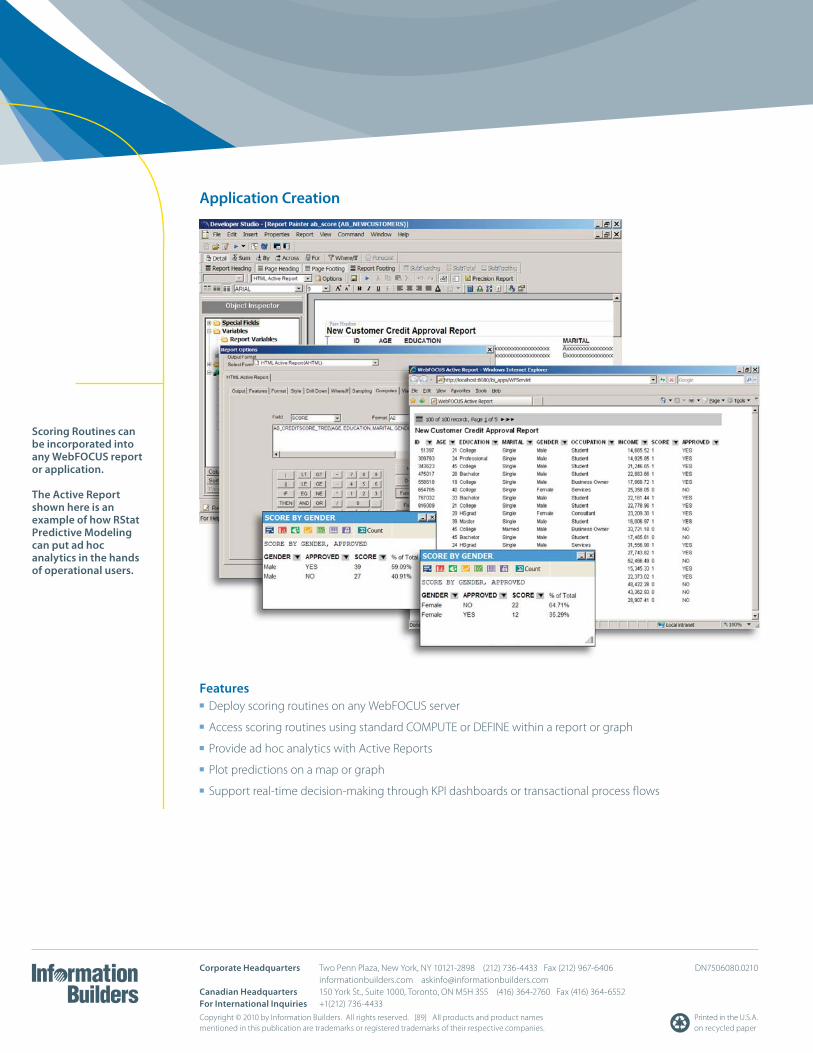
Application Creation
Features
Deploy scoring routines on any WebFOCUS server ■
Access scoring routines using standard COMPUTE or DEFINE within a report or graph ■
Provide ad hoc analytics with Active Reports ■
Plot predictions on a map or graph ■
Support real-time decision-making through KPI dashboards or transactional process flows ■
Scoring Routines can be incorporated into any WebFOCUS report or application.
The Active Report shown here is an example of how RStat Predictive Modeling can put ad hoc analytics in the hands of operational users.
Corporate Headquarters Two Penn Plaza, New York, NY 10121-2898 (212) 736-4433 Fax (212) 967-6406 DN7506080.0210
informationbuilders.com [email protected]
Canadian Headquarters 150 York St., Suite 1000, Toronto, ON M5H 3S5 (416) 364-2760 Fax (416) 364-6552
For International Inquiries +1(212) 736-4433
Copyright © 2010 by Information Builders. All rights reserved. [89] All products and product names
mentioned in this publication are trademarks or registered trademarks of their respective companies.
Printed in the U.S.A.
on recycled paper


![Cobar Shire · NO C] You must nominate a Licensed Contractor: Builders Name: Builders Address: Builders Contact Phone No.. Builders Contractor Licence No. : If the reasonable market](https://img.pdfslide.us/doc/110x75/5f9adfaabaa3837b663491f9/cobar-shire-no-c-you-must-nominate-a-licensed-contractor-builders-name-builders.jpg)