Embed Size (px)
Citation preview

IRES2011-029
IRES Working Paper Series
Information Asymmetry and Organizational Structure: Evidence from REITs
Yongheng Deng, Maggie (Rong) Hu, and Anand Srinivasan
Aug 2015

Information Asymmetry and Organizational Structure: Evidence from REITs1
Yongheng Deng
Department of Real Estate, Department of Finance,
and Institute of Real Estate Studies,
National University of Singapore
e-mail: [email protected]
Maggie (Rong) Hu
School of Banking and Finance
UNSW Business School
University of New South Wales, Australia
Email: [email protected]
Anand Srinivasan
Department of Finance
NUS Business School
National University of Singapore
e-mail: [email protected]
August 31, 2015
1 We would like to thank discussants and participants at European Financial Management Association
Meeting (EFMA) 2012, Asian Financial Association Conference 2012, Financial Management Association
Conference 2012, and FSU/UF Critical Issues in Real Estate Symposium 2014 for helpful comments and
suggestions.

Information Asymmetry and Organizational Structure: Evidence from REITs
Abstract
We test for the differences in information asymmetry across two organizational forms
(external and internal) in the REIT industry. We find significant differences with external
REITs being significantly more transparent relative to internal REITs, and these
differences are reflected in the loan contract terms and loan syndicate structure of loans
made to these two types of REITs. We find that the relatively more transparent externally
advised REITs are offered more favourable loan contracts in terms of lower loan rates and
lower likelihood of collateral requirement. Further, loans to external REITs have syndicates
that are larger in size and the lead lender retains a smaller portion of the loan, reflecting
lower information asymmetry.
Key words: external advisor; Real Estate Investment Trust (REIT); organizational
structure; loan contract terms; information opacity; certification effect
JEL classification: G20, L85, L00, L22

1
1. Introduction
Publicly traded REITs in the U.S. adopt two principal organizational forms – an
internal REIT, where the REIT advising and property management are performed within
the REIT itself by its own staff, and an external REIT where the advisory and property
management role is performed by an external advisor. Extant literature documents that
these external advisor arrangements provide poor performance due to conflicts of interest
between the external advisor and the REIT shareholders (Capozza and Seguin 2000,
Ambrose and Linneman 2001).2 Nevertheless, close to 20% of traded REITs in the US
continue to have the external organization structure. Further, in other countries such as
Singapore, a majority of REITs are externally managed. This suggests that there are some
potential advantages of this organizational form that might have been neglected in the
literature.
This paper empirically investigates one potential benefit of the external
organizational form by examining differences in information asymmetry, loan contract
terms (both price and non-price terms) and the syndicate structure of loans to external and
internal REITs. Our investigation is motivated in part by a recent model by Sun (2010)
who argues that the external organizational form may be optimal in some cases, as the
external advisor may exert larger effort due to reputational concerns. Such reputational
concerns are likely to be of greater importance for smaller REITs, where information
asymmetries are more important. In addition, Chan, Erikson and Wang (2003) document
2 There is a large literature that shows a strong impact of corporate governance on REIT valuation. Hartzell,
Kallberg and Liu (2008) show a valuation effect during IPOs as well as long-run operating performance
differences in REITs based on corporate governance. Other evidence on the importance of REIT corporate
governance includes Campbell, Ghosh and Sirmans (2005), Hartzell, Sun and Titman (2006), Bauer,
Eichholtz and Kok (2010), Anglin, Edelstein, Gao and Tsang (2012), and Deng, Devos, Rahman and Tsang
(2015).

2
that an external REIT may be restricted in choosing risky projects, thus, the chance of risk
shifting is lower. This would also result in a lower degree of information asymmetry with
capital market participants. Since the ex-ante likelihood of risk shifting may be higher in
smaller firms, this would suggest that smaller REITs should be more likely to choose the
external form. Consistent with this, the empirical analysis of our sample also finds that
internal REITs are less than half the size of external REITs.3
We next proceed to the main analysis of this paper, namely examining differences
in loan contract terms (both price and non-price) across these two types of REITs. Our use
of loan contract terms is motivated in part by some recent papers in banking that suggest
that loan contract terms reflect informational asymmetry and moral hazard (Sufi, 2007;
Bharath et al, 2011). An additional benefit of focusing on loan contract terms is that it
provides an examined benefit of continuing in the external form – that a lower cost of
capital for loans (due to lower information asymmetry) may offset some of the documented
disadvantages of being an external REIT.
We study four loan contract terms - the interest rate, whether or not a loan is
collateralized, the number of covenants and the maturity of the loan. To the extent that the
external REITs have a lower information asymmetry and risk shifting, this should result in
lower interest rates, and fewer collateral and covenant restrictions (Diamond, 1984; Boot,
Thakor and Udell, 1990). Further, to the extent that maturity structure of debt is determined
by risk shifting (Flannery, 1986), this should also lead to longer debt maturities for external
3 A REIT industry report prepared by Deloitte (2008) suggests that the optimal organizational form for
smaller REITs is an external advisory arrangement while larger REITs should be internally advised. In this
report, the principal benefits of being external are stated to be reaping the benefits of economies of scale in
management of properties by the external advisor, as well as taking advantage of the expertise of the external
advisor in a particular geographical location or industry.

3
REITs. To test this, we use a large sample of loans made to publicly traded U.S. REITs
using the LPC Dealscan database. This database has been widely used in the banking
literature for studying issues in banking for industrial firms (Drucker and Puri, 2005;
Santos and Winton, 2008), although most extant studies using this data exclude financials
and REITs.
We find broad support for the notion that loan contract terms reflect lower
information asymmetry for external REITs. In particular, external REITs obtain lower loan
rate of around 15 basis points. Given the average loan spread of around 170 basis points,
this suggests an 8% discount in the loan rate. As found with the measures of information
asymmetry, this result is surprising because the size of the external REITs in the sample is
only 56% in terms of mean and 80% in terms of median relative to the size of internal
REITs. In most studies, loan rates and collateral decrease with size, reflecting the usually
lower credit risk associated with larger firms. Likewise, we find that external REITs have
a significantly lower likelihood of collateral constraints and smaller number of covenants.
However, we do not find any difference in the maturity structure of loans. Consistent with
the literature on relationship lending, prior relationships between lenders and borrowers
result in significantly lower interest rates. Relationships are also associated with lower
collateral and lower maturity, but have no impact on covenants.
Next, we examine the syndicate structure of loans made to internal and external
REITs. Sufi (2007) documents that information asymmetry also impacts the structure of
the syndicate in case of syndicated loans. In particular, he shows that greater information
asymmetry leads to smaller syndicates as well as retention of a greater share of the loan by
the lead lenders. Since most of the loans in the LPC database are also syndicated, using the

4
syndicate structure provides an alternative test for the notion that information asymmetry
differs across these two organizational forms. We find that external REITs have larger
syndicates as well as lower retention of the loan share by lead lenders, consistent with the
notion that they have lower information asymmetry.
The above results may be driven by differences in credit risk of internal and external
REITs. Our baseline specifications included credit risk controls in the form of ratings at
the loan level. Nevertheless, it is possible that there are other unobservable risk factors that
cause this difference. We use a change in laws pertaining to REITs as a natural experiment
to test our results. Specifically, in 2001, REIT law was changed to reduce the mandatory
payout ratio from 95% to 90%.4 This change effectively increased agency costs for all
REITs. In this situation, the advantage to being externally advised should become larger,
due to the greater capacity of internal REITs to do risk shifting. We re-estimate our baseline
results interacting a post Modernization Act dummy variable with the external status.
Consistent with our main argument, the advantage of being externally advised increases
significantly after the REIT modernization act.5
To summarize, extant studies on external REITs, which focus mainly on the conflict
of interests between the external advisors and the shareholders of external REITs, may
have ignored the benefits of enhanced transparency associated with being an external REIT.
Our paper attempts to fill this gap by exploring in detail the potential advantage of external
REIT organizational structure from the perspective of enhanced monitoring and loan
contract terms.
4 The REIT Modernization Act was passed by the U.S. Congress in 1999. However, this provision was made
effective only after 2001. 5 We thank Benjamin Schiek, discussant of our paper, for this excellent suggestion.

5
Although the setting of our study applies principally to real estate, it also has
implications for a larger literature that examines the link between organizational form and
risk shifting. In particular, as documented by Esty (2001), risk shifting incentives of
organizational forms differ significantly across mutual and stock insurance companies. Our
study shows that such differences may also significantly impact information asymmetries,
and these differences are priced in the market for loans.
The rest of this paper is organized as follows: in Section 2, we provide some
institutional background about internal and external REITs and develop our hypotheses. In
Section 3, we provide details on the data collection and sample construction. In Section 4,
we conduct univariate analysis. In Section 5, we conduct multivariate analysis of loan
contract terms and syndicate structure. Lastly, in Section 6, we present our concluding
remarks.
2. Institutional Background, Related Literature and Hypotheses Development
This section provides the institutional background of REITs in the US, focusing on
the development of these two organization forms – internal and external. Next, we survey
academic literature on the relative performance of these two organizational forms. Lastly,
we develop the hypotheses on differences in loan contract terms across these two
organizational forms that would be consistent with the difference in information
asymmetry.
2.1 Evolution of REIT organizational form

6
Chan, Erikson and Wang (2003) provide a detailed analysis of the REIT industry
as well as the differences between internal and external REITs. This section draws on
insights from their study. Because REITs were designed to be passive investment vehicles,
they were prohibited from actively trading their properties in the open market or directly
managing them. Instead, they were required to either employ professional property
management firms or simply lease their properties. The effect of these legal requirements
is to separate the fiduciary responsibilities of REIT management from the provision of
tenant services.
In 1986, the US Congress changed the tax code to allow REITs to manage their
own portfolios. After the passage of Tax Reform Act in 1986, REITs were allowed to
“directly select, hire, and compensate those independent contractors who will provide
customary services that may be provided by a REIT in connection with the rental of real
property, rather than hiring an independent contractor to hire other independent contractors.”
REITs that continued to be managed by external advisors were classified as external
REITs, whereas those that integrated the advising function within the organization were
classified as internal REITs. Anecdotal evidence suggests that internal REITs pursue more
aggressive growth strategies via the acquisition and development of properties. 6 The
information content in their operating performance, business strategy, and expansion plan
is expected to be less available to the public relative to external advised REITs. Beginning
in 1987, many REITs switched from externally advised and hired internal professional
6 See, for example, Capozza and Seguin (2000), Ambrose and Linneman (2001) and Chan, Erikson and Wang
(2003).

7
management. New internally-advised REITs were also formed by entrepreneurs needing
access to capital to build or restructure portfolios of properties.
2.2 Literature Review on External REIT Puzzle
The coexistence of two REIT forms is puzzling since the internally-advised REITs
are believed to be more efficient than the old-style externally-advised REITs. John Haahr,
the managing director of the real estate group at Kemper Securities, says that self-managed
REITs are the only ones he will consider. “Picking self-managed REITs is our way of
making sure that the money stays in the company,” said Haahr.7 Several leading REIT
experts predicted that self-advised and self-managed types of REITs would dominate the
industry (Linneman, 1997). This view was driven by the belief that internally advised
REITs, similar to operating companies, would be able to improve profits by expanding
revenues or controlling expenses. Capozza and Seguin (1998) found that during the period
from 1985 to 1992, internally-advised REITs outperformed externally-advised REITs by
more than 7% annually.
The above arguments are convincing – however, we observe few conversions from
external to internal advisors after 1996. As we will see, externally advised REITs still
comprise around 20% of the listed REITs in our data sample. The paper by Sun (2010)
provides a detailed theoretical analysis of potential advantages of being external in terms
of advisor reputation. To the extent that smaller REITs derive greater benefits from having
better reputation, this implies that smaller REITs are more likely to be externally managed.
7 As quoted by Katherine Anderson, “All the Right Moves,” Journal of Portfolio Management, Nov 1994.

8
2.3 Hypotheses
Next, we develop hypotheses on the impact of these differences in organizational
form and possible difference in information asymmetry on loan contract terms. Modern
banking theory has relied largely on information asymmetry and moral hazard to develop
theories for the existence of banks as well as explanation for extant loan contract terms
(Diamond, 1984; Ramakrishnan and Thakor, 1984). These suggest that greater
transparency of borrowers should lead to lower loan rates, due to the reduction in ex ante
information risk (e.g., Diamond and Verrecchia, 1991; Baiman and Verrecchia, 1996). In
our context, these studies would suggest that banks are more likely to charge a lower loan
rate to external REITs, because of their enhanced transparency. This reasoning leads to the
first hypothesis.
Hypothesis 1: Spreads should be lower for external REIT loans.
However, a typical loan provides a number of other contractual ways in which a
lender can impact the “cost” of a loan to a borrower. Besides the loan rate, bank loan
contracts also include non-price terms, such as collateral requirements, restrictive
covenants, and duration of the loan.
Some theoretical models of collateral based on moral hazard (Boot, Thakor and
Udell, 1991; Stulz and Johnson, 1985) posit that high risk borrowers are more likely to post
collateral. On the other hand, models of collateral based on adverse selection (Bester, 1985;
Besanko and Thakor, 1987) posit that collateral should be posted by low risk borrowers. A
preponderance of empirical evidence suggests that high risk borrowers tend to post more

9
collateral (Berger and Udell, 1990; Jimenez, Salas and Saurina, 2006). To the extent that
this is also applicable to REITs, one should expect lower collateral and lower information
asymmetry, and therefore a lower collateral requirement, for external REITs. Accordingly,
our second hypothesis is as follows:
Hypothesis 2: The likelihood of collateral should be lower for external REIT loans.
The debt covenant literature finds that banks use covenants to improve the ex post
monitoring of credit quality, although the covenants also reduce borrower investment
flexibility (Smith and Warner, 1979; Graham et al., 2008). Further, as Rajan and Winton
(1995) show, covenants also give lenders greater ex-post incentives to monitor; thus, they
are more likely to be used for borrowers that require such monitoring. The implication is
that the more opaque the firm is, the more likely that a greater number of covenants are
used to monitor the firm to improve transparency and prevent excessive risk taking. This
leads to the third hypothesis.
Hypothesis 3: The number of covenants should be lower for external REIT loans.
The literature on loan maturity is two-fold. On the one hand, Flannery (1986)
suggests that debt maturity would increase as borrower quality improves, implying that
debt maturity is a downward sloping function of the risk of the borrower. On the other hand,
Diamond (1991) predicts that maturity is a non-monotonic function of the borrower’s risk
rating with the shortest maturities for the lowest and highest risk ratings. Empirically,

10
Berger et al. (2005) find support for Flannery (1986). This suggests the following
hypothesis in terms of maturity of the loans taken by external versus internal REITs.
Hypothesis 4: Loan maturity should be higher for external REIT loans.
Next, we examine the effect of REIT organizational status on loan syndicate
structure. Unlike a traditional bank loan, which typically involves a single creditor, a
syndicated loan combines a group of lenders. A lead arranger originates the loan and
performs due diligence and monitoring, and the participant banks fund part of the loan
(Esty, 2001). In such loans, in addition to the information symmetry problem between
lenders and borrowers (Holmstrom and Tirole, 1997), there is an element of moral hazard
between the lead arrangers and other participant lenders. In particular, the lead arrangers
have an incentive to shirk monitoring responsibilities, especially when more intense
monitoring is required, as the monitoring efforts are costly and unobservable, and the lead
arrangers only own part of the loan (Ivashina, 2009). Ex ante, participant banks should take
these incentives into account and demand that a greater fraction of the loan be held by the
lead arrangers the more opaque the borrowing firm is. Sufi (2007) tests the above model
and finds that loan syndicates are structured to minimize this moral hazard problem. In
particular, he finds that lending syndicates tend to be smaller and lead banks retain a larger
share of the loan for borrowers requiring high levels of monitoring. In our setting, given
the higher information asymmetry of internal REITs, there would be a greater moral hazard
problem between leader arranger and participant banks. Hence we hypothesize that
participant banks would require the leader arranger to retain higher shares. In addition,

11
fewer banks would be willing to join, resulting in a smaller syndicate size for loans with
internal REIT borrowers. This leads to the last two hypotheses on syndicate structure and
lead lender share differences between external and internal REITs.
Hypothesis 5: Lead lender share should be lower for external REIT loans and higher for
internal REITs.
Hypothesis 6: Syndicate size should be larger for external REIT loans, and smaller for
internal REITs.
3. Data and Sample Selection
Our sample includes all U.S. REITs for which data is available in the Loan Pricing
Corporation (LPC) DealScan Database and COMPUSTAT. Data on individual loan
facilities is obtained from the DealScan database maintained by LPC. LPC has been
collecting information on loans to large U.S. corporations primarily through self-reporting
by lenders, SEC filings, and its staff reporters. The primary sources of data for DealScan
are attachments to SEC filings, reports from loan originators, and the financial press.
While the LPC database provides comprehensive information on loan contract
terms (LIBOR spread, maturity, collateral, etc.), it does not provide much information on
borrowers, such as borrowers’ financial information, etc. We manually match the
borrowers in the LPC database with the merged CRSP and COMPUSTAT database using
a text-matching algorithm outlined in Engelberg and Sankaraguruswamy (2007). The
output from the algorithm is verified by hand matching. For those REITs in the LPC
database that provide no matches using the algorithm, we hand match directly to CRSP and

12
COMPUSTAT. We then exclude those REITs that are mortgage or hybrid REITs. This
results in a total sample of 196 REITs.
To obtain the advisor status of each REIT, we searched manually in LexisNexis
and SEC filings for the company’s business description. A REIT is classified as internally
advised if it is found to be internally advised or internally managed in its SEC filings or
related news articles. Out of the 196 equity REITs, we are able to classify 159 as internal
REITs and 35 as external REITs. The remaining REITs were excluded from our analysis.
We then use the COMPUSTAT database to extract data on accounting variables for
each REIT. To ensure we only use accounting information that is publicly available at the
time of the loan, we employ the following procedure: For those loans made in calendar
year t, if the loan activation date is 6 months or later than the fiscal year ending month in
calendar year t, we use the data of that fiscal year. If the loan activation date is less than 6
months after the fiscal year ending month, we use the data from the fiscal year ending in
calendar year t-1.
Following Drucker and Puri (2005), we use the LPC reported “All-in-Spread-
Drawn” (AISD) as our measure of the cost for a loan. AISD is the coupon spread over
LIBOR on the drawn amount plus any recurring annual fee. For loans not based on LIBOR,
LPC converts the coupon spread into LIBOR terms by adding or subtracting a constant
differential reflecting the historical averages of the relevant spreads. The AISD enables
comparisons across loans, independent of the underlying fee and rate structure. 8
8 As of 8/31/2002, the differentials used in the calculation of AIS reported by LPC are: +255 basis points
(BP) for the prime rate, +3 BP for the commercial paper rate, -34 BP for the T-bill rate, -18 BP for bankers’
acceptance rate, –6 BP for the rate on CDs, and 0 BP for the federal funds rate, cost of funds rate and money
market rate. Hubbard et al. (2002) show that replacing these constants with time-varying differentials based
on year-specific average spreads has a minimal effect on any pricing implications.

13
As mentioned earlier, we use collateral requirements, covenants, and maturity as
the non-price terms of a loan. The dummy variable “collateral” equals 1 if the loan facility
was secured and 0 otherwise. Since the LPC database has a missing value for the secured
field for a large number of observations, we assume that observations that have a missing
value are uncollateralized.9 We use the total number of covenants in the loan contracts,
which is computed as the total number of financial covenants and general covenants, as
our measure of covenant strictness (Bradley and Roberts, 2004). The facility maturity is
calculated as the number of months between the facility start date and the maturity date.
These four variables, i.e., loan spread, collateral, covenants, and loan maturity, are used as
the principal measures of the borrowing firms’ benefits or costs in a loan contract.
A key focus of our paper is to analyze the information asymmetry across these two
REIT organizational forms. At the same time, there is also a literature on relationship
lending that analyzes the impact of relationships on information asymmetry. One finding
from the relationship literature is that borrowers and lenders form long-term relationships
that impact non-price as well as price terms of a loan contract. To adequately control for
this, as well as analyze loans for lender-specific variables, we focus on the loan-lender pair
as our unit of analysis. This allows us to precisely analyze the impact of relationships on
loan spreads, as well as adjust for lender-specific variables on the pricing of loan contracts.
We will henceforth use this as the unit of analysis and will be referring to a lender-loan
pair as a "loan". Another advantage of this specification is that firms with unobservably
higher information asymmetry should form stronger relationships. To the extent that our
9 This is consistent with prior literature in this field such as Bharath et al (2011).

14
controls for information asymmetry are not complete, selection of borrowers into strong
relationships with lenders allows us to control for this unobservable heterogeneity.
Table 1 Panel A presents a longitudinal view of our sample of observations with
the yearly distribution of 3,102 observations, among which 2,398 are for internal REITs,
and 704 for external ones. The number of observations drops sharply in years 2008 and
2009, which is consistent with a sharp decrease in loan syndications in these years due to
the credit crisis.10 Panel B reports the unique number of REIT firms by year and advisor
status.
Table 2 Panel A-C presents the summary statistics for all the key variables,
including loan characteristics, such as loan facility amount and spread, as well as borrower
characteristics, such as total assets and leverage ratio. The average (median) loan spread in
our sample is about 173 basis points (140 basis points), and average (median) loan amount
is about USD 361 million (250 million). Average (median) loan maturities are 34 (36)
months. About 20% of the loan facilities are collateralized and about 60% have covenants,
with 5 covenants per loan on average.
We also provide descriptive statistics for internal and external REIT samples in
Panel B and Panel C. There are approximately three times more loans taken by internal
REITs relative to external REITs, roughly consistent with the fractions of these REIT types
in the overall sample. Comparing Panel B to Panel C, we find that external REITs are
typically smaller in size, consistent with the finding in Capozza and Segiun (2000). Despite
10 In a press release, Thomson Reuters LPC reported that loan issuance in the U.S. for 2008 came in at only
$763.98 billion, which is down 55% from 2007 and that there was contraction in all industry sectors. See
“U.S. Loan Market Review: 2008 ends with lending grinding to a halt” New York, December 30, 2008
(Thomson Reuters LPC).

15
their larger size, internal REITs experienced higher loans rates, stricter collateral
requirements and shorter loan maturities. The average loan spread is 174.3 basis points for
internally advised REITs and 167.3 basis points for externally-advised REITs, respectively.
About 22% of internal REIT loans have a collateral requirement, whereas only 15% of
external REIT loans are collateralized.
4. Univariate Analysis
Univariate tests of differences in key loan characteristics and borrower
characteristics between internal REIT and external REIT loans are presented in Panel D of
Table 2. The last three columns report differences in means and the associated t-statistics
and z-statistics. The first part presents the test results for the key loan characteristics. The
statistics provide strong evidence that external REITs enjoy significantly better price as
well as non-price terms. The difference in mean loan spreads is 7 basis points and is
statistically significant at the 10% level, while the difference in median loan spread is 30
basis points and is significant at the 1% level. On average, about 21.6% of internal REIT
loans are collateralized compared to 15.1% external REIT loans that are collateralized. This
difference is significant at 1% level. Thus, the univariate results on loan spreads and
collateral are consistent with hypotheses 1 and 2 respectively, that is, external REITs obtain
a lower loan rate and are less likely to provide collateral. It is interesting to note that
externally advised REITs are associated with more covenant requirements, contrary to the
predicted sign in Hypothesis 3. The difference in mean maturity is insignificant contrary
to Hypothesis 4; however, the median maturity of external REIT loans is higher than that
of internal REITs, which is consistent with the predicted sign.

16
The principal variables we use to capture the syndicate structure are the total
number of lenders in the syndicate and the percentage of the loan kept by the lead arranger,
following Sufi (2007). On average, lead arrangers retain 33% of the total loan amount for
loans taken by external REITs, compared with 37% for internal REIT loans. The difference
of lead lender share is about 4% and is significant at 1% level. There is also a significantly
greater number of lenders in external loan syndicates. Thus, the difference in syndicate
concentration documented here is also consistent with external REITs being more
informationally transparent than internal REITs as stated in hypotheses 5 and 6,
respectively.
While the univariate tests provide preliminary evidence that external REITs are
offered more favourable loan terms, and that syndicate structures are significantly different
across these two loans, these results do not take into account potentially significant
differences in borrowing firms’ characteristics. For example, banks may prefer to offer
better loan contract to borrowers with a track record of strong financial performance. To
examine this, we tabulate differences between internal and external REITs in terms of firm
characteristics. The results are reported in bottom part of Table 2 Panel D. The average size
(as measured by book value of assets) of an internal REIT ($ 3,365 million) is almost twice
the average size of an external REIT ($ 1,909 million). This difference in size is significant
at the one percent level. The two types of REIT borrowers also differ with respect to
leverage and market to book ratios. To better examine the effects of REIT organizational
structure on loan contract terms, we employ multivariate tests in the following section.
5. Multivariate Analysis

17
The results in the previous section suggest that loan contract terms and syndicate
structures differ significantly across internal and external REITs. To account for
differences in loan facility and borrower specific characteristics, this section conducts
multivariate analysis to examine if the differences persist when other controls are added.
5.1 Organizational Form and Loan Contract Terms
We hypothesize that external REITs are expected to have lower loan rates, lower
collateral requirements, and fewer loan covenants if the greater transparency of this
organizational form is reflected in loan contract terms. Thus, our main dependent variables
are the loan contract terms, including loan rates, an indicator variable for collateral
requirement, number of covenants imposed, and loan maturity. Our key independent
variable is a dummy variable which indicates whether the REIT organizational structure is
external. Specifically, the regression model is as follows:
𝐿𝑜𝑎𝑛 𝐶𝑜𝑛𝑡𝑟𝑎𝑐𝑡 𝑇𝑒𝑟𝑚𝑠 𝑖,𝑗(𝑖. 𝑒. , 𝐴𝐼𝑆𝐷, 𝐶𝑜𝑙𝑙𝑎𝑡𝑒𝑟𝑎𝑙, 𝐶𝑜𝑣𝑒𝑛𝑎𝑛𝑡𝑠, 𝑎𝑛𝑑 𝑀𝑎𝑡𝑢𝑟𝑖𝑡𝑦)
= 𝛽0 + 𝛽1(𝐸𝑥𝑡𝑒𝑟𝑛𝑎𝑙) + ∑ 𝛽𝑖(𝐿𝑜𝑎𝑛 𝐶ℎ𝑎𝑟𝑎𝑐𝑡𝑒𝑟𝑖𝑠𝑡𝑖𝑐𝑠) +
∑ 𝛽𝑗(𝐵𝑜𝑟𝑟𝑜𝑤𝑒𝑟 𝐶ℎ𝑎𝑟𝑎𝑐𝑡𝑒𝑟𝑖𝑠𝑡𝑖𝑐𝑠) + ∑ 𝛽𝑘(𝑂𝑡ℎ𝑒𝑟 𝐶𝑜𝑛𝑡𝑟𝑜𝑙𝑠) + 𝜀𝑖,𝑗 (1)
where the 𝑖 and 𝑗 subscripts indicate loans and firm, respectively, and 𝛽 is a vector of
parameters.
We estimate the empirical loan rate model using OLS method; for collateral, the
regression estimation is done using Probit; and ordinal Logit model is used for covenants
regression because the number of covenants is a discrete natural number. We use the log
of the total assets, leverage ratio, and the market to book ratio as control variables for

18
borrower characteristics. Following Bradley and Roberts (2004) and Degryse and Ongena
(2005), we also use the term spread and default spread to control for macroeconomic risk
factors. Term spread is the difference between the yield on a one- and a ten-year Treasury
bill. Default spread is defined as the difference between the yield on Moody’s seasoned
corporate bonds with Baa ratings and the yield on 10-year U.S. government bonds.
We use the logarithm of loan amount, collateral, loan concentration, number of
covenants, and the logarithm of maturity as control variables for loan characteristics in the
loan rate regression. Following Berger and Udell (1990), Elsas and Krahnen (1998) and
Degryse and Ongena (2005), we assume that collateral and loan rate are determined
sequentially, with the collateral decision preceding the interest rate determination. Thus,
collateral is used as an independent variable in the loan rate regression, but not vice versa.
The detailed definitions of most of the variables can be found in Appendix A. We also
include year, loan type, loan purpose, and lender fixed effects.
5.1.1 Effect on Loan Rate
Panel A of Table 3 reports estimation results for the loan rate regression. We find
that the spread on external REIT loans is around 15 basis points lower than spread on
internal REIT loans, after accounting for borrower and loan characteristics. This estimate
is actually larger than the 7 basis points difference in loan spreads in the univariate test
from Table 3 which essentially reflects the fact that external REITs are smaller in firm size
and therefore should, ceteris paribus, pay higher interest rates on loans.

19
Other variables in this regression have signs consistent with prior literature. For
example, larger loans have lower spreads reflecting economies of scale at loan origination.
Larger borrowers have lower spreads, and borrowers with greater leverage have higher
spreads. To the extent that market-to-book can be interpreted as a proxy for credit risk
(Fama and French (1993)), a negative coefficient for this variable implies that credit risk
is lower for such firms. Collateral has a positive impact on loan spreads consistent with the
notion that more risky borrowers are more likely to be required to post collateral as well as
pay higher loan rates. The positive impact of collateral on loan rates has been documented
in many other empirical studies (Berger and Udell, 1990; Bharath et al., 2011). Consistent
with Degryse and Ongena (2005) who find that a one basis point parallel shift of the term
spread implies a positive 0.4 basis point shift in the loan rate, we find that term spread and
default spread are positively related with loan rates in our sample when year fixed effect is
excluded. The negative effect of External dummy on AISD holds in all different
specifications. Thus, hypothesis 1 is supported.
5.1.2 Effect on Non-Price Loan Contract Terms
Next we focus on three specific non-price terms: collateral requirements, the
number of covenants, and loan maturity. Turning to Panel B of Table 3, external REIT
loans are associated with about 30% reduction in collateral requirement, as the external
dummy is negatively related to collateral requirement at 1% significance level. This result
is also consistent with Bester (1985), who suggests that borrowers with less severe
information asymmetries should have reduced collateral requirements.

20
We control for loan amount, maturity, leverage, market-to-book, and loan
concentration (measured as the fraction of the loan amount to the sum of existing debt plus
the loan amount). These control variables have similar effects on collateral and loan spread.
We find that larger loans are associated with lower collateral requirement, which suggests
that banks offer larger loans to less risky borrowers and impose less stringent collateral
requirement as well. Leverage is found to be positively associated with collateral
requirement; consistent with the notion that highly leveraged firms have greater incentives
to increase the riskiness of assets. Banks take this into account ex ante and set stricter
collateral requirements as compensation for risk.
Loan concentration [Loan Amount/(Existing Debt + Loan Amount )] is
expected to be positively associated with collateral requirements. If a particular loan
facility is a significant portion of the firm’s debt, it is more likely to be secured (Berger
and Udell, 1990; Boot, Thakor, and Udell, 1991; Dennis, Nandy, and Sharpe, 2000).
However, loan concentration is significant only in one specification.
Table 3 Panel C reports the ordinal Logit regression result on the number of
covenants in loan contracts. The coefficient on the external dummy is -0.16 and significant
at the 1% level, suggesting the existence of fewer covenants for external REIT loans. This
result is consistent with the notion that banks use restrictive covenants to improve the ex
post monitoring of borrowers’ credit quality (Smith and Warner, 1979; Rajan and Winton,
1995; Bradley and Roberts, 2004; Graham et al., 2008). We also control for other firm and
loan specific variables. Loan amount is positively associated with covenant requirements,
which suggests that banks impose more restrictions on larger loans. Collateral is positively

21
associated with the number of covenants, as explained earlier in part B. Larger firms are
less subject to covenant restrictions, consistent with Kim et al. (2011).
Table 3 Panel D reports the regression results for loan maturity. The dependant
variable Log(Maturity) is the natural log of the stated maturity of the loan facility
(measured as length in months between facility activation date and maturity date). We
model the relationship between debt maturity and REIT organizational status after
controlling for variables that are known determinants of debt maturity (see Barclay and
Smith, 1995; Guedes and Opler, 1996; Barclay, Marx, and Smith, 2003). We control for
firm size, loan amount, leverage, collateral, market-to-book, and asset maturity. Following
Guedes and Opler (1996), we define asset maturity as (Net PP&E/Assets)(Net
PP&E/Depreciation), where PP&E stands for property, plant and equipment. The intuition
behind this variable is that firms may try to match their debt maturity to asset maturity.
Myers (1977) argues that firms schedule debt repayments to match the decline in the value
of assets in place as a way to lower the agency costs of debt. Thus, firms with more long-
term assets in place can support more long-term debt. Maturity matching allows firms to
extend debt maturity without significantly increasing the agency costs of debt. Similarly,
Diamond (1991) argues that liquidity risk is reduced by financing long-term assets with
long-term debt.
However, in all specifications, the external dummy is not significant. This suggests
that at least in this setting, debt maturity is not impacted by information asymmetry. It may
also be consistent with the notion that the relationship between loan maturity and firm risk
is non-monotonic (Diamond (1991)). Further, contrary to the maturity matching theory, the
coefficients on asset maturity are negative in model 3 and model 4. However, it should be

22
noted that there is a large reduction in the number of observations due to missing variables
when we construct the asset maturity variable.
Overall, the results of this sub-section provide broad support for hypothesis 1 to
hypothesis 3 that loan contract terms do reflect lower information asymmetry. Although
we do not find support for hypothesis 4, the theoretical literature has conflicting predictions
for the impact of information asymmetry on loan maturity which may be one potential
explanation for this result.
5.2 Effect on Loan Syndicate Structure
Next, we examine the effect of being externally advised on lead lender shares and
syndicate size. Specifically, we estimate the following equation:
𝑆𝑦𝑛𝑑𝑖𝑐𝑎𝑡𝑒 𝑆𝑡𝑟𝑢𝑐𝑡𝑢𝑟𝑒𝑖 = 𝑋𝑖𝛽 + 𝐸𝑥𝑡𝑒𝑟𝑛𝑎𝑙𝑖𝛾 + 𝑌𝑒𝑎𝑟 + 𝐿𝑜𝑎𝑛 𝐶ℎ𝑎𝑟𝑎𝑐𝑡𝑒𝑟𝑖𝑠𝑡𝑖𝑐𝑠𝑖 (2)
Following Sufi (2007), we sort the sample by sales revenue and then create the
dummies for the smallest one-third, middle one-third, and largest one-third of firms in the
sample by sales. We then interact the logarithm of loan amount with the mid and large
dummies. The estimation result is presented in Table 5.11 The dependent variable in model
1 is Lead Lender Share, defined as the percentage of the loan retained by the lead lender,
and the dependent variable in model 2 is syndicate size, defined as the total number of
lenders in the loan syndicate. Our key independent variable of interest is the external
dummy, which captures the difference in information opacity in REIT borrowers. We
11 The variables of lead lender share and syndicate size are not disclosed by LPC data for many data
observations. Hence, this regression has a much smaller number of observations relative to the loan
contract regressions.

23
control for firm characteristics and loan characteristics, such as the logarithm of firm sales
(which is the logarithm of sales revenue), a dummy variable for rated firms and an indicator
for term loan, as well as year, loan purpose and lender fixed effects.
In both models, the external dummy is significantly related to the degree of
concentration within the syndicate. We find that there are more lenders in the syndicate,
and the lead arranger holds fewer shares of the loan. The effect of the external dummy on
syndicate concentration is also economically significant. Ceteris paribus, being externally
advised reduces lead lender share by about 9% and increases the number of lenders in the
syndicate by about 1.6. This is consistent with the result reported in Sufi (2007) who finds
that lending syndicates tend to be more concentrated for borrowers requiring high levels of
monitoring. Thus, these results provide support for hypotheses 5 and 6 that syndicate
structure also reflects the lower information asymmetry of loan contract terms.
5.3 Endogeneity of External REIT Status
A potential concern is that the decision to choose internal or external organizational
status may be endogenous. In this case, the coefficient on the external REIT dummy
variable may be biased. There are several ways to account for such a bias. Instrumental
variable analysis is one possible approach. However, this does require the instrument to be
positively correlated with the REIT status but not with loan contract terms.
Here, we take an alternative approach. In our sample period, an important
legislation that was passed by the U.S. Congress was the REIT Modernization Act in 1999.
One important aspect of this act was to reduce the mandatory distribution of REITs from

24
95% to 90%. This had the effect of increasing the cash flow available to REIT management.
In fact, a policy paper on this reduction of distribution requirement published on NAREIT’s
web site states, “This flexibility is especially important in the capital intensive commercial
real estate leasing business under which REITs must incur capital costs to maintain the
quality of their properties.”12 This suggests that the act further enhanced the ability of
internal REITs to engage in high growth or potentially risky strategies. This makes this
event a good setting to test for the effect of information asymmetry.
In particular, with the passage of the act, the risk to lenders increases as lenders
may be able to pursue more high risk and potentially higher return strategies. While this
may very well be beneficial to shareholders, debtholders may rationally demand a higher
premium. For internal REITs, given their flexibility of strategies, this is likely to be a large
advantage. However, given the greater degree of restrictions faced by external REITs, they
will not face similar issues, as they are unable to use these higher payouts for risky new
projects. This implies that the degree of difference in loan spreads should increase with the
passage of this act.
Using a similar specification as Table 3, we test if this is indeed the case in Table
5. We create a post-REIT Modernization Act dummy variable for years after 2001 and
interact it with the external status. In fact, we find that the interaction is negative and
significant in the loan spread regression in Table 5 Panel A, suggesting that external REITs
derive greater benefits after the passage of this act.
12 Source: https://www.reit.com/advocacy/policy/federal-tax-legislation/reit-modernization-act-rma-1999

25
5.4 Corporate Governance, Organizational Status and Loan Contract Terms
It is documented in the literature that effective corporate governance could mitigate
agency risk, as shown in Hartzell, Sun and Titman (2006). REITs have other monitoring
tools at their disposal that could also mitigate information asymmetry, such as board
structure, managerial compensation contracts, and institutional ownership. In this section,
we compare loan characteristics of external REITs to those of the well-governed internal
REITs. We first sort internal REITs based on the percentage of the board that is
independent, and compare external REITs to those internal REITs with a higher percentage
of independent board. By comparing the group of external REITs with the group of better
governed internal REITs, we can check whether organizational structure is a substitute for
other forms of corporate governance mechanism.
We divide the internal REIT sample into four groups based on the rank of
independent director percentage. For the internal REITs sample, we then keep only the
quartile which has the highest percentage of independent directors and remove the other
three quartiles. Next we conduct univariate tests on the loan contract terms between
external REITs and better governed internal REITs.
The number and mean value of key loan contract term variables in the univariate
test result are reported in Panel A of Table 6. Compared to the better governed internal
REITs, external REITs have more favourable loan contract terms, including lower interest
rate and less stringent collateral requirements. However, they have more covenants
imposed on their loans.
We also conduct multivariate regression analysis to corroborate our univariate
result. In our loan contract terms regression, we include additional corporate governance

26
control variables, including independent director (model 2), and institutional ownership
(model 3), in the panels B-E. The regression results generally show that external
organizational status is not a perfect substitute for corporate governance mechanism. The
estimated coefficients on external organization status are still negative and significant in
most models, even after controlling for corporate governance variables.
5.5 Other Robustness checks
In other unreported tests, we also consider dispersion of analyst forecasts in internal
and external REITs. We find that external REITs have lower dispersion of forecasts
consistent with lower information asymmetry. However, this result does need to be
interpreted with caution as we do not have prior relationships between analysts and REITs.
Boudry, Kallberg and Liu (2010, 2011) show that these relationships are highly significant
in determining analyst behavior and bias in the context of REITs. We also perform similar
tests for the bid-ask spreads, and find similar results.
6. Conclusion
The coexistence of the two REIT forms has been a puzzling phenomenon in the real
estate literature. In this paper, we seek to provide a partial resolution to the external advisor
puzzle from the unique perspective of the information environment and loan contract terms.
Using a sample of loan facilities taken by REIT firms from 1987 to 2009, we investigate
the effects of REITs organization structure on loan contract terms in the loan market. We
compare the price and non-price terms of loan contracts between the two types of borrowers,

27
controlling for borrower- and loan-specific characteristics, as well as year and loan type
fixed effects.
The empirical evidence in this study provides support for the hypothesis that
externally advised REITs are offered more favourable loan contract terms by their banks,
including lower loan rates, lower collateral requirements, and fewer loan covenants. The
loan rate difference between the two groups is 11 basis points in our main regressions. The
difference in collateral requirements between the two groups is 33%, and the difference in
covenants in 26%, which are both quite significant. We find weak evidence of differences
in loan maturities. Our results suggest that banks view external REITs as less
informationally opaque and having less pre-contract information uncertainty, which leads
to banks offering more favourable contract terms to external REIT borrowers.
An external REIT must weigh the cost and benefit of staying externally advised
before it makes the decision to convert to internally advised status. The cost of being
externally advised mainly comes from the loss in forgoing higher risk growth projects and
staying in a relatively static business model. And the benefit of being externally advised
mainly consists of cost savings from external advisory and management (Deloitte, The
Canadian REIT Guide, (2008)), as well as more favourable loan contract terms which we
find in this study.

28
References:
Anglin, Paul, Robert Edelstein, Yanmin Gao and Desmond Tsang (2012). What is the
Relationship Between REIT Governance and Earnings Management? Forthcoming in
Journal of Real Estate Finance and Economics.
Ambrose, B., & Linneman, P. (2001). REIT Organizational Structure and Operating
Characteristics. Journal of Real Estate Research, 21, 146-62.
Baiman, S., & Verrecchia, R.E. (1996). The Relation Among Capital Markets, Financial
Disclosure, Production Efficiency, and Insider Trading. Journal of Accounting Research,
34, 1–22.
Barclay, M., Marx, L., & Smith, C. (2003). The joint determination of leverage and
maturity. Journal of Corporate Finance, 9, 149-167.
Basel Committee on Banking Supervision. (2000). Principles for the Management of
Credit Risk. Basel Committee Publications, Bank for International Settlement.
Bauer, Rob, Piet Eichholtz, Nils Kok. (2010). Corporate Governance and Performance:
The REIT Effect. Journal of Real Estate Finance and Economics, 38, 1-29.
Berger, A.N., & Udell, G. (1990). Collateral, Loan Quality and Bank Risk. Journal of
Monetary Economics, 25, 21–42.
Berger, A., Miller, N. H., Petersen, M. A., Rajan, R. G., & Stein, J. (2005). Does
Function Follow Organizational Form? Evidence from the Lending Practices of Large
and Small banks. Journal of Financial Economics, 76, 237-269.
Besanko, D., & Thakor, A. (1987). Collateral and Rationing: Sorting Equilibria in
Monopolistic and Competitive Credit Markets. International Economic Review, 28, 671-
689.
Bester, H. (1985). Screening vs. Rationing in Credit Markets with Imperfect Information.
American Economic Review, 75, 850–855.
Bharath, S., Dahiya, S., Saunders, A., & Srinivasan, A. (2011). Lending Relationships
and Loan Contract Terms. Review of Financial Studies, 24, 1141-1203.
Boot, A., Thakor, A., & Udell, G. (1991). Secured Lending and Default Risk:
Equilibrium Analysis, Policy Implications and Empirical Results. The Economics
Journal, 101, 458-472.
Boot, A., & Thakor, A. (1991). Off-Balance Sheet Liabilities, Deposit Insurance and
Capital Regulation. Journal of Banking and Finance, 15, 825-846.
Boudry, W., Kallberg, J. & C. Liu. (2010). An analysis of REIT security issuance
decisions. Real Estate Economics 38, 91-120.

29
Boudry, W., Kallberg, J. & C. Liu. (2011). Analyst behavior and underwriter choice.
Journal of Real Estate Finance and Economics 43, 5-38.
Bradley, M., & Roberts, M. R. (2004). The Structure and Pricing of Corporate Debt
Covenants. Working Paper.
Campbell, R. D., Ghosh, C., & Sirmans, C. F. (2005). Value creation and governance
structure in REIT mergers. Journal of Real Estate Finance and Economics, 31(2), 225–
239.
Capozza, D., & Seguin, P. (1998). Managerial Style and Firm Value. Real Estate
Economics, 26, 131-50.
Capozza, D., & Seguin, P. (2000). Debt, Agency and Management Contracts in REITs:
The External Advisor Puzzle. Journal of Real Estate Finance and Economics, 20, 91-
116.
Chan, S. H., Erickson, J., & Wang, K. (2003). Real Estate Investment Trusts. Oxford
University Press.
Degryse, H., & Ongena, S. (2005). Distance, Lending Relationships, and Competition.
Journal of Finance, 60, 231–266.
Deloitte. (2008). The Canadian REIT Guide. 8th edition, Canada.
Deng, Y., Devos, E., Rahman, S., & Tsang, D. (2015). The Role of Debt Covenants in the
Investment Grade Bond Market – The REIT Experiment. Journal of Real Estate Finance
and Economics (forthcoming).
Dennis, S., Nandy, D., & Sharpe, I. G. (2000). The determinants of contract terms in
bank revolving credit agreements. Journal of Financial and Quantitative Analysis, 35,
87-110.
Diamond, D.W., & Verrecchia, R. E. (1991). Disclosure, Liquidity, and the Cost of
Capital. Journal of Finance, 46, 1325-1359.
Diamond, D.W. (1984). Financial intermediation and delegated monitoring. Review of
Economic Studies, 51, 393–414.
Diamond, D.W. (1991). Debt maturity structure and liquidity risk. Quarterly Journal of
Econom-ics, 106, 709-737.
Drucker, S. , & Puri, M. (2005). On the Benefits of Concurrent Lending and
Underwriting. Journal of Finance, 60, 2763-2799.
Elsas, R., & Krahnen, J. P. (1998). Is relationship lending special? Evidence from credit-
file data in Germany. Journal of Banking & Finance, 22, 1283-1316.

30
Engelberg, J., & Sankaraguruswamy, S. (2007). How to Gather Data Using a Web
Crawler: An Application Using SAS to Search Edgar. Working Paper.
Esty, B. (2001). Structuring loan syndicates: A case study of the Hong Kong Disneyland
project loan. Journal of Applied Corporate Finance, 14, 80–95.
Fama, E., & French, K. R. (1993). Common Risk Factors in the Returns on Stocks and
Bonds. Journal of Financial Economics, 33, 3-56.
Flannery, M. J. (1986). Asymmetric information and risky debt maturity choice. Journal
of Finance, 41, 19-37.
Graham, J. R., Li, S., & Qiu, J. (2008). Corporate Misreporting and Bank Loan
Contracting. Journal of Financial Economics, 89, 44-61
Guedes, J., & Opler, T. (1996). The determinants of maturity of corporate debt issues.
Journal of Finance, 51, 1809-1833.
Hartzell, J. C.; L. Sun; & Titman. S. (2006). The Effect of Corporate Governance on
Investment: Evidence from Real Estate Investment Trusts. Real Estate Economics 34:
343-376.
Holmstrom, B., & Tirole, J. (1997). Financial intermediation, loanable funds, and the real
sector. Quarterly Journal of Economics, 112, 663-691.
Ivashina, V. (2009). Asymmetric information effects on loan spreads. Journal of
Financial Economics, 92, 300–319.
Jiménez, G., Salas, V., & Saurina, J. (2006). Determinants of collateral. Journal of
Financial Economics, 81, 255-281.
Kim, J. B., Tsui, J. S. L., & Yi, C. H. (2011). The voluntary adoption of international
financial reporting standards and loan contracting around the world. Review of
Accounting Studies, forthcoming.
Linneman, P. (1997). Forces Changing the Real Estate Industry Forever. Wharton Real
Estate Reviews, 1997, 1-12.
Myers, S. C. (1977). Determinants of Corporate Borrowing. Journal of Financial
Economics, 5(2), pp. 147-175.
Rajan, R., & Winton, A. (1995). Covenants and collateral as incentives to monitor.
Journal of Finance, 50, 1113-1146.
Ramakrishnan, R. T. S., & Thakor, A. (1984). Information reliability and a theory of
financial intermediation. Review of Economic Studies, 415-432.

31
Santos, J. A.C., & Winton, A. (2008). Bank Loans, Bonds, and Informational Monopolies
across the Business Cycle, Journal of Finance, 63, 1315-1359.
Smith, C. W. Jr., & Warner, J. B. (1979). On Financial Contracting: An Analysis of Bond
Covenants. Journal of Financial Economics, 117-161.
Stulz, R. M., & Johnson, H. (1985). An Analysis of Secured Debt. Journal of Financial
Economics, 4, 501-21.
Sufi, A. (2007). Information asymmetry and financing arrangements: Evidence from
syndicated loans. Journal of Finance, 62, 629–668.
Sun, H. (2010). A Theory on REITs Advisor Choice and the Optimal Compensation
Mechanism. Journal of Real Estate Finance and Economics, 40, 387-411.

32
Appendix: Variable Definitions
AISD is the “All In Spread-Drawn”, which is the all-inclusive cost of a drawn loan to the
borrower. This equals the coupon spread over LIBOR on the drawn amount plus the annual
fee and is reported in basis points.
Collateral is a dummy variable indicating whether the borrower needs to pledge collateral
to the lender in the loan contract.
Coverage is defined as log of ratio (1+ EBITDA) divided by Interest Expenses.
Dcov is a dummy variable indicating the existence of covenants.
Default spread is defined as the difference between the yield on Moody’s seasoned
corporate bond with Baa rating and 10-year U.S. government bond.
External is the dummy variable with 1 indicating whether a REIT is externally advised
and 0 otherwise.
Facility Amount is the dollar amount of loan facility in millions.
Indep_director is the percentage of independent directors on the board, defined as the
number of independent directors divided by the total number of directors.
Inst_hold is the percentage of institutional investors’ holdings, defined as the total
number of shares held by institutional investors over the total number of shares
outstanding, obtained from IBES, calculated for each firm year.
Lead lender share is defined as the percentage of loan kept by the lead lender.
Leverage is defined as the ratio of book value of total debt to book value of assets.
Log(sales) is the logarithm of sales revenue obtained from Compustat fundamental
annual data file.
Log(assets) is the logarithm of total book assets as obtained from Compustat fundamental
annual data file.
Log(loan amount) is the logarithm of the total amount of the loan facility.
Log(maturity) is the logarithm of maturity of the loan facility in months.
Loan concentration is measured as the fraction of the loan amount to the sum of existing
debt plus the loan amount.

33
Market to book is the ratio of (Book value of assets - Book value of equity + market value
of equity) divided by book value of assets.
Maturity is length in months between facility activation date and maturity date.
Ncov is the number of covenant constraints in loan contracts.
Post_Mod is equal to one if year is greater than 2001 and 0 otherwise.
Profitability is defined as EBITDA over sales.
Relationship is the strength of the lending relationship between the REIT firm and the
lender bank. It is measured as the ratio of dollar value of deals with the bank to total
dollar value of loans borrowed by the firm in the last 5 years before the current loan.
ROA is defined as net income over total assets.
Syndicate size is defined as the total number of lenders in the loan syndicate.
Term Spread is defined as the difference between the yield of the 1-year and 10-year
Treasury bonds.
Total Assets is the book value of assets of the borrower in millions as reported in the
COMPUSTAT.

34
Table 1: Distribution of Loans by Year, Relationship and Advisor Status
This table provides the distribution of loans by year and REIT advisor status. The sample period
is from year 1987 to year 2009.
Panel A: Number of observations by year and REIT advisor status
Year Total Internal External
1987 3 1 2
1988 5 3 2
1989 1 1 0
1990 12 8 4
1991 5 3 2
1992 2 1 1
1993 20 15 5
1994 77 62 15
1995 88 68 20
1996 134 106 28
1997 221 163 58
1998 327 265 62
1999 134 94 40
2000 286 236 50
2001 126 103 23
2002 165 105 60
2003 160 110 50
2004 257 222 35
2005 345 253 92
2006 367 259 108
2007 243 206 37
2008 93 88 5
2009 31 26 5
Total 3102 2398 704

35
Panel B: Number of unique loans and REIT firms by year and REIT advisor status
Year
Internal
REIT
Loans
External REIT
Loans
Total
Loans
Internal
REITs
External
REITs
Total
REITs
1987 1 2 3 1 1 2
1988 3 2 5 2 2 4
1989 1 0 1 1 0 1
1990 6 3 9 4 3 7
1991 3 1 4 2 1 3
1992 1 1 2 1 1 2
1993 14 5 19 10 5 15
1994 48 11 59 37 8 45
1995 49 13 62 35 10 45
1996 71 20 91 45 14 59
1997 77 28 105 55 16 71
1998 77 20 97 53 15 68
1999 38 19 57 33 13 46
2000 77 21 98 52 15 67
2001 42 8 50 31 8 39
2002 37 19 56 26 16 42
2003 35 9 44 26 6 32
2004 60 12 72 42 9 51
2005 79 14 93 53 10 63
2006 58 17 75 41 11 52
2007 51 5 56 36 4 40
2008 42 1 43 35 1 36
2009 6 1 7 5 1 6
Total 876 232 1108 626 170 796

36
Table 2: Summary Statistics and Univariate Tests for Key Loan and Borrower Characteristics
Table 2 presents summary statistics of loan characteristics and borrower characteristics measures. Panel A reports the summary statistics on key loan
and borrower characteristics variables for the overall sample. Internal REITs sample summary statistics are reported in Panel B and external ones
are in Panel C. The univariate test of key loan characteristics and borrower characteristics between internal and external REIT types are reported in
Panel D. See Appendix for definitions of all variables used in this table. All values are winsorized at the 1% and 99% level.
Panel A: Overall Sample
Variable N Mean Std Dev Min 25% Median 75% Max
Key Loan Characteristics
AISD 2890 172.660 105.700 45.000 90.000 140.000 225.000 388.000
Facility Amount ($ Mil) 3100 361.140 376.780 10.000 113.830 250.000 473.000 2000.000
Maturity (Months) 2051 34.720 14.260 5.000 29.000 36.000 36.000 95.000
Collateral 3102 0.200 0.400 0.000 0.000 0.000 0.000 1.000
Ncov 3102 4.889 4.392 0.000 0.000 6.000 9.000 14.000
Dcov 3109 0.603 0.489 0.000 0.000 1.000 1.000 1.000
Lead Lender Share 3098 0.357 0.318 0.045 0 .125 0.25 0.5 1.000
Number of Lenders 3098 10.483 8.310 1 4 9 15 35
Key Borrower Characteristics
Total Assets ($ Mil) 2648 3002.200 3509.790 19.150 831.100 1750.810 3941.150 18794.250
Coverage 331 1.280 0.520 0.360 1.090 1.190 1.370 4.190
Leverage 2613 0.500 0.140 0.040 0.420 0.490 0.570 0.860
Profitability 335 0.480 0.180 0.160 0.390 0.450 0.630 0.930
Market to Book 2608 1.300 0.270 0.820 1.110 1.260 1.460 2.240

37
Panel B: Internal REITs Sample
Variable N Mean Std Dev Min 25% Median 75% Max
Key Loan Characteristics
AISD 2212 174.300 103.320 45.000 100.000 150.000 225.000 388.000
Facility Amount ($ Mil) 2398 352.310 370.060 10.000 110.000 235.000 450.000 2000.000
Maturity (Months) 1569 34.490 14.060 5.000 29.000 36.000 36.000 95.000
Collateral 2398 0.220 0.410 0.000 0.000 0.000 0.000 1.000
Ncov 2398 4.714 4.508 0.000 0.000 6.000 9.000 14.000
Dcov 2398 0.571 0.495 0.000 0.000 1.000 1.000 1.000
Lead Lender Share 2396 0.366 0.320 0.038 0.125 0.250 0.500 1.000
Number of Lenders 2395 10.159 8.120 1.000 3.000 8.000 15.000 35.000
Key Borrower Characteristics
Total Assets ($ Mil) 1987 3365.700 3898.880 19.150 853.060 2011.910 4425.780 18794.250
Coverage 187 1.255 0.583 0.360 1.035 1.200 1.348 4.186
Leverage 1959 0.510 0.140 0.040 0.430 0.490 0.570 0.860
Profitability 190 0.498 0.198 0.163 0.387 0.453 0.663 0.935
Market to Book 1957 1.290 0.270 0.860 1.110 1.250 1.430 2.240

38
Panel C: External REITs Sample
Variable N Mean Std Dev Min 25% Median 75% Max
Key Loan Characteristics
AISD 678 167.300 113.000 45.000 85.000 120.000 200.000 388.000
Facility Amount ($ Mil) 702 391.330 397.680 10.000 125.000 300.000 500.000 2000.000
Maturity (Months) 482 35.470 14.900 5.000 28.000 36.000 39.000 95.000
Collateral 704 0.150 0.360 0.000 0.000 0.000 0.000 1.000
Ncov 704 5.483 3.917 0.000 0.000 7.000 8.000 13.000
Dcov 704 0.709 0.455 0.000 0.000 1.000 1.000 1.000
Lead Lender Share 702 0.329 0.308 0.055 0.111 0.200 0.500 1.000
Number of Lenders 703 11.586 8.842 1.000 5.000 9.000 16.000 31.000
Key Borrower Characteristics
Total Assets ($ Mil) 661 1901.500 1438.570 76.330 57.650 1607.960 2688.610 5679.310
Coverage 144 1.321 0.419 0.568 1.156 1.189 1.405 2.713
Leverage 654 0.470 0.140 0.040 0.380 0.480 0.560 0.860
Profitability 145 0.457 0.156 0.163 0.200 0.430 0.559 0.915
Market to Book 651 1.320 0.290 0.760 1.090 1.330 1.550 2.240

39
Panel D: Univariate tests of loan and borrower characteristics between Internal and external REITS
N
Internal External Diff t- stat Z- stat
N Mean Median N Mean Median
Key Loan Characteristics
Facility Amount ($mil) 3100 2398 352.307 235.000 702 391.329 300.000 -39.022 -2.322** -2.787***
AISD 2890 2212 174.305 150.000 678 167.301 120.000 7.004 1.440* 3.986***
Maturity (month) 2051 1569 34.491 36.000 482 35.467 36.000 -0.976 -1.275 -2.177**
Collateral 3102 2398 0.216 0.000 704 0.151 0.000 0.066 4.143*** 3.830***
Ncov 3102 2398 4.714 6.000 704 5.483 7.000 -0.769 -4.418*** -3.217***
Dcov 3102 2398 0.571 1.000 2398 0.709 1.000 -0.137 -6.912*** -6.553***
Lead Lender Share 3098 2396 0.366 0.250 702 0.329 0.200 0.036 2.740*** 3.137***
Number of Lenders 3098 2395 10.160 8.000 703 11.586 9.000 -1.427 -3.830*** -3.828***
Key Borrower Characteristics
Total Assets 2648 1987 3365.702 2011.912 661 1909.504 1607.964 1456.198 14.025*** 5.994***
Leverage 2613 1959 0.507 0.491 654 0.470 0.483 0.037 5.808*** 4.111***
Market to Book 2608 1957 1.294 1.250 651 1.319 1.325 -0.024 -1.886** -2.607***

40
Table 3: REIT Advisor Status and Loan Contract Terms
This table tests the effect of being externally advised on loan contract terms, including loan spread,
pledge of collateral, number of covenants, and loan maturity. In panel A, the dependent variable
is AISD, or “All In Spread-Drawn”, which is the all-inclusive cost of a drawn loan to the borrower.
In panel B, the dependent variable collateral is a dummy variable indicating the presence of
collateral in loan contract. In panel C, the dependent variable Ncov is the number of covenant
constraints in loan contracts. In panel D, the dependent variable Log(maturity) is the logarithm of
maturity of the loan facility in months. External is a dummy variable with 1 indicating whether a
REIT is externally advised and 0 otherwise. See Appendix for definitions of all variables used in
this table. Numbers in the parentheses are standard errors corrected for heteroscedasticity. (***
Significant at one percent level, ** Significant at five percent level,*Significant at ten percent level)

41
Panel A: External Status and Loan Spread (OLS)
(1) (2) (3) (4) (5)
VARIABLES AISD AISD AISD AISD AISD
External -15.85*** -16.19*** -16.10*** -14.67** -16.21**
(5.653) (6.024) (6.033) (6.029) (6.767)
Log(maturity) 1.39 3.41 4.06 4.36 1.07
(5.133) (5.229) (5.534) (5.577) (5.953)
Log(loan size) -15.20*** -12.66*** -12.80*** -12.82*** -9.33**
(2.848) (3.058) (3.261) (3.250) (4.547)
Log(assets) -14.29*** -16.15*** -16.01*** -15.90*** -18.50***
(1.664) (2.047) (2.128) (2.174) (4.263)
Leverage 84.74*** 105.60*** 104.47*** 103.70*** 95.68***
(15.487) (16.832) (17.793) (17.868) (23.701)
Collateral 39.42*** 34.09*** 33.96*** 33.22*** 36.48***
(5.755) (6.021) (5.983) (6.033) (7.325)
Market to book -53.54*** -56.11*** -55.56*** -54.78*** -59.75***
(8.679) (10.143) (10.464) (10.607) (11.455)
Term Spread 4.80* -65.58 -30.55*** -31.20*** -19.12**
(2.685) (81.868) (5.371) (6.027) (7.872)
Default Spread 11.43* 40.02 -25.49** -25.29** 103.20***
(6.056) (152.670) (10.134) (10.454) (24.898)
Relationship -32.54***
(8.584)
Lender_mktshare 10.30
(71.457)
Constant 547.78*** 602.87** 724.23*** 720.93*** 271.36***
(51.439) (273.272) (61.236) (62.120) (92.324)
Year FE No Yes Yes Yes Yes
Loan Type No No Yes Yes Yes
Lender FE No No No Yes Yes
Rating FE Yes Yes Yes Yes Yes
Observations 1,697 1,697 1,697 1,697 1,404
R-squared 0.19 0.22 0.22 0.22 0.22
Adj. R-squared 0.18 0.20 0.20 0.20 0.19

42
Panel B: External Status and Collateral Requirement (Probit)
(1) (2) (3) (4) (5)
VARIABLES collateral collateral collateral collateral collateral
External -0.27*** -0.34*** -0.33*** -0.33*** -0.39***
(0.082) (0.089) (0.089) (0.089) (0.101)
Log(maturity) 0.06 -0.00 0.01 0.01 -0.14
(0.074) (0.077) (0.079) (0.079) (0.093)
Log(loan size) -0.45*** -0.32*** -0.31*** -0.29*** -0.40***
(0.070) (0.076) (0.079) (0.080) (0.117)
Loan Concentration 0.16 0.32 0.26 0.17 3.50***
(0.446) (0.479) (0.483) (0.487) (0.784)
Log(assets) -0.07 -0.16* -0.17* -0.18** -0.09
(0.081) (0.088) (0.089) (0.089) (0.132)
Leverage 0.01 0.93** 0.84** 0.76** 4.11***
(0.324) (0.365) (0.378) (0.381) (0.567)
Market to book -0.38** -0.70*** -0.69*** -0.71*** -0.62***
(0.158) (0.198) (0.199) (0.199) (0.220)
Relationship -0.22*
(0.134)
Lender_mktshare -0.56
(1.116)
Constant 8.49*** 11.54*** 11.50*** 11.43*** 6.31***
(0.773) (0.848) (0.875) (0.890) (1.349)
Year FE No Yes Yes Yes Yes
Loan Type No No Yes Yes Yes
Lender FE No No No Yes Yes
Rating FE Yes Yes Yes Yes Yes
Observations 1,768 1,762 1,762 1,762 1,446
Adj. R-squared 0.13 0.20 0.20 0.21 0.27

43
Panel C: External Status and Number of Covenants (Ologit)
(1) (2) (3) (4) (5)
VARIABLES ncov ncov ncov ncov ncov
External -0.20** -0.21** -0.24** -0.25** -0.23**
(0.093) (0.100) (0.102) (0.102) (0.111)
Log(maturity) 0.03 0.13 0.02 0.03 0.01
(0.101) (0.099) (0.102) (0.103) (0.115)
Log(loan size) 0.93*** 0.75*** 0.73*** 0.73*** 0.45***
(0.121) (0.128) (0.146) (0.147) (0.154)
Loan Concentration -0.49 0.08 0.36 0.43 0.98
(0.734) (0.797) (0.874) (0.882) (0.951)
Log(assets) -0.74*** -0.62*** -0.60*** -0.60*** -0.32**
(0.136) (0.146) (0.159) (0.159) (0.160)
Leverage -0.22 -0.15 0.20 0.21 -0.44
(0.487) (0.549) (0.615) (0.624) (0.724)
Market to book 0.14 0.23 0.13 0.12 0.08
(0.149) (0.194) (0.199) (0.206) (0.224)
Relationship 0.22
(0.160)
Lender_mktshare 1.01
(1.279)
Constant 18.03*** 16.11*** 16.49*** 16.63*** 14.63***
(1.345) (1.345) (1.497) (1.512) (2.125)
Year FE No Yes Yes Yes Yes
Loan Type No No Yes Yes Yes
Lender FE No No No Yes Yes
Rating FE Yes Yes Yes Yes Yes
Observations 1,768 1,768 1,768 1,768 1,452
Adj. R-squared 0.06 0.09 0.09 0.09 0.05

44
Panel D: External Status and Loan Maturity (OLS)
(1) (2) (3) (4) (5)
VARIABLES Log(maturity) Log(maturity) Log(maturity) Log(maturity) Log(maturity)
External 0.05* 0.06** 0.03 0.03 0.04
(0.029) (0.029) (0.028) (0.028) (0.030)
Log(loan size) 0.10*** 0.10*** 0.12*** 0.12*** 0.20***
(0.018) (0.020) (0.020) (0.020) (0.026)
Log(assets) -0.11*** -0.16*** -0.15*** -0.16*** -0.28***
(0.040) (0.044) (0.043) (0.043) (0.060)
Leverage 0.06 0.06 0.13 0.13 0.02
(0.090) (0.096) (0.095) (0.095) (0.112)
Collateral 0.05 0.01 0.02 0.01 -0.05
(0.033) (0.033) (0.031) (0.031) (0.035)
Market to book 0.20*** 0.04 -0.03 -0.03 -0.01
(0.048) (0.066) (0.063) (0.063) (0.067)
Log(Sales) 0.13*** 0.16*** 0.15*** 0.15*** 0.20***
(0.040) (0.045) (0.044) (0.044) (0.057)
Relationship -0.20***
(0.043)
Lender_mktshare 0.43
(0.326)
Constant 1.54*** 2.47*** 1.56*** 1.57*** -1.42***
(0.339) (0.359) (0.371) (0.371) (0.422)
Year FE No Yes Yes Yes Yes
Loan Type No No Yes Yes Yes
Lender FE No No No Yes Yes
Rating FE Yes Yes Yes Yes Yes
R-squared 0.06 0.11 0.18 0.19 0.21
Adj. R-squared 0.06 0.09 0.17 0.17 0.18

45
Table 4: REIT Advisor Status and Loan Syndicate Structure
This table tests the effect of being externally advised on loan syndicate structure, in terms of lead
lender shares and syndicate size, by estimating the following equation:
𝑆𝑦𝑛𝑑𝑖𝑐𝑎𝑡𝑒 𝑆𝑡𝑟𝑢𝑐𝑡𝑢𝑟𝑒𝑖 = 𝑋𝑖𝛽 + 𝐸𝑥𝑡𝑒𝑟𝑛𝑎𝑙𝑖𝛾 + 𝑌𝑒𝑎𝑟 + 𝐿𝑜𝑎𝑛 𝑃𝑢𝑟𝑝𝑜𝑠𝑒 The dependent variable in model 1 is Lead lender share, defined as the percentage of loan kept by
the lead lender. The dependent variable in model 2 is syndicate size, defined as the total number
of lenders in the loan syndicate. Key independent variable in the model is External, which is a
dummy variable with 1 indicating whether a REIT is externally advised and 0 otherwise. The
control variables (X) include firm characteristics and loan characteristics variables. See Appendix
for detailed definitions of all variables used in this table. Numbers in the parentheses are standard
errors corrected for heteroscedasticity. (*** Significant at one percent level, ** Significant at five
percent level ,*Significant at ten percent level)
(1) (2)
VARIABLES Lead lender share Syndicate Size
External -0.09** 1.58**
(0.043) (0.617)
Log(loan amount) -0.17*** 2.52***
(0.025) (0.372)
Log(loan amount)*mid -0.00 0.10**
(0.003) (0.041)
Log(loan amount)*large -0.00 0.59***
(0.004) (0.058)
Log(maturity) -0.03 1.65***
(0.035) (0.458)
Log(firm sales) -0.12 -0.70
(0.087) (1.022)
Rated -0.04 -2.16***
(0.045) (0.679)
Term Loan -0.05 0.75
(0.060) (0.839)
Constant 4.42*** -47.46***
(0.406) (5.860)
Year FE Yes Yes
Loan Purpose FE Yes Yes
Observations 230 230
R-squared 0.73 0.86
Adj. R-squared 0.70 0.85

46
Table 5: REIT Advisor Status and Loan Contract Terms
(Diff-in-Diff Analysis around REIT Modernization Act)
This table shows the diff-in-diff analysis result around the REIT Modernization Act in year 2001.
Post_mod dummy is equal to one if year is greater than 2001 and 0 otherwise. See Appendix for
definitions of all variables used in this table. Numbers in the parentheses are standard errors
corrected for heteroscedasticity. (*** Significant at one percent level, ** Significant at five percent
level,*Significant at ten percent level)
Panel A: External Status and Loan Spread (OLS)
(1) (2) (3) (4)
VARIABLES AISD AISD AISD AISD
External -18.00*** -17.95*** 26.89** 23.67**
(6.246) (6.260) (11.671) (11.474)
Post_mod -2.76 13.20
(7.977) (8.340)
External*Post_mod -69.97*** -64.61***
(13.095) (12.626)
Log(maturity) -0.05 0.03 -1.51 -1.08
(5.911) (5.963) (5.899) (5.904)
Log(loan size) -10.63** -10.55** -8.96** -8.73*
(4.434) (4.442) (4.443) (4.466)
Log(assets) -21.27*** -21.00*** -20.48*** -19.34***
(3.928) (4.029) (4.066) (3.974)
Leverage 74.91*** 76.33*** 84.43*** 89.97***
(22.308) (22.250) (22.062) (22.258)
Collateral 39.64*** 39.42*** 40.28*** 39.27***
(7.200) (7.131) (7.150) (7.198)
Market to book -62.48*** -61.12*** -57.71*** -52.04***
(9.210) (10.214) (10.024) (8.986)
Term spread 6.90** 6.86** 7.34** 7.11**
(3.037) (3.048) (3.051) (3.027)
Default spread 10.90 12.58 14.82* 21.94***
(6.633) (8.232) (8.102) (6.438)
Relationship -25.14*** -25.27*** -27.92*** -28.29***
(7.410) (7.425) (7.321) (7.326)
Lender_mktshare 100.92* 96.82 100.97* 82.83
(58.175) (61.167) (60.632) (58.508)
Constant 546.25*** 539.28*** 489.89*** 463.38***
(67.315) (70.425) (71.731) (70.060)
Loan Type FE Yes Yes Yes Yes
Lender FE Yes Yes Yes Yes
Rating FE Yes Yes Yes Yes
Observations 1,404 1,404 1,404 1,404
R-squared 0.19 0.19 0.21 0.21
Adj. R-squared 0.17 0.17 0.19 0.19

47
Panel B: External Status and Collateral Requirement (Probit)
(1) (2) (3) (4)
VARIABLES collateral collateral collateral collateral
External -0.39*** -0.39*** -0.58*** -0.58***
(0.101) (0.101) (0.155) (0.155)
Post_mod -0.95*** -0.99***
(0.360) (0.360)
External*Post_mod 0.35* 0.35*
(0.195) (0.195)
Log(maturity) -0.14 -0.14 -0.13 -0.13
(0.093) (0.093) (0.093) (0.093)
Log(loan size) -0.40*** -0.40*** -0.42*** -0.42***
(0.117) (0.117) (0.117) (0.117)
Loan_debt 3.50*** 3.50*** 3.66*** 3.66***
(0.784) (0.784) (0.790) (0.790)
Log(assets) -0.09 -0.09 -0.08 -0.08
(0.132) (0.132) (0.132) (0.132)
Leverage 4.11*** 4.11*** 4.18*** 4.18***
(0.567) (0.567) (0.567) (0.567)
Market to book -0.62*** -0.62*** -0.64*** -0.64***
(0.220) (0.220) (0.221) (0.221)
Relationship -0.22* -0.22* -0.20 -0.20
(0.134) (0.134) (0.134) (0.134)
Lender_mktshare -0.56 -0.56 -0.49 -0.49
(1.116) (1.116) (1.115) (1.115)
Constant 6.31*** 7.26*** 7.63*** 6.64***
(1.349) (1.244) (1.253) (1.355)
Loan Type FE Yes Yes Yes Yes
Lender FE Yes Yes Yes Yes
Rating FE Yes Yes Yes Yes
Observations 1,446 1,446 1,446 1,446
Adj. R-squared 0.27 0.27 0.27 0.27

48
Panel C: External Status and Number of Covenants (Ologit)
(1) (2) (3) (4)
VARIABLES ncov ncov ncov ncov
External -0.23** -0.23** -0.22 -0.22
(0.111) (0.111) (0.181) (0.181)
Post_mod -1.03** -1.03**
(0.428) (0.435)
External*Post_mod -0.01 -0.01
(0.219) (0.219)
Log(maturity) 0.01 0.01 0.00 0.00
(0.115) (0.115) (0.115) (0.115)
Log(loan size) 0.45*** 0.45*** 0.45*** 0.45***
(0.154) (0.154) (0.155) (0.155)
Loan_debt 0.98 0.98 0.97 0.97
(0.951) (0.951) (0.959) (0.959)
Log(assets) -0.32** -0.32** -0.32** -0.32**
(0.160) (0.160) (0.161) (0.161)
Leverage -0.44 -0.44 -0.44 -0.44
(0.724) (0.724) (0.727) (0.727)
Market to book 0.08 0.08 0.08 0.08
(0.224) (0.224) (0.225) (0.225)
Relationship 0.22 0.22 0.22 0.22
(0.160) (0.160) (0.161) (0.161)
Lender_mktshare 1.01 1.01 1.01 1.01
(1.279) (1.279) (1.280) (1.280)
Constant 14.63*** 13.59*** 13.60*** 14.63***
(2.125) (1.965) (1.975) (2.126)
Loan Type FE Yes Yes Yes Yes
Lender FE Yes Yes Yes Yes
Rating FE Yes Yes Yes Yes
Observations 1,452 1,452 1,452 1,452
Adj. R-squared 0.05 0.05 0.05 0.05

49
Panel D: External Status and Loan Maturity (OLS)
(1) (2) (3) (4)
VARIABLES Log(maturity) Log(maturity) Log(maturity) Log(maturity)
External 0.04 0.04 0.08* 0.08*
(0.030) (0.030) (0.048) (0.048)
Post_Mod 1.71*** 1.75***
(0.098) (0.106)
External*Post_Mod -0.06 -0.06
(0.060) (0.060)
Log(loan size) 0.20*** 0.20*** 0.20*** 0.20***
(0.026) (0.026) (0.026) (0.026)
Log(assets) -0.28*** -0.28*** -0.28*** -0.28***
(0.060) (0.060) (0.060) (0.060)
Leverage 0.02 0.02 0.02 0.02
(0.112) (0.112) (0.112) (0.112)
Collateral -0.05 -0.05 -0.05 -0.05
(0.035) (0.035) (0.035) (0.035)
Market to book -0.01 -0.01 -0.01 -0.01
(0.067) (0.067) (0.067) (0.067)
Log(Sales) 0.20*** 0.20*** 0.20*** 0.20***
(0.057) (0.057) (0.057) (0.057)
Relationship -0.20*** -0.20*** -0.20*** -0.20***
(0.043) (0.043) (0.043) (0.043)
Lender_mktshare 0.43 0.43 0.43 0.43
(0.326) (0.326) (0.326) (0.326)
Constant -1.42*** -1.42*** -1.49*** -1.49***
(0.422) (0.422) (0.437) (0.437)
Loan Type FE Yes Yes Yes Yes
Lender FE Yes Yes Yes Yes
Rating FE Yes Yes Yes Yes
Observations 1,451 1,451 1,451 1,451
R-squared 0.21 0.21 0.21 0.21
Adj. R-squared 0.18 0.18 0.18 0.18
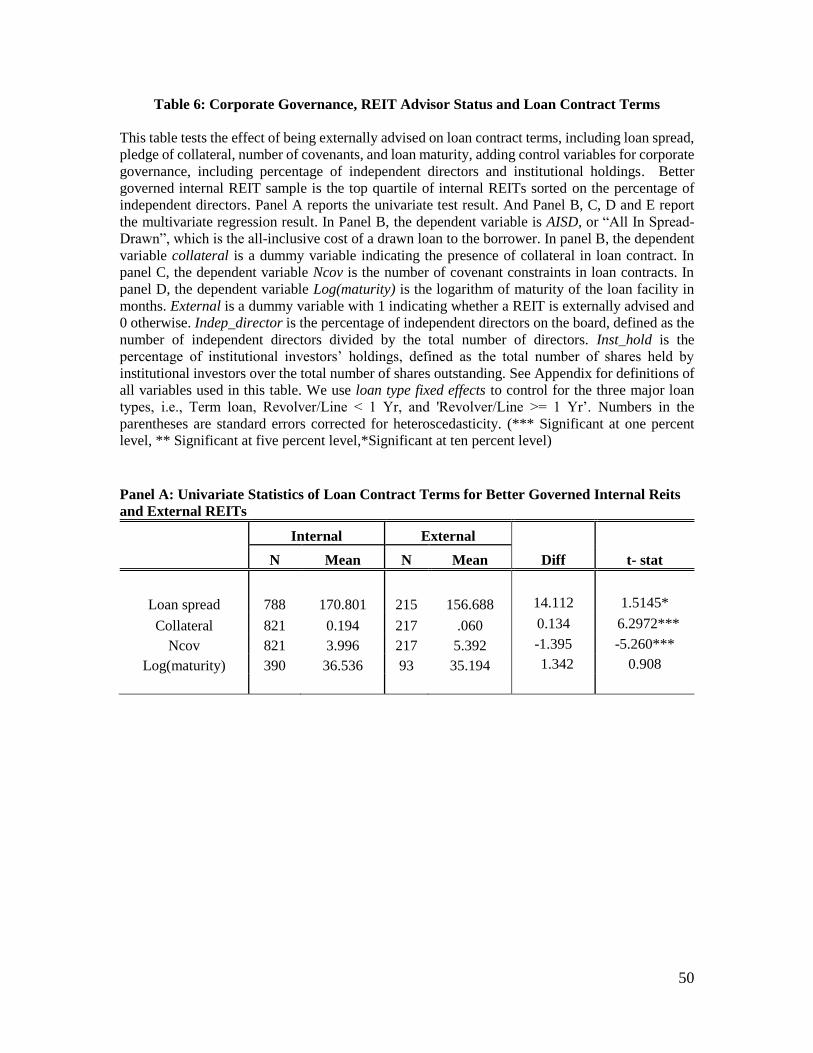
50
Table 6: Corporate Governance, REIT Advisor Status and Loan Contract Terms
This table tests the effect of being externally advised on loan contract terms, including loan spread,
pledge of collateral, number of covenants, and loan maturity, adding control variables for corporate
governance, including percentage of independent directors and institutional holdings. Better
governed internal REIT sample is the top quartile of internal REITs sorted on the percentage of
independent directors. Panel A reports the univariate test result. And Panel B, C, D and E report
the multivariate regression result. In Panel B, the dependent variable is AISD, or “All In Spread-
Drawn”, which is the all-inclusive cost of a drawn loan to the borrower. In panel B, the dependent
variable collateral is a dummy variable indicating the presence of collateral in loan contract. In
panel C, the dependent variable Ncov is the number of covenant constraints in loan contracts. In
panel D, the dependent variable Log(maturity) is the logarithm of maturity of the loan facility in
months. External is a dummy variable with 1 indicating whether a REIT is externally advised and
0 otherwise. Indep_director is the percentage of independent directors on the board, defined as the
number of independent directors divided by the total number of directors. Inst_hold is the
percentage of institutional investors’ holdings, defined as the total number of shares held by
institutional investors over the total number of shares outstanding. See Appendix for definitions of
all variables used in this table. We use loan type fixed effects to control for the three major loan
types, i.e., Term loan, Revolver/Line < 1 Yr, and 'Revolver/Line >= 1 Yr’. Numbers in the
parentheses are standard errors corrected for heteroscedasticity. (*** Significant at one percent
level, ** Significant at five percent level,*Significant at ten percent level)
Panel A: Univariate Statistics of Loan Contract Terms for Better Governed Internal Reits
and External REITs
Internal External
Diff t- stat N Mean N Mean
Loan spread 788 170.801 215 156.688 14.112 1.5145*
Collateral 821 0.194 217 .060 0.134 6.2972***
Ncov 821 3.996 217 5.392 -1.395 -5.260***
Log(maturity) 390 36.536 93 35.194 1.342 0.908

51
Panel B: Corporate Governance and Organizational Status on Loan Spread
(1) (2) (3)
VARIABLES AISD AISD AISD
External -16.52*** -27.44* -11.37*
(5.854) (14.527) (6.152)
Indep_director 4.37
(3.961)
Inst_hold 10.18***
(2.830)
Log(maturity) 3.54 -28.51** 6.31
(5.324) (11.627) (5.459)
Log(loan_size) -13.26*** -48.05*** -15.76***
(3.220) (8.474) (4.032)
Log(assets) -16.00*** 12.44* -20.21***
(2.100) (7.011) (3.694)
Leverage 109.27*** 152.22*** 110.40***
(17.252) (33.237) (18.868)
Collateral 35.62*** 47.11*** 31.65***
(5.972) (10.511) (6.323)
Market to book -62.75*** -41.42*** -71.72***
(9.829) (15.465) (9.979)
Ncov 0.09 0.20 0.15
(0.707) (1.366) (0.723)
Term Spread 1.98 -9.27 1.93
(5.829) (8.038) (5.891)
Default Spread 19.72 37.51* 21.43*
(12.505) (20.726) (12.592)
Constant 492.23*** 993.78*** 541.42***
(65.380) (137.413) (70.197)
Year FE Yes Yes Yes
Lender FE Yes Yes Yes
Credit Rating FE Yes Yes Yes
Loan Type FE Yes Yes Yes
Observations 1,697 471 1,586
R-squared 0.21 0.41 0.20
Adj. R-squared 0.20 0.39 0.18

52
Panel C: Corporate Governance and Organizational Status on Collateral
(1) (2) (3)
VARIABLES collateral collateral collateral
External -0.22*** -0.86*** -0.36***
(0.081) (0.227) (0.091)
Indep_director 1.61**
(0.670)
Inst_hold 0.10***
(0.021)
Log(maturity) 0.07 -0.43** -0.00
(0.075) (0.178) (0.080)
Log(loan amount) -0.56*** -0.37* -0.60***
(0.073) (0.219) (0.076)
Loan concentration 0.26 -0.38 2.38***
(0.440) (1.904) (0.522)
Log(assets) 0.01 -0.45 -0.22**
(0.080) (0.273) (0.086)
Leverage 0.13 6.03*** 3.13***
(0.319) (1.013) (0.468)
Market to book -0.68*** -0.85*** -1.13***
(0.180) (0.308) (0.174)
Constant 10.20*** 5.89** 10.55***
(0.830) (2.328) (0.890)
Year FE Yes Yes Yes
Lender FE Yes Yes Yes
Credit Rating FE Yes Yes Yes
Loan Type FE Yes Yes Yes
Observations 1,768 479 1,656
Pseudo. R-squared 0.14 0.37 0.24

53
Panel D: Corporate Governance and Organizational Status on Loan Covenants
(1) (2) (3)
VARIABLES ncov ncov ncov
External -0.09 0.29 0.03
(0.096) (0.249) (0.103)
Indep_director -0.10
(0.086)
Inst_hold -0.10*
(0.053)
Log(maturity) 0.09 1.08** 0.08
(0.108) (0.476) (0.107)
Log(loan amount) 0.82*** 0.96*** 0.51***
(0.064) (0.209) (0.081)
Collateral 0.71*** 2.31*** 0.99***
(0.133) (0.313) (0.135)
Log(assets) -0.57*** -0.56*** -0.14*
(0.053) (0.203) (0.084)
Leverage -0.03 0.06 -0.82**
(0.355) (0.864) (0.381)
Market to book 0.22 0.01 0.39**
(0.175) (0.353) (0.175)
Constant 13.96*** 24.24*** 11.42***
(1.249) (3.704) (1.383)
Year FE Yes Yes Yes
Lender FE Yes Yes Yes
Credit Rating FE Yes Yes Yes
Loan Type FE Yes Yes Yes
Observations 1,768 479 1,656
Adj. R-squared 0.09 0.13 0.06

54
Panel E: Corporate Governance and Organizational Status on Loan Maturity
(1) (2) (3)
VARIABLES Log(maturity) Log(maturity) Log(maturity)
External 0.04 -0.06 0.03
(0.029) (0.054) (0.032)
Indep_director -0.01
(0.015)
Inst_hold -0.01
(0.013)
Log(loan amount) 0.06*** 0.07* 0.09***
(0.020) (0.038) (0.025)
Log(assets) -0.13*** -0.18** -0.18***
(0.043) (0.080) (0.049)
Leverage 0.28*** 0.51*** 0.37***
(0.095) (0.151) (0.103)
Collateral 0.01 -0.06 0.00
(0.032) (0.054) (0.033)
Market to book 0.09 0.40*** 0.07
(0.057) (0.068) (0.058)
Log(sales) 0.14*** 0.16** 0.16***
(0.044) (0.069) (0.045)
Constant 2.19*** 1.98*** 1.86***
(0.365) (0.544) (0.396)
Year FE Yes Yes Yes
Lender FE Yes Yes Yes
Credit Rating FE Yes Yes Yes
Loan Type FE Yes Yes Yes
Observations 1,766 479 1,654
R-squared 0.13 0.17 0.13
Adj. R-squared 0.12 0.15 0.12