Embed Size (px)
Citation preview
Information Asymmetry and Managerial Myopia in High-
technology Firms
Name: Ke Wang
Student number: 11826568
Thesis supervisor: Alexandros Sikalidis
Date: June 25, 2018
Word count: 13076
MSc Accountancy & Control, specialization Control
Faculty of Economics and Business, University of Amsterdam
2
Statement of Originality
This document is written by student Ke Wang who declares to take full responsibility for the
contents of this document.
I declare that the text and the work presented in this document is original and that no sources
other than those mentioned in the text and its references have been used in creating it.
The Faculty of Economics and Business is responsible solely for the supervision of completion
of the work, not for the contents.
3
Abstract
This study examines the association between information asymmetry and managerial myopia
in the background of high-technology firms. Using U.S. firms reporting over the period 2010–
2016, I provide evidence that increased managerial myopia in capital investment is associated
with the growing information asymmetry between investors and managers. In particular, a
positive association is found at the higher level of trading volume, and a negative association
is found at the higher level of stock return volatility and bid-ask spread. These findings suggest
that managers can mitigate myopic behaviors by increasing information transparency.
4
Contents
1 Introduction .......................................................................................................................................... 5
2 Literature review ................................................................................................................................. 8
2.1 Information asymmetry and investor sentiment ................................................................... 8
2.2 Investor sentiment and stock price ........................................................................................ 11
2.3 Concerned manager and managerial myopia ...................................................................... 13
2.3.1 Concerned Managers .......................................................................................... 14
2.3.2 Managerial myopia ............................................................................................. 18
2.3.3 The relationship between concerned manager and managerial myopia ............. 22
2.4 Testable hypothesis in high-technology firms setting ....................................................... 22
2.4.1 Testable hypothesis ............................................................................................. 23
3 Research design ................................................................................................................................ 25
3.1 Measuring information asymmetry ....................................................................................... 25
3.2 Measuring managerial myopia ............................................................................................... 25
3.3 Control variables ........................................................................................................................ 26
3.4 Model ............................................................................................................................................ 27
3.5 Sample selection ........................................................................................................................ 27
4 Results ................................................................................................................................................. 29
4.1 Descriptive statistics ................................................................................................................. 29
4.2 Regression results ...................................................................................................................... 29
5 Summary and conclusion ................................................................................................................ 33
References ................................................................................................................................................... 35
5
1 Introduction
The threat of myopic decisions on corporate performance has attracted significant attention for
more than 30 years, with much discussion focusing on whether it destroys firm’s value.
(Graham et al. 2005; Bhojraj and Libby 2005; Marginson and Mcaulay 2008). Myopic
problems occur when executives have the opportunity to make short-term decisions that benefit
current corporate performance but at the expense of long-term revenue (Antia et al. 2010). In
2013, BlackRock, the Canada Pension Plan Investment Board (CPPIB) and McKinsey &
Company came together to create the Focusing Capital on the Long Term initiative with the
aim of conducting research on long-termism and developing practical tools and solutions.
Unfortunately, according to a recent survey, they found that the pressure on companies to focus
more on long-term objectives is not decreasing. Similarly, another survey shows that although
the share S&P 500 companies spent on buybacks is 58% higher, nearly 30 times than the share
in 1981, investments in fixed assets keep low all the time, which, in a sense, short-termism is
increasing. McKinsey Global Institute has also investigated in this area. The recent surveys of
C-level executives and board members show that respondents are under more short-term
pressure in the last five years. Some companies even admitted that they are using excessively
short-term strategic planning. Unlike the result of survey 2013, more of them focused on the
result within two years or less. It is a time to reexplore how managerial myopia happens and
how to keep the balance between short-term accountability and long-term value creation.
Additionally, McKinsey report 2015 has shown that profits have increasingly migrated to idea-
intensive industries. The findings of the report also suggest that idea-intensive industries are
the most long-term oriented on an industry level, especially compared with capital-intensive
industries. It is worthy to note that long-term investment, like R&D investments, is one of the
most important strategies that the managers in high-technology firms must take into
consideration (Greve 1998), indicating that myopic behaviors can cause more serious damages
to high-technology sectors than other industries, as their profits mainly depend on long-term
investment. I choose the setting of high-technology firms, mainly for providing some
implications for the sector and its executive managers.
Although myopia is an important element in many theories, prior research provides limited
evidence regarding the role of information asymmetry in managerial myopia. On the one hand,
there are some difficulties in measuring the phenomenon, which does not correspond to any
single quantifiable metric and is a confluence of many complex factors. Thus, empirically
identifying the effect of information asymmetry on myopia is a challenging task. One the other
6
hand, many types of researches only examine some apparent factors that lead to managerial
myopia, rather than get into deeply into the bottom.
Based on supported literatures, I found that there is a reasoning link from information
asymmetry to managerial myopia. First, information asymmetry between investors and
managers might lead to negative investor sentiment, as investors can’t distinguish long-term
investments that don’t benefit in the short-term from the misbehavior of management. Second,
the stock price fluctuates positively and immediately with investor sentiment by future cash
flow, selling signal, risk exposure, etc. As a result, negative sentiment tends to cause lower
stock price. Third, it is possible that managers who are concerned about stock price would
manipulate myopic investment to meet short-term objectives.
Using a sample of 307 high-technology companies from 2010 to 2016, I have tested the
hypothesis that the information asymmetry is positively related to managerial myopia in high-
technology firms and the result supported predicted the positive association. I distinguish
capital investment from R&D investment, to investigate different effects of asymmetric
information on them. The results indicate that the predicted relations between information
asymmetry and capital investments are observed. But there is a contradiction in the result of
R&D without control variables, and I found that frequent information disclosure sometimes
encourages managers to focus on short-term earnings, which increases managerial myopia.
My paper makes two contributions to extant literature and practice. First, I contribute to the
literature on innovation, especially towards high-technology firms. Unlike prior studies, the
sample of my study consists of firms in the high-technology sector. High-technology firms are
particularly relevant for examining effects on myopia, because, as I introduced, their survival
and performance heavily depend on the capability to effectively set long-term strategies and
planning. They play a significant role in economic development of any country, as the profit
center has moved from capability-intensive industry to ideal-intensive industry. Practically, my
results can help controller in high-technology groups determine whether there is a strong level
of information asymmetry and try to mitigate and cure myopic problem.
Second, it contributes to the literature by extending the research into the depth about the factors
that have effects on managerial myopia. Extant literatures focus on how institutional investors
play the role of the decision-making process of myopic behaviours. For example, the results
reported by (Bushee 1998) indicate that when the institutional ownership is high, managers are
less likely to cut R&D investment to reverse an earnings decline. Prior research also documents

7
that the evidence of CEOs’ job changes, such as retirement of CEOs in the form of reductions
in R&D expenditures (Dechow and Sloan 1991; Lundstrum 2002; Barker and Mueller 2002),
potentially earning declines and loss (Habib and Hansen 2008), impending acquisitions that
have higher returns but lower post-merger long-term stock performance (Gao 2010), and
earning management to increase pension contributions (Kalyta 2009), also cause short-horizon
decisions. Some observers also comment that control systems and frequent reporting tend to
cause an excessive short-term orientation and stimulate manipulation (Thurow 1981; Schlender
1982; Arthur et al. 2018). But I find that information asymmetry is one of the underlying
reasons of depth, suggesting that researchers and practitioners should consider causes rather
than effortlessly solve superficial phenomena. In general, my paper adds to extant literatures
in the research of myopia management.
The paper is structured as follows: Section 2 develops hypotheses on the association between
information asymmetry and managerial myopia. Section 3 describes the research design, while
Section 4 reports the main results. Section 5 summarizes and concludes this paper.

8
2 Literature review
I rely on past research, both theory and evidence, to prove that my hypothesis regarding the
implications of asymmetric information for managers within companies. My focus is on the
relation between asymmetric information and managerial myopia. This relation depends on
three links, as illustrated in figure 1.
I will explain each link in turn.
Figure 1: Linking information asymmetry with managerial myopia
2.1 Information asymmetry and investor sentiment
In agency theory (Jensen and Meckling 1976), if both parties to any relationship are profit
maximizers, it is reasonable that the agent will not always behave to align with the best interests
and desires of the principal. And one of the consequences is asymmetric information.
Information asymmetry, as known as information failure, represents the difference between
one party’s information and another party’s information about the same thing. The more
available information is what called private information.
Asymmetric information can come in two possible ways, depending on the information known
when taking the decision. Ex ante is related to adverse selection and ex post to moral hazard.
Some studies use adverse selectin cost to prove the existence of information asymmetry (Chen
et al., 2003). In the corporate studies, there are two types of information asymmetry, one
between top management and divisional managers, another between internal managers and
external investors. The knowledge is dispersed across different levels and divisions within a
company. Top managers have a clearer overall view of business strategy, while divisional
managers, who execute the strategy or plan in their positions, have more detailed and specific
knowledge or information, such as operational management and competitive advantages (Chen
et al., 2017). Compared with information to assess a company used by external investors,
internal managers are easier to get more information to make decisions. For example, managers
have an incentive to issue equity when the firm is overvalued.
Information asymmetry has been proved to have affects on a lot of aspects, especially in stock
market performance and corporate governance. Lowry (2001) uses the cost of adverse selection
Information Asymmetry
Investor Sentiment
Stock PriceManagerial
Myopia
9
as the proxy of information asymmetry to explain why IPO volume fluctuate substantially over
time. Kelly and Ljungqvist (2012) suggest that information asymmetry has a substantial effect
on asset pricing through a liquidity channel. Companies operate in the environments with high
information asymmetry hold smaller cashes (Chung et al. 2015)
In this thesis, I mainly focus on its relationship with managerial behavior, involving outside
investors and stock market. Similarly, tax avoidance, as one of measurements of managerial
myopia, is more aggressive after a reduction in analyst coverage caused by broker closures and
mergers (Tao and Chen 2017). This paper researches on analyst, who care about companies’
tax policies, analyze tax planning, distribute public and private information, and assess the risk
of tax. Therefore, this scrutiny, as information transparency, discourages aggressive tax
avoidance. My thesis links information asymmetry with investor. Uninformed investors are
able to stimulate more myopic behaviors.
Efficient market hypothesis indicates that public available information can be fully reflected
by securities prices (Eugene F. Fama 1970), while some other economists challenged the EMH
with behavioral finance, for the reason that psychological and behavioral elements have
influence on stock prices.
Investor sentiment reflects investors’ willingness, anticipation, opinion, and emotion towards
investment or market as a whole. Investor sentiment surveys have long influence on investors
attitudes over years. There are some irrational individual actions not driven by facts at hands.
For example, despite large April 2000 market losses, investor expectations of future returns did
not significantly fall (Dreman et al. 2001). And many individual investors expected a negative
result with current financial facts and figures.
Stock market and behavioral finance are the most two big and likely effects from investors
sentiment. Before I explore how investor sentiment influence stock price, I should examine the
literature bases provided by behavioral finance area. According to Shefrin (1999), one of the
three behavioral finance topics is inefficient markets, which represent the price or rate of stock
return is contractionary to EMH. It is useful for overconfidence to explain and analyze market
inefficiency. Human beings have the tendency to overestimate their abilities. One the hand,
private information of investors weighted higher than public available information when
making decisions (Barber and Odean, 1999; Daniel, Hirshleifer, and Subrahmanyam 1998;
Chuang and Lee 2006). Thus, investors have biases and could overact towards private
information. On the other hand, private information plays role in an earlier stage and for a
10
longer period. Interestingly, Barberies, Shleifer, and Vishny (1998) find that investors are
indifferent or under-react to the objective accounting information, like earnings announcements,
dividend distribution, and share repurchases in financial statements, but over-react to some
records of extreme performance, such as some big events in bullish market.
Many studies have proved that investor sentiment’s impact on stock market. I will introduce
more related literatures in the next section.
Prior literatures have shown that asymmetric information leads to negative investor sentiment.
When there is information asymmetry between corporate managers and investors about
investment expenditure, it is likely that investors can’t distinguish the investments that only
benefit in the long term from those that will not. The reason is that the amount of investment
is sometimes not directly observed by investors. Clearly, this argument is not applicable to all
situation, i.e. the expenditures on tangible assets, such as plant or equipment, can be easily
identified. However, according to Stein (1989), there are many invisible investment and money
spent on them can’t be obviously recognized from increased operating costs. For example, a
commitment to increase the resources distributed to client coverage for the short term is
expected to generate long-term loyalty benefits. But the costs, as an increase in operating costs,
is averse to the result of profitability. And if investors don’t have reasonable explanation or are
not persuaded convincingly by managers at this time, as a result, investors may attribute the
long-term investment to managerial misbehavior or poor business prospects, which means
negative investor sentiment.
The work of Laffont and Tirole (1987), which pays attention to the design of efficient contracts
of managers to encourage managerial effort, also indicated the relation between information
asymmetry and investor sentiment. They found that if information asymmetry lead to invisible
investment, high-cost investments will be misunderstood as low managerial effort.
Regarding investor sentiment literatures, this argument is also consistent with the expectation
of overconfidence hypothesis. Overconfident investors conduct trades based on the private
information they observe and believe, of which they think is a better option than others. (Odean
1998). With the image of misbehavior or poor management, they are overconfident to make
irrational decisions, influencing the stock return and price of the company.
Then I will show how negative sentiment will influence stock price, and further change myopic
behaviors.
11
2.2 Investor sentiment and stock price
Studies of behavioral finance hold that investors might be irrational to make decisions, driven
by their psychological or cognitive factors. Thus, the stock price is not only influenced by
intrinsic value, such as accounting information, but also by investor sentiment. There are some
interesting observations of investor sentiment. A number of big movements in stock market are
caused by investor sentiment, further raising the attention to this behavioral indicator. And In
early 2001, researchers investigated how investors reacted to the fact that publicly traded stock
values decreased sharply. In the expectation, they would be more conservative and responded
pessimistically. Dreman et al. (2001), however, surprisingly found that there was only little
difference between investor sentiment in 2001 and in prior years.
Existing studies have shown investor sentiment may affect the earning growth, rate of return,
and stock valuation of stock market.
First, investors have positive attitudes toward the stock when they have optimistic sentiment
and analysts tend to distribute the information of high ratings for those stocks, therefore the
prediction of earnings growth can be affected (Cornell et al., 2014). Secondly, the required rate
of return, which equals the product of risk quantity and risk price, is subjective to the effect of
investor sentiment, but in a more complicated way. Although investors may undervalue the
risk disclosure when investors are in high sentiment period, they need higher compensation of
the return for bearing the risks. Thirdly, Wang et al. (2010) implies in the study that investor
behaviors are also able to influence the stock valuation. For example, De Long et al. (1990)
found that the stock price is determined by the combination of rational intrinsic value and
irrational noise trader risk, which can be caused by the irrational and intuitive investors. And
two other studies have investigated further.
Investor sentiment can affect stock price in these several aspects.
Certain studies (Hribar and McInnis 2012; Cornell et al. 2014) found that when investor
sentiment is high, analysts have positive attitudes towards the future profitability. Thus, they
are potential to distribute more buying signals. Brown and Cliff (2004) indicate that high
sentiment may alter the investors' expectation of future cash flows and thus affect prices.
Investors may have incorrect subjective beliefs or the so-called private information to value
stock. Furthermore, Baker and Wurgler (2007) argue that sentiment could also affect stock
price by altering the anticipated risk exposure of investors, and Shefrin (2008) constructs an
SDF (Stochastic Discount Factor) based on the sentiment and link the required rate of return to
12
investor sentiment. In addition, Baker and Wurgler (2006) discover certain cross-sectional
differences of the sentiment effect; they find that investor sentiment provides more evident
impact on stocks that are difficult to value or risky and costly to arbitrage. They define investor
sentiment as the propensity to speculate, and the key predictions come from two parts. When
arbitrage is equally across through the firm, sentiment-baes stock demands also differ across
through the firm; when sentiment increases, the investor sentiment is defined as a higher
demand of speculative stocks. Stambaugh et al. (2012) detect an asymmetric effect of investor
sentiment, i.e., the optimistic sentiment always leads to overpricing, which is greater than the
underpricing resulting from pessimism. And investor sentiment represents the overall
optimistic and pessimistic perception toward the stock market. Similarly, investor sentiment is
identified as the behavior of noise traders (Lee et al., 1991).
Furthermore, some studies have also examined that the fluctuation and the reaction of stock
price. Li (2015) has shown that sentiment stock lead to not only much larger fluctuations of
stock prices, but also more immediate response. When investor sentiment has effect on stock
price, its responses are more drastic in the stock market downturn than in the stock market
expansion. Similarly, this effect last longer in bull market than bear market. Additionally,
different direction and stock prices under the two market states can be caused by the same
stimulating factors. Unlike other indicators that influence stock price, there is no lag but
immediate effect for the responses of stock.
Rajan and Servaes (1997; 2003), Lowry (2001), and Lee et al. (1991), conclude that sentiment
hypothesis could also explain why IPO volume and price fluctuate so much over time. In some
periods, investors are excessively optimistic and are willing to bear for the value higher than
that it is worthy. Therefore, corporations are encouraged by this behavior and can’t wait to go
public. Contrarily, investors my underestimate company’s value in low sentiment and IPO
volume is also very low. There are some literatures that support his finding. When the IPO
price is overvalued, the stock price in the first day would be very high but keep low constantly
for the next five years, because investor sentiment’s influence can be consistent with the stock
price all the time (Purnanandam and Swaminathan 2001). Besides, Jindra’s (2001) results
indicate that it is no wonder that companies are more likely to issue new equities when they
are overvalued.
Then I would like to introduce some literatures who regard investor sentiment as a strong
forecasting model. Baker and Wurgler (2006) suggest that there are clearly identifiable,
important, and regular pattern on individual firms for investor sentiment to forecast the stock

13
market. Although Thorp (2004) notes that the changes of sentiment do not mean the meaningful
relationship between sentiment and stock market, he indeed discovers that abnormal optimistic
or pessimistic sentiment would signal an opposing direction in the next several weeks, driving
the stock prices with irrational emotions. This perspective leads to viewing the investor
sentiment as a contrarian indicator in the specific situations of extremely bullish or bearish
environments
Overall, investor sentiment has an effect on stock price in the following ways. First, with
negative sentiment, investors will have lower prediction of earning growth and stock valuation
and believe the investment will be risker. If they want to bear the higher risk caused, higher
compensation or the rate of return is required, which means companies have to pay more to
investors. Which ever the effect is, companies would suffer loss in the prediction or
compensation. Second, there are a number of ways to lower stock price by investor sentiment.
Lower future cash flow, selling signal, and more risk exposure are all the consequence of
negative sentiment. Even though we know that some investors’ behaviors are irrational, some
researchers also conclude that the stock price is determined by intrinsic value and investor
attitudes jointly. In addition, stock market can fluctuate with sentiment, and, compared with
other factors, there is an immediate effect without lagging feature.
As I deduce in the last section, higher information asymmetry might lead to negative investor
sentiment. Now I can conclude that negative sentiment can stimulate lower stock price, either
in prediction or in practice. Therefore, asymmetric information between investors and
managers is likely to induce lower stock price, which is definitely not the result that managers
who concerned stock price want to see.
In the next section, I will introduce how managers who concerned the stock price might
implement myopic strategies, reducing the whole value of the company.
2.3 Concerned manager and managerial myopia
Agency theory addresses problems that arise due to differences between the goals or desires
between the principal and agent. The most typical agency relationship occurs between
shareholders and executive managers. For example, managers may sacrifice long-term benefits
of the company to achieve the short-term profitability, as their salaries are not flexible with
long-term incomes. However, even when managers exhibit some concern for stock-prices when
evaluating investments because of reasonable compensation design, they are still reluctant to
undertake long-term-oriented projects to increase the company’s whole value.

14
2.3.1 Concerned Managers
Theoretical and evidence studies argue that lower stock prices may expose managers to the risk
of hostile takeover, lower stock-based compensation, or managers may concerned about the
job dismissal due to poor stock performance caused by their management. Then I will introduce
some relevant literatures in the three areas.
2.3.1.1 Takeover threats
Some researchers, like Jensen and Meckling (1976) and Fama (1980), contend that
management control from outside can improve the efficiency of market and enhance wealth.
They also suggested that, as a useful external governance mechanism, takeover is able to reduce
agency costs by promote disciplined management (Scharfstein 1988; Grossman and Hart 1980).
However, opponents argue that takeovers sometimes damage the firm value because managers
within companies are subject to hostile takeover. In addition, firms are bound to adopt anti-
takeover provisions to mitigate takeover threats and increase the difficulty of hostile takeover.
I think the reason why managers are under substantial takeover threats is that they are likely to
be replaced after acquisition.
First, as a result, managers will manipulate accruals management. One major concern on
takeover threats of managers is that the firm stock would be undervalued for the short-term
(Froot et al. 1992). Consequently, it is possible that managers are induced to rely on a large
variety of ways, like earning management to mitigate and stop takeover. Some literatures have
supported this argument. Managers under takeover pressure exercise accounting discretion to
contest hostile takeover and reduce the threats (DeAngelo 1988). Similarly, Zhao and Chen
(2008) report that there is a negative relationship between the likelihood and level of accrurals
management and staggered boards.
Second, real activities management are potential to be triggered, which is also my focus in this
thesis. Stein (1998) has an extensive research and suggest that managers are willing to cut long-
term investments, like R&D investment to support short-term performance growth. Short-term
investments can offer immediate return while long-term project is less productive and low-
yielding. As a result, the profit of the company is sacrificed. Prior studies also indicate that
managers’ engagement in real activities manipulation is a response to increased capital market
pressure or short-term participated investor (Cohen and Zarowin 2010; Bhojraj and Libby 2005;
Bushee 1998). In short, less-protected from the takeover pressure are likely manipulate real
activities. On contrary, when takeover protection alleviates the pressure and threats, they are
15
less likely to participate in the manipulation. For example, more-protected firms such as
staggered-board firms are associated with lower levels of abnormal real activities used to just
meet near-term earnings targets.
2.3.1.2 Executive compensation
There are also enormous studies about the executive compensation that can also explain why
managers are concerned on short-term stock price.
Executive compensation is a complex and contentious subject. The high level of CEO pay has
encouraged a heated debate about the nature and the outcomes that it produces. Murphy (2012)
and Carola & Dirk (2010) have reported the development history of executive compensation.
Since 1930s, shareholders have begun to have rights to know the details of the compensation
paid to top executives in publicly traded corporations. Following the Securities Act of 1934,
the responsibility for enforcing pay disclosures for top executives in publicly traded
corporations was consolidated into the newly created Securities and Exchange Commission
(SEC). And SEC demanded all companies to disclosure all compensation information
(including salaries, bonuses, stock, and stock options). In 1950s, restricted stock options
became a relatively efficient way to convey after tax compensation to executives, therefore it
was popular from that time. From the mid-1970s to the early 2000s, compensation levels grew
dramatically, differences in pay across managers and firms widened, and equity incentives tied
managers’ wealth closer to firm performance. By far, stock options have become the single
largest component of CEO pay in the 1990s. And the sensitivity of CEO wealth to performance
also surged in the 1990s, mostly due to rapidly growing option portfolios. Lately, average CEO
pay declined from 2000 to 2008, and restricted stock grants have replaced stock options as the
most popular form of equity compensation.
Because more and more corporation separated the ownership from control, the agency problem
between management and shareholders has been a central topic (Berle & Means 1932). Most
research on executive compensation has been firmly rooted in agency problem: compensation
system are designed to align the interests of executives with those of ownership. If managers
are self-interested and can’t be monitored and stopped by companies’ owners, managers are
potential to use the expense of shareholder value to pursue their own benefits and welfare.
Some evidence on studies has supported this argument. Managers pay perquisite compensation
and prestige in daily life with company value, which is highly damaged to the whole company
(Jensen 1986; Jensen & Meckling 1976; Bertrand & Mullainathan 2003; Morck et al. 1990).
16
Some researchers put forward that executive compensation is able to mitigate and even
eliminate agency problems for that it ties managers with the interest of company (Jensen &
Meckling 1976). By effectively granting the executive an ownership stake in the firm, equity-
linked compensation, such as restricted stocks and stock options, creates incentives for them to
take actions that benefit both shareholders and themselves.
There are two hypotheses from academic literatures that explain why executive compensation
is increased: efficient contracting and managerial power (Murphy 2012). Efficient contracting
views that executive compensation can mitigate agency problems between executives and
shareholders to optimize firm value. The level, structure, and component of compensation
represent a competitive equilibrium for managerial talent, to compensate their contribution to
the company. While managerial power hypothesis holds that powerful executives, who have
effect on board committees, determine the level, structure, and component of compensation
rather than the competitive market (Bebchuk & Fried 2004). Some studies regard the two
hypotheses as competing theory, but Murphy (2012) argues that it is not necessary to
distinguish them empirically. Frist, the two hypotheses are not mutually exclusive; on contrary,
mitigating conflicts of interested between managers and shareholders and renting extraction
tend to be achieved simultaneously. Second, if researchers focus on the competition of the two
hypotheses, other important indicators that explain the trends will be ignored.
In summary, when control and ownership is separated, it is possible that principals act to benefit
themselves and destroy shareholders’ value. As executive compensation is able to solve agency
problems owing to either efficient contracting hypothesis or managerial power hypothesis,
managers will be motivated to align with the interest of company. From history, we also know
that both the level and the composition of CEO pay have changed dramatically over time and
stock-based compensation has been a primary way to pay for executives. Therefore, executives
are concerned about stock price if they are tied with stock compensation, because low stock
price not only hurt the future economic revenue of company but also damage their own benefits.
2.3.1.3 Job termination
Except takeover threats and executive compensation, managers also may be concerned on the
job termination due to poor stock performance caused by their management.
Chen et al. (2001) defines job termination as a permanent layoff of employees from a company.
And Freeman & Cameron (1993) contend that downsizing that is a series of activities
17
undertaken and executed by top management to improve organizational efficiency and
competitiveness, reducing the size of labor force.
There are a lot of reasons examined by academic literatures that lead to layoff. One important
source is the relative poor performance to competitors (Hart 1983). This is also confirmed by
Jensen (1993), who describes product market discipline as an instrument to remove the top
management and stop the poor performance. Other external pressures force manager to engage
in downsizing. For example, Gombola and Tsetsekos (1992) find that increase in leverage is a
characteristic of sample firms before the layoff announcements. Since the improvement of
productivity is one of the expected results of employee layoffs (Cascio 1993), it seems
reasonable to assume that job termination is a reaction to poor productivity and operating profit
in companies. Hillier (2007) also find that the frequency of layoffs is increased following
threats to management control.
In this thesis, I pay much attention to layoff pressure and threats caused by the poor stock price
performance. Several studies have backed the relationship and highlighted the important role
of stock price.
Gilson (1990) claims that poor operating and stock price performance has increased the level
of financial distress, further resulting in possibility of employee dismissal. The author creates
a sample of firms from publicly traded companies whose stock price dropped sharply. He
assumes that the list of poor stock performance would incorporates firms that were relatively
in financial distress, i.e. default on debt, bankrupt, or debts restructuring. For the sample of 111
firms, he finds that there is a shift in ownership from incumbent management and the board
committees to blockholders and creditors. Specifically, only 46% and 43% of directors and
CEOs respectively still keep their positions after decreased stock price led by the disclosure of
bankruptcy and debt restructuring. Billger and Hallock (2005) also find strong evidence that
layoffs related with negative stock price are more likely to cause SEO turnover than that related
with positive stock price.
Two different theories can explain why organizations downsize and dismiss employees. One
perspective is psychological contract theory and another one is economic theory (Lumpur
2005). The psychological contract theory views that each party of employees and organization
will fulfill their responsibilities. This relationship, in terms of employee, means that individuals
will meet their commitments to work for the organization and gain profits. (De Meuse et al.
2004). Likewise, organizations are expected to provide a stable and prospective working
18
environment, compensate for employees who perform well, and offer future opportunities in
promotion and trainings. Therefore, employees will perceive that organizations violate their
responsibility to protect a stable employment and environment (Morrison & Robinson 1997),
while organizations fire employees because employees don’t achieve their committed goals or
even damage the firm value.
The other perspective assumes that organization downsize primarily depends on the economic
costs and revenues of layoffs. Executives engage in layoffs to reduce organizational cost and
improve financial performance simultaneously, such as the operating profits. There is a trade-
off analysis between the short-term costs related to layoffs and long-term labour costs. The
reduction in the size of workforce will decrease the labour costs and increase the profitability
(Neinstedt 1989). Companies also need to pay for hiring and training new employees following
layoffs (Atchison 1991). But the view that long-term benefits are higher than the short-term
costs dominate in companies and labour market (Abraham & Kim 1999). Thus, layoffs play a
significant role to encourage employees to work hard, be more responsive to customers’ needs,
improve communication skills, and expedite decision-making process. Moreover, employees
work under the dismissal pressure or they will be fired for low performance, because the benefit
of replacing them exceeds the costs of developing new employees.
Overall, I explain what factors lead to layoffs and why organizations downsize. If employees
cause poor stock performance, the firm benefits will be damaged. From the perspective of either
psychological theory or economic theory, it is possible that they would be fired. On the one
hand, companies argue that the employees don’t meet their commitments, and it is reasonable
to lay off them and hire new employees who can bring benefits. On the other hand, companies
need to stop further loss in the future, and the economic advantages in financial performance
are supposed to be more than the disadvantages of costs related with new employees. So, any
employee in a company, including managers, is concerned on possibility of layoffs.
2.3.2 Managerial myopia
Over the past decade, many critics have expressed concerns that myopic managerial and
investment behaviours have caused firms to lost competitiveness and economic development.
(Jacobs 1991; Porter 1992; Laverty 1996). Myopia, in the filed of business and economy, refers
to underinvestment behaviours of firms to meet short-term goals rather ran long-term benefits.
A lot of studies have explored why executives would implement myopic decisions, an agency
problem that hurts the value of shareholders and firms.
19
Many researchers focus on how institutional investors play the role of decision-making process
of myopic behaviours. Institutional investors can monitor and encourage to gain higher overall
performances (Almazan et al. 2005; Hartzell and Starks 2003). Dobrzynski (1993) and Monks
and Minow (1995) have examined that managers are allowed to choose investments that
maximize long-term value rather than meet short-term earnings goals under the pressure of
institutional invests and large shareholders. The results reported by (Bushee 1998) indicate that
when the institutional ownership is high, managers are less likely to cut R&D investment to
reverse an earning decline. The presence of institutional investors decreases the likelihood of
misvaluations managers perceive.
Prior research documents that the evidence of CEOs’ job changes, such as retirement of CEOs
in the form of reductions in R&D expenditures (Dechow and Sloan 1991; Barker and Mueller
2002; Lundstrum 2002), potentially earning declines and loss (Habib and Hansen 2008),
impending acquisitions that have higher returns but lower post-merger long-term stock
performance (Gao 2010), and earning management to increase pension contributions (Kalyta
2009), also cause short-horizon decisions. And no matter the absence of career concerns or
excessive career concerns of CEOs, job changes are likely to lead to the overweight on short-
term performance at the expense of long-term firm value. First, CEOs have the tendency to
reduce R&D and engage in earning management near retirement. (Lundstrum 2002; Kalyta
2009). Second, Habib and Hansen (2008) documents that CEOs are overly concerned about the
firm value to manipulate and avoid earning declines and losses.
Some observers also comment that control systems tend to cause an excessive short-term
orientation and stimulate manipulation (Thurow 1981; Schlender 1982). The survey result of
Merchant (1990) is evident to show that myopic behaviours are positively associated with the
felt pressure to meet financial targets.
Consistent my thesis, some studies research that frequent financial reporting, a proxy of
information transparency, is likely to influence myopic behaviours. There are some reasons to
believe that increased frequent reporting could mitigate investment myopia and encourage
long-term orientation of managers. For example, increased public disclosure could improve
firms’ access to financing by decreasing investment contradictions between firms and capital
investors, even helping firms in identifying positive NPV projects to gain benefits. Second, the
increased internal and external monitoring can construct a system to discipline corporate
managers and mitigate agency problems. As a result, managers are more willing to invest in
20
long-term projects. Thus, decreased information asymmetry are believed to might mitigate
corporate myopia.
In addition, we should know more about the impacts of investment and managerial myopia.
Specifically, what are the differences between short-term and long-term oriented firms? How
these differences impact firms and economy? The finding in a McKinsey report (2017) has
revealed the impact of short termism.
Regarding internal benefits, long-term firms exhibit strong financial performance. The long-
term companies outperformed other companies in terms of revenue and earnings growth. Even
in financial crisis, they suffered less earning decline and recovered more quickly after crisis.
Economic profits measure not only companies’ profitability but also how companies allocate
resources and use capital effectively to get better options and opportunities. And the companies
that orient the long-term horizon performed better in economic benefits. Moreover, long-term
firms can deliver more returns to shareholders than other companies. Regarding the impact to
economy, researchers of McKinsey conclude that more advantages in macroeconomy have
been brought by long-term firms. Even in financial crisis, these companies that have more
sustainable ability to invest can maintain their earning growth and achieve long-term goals. In
addition, they can add more to economic output and growth. For example, long-term companies
have provided more opportunities and hired more worker, mitigating the financial burden of
government and unlock potential value.
Other literatures are dedicated to developing how to mitigate and cure myopic behaviours.
Almost all studies concentrate on performance measures to manage myopia.
As the problem of institutional investor and job changes, performance measurement designed
for compensation contracting of executives are suggested. Dikolli et al. (2009) show that on
average, the contracting weight on CEO cash bonus decreases and annual return increases,
following the increases of the level of transient ownership. The authors assume that firms will
trade off between contractual explicit incentive and implicit incentives brought by institutional
investors. Specifically, the design of contacts is purposed to efficiently balance the effort
allocation between generating short-term earning and increasing long-term value. The result is
that the level of institutional ownership is positively related with equity incentives in contracts.
Dikolli et al. (2013) identify possible job changes and, likewise, find that compared with CEOs
not identified as short-horizon, the contracting weight placed on future-looking information in
CEO compensation system is larger for those identified as short-horizon. Contracts emphasize
21
more on R&D expenses and non-financial performance measures if CEOs approach retirement
(Cheng 2004; Matejka et al. 2009). Furthermore, the authors also indicate that more external
and internal monitoring are negatively with managerial myopia. Increased shareholder right,
as the proxy of external monitoring, can prevent managerial entrenchment, thereby further
reducing the myopic behaviours. Some studies suggest that contacts should compensate CEO
for increase employment risk that internal monitoring creates (Hoskisson et al. 2009). Thus,
the contracting and internal monitoring complements reinforce for each other.
Merchant and Bruns (1986) divide measurements into top and middle management. The return
realized by shareholders are a better yardstick for top management, while a good measure that
combines economic returns with cash flow generated is more suitable for middle management.
Abernethy et al. (2013) have researched the role of both accounting measures and non-financial
measures to solve myopia problem. Accounting returns, such as return on investment, residual
income, incorporate not only the summary of all relevant actions but also cost of capital, which
is helpful to align managers’ actions with shareholders’ interests. Therefore, accounting
measures are believed to be highly congruous as they measure the economic value generated
from resources (Anthony and Govindarajan 2004; Scapens 1979; Zimmerman 1997;). The
main benefit of non-financial measurements is that it can focus on forward-looking indicators
and motivate managers to achieve long-term profits. Further, this kind of measurement can be
tailored for specific companies and activities. For example, customer satisfaction that can’t be
measured by numbers are suitable for customer-oriented companies. Thus, the design of non-
financial measures dominates the literatures of myopia management. (Ittner and Larcker 1998;
Thevaranjan et al. 2000).
Except performance measurements, intrinsic investors, defined in the McKinsey analysis as
those who have deep understanding of a company’s intrinsic value, can help firm to solve the
problem of myopia (Darr and Koller 2017). They are believed to have willingness to invest for
long term and accept bad financial news, which instead could be an opportunity to increase
their holdings. Therefore, the presence of intrinsic investors gives executives enough room to
create values and help long-term shareholders achieve integrated strategies. This report
concludes that if managers want to achieve long-term goals and value more easily, they should
find, work, and cooperate with intrinsic investors.

22
2.3.3 The relationship between concerned manager and managerial myopia
Managers who are concerned on stock price are more potential to make myopic decisions and
hurt the long-term value of firms.
First, in such a climate where takeover is prevalent, managers found themselves distracted
towards short term and reduce long-term investment to stretch quarterly earnings target
(Auletta 1986). When there is a chance that the company will be bought at an unfairly low
price, managers may boost earning or reduce R&D expenses to boost short-term profits,
attempting to satisfy shareholders. Setting a takeover barrier seems to be a reasonable solution.
Second, incentive compensation should encourage behaviours aligned with firm value, while
stock-based incentives compensation can surprisingly motivate management myopia. When
managers are concerned about the personal incomes influenced by stock price, they will inflate
short-term earnings and increase stock price. In addition, some results suggest that the equity
incentives are negatively related to the level of risk bearing (Guay 1999; Tufano 1996;
Lewellen 2006; Rajgopal & Shevlin 2002; Coles et al. 2006), and long-term investment is
riskier than that of short term.
In most cases, as Gilson (1990) claimed, poor performance in stock market has increased the
level of financial distress, further resulting in possibility of employee dismissal. If employees
work under the pressure of layoffs related with stock price, they are concerned about the stock
performance and take initiative to manipulate short-term profits at the expense of future value.
And a typical study (Stein 1989) that uses signal-jamming model also illustrates why the more
managers concerned about stock price, the worse the problems become. Managers who know
that higher earnings today are correlated with better future forecast of firm value, they will
manipulate the signals to shareholders. But in equilibrium the market can identify the inflation
and take it into consideration of forecasts. Nonetheless, managers are trapped into myopic
behaviours.
Taken together, all these arguments contend that managers’ concern on lower stock price leads
to focus more heavily on short-term profits rather than on long-term objectives, which is
defined as managerial myopia.
2.4 Testable hypothesis in high-technology firms setting
McKinsey report 2015 has shown that, in the context of competitive landscapes, profits have
increasingly migrated to idea-intensive industries, such as pharmaceuticals, technology,
23
software, and biotechnology. The findings of report also suggest that idea-intensive industries
are the most long-term oriented on an industry level, especially compared with capital-intensive
industries. Regarding the explanation, it seems reasonable that the growing profit pool in high-
technology firms encourages long-termism.
It is worthy to note that long-term investment, like R&D investments, are one of the most
important strategies that the managers in high-technology firms must take into consideration
(Greve 1998). The argument indicates that myopic behaviors can cause more serious damages
to high-technology sectors than other industries, as their profits mainly depend on long-term
investment. Consistently, some literatures also point out their concerns. Innovations in high-
technology firms generated more than half economic growth from1945 to 2002 (Leary 2002).
Due to the rapid and discontinuous development in market, innovation, organizational learning,
and the creation of new knowledge are significant for their long-term survival and success.
(Makri et. al 2006). R&D intensity are particularly relevant with high-technology firms because
their performance is heavily correlated with effective generation of innovations (Li et al. 2008).
Additional, high-technology firms are perceived to be not reluctant to reveal their information.
Many firms are privately hold. Even the firms whose information are publicly available, the
information asymmetry of them is larger than that of other industries.
Therefore, the above suggests that it is plausible to explore how information asymmetry has
effect on managerial myopia in high-technology firms.
2.4.1 Testable hypothesis
Prior literatures have shown that asymmetric information leads to negative investor sentiment.
When there is information asymmetry between corporate managers and investors about
investment expenditure, it is likely that investors can’t distinguish the investments that only
benefit in the long term from those that will not. And if investors don’t have reasonable
explanation or are not persuaded convincingly by managers at this time, as a result, investors
may attribute the long-term investment to managerial misbehavior or poor business prospects,
which means negative investor sentiment.
Investor sentiment has an effect on stock price in the following ways. First, with negative
sentiment, investors will have lower prediction of earning growth and stock valuation and
believe the investment will be risker. Second, there are a number of ways to lower stock price
by investor sentiment. Lower future cash flow, selling signal, and more risk exposure are all
the consequence of negative sentiment. In addition, stock market can fluctuate with sentiment,
24
and, compared with other factors, there is an immediate effect without lagging feature. The
conclusion is that negative sentiment can stimulate lower stock price, either in prediction or in
practice.
I have identified three types of managers who are concerned on stock price and my have
influence on managerial myopia. First, in such a climate where takeover is prevalent, managers
found themselves distracted towards short term and reduce long-term investment to stretch
quarterly earnings target (Auletta 1986). Second, incentive compensation should encourage
behaviors aligned with firm value, while stock-based incentives compensation can surprisingly
motivate management myopia. Third, if employees work under the pressure of layoffs related
with stock price, they are concerned about the stock performance and take initiative to
manipulate short-term profits at the expense of future value.
Taken together, if investors can observe everything that managers do, any decision that
management make is not aligned with long-term benefits would lower the stock price. If, on
the other hand, not all information can’t be observed by investors and they have to reply on
some imperfect summaries, managers may be concerned about lower stock price caused by the
misunderstanding of strategies. Consequently, they have strong motivation to, for example,
reduce future R&D expenses to boost the current earnings and present a better short-term
financial performance, avoiding undervaluation of stock price. Overall, this association can be
approximated as positive, and stated formally,
H1: The information asymmetry is positively related to managerial myopia in high-technology
firms.

25
3 Research design
3.1 Measuring information asymmetry
As there are no general measurements of information asymmetry, I chose four indicators that
are most commonly used in prior literatures: the market value of shared traded in market
(TRADEVALUE), the number of shares traded in market (TRADEVOLUME), bid ask spread
(SPREAD), and volatility of stock (VOLATILITY).
TRADEVALUE and TRADEVOLUME are measured by Compustat database and SPREAD
and VOLATILITY are reported by CRSP database.
Draper and Paudyal (2008) find that asymmetric information is negatively related to trading
volume, the number of outstanding shares. Gajewski (1999) also indicates that potential release
of information may lead to higher trading volume, as the average trading volume on
announcement days tend to be larger. Van Ness et al. (2001) report that because trading volume
and trading value mean more information known by investor, the two proxies are related to
information asymmetry. Hence, I expect that the higher trading volume or the larger trading
value, the lower degree of information asymmetry.
According to the finding of Ness and Warr (2000), the realized spread on London Stock
Exchange was dominated by asymmetric information components. Consistently, other studies
also suggest that the adverse selection costs are positively correlated with the entire spread.
Therefore, using the bid ask spread as a proxy of information asymmetry is justified, and I
assume that the larger percentage change of bid ask spread, the larger the level of information
asymmetry.
The volatility of a stock measure the dispersion of returns for the given security. In general, the
higher the volatility, the riskier the security. Wang (1993) shows that information asymmetry
among investors can increase volatility. Thus, it is reasonable to assume that higher volatility
of stock return lead to larger degree of information asymmetry.
3.2 Measuring managerial myopia
I use the investment decline as the managerial myopia. The investment decline measures the
myopic underinvestment by managers due to concerns on possible lower stock price caused by
investor sentiment. Both survey-based and archival research suggest that managerial myopia
can manifest in the form of underinvestment. Graham et al. (2005) find that managers have
26
admitted cutting current investment expenditures and reducing equipment maintenance to meet
short-term earnings targets.
R&D expense are regarded as a typical proxy of managerial myopia. R&D offer a way to
measure the extent how a company implement its long-term plan, by which they can identify a
sustainable product or technology that benefit them permanently and then bring it to life. Prior
research provides some evidence that managers reduce R&D to meet short-term earning goals
(Jacobs 1991; Dechow and Sloan 1991).
But many literatures only take R&D investment into consideration (Lev and Sougiannis 1996;
Bushee 1998), I also use measures to capture firms’ capital investment. Capital investment
projects commonly generate value over long term. For example, a capital investment for a
product to penetrate a new market may take more than half of year to attract new customers’
loyalty and attention. Thus, benefits of such capital investment are also not immediate, and
investors should be patient to the returns. Similarly, when investors don’t observe the future
prospects of the capital investment, they will also mistakenly have negative investor sentiment
and attribute to investment to inferior management.
My first measure CAPEX is defined as the amount of capital expenditures scaled by beginning-
of-year total assets. Edmans et al. (2017); Ladika and Sautner (2015); and Asker et al. (2015)
find from archival evidence that reduced capital expenditure is one of forms of managerial
myopia. The second measure of capital investment CHPPE is defined as the change in net fixed
assets scaled by beginning-of-year total assets. CHPPE captures not only the direct capital
expenditures, but also the fixed assets purchased from merger and acquisitions and from long-
term leases record.
CAPEX, CHPPE, R&D are measured by information from Compustat database.
3.3 Control variables
First, I control firm size (SIZE), as the natural logarithm of total assets for any given company
in a given year. I also control firms’ profitability (EBITDA), as EBITDA scaled by total assets
for any given company in a given year. And the beginning-of-year cash scaled by assets (CASH)
is controlled. Taken together, I think firms with higher level of size, EBITDA, and cash have
more opportunities to explore investment improvements. And as I introduced in the cure of
myopia from literature review, bigger firms tend to have higher degree of external and internal
monitoring, therefore, firms have lower level of myopia behaviors. In addition, I control the
27
beginning-of-year long-term debts scaled by total assets (LEVERAGE). Likewise, firms with
higher level of leverage will be limited in myopia management. I use Compustat database to
find all information of control linvariables.
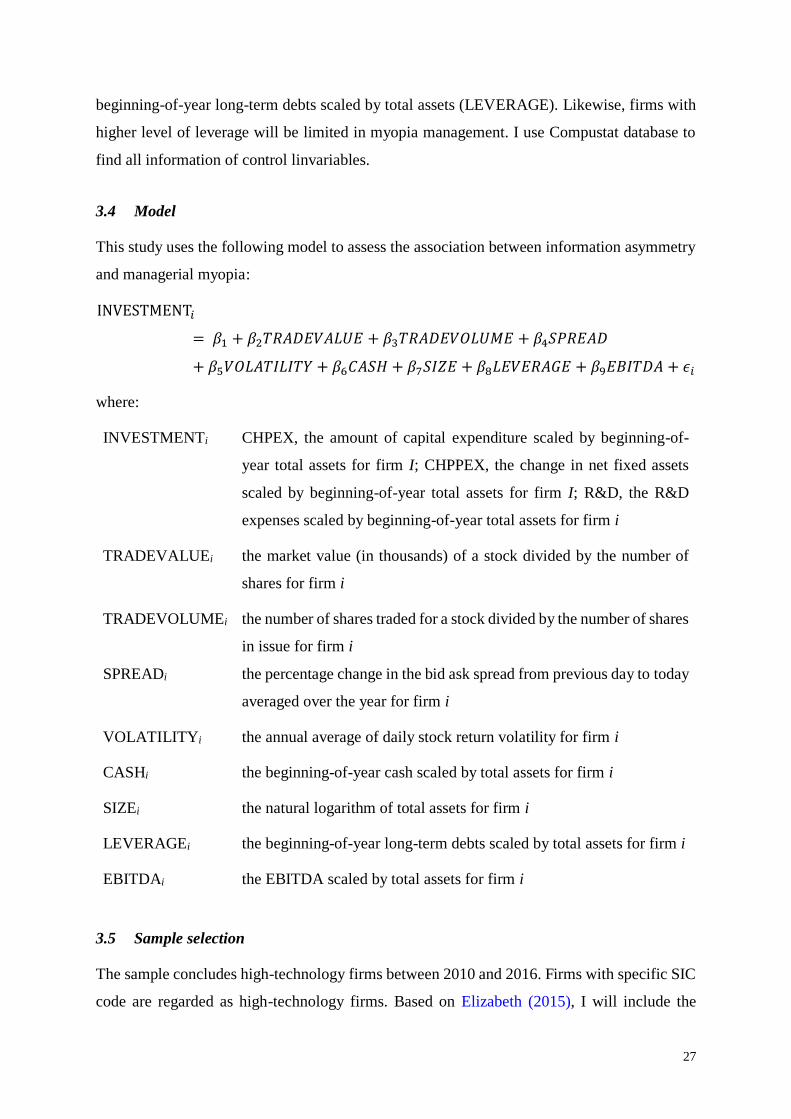
3.4 Model
This study uses the following model to assess the association between information asymmetry
and managerial myopia:
INVESTMENT𝑖
= 𝛽1 + 𝛽2𝑇𝑅𝐴𝐷𝐸𝑉𝐴𝐿𝑈𝐸 + 𝛽3𝑇𝑅𝐴𝐷𝐸𝑉𝑂𝐿𝑈𝑀𝐸 + 𝛽4𝑆𝑃𝑅𝐸𝐴𝐷
+ 𝛽5𝑉𝑂𝐿𝐴𝑇𝐼𝐿𝐼𝑇𝑌 + 𝛽6𝐶𝐴𝑆𝐻 + 𝛽7𝑆𝐼𝑍𝐸 + 𝛽8𝐿𝐸𝑉𝐸𝑅𝐴𝐺𝐸 + 𝛽9𝐸𝐵𝐼𝑇𝐷𝐴 + 𝜖𝑖
where:
INVESTMENTi CHPEX, the amount of capital expenditure scaled by beginning-of-
year total assets for firm I; CHPPEX, the change in net fixed assets
scaled by beginning-of-year total assets for firm I; R&D, the R&D
expenses scaled by beginning-of-year total assets for firm i
TRADEVALUEi the market value (in thousands) of a stock divided by the number of
shares for firm i
TRADEVOLUMEi the number of shares traded for a stock divided by the number of shares
in issue for firm i
SPREADi the percentage change in the bid ask spread from previous day to today
averaged over the year for firm i
VOLATILITYi the annual average of daily stock return volatility for firm i
CASHi the beginning-of-year cash scaled by total assets for firm i
SIZEi the natural logarithm of total assets for firm i
LEVERAGEi the beginning-of-year long-term debts scaled by total assets for firm i
EBITDAi the EBITDA scaled by total assets for firm i
3.5 Sample selection
The sample concludes high-technology firms between 2010 and 2016. Firms with specific SIC
code are regarded as high-technology firms. Based on Elizabeth (2015), I will include the

28
following firms in the sample: high-tech manufacturing (SIC 357, 365, 366, 367, 381, 382, 384,
and 386), high-tech services including communications services (SIC 481, 482, 484, and 489),
and computer-related services and software (SIC 737). Firms with insufficient data are
excluded, and the final sample consists of 307 firm-year observations. Variables of R&D and
trading volume have some extreme values, therefore, I use the winsorize command to deal with
all variables in Stata.
29
4 Results
4.1 Descriptive statistics
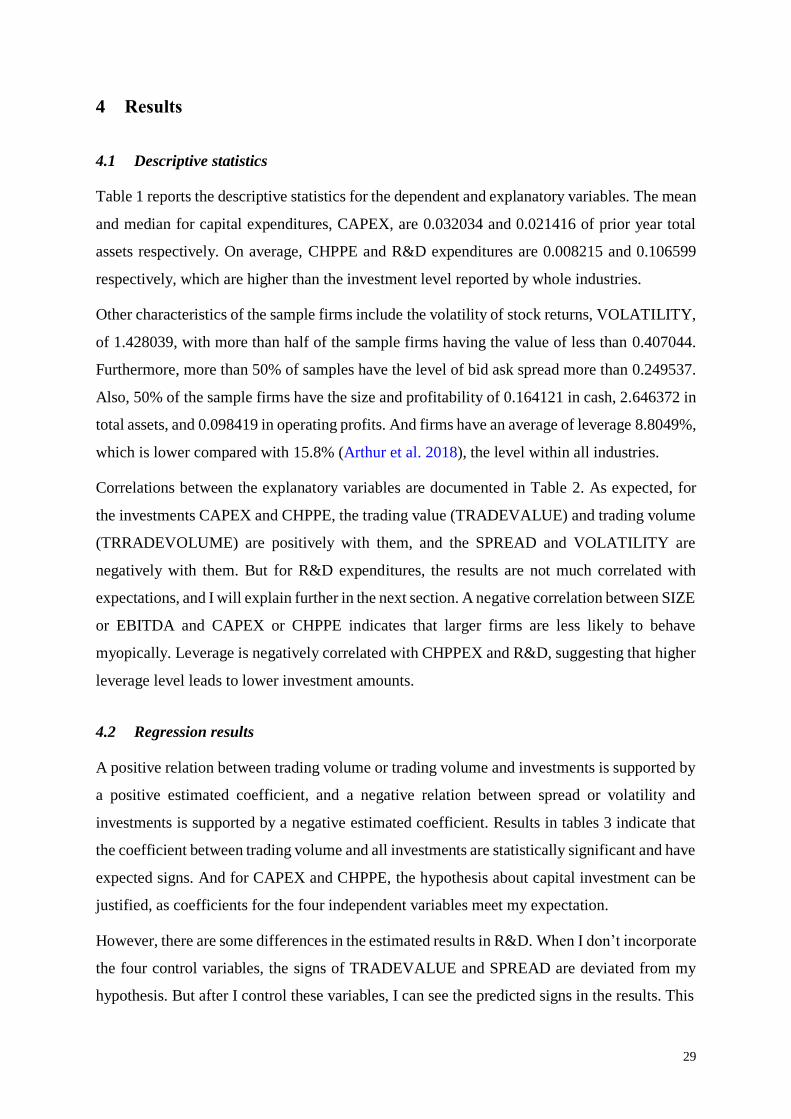
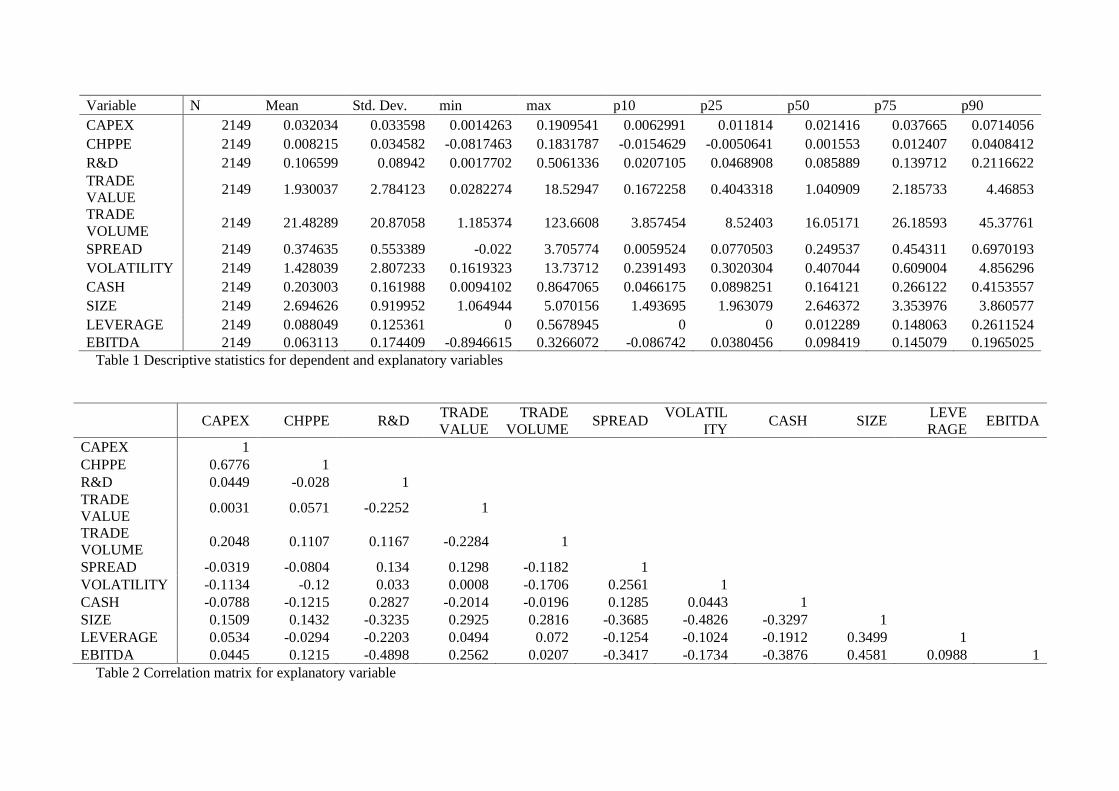
Table 1 reports the descriptive statistics for the dependent and explanatory variables. The mean
and median for capital expenditures, CAPEX, are 0.032034 and 0.021416 of prior year total
assets respectively. On average, CHPPE and R&D expenditures are 0.008215 and 0.106599
respectively, which are higher than the investment level reported by whole industries.
Other characteristics of the sample firms include the volatility of stock returns, VOLATILITY,
of 1.428039, with more than half of the sample firms having the value of less than 0.407044.
Furthermore, more than 50% of samples have the level of bid ask spread more than 0.249537.
Also, 50% of the sample firms have the size and profitability of 0.164121 in cash, 2.646372 in
total assets, and 0.098419 in operating profits. And firms have an average of leverage 8.8049%,
which is lower compared with 15.8% (Arthur et al. 2018), the level within all industries.
Correlations between the explanatory variables are documented in Table 2. As expected, for
the investments CAPEX and CHPPE, the trading value (TRADEVALUE) and trading volume
(TRRADEVOLUME) are positively with them, and the SPREAD and VOLATILITY are
negatively with them. But for R&D expenditures, the results are not much correlated with
expectations, and I will explain further in the next section. A negative correlation between SIZE
or EBITDA and CAPEX or CHPPE indicates that larger firms are less likely to behave
myopically. Leverage is negatively correlated with CHPPEX and R&D, suggesting that higher
leverage level leads to lower investment amounts.
4.2 Regression results
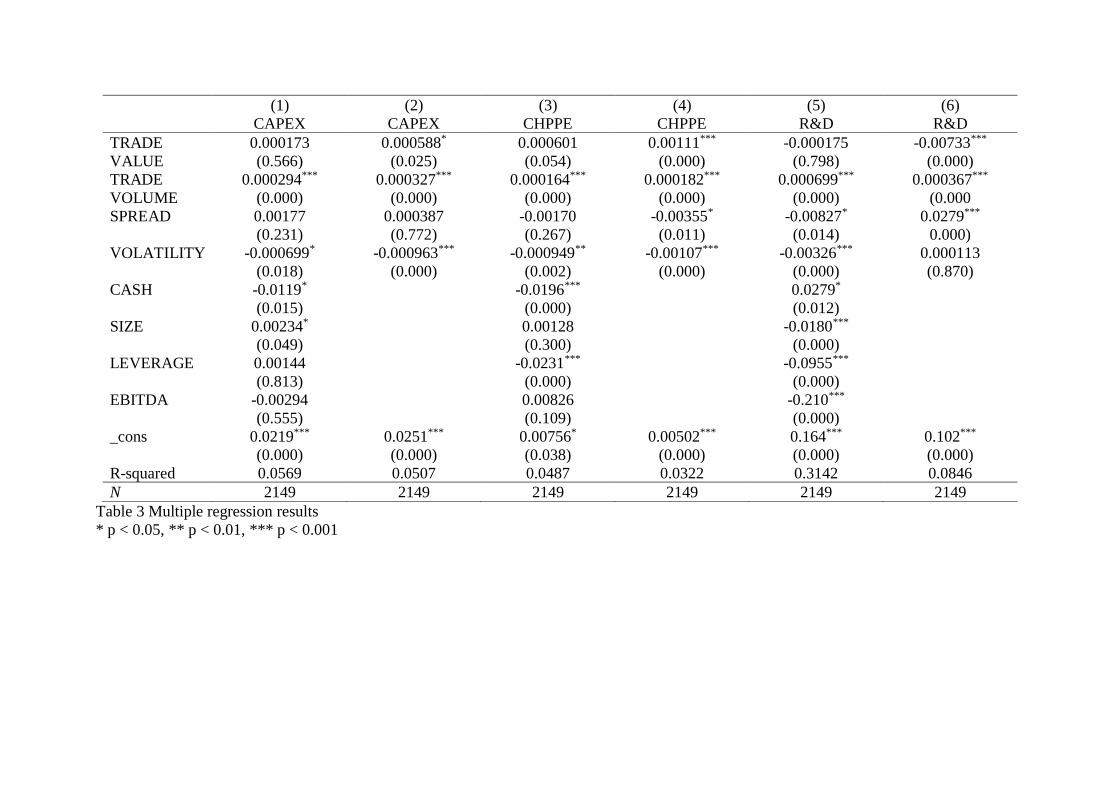
A positive relation between trading volume or trading volume and investments is supported by
a positive estimated coefficient, and a negative relation between spread or volatility and
investments is supported by a negative estimated coefficient. Results in tables 3 indicate that
the coefficient between trading volume and all investments are statistically significant and have
expected signs. And for CAPEX and CHPPE, the hypothesis about capital investment can be
justified, as coefficients for the four independent variables meet my expectation.
However, there are some differences in the estimated results in R&D. When I don’t incorporate
the four control variables, the signs of TRADEVALUE and SPREAD are deviated from my
hypothesis. But after I control these variables, I can see the predicted signs in the results. This
Variable N Mean Std. Dev. min max p10 p25 p50 p75 p90
CAPEX 2149 0.032034 0.033598 0.0014263 0.1909541 0.0062991 0.011814 0.021416 0.037665 0.0714056
CHPPE 2149 0.008215 0.034582 -0.0817463 0.1831787 -0.0154629 -0.0050641 0.001553 0.012407 0.0408412
R&D 2149 0.106599 0.08942 0.0017702 0.5061336 0.0207105 0.0468908 0.085889 0.139712 0.2116622
TRADE
VALUE 2149 1.930037 2.784123 0.0282274 18.52947 0.1672258 0.4043318 1.040909 2.185733 4.46853
TRADE
VOLUME 2149 21.48289 20.87058 1.185374 123.6608 3.857454 8.52403 16.05171 26.18593 45.37761
SPREAD 2149 0.374635 0.553389 -0.022 3.705774 0.0059524 0.0770503 0.249537 0.454311 0.6970193
VOLATILITY 2149 1.428039 2.807233 0.1619323 13.73712 0.2391493 0.3020304 0.407044 0.609004 4.856296
CASH 2149 0.203003 0.161988 0.0094102 0.8647065 0.0466175 0.0898251 0.164121 0.266122 0.4153557
SIZE 2149 2.694626 0.919952 1.064944 5.070156 1.493695 1.963079 2.646372 3.353976 3.860577
LEVERAGE 2149 0.088049 0.125361 0 0.5678945 0 0 0.012289 0.148063 0.2611524
EBITDA 2149 0.063113 0.174409 -0.8946615 0.3266072 -0.086742 0.0380456 0.098419 0.145079 0.1965025
Table 1 Descriptive statistics for dependent and explanatory variables
CAPEX CHPPE R&D TRADE
VALUE
TRADE
VOLUME SPREAD
VOLATIL
ITY CASH SIZE
LEVE
RAGE EBITDA
CAPEX 1
CHPPE 0.6776 1
R&D 0.0449 -0.028 1
TRADE
VALUE 0.0031 0.0571 -0.2252 1
TRADE
VOLUME 0.2048 0.1107 0.1167 -0.2284 1
SPREAD -0.0319 -0.0804 0.134 0.1298 -0.1182 1
VOLATILITY -0.1134 -0.12 0.033 0.0008 -0.1706 0.2561 1
CASH -0.0788 -0.1215 0.2827 -0.2014 -0.0196 0.1285 0.0443 1
SIZE 0.1509 0.1432 -0.3235 0.2925 0.2816 -0.3685 -0.4826 -0.3297 1
LEVERAGE 0.0534 -0.0294 -0.2203 0.0494 0.072 -0.1254 -0.1024 -0.1912 0.3499 1
EBITDA 0.0445 0.1215 -0.4898 0.2562 0.0207 -0.3417 -0.1734 -0.3876 0.4581 0.0988 1
Table 2 Correlation matrix for explanatory variable
performance, to some extent, accord with my expectation, as the control variables play their
roles in the regression. I also find some other literatures that can explain the result.
Although some opponents argue that the lack of information disclosure encourages managers
to engage in such myopic investment, others hold that large shareholdings and intrinsic
investors allow managers to focus on long-term objective rather short-term earnings.
As the dealer rather than the owner, institutional investors pay much attention to short-term
performance and result, influencing managers to fear the undervaluation of stock price and
selling caused by their dissatisfaction towards earning. (Graves and Waddock 1990; Jacobs
1991; Porter 1992). Therefore, it is possible that managers cut R&D investment, a kind of proxy
for long-term investment, to avoid investors’ disappointment. There are two assumptions that
managers have incentives to stop undervaluation. First, managers have enough concerns about
the stock price, as we also explained in the last section. Second, supported by Bernard et al.
(1993), managers believe that the market is capable of overreacting to unmanaged earning
declines or underreacting to artificial earning boost.
Further, in an influential survey, CEOs complained that the culture of meeting short-term
targets restrain their abilities from increasing long-term firm value (Graham, Harvey, and
Rajgopal 2005). Most of them even expressed their willingness to sacrifice long-term value to
present a better shot-term result. Recent theoretical studies (Gigler et al. 2014; Edmans et al.
2016; Hermalin and Weisbach 2012) also support the argument that the greater disclosure on
financial reporting, the more possibility that managers make myopic decisions.
Hence, the reasons above are helpful to explain why the trading value, in the regression result
from table 3, is negatively related with R&D and spread is positively correlated with R&D.
Overall, the results support my hypothesis, since all variables perform expectedly to CAPEX
and CHPPE, and after controlling four related variables, the result between dependent and
explanatory variables also is also consistent with the hypothesis.
(1) (2) (3) (4) (5) (6)
CAPEX CAPEX CHPPE CHPPE R&D R&D
TRADE 0.000173 0.000588* 0.000601 0.00111*** -0.000175 -0.00733***
VALUE (0.566) (0.025) (0.054) (0.000) (0.798) (0.000)
TRADE 0.000294*** 0.000327*** 0.000164*** 0.000182*** 0.000699*** 0.000367***
VOLUME (0.000) (0.000) (0.000) (0.000) (0.000) (0.000
SPREAD 0.00177 0.000387 -0.00170 -0.00355* -0.00827* 0.0279***
(0.231) (0.772) (0.267) (0.011) (0.014) 0.000)
VOLATILITY -0.000699* -0.000963*** -0.000949** -0.00107*** -0.00326*** 0.000113
(0.018) (0.000) (0.002) (0.000) (0.000) (0.870)
CASH -0.0119* -0.0196*** 0.0279*
(0.015) (0.000) (0.012)
SIZE 0.00234* 0.00128 -0.0180***
(0.049) (0.300) (0.000)
LEVERAGE 0.00144 -0.0231*** -0.0955***
(0.813) (0.000) (0.000)
EBITDA -0.00294 0.00826 -0.210***
(0.555) (0.109) (0.000)
_cons 0.0219*** 0.0251*** 0.00756* 0.00502*** 0.164*** 0.102***
(0.000) (0.000) (0.038) (0.000) (0.000) (0.000)
R-squared 0.0569 0.0507 0.0487 0.0322 0.3142 0.0846
N 2149 2149 2149 2149 2149 2149
Table 3 Multiple regression results
* p < 0.05, ** p < 0.01, *** p < 0.001
5 Summary and conclusion
This paper examines the association between information asymmetry and managerial myopia
in high-technology firms. Extant literatures posit a theoretical reasoning link from information
asymmetry to managerial myopia. The first link between information asymmetry and investor
sentiment argue that information asymmetry between investors and managers might lead to
negative investor sentiment, as investors can’t distinguish long-term investments that don’t
benefit in the short-term from the misbehavior of management. The second link between
investor sentiment and stock price argue that, according to some proved evidences, the stock
price fluctuates positively and immediately with investor sentiment by future cash flow, selling
signal, risk exposure, etc. As a result, negative sentiment tends to cause lower stock price. The
third link between concerned manager and managerial myopia argue that it is possible that
managers who are concerned about stock price would manipulate myopic investment to meet
short-term objectives.
Using a sample of 307 high-technology companies from 2010 to 2016, I have tested the
hypothesis and the result supported predicted the positive association. The predicted positive
relations between trading value / trading volume and investments are observed, consistent with
the hypothesis that firms with higher level of trading volume have more opportunities to
improve investment shot-termism and reduce managerial myopia. The negative associations
are found between volatility / spread and investments, also consistent with the hypothesis.
There is a contradiction in the result of R&D without control variables, and I found that
frequent information disclosure sometimes encourages managers to focus on short-term
earnings, which increases managerial myopia.
The result offers supports in favor of increasing managerial myopia by asymmetric information,
indicating that executives and shareholders should try to reduce information asymmetry, such
as adding more institutional investors, to mitigate managerial myopia, the problem that has
negative impacts on internal financial performance and external macro-economy. For example,
long-term oriented firms have better future earnings growth and create more employment
opportunities even in financial crisis. My paper also has the implication for practice because
several regions, including Europe, Singapore, and Australia, have debated the merits of
mandating quarterly reporting. And compared with annual reporting, quarterly reporting that
is regarded as the decreased level of information asymmetry can mitigate myopic investment
with the results from this paper.

34
This study has some limitations. First, it is limited in that it focuses on high-technology
companies in the U.S., suggesting that that future research could extend this study to other
developed or developing countries. As restrained by the available database, it is difficult for
me to collect data from other countries. And the results incorporate information from other
areas would be more profound and helpful, as high-technology firms have developed very well
in some developing countries. Second, since information asymmetry can lead to managerial
myopia, what’s the result about the level of myopic behaviors if information transparency is
improved? With more time, I will explore whether informed institutional investor or frequency
of financial reporting would decrease the level of myopia, to verify my results from another
perspective.
35
References
Almazan, A., J. C. Hartzell, and L. T. Starks (2005) Active institutional shareholders and
costs of monitoring: Evidence from executive compensation, Financial Management, 34
(4), pp.5-34.
Anthony, R. N., and V. Govindarajan (2004) Management control systems, 11th ed,
McGraw-Hill/Irwin.
Antia, M., C. Pantzalis, and J. C. Park (2010) CEO decision horizon and firm performance:
An empirical investigation, Journal of Corporate Finance, 16 (3), pp.288–301.
Arthur G. Kraft, Rahul Vashishtha, and Mohan Venkatachalam (2018) Frequent Financial
Reporting and Managerial Myopia, The Accounting Review, 93(2), pp.249-275.
Asker, J., J. Farre-Mensa, and A. Ljungqvist (2015) Corporate investing and stock market
listing: A puzzle? Review of Financial Studies, 28 (2), pp.342–390.
Atchison, T. J. (1991) The Employment Relationship: United or Retired, The Executive, 11,
pp.52-62.
Auletta, Ken (1986) Greed and Glory on Wall Street: The Fall of the House of Lehman,
Random House.
Baker, M. and Wurgler, J. (2006) Investor sentiment and the cross-section of stock returns,
The Journal of Finance, 61 (4), pp.1645–1680.
Baker, Malcolm, and Jeffrey Wurgler (2007) Investor Sentiment in the Stock Market, Journal
of Economic Perspectives 21, 2, pp.129–151.
Barber, B.M. and T. Odean (1999) The Courage of Misguided Convictions, Financial
Analysts, 55(6), pp.41-55.
Barker V. L., III, and G. C. Mueller (2002) CEO characteristics and firm R&D spending,
Management Science, 48(6), pp.782–801.
36
Baruch Lev, and Theodore Sougiannis (1996) The capitalization, amortization, and value-
relevance of R&D, Journal of Accounting and Economics, 21(1), pp.107-138.
Bebchuk LA, Fried JM. (2004) Pay without Performance: The Unfulfilled Promise of
Executive Compensation, Harvard University Press.
Berle AA and Means GC (1932) The Modern Corporation and Private Property, New York:
Macmillan.
Bernard, V., J. Thomas, and J. Abarbanell (1993) How sophisticated is the market in
interpreting earnings news? Journal of Applied Corporate Finance, 6(2), pp.54-63.
Bertrand M, Mullainathan S. (2001) Are CEOs rewarded for luck? The ones without
principals are, The Quarterly Journal of Economics, 116(3), pp.901–32.
Bhojraj, S., Libby, R. (2005) Capital market pressure, disclosure frequency-induced
earnings/cash flow conflict, and managerial myopia, The Accounting Review, 80(1),
pp.1–20.
Billger, S. M. & Hallock, K. F. (2005) Mass layoffs and CEO turnover, Industrial Relations,
44(3), pp.463-489.
Brown, G. and Cliff, M. (2004) Investor sentiment and the near-term stock market, Journal of
Empirical Finance, 11 (1), pp.1–27.
Bryan Kelly, Alexander Ljungqvist (2012) Testing Asymmetric-Information Asset Pricing
Models, The Review of Financial Studies, 25(5), pp.1366–1413.
Bushee, B. J. (1998) The influence of institutional investors on myopic R&D investment
behavior, The Accounting Review, 73(3), pp.305-333.
Carola Frydman and Dirk Jenter (2010) CEO Compensation, Annual Review of Financial
Economics, 21(1), pp.75-102.
Cascio, W.F. (1993) Downsizing: What Do We Know? What Have We Learned? Academy of
Management Executive, 7(1), pp.95–104.
37
Chen Chen, Xiumin Martin, Sugata Roychowdhury, Xin Wang, and Matthew T. Billett
(2018) Clarity Begins at Home: Internal Information Asymmetry and External
Communication Quality, The Accounting Review, 93(1), pp.71-101.
Chen, Jeng-Hong & Jiang, Christine X. & Kim, Jang-Chul & McInish, Thomas H. (2003)
Bid-Ask Spreads, Information Asymmetry, and Abnormal Investor Sentiment: Evidence
from Closed-End Funds, Review of Quantitative Finance and Accounting, 21(4), pp.303-
321.
Chen, P., Mehrotra, V., Sivakumar, R. & Yu, W. W. (2001) Layoff, Shareholders’ Wealth,
and Corporate Performance, Journal of Empirical Finance, 8(2), pp.171-199.
Cheng, S. (2004) R&D expenditures and CEO compensation, The Accounting Review, 79 (2),
pp.305–328.
Chuang, W.I. and B. S. Lee (2006) An Empirical Evaluation of the Overconfidence
Hypothesis, Journal of Banking & Finance, 30(9), pp.489-515.
Cohen, D., Zarowin, P. (2010) Accrual-based and real earnings management activities around
seasoned equity offerings, Journal of Accounting and Economics, 50(1), pp.2–19.
Coles JL, Daniel ND, Naveen L. (2006) Managerial incentives and risk-taking, Journal of
Finance and Economics, 79(2), pp.431–68.
Cornell, B. and Landsman, W., Stubben, S. (2014) Accounting information, investor
sentiment, and market pricing, Journal of Law, Finance, and Accounting (JLFA).
Daniel, K., D. Hirshleifer, and A. Subrahmanyam (1998) Investor Psychology and Security
Market Under- and Overreactions, The Journal of Finance, 53(6), pp.1839-885.
David Hillier, Andrew Marshall, Patrick McColgan and Samwel Werema (2007) Employee
Layoffs, Shareholder Wealth and Firm Performance: Evidence from the UK, Journal of
Business Finance & Accounting, 34(3-4), pp.467-494.
David Marginson, and Laurie McAulay (2008) Exploring the debate on short‐termism: a
theoretical and empirical analysis, Strategic Management Journal, 29(3), pp.273-292.
38
DeAngelo, Linda Elizabeth (1988) Managerial competition, information costs, and corporate
governance: The use of accounting performance measures in proxy contests, Journal of
Accounting and Economics, 10(1), pp. 3-36.
Dechow, P. M., and R. G. Sloan. (1991) Executive incentives and the horizon problem,
Journal of Accounting & Economics, 14(1), pp.51–89.
De Long, B. and Shleifer, A., Summers, L., Waldmann, R. (1990) Noise trader risk in
financial markets, Journal of Political Economy, 98 (4), pp.703–708.
De Meuse, K. P., Bergmann, T. J., Vanderheiden P. A. & Roraff, C. E. (2004) New Evidence
Regarding Organizational Downsizing and Firm’s Financial Performance: A Long-term
Analysis, Journal of Managerial Issues, 16(2), pp.155-177.
Dobrzynski, J. (1993) Relationship investing, Business Week, 3309, pp.68-75.
Dreman, D., S. Johnson, D. Macgregor, and P. Slovic (2001) A Report on the March 2001
Investor Sentiment Survey, Journal of Psychology and Financial Markets, 2(3), pp.126-
34.
Edmans, A., M. Heinle, and C. Huang (2016) The real costs of financial efficiency when
some information is soft, Review of Finance, 20(6), pp.2151–2182.
Edmans, A., V. W. Fang, and K. A. Lewellen (2017) Equity vesting and investment, Review
of Financial Studies, 30 (7), pp.2229–2271.
Elizabeth N. K. Lim (2015) The role of reference point in CEO restricted stock and its impact
on R&D intensity in high-technology firms, Strategic Management Journal, 36(6),
pp.872-889.
Eugene F. Fama (1970) Efficient Capital Markets: A Review of Theory and Empirical Work,
The Journal of Finance, 25(2), pp.383-417.
Eugene F. Fama (1980) Agency Problems and the Theory of the Firm, Journal of Political
Economy, 88(2), pp.288-307.
39
Freeman, S. J. & Cameron, K.S. (1993) Organizational Downsizing: A Convergence and
Reorientation Framework, Organization Science, 4(1), pp.10-29.
Froot, Kenneth A, Andre F Perold, and Jeremy C Stein (1992) Shareholder Trading Practices
and Corporate Investment Horizons, Journal of Applied Corporate Finance, 5 (2),
pp.42-58.
Gao, H. (2010) Market misvaluation, managerial horizon, and acquisitions, Financial
Management, 39(2), pp.833–850.
Gigler, F., C. Kanodia, H. Sapra, and R. Venugopalan (2014) How frequent financial
reporting can cause managerial short-termism: An analysis of the costs and benefits of
increasing reporting frequency, Journal of Accounting Research, 52(2), pp.357–387.
Gombola, M.J. and G.P. Tsetsekos (1992) The Information Content of Plant Closing
Announcements: Evidence from Financial Profiles and Stock Price Reaction, Financial
Management, 21(2), pp.31–40.
Graham, J. R., C. R. Harvey, and S. Rajgopal (2005) The economic implications of corporate
financial reporting, Journal of Accounting and Economics, 40 (1/3), pp.3–73.
Graves, S. and S. Waddock (1990) Institutional ownership and control: Implications for long-
term corporate strategy, Academy of Management Executive, 4(1), pp.75-83.
Greve, H. R. (1998) Performance, aspirations, and risky organizational change,
Administrative Science Quarterly, 43(1), 58−86.
Guay WR. (1999) The sensitivity of CEO wealth to equity risk: an analysis of the magnitude
and Determinants, Journal of Finance and Economics, 53(1), pp.43–71.
Habib, A., and J. C. Hansen (2008) Target shooting: Review of earnings management around
earnings benchmarks, Journal of Accounting Literature, 27(1), pp.25–70.
Hart, O.D. (1983) The Market Mechanism as an Incentive Scheme, Bell Journal of
Economics, 14(2), pp. 366–82.
40
Hartzell, J. C, and L. T. Starks (2003) Institutional investors and executive compensation,
The Journal of Finance, 58 (6), pp.2351-2374.
Hermalin, B. E., and M. S. Weisbach (2012) Information disclosure and corporate
governance, Journal of Finance, 67 (1), pp.195–233.
Hoskisson, R. E., M. W. Castleton, and M. C. Withers (2009) Complementarity in monitoring
and bonding: More intense monitoring leads to higher executive compensation, The
Academy of Management Perspectives, 23(2), pp.57–74.
Hribar, P. and McInnis, J. (2012) Investor sentiment and analysts earnings forecast error,
Management science, 58 (2), pp.293–307.
Ittner, C. D., and D. F. Larcker (1998) Innovations in performance measurement: Trends
andresearch implications, Journal of Management Accounting Research, 10, pp.205–
238.
Jacobs, M. (1991) Short-Term America: The Causes and Cures of Our Business Myopia,
Harvard Business School Press.
Jeremy C. Stein (1989) Efficient Capital Markets, Inefficient Firms: A Model of Myopic
Corporate Behavior, The Quarterly Journal of Economics, 104(4), pp. 655-669.
Jensen, Michael C. (1986) Agency Cost of Free Cash Flow, Corporate Finance, and
Takeovers, American Economic Review, 76(2), pp.323–29.
Jensen, M.C. (1993) The Modern Industrial Revolution, Exit, and the Failure of Internal
Control Systems, Journal of Finance, 48(3), pp.831–80.
Jeremy C. Stein (1989) Efficient Capital Markets, Inefficient Firms: A Model of Myopic
Corporate Behavior, The Quarterly Journal of Economics, 104(4), pp.655-669.
Jindra, J. (2001) Seasoned equity offerings, valuation, and timing, Unpublished working
paper, Cornerstone Research, Menlo Park, CA.
Jinfang Li (2015) The asymmetric effects of investor sentiment and monetary policy on stock
prices, Applied Economics, 47(24), pp.2514–2522.

41
Kalyta, P. (2009) Accounting discretion, horizon problem, and CEO retirement benefits, The
Accounting Review, 84(5), pp.1553–1573.
Kee H.Chung, Jang-Chul Kim, Young Sang Kim and Hao Zhang (2015) Information
Asymmetry and Corporate Cash Holdings, Journal of Business Finance & Accounting,
42(9-10), pp.1341–1377.
Kenneth A. Merchant and William J. Bruns, Jr. (1986) Measurements to cure management
myopia, Business Horizons, 29(3), pp.56-64.
Kuala Lumpur (2005) Corporate Layoff Announcements and Shareholder Value: Empirical
Evidence from Finland, 2005, Department of Business Administration, Lappeenranta
University of Technology.
Ladika, T., and Z. Sautner (2015) The Effect of Managerial Short-Termism on Corporate
Investment, Working paper, University of Amsterdam.
Laffont, J. J., and Jean Tirole (1987) Managerial Switching and Myopia, mimeo.
Laverty, K. (1996) Economic "short-termism": The debate, the unresolved issue, and the
implications for management practice and research, Academy of Management Review,
21(3), pp.825-860.
Leary, W. E. (2002) Secrets of 200 years of inventions in the most innovative country, New
York Times, November 6.
Lee, C., Shleifer, A., and Thaler, R. (1991) Investor sentiment and the closed-end fund
puzzle, Journal of Finance, 46 (1), pp.75–109.
Lewellen K. (2006) Financing decisions when managers are risk averse, Journal of Finance
and Economics, 82(3), pp.551–89.
Li D, Eden L, Hitt MA, Ireland RD. (2008). Friends, acquaintances, or strangers? Partner
selection in R&D alliances, Academy of Management Journal, 51(2), pp.315–334.
Lowry, Michelle (2001) Why Does IPO Volume Fluctuate so Much? Journal of Financial
Economics, 67, pp.3-40.
42
Lundstrum, L. L. (2002) Corporate investment myopia: A horserace of the theories, Journal
of Corporate Finance, 8(4), pp.353–371.
Makri, M., Lane, P. J., & Gomez-Mejia, L. (2006) CEO Incentives, innovation, and
performance in technology-intensive firms, Strategic Management Journal, 27(11),
pp.1057-1080.
Margaret A. Abernethy, Jan Bouwens, Laurence Van Lent (2013) The Role of Performance
Measures in the Intertemporal Decisions of Business Unit Managers, Contemporary
Accounting Research, 30(3), pp.925-961.
Matejka, M., K. A. Merchant, and W. A. Van der Stede (2009) Employment horizon and the
choice of performance measures: Empirical evidence from annual bonus plans of loss-
making entities, Management Science, 55(6), pp.890–905.
McKinsey Global Institute (2015) Playing to win: The new global competition for corporate
profits.
McKinsey Global Institute (2017) How to build an alliance against corporate short-termism.
McKinsey Global Institute (2017) Measuring the economic impact of short-termism.
Merchant, Kenneth A. (1990) The effects of financial controls on data manipulation and
management myopia, Accounting, Organizations anal Society, 15(4), pp.297-213.
Michael C. Jensen (1976) Theory of the firm: managerial behaviour, agency cost and
ownership structural, Journal of Financial Economics, 3(4), pp.305-360.
Monks, R., and N. Minow (1995) Corporate Governance, Cambridge.
Morck R, Shleifer A, Vishny RW. (1990) Do managerial objectives drive bad acquisitions?
Journal of Finance, 45(1), pp.31–48.
Morrison, E. W. & Robinson, S. L. (1997) When Employees Feel Betrayed: A Model of How
Psychological Contract Violation Develops, Academy of Management Review, 22(1),
pp.226-256.

43
Murphy, Kevin J. (2012), Executive Compensation: Where We Are, and How We Got There.
George Constantinides, Milton Harris, and René Stulz (eds.), Handbook of the
Economics of Finance.
Neinstedt, P. R. (1989) Effectively Downsizing Management Structures, Human Resource
Planning 12(2), 155-164.
Odean, T. (1998) Volume, Volatility, Price and Profit When All Traders Are Above Average,
The Journal of Finance, 53(6), pp.1887-1934.
Porter, M. (1992) Capital Choices: Changing the Way America Invests in Industry, Journal
of Applied Corporate Finance, 5(2), pp.4-16.
Purnanandam, A. and Swaminathan, B. (2001) Are IPOs underpriced? Unpublished working
paper, Cornell University.
Rajan, R., Servaes, H. (1997) Analyst following of initial public offerings, Journal of
Finance, 52, pp.507–530.
Rajan, R., and Servaes, H. (2003) The effect of market conditions on initial public offerings,
Venture Capital Contracting and the Valuation of High-tech Firms, Oxford University
Press, pp.437-463
Rajgopal S, Shevlin T. (2002), Empirical evidence on the relation between stock option
compensation and risk taking, Journal of Accounting and Economics, 33(2), pp.145–
171.
Sanford J. Grossman & Oliver D. Hart (1980) Takeover Bids, the Free-Rider Problem, and
the Theory of the Corporation, Bell Journal of Economics, 11(1), pp.42-64.
Scapens, R. W. (1979) Profit measurement in divisionalized companies, Journal of Business
Finance and Accounting, 6 (3), pp.281–305.
Scharfstein, David S. (1988) The Disciplinary Role of Takeovers, Review of Economic
Studies, 55(2), pp.185–200.
44
Schlender, B. R. (1982) Datapoint Kept Trying to Set Profit Records Until the Bubble Burst,
Wall Street Journal, p.1.
Shane S. Dikolli, Susan L. Kulp and Karen L. Sedatole (2009) Transient Institutional
Ownership and CEO Contracting, The Accounting Review, 84(3), pp. 737-770.
Shane S. Dikolli, Susan L. Kulp and Karen L. Sedatole (2013) The Use of Contract
Adjustments to Lengthen the CEO Horizon in the Presence of Internal and External
Monitoring, Journal of management accounting research, 25(1), pp.199-229.
Shefrin, H. (1999) Beyond Greed and Fear: Understanding Behavioural Finance and the
Psychology of Investing, Harvard Business School Press.
Shefrin, H. (2008) Risk and return in behavioral SDF-based asset pricing models, Journal of
Investment Management, 6(4), pp.4-22.
Stambaugh, R., Yu, J., and Yuan, Y. (2012) The short of it: investor sentiment and anomalies,
Journal of financial economics, 104 (2), pp.288–302.
Stein, J. (1988) Takeover threats and managerial myopia, Journal of Political Economy,
96(1), pp.61–80.
Steven E. Abraham & Dong-One Kim (1999) Layoff and Employment Guarantee
Announcements: How Do Shareholders Respond? Departmental Working Papers,
Department of Economics, SUNY-Oswego.
Stuart C. Gilson (1990) Bankruptcy, Boards, Banks, and Blockholders, Journal of Financial
Economics, 1990, 27(2), pp.355-387.
Tao Chen and Chen Lin (2017) Does Information Asymmetry Affect Corporate Tax
Aggressiveness? Journal of Financial and Quantitative Analysis, 52 (05), pp.2053-2081.
Thevaranjan, A., K. Joseph, and D. Srinivasan (2000) Managerial myopia and non- financial
measures: The case of customer satisfaction mitigating hard-selling, Working paper,
Syracuse University, University of Kansas, and University of Pittsburgh.
45
Thorp, W. A. (2004) Investor Sentiment as a Contrarian Indicator, The American Association
of Individual Investors.
Thurow, L C. (1981) Where Management Fails, Newsweek, p.78.
Tufano P. (1996) Who manages risk? An empirical examination of risk management
practices in the gold mining industry, Journal of Finance, 51(4), pp.1097–1137.
Wang, Y., Jian, X. and Li, L. (2010) Does fair value measurement model have value
relevance? Empirical evidence from financial assets investigation, China Account, 8 (4),
pp.383–398.
Zhao, Y., Chen, K. (2008) Staggered boards and earnings management, The Accounting
Review, 83(5), pp.1347–1381.
Zimmerman, J. L. (1997) EVA and divisional performance measurement: Capturing
synergies and other issues, Journal of Applied Corporate Finance, 10 (2), pp.98–109.