Embed Size (px)
Citation preview

Information Asymmetries and the Effects of Banking Mergers
on Firm-Bank Relationships
Steven Drucker* Stanford Graduate School of Business
January 2005
JOB MARKET PAPER
ABSTRACT
This study examines the effects of the recent mergers between commercial banks and investment banks on firm-bank relationships and the pricing of loan contracts, focusing on the role of information asymmetries. I find that informationally opaque borrowers - firms that are junk rated and have single lending relationships - are more likely to switch lenders to a merged commercial-investment bank when their existing lenders are pure commercial banks. Also, informationally sensitive firms are likely to select their commercial-investment bank as public debt underwriter. The revealed preference by informationally opaque firms for relationships with commercial-investment banks suggests that companies value such relationships when there are potential benefits from the bank’s ability to use private information from lending relationships in investment banking, where the bank can reduce information asymmetries between firms and investors. After merging, banks raise the interest rates of their continuing borrowers who have single lending relationships or are junk rated, which is consistent with banks having information monopolies over these borrowers that allows for the extraction of merger-related gains. For more informationally transparent firms, mergers between commercial banks and investment banks do not affect their relationships or borrowing costs.
* E-mail: [email protected]. Phone: 650-725-7260. I am very grateful to the FDIC Center for Financial Research for funding this research. I would like to thank my thesis committee, Peter DeMarzo, Paul Pfleiderer, and Manju Puri, as well as Anat Admati, Malcolm Baker, Mark Carey, Darrell Duffie, Mark Flannery, Gerald Hanweck, Thomas Hellmann, Hans Hvide, Jeremy Graveline, Steve Grenadier, Yael Hochberg, Wenying Jiangli, Ilan Kremer, Camelia Kuhnen, Leandro Saita, Ilya Strebulaev, Alexei Tchistyi, Faye Wang, Jeff Zwiebel and seminar participants at the 2004 FDIC Center for Financial Research Summer Workshop and Stanford GSB for helpful comments and suggestions.

1
1. Introduction
Relationships with banks are well known to be valuable to firms. Through screening and
monitoring activities, banks are able to collect private information that allows them to overcome
information asymmetries and fund firms even when borrower quality is difficult to assess (see
e.g. Diamond (1984, 1991), Ramakrishnan and Thakor (1984), Fama (1985), Boyd and Prescott
(1986)). The acquisition of information over time allows banks to increase the availability of
credit and reduce collateral requirements for their borrowers (see e.g. Boot and Thakor (1994),
Petersen and Rajan (1994), Berger and Udell (1995), Cole (1998)). Through an ongoing
relationship, a firm can develop a credit record to obtain a sound reputation that helps convey its
quality to outside markets (Diamond (1991)).1
Until recently, relationships between firms and banks were restricted in scope by the
1933 Glass-Steagall Act, which prohibited commercial banks from engaging in investment
banking activities, such as securities underwriting. However, during the 1990s, many restrictions
were relaxed and the Glass-Steagall Act was eventually repealed, spurring a wave of mergers
between commercial and investment banks (“CB-IB mergers”) that allow banks to offer a full
range of financial products and services.2 Given the significance of relationships to firms, it is
important to assess how these mergers affect relationships and if these mergers benefit or harm
firms.
One reason to expect that CB-IB mergers will affect firm-bank relationships results from
the merged commercial-investment bank’s (“CB-IB”) ability to use private information from
lending relationships in investment banking. Existing empirical evidence suggests that when
commercial banks underwrite public securities, they can use this private information to reduce
information asymmetries between the firm and investors, achieving higher security prices
particularly when the company is lower rated or relatively unknown to public markets (see e.g.
1 Consistent with this theory, empirical studies find that new loans, loan renewals, and lender identity convey private information to the outside equity market about a firm’s financial condition (see e.g. James (1987), Lummer and McConnell (1989), Best and Zhang (1993), and Billett, Flannery, and Garfinkel (1995)). 2 While commercial banks could engage in investment banking activities without merging with pre-established investment banks, with the notable exception of J.P. Morgan, commercial banks had limited success with internally created investment banks. Mergers were the primary method for commercial banks’ entering into investment banking. See Carow and Kane (2002) for a review of the relaxation of the Glass-Steagall Act and event study evidence related to key events in the deregulation process.

2
Puri (1996), Gande et. al (1997), Schenone (2004)). Further, the ability to use private
information from commercial banking activities in investment banking may limit the duplication
of screening and monitoring activities. This can create efficiency gains due to informational
economies of scope, which could lower overall costs (see e.g. Benston (1990), Saunders and
Walter (1994), Drucker and Puri (2004b)). As a result of these potential benefits, CB-IB mergers
may affect relationships between firms and banks in both the traditional lending environment as
well as in investment banking. Specifically, if firms expect to receive future benefits from bank
underwriting, then having a lending relationship with a bank that can provide investment banking
services may be particularly important for companies that need their quality to be certified or
when informational economies of scope are large. Also, when accessing public markets,
informationally opaque firms may benefit from selecting their lender as underwriter, thereby
expanding the firm-bank relationship.
Further, CB-IB mergers may affect the pricing of loan contracts. If there are gains
related to the CB-IB’s ability to use private information from lending relationships in investment
banking, then these gains are likely to be pronounced among informationally opaque firms.
Sharpe (1990) and Rajan (1992) show theoretically that a commercial bank may be able to
extract rents by charging higher interest rates to borrowers due to an “information monopoly”
that can arise when a firm has difficulty conveying its quality to other banks. Due to the
potential gains available after a CB-IB merger, the CB-IB may be able to extract additional rents
from informationally opaque firms through higher loan interest rates. However, if firms can
convey their quality to other banks, then information monopolies should not exist, and
competition would not allow for rent extraction. In fact, if informational economies of scope
produce lower costs for the bank, then firms may actually receive lower interest rates.
However, it is not entirely clear that the CB-IB’s ability to use information from lending
relationships in investment banking will substantially affect firm-bank relationships. CB-IBs are
large banks, and the literature documents that large banks tend to rely on “hard,” verifiable
information when extending loans (see e.g. Berger and Udell (1996), Cole, Goldberg, and White
(1999), Berger et al. (2004)). These banks have been shown to primarily focus their lending
business on medium to large borrowers, for which hard information exists (see e.g. Berger,

3
Kashyap, and Scalise (1995), Peek and Rosengren (1996), Strahan and Weston (1996)).3 If
outsiders and the lender have access to similar information, then the bank will not be important
in resolving information asymmetries and the CB-IB merger may not influence firm-bank
relationships.
Do mergers between commercial banks and investment banks affect firm-bank
relationships? Is there evidence that suggests that these mergers increase the value of
relationships for firms? Can CB-IBs extract information rents or are any potential cost savings
passed along to firms? In this paper, I empirically examine these questions by studying the
effects of CB-IB mergers on firms’ lending relationships, their choice of underwriter, and the
pricing of loan contracts. I construct a unique data set that is carefully assembled and hand-
matched from multiple databases. I gather data on individual loan contracts, including the
identities of the borrowers and lenders and the price and contract terms of the loans. I
supplement the loan data with each borrower’s financial characteristics and lending history,
information on commercial bank lenders, and data on the economic environment. Further, I
collect data on public debt issues made by borrowers of CB-IBs, including firms’ prior
underwriting relationships and each potential underwriter’s market share. Importantly, the
disaggregated data set allows me to isolate borrowers that are likely to be most impacted by these
mergers.
The empirical results show that CB-IB mergers have a significant effect on relationships
between banks and informationally opaque firms. First, when seeking a loan, junk rated firms
are significantly more likely to start a new lending relationship with a CB-IB when they do not
have a prior lending relationship with a CB-IB. Switching to CB-IBs is more common among
junk rated firms with single lending relationships, where information asymmetries are likely to
be larger than for firms with multiple lending relationships. These results are consistent with the
hypothesis that the benefits of borrowing from a CB-IB outweigh the switching costs for
informationally opaque firms. Second, when accessing the public debt markets, lower rated
firms and companies with single lending relationships are significantly more likely to select their 3 Stein (2002) reasons that large banks focus on larger companies because the banks are better equipped to handle hard information rather than “soft” information that is needed to assess the quality of small businesses. Petersen (2002) argues that this occurs for efficiency reasons. Hard information is easier to standardize than soft information, which requires interpretation by the loan officer. Therefore, hard information is more easily incorporated into automated loan procedures and is more durable because it can be interpreted without context, allowing for distribution to many parts of the organization.

4
CB-IB as underwriter, even after controlling for prior underwriting relationships, underwriter
reputation, and firm characteristics. The revealed preference by informationally opaque firms for
relationships with CB-IBs suggests that these types of companies place a higher value on
relationships with a CB-IB than with a stand-alone bank when the CB-IB’s ability to resolve
information asymmetries between the firm and investors is likely to be important.
Interestingly, further analysis suggests that following CB-IB mergers, banks extract
additional rents from informationally opaque firms that continue to borrow from the bank. Junk
rated borrowers and borrowers with single lending relationships pay significantly higher interest
rates when continuing to borrow post-merger relative to pre-merger. The increase in borrowing
costs is statistically significant and economically substantive, with junk rated borrowers facing
interest rates that are 44 basis points higher, a borrowing cost increase of approximately
$400,000 for the average loan. This is a particularly noteworthy finding because it suggests that
informationally opaque firms have difficulty conveying their quality to other banks; consistent
with the analyses in Sharpe (1990) and Rajan (1992), the existing lenders may have information
monopolies over these firms and can therefore extract additional rents. These additional rents
arise from the expected gains that can result from the CB-IBs ability to resolve information
asymmetries when underwriting.
Two other findings reinforce the view that the effects of CB-IB mergers are related to the
CB-IB’s ability to use its private information from lending in its new area of business. First,
when the borrower is more informationally transparent, such as when the firm is investment-
grade rated or has multiple lending relationships, CB-IB mergers do not have a significant effect
on the decision to switch lenders, underwriter selection, or interest rates. Second, commercial
banking mergers between the fifty largest commercial banks, mergers in which the bank does not
gain a new area of business to use information, do not have a significant effect on either the
likelihood a borrower will switch lenders or on the pricing of loan contracts. In addition, the
analysis of commercial banking mergers provides additional evidence that the effects of CB-IB
mergers are not driven by general consolidation in the commercial banking industry.

5
While there is a vast literature on banking mergers, there has been little research on the
direct effects of banking mergers on firm-bank relationships.4 One exception is Sapienza (2002),
who uses individual loan contracts to analyze the effects of commercial bank mergers on loan
interest rates and lending relationships between commercial banks and Italian small business
borrowers. My focus is quite different than Sapienza (2002). I provide the first analysis of the
effects of mergers between commercial banks and investment banks on firm-bank relationships.
Also, I concentrate on relationships between banks and medium to large firms, which have
largely been ignored in studies of relationship banking.5
This paper also adds to the literature on the implications of combining commercial
banking with investment banking.6 Much of the empirical literature that examines when banks
lend and underwrite investigates the effect of bank lending, and the private information
contained therein, on the banks’ underwriting of public securities. These effects are ascertained
through the pricing of underwritten securities (see e.g. Puri (1996), Gande et al. (1997),
Schenone (2004)) or through long run performance (see e.g. Ang and Richardson (1994),
Kroszner and Rajan (1994), Puri (1994), Benzoni and Schenone (2004)). An important but less
explored issue is the reverse question: how does the ability of banks to provide investment
banking services influence commercial banks’ core business – commercial lending? Drucker
and Puri (2004b) provide some analysis on this topic. They show that the ability to underwrite
allows banks to lend concurrently with firms’ securities issuances, which produces substantial
benefits for both issuers and banks. In this paper, I also provide empirical evidence on the
impact of underwriting opportunities on lending. My findings underscore that the ability to
underwrite allows banks to forge new lending relationships with borrowers that are likely to
benefit from bank underwriting, and in certain instances, charge higher loan interest rates.
The remainder of this paper is organized as follows. Section 2 describes the data and
sample selection process. The major empirical findings are presented in Section 3. Section 4
concludes.
4 The research on commercial banking mergers tends to focus on the ex-post performance of merged banks, wealth effects for bank shareholders, and the effects on the supply of credit to small businesses. See Berger, Demsetz, and Strahan (1999) and Walter (2004) for excellent reviews of the literature and discussion of the causes and consequences of banking consolidation. 5 See Boot (2000) for a survey of the relationship banking literature. 6 See Drucker and Puri (2004a) for a detailed review of the literature on the interaction between commercial banks and capital markets.

6
2. Data and Sample Selection
This paper analyzes mergers between commercial banks and investment banks that occur
between 1997 through 2002. Largely due to the Glass Steagall Act, there were no significant
mergers between U.S. commercial banks and investment banks prior to 1997. However, in late
1996 and early 1997, the Federal Reserve relaxed major provisions of the Act, substantially
increasing the amount of revenue that commercial banks could earn from investment banking
activities and relaxing firewalls between the commercial bank and its investment banking
division. Mergers between commercial and investment banks followed soon after. In almost all
cases, commercial banks did not have highly active investment banking practices prior to their
mergers with investment banks, so most companies did not have the ability to use the same
institution for both commercial and investment banking until 1997.7 I identify mergers between
commercial banks and investment banks using SDC Platinum’s mergers and acquisitions
database. To ensure that I capture mergers with viable underwriters, I only include mergers
where the investment bank had underwritten at least one equity or bond offering during the three
years prior to the merger, which can be determined by examining SDC Platinum’s new issues
database. Table 1 provides a listing of the U.S commercial banks that merge with investment
banks and the dates of the mergers. There are 17 such mergers with the first occurring in
January 1997 and the last in July 2001.
I construct a unique database of firm-bank lending relationships using four additional
databases with some data sources matched by hand. All variables are defined in detail in
Appendix A. I collect data on individual loan contracts from LPC DealScan for the period
January 1992 through December 2002, where the lender is one of the fifty largest U.S.
commercial bank lenders of commercial and industrial (“C&I”) loans as of the end of 1996 based
7 Prior to 1997, commercial banks had limited success with internally created investment banks. In underwriting public equity, commercial banks only achieved a 2% market share by dollar volume in 1996 (Gande, Puri, and Saunders (1999)). According to Securities Data Corporation, in the non-financial, non-convertible debt market, only JP Morgan achieved a significant market share by 1996 (7.3% by dollar volume) and no other commercial bank had more than 1.5% of the market share. Cadette (1996) attributes this to Glass-Steagall restrictions that were “crimping the ability of American commercial banking organizations to meet their customers’ needs.” In the empirical tests, I treat J.P. Morgan as a CB-IB, but the results are economically and statistically similar if I treat it as a pure commercial bank.

7
on data from the FDIC Reports of Condition and Income (“Call Reports”).8 To determine the
top-50 banks, I consolidate the C&I loans of each of the individual commercial banks owned by
the same banking organization, as indicated by the highest level of the organizational structure.
LPC DealScan collects its loan data from SEC filings, large loan syndicators, and a staff of
reporters, and the majority of companies in the LPC database are medium to large firms. For
each lending facility, LPC provides the identities of the borrower and lender, the borrower’s
industry through the standard industrial classification (“SIC”) code, the Standard and Poor’s
long-term credit rating of the borrower, the contract active and maturity date, the notional value
of the facility, the type and purpose of the lending facility, as well as price and some other non-
price terms of each loan. However, LPC does not provide borrower-specific financial
characteristics that are likely to affect a firm’s choice of bank and loan pricing. Since LPC does
not provide a reliable identifier that can be used to match the loan data with other sources, I
supplement the loans with financial data by hand matching the firms in LPC to Compustat
Industrial Annual by using the borrower name. Using data from the year prior to the lending
facility active date, I construct measures of firm size (logarithm of assets), profitability (return on
assets), and leverage (debt-to-asset ratio). All notional figures are deflated by the GDP implicit
price deflator so that the values are in January 1992 dollars.
I use a subset of these lending contracts in the empirical analysis. Since I wish to study
industrial firms, I remove financial firms (companies with a one-digit SIC code of six). Also, I
remove syndicated loans where there is more than one lead bank involved in the transaction.9
Removing these loans ensures that I accurately capture the lender that sets the loan rate and
interacts with the borrower. Also, this restricts the sample to relationship-type loans, as larger
syndicated loans can be viewed as transactional in nature (Boot and Thakor (2000)).10 Finally, I
remove loans to borrowers whose first lending relationship forms during the merger period.
Unlike borrowers that have lending relationships prior to the merger period, these firms can
choose an initial lender that has investment banking capabilities. This may bias the results
8 These banks account for 73% of the commercial and industrial loan market at the end of 1996. By comparison, the next 50 banks only account for only 8% of the market. All mergers between commercial banks and investment banks involve banks ranked in the top-50. 9 For syndicated loans, DealScan identifies lead banks via titles that include the words “arranger” and “agent,” and less active members with titles that include the words “manager” and “participant.” 10 The downside of leaving out the larger syndicated loans is that I may not pick up all of a firm’s relevant lending relationships. If so, then this will bias against finding effects based on the concentration of a borrower’s lending activity.

8
towards finding that borrowers are more likely to borrow from a merged commercial-investment
bank and also that borrowers are more likely to use their lender as underwriter. This restriction
leaves a sample of loans to firms that borrow from the top-50 banks during the five years prior to
the merger period of January 1997 through December 2002 and also receive a subsequent loan
from at least one of these banks during the merger period. There are 864 “existing borrowers”
and 3,349 loans with the sample banks from 1992 through 2002. Of the existing borrowers, 607
firms continue to borrow from the same bank. There are 2,245 loans between banks and their
“continuing borrowers” between 1992 and 2002.
In order to isolate the effects of the mergers, I control for factors that are likely to
influence a firm’s selection of bank or alter the pricing of loan contracts. Prior literature
suggests that the strength of a firm’s lending relationships can influence both the selection of
lender and the pricing of loans. Theoretically, strong lending relationships may allow banks to
exert monopoly power over borrowers and charge higher interest rates (Sharpe (1990), Rajan
(1992)). On the other hand, stronger relationships could result in a higher probability of
selection and lower interest rates for the borrower if there are scale economies in information
production and banks pass along these savings (see e.g. Boot and Thakor (1994), Petersen and
Rajan (1994)).11 To capture the strength of the borrower’s lending relationships, I determine if
the borrower has formed multiple lending relationships between January 1992 and the date of the
loan. When tracking lending relationships, I account for mergers between commercial banks by
assuming that the surviving bank acquires all of target bank’s prior lending relationships.
The reputation of the bank can also be an important factor. I capture reputation through
the bank’s market share of total domestic commercial and industrial loans as of the end of the
year prior to loan. When a merger between commercial banks occurs, I use the combined market
share of the banks for the remainder of the year. For example, Fleet Bank merged with
BankBoston in September 1999. At the end of 1998, Fleet Bank had a loan market share of
3.2% and BankBoston’s loan market share was 2.4%. For each loan made by the consolidated
bank between the merger date and the end of 1999, I use a market share of 5.6% for the
11 The empirical literature on loan pricing is mixed. For example, Angelini, Di Salvo and Ferri (1998) and Degryse and van Cayseele (2000) find evidence consistent with banks charging higher rates to borrowers with strong relationships while Berger and Udell (1995) and Bharath et al. (2004) find stronger lending relationships result in lower borrowing costs.

9
consolidated bank. Also, using the combined market share helps control for any effects that
could be attributable to increases in bank size from commercial bank mergers.
Further, I create variables to capture market-wide influences on interest rates. Fama and
French (1989) show that business conditions are closely related to the bond market credit spread
and term spread. From the Federal Reserve Statistical Release H.15, I construct the credit spread
as the monthly difference between Moody’s seasoned Baa-rated corporate bonds and Aaa-rated
corporate bonds. For the term spread, I use the monthly difference between the 10-year Treasury
bond and the 6-month Treasury bill rate.
Over the sample period, there are changes in loan market concentration both due to
commercial banking mergers and also for other reasons, such as de novo entry of new
commercial banks. As some studies show that more concentrated markets have higher loan rates
(see e.g. Hannan (1991); Petersen and Rajan (1995)), it is important to control for this effect.
These studies focus on small business lending and use the concentration of deposits at the local
level, which is captured by the Herfindahl index of deposit market share in the company’s
metropolitan statistical area. Since the companies in this study are medium to large firms that
have access to a larger lending market, I use the concentration of the lending market at the
national level, computing the Herfindahl index of domestic commercial & industrial loans from
commercial banks in the Call Reports as of the end of the year prior to the year of the loan.12
Also, in order to study borrowers’ choice of underwriter, I collect U.S. non-convertible
public debt issues made by continuing borrowers from SDC Platinum’s new issue database.
There are 173 debt issues by these borrowers that occur after their commercial bank merges with
an investment bank. Again, I create variables for factors that are likely to affect underwriter
selection. Prior research shows that underwriter reputation is an important determinant of a
firm’s choice of underwriter (see e.g. Booth and Smith (1986), Carter and Manaster (1990)). I
proxy for reputation using the underwriter’s market share in the non-convertible public debt
market in the year prior to the debt issuance. For each year, I compute each underwriter’s
12 The Herfindahl index is the sum of squared market shares, multiplied by 1000. To calculate the Herfindahl index, each commercial bank is given a market share by consolidating all C&I loans by its individual chartered banks in the Call Report. I also calculated the Herfindahl index of deposit market share at the metropolitan statistical area level using the FDIC Summary of Deposits and at the regional level using both the Summary of Deposits and the Call Reports, but these variables were almost always statistically insignificant in loan pricing models and in many cases, had incorrect signs.

10
market share by adding the principal amounts of all U.S. non-convertible public debt issues
where the bank was a lead underwriter and dividing this total by the principal amounts of all U.S.
non-convertible public debt issues during the year. When a merger between potential
underwriters occurs, I use the combined market share of the underwriters for the remainder of the
year. Also, prior underwriting relationships have been shown to be important in underwriter
selection (see e.g. Baker (1990), Crane and Eccles (1993), Ljungqvist, Marston, and Wilhelm
(2004), Drucker and Puri (2004b)). I identify all public debt underwriting relationships for each
issuer between January 1992 and the date of the debt issuance. When underwriters merge, I
assume that the acquiring institution acquires all of the target’s prior underwriting relationships.
3. Methodology and Results
This section provides an empirical analysis of the effects of mergers between commercial banks
and investment banks on firm-bank relationships and loan pricing. The mergers provide
commercial banks with the ability to use information from lending relationships in investment
banking, which could allow the bank to generate higher security prices by reducing information
asymmetries between the firm and public markets. The mergers may also produce efficiency
gains due to informational economies of scope. If firms expect to receive future benefits from
bank underwriting, then having a lending relationship with a bank that can provide investment
banking services may be particularly important. I examine this possibility in Section 3.1 by
estimating the likelihood that a firm switches to a CB-IB. Also, after their bank is involved in a
CB-IB merger, firms may be likely to choose their bank rather than other underwriters when
issuing public securities to capture these benefits. This possibility is studied in Section 3.2. The
revealed preference by firms for CB-IBs as opposed to stand-alone financial intermediaries will
help determine which types of firms value relationships with CB-IBs. In Section 3.3., I estimate
the effects of CB-IB mergers on the interest rates (inclusive of fees) that banks charge to their
continuing borrowers.
A central issue in the analysis is whether any findings that I attribute to CB-IB mergers
are due to the bank being able to use its private information in investment banking. Therefore, in
all tests, I isolate borrowers for which the bank’s private information is likely to be valuable. For
this study, I focus on junk rated borrowers and firms that have single lending relationships. I
11
select junk rated borrowers because prior empirical evidence suggests that banks can certify the
quality of lower rated borrowers to public markets (see e.g. Puri (1996), Gande et al. (1997)).
This could be the result of these firms’ being closer to financial distress than investment-grade
borrowers, so banks’ private information about these firms’ financial states will be particularly
valuable to investors. Also, junk rated firms are likely to have higher costs of due diligence so
re-using information may create large efficiency gains (see e.g. Drucker and Puri (2004b)). I
choose borrowers with single lending relationships because banks are likely to be more
important in certifying these firms as opposed to firms that maintain multiple relationships.
Banks have more private information about their single relationship borrowers and these
borrowers are more likely to be less known to outside markets.
3.1. Switching Lenders
This section examines the effect of CB-IB mergers on borrowers’ lending relationships. For
informationally opaque borrowers, having a lending relationship with a CB-IB may produce
benefits when the firm accesses the public markets. Therefore, borrowers may seek lending
relationships with banks that have merged with investment banks. I examine this possibility by
comparing the likelihood of starting a new lending relationship with a CB-IB for firms that do
not have an existing CB-IB lender with firms that do have an existing CB-IB lender, controlling
for other factors that could affect the decision to switch lenders. If firms that do not have
existing lending relationships with CB-IBs are more likely to switch to a CB-IB, then this
implies that benefits of a CB-IB lending relationship outweigh the switching costs associated
with starting a new relationship. The revealed preference for CB-IB relationships would be
consistent with borrowers placing a higher value on lending relationships with CB-IBs.
One important data issue arises when examining a borrower’s decision to switch lenders.
There are some instances when a lender provides multiple lending facilities to the borrower on
the same day. Since these loans are presumably negotiated at the same time, I consider the set of
loans to represent a single interaction between the firm and bank. Therefore, I use the “loan
deal” as the unit of analysis, where a loan deal is defined as one or more loans to a borrower by
the same lender on the same date. Table II provides summary statistics for the 1,259 loan deals
between existing borrowers and the top-50 banks over the merger period of January 1997

12
through December 2002. Borrowers tend to be medium sized, with a median asset size of $261
million. The majority of borrowers have a single lending relationship at the time of the loan deal
and 18 percent of the loan deals involve a junk rated borrower. Interestingly, relationships are
quite durable, with borrowers selecting a prior lender in nearly 75 percent of loan deals.
3.1.1. Multinomial Logit Models
I use a multinomial logit model in order to examine borrowers’ decision to either borrow again
from its prior lenders or choose a new CB-IB.13 This model allows the borrower to choose from
among multiple choices based on factors that are specific to the firm, the potential choice, and
the relationship between the firm and its prior lenders. Specifically, I estimate the multinomial
logit model:
εβββββ
ββββ
++++++
+++=
INDFIRMFINF
JUNKIGRADEMULTREL
CBIBSHARELOANMKTSHRELPRIORCBIBRSWITCHLEND
I654
3210 .
(1)
The dependent variable, SWITCHLEND, captures the borrower’s choice from three alternatives:
(i) “Prior Lender,” which is any bank that that has provided a loan to the firm between January
1992 and the loan date; (ii) “New CB-IB,” which is a commercial bank that has merged with an
investment bank and has not provided a loan to the firm between January 1992 and the loan date;
and, (iii) “New CB,” which is a commercial bank that has not merged with an investment bank
and has not provided a loan to the firm between January 1992 and the loan date. For
identification purposes, one of these categories must be specified as the base category, which I
choose to be “Prior Lender.” The estimation will produce two coefficients for each of the
independent variables: one will capture the effect of the variable on the probability of choosing
“New CB-IB” as opposed to “Prior Lender,” and the other coefficient will reflect the effect of
the variable on the probability of selecting “New CB” instead of “Prior Lender.”14
13 Greene (2000) provides an excellent discussion of models for choices between multiple alternatives. A multinomial logit model provides the relative probabilities of each of the alternatives and can be thought of as jointly estimating a series of logit models for each pair of alternatives. 14 To examine the effect of any of the independent variables on the choice between “New CB-IB” and “New CB,” one would just calculate the differences in the coefficients that are estimated when “Prior Lender” is the base category.

13
Of interest is the effect of PRIORCBIBREL, which indicates that the borrower has a
relationship with a commercial bank that has merged with an investment bank prior to the loan
deal, on the likelihood that the borrower switches to a new CB-IB. A negative coefficient on
PRIORCBIBREL would suggest that a borrower is more likely to switch to a CB-IB when it does
not have a prior lending relationship with a CB-IB. This would be consistent with the hypothesis
that the benefits of a CB-IB lending relationship outweigh the switching costs associated with
starting a new relationship.
In addition, I modify the model to account for differences in the information opacity of
borrowers by including interactions between PRIORCBIBREL and the credit rating variables
IGRADE, JUNK, and NR, which indicate if the firm is investment-grade rated, junk rated, or not
rated at the loan date. As previously argued, junk rated borrowers may benefit substantially from
a lending relationship with a CB-IB. A negative coefficient on JUNK X PRIORCBIBREL in
switching to a new CB-IB would be consistent with this claim. To further isolate the importance
of banks’ private information, I split the sample between firms that have single lending
relationships and firms that have multiple lending relationships at the time of the loan deal.
The model contains other variables that may affect a borrower’s choice. LOANMKTSHR,
the maximum market share of C&I loans of the borrower’s prior lenders in the year prior to the
loan, is used to proxy for the bank’s reputation. LOANMKTSHR is expected to be negatively
related to the likelihood of switching to a new lender. LOANMKTSHR is adjusted for
commercial bank mergers, so this variable also controls for the effects of general commercial
banking consolidation. Also, for loan deals in the later part of the sample, there are more
commercial banks that have previously merged with investment banks, which by itself, makes it
more likely for borrowers to choose the banks that are classified as “New CB-IB.” To account
for this aspect of the sample, I include CBIBSHARE, which is a measure of CB-IB merger
activity that is the sum of the loan market shares of CB-IBs at the end of the month prior to the
loan deal.15 Larger values of CBIBSHARE are expected to be associated with a higher likelihood
of a borrower selecting “New CB-IB” and a lower probability of selecting “New CB.” The
model includes MULTREL, which indicates if the borrower has multiple lending relationships
with the top-50 commercial banks at the time of the loan deal, IGRADE and JUNK, as well as
15 In a separate estimation, I replace CBIBSHARE with year fixed effects. The results are statistically and economically similar.

14
FIRMFIN, a vector of firm financial characteristics that consists of the firm’s size (logarithm of
assets), profitability (return on assets), and leverage (debt-to-asset ratio) during the year prior to
the loan. Industry fixed effects are also included in the model (IND). Since observations for the
same company may be correlated, all models are estimated with clustered standard errors.
3.1.2. Results
Table 3 presents the results of estimating equation (1).16 Panel 1 provides the effects of the
variables on the probability of switching to a new CB-IB as opposed to borrowing again from a
prior lender, while Panel 2 shows the effects of the variables on switching to a pure commercial
bank instead of choosing to borrow from a prior lender. As for the control variables, the
coefficients on LOANMKTSHR are negative and significant at the 1% level in most
specifications, indicating that borrowers that have lending relationships with banks with higher
market shares are less likely to switch lenders. For the full sample of loan deals, all else equal, a
one standard deviation (3.61 percent) increase in market share decreases the odds that a borrower
starts a new lending relationship with a CB-IB by 1.4 times. As expected, the coefficients on
CBIBSHARE indicate that a larger total market share for CB-IBs results in a higher likelihood of
borrowers’ switching to a CB-IB and a lower probability of switching to a CB.
The first column provides results for estimating model (1) using the full sample of loan
deals. The insignificant coefficients on PRIORCBIBREL indicate that having a prior lending
relationship with a CB-IB does not effect a borrower’s decision to switch lenders. Similar
effects are found in the third and fifth columns, where model (1) is estimated separately for
borrowers with single lending relationships and borrowers with multiple lending relationships.
Significant effects emerge when PRIORCBIBREL is split according to the credit rating of
the borrower. The results in the second column of Panel 1 show that the coefficient on JUNK X
PRIORCBIBREL is significantly negative at the 5% level, which indicates that junk rated
borrowers are more likely to switch to a CB-IB when they do not have prior lending relationships
with CB-IBs. The difference is economically meaningful, as a junk rated borrower that has prior
16 An assumption underlying the multinomial logit model is the independence of irrelevant alternatives (“IIA”). This means that adding or deleting potential choices does not affect the odds among the remaining outcomes. Using formal tests of IIA developed by Hausman and McFadden (1984), in all models, I cannot reject the assumption of IIA.

15
CB-IB lending relationships has a 4.2 percent probability of establishing a new relationship with
a CB-IB while a junk rated borrower that does not have a prior lending relationship with a CB-IB
switches 10.3 percent of the time. For the single relationship sample, the fourth column of Panel
1 shows that the coefficient of JUNK X PRIORCBIBREL is more negative than in the full sample
and also statistically significant (p-value = 5.6%). Holding all other variables constant, the odds
of a junk rated borrower with a single lending relationship switching to a new CB-IB is 3.00
times greater when the borrower’s lender is a pure commercial bank relative to when the lender
is a CB-IB. These results suggest that for junk rated borrowers, the benefits of borrowing from a
CB-IB outweigh the costs of switching from a pure commercial bank. Importantly, the results in
the second and fourth column of Panel 2 show that for the full sample and for borrowers with
single lending relationships, there is no significant effect of JUNK X PRIORCBIBREL on the
likelihood of switching to a pure commercial bank. This suggests that the ability of the new
lender to provide investment banking services is important in firms’ decision to start a new
lending relationship.
In contrast to the results for junk rated firms, having a prior relationship with a CB-IB
does not have a significant effect on the likelihood that an investment-grade firm switches to a
CB-IB. Similar results are found for borrowers with multiple lending relationships, as shown in
the fifth and sixth columns of Panel 1. These results are consistent with information opacity
playing a vital role in borrowers’ decision to switch to CB-IBs. Interestingly, for not rated firms,
having a prior lending relationship with a CB-IB does not affect their decision to continue to
borrow from their prior lenders. One explanation is that while these borrowers are
informationally opaque, not rated borrowers are also less likely to access the public markets.
This implies that a high likelihood of using investment banking services is important in the
decision to establish a new lending relationship with a CB-IB.
Overall, the results suggest that lending relationships with CB-IBs are valuable to firms
that are likely to benefit from the CB-IB’s ability to use its private information from lending in
investment banking. This is supported by junk rated borrowers, particularly ones that have
single lending relationships, being significantly more likely to establish a new lending
relationship with a CB-IB when they do not have a prior relationship with a CB-IB. For these
informationally opaque firms, the results support the hypothesis that the benefits of borrowing
from a CB-IB outweigh switching costs. There is additional support for the claim that borrowers

16
switch to CB-IBs due to their ability to use private information from lending in investment
banking. For informationally transparent borrowers and borrowers that have a low likelihood of
needing investment banking services, a prior lending relationship with a CB-IB does not effect
the decision to switch to a CB-IB.
3.1.3. Robustness – Commercial Banking Mergers
To further examine if the results are likely due to the CB-IB’s ability to use information in
investment banking, I perform additional tests using a sample of commercial banking mergers
between the fifty largest commercial banks (“CB-CB mergers”). It is possible that some of the
previous results are driven by general consolidation among commercial banks because some of
the commercial banks that are involved in CB-IB mergers also merge with other commercial
banks during the sample period. While I control for the increases in size of the lender when it
merges with another commercial bank through LOANMKTSHR, it is possible that CB-CB
mergers have other effects that can influence the likelihood of switching. Also, studying the
effects of CB-CB mergers provides a useful comparison with CB-IB mergers because the
commercial bank does not gain another line of business through CB-CB mergers.
In order to address these issues, I examine if CB-CB mergers that involve a borrower’s
prior lenders affects the probability that a borrower switches to a new bank. To proceed, I
estimate equation (1) with a few changes. First, I alter the dependent variable, SWITCHLEND,
to be an indicator variable that equals one if the firm selects any commercial bank that has not
provided a loan to the firm between January 1992 and the loan date. I use this more
parsimonious specification because I find little reason for a merger between commercial banks to
have different influences on the likelihood that a borrower establishes a new lending relationship
with a CB-IB instead of a pure commercial bank.17 Also, I replace PRIORCBIBREL with
CBMERGE, which indicates that the firm has a prior lender that has merged with another top-50
commercial bank prior to the loan deal. Finally, I replace CBIBSHARE with year fixed effects
(YR).
17 In support, when I use the original definition of SWITCHLEND, a comparison of choosing “New CB” vs. “New CB-IB” reveals that the merger variables are highly insignificant and also insignificantly different across all three categories.

17
The results of the probit estimations are found in Table 4. In the first six columns, I use
loans from all of the top-50 commercial banks. In all estimations, CBMERGE is highly
insignificant. Also, the interaction terms between these variables and the credit rating variables
IGRADE, JUNK, and NR are also insignificant. These results support the claim that the effects
on firm-bank relationships that are identified in Section 3.1.2. are not simply due to general
banking consolidation.
One potential problem with using the full sample of loans to examine differences between
mergers that allow the bank to use information in a new line of business (CB-IB mergers) and
mergers that do not provide a new product line (CB-CB mergers) is that some of the banks in the
sample are involved in both types of mergers. To address this problem, I re-estimate the model
using only loan deals to borrowers that do not have relationships with banks that merge with
investment banks during the sample period. The results in the seventh and eighth columns again
show that commercial bank mergers do not affect the probability of switching to a new lender.
3.2. Underwriter Selection
In this section, I further explore the effects of CB-IB mergers on firm-bank relationships by
examining whether continuing borrowers are likely to select their CB-IB as public debt
underwriter. To do so, I examine these borrowers’ selection of underwriter in their 173 non-
convertible public debt issues that occur between their bank’s merger date and June 2004.
Again, I focus on junk rated borrowers and firms with single lending relationships, for whom the
banks are more likely to be able to create efficiency gains from informational economies of
scope or reduce information asymmetries between the firm and investors. These potential
benefits may increase the likelihood that these borrowers use their CB-IB as underwriter when
they issue public securities.
3.2.1. Logit and Conditional Logit Models
To model firms’ choice of underwriter, I begin with standard logit models. In the models, I
allow each issuer to select between twelve choices: its lending CB-IB, each of the top-10
underwriters of U.S non-convertible public debt, and a single choice of any other underwriters

18
that are not ranked in the top-10.18 The top-10 underwriters are determined on a yearly basis,
based on the underwriter’s dollar market share of the U.S. non-convertible public debt market in
the year prior to the issuance.19 The top-10 debt underwriters account for approximately 90
percent of the total dollar amount of underwritten debt issues.
The main logit model is specified as follows:
εββββ
βββββ
+++++
++++=
YRINDFIRMFINF
IGRADE
MULTRELPRIORUNDDEBTMKTSHRLENDERSELUND
YI5
43210 ,
(2)
where SELUND indicates if the potential underwriter is selected as a lead manager for the issue.
The relevant independent variable is LENDER, which is one if the potential underwriter is the
issuer’s CB-IB in the continuing lending relationship. A positive coefficient of LENDER
signifies that the lending relationship increases the likelihood of being selected as lead debt
underwriter.
To examine if the lending relationship has a stronger influence in underwriter selection
when the bank’s private information is likely to be more valuable in underwriting, I modify the
model to include interactions between LENDER and the credit rating variables, IGRADE and
JUNK, which identify if the issuance is investment-grade rated or junk rated, respectively. Also,
in a separate estimation, I include interactions between LENDER and the lending relationship
variables, MULTREL and SINGREL, where MULTREL indicates that the borrower has multiple
lending relationships with the top-50 banks at the time of the issuance, and SINGREL indicates
that the borrower has a single lending relationship with a top-50 bank at the time of issuance.
The model contains two additional variables that are very likely to influence selection.
DEBTMKTSHR, the underwriter’s market share in the U.S. non-convertible public debt market
based on total dollars lead underwritten in the year prior to the issuance date, is used to proxy for
reputation. Larger values of DEBTMKTSHR are expected to be associated with a higher
likelihood of selection.20 Also, previous research indicates that underwriting relationships are
18 Similar models have been used to study underwriter selection (see e.g. Bharath et al. (2004), Drucker and Puri (2004b), Ljungqvist, Marston, and Wilhelm (2004)) and lender choice (Hellmann, Lindsey, and Puri (2004)). 19 If the lending CB-IB happens to be ranked in the top-10, then these issuers have 11 potential choices. 20 It is possible that some underwriters specialize in underwriting junk rated issues while others do not play a large role in this market. In unreported estimations, I split DEBTMKTSHR in two variables that separately capture the underwriter’s market share of investment-grade rated issues and the underwriter’s market share of junk rated issues.

19
very durable (for recent empirical evidence, see Drucker and Puri (2004b), Ljungqvist, Marston,
and Wilhelm (2004)). To capture this effect, the model includes PRIORUND, which indicates
that the issuer and potential underwriter have a prior debt underwriting relationship between
1992 and the issue date. The logit model also includes a number of additional controls for
borrower specific characteristics: MULTREL; IGRADE; FIRMFIN, which is a vector consisting
of the firm’s size (logarithm of assets), profitability (return on assets), and leverage (debt-to-asset
ratio) during the year prior the issuance; and IND, which are industry fixed effects using the one-
digit SIC code of the issuer. Also included is YR, which are year fixed effects. Since
observations for the same issuance may be correlated, all logit models are estimated with
clustered standard errors.
In addition, I repeat the three estimations using a conditional logit model. This is a more
powerful estimation method because it includes firm fixed effects, which controls for all firm
characteristics at the time of the issuance instead of the few variables included in the logit model.
In the conditional logit model, the issuer controls (MULTREL, IGRADE, FIRMFIN, IND) as well
as YR are removed and replaced with the firm fixed effects. Therefore, there are only three
remaining variables: the lending relationship indicator (LENDER), underwriter market share
(DEBTMKTSHR), and prior underwriting relationships (PRIORUND).
3.2.2. Results
The results of estimating the logit and conditional logit models are displayed in Table 5. As
expected, both the underwriter’s market share and the existence of a prior underwriting
relationship are highly significant in all estimations. For the base estimation that is displayed in
the first column, all else equal, a one standard deviation (5.40 percent) increase in
DEBTMKTSHR raises the odds that the underwriter will be selected by 1.24 times. Also, the
odds that an issuer will select a potential underwriter as a lead underwriter are 4.64 times greater
when the firm and underwriter have a prior underwriting relationship.
The results of logit model (2) in the first column show that the coefficient of LENDER is
significantly positive (p-value of 5.8%). This indicates that after controlling for other factors that
The effect of LENDER and the associated interaction terms are statistically and economically similar to the results that are presented in Table 5.

20
significantly influence underwriter selection, the lending relationship significantly increases the
probability of being selected as a lead manager. This is consistent with CB-IB mergers allowing
commercial banks to expand the scope of their relationships and also, by revealed preference,
with firms benefiting from using their lending bank as underwriter. The conditional logit
estimation in column four supports these findings.
Importantly, the evidence suggests that the positive effects of lending relationships are
concentrated among firms where the bank’s private information is likely to be more important in
reducing information asymmetries.21 The results of the logit model in column two and the
conditional logit model in column five both show that the lending relationship significantly
increases the probability of selection when the issue is junk rated (at the 1% level) but does not
have a significant effect for investment-grade issues. Based on the results in the second column,
for junk rated borrowers, the odds of selecting a potential underwriter as a lead underwriter are
4.10 times greater if the underwriter is the issuer’s CB-IB lender, holding all other variables
constant. Also, a t-test for differences between junk rated issues and investment-grade issues is
significant at the 1% level.
The estimations of the logit model in column three and the conditional logit model in
column six both show that the positive effect of the lending relationship on underwriter selection
is found for issuers with single lending relationships (at the 5% level), but there is no significant
effect for issuers with multiple lending relationships. Based on the results in the third column,
for borrowers with single lending relationships, the odds of selecting a potential underwriter as a
lead underwriter are 1.96 times greater if the underwriter is the issuer’s CB-IB lender, holding all
other variables constant. These results are consistent with issuers’ choosing their bank as
underwriter when the bank has more private information, which can enhance the certification
ability of the lender and reduce costs due to informational economies of scope.
The findings of this section, in combination with the analysis in Section 3.1., show that
CB-IB mergers have a distinct effect on relationships between banks and informationally opaque
firms. Junk rated borrowers, particularly those with single lending relationships, are more likely
21 The importance of the bank’s ability to reduce information asymmetries in determining the impact of lending relationships on underwriter selection has not been emphasized in previous studies that examine if lending relationships affect the likelihood of winning underwriting mandates (Bharath et al. (2004), Drucker and Puri (2004b), Ljungqvist, Marston, and Wilhelm (2004), Yasuda (2004)).

21
to start a new lending relationship with a CB-IB when they do not have a prior relationship with
a CB-IB. Also, when these same types of firms continue to borrow from their bank, they are
more likely to choose their CB-IB as debt underwriter, thereby expanding the firm-bank
relationship. Overall, through revealed preference, the results indicate that informationally
sensitive firms have higher value for relationships with CB-IBs. This is consistent with the view
that CB-IB mergers provide banks with the ability to use valuable private information in
investment banking, which leads to benefits for informationally sensitive firms.
3.3. The Pricing of Loan Contracts In Sections 3.1. and 3.2., I provide evidence that suggests that informationally opaque firms have
higher value for CB-IB relationships. Now, I examine the effects of CB-IB mergers on the
pricing of loan contracts. Interest rates may increase for two related reasons. First, if
commercial banks have an information monopoly over informationally opaque borrowers, then
after CB-IB mergers, the CB-IB may charge higher interest rates to share in some of the
expected future gains that can emerge from the CB-IB’s ability to resolve information
asymmetries when underwriting. This type of rent extraction is described in Puri (1999), who
shows theoretically that under certain conditions, CB-IB’s ability to generate higher security
prices in underwriting can allow the CB-IB to extract some of the additional value. Second,
CB-IBs may charge higher interest rates to profit from a larger adverse selection problem that
may be caused by the merger. The “lemons problem” arises from the potential benefits to firms
from using the CB-IBs for both lending and underwriting, which could cause other financial
intermediaries to be more skeptical of the quality of companies that do not use their CB-IB for
both services. This can increase the switching costs for informationally sensitive firms that are
likely to access the public capital markets, and the merged CB-IB can have a larger information
monopoly over these firms than a pure commercial bank would have, which can allow for
additional rent extraction (see e.g. Rajan (1996, 2002)).
However, if firms can successfully convey their quality to other banks, then information
monopolies will not be present and rent extraction should not occur. Competition between CB-
IBs should prevent banks from charging higher interest rates in order to share in potential
benefits that the firm may receive from future public security issuances. Also, there would not

22
be a lemons problem, so interest rates would not increase following CB-IB mergers. Firms may
actually receive lower interest rates if informational economies of scope produce lower costs for
the bank and competition causes CB-IBs to pass these savings along to firms.
To study the effects of CB-IB mergers on the pricing of loan contracts, I analyze the
loans to firms with existing relationships who continue to borrow from their bank during the
merger period. There are 2,245 loans between these 607 firms and their banks between 1992 and
2002. These loans are from banks that are involved in CB-IB mergers as well as similar banks
that do not merge. By including banks that are not involved in mergers, I can examine if any
effects that are identified during the merger period are common to all banks or just to the
merging banks. The sample construction is similar to Sapienza (2002), who examines the effect
of commercial bank mergers on small Italian companies. Summary statistics are presented in
Table 6.
The sample of loans to continuing borrowers may suffer from selection problems. First, a
number of borrowers switch to other banks, and these borrowers may be systematically different
than the continuing borrowers. In the loan pricing model, I include many observable
characteristics and firm fixed effects, which capture unobservable firm characteristics, so if the
borrower’s switching decision is based on the observable factors or on unobservable firm
characteristics, then the coefficients will not be biased. Still, I formally account for the
possibility of sample selection bias by using the full sample of 3,349 loans to the 864 existing
borrowers and employing a two-stage procedure developed by Heckman (1979).22 The results
(not reported) are statistically and economically similar to the results that will be presented in
Section 3.3.2. Second, it is possible that the continuing borrowers of the banks that do not merge
with investment banks are different than the borrowers of the merging banks, potentially due to
different needs for using a commercial bank for investment banking services. Again, the
observable control variables and firm fixed effects should mitigate sample selection biases.
However, I estimate the loan pricing model using only those loans from banks that merge with
investment banks, and the results for all estimations (not reported) are statistically and
economically similar to those that will be reported in Section 3.3.2. 22 The first stage uses a probit model to estimate the probability of continuing to borrow. The estimates of the probit model are used to create the inverse mills ratio, which is included when estimating the loan pricing model. This produces consistent estimates of the parameters. The covariance matrix is adjusted in accordance with Heckman (1979).

23
3.3.1. Fixed Effects Regressions
I estimate the following loan pricing model:
εβββ
βββββ
+++++
++++=
ifPOSTP
ECONOMYE
LENDRELL
FIRMFINF
RATINGR
CONTRACTC
IBMERGESPREADY
1996
10 .
(3)
This model attempts to isolate the effect of CB-IB mergers by controlling for factors that
could influence the yield spread of the loan. The structure is similar to models used in
examining both loan yield spreads (see e.g. Hubbard, Kuttner, and Palia (2002)) and bond yield
spreads (see e.g. Gande, Puri and Saunders (1999), Penas and Unal (2004)).
The dependent variable is YSPREAD, the yield spread on the loan, measured by the “all-
in spread drawn.”23 The all-in spread drawn provides a standard measure of the overall cost of
the loan, taking into account one-time and recurring fees, quoted in basis points above LIBOR.
The key independent variable is IBMERGE, which is an indicator variable that is one at any date
after the lending bank merges with an investment bank. A positive (negative) coefficient of
IBMERGE would indicate that banks increase (decrease) their loan interest rates to continuing
borrowers after merging. An increase in loan rates is consistent with banks extracting rents from
their borrowers, while a decrease in loan rates is consistent with informational scope economies
reducing the costs of lending and the bank passing these savings along to the borrower.
I control for many factors that can influence loan yield spreads. I include CONTRACT,
which are non-price loan characteristics consisting of indicators for the type of loan, indicators
for the purpose of the loan, the logarithm of the facility size of the loan, and the logarithm of the
length of the loan. To control for the risk of the borrower, I include RATING, which are dummy
variables for the firm’s credit rating, and FIRMFIN, a vector of firm financial characteristics that
consists of the firm’s size (logarithm of assets), leverage (debt-to-asset ratio), and profitability
(return on assets) during the year prior to the loan.24 Firms with lower credit ratings and firms
that are more leveraged are expected to have higher loan rates. Larger and more profitable firms
are likely to have lower yield spreads because these borrowers tend to be less risky. Also 23 The all-in spread drawn is defined as the coupon spread over LIBOR plus the annual fee plus the up-front fee (which is divided by the maturity of the loan). 24 In additional tests, I have included variables that capture if borrowers have experienced a credit rating upgrade or downgrade since their prior loan. However, this occurs for only 2.4% of the loans in the sample. While the signs of these variables are correct, they are generally statistically insignificant and do not affect the results.

24
incorporated is LENDREL, which are variables specific to the lending relationship. This
includes a variable that indicates if the firm has multiple lending relationships with the top-50
banks at the time of the loan as well as the lender’s market share of C&I loans in the year prior to
the loan. Including the bank’s loan market share serves two purposes. First, it proxies for the
bank’s reputation. Second, it captures any effects on loan pricing from bank size changes that
are caused by mergers between commercial banks. Economy-wide influences are captured by
ECONOMY, which consists of the bond market credit spread, the bond market term spread, and
the Herfindahl index of the loan market. These variables are expected to be positively related to
the yield spread. The regressions include POST1996, an indicator variable that is one at any date
after December 31, 1996. The coefficient on POST1996 captures any differences in yield
spreads charged by banks to continuing borrowers during the period 1997 through 2002 that are
not directly attributable to the bank merging or other factors that can affect yield spreads that are
included in the regression. I also include firm fixed effects, fi, to capture the effects on yield
spreads of unobserved firm specific factors. By using loans to continuing borrowers and a fixed-
effects model, I use the firm before the mergers as a control for itself after the mergers. Also, by
including borrowers from banks that do not merge with investment banks, I capture overall
changes in the pricing of loan contracts during the merger period.
To isolate loans to companies that are more informationally opaque, I estimate model (3)
for the full sample as well as for sub-samples based on the firm’s credit rating and number of
lending relationships. In the sub-sample analyses, I wish to continue to use the powerful firm
fixed effects. However, when running the model, there is one estimation problem: if I were
simply to classify loans based on the credit rating or number of relationships at the time of the
loan, I would lose much of this power when firms have a credit rating change or move from
single to multiple relationships. As a solution, I estimate model (3) using five samples: (i) the
full sample; (ii) loans to firms that are investment-grade rated when receiving at least one of their
loans; (iii) loans to firms that are junk rated when receiving at least one of their loans; (iv) firms
that have a single lending relationship with a top-50 bank over the full sample period of 1992
through 2002; and, (v) firms that have more than one lending relationship with a top-50 bank
over the sample period of 1992 through 2002. Using these samples preserves the power of the
fixed effects methods and also allows the control variables to vary across the different sub-
samples.

25
I perform additional tests in order to further examine if the effects on interest rates are
related to the ability of the CB-IB to use information in investment banking by estimating the
effects of CB-CB mergers on loan yield spreads. Examining the effects of CB-CB mergers helps
determine if any changes in loan yield spreads are due to general banking consolidation. While
the model controls for changes to the size of the lender and concentration of the loan market that
are caused by CB-CB mergers, there may be additional effects on loan pricing. Also, an analysis
of the effects of CB-CB mergers provides a useful contrast because the bank does not expand the
scope of its operations through these mergers. I repeat the estimations of equation (3) using CB-
CB mergers by replacing IBMERGE with CBMERGE, which indicates that the lender has
merged with another top-50 commercial bank prior to the loan. To further isolate differences
between the two types of mergers, I also estimate equation (3) using only loans from banks that
do not merge with investment banks during the sample period. In all estimations, I use
heteroskedastic consistent standard errors.
3.3.2. Results
The results of fixed-effects regressions are presented in Table 7. Panel A displays the effects on
yield spreads of the mergers between commercial banks and investment banks. In general, the
control variables have the expected signs and most are statistically significant. Loan yield
spreads are higher for lower credit rated borrowers and borrowers with higher leverage, and yield
spreads are lower for larger and more profitable borrowers. Also, the term spread, credit spread,
and concentration in the loan market are positively related to the level of yield spreads. The
results for the full sample of continuing borrowers are presented in the first column. The
coefficient on IBMERGE is positive and statistically significant at the 5% level; continuing
borrowers pay 13 basis points more after a CB-IB merger than before the merger.
Examination of the sub-samples shows that after merging with investment banks,
commercial banks charge significantly higher interest rates to their junk rated borrowers and
borrowers with single lending relationships. The second column presents the results for the junk
rated sample, which shows that junk rated borrowers pay yield spreads that are 43.64 basis points
higher after the CB-IB merger than before the merger, which is significant at the 1% level. For
the average loan in the sample, which is a $36 million dollar, 3-year loan, an increase of 43.64

26
basis points translates into a present value increase of approximately $400,000.25 Also, the fifth
column shows that borrowers with single lending relationships have their yield spreads increase
by 18.04 basis points. Further, in unreported estimations, I find that junk rated firms with single
lending relationships pay significantly higher loan yield spreads following the CB-IB merger,
while the junk rated firms with multiple lending relationships do not have a significant increase
in borrowing costs post-merger. These results are consistent with banks having an information
monopoly over junk rated firms with single lending relationships that allows the CB-IB to share
in merger-related gains by charging higher interest rates. In addition, the higher yield spreads
may partially reflect an increase in the switching costs for the CB-IB’s junk rated borrowers.
Additional evidence suggests that the CB-IB’s do not raise interest rates following the
merger in cases where it is unlikely to have an information monopoly. The results in the third
column indicate that the more informationally transparent, investment-grade rated borrowers do
not experience an interest rate change after CB-IB mergers. Also, consistent with Rajan (1992)
who notes that multiple lending relationships can limit a bank’s information monopoly, the
results in the fifth column show that the coefficient on IBMERGE is insignificant.
Table 7, Panel B shows the effects of CB-CB mergers on the pricing of loan contracts.
The first through fifth columns display the results when using loans from all of the top-50
commercial banks, while the sixth column shows the results of estimating the loan pricing model
when only including loans from banks that do not merge with investment banks during the
sample period. In contrast to CB-IB mergers, all estimations reveal that commercial bank
mergers do not significantly influence the pricing of loan contracts. These results support the
view that the increases in interest rates after CB-IB mergers are related to the ability of the CB-
IB to use information across product lines and are not driven by commercial bank consolidation.
Sections 3.1. and 3.2. provide evidence that is consistent with junk rated firms and firms
with single lending relationships valuing relationships with CB-IBs due to the ability of the bank
to reduce the costs of information asymmetry in investment banking. The results of this section
suggest that banks have information monopolies over their informationally opaque borrowers,
which allows CB-IBs to extract at least some of this created value by raising loan yield spreads
after the CB-IB merger. Also, the findings are consistent with CB-IB mergers increasing the
25 This calculation assumes a discount rate of 10%.
27
switching costs for informationally opaque firms who are likely to issue public securities in the
future. CB-IB mergers do not affect the loan yield spreads of informationally transparent firms
and CB-CB mergers do not influence the pricing of loan contracts, supporting the view that the
borrowing cost increases are related to the ability of the CB-IB to use private information in
investment banking.
4. Conclusion
Following the relaxation and repeal of the 1933 Glass-Steagall Act, commercial banks merged
with investment banks, allowing banks to expand their relationships with companies. Through
these mergers, the commercial bank acquires the capability to use the private information from
its lending relationships in investment banking. This may allow the bank to reduce information
asymmetries between the firm and public markets as well as create efficiencies by limiting the
duplication of screening and monitoring activities. As a result, these mergers can have important
effects on relationships between banks and informationally opaque firms.
The empirical findings indicate that mergers between commercial banks and investment
banks have distinct effects on firm-bank relationships when the CB-IB’s ability to reduce
information asymmetries between the firm and investors is likely to be important. This is
supported by the decisions of informationally opaque firms to switch from pure commercial
banks to CB-IB lenders and to use their CB-IB as the underwriter of their public securities: junk
rated firms, particularly those with single lending relationships, are more likely to start a new
lending relationship with a merged commercial-investment bank when they do not have a prior
lending relationship with a CB-IB; and, when junk rated companies and firms with single
lending relationships issue public debt, the existence of the lending relationship significantly
increases the likelihood of the firm selecting their CB-IB as a lead underwriter. The revealed
preference by informationally opaque firms for relationships with CB-IBs is consistent with
these firms having a higher value for relationships with merged commercial-investment banks.
Additional evidence is consistent with CB-IBs sharing in the expected gains by extracting
information rents after merging with investment banks, as their junk rated and single lending
relationship continuing borrowers pay higher loan interest rates after the merger relative to
before the merger. The borrowing cost increases suggest that commercial banks have

28
information monopolies over their more informationally opaque borrowers and may indicate that
these borrowers face larger information monopolies after CB-IB mergers.
Other results support the view that the effects of the mergers between commercial banks
and investment banks are related to commercial banks gaining the ability to use private
information in investment banking. Mergers between commercial banks and investment banks
do not influence informationally transparent firms’ decision to switch lenders, underwriter
selection, or interest rates. Also, mergers between commercial banks, where the bank does not
gain a new area of business, produce no significant effects on firms’ decision to switch lenders or
borrowing costs. Overall, the analysis suggests that CB-IB mergers create gains, and the CB-IB
can share in these gains by charging higher interest rates when the CB-IB is most likely to have
an information monopoly. In addition, the results point out that it is possible that the potential
gains from the CB-IB mergers may lead to larger switching costs for the informationally opaque
borrowers who will be likely to issue public securities. Do CB-IB mergers cause a significant
increase in switching costs, and if so, does this influence firms’ financing decisions? This is a
topic that deserves further research.

29
Appendix A Detailed Descriptions of the Variables
Probability of Switching Lenders SWITCHLEND: In the multinomial logit model, the variable indicates the borrower’s choice from three
alternatives: (i) “Prior Lender,” which is any bank that that has provided a loan to the firm between January 1992 and the loan date; (ii) “New CB-IB,” which is a commercial bank that has merged with an investment bank and has not provided a loan to the firm between January 1992 and the loan date; and, (iii) “New CB,” which is a commercial bank that has not merged with an investment bank and has not provided a loan to the firm between January 1992 and the loan date. In the probit model, an indicator variable that equals one if the firm selects any commercial bank that has not provided a loan to the firm between January 1992 and the loan date.
PRIORCBIBREL: An indicator variable that equals one if the borrower has a relationship with a commercial bank that has merged with an investment bank prior to the loan deal.
CBMERGE: An indicator variable that equals one if the borrower has a relationship with a commercial bank that has merged with another commercial bank (ranked in the top-50 of C&I lenders as of the end of 1996) prior to the loan deal.
LOANMKTSHR: Of the firms’ prior lenders, the maximum market share of total domestic C&I loans as of the end of the year prior to the year of the loan, adjusted for mergers that take place during the year of, but prior to, the loan, expressed as decimal.
CBIBSHARE: The sum of the market shares of total domestic C&I loans of all banks that have merged with investment banks by the month prior to the loan, accounting for mergers between commercial banks.
MULTREL: An indicator that equals one if the borrower has received a loan from more than one top-50 bank prior to the loan deal.
IGRADE: A dummy variable that equals one if the firm has a Standard and Poor’s long-term debt rating of AAA, AA, A, or BBB at the time of the loan.
JUNK: A dummy variable that equals one if the firm has a Standard and Poor’s long-term debt rating of BB, B, CCC, or CC at the time of the loan.
NR: A dummy variable that equals one if the firm does not have a Standard and Poor’s long-term debt rating at the time of the loan.
LNASSETS: The logarithm of total assets during the year prior to the loan, measured in first quarter, 1992 dollars. ROA: The return on assets, calculated as the ratio of net income to total assets during the year prior to the loan,
measured in first quarter, 1992 dollars. LEVERAGE: The book debt to total assets during the year prior to the loan, measured in first quarter, 1992 dollars. IND: Dummy variables that equal one if the issuer is in the corresponding one-digit SIC group.
Selecting Lead Underwriter for Public Debt Issuance SELUND: An indicator variable that is one if the specified potential underwriter is selected as a lead underwriter on
the issuance. LENDER: An indicator variable that equals one if the potential underwriter is the issuer’s lending bank in the
continuing borrowing relationship. DEBTMKTSHR: The potential underwriter’s market share in the U.S. public, non-convertible debt market based on
total dollars lead underwritten in the year prior to the issuance, as reported by SDC. PRIORUND: An indicator variable that is one if the potential underwriter has previously been selected as lead
underwriter of a debt issuance by the issuer between January 1992 and the date of the issuance. IGRADE: A dummy variable that equals one if the issue has a Standard and Poor’s debt rating of AAA, AA, A, or
BBB at the time of the issuance. JUNK: A dummy variable that equals one if the issue has a Standard and Poor’s debt rating of BB, B, CCC, or CC
at the time of the issuance. LNASSETS: The logarithm of total assets during the year prior to the issuance, measured in first quarter, 1992
dollars. ROA: The return on assets, calculated as the ratio of net income to total assets during the year prior to the issuance,
measured in first quarter, 1992 dollars. LEVERAGE: The book debt to total assets during the year prior to the issuance, measured in first quarter, 1992

30
dollars. MULTREL: An indicator that equals one if the borrower has received a loan from more than one top-50 bank prior
to the debt issuance. SINGREL: An indicator that equals one if the borrower has received a loan from only one top-50 bank prior to the
debt issuance. IND: Dummy variables that equal one if the issuer is in the corresponding one-digit SIC group. YR: Dummy variables that correspond to the year of issuance.
Estimating Changes in the Yield Spreads of Loan Contracts YSPREAD: The yield spread of the loan. This is the DealScan item “all-in spread drawn,” which is the coupon
spread over LIBOR plus the annual fee plus the up-front fee (which is divided by the maturity of the loan). IBMERGE: An indicator variable that equals one at any date after the lending bank merges with an investment bank. CBMERGE: An indicator variable that is one at any date after the lender mergers with another commercial bank,
where both commercial banks are ranked in the top-50 commercial bank C&I lenders as of the end of 1996.
LNLENGTH: The logarithm of LENGTH, the term length of the loan, where the term length is the number of months between the facility active date and the facility maturity date.
LNFACSIZE: The logarithm of FACSIZE, the notional size of the lending facility. The notional size is measured in first quarter, 1992 dollars.
TYPE: Dummy variables that correspond to the type of lending facility. The dummy variables indicate if the facility is a term loan, 364-day facility, revolving line of credit, or other type.
PURPOSE: Dummy variables that correspond to the purpose of the loan. The purposes are for acquisition, recapitalization, LBO, general, miscellaneous, or other.
LNASSETS: The logarithm of total assets during the year prior to the loan, measured in first quarter, 1992 dollars. ROA: The return on assets, calculated as the ratio of net income to total assets during the year prior to the loan,
measured in first quarter, 1992 dollars. LEVERAGE: The book debt to total assets during the year prior to the loan, measured in first quarter, 1992 dollars. RATING: Dummy variables that indicate the firm’s Standard and Poor’s long term debt rating at the time of the
loan. Individual dummies are created for AAA, AA, A, BBB, BB, B, CCC, and C. Not rated loans are indicated by the variable NR.
MULTREL: An indicator that equals one if the borrower has multiple in-sample bank lenders at loan origination date.
LOANMKTSHR: The lender’s market share of total domestic C&I loans from commercial banks in the Federal Reserve Call Reports as of the end of the year prior to the year of the loan, adjusted for mergers that take place during the year of, but prior to, the loan, expressed as decimal.
BAAMINAAA: The monthly difference between Moody’s seasoned Baa-rated corporate bonds and Aaa-rated corporate bonds, measured during the month of the loan, expressed as decimal.
10YRMIN6MO: The difference between the 10-year treasury bond and 6-month T-bill, measured during the month of the loan, expressed as decimal.
HHI: The Herfindahl index of domestic C&I Loans from commercial banks in the Federal Reserve Call Reports as of the end of the year prior to the year of the loan. This variable captures loan concentration at the national level. To calculate HHI, each commercial bank is given a market share by consolidating all of C&I loans by its individual chartered banks in the Call Report. HHI is the sum of squared market shares, multiplied by 1000.
POST1996: An indicator variable that equals one if the date of the loan is after December 31, 1996.

31
References
Ang, J., and R. Richardson (1994), “The underwriting experience of commercial bank affiliates prior to the Glass-Steagall Act: A reexamination of evidence for passage of the act,” Journal of Banking and Finance 18, 351-395.
Angelini, P., R. Di Salvo, and G. Ferri (1998), “Availability and cost of credit for small
businesses: Customer relationships and credit cooperatives,” Journal of Banking and Finance 22, 925-954.
Baker, W. (1990), Market networks and corporate behavior, American Journal of Sociology 96,
589-625. Benston, G. (1990), The Separation of Commercial and Investment Banking, New York: Oxford
University Press. Benzoni, L., and C. Schenone (2004), “Conflict of interest or certification? Evidence from IPOs
underwritten by the firm’s relationship bank,” Working Paper: University of Minnesota. Berger, A., R. Demsetz, and P.E. Strahan (1999), “The consolidation of the financial services
industry: Causes, consequences, and implications for the future,” Journal of Banking and Finance 23, 135-194.
Berger, A., A. Kashyap, and J. Scalise (1995), “The transformation of the U.S. banking industry:
What a long, strange trip it’s been,” Brookings Papers on Economic Activity 2, 55-201. Berger A., N. Miller, M. Petersen, R. Rajan, and J. Stein (2004), “Does function follow
organizational form? Evidence from the lending practices of large and small banks,” Journal of Financial Economics. forthcoming.
Berger, A., and G. Udell (1995), “Relationship lending and lines of credit in small firm finance,”
Journal of Business 68, 351-381. Berger, A., and G. Udell (1996), “Universal banking and the future of small business lending, In
Universal Banking: Financial System Design Reconsidered (eds. A. Saunders and I. Walter), Chicago: Irwin.
Best, R., and H. Zhang (1993), “Alternative information sources and the information content of
bank loans,” Journal of Finance 48, 1507-1523. Bharath, S., S. Dahiya, A. Saunders, and A. Srinivasan (2004), “So what do I get? The bank’s
view of lending relationships,” Working Paper: New York University. Billett, M., M. Flannery, and J. Garfinkel (1995), “The effect of lender identity on a borrowing
firm’s equity return,” Journal of Finance 50, 699-718.

32
Boot, A., (2000), “Relationship banking: what do we know?,” Journal of Financial Intermediation 9, 7-25.
Boot, A., and A. Thakor (1994), “Moral hazard and secured lending in an infinitely repeated
credit market game,” International Economic Review 35, 899-920. Boot, A., and A. Thakor (2000), “Can relationship banking survive competition?,” Journal of
Finance 54, 679-713. Booth, J., and R. Smith (1986), “Capital raising, underwriting and the certification hypothesis,”
Journal of Financial Economics 15, 261-281. Boyd, J., and E. Prescott (1986), “Financial intermediary-coalitions,” Journal of Economic
Theory 38, 211-232. Cadette, W. (1996), “Universal banking: A U.S. perspective,” In Universal Banking: Financial
System Design Reconsidered (eds. A. Saunders and I. Walter), Chicago: Irwin. Carow, K., and E. Kane (2002), “Event-study evidence of the value of relaxing longstanding
regulatory restraints on banks, 1970-2000,” The Quarterly Review of Economics and Finance 42, 505-527.
Carter, R., and S. Manaster (1990), “Initial public offerings and underwriter reputation,” Journal
of Finance 45, 1045-1067. Cole, R. (1998), “The importance of relationships to the availability of credit,” Journal of
Banking and Finance 22, 959-977. Cole, R., L. Goldberg, and L. White (1999), “Cookie-cutter vs. character: The microstructure of
small business lending by large and small banks,” In Business Access to Capital and Credit (eds. J. Blanton, A Williams, and S. Rhine), Federal Reserve Research Conference, 362-389.
Crane, R., and D. Eccles (1993), “Customer relationships in the 1990s,” in Financial Services:
Perspectives and Challenges (ed. S. Hayes), Boston, MA: Harvard Business School Press.
Degryse, H., and P. van Cayseele (2000), “Relationship lending within a bank-based system:
evidence from European small business data,” Journal of Financial Intermediation 9, 90-109.
Diamond, D. (1984), “Financial intermediation and delegated monitoring,” Review of Economic
Studies 51, 393-414. Diamond, D. (1991), “Monitoring and reputation: The choice between bank loans and directly
placed debt,” Journal of Political Economy 99, 689-721.

33
Drucker, S., and M. Puri (2004a), “Banks and capital markets,” In Empirical Corporate Finance,
Handbooks in Finance, (ed. B.E. Eckbo), Amsterdam: Elsevier/North-Holland Publishers, forthcoming.
Drucker, S., and M. Puri (2004b), “On the benefits of concurrent lending and underwriting,”
Journal of Finance, forthcoming. Fama, E. (1985), “What’s different about banks?,” Journal of Monetary Economics 10, 10-19. Fama, E., and K. French (1989), “Business conditions and expected returns on stocks and
bonds,” Journal of Financial Economics 25, 23-49. Gande, A., M. Puri, and A. Saunders (1999), “Bank entry, competition, and the market for
corporate securities underwriting,” Journal of Financial Economics 54, 165-195. Gande, A., M. Puri, A. Saunders, and I. Walter (1997), “Bank underwriting of debt securities:
modern evidence,” Review of Financial Studies 10, 1175-1202. Greene, W. (2000), Econometric Analysis, 4th ed., New Jersey: Prentice-Hall. Hannan, T. (1991), “Bank commercial loan markets and the role of market structure: evidence
from surveys of commercial lending,” Journal of Banking and Finance 15, 133-149. Hausman, J., and D. McFadden (1984), “Specification tests for the multinomial logit model,”
Econometrica 52, 1219-1240. Heckman, J. (1979), “Sample selection bias as a specification error,” Econometrica 47, 153-161. Hellmann, T., L. Lindsey, and M. Puri (2004), “Building relationships early: Banks in venture
capital,” Working Paper: Duke University. Hubbard, R., K. Kuttner, and D. Palia (2002), “Are there bank effects in borrowers’ cost of
funds? Evidence from a matched sample of borrowers and banks,” Journal of Business 75, 559-581.
James, C. (1987), “Some evidence on the uniqueness of bank loans,” Journal of Financial
Economics 19, 217-235. Kroszner, R., and R. Rajan (1994), “Is the Glass-Steagall act justified? A study of the U.S.
experience with universal banking before 1933,” American Economic Review 84, 810-832.
Ljungqvist, A., Marston, F., Wilhelm, W. (2004), “Competing for Securities Underwriting
Mandates: Banking Relationships and Analyst Recommendations,” Journal of Finance, forthcoming.
34
Lummer, S., and J. McConnell (1989), “Further evidence on the bank lending process and the capital market response to bank loan agreements,” Journal of Financial Economics 25, 99-122.
Peek, J., and E. Rosengren (1996), “Small business credit availability: How important is size of
lender?,” in Financial System Design: The Case for Universal Banking (eds. A. Saunders and I. Walter), Burr Ridge, IL: Irwin.
Penas, M., and H. Unal (2004), “Gains in bank mergers: Evidence from the bond markets,”
Journal of Financial Economics 74, 149-179. Petersen, M. (2002), “Information: Hard and soft,” Working Paper: Northwestern University. Petersen, M., and R. Rajan (1994), “The benefits of lending relationships: evidence from small
business data,” Journal of Finance 49, 3-37. Petersen, M., and R. Rajan (1995), “The effect of credit market competition on lending
relationships,” Quarterly Journal of Economics 110, 407-443. Puri, M. (1994), “The long-term default performance of bank underwritten security issues,”
Journal of Banking and Finance 18, 397-418. Puri, M. (1996), “Commercial banks in investment banking: Conflict of interest or certification
role?,” Journal of Financial Economics 40, 373-401. Puri, M. (1999), “Commercial banks as underwriters: Implications for the going public process,”
Journal of Financial Economics 54, 133-163. Rajan, R. (1992), “Insiders and outsiders: The choice between informed and arm’s length debt,”
Journal of Finance 47, 1367-1400. Rajan, R. (1996), “Commercial bank entry into the securities business: A survey of theories and
evidence,” in Universal Banking: Financial System Design Reconsidered (eds. A. Saunders and I. Walter), Burr Ridge, IL: Irwin.
Rajan, R. (2002), “An investigation into the economics of extending bank powers,” Journal of
Emerging Market Finance 1, 125-156. Ramakrishnan, R., and A. Thakor (1984), “Information reliability and a theory of financial
intermediation,” Review of Economic Studies 22, 415-432. Sapienza, P. (2002), “The effects of banking mergers on loan contracts,” Journal of Finance 57,
329-367. Saunders, A., and I. Walter (1994), Universal banking in the United States, What could we
gain? What could we lose?, (Oxford University Press, NY).

35
Schenone, C. (2004), “The effects of banking relationships on the firm’s IPO underpricing,”
Journal of Finance 59, 2903-2958. Sharpe, S. (1990), “Asymmetric information, bank lending and implicit contracts: A stylized
model of customer relationships,” Journal of Finance 45, 1069-1087. Stein, J. (2002), “Information production and capital allocation: Decentralized versus
hierarchical firms,” Journal of Finance 57, 1891-1922. Strahan, P., and J. Weston (1996) “Small business lending and bank consolidation: Is there cause
for concern?” Federal Reserve Bank of New York Current Issues in Economics and Finance 2, 1-6.
Yasuda, A. (2004), “Do bank relationships affect the firm’s underwriter choice in the corporate-
bond underwriting market?,” Journal of Finance, forthcoming. Walter, I. (2004), Mergers and acquisitions in banking and finance: What works, what fails, and
why, (Oxford University Press, New York).

36
Table 1 List of Commercial Bank – Investment Bank Mergers – 1997 through 2002
This table presents a list of U.S. commercial banks that merge with investment banks and the month and year of merger. This list only includes mergers where the commercial banks were ranked in the top-50 of domestic commercial and industrial lending as of December 1996 and the investment bank had underwritten at least one equity or bond offering during the three years prior to the merger.
Commercial Bank Investment Bank Merger Date
LaSalle Bank Chicago Corp. January 1997
Bankers Trust Alex Brown & Sons September 1997
Bank of America Robertson Stephens October 1997
NationsBank Montgomery Securities October 1997
First Union Wheat, First, Butcher & Singer November 1997
SunTrust Bank Equitable Securities January 1998
US Bancorp Piper Jaffray May 1998
Fifth Third Bancorp Ohio Co June 1998
BankBoston Robertson Stephens September 1998
KeyCorp McDonald Investments September 1998
Citigroup Salomon Smith Barney October 1998
BB&T Corp Scott & Stringfellow November 1998
Wachovia Bank Interstate - Johnson Lane January 1999
First Union Everen Securities October 1999
Chase Manhattan Bank Hambrecht & Quist December 1999
Wells Fargo Van Kasper & Co November 2000
SunTrust Bank Robinson Humphrey July 2001

37
Table 2
Borrower and Loan Deal Summary Statistics: Existing Borrowers, 1997-2002
This table provides summary statistics for loan deals from January 1997 to December 2002 to “existing borrowers,” which are borrowers who have a loan from at least one top-50 ranked bank before January 1997. A loan deal is one or more loans to a borrower by the same lender on the same facility active date. The variables are: ROA is the return on assets, calculated as the ratio of net income to total assets during the year prior to the loan; LEVERAGE is the book debt to total assets during the year prior to the loan; ASSETS is the total assets during the year prior to the loan, in millions of year 1992 dollars; LNASSETS is the logarithm of ASSETS; MULTREL is an indicator that equals one if the borrower has multiple top-50 banks at loan origination date; IGRADE is a dummy variable that equals one if the borrower has a Standard and Poor’s long-term debt rating of AAA, AA, A, or BBB at the time of the loan; JUNK is a dummy variable that equals one if the borrower has a Standard and Poor’s long-term debt rating of BB,B, CCC, or CC at the time of the loan; NR is a dummy variable that equals one if the borrower does not have a Standard and Poor’s long-term debt rating at the time of the loan; SWITCHLEND is an indicator variable that equals one if the firm selects any commercial bank that has not provided a loan to the firm between January 1992 and the loan date; PRIORCBIBREL is an indicator variable that equals one if the borrower has a relationship with a commercial bank that has merged with an investment bank prior to the loan deal; and, CBMERGE is an indicator variable that equals one if the borrower has a relationship with a commercial bank that has merged with another commercial bank prior to the loan deal. All notional values are expressed in millions of first quarter, year 1992 dollars using the GDP implicit price deflator.
Loan Deals - 1997 through 2002 (1259 Loan Deals) Variable Mean Std. Dev Median ROA 0.013 0.150 0.032 LEVERAGE 0.583 0.246 0.577 ASSETS 1477.220 5632.361 261.03 LNASSETS 19.502 1.605 19.380 Variable Percentage Variable Percentage SWITCHLEND 25.18 IGRADE 13.43 PRIORCBIBREL 48.37 JUNK 17.55 CBMERGE 45.99 NR 69.02 MULTREL 21.92

38
Table 3 Probability of Switching Lenders
Commercial Bank-Investment Bank Mergers
This table presents the results of a multinomial logit model, using 1,259 loan deals from 1997 through 2002 where the borrower has an existing lending relationship at the time of the loan deal with a commercial bank ranked in the top-50 by total domestic commercial & industrial (C&I) loans (ranked as of the end of 1996). The dependent variable is SWITCHLEND, which indicates the borrower’s choice from three alternatives: (i) “Prior Lender,” which is any bank that that has provided a loan to the firm between January 1992 and the loan date; (ii) “New CB-IB,” which is a commercial bank that has merged with an investment bank and has not provided a loan to the firm between January 1992 and the loan date; and, (iii) “New CB,” which is a commercial bank that has not merged with an investment bank and has not provided a loan to the firm between January 1992 and the loan date. The firm’s choice depends upon the following independent variables: PRIORCBIBREL is an indicator variable that equals one if the borrower has a relationship with a commercial bank that has merged with an investment bank prior to the loan deal; LOANMKTSHR is, of the firm’s prior lenders, the maximum market share of total domestic C&I loans as of the end of the year prior to the year of the loan, adjusted for mergers that take place during the year of, but prior to, the loan, expressed as decimal; MULTREL is an indicator that equals one if the borrower has received a loan from more than one top-50 bank prior to the loan deal; IGRADE is a dummy variable that equals one if the borrower has a Standard and Poor’s long-term debt rating of AAA, AA, A, or BBB at the time of the loan; JUNK is a dummy variable that equals one if the borrower has a Standard and Poor’s long-term debt rating of BB,B, CCC, or CC at the time of the loan; LNASSETS is the logarithm of total assets (measured in millions of year 1992 dollars) during the year prior to the loan; ROA is the return on assets, calculated as the ratio of net income to total assets during the year prior to the loan; LEVERAGE is book debt to total assets during the year prior to the loan; and, IND are dummy variables that equal one if the issuer is in the corresponding one-digit SIC group (not reported). To capture that there are more CB-IBs over time, I include CBIBSHARE, the sum of the market shares of total domestic C&I loans of all banks that have merged with investment banks by the month prior to the loan, accounting for mergers between commercial banks. Panel 1 shows the probability of switching to “New CB-IB” instead of staying with “Prior Lender” while Panel 2 shows the probability of switching to “New CB” instead of staying with “Prior Lender.” Columns (1) and (2) include the full sample of loan deals. Columns (3) and (4) only include loan deals where the borrower has a single lending relationship at the time of the loan deal (MULTREL = 0). Columns (5) and (6) include only loan deals where the borrower has more than one lending relationship at the time of the loan deal (MULTREL = 1). Standard errors are White heteroskedastic consistent and clustered at the firm-level and z-scores are in parentheses. ***, **, and * indicate significance at the 1%, 5%, and 10% level, respectively.

39
Full Sample Single Lending Relationship Multiple Lending Relationship (1) (2) (3) (4) (5) (6)
Panel 1: Probability of switching to “New CB-IB” vs. staying with “Prior Lender” PRIORCBIBREL -0.024
(-0.10)
0.041 (0.16)
-0.656 (-0.70)
JUNK X PRIORCBIBREL -0.987 ** (-1.96)
-1.100 * (-1.91)
-0.966 (-0.96)
IGRADE X PRIORCBIBREL 0.236 (0.40)
0.063 (0.10)
0.987 (1.06)
NR X PRIORCBIBREL 0.157 (0.58)
0.247 (0.86)
-0.737 (-0.76)
LOANMKTSHR -9.012 *** (-3.15)
-8.217 *** (-2.84)
-8.959 *** (-2.71)
-8.743 *** (-2.62)
-11.819 * (-1.89)
-11.686 * (-1.86)
MULTREL
-0.244 (-0.95)
-0.288 (-1.10)
CBIBSHARE 6.408 *** (8.10)
6.381 *** (8.19)
6.572 *** (8.12)
6.736 *** (8.17)
6.725 ** (2.18)
6.586 ** (2.22)
IGRADE 0.262 (0.66)
0.021 (0.04)
0.009 (0.02)
0.084 (0.13)
1.423 (1.46)
1.195 (1.46)
JUNK -0.478 (-1.47)
0.298 (0.69)
-0.392 (-1.05)
0.344 (0.77)
-0.419 (-0.65)
-0.222 (-0.65)
LNASSETS 0.026 (0.29)
0.006 (0.07)
0.055 (0.51)
0.061 (0.57)
-0.129 (-0.72)
-0.156 (-0.92)
ROA 0.073 (0.13)
0.033 (0.06)
0.172 (0.31)
0.080 (0.14)
-1.119 (-0.74)
-1.150 (-0.76)
LEVERAGE 1.137 *** (3.25)
1.097 *** (3.13)
1.304 *** (3.58)
1.311 *** (3.57)
-0.183 (-0.14)
-0.263 (-0.20)
Intercept -3.441 * (-1.86)
-4.390 ** (-2.50)
-4.167 * (-1.85)
-4.355 ** (-1.95)
-1.095 (-0.31)
-0.482 (-0.14)
IND Fixed Effects Yes Yes Yes Yes Yes Yes
Panel 2: Probability of switching to “New CB” vs. staying with “Prior Lender” PRIORCBIBREL -0.077
(-0.33) 0.027
(0.10) -0.590
(-1.21)
JUNK X PRIORCBIBREL -0.139 (-0.29)
0.385 (0.75)
-2.133 ** (-2.12)
IGRADE X PRIORCBIBREL -0.185 (-0.36)
-0.396 (-0.60)
0.174 (0.21)
NR X PRIORCBIBREL -0.035 (-0.13)
0.005 (0.02)
-0.492 (-0.92)
LOANMKTSHR -7.431 ** (-2.28)
-7.340 ** (-2.24)
-11.680 *** (-2.80)
-11.763 *** (-2.85)
2.243 (0.35)
1.832 (0.29)
MULTREL 0.132 (0.61)
0.132 (0.60)
CBIBSHARE -1.180 * (-1.91)
-1.196 * (-1.93)
-0.912 (-1.32)
-0.933 (-1.34)
-1.817 (-1.13)
-1.606 (-1.01)
IGRADE 0.049 (0.12)
0.083 (0.16)
-0.122 (-0.25)
0.060 (0.10)
0.525 (0.61)
0.368 (0.41)
JUNK -0.161 (-0.58)
-0.102 (-0.30)
0.028 (0.09)
-0.095 (-0.26)
-0.880 (-1.34)
-0.678 (-0.97)
LNASSETS -0.181 * (-1.90)
-0.188 ** (-1.97)
-0.218 ** (-2.18)
-0.222 ** (-2.21)
0.032 (0.12)
0.033 (0.15)
ROA -0.201 (-0.28)
-0.203 (-0.29)
0.019 (0.02)
0.044 (0.05)
-1.770 (-1.12)
-1.745 (-1.05)
LEVERAGE 0.686 * (1.62)
0.670 (1.58)
0.932 ** (2.06)
0.958 ** (2.12)
-0.804 (-0.74)
-0.632 (-0.56)
Intercept 2.431 (1.05)
2.305 (1.29)
4.063 * (1.88)
4.097 * (1.89)
-1.953 (-0.40)
-2.153 (-0.52)
IND Fixed Effects Yes Yes Yes Yes Yes Yes
Log Likelihood -844.410 -846.531 -659.380 -656.370 -168.750 -167.970 Pseudo R-squared 0.0909 0.0886 0.1028 0.1069 0.1281 0.1321 Number of Loan Deals 1259 1259 983 983 276 276

40
Table 4 Probability of Switching Lenders
Commercial Bank – Commercial Bank Mergers
This table presents the results of a probit model, using the 1,259 loan deals from 1997 through 2002 where the borrower has an existing lending relationship at the time of the loan deal with a commercial bank ranked in the top-50 by total domestic commercial & industrial (C&I) loans (ranked as of the end of 1996). The dependent variable is SWITCHLEND, which is an indicator variable that equals one if the firm selects any commercial bank that has not provided a loan to the firm between January 1992 and the loan date. The firm’s choice depends upon the following independent variables: CBMERGE is an indicator variable that equals one if the borrower has a relationship with a commercial bank that has merged with another commercial bank (ranked in the top-50 of C&I lenders as of the end of 1996) prior to the loan deal; LOANMKTSHR is, of the firm’s prior lenders, the maximum market share of total domestic C&I loans as of the end of the year prior to the year of the loan, adjusted for mergers that take place during the year of, but prior to, the loan, expressed as decimal; MULTREL is an indicator that equals one if the borrower has received a loan from more than one top-50 bank prior to the loan deal; IGRADE is a dummy variable that equals one if the borrower has a Standard and Poor’s long-term debt rating of AAA, AA, A, or BBB at the time of the loan; JUNK is a dummy variable that equals one if the borrower has a Standard and Poor’s long-term debt rating of BB,B, CCC, or CC at the time of the loan; LNASSETS is the logarithm of total assets (measured in year 1992 dollars) during the year prior to the loan; ROA is the return on assets, calculated as the ratio of net income to total assets during the year prior to the loan; LEVERAGE is book debt to total assets during the year prior to the loan; IND are dummy variables that equal one if the issuer is in the corresponding one-digit SIC group (not reported); and, YR dummy variables that correspond to the year of the loan deal (not reported). Columns (1) and (2) include the full sample of loan deals. Columns (3) and (4) only include loan deals where the borrower only has a single lending relationship at the time of the loan deal (MULTREL = 0). Columns (5) and (6) include only loan deals where the borrower has more than one lending relationship at the time of the loan deal (MULTREL = 1). Columns (7) and (8) include loan deals to borrowers that do not have relationships with banks that merge with investment banks during the sample period. Standard errors are White heteroskedastic consistent and clustered at the firm-level and z-scores are in parentheses. ***, **, and * indicate significance at the 1%, 5%, and 10% level, respectively.��

41
Table 4 Probability of Switching Lenders
Commercial Bank – Commercial Bank Mergers
Full Sample
Single Lending Relationship
Multiple Lending Relationship
Lenders Do Not Merge with IB
(1) (2) (3) (4) (5) (6) (7) (8) CBMERGE -0.037
(-0.33)
0.044
(0.35) -0.171
(-0.69) -0.015
(-0.04)
JUNK X CBMERGE
-0.003
(-0.01) 0.088
(0.34) 0.741
(1.28)
0.549
(0.77) IGRADE X CBMERGE
0.239
(1.02) 0.273
(0.97) 0.177
(0.37)
-0.442
(-0.66) NR X CBMERGE
-0.088
(-0.71) 0.002
(0.01) -0.400
(-1.51)
-0.043
(-0.10) LOANMKTSHR -5.278 ***
(-3.34) -5.419 ***
(-3.42) -6.572 ***
(-3.61) -6.747 ***
(-3.65) -1.111
(-0.35) -1.586 (-0.50)
-1.673 (-0.20)
-1.395 (-0.17)
MULTREL -0.025 (-0.23)
-0.027 (-0.25)
0.071 (0.11)
0.089 (0.14)
IGRADE 0.096 (0.54)
-0.064 (-0.30)
-0.031 (-0.15)
-0.148 (-0.63)
0.340 (0.93)
-0.006 (-0.01)
0.154 (0.30)
0.355 (0.58)
JUNK -0.185 (-1.47)
-0.228 (-1.42)
-0.099 (-0.067)
-0.137 (-0.77)
-0.234 (-0.82)
-1.046 * (-1.91)
0.188 (0.56)
0.095 (0.28)
LNASSETS -0.050 (-1.26)
-0.047 (-1.17)
-0.048 (-1.11)
-0.045 (-1.04)
-0.072 (-0.81)
-0.071 (-0.82)
-0.099 (-0.95)
-0.097 (-0.92)
ROA -0.006 (-0.02)
-0.024 (-0.08)
0.114 (0.36)
0.098 (0.31)
-1.228 * (-1.81)
-1.261 * (-1.88)
-2.000 ** (-1.97)
-1.981 ** (-1.96)
LEVERAGE 0.525 *** (2.99)
0.517 *** (2.93)
0.649 *** (3.33)
0.647 *** (3.32)
-0.500 (-0.98)
-0.642 (-1.24)
0.581 (1.06)
0.569 (1.03)
Intercept 0.544 (0.62)
0.509 (0.58)
0.671 (0.67)
0.644 (0.65)
1.464 (0.87)
1.677 (1.00)
0.897 (0.45)
0.834 (0.42)
IND and YR Fixed Effects Yes Yes Yes Yes Yes Yes Yes
Yes
Log Likelihood -683.087 -682.151 -553.808 -533.334 -136.584 -134.414 -111.144 -110.653 Pseudo R-squared 0.0385 0.0398 0.0478 0.0486 0.0862 0.1007 0.1007 0.1046 Number of Loan Deals 1259 1259 983 983 276 276 204 204

42
Table 5 Probability of Selecting Lead Underwriter for Public Debt Issuance
This table presents the results of two logit models of underwriter selection. The data consists of all public, non-convertible debt issues by continuing borrowers after their relationship bank merges with an investment bank through June 2004 (there are 173 issues). For each issue, the issuer is allowed to choose from a set of lead underwriters that is comprised of the firm’s lending bank in the continuing relationship, the ten-top ranked debt underwriters from the year prior to the debt issue, and a single underwriter that represents all other underwriters. The top-10 ranked underwriters are determined by the market share of each underwriter in the U.S. public, non-convertible debt market based on total dollars lead underwritten, as reported by SDC. The dependent variable is SELUND, which is one if the specified potential underwriter is selected as a lead underwriter on the issuance. The independent variables are LENDER, which is one if the potential underwriter is the issuer’s lending bank in the continuing borrowing relationship; DEBTMKTSHR is the market share of the potential underwriter in the U.S. public, non-convertible debt market based on total dollars lead underwritten in the year prior to the issuance, as reported by SDC. PRIORUND is one if potential underwriter has previously been selected as lead underwriter of a debt issuance by the issuer between January 1992 and the date of the issuance; IGRADE is a dummy variable that equals one if the issue has a Standard and Poor’s debt rating of AAA, AA, A, or BBB at the time of the issuance; LNASSETS is the logarithm of total assets (measured in millions of year 1992 dollars) during the year prior to the loan; ROA is the return on assets, calculated as the ratio of net income to total assets during the year prior to the loan; LEVERAGE is book debt to total assets during the year prior to the loan; MULTREL is an indicator that equals one if the borrower has received a loan from more than one top-50 bank prior to the debt issuance; IND are dummy variables that correspond to the one-digit SIC code of the issuer (not reported); and, YR are dummy variables that correspond to the year of the issuance (not reported). For the estimations displayed in columns (2) and (5), interaction terms are created using JUNK, which is a dummy variable that equals one if the issue has a Standard and Poor’s debt rating of BB, B, CCC, CC, or C at the time of the issuance, and IGRADE. For the estimations displayed in columns (3) and (6), interaction terms are created using SINGREL, which is an indicator that equals one if the borrower has received a loan from only one top-50 bank prior to the debt issuance, and MULTREL. Columns (1) through (3) report estimates of a standard logit model, with standard errors that are White heteroskedastic consistent and clustered for each debt issuance. Columns (4) through (6) report estimates of a conditional logit model, which includes firm fixed effects (for the firm at the time of the issuance). Z-scores are reported in parentheses. ***, **, and * indicate significance at the 1%, 5%, and 10% level, respectively.

43
Standard Logit Conditional Logit (1) (2) (3) (4) (5) (6) LENDER 0.420 *
(1.90) 0.377 *
(1.89)
JUNK X LENDER 1.411 *** (3.45)
1.313 *** (3.26)
IGRADE X LENDER
0.153 (0.60)
0.129 (0.56)
SINGREL X LENDER
0.617 ** (2.05)
0.534 ** (2.00)
MULTREL X LENDER
0.183 (0.56)
0.185 (0.60)
DEBTMKTSHR 3.921 *** (2.88)
3.895 *** (2.82)
3.714 *** (2.69)
3.038 ** (2.41)
3.049 ** (2.41)
2.878 ** (2.25)
PRIORUND 1.542 *** (8.42)
1.570 *** (8.64)
1.548 *** (8.47)
1.926 *** (10.17)
1.947 *** (10.30)
1.923 *** (10.19)
IGRADE -0.404 ** (-2.22)
-0.237 (-1.27)
-0.404 ** (-2.22)
N/A N/A N/A
LNASSETS -0.005 (-0.08)
-0.004 (-0.08)
-0.004 (-0.06)
N/A N/A N/A
ROA -0.668 (-0.48)
-0.627 (-0.44)
-0.718 (-0.51)
N/A N/A N/A
LEVERAGE -0.075 (-0.14)
-0.063 (-0.12)
-0.080 (-0.15)
N/A N/A N/A
MULTREL -0.169 * (-1.67)
-0.164 * (-1.64)
-0.115 (-1.12)
N/A N/A N/A
Intercept -2.007 (-1.59)
-2.162 * (-1.69)
-2.046 (-1.62)
N/A N/A N/A
IND and YR Fixed Effects
Yes Yes Yes N/A N/A N/A
Firm Fixed Effects No No No Yes Yes Yes
Log Likelihood
-720.552
-717.360
-720.021
-489.817
-486.745
-489.446
Psuedo R-Squared 0.0924 0.0964 0.0931 0.1394 0.1448 0.1400 Number of Observations
1966 1966 1966 1966 1966 1966
T-Tests JUNK X LENDER – IGRADE X LENDER 1.258 ***
(2.61) 1.184 ***
(2.56)
SINGREL X LENDER – MULTREL X LENDER
0.434 (0.98)
0.349 (0.86)

44
Table 6
Borrower and Loan Summary Statistics: Continuing Borrowers, 1992 - 2002
This table provides summary statistics for the sample of loans to “continuing borrowers” from January 1992 to December 2002. Loans to continuing borrowers are loans where the same bank is a lender on a firm’s loans in both the period January 1992 through December 1996 and also on another loan at some point from January 1997 through December 2002. The variables are: FACSIZE is the notional size of the lending facility, in millions of year 1992 dollars; LNFACSIZE is the logarithm of FACSIZE; LENGTH is the term length of the loan, where the term length is the number of months between the facility active date and the facility maturity date; LNLENGTH is the logarithm of LENGTH; ROA is the return on assets, calculated as the ratio of net income to total assets during the year prior to the loan; LEVERAGE is the book debt to total assets during the year prior to the loan; ASSETS is the total assets during the year prior to the loan, in millions of year 1992 dollars; LNASSETS is the logarithm of ASSETS; POST1996 is an indicator variable that equals one if the date of the loan is after December 31, 1996; IBMERGE is an indicator variable that equals one at any date after the lending bank merges with an investment bank; CBMERGE is an indicator variable that is one at any date after the lender merges with another commercial bank, where both commercial banks are ranked in the top-50 commercial bank C&I lenders as of the end of 1996; MULTREL9202 is an indicator that equals one if the borrower receives a loan from more than one bank during the full sample period, 1992 through 2002; MULTREL is an indicator that equals one if the borrower has multiple top-50 bank lenders at loan origination date; IGRADE is a dummy variable that equals one if the borrower has a Standard and Poor’s long-term debt rating of AAA, AA, A, or BBB at the time of the loan; JUNK is a dummy variable that equals one if the borrower has a Standard and Poor’s long-term debt rating of BB,B, CCC, or CC at the time of the loan; NR is a dummy variable that equals one if the borrower does not have a Standard and Poor’s long-term debt rating at the time of the loan; and TYPE are dummy variables that correspond to the type of lending facility (term loan, 364-day facility, revolving line of credit, or other loan). All notional values are expressed in millions of first quarter, year 1992 dollars using the GDP implicit price deflator.
Panel A: Loans to Continuing Borrowers (607 Firms / 2245 Loans) Variable Mean Std. Dev Median FACSIZE 91.795 185.114 36.000 LNFACSIZE 17.283 1.555 17.399 LENGTH 38.589 23.899 36.000 LNLENGTH 3.416 0.752 3.584 ROA 0.033 0.117 0.040 LEVERAGE 0.575 0.236 0.573 ASSETS 1082.104 3357.973 191.609 LNASSETS 19.226 1.585 19.071 Variable Percentage RATING Percentage TYPE Percentage POST1996 48.15 IGRADE 11.05 Term Loan 23.48 IBMERGE 19.51 JUNK 14.97 364-day Facility 6.46 CBMERGE 19.73 NR 73.98 Credit Line 67.71 MULTREL9202 22.89 Other Type 2.36 MULTREL 9.22

45
Table 7
Estimating Changes in the Yield Spreads of Loan Contracts
This table presents the results of fixed-effect regressions. The sample of loans is to “continuing borrowers.” Continuing borrowers receive loans from an in-sample commercial bank between January 1992 and December 1996 and also borrow from the same bank between January 1997 and December 2002. The dependent variable is YSPREAD, which is the yield spread of the loan. YSPREAD is the DealScan item called the “all-in spread drawn,” which is defined as the coupon spread over LIBOR plus the annual fee plus the up-front fee, divided by the maturity of the loan. Panel A provides the effect of mergers between commercial banks and investment banks. The regressions include IBMERGE, an indicator variable that is one at any date after the lender merges with an investment bank. Panel B provides the effect of mergers between any of the top-50 commercial bank lender of commercial & industrial (C&I) loans as of the end of 1996. The regressions include CBMERGE, which is an indicator variable that is one at any date after the lender merges with another commercial bank, where both commercial banks are ranked in the top-50 commercial bank C&I lenders as of the end of 1996. The following variables are non-price loan characteristics: the type of loan (TYPE) is captured by the dummy variables, indicating if the loan is a credit line, term loan, 364-day facility, or other loan; the purpose (PURPOSE) of the loan is captured by dummy variables, indicating if the loan’s purpose (as designated by LPC) is for acquisition, recapitalization, LBO, general, miscellaneous, or other; LNLENGTH is the logarithm of the term length of the loan, where the term length is the number of months between the facility active date and facility maturity date; and, LNFACSIZE is the logarithm of the notional size of the facility (measured in millions of 1992 dollars). The following variables capture borrower risk characteristics: LNASSETS is the logarithm of total assets (measured in millions of 1992 dollars) during the year prior to the loan; ROA is the return on assets, calculated as the ratio of net income to total assets during the year prior to the loan; LEVERAGE is book debt to total assets during the year prior to the loan; and, the firm’s Standard and Poor’s long term debt rating at the time of the loan is captured by dummy variables AAA, AA, A, BBB, BB, B, CCC, CC, C and NR. The following variables are related to the lending relationship and the lender: MULTREL is an indicator that equals one if the borrower has multiple top-50 bank lenders at loan origination date; and, LOANMKTSHR is the lender’s market share of total domestic C&I loans from commercial banks in the Federal Reserve Call Reports as of the end of the year prior to the year of the loan, adjusted for mergers that take place during the year of, but prior to, the loan. The following variables control for economy-wide influences: BAAMINAAA is the monthly difference between Moody’s seasoned Baa-rated corporate bonds and Aaa-rated corporate bonds, measured during the month of the loan; 10YRMIN6MO is the difference between the 10-year treasury bond and 6-month T-bill, measured during the month of the loan; and HHI is the Herfindahl index of domestic C&I loans as of the end of the year prior to the year of the loan. Also included is POST1996, an indicator variable that equals one if the date of the loan is after December 31, 1996. Firm fixed effects are included. All notional figures are deflated using the GDP Price Deflator, where the basis is the first quarter of 1992. For both Panels A and B, in column (1), the model is estimated using full sample of loans. In column (2), the model is estimated using loans to firms that are that are junk rated (JUNK) when receiving at least one of their loans, as measured by their Standard and Poor’s long term debt credit rating at the time of their loans. Junk rated borrowers have a credit rating of BB, B, CCC, CC, or C In column (3), the model is estimated using loans to firms that are that are investment-grade rated (IGRADE) when receiving at least one of their loans, as measured by their Standard and Poor’s long term debt credit rating at the time of their loans. Investment-grade borrowers have a credit rating of AAA, AA, A, or BBB. In column (4), the model is estimated using loans to firms that have an single lending relationship during the period from January 1, 1992 to December 31, 2002. A firm has a single relationship when the firm uses the same bank as its lender for all of its loans from top-50 banks (MULTREL9202 = 0). In column (5), the model is estimated using loans to firms that have multiple lending relationships during the period from January 1, 1992 to December 31,2002. A firm has multiple relationships when the firm uses more than one top-50 bank for its loans (MULTREL9202 = 1). Coefficients for the type dummies, purpose dummies, and firm fixed effects are not reported. In column (6) of Panel B, the model is estimated using loans from banks that do not merge with an investment bank during the sample period. There are no loans with rating AAA, CC, or C ; and, NR is left out to avoid colinearity. T-ratios are in parentheses, calculated using White heteroskedastic-consistent standard errors. ***, **, and * indicate significance at the 1%, 5%, and 10% level, respectively.

46
Panel A: Commercial Bank – Investment Bank Mergers
Full Sample (1)
Junk Rated
(2)
Investment-Grade Rated
(3)
Single Lending Relationship
(4)
Multiple Lending Relationship
(5) IBMERGE 13.394 **
(2.00) 43.644 ***
(3.55) -4.202
(-0.47) 18.039 **
(2.20) 2.547
(0.23) LNLENGTH -11.862 ***
(-3.03) -1.139
(-0.18) -4.120
(-0.96) -13.688 ***
(-2.98) -8.356
(-1.28) LNFACSIZE -14.102 ***
(-4.87) -6.23
(-1.26) -7.814 ***
(-2.68) -15.218 ***
(-4.47) -9.358 *
(-1.76) LNASSETS -30.783 ***
(-5.47) -16.705 *
(-1.65) -19.907 ***
(-2.61) -35.215 ***
(-5.56) -17.411 *
(-1.67) ROA -26.843
(-1.53) -2.08
(-0.08) -186.902 ***
(-3.61) -19.020
(-0.85) -37.571
(-1.45) LEVERAGE 141.845 ***
(7.72) 128.969 ***
(3.56) 103.130 ***
(2.98) 148.928 ***
(7.12) 94.362 ***
(2.64) AA -8.366
(-0.39) -15.257
(-0.74) 36.973
(1.32) -58.284 **
(-2.09) A -21.582
(-1.44) -95.656 ***
(-3.41) -26.480 *
(-1.71) -10.691
(-0.54) -46.409
(-1.63) BBB -4.486
(-0.41) -21.095
(-1.20) -19.211
(-1.57) 1.558
(0.12) -30.720
(-1.09) BB 28.321 ***
(2.89) 16.307
(1.53) 12.780
(1.02) 30.511 ***
(2.77) 29.093
(1.47) B 46.748 ***
(4.29) 33.043 ***
(2.77) 62.144 **
(2.22) 59.300 ***
(5.49) 29.633
(1.39) CCC 117.834 *
(1.73) 123.032 *
(1.74) 113.364
(1.46) 179.760 ***
(5.27) MULTREL 6.019
(0.71) 15.994
(1.07) 8.843
(0.82)
LOANMKTSHR -4.757
(-0.03) 315.097
(0.93) -333.587 **
(-2.05) 35.435
(0.24) -183.053
(-0.69) BAAMINAAA 44.405 **
(2.16) 46.435
(0.96) 14.381
(0.59) 47.829 *
(1.93) 18.310
(0.57) 10YRMIN6MO 8.526 ***
(2.59) 7.578
(1.15) 10.805 ***
(3.73) 10.600 ***
(2.72) -1.337
(-0.24) HHI 0.074
(1.12) 0.039
(0.28) 0.383 ***
(4.31) 0.074
(0.97) 0.034
(0.28) POST1996 -3.391
(-0.65) -12.811
(-1.34) -12.394 **
(-2.31) -0.195
(-0.03) -9.252
(-1.07) Intercept 899.458 ***
(8.33) 739.911 ***
(4.08) 559.855 ***
(3.09) 1002.800 ***
(8.44) 776.690 ***
(4.40) FIRM, TYPE, and PURPOSE Fixed Effects
Yes Yes Yes Yes Yes
R-Squared 0.4645 0.3850 0.5107 0.4675 0.4661 Number of Loans 2245 599 332 1731 514
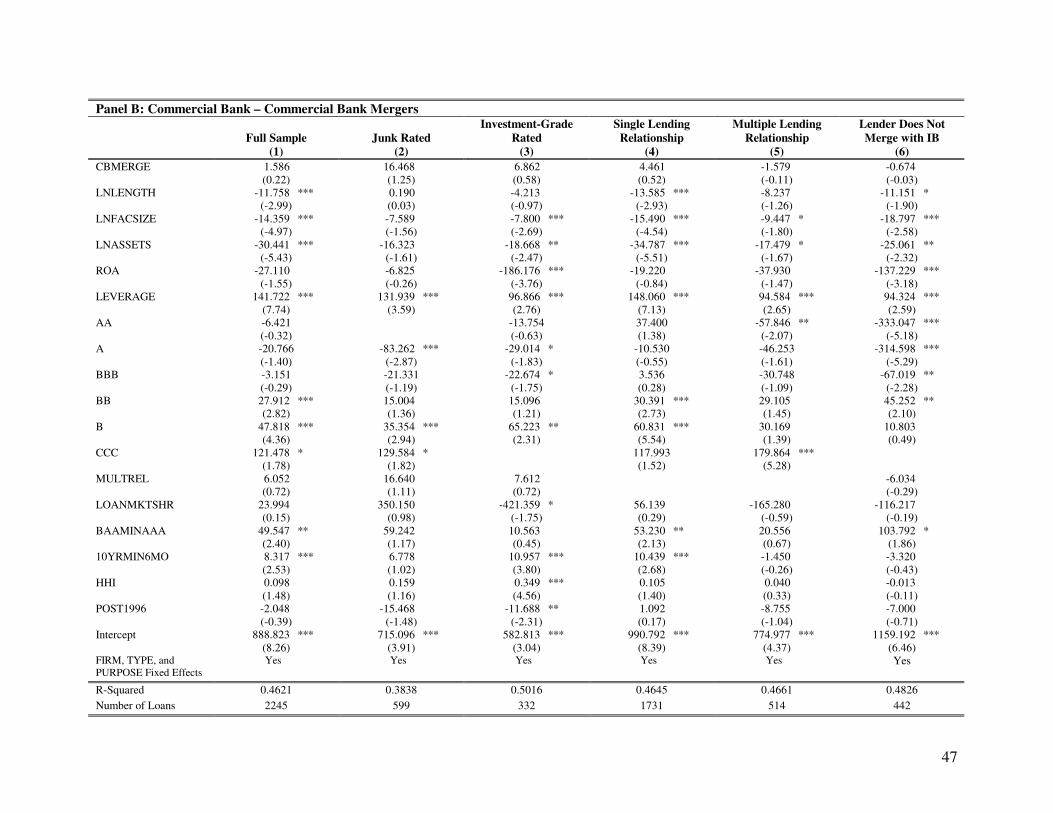
47
Panel B: Commercial Bank – Commercial Bank Mergers
Full Sample (1)
Junk Rated
(2)
Investment-Grade Rated
(3)
Single Lending Relationship
(4)
Multiple Lending Relationship
(5)
Lender Does Not Merge with IB
(6) CBMERGE 1.586
(0.22) 16.468
(1.25) 6.862
(0.58) 4.461
(0.52) -1.579
(-0.11) -0.674
(-0.03) LNLENGTH -11.758 ***
(-2.99) 0.190
(0.03) -4.213
(-0.97) -13.585 ***
(-2.93) -8.237
(-1.26) -11.151 *
(-1.90) LNFACSIZE -14.359 ***
(-4.97) -7.589
(-1.56) -7.800 ***
(-2.69) -15.490 ***
(-4.54) -9.447 *
(-1.80) -18.797 ***
(-2.58) LNASSETS -30.441 ***
(-5.43) -16.323
(-1.61) -18.668 **
(-2.47) -34.787 ***
(-5.51) -17.479 *
(-1.67) -25.061 **
(-2.32) ROA -27.110
(-1.55) -6.825
(-0.26) -186.176 ***
(-3.76) -19.220
(-0.84) -37.930
(-1.47) -137.229 ***
(-3.18) LEVERAGE 141.722 ***
(7.74) 131.939 ***
(3.59) 96.866 ***
(2.76) 148.060 ***
(7.13) 94.584 ***
(2.65) 94.324 ***
(2.59) AA -6.421
(-0.32) -13.754
(-0.63) 37.400 (1.38)
-57.846 ** (-2.07)
-333.047 *** (-5.18)
A -20.766 (-1.40)
-83.262 *** (-2.87)
-29.014 * (-1.83)
-10.530 (-0.55)
-46.253 (-1.61)
-314.598 *** (-5.29)
BBB -3.151 (-0.29)
-21.331 (-1.19)
-22.674 * (-1.75)
3.536 (0.28)
-30.748 (-1.09)
-67.019 ** (-2.28)
BB 27.912 *** (2.82)
15.004 (1.36)
15.096 (1.21)
30.391 *** (2.73)
29.105 (1.45)
45.252 ** (2.10)
B 47.818 *** (4.36)
35.354 *** (2.94)
65.223 ** (2.31)
60.831 *** (5.54)
30.169 (1.39)
10.803 (0.49)
CCC 121.478 * (1.78)
129.584 * (1.82)
117.993 (1.52)
179.864 *** (5.28)
MULTREL 6.052 (0.72)
16.640 (1.11)
7.612 (0.72)
-6.034 (-0.29)
LOANMKTSHR 23.994 (0.15)
350.150 (0.98)
-421.359 * (-1.75)
56.139 (0.29)
-165.280 (-0.59)
-116.217 (-0.19)
BAAMINAAA 49.547 ** (2.40)
59.242 (1.17)
10.563 (0.45)
53.230 ** (2.13)
20.556 (0.67)
103.792 * (1.86)
10YRMIN6MO 8.317 *** (2.53)
6.778 (1.02)
10.957 *** (3.80)
10.439 *** (2.68)
-1.450 (-0.26)
-3.320 (-0.43)
HHI 0.098 (1.48)
0.159 (1.16)
0.349 *** (4.56)
0.105 (1.40)
0.040 (0.33)
-0.013 (-0.11)
POST1996 -2.048 (-0.39)
-15.468 (-1.48)
-11.688 ** (-2.31)
1.092 (0.17)
-8.755 (-1.04)
-7.000 (-0.71)
Intercept 888.823 *** (8.26)
715.096 *** (3.91)
582.813 *** (3.04)
990.792 *** (8.39)
774.977 *** (4.37)
1159.192 *** (6.46)
FIRM, TYPE, and PURPOSE Fixed Effects
Yes Yes Yes Yes Yes Yes
R-Squared 0.4621 0.3838 0.5016 0.4645 0.4661 0.4826 Number of Loans 2245 599 332 1731 514 442