Embed Size (px)
Citation preview
May 2014
Information and Communications Technology Sector (ICT) Market Data 2013
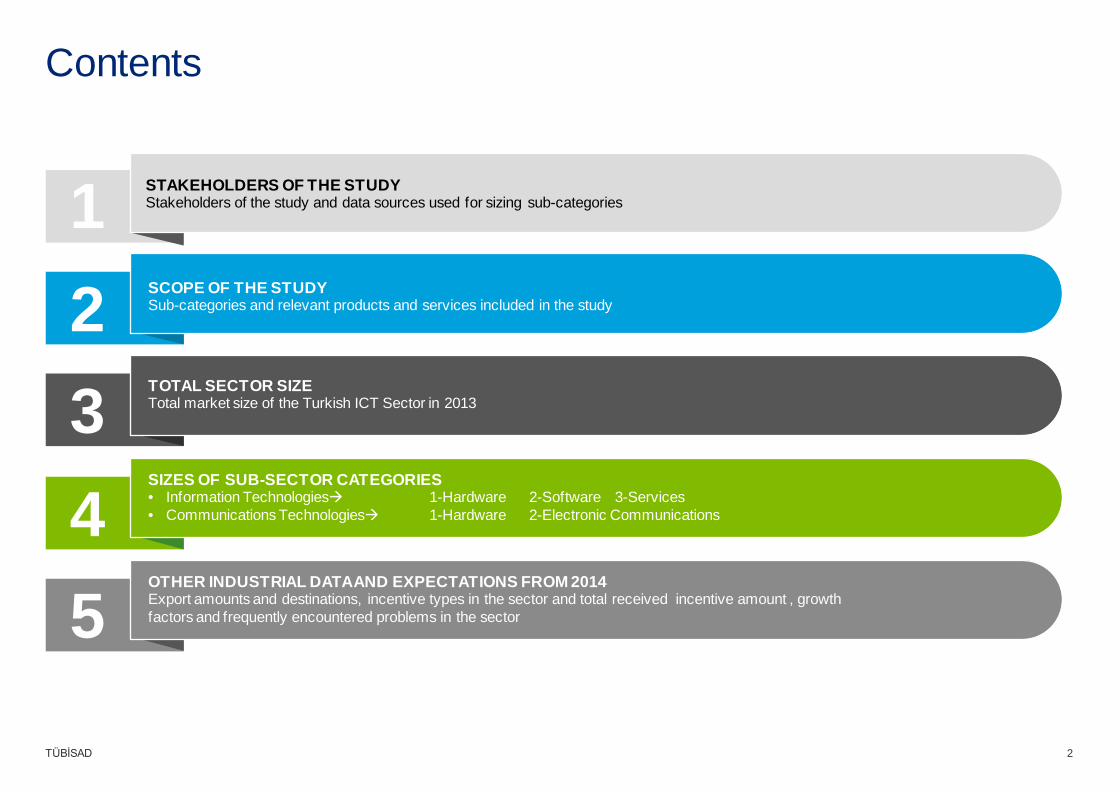
Contents
1 2 3 4 5
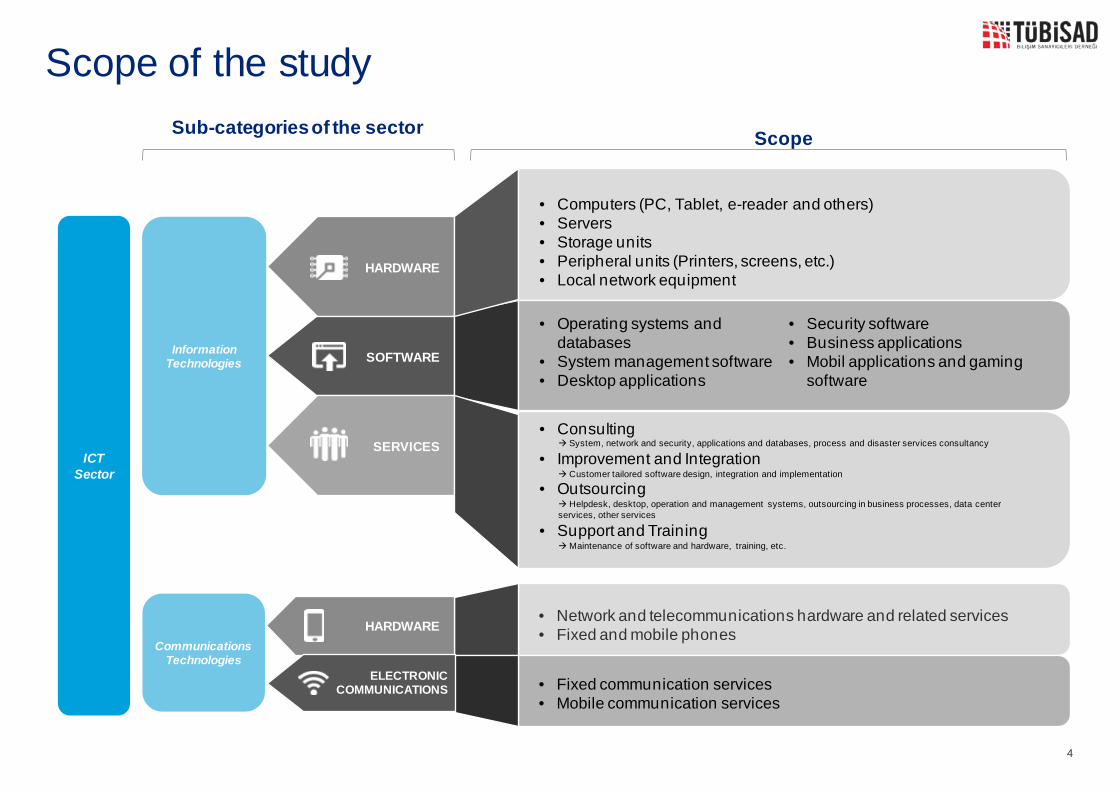
SCOPE OF THE STUDY Sub-categories and relevant products and services included in the study
STAKEHOLDERS OF THE STUDY Stakeholders of the study and data sources used for sizing sub-categories
TOTAL SECTOR SIZE Total market size of the Turkish ICT Sector in 2013
SIZES OF SUB-SECTOR CATEGORIES • Information Technologies 1-Hardware 2-Software 3-Services • Communications Technologies 1-Hardware 2-Electronic Communications
OTHER INDUSTRIAL DATA AND EXPECTATIONS FROM 2014 Export amounts and destinations, incentive types in the sector and total received incentive amount , growth factors and frequently encountered problems in the sector
TÜBİSAD 2
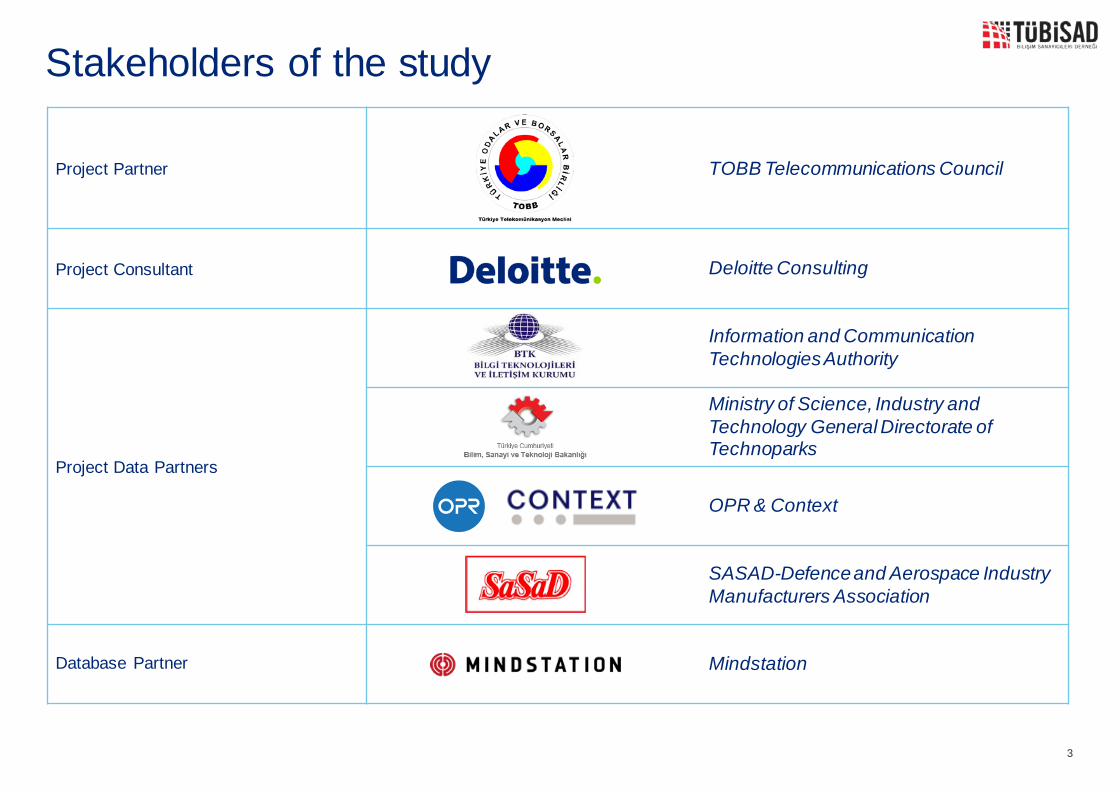
Project Partner TOBB Telecommunications Council
Project Consultant Deloitte Consulting
Project Data Partners
Information and Communication Technologies Authority
Ministry of Science, Industry and Technology General Directorate of Technoparks
OPR & Context
SASAD-Defence and Aerospace Industry Manufacturers Association
Database Partner Mindstation
Stakeholders of the study
3
HARDWARE
SOFTWARE
SERVICES
• Computers (PC, Tablet, e-reader and others) • Servers • Storage units • Peripheral units (Printers, screens, etc.) • Local network equipment
• Operating systems and databases
• System management software • Desktop applications
• Security software • Business applications • Mobil applications and gaming
software
• Consulting System, network and security, applications and databases, process and disaster services consultancy
• Improvement and Integration Customer tailored software design, integration and implementation
• Outsourcing Helpdesk, desktop, operation and management systems, outsourcing in business processes, data center services, other services
• Support and Training Maintenance of software and hardware, training, etc.
• Network and telecommunications hardware and related services • Fixed and mobile phones
• Fixed communication services • Mobile communication services
HARDWARE
ELECTRONIC COMMUNICATIONS
Information Technologies
Communications Technologies
Sub-categories of the sector Scope
ICT Sector
Scope of the study
4
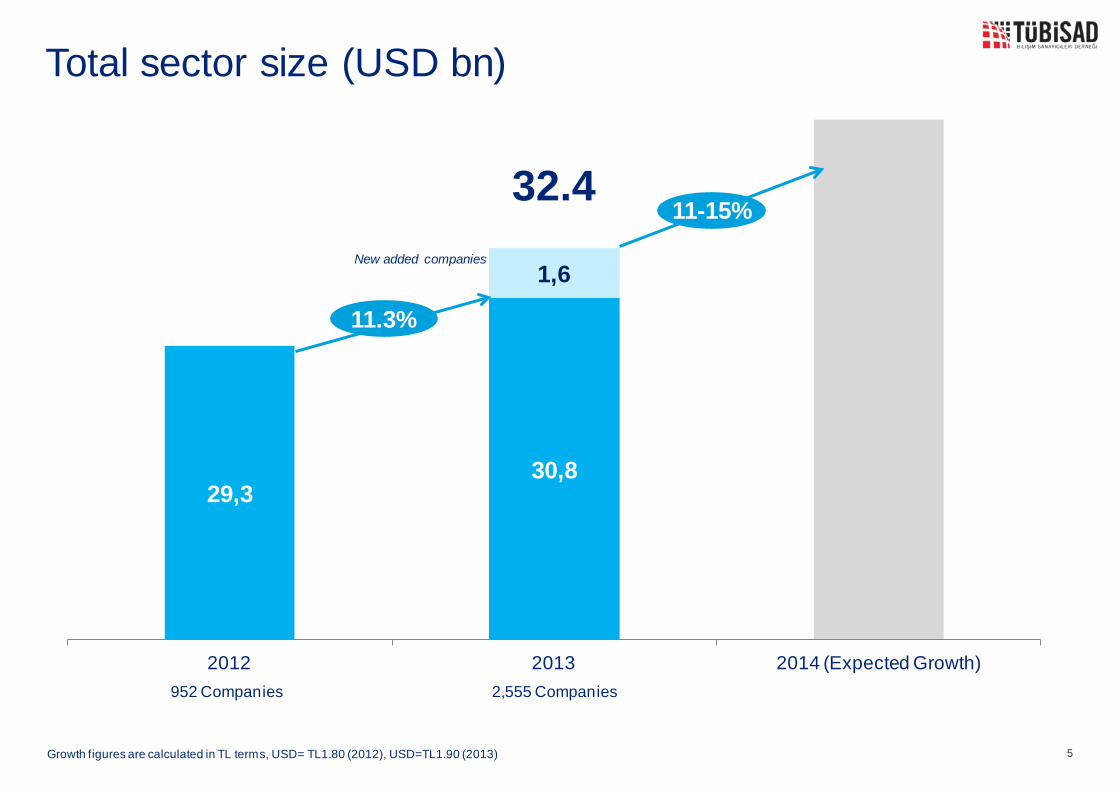
Total sector size (USD bn)
29,3 30,8
1,6
2012 2013 2014 (Expected Growth)
5
New added companies
11.3%
11-15% 32.4
952 Companies 2,555 Companies
Growth figures are calculated in TL terms, USD= TL1.80 (2012), USD=TL1.90 (2013)
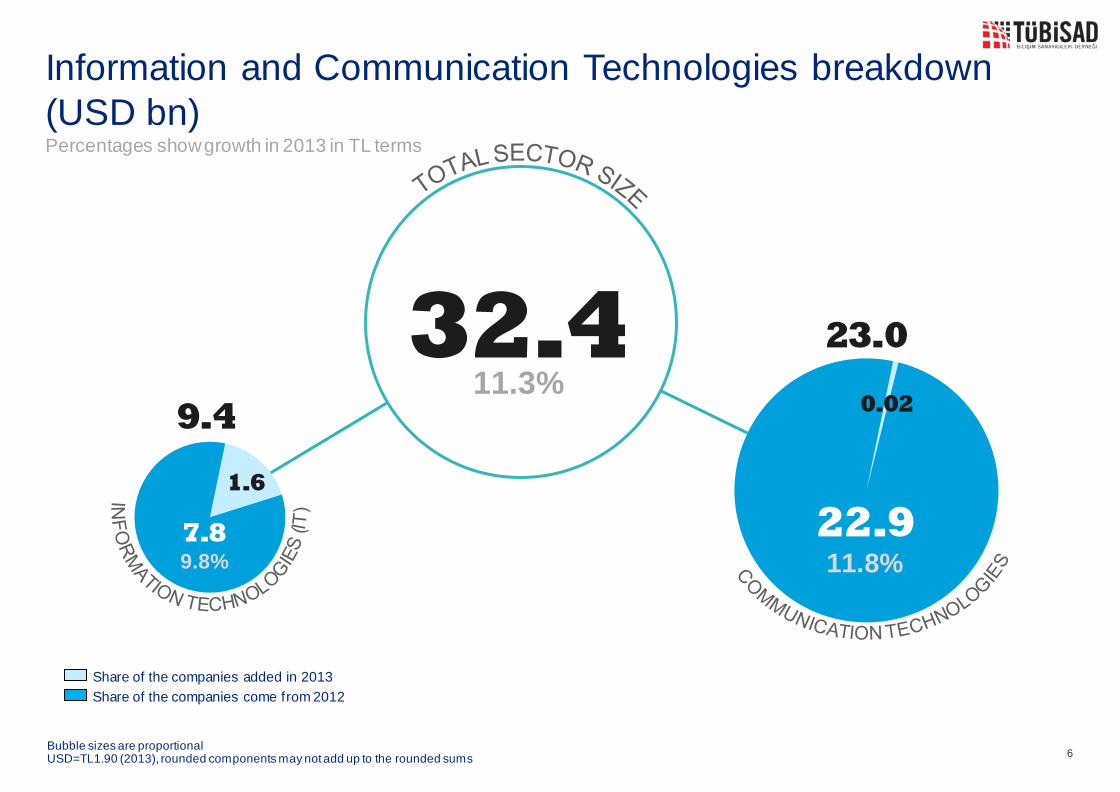
Information and Communication Technologies breakdown (USD bn) Percentages show growth in 2013 in TL terms
6
32.4
7.8 9.8%
1.6
9.4
Share of the companies added in 2013
Share of the companies come from 2012
22.9 11.8%
0.02
23.0 11.3%
Bubble sizes are proportional USD=TL1.90 (2013), rounded components may not add up to the rounded sums
4.8 8%
0.4
5.3
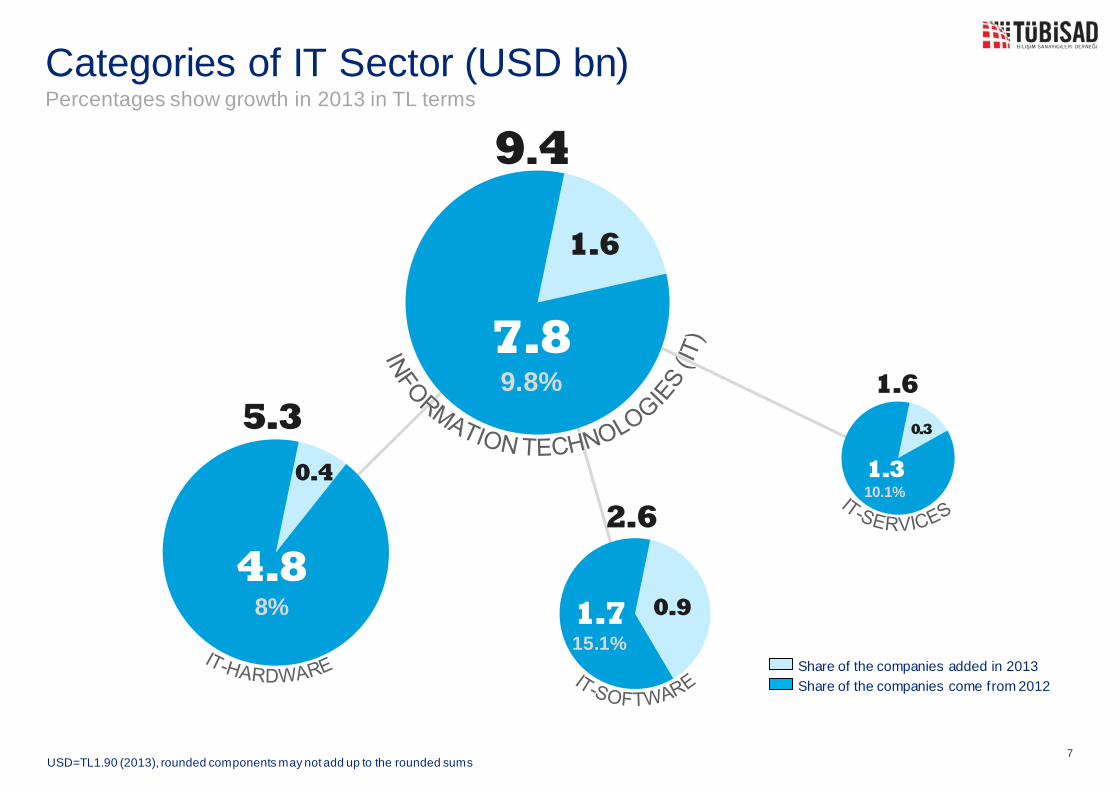
Categories of IT Sector (USD bn) Percentages show growth in 2013 in TL terms
7
7.8 9.8%
1.6
9.4
1.7 15.1%
0.9
2.6
1.3 10.1%
0.3
1.6
Share of the companies added in 2013
Share of the companies come from 2012
USD=TL1.90 (2013), rounded components may not add up to the rounded sums
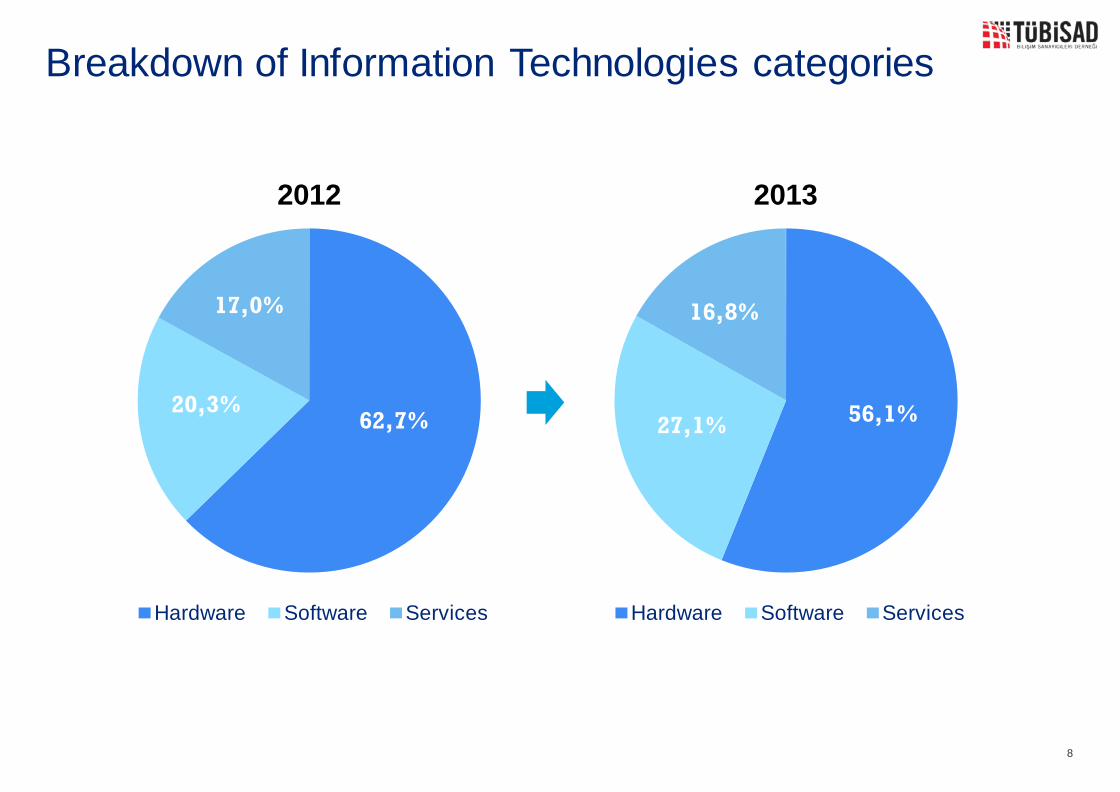
Breakdown of Information Technologies categories
8
56,1% 27,1%
16,8%
2013
Hardware Software Services
62,7% 20,3%
17,0%
2012
Hardware Software Services

17.0 7.3%
17.0
6.0 27%
0.02
6.0
Categories of Communication Tech. Sector (USD bn) Percentages show growth in 2013 in TL terms
9
22.9 11.8%
0.02
23.0
Share of the companies added in 2013
Share of the companies come from 2012
USD=TL1.90 (2013), rounded components may not add up to the rounded sums
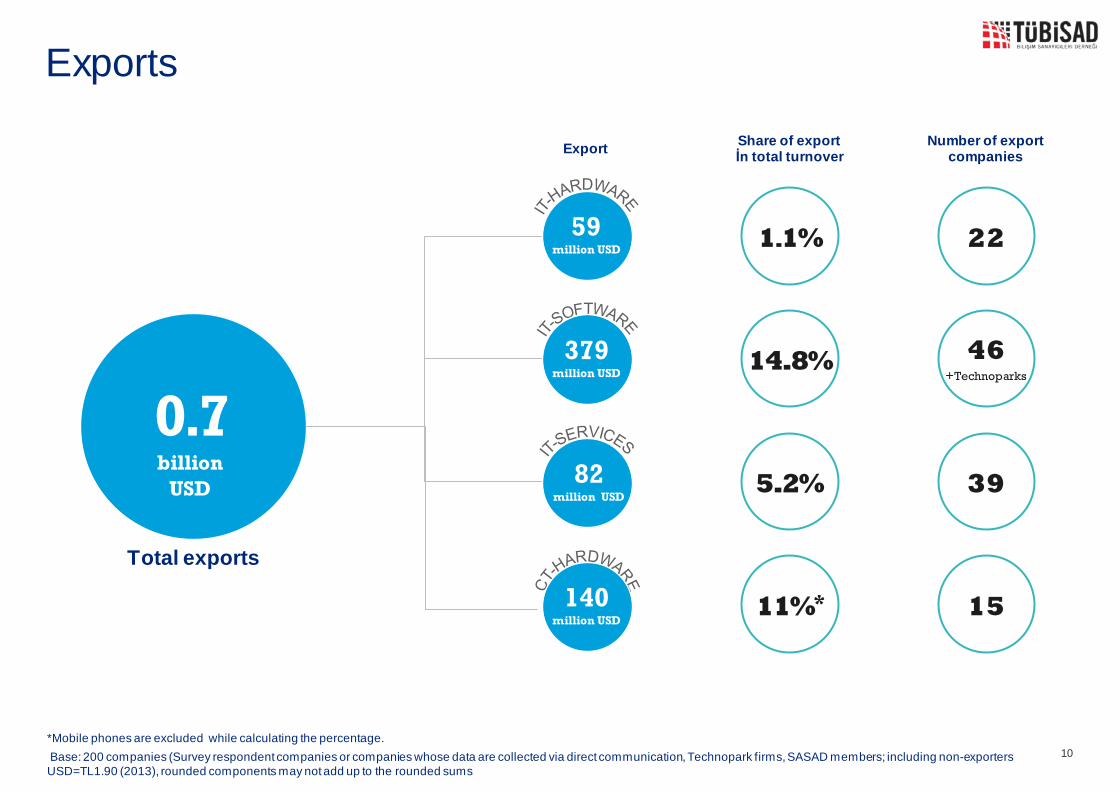
Exports
Total exports
0.7 billion
USD
59 million USD
379 million USD
82 million USD
140 million USD
Export
1.1%
14.8%
5.2%
11%*
Share of export İn total turnover
*Mobile phones are excluded while calculating the percentage. 10
22
46 +Technoparks
39
15
Number of export companies
Base: 200 companies (Survey respondent companies or companies whose data are collected via direct communication, Technopark firms, SASAD members; including non-exporters USD=TL1.90 (2013), rounded components may not add up to the rounded sums
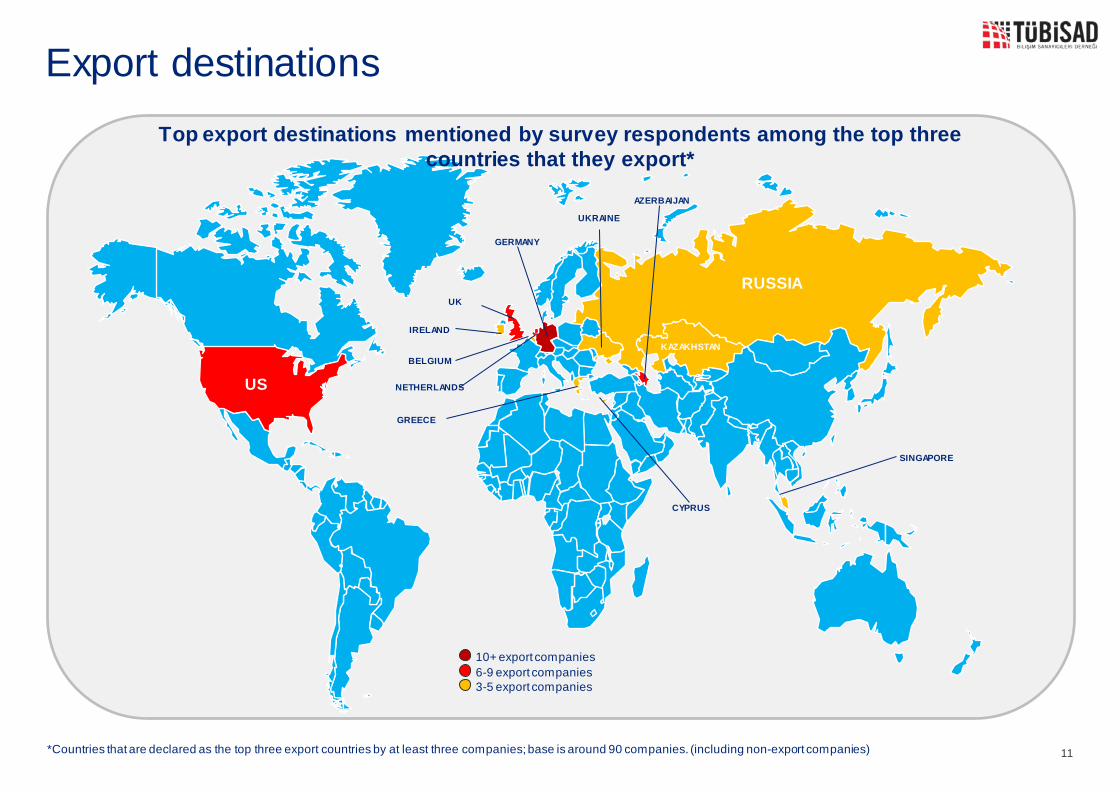
Export destinations Top export destinations mentioned by survey respondents among the top three
countries that they export*
11
3-5 export companies 6-9 export companies 10+ export companies
*Countries that are declared as the top three export countries by at least three companies; base is around 90 companies. (including non-export companies)
US
RUSSIA
KAZAKHSTAN
UK
GERMANY
IRELAND
BELGIUM
NETHERLANDS
GREECE
UKRAINE
AZERBAIJAN
SINGAPORE
CYPRUS
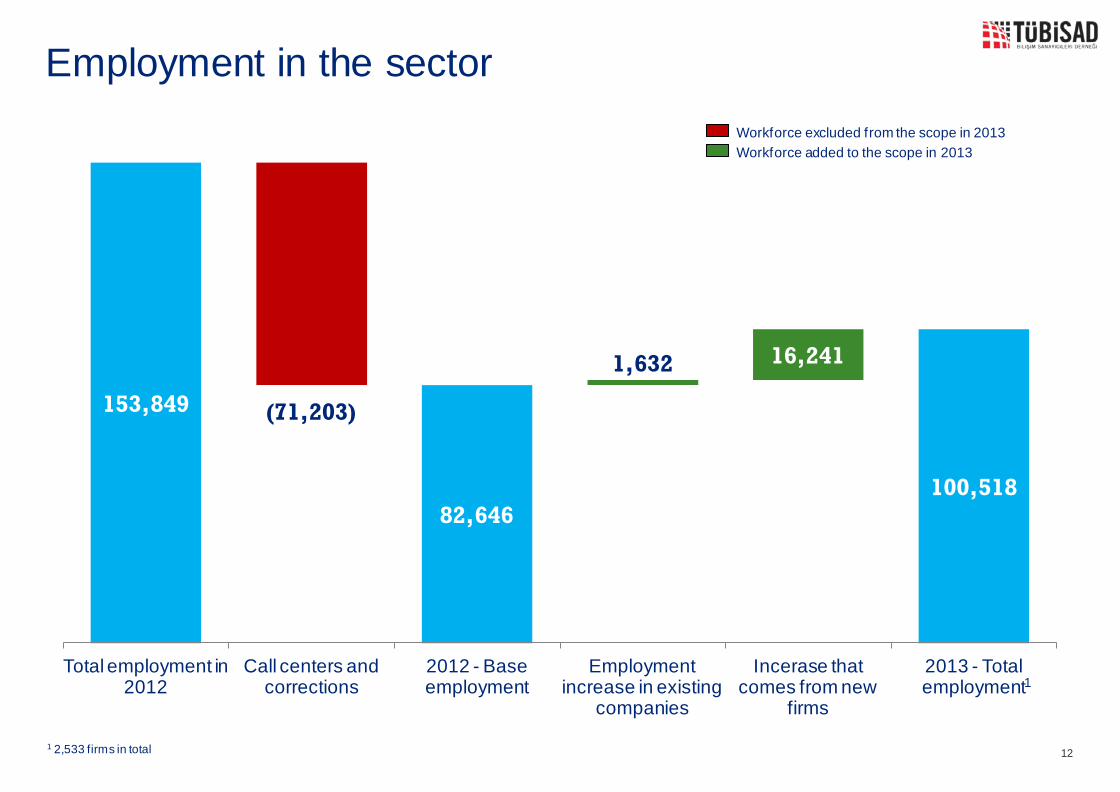
Employment in the sector
12
153,849
82,646 100,518
(71,203)
1,632 16,241
Total employment in 2012
Call centers and corrections
2012 - Base employment
Employment increase in existing
companies
Incerase that comes from new
firms
2013 - Total employment
Workforce excluded from the scope in 2013
Workforce added to the scope in 2013
1
1 2,533 firms in total
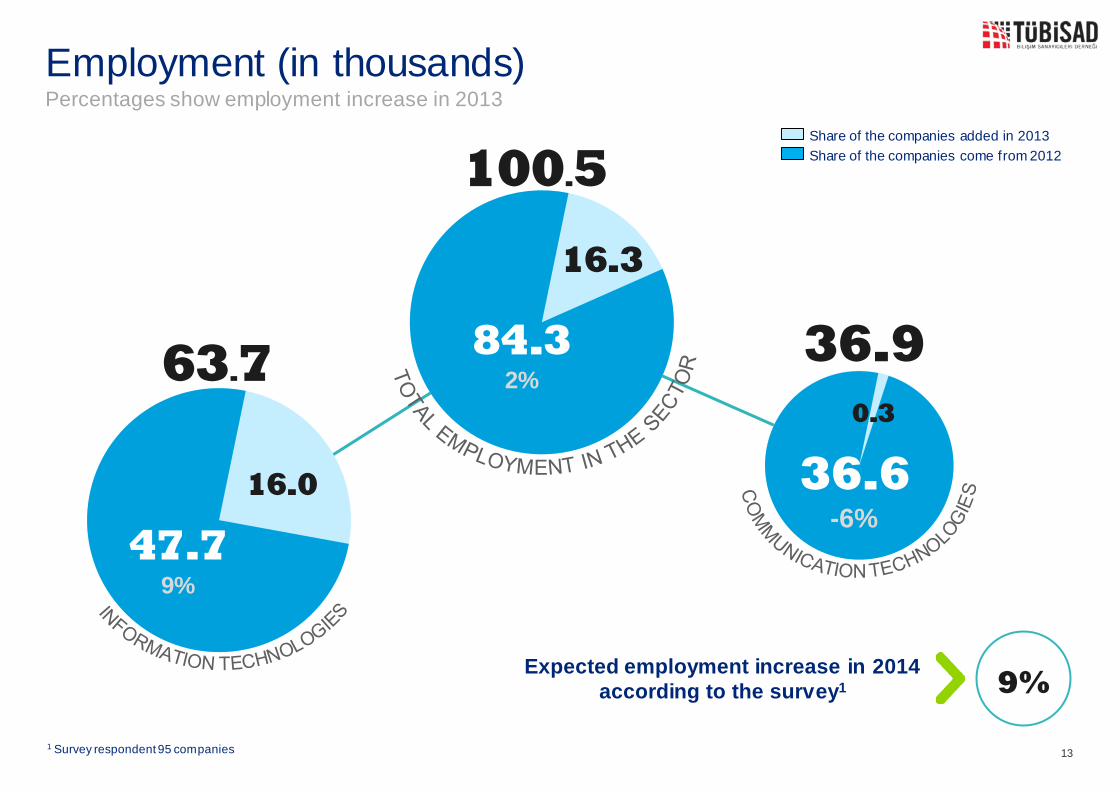
47.7 9%
16.0
63.7
Employment (in thousands) Percentages show employment increase in 2013
13
36.6 -6%
%xx 36.9 84.3
2%
16.3
100.5
9% Expected employment increase in 2014 according to the survey1
Share of the companies added in 2013
Share of the companies come from 2012
0.3
1 Survey respondent 95 companies
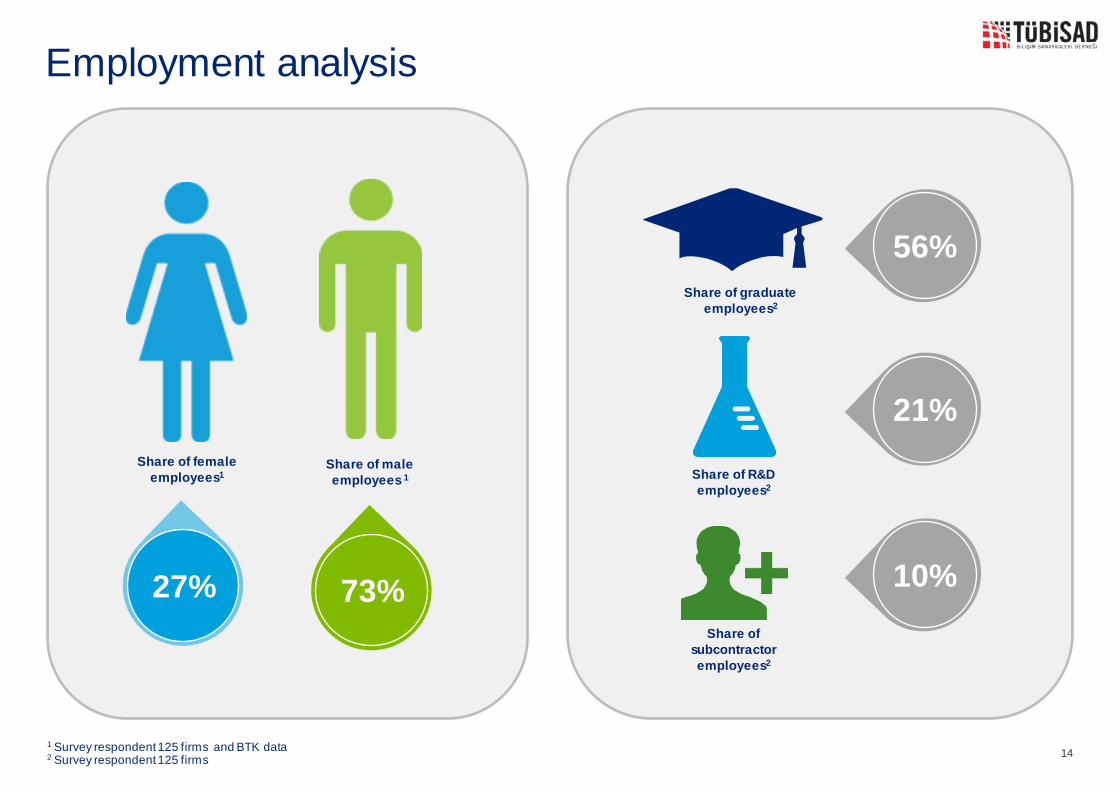
Employment analysis
27% 73%
Share of female employees1
Share of male employees 1
56% Share of graduate
employees2
Share of R&D employees2
21%
Share of subcontractor employees2
10%
14 1 Survey respondent 125 firms and BTK data 2 Survey respondent 125 firms
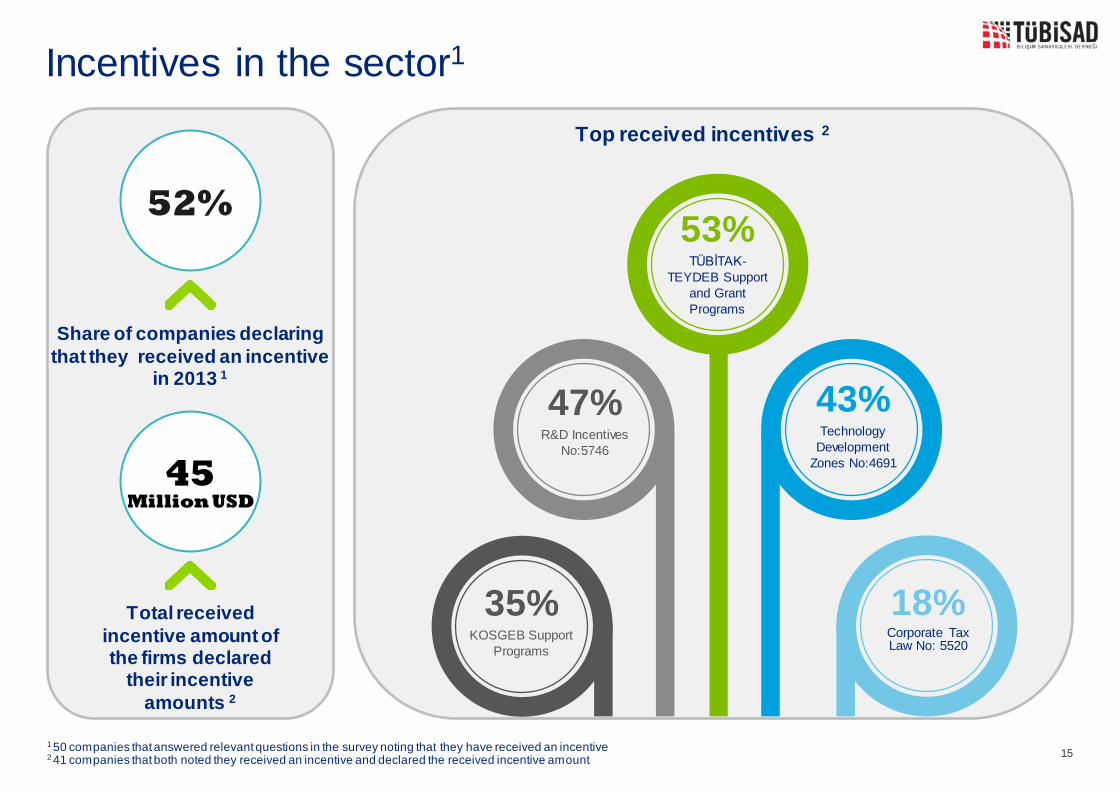
52%
Share of companies declaring that they received an incentive
in 2013 1
45 Million USD
Total received incentive amount of the firms declared
their incentive amounts 2
47% R&D Incentives
No:5746
53% TÜBİTAK-
TEYDEB Support and Grant Programs
43% Technology
Development Zones No:4691
18% Corporate Tax Law No: 5520
35% KOSGEB Support
Programs
Top received incentives 2
Incentives in the sector1
15 1 50 companies that answered relevant questions in the survey noting that they have received an incentive 2 41 companies that both noted they received an incentive and declared the received incentive amount
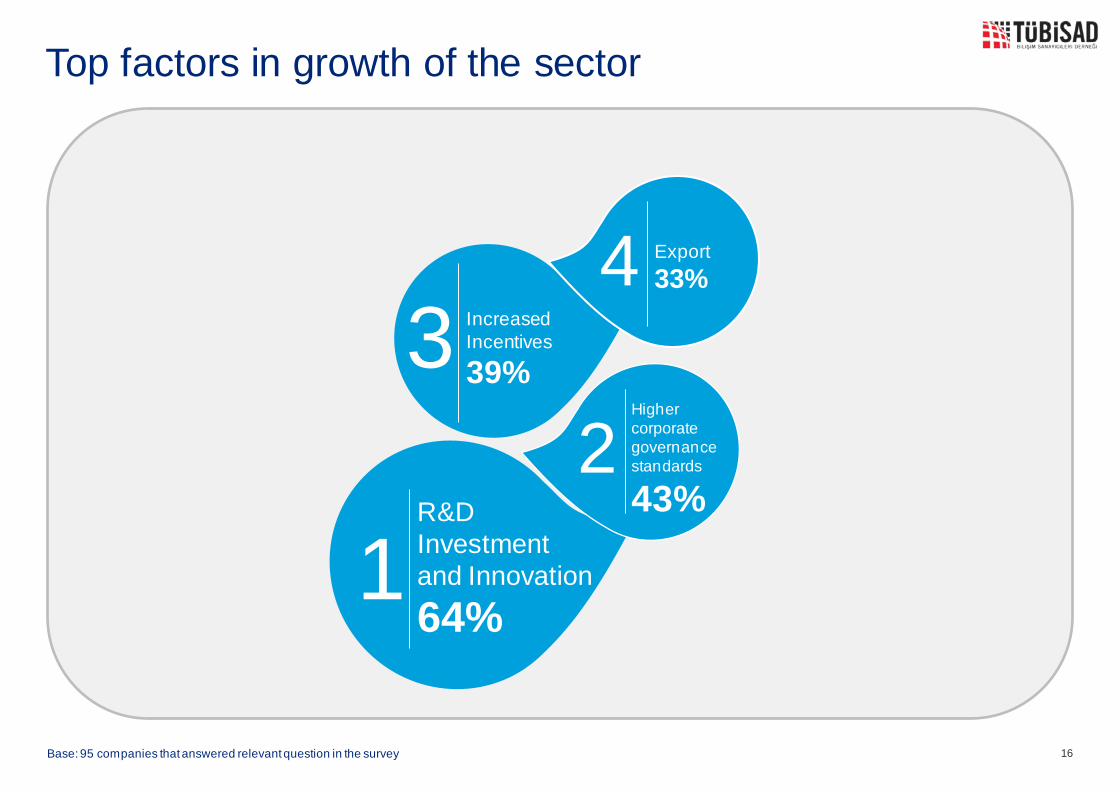
Top factors in growth of the sector
R&D Investment and Innovation
64% 1
Increased Incentives
39% 3 Higher corporate governance standards
43% 2
Export 33% 4
16 Base: 95 companies that answered relevant question in the survey
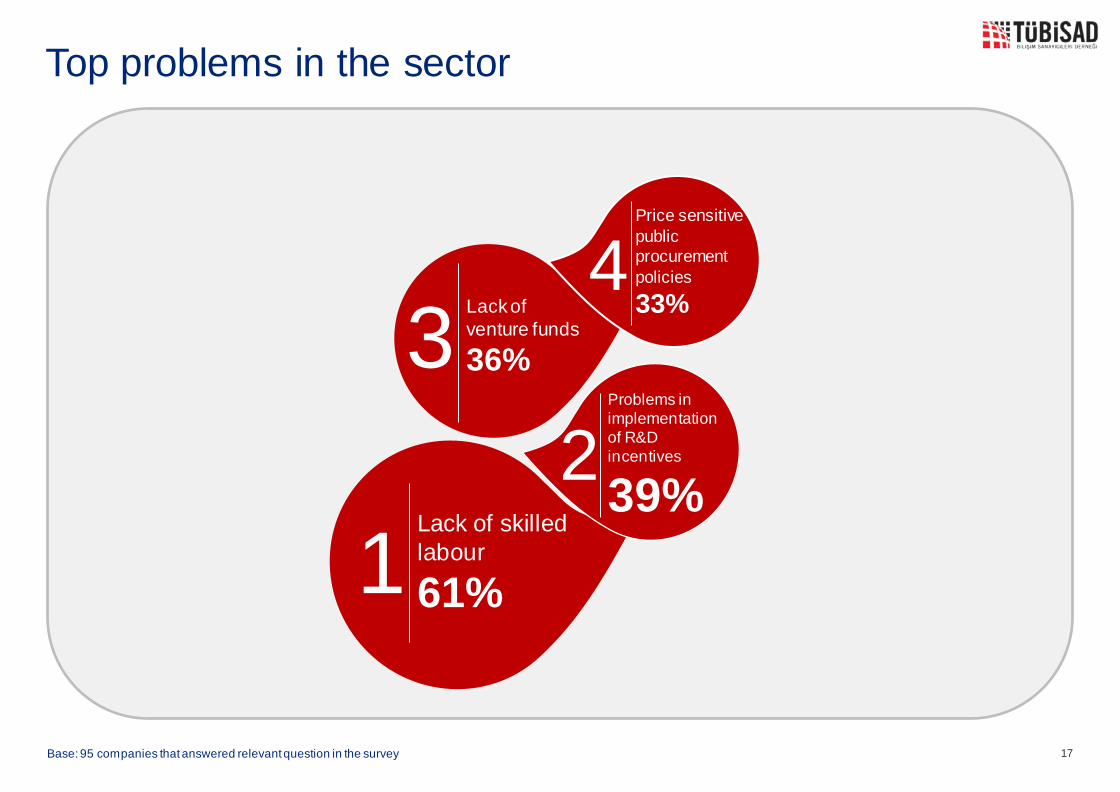
Top problems in the sector
Lack of skilled labour
61% 1
Lack of venture funds
36% 3 Problems in implementation of R&D incentives
39% 2
Price sensitive public procurement policies
33% 4
17 Base: 95 companies that answered relevant question in the survey
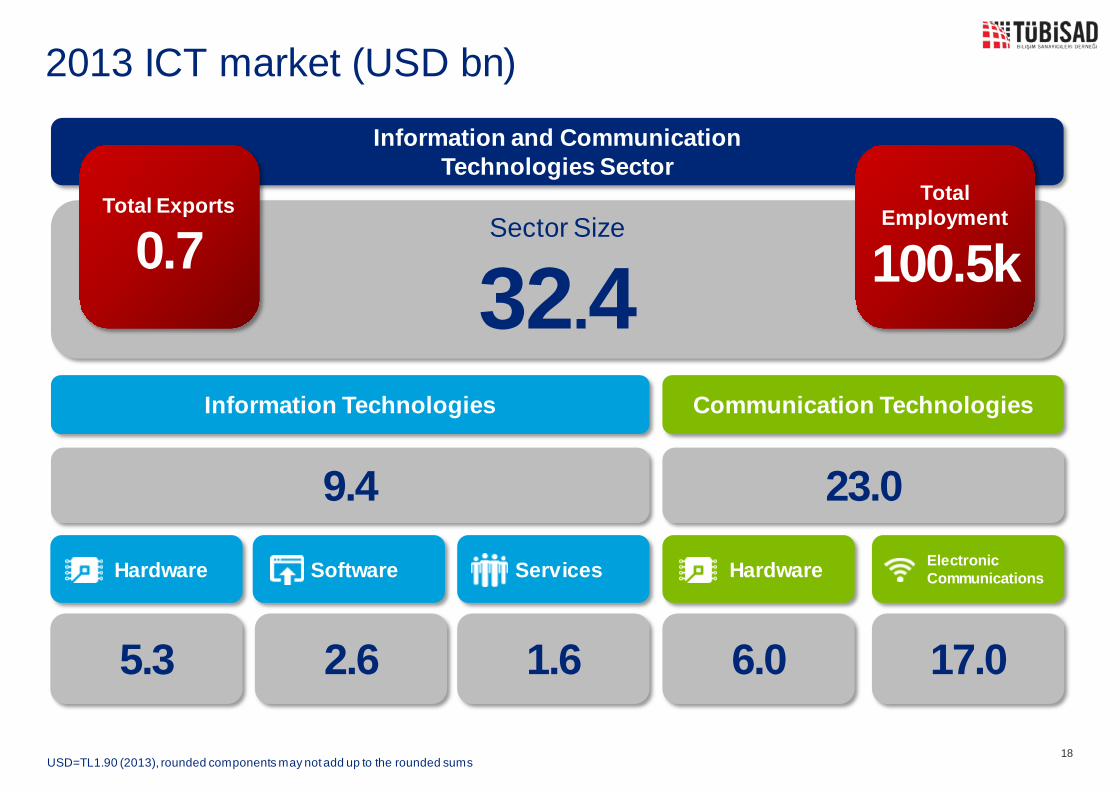
2013 ICT market (USD bn)
18
Information Technologies Communication Technologies
Hardware Software Services Hardware Electronic Communications
5.3 2.6 1.6 6.0 17.0
9.4 23.0
Information and Communication Technologies Sector
Sector Size
32.4 Total Exports
0.7 Total
Employment
100.5k
USD=TL1.90 (2013), rounded components may not add up to the rounded sums
THANK YOU
We would like to express our appreciation to TOBB Telecommunications Council, Deloitte Consulting, Information and Communications Technologies Authority,
Ministry of Science, Industry, and Technology General Directorate of Technoparks, OPR, Context, SASAD, Mindstation,
TÜBİSAD member firms and sector companies for their valuable contributions .
This report has been prepared for TÜBİSAD by Deloitte Consulting. Any data in this report can not be used -neither as comment nor partially- copied or shared with third parties without written consent of TÜBİSAD and Deloitte Consulting.
19