Embed Size (px)
Citation preview

ASSET MANAGEMENT PLAN 2015-16
INFORMATION AND COMMUNICATIONS TECHNOLOGY
- i -
CITY OF PLAYFORD – ICT SERVICES - ASSET MANAGEMENT PLAN (Endorsed by Council – 23/06/15)
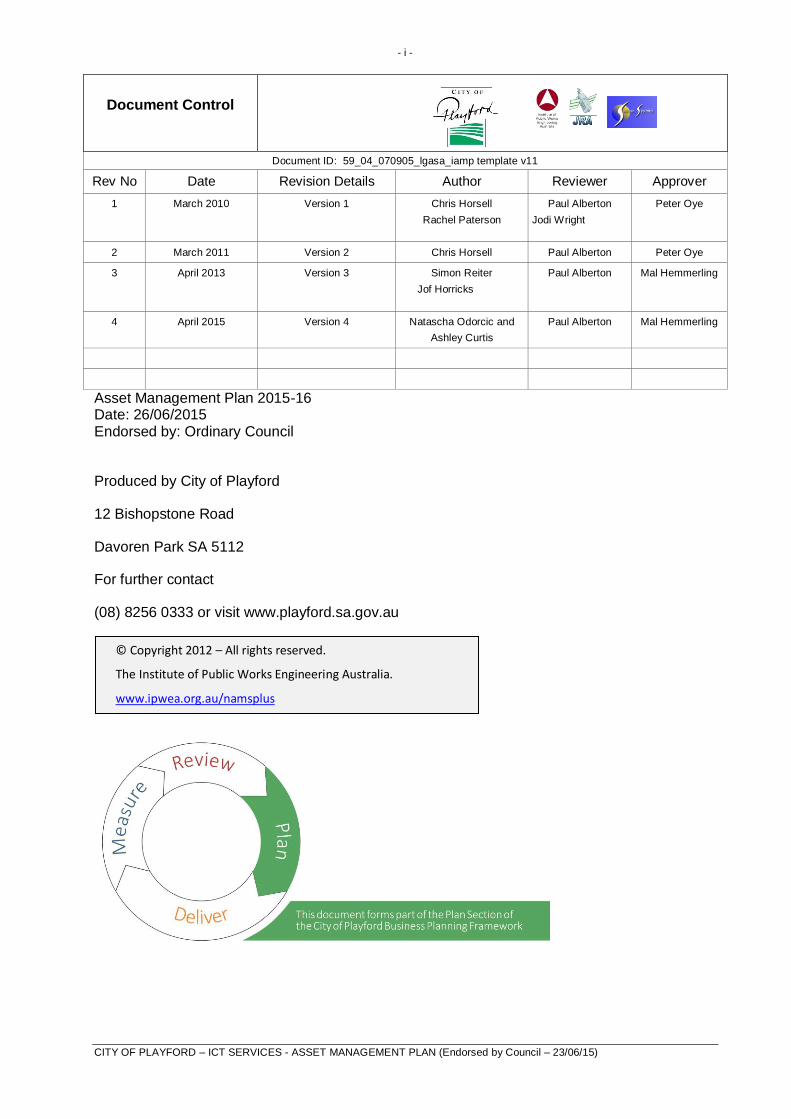
Document Control
Document ID: 59_04_070905_lgasa_iamp template v11
Rev No Date Revision Details Author Reviewer Approver
1 March 2010 Version 1 Chris Horsell
Rachel Paterson Paul Alberton
Jodi Wright
Peter Oye
2 March 2011 Version 2 Chris Horsell Paul Alberton Peter Oye
3 April 2013 Version 3 Simon Reiter
Jof Horricks
Paul Alberton Mal Hemmerling
4 April 2015 Version 4 Natascha Odorcic and
Ashley Curtis
Paul Alberton Mal Hemmerling
Asset Management Plan 2015-16 Date: 26/06/2015 Endorsed by: Ordinary Council
Produced by City of Playford
12 Bishopstone Road
Davoren Park SA 5112
For further contact
(08) 8256 0333 or visit www.playford.sa.gov.au
© Copyright 2012 – All rights reserved.
The Institute of Public Works Engineering Australia.
www.ipwea.org.au/namsplus

- ii -
CITY OF PLAYFORD – ICT SERVICES - ASSET MANAGEMENT PLAN (Endorsed by Council – 23/06/15)
TABLE OF CONTENTS
1. EXECUTIVE SUMMARY .................................................................................................................................................. 1 What Council Provides ........................................................................................... 1 What does it Cost? ................................................................................................. 1 Plans for the Future ................................................................................................ 1 Measuring our Performance ................................................................................... 1 Confidence Levels .................................................................................................. 2 The Next Steps ....................................................................................................... 2 What is an Asset Management Plan? ..................................................................... 2
2. INTRODUCTION .............................................................................................................................................................. 3 2.1 Background ...................................................................................................... 3 2.2 Goals and Objectives of Asset Management .................................................... 5 2.3 Plan Framework ............................................................................................... 5 2.4 Core and Advanced Asset Management .......................................................... 7 2.5 Community Consultation .................................................................................. 7
3. LEVELS OF SERVICE ..................................................................................................................................................... 8 3.1 Customer Research and Expectations ............................................................. 8 3.2 Strategic and Corporate Goals ....................................................................... 10 3.3 Legislative Requirements ............................................................................... 11 3.4 Current Levels of Service ............................................................................... 11 3.5 Desired Levels of Service .............................................................................. 12
4. FUTURE DEMAND ........................................................................................................................................................ 13 4.1 Demand Drivers ............................................................................................. 13 4.2 Demand Forecast .......................................................................................... 13 4.3 Demand Impact on Assets ............................................................................. 13 4.4 Demand Management Plan............................................................................ 14 4.5 Asset Programs to Meet Demand .................................................................. 14
5. LIFECYCLE MANAGEMENT PLAN ............................................................................................................................... 16 5.1 Background Data ........................................................................................... 16 5.2 Risk Management Plan .................................................................................. 18 5.3 Routine Operations and Maintenance Plan .................................................... 19 5.4 Renewal / Replacement Plan ......................................................................... 21 5.5 Creation/ Acquisition / Upgrade Plan .............................................................. 25
6. FINANCIAL SUMMARY ................................................................................................................................................. 27 6.1 Financial Statements and Projections ............................................................ 27 6.2 Funding Strategy ............................................................................................ 31 6.3 Valuation Forecasts ....................................................................................... 31 6.4 Key Assumptions made in Financial Forecasts .............................................. 33 6.5 Forecast Reliability and Confidence ............................................................... 34
7. PLAN IMPROVEMENT AND MONITORING ................................................................................................................... 35 7.1 Status of Asset Management Practices .......................................................... 35 7.2 Improvement Program ................................................................................... 36 7.3 Monitoring and Review Procedures ................................................................ 36
8. REFERENCES ............................................................................................................................................................... 37 9. APPENDICES ................................................................................................................................................................ 38
Appendix A Maintenance Response Levels of Service ...................................... 39 Appendix B Projected 10 year Capital Renewal and ......................................... 40 Replacement Program .......................................................................................... 40 Appendix C Projected Upgrade/Exp/New 10 year Capital Works ...................... 41 Program ................................................................................................................ 41 Appendix D Budgeted Expenditures Accommodated in LTFP ........................... 42 To be developed ................................................................................................... 42 Appendix E ABBREVIATIONS .......................................................................... 43 APPENDIX F GLOSSARY ................................................................................ 44
- 1 -
CITY OF PLAYFORD – ICT SERVICES - ASSET MANAGEMENT PLAN (Endorsed by Council – 23/06/15)
1. EXECUTIVE SUMMARY
What Council Provides
Council provides an Information Communication & Technology (ICT) Services network to enable the delivery of services to the community which support the governance and accountability of Council. These services are provided in partnership with end users to enable a systematic process of capturing, organising, sharing and using information to enable us to meet our strategic objectives and deliver services to our Community.
What does it Cost?
The projected outlays necessary to provide the services covered by this Asset Management Plan (AM Plan) includes operations, maintenance, renewal and upgrade of existing assets over the 10 year planning period is $26.7m or $2.6m on average per year.
Estimated available funding for this period is $27.0m or $2.7m on average per year which is 101% of the cost to provide the service.
Plans for the Future
Council plans to operate and maintain the ICT network to achieve the following strategic objectives.
1. We are committed to meeting customer needs and providing well informed advice and direction so that users of our systems achieve the best possible outcomes. We aim to strive for excellence and best practice in technology, information management and service delivery to meet customer expectations at the highest level possible, subject to budget limitations
2. Ensure the ICT network is maintained at a safe and functional standard.
3. Build our capacity for excellence 4. Ensure we apply resources to meet
short term requirements and long term sustainability
5. Operation, maintenance, renewal and upgrade of all ICT assets to meet service levels are set in annual budgets.
6. ICT infrastructure, including servers, desktops, personal computers, printers, mobile devices, networking, telephony and audio visual equipment replacement will be managed via business plans.
Measuring our Performance
Quality ICT assets will be maintained in a reasonably usable condition. Defects found or reported that are outside our service standard will be repaired.
Function Our intent is that an appropriate ICT network is maintained in partnership with other levels of government and stakeholders for the sustainable delivery of ICT systems.
ICT asset attributes will be maintained at a safe level and associated equipment be provided to ensure key functional objectives are met:
Cultivate continuous improvement practice across the organisation
Strategically develop and administer assets for maximum organisational and community benefit
The main functional consequence of the ICT services is to enable us to deliver more efficient and more effective services to our community, and thereby achieve Council’s strategic objectives by:
Applying a whole-of-organisation approach to the consideration and delivery of services and projects.
Ensuring that cost effective, integrated and innovative solutions can be delivered to meet challenges,
Broadening the understanding and ownership of knowledge management within the organisation
Safety We monitor all ICT and prioritise and repair defects in accordance with our inspection schedule to ensure they are safe and fully operational.

- 2 -
CITY OF PLAYFORD – ICT SERVICES - ASSET MANAGEMENT PLAN (Endorsed by Council – 23/06/15)
Confidence Levels
This AM Plan is based on reliablemedium level of confidence information.
The Next Steps
This actions resulting from this Asset Management Plan are:
Review data management quality procedures.
Compile a long term financial plan based on asset life cycle funding requirements
Implement trend analysis and capacity planning to facilitate proactive asset acquisitions based on organisational growth.
Questions you may have
What is an Asset Management Plan?
Asset management planning is a comprehensive process to ensure delivery of services from assets are provided in a financially sustainable manner.
An asset management plan details information about assets including actions required to provide an agreed level of service in the most cost effective manner. The plan defines the services to be provided, how the services are provided and what funds are required to provide the services.

- 3 -
CITY OF PLAYFORD – ICT SERVICES - ASSET MANAGEMENT PLAN (Endorsed by Council – 23/06/15)
2. INTRODUCTION
2.1 Background
This Asset Management Plan is to demonstrate responsive management of assets (and services provided from assets), compliance with regulatory requirements, and to communicate funding required to provide the required levels of service.
Previous patterns of ICT assets have generally been opportunistic and driven by demand. The number of assets that City of Playford has acquired over time and the ad hoc nature of asset investment mean that the City of Playford’s resources to maintain and upgrade the asset have not been adequate. The expectations associated with levels of service for ICT have changed over the years, staff and community need is a significant factor in the management of ICT assets. City of Playford recognises that its relationship with its communities is changing, and that communities are more involved in levels of service consultation and decision making. The asset management plan follows the format for AM Plans recommended in Section 4.2.6 of the International Infrastructure Management Manual1. The ICT Asset Management Plan is to be read with the following planning documents:
ICT Strategy.
ICT Team Operational Plan.
Strategic Plan Delivery Program 2015/16 – 2018/19 (inclusive of the 2015/16 Annual Business Plan and Budget),
Strategic Plan,
Long Term Financial Plan 2015/16 – 2024/25,
Playford Community Vision 2043.
Emergency Response Plan.
ICT Disaster Recovery Plan
1 IPWEA, 2011, Sec 4.2.6, Example of an Asset Management Plan Structure, pp 4|24 – 27.
- 4 -
CITY OF PLAYFORD – ICT SERVICES - ASSET MANAGEMENT PLAN (Endorsed by Council – 23/06/15)
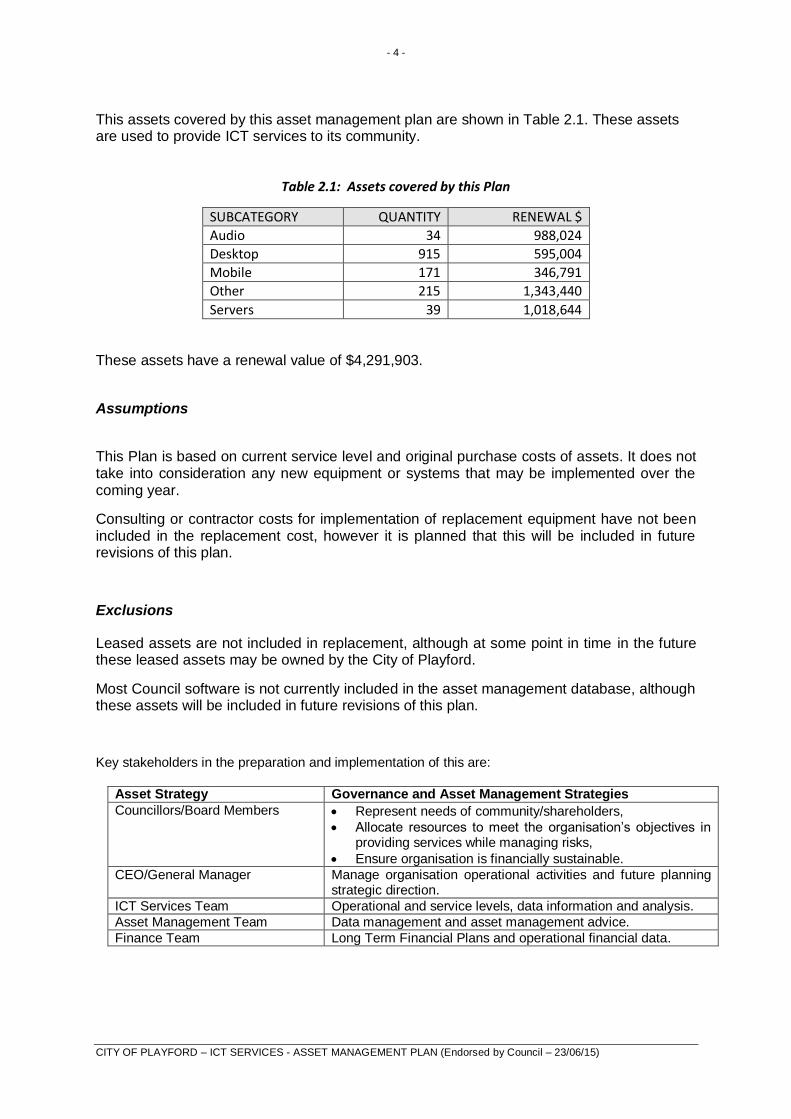
This assets covered by this asset management plan are shown in Table 2.1. These assets are used to provide ICT services to its community.
Table 2.1: Assets covered by this Plan
SUBCATEGORY QUANTITY RENEWAL $
Audio 34 988,024
Desktop 915 595,004
Mobile 171 346,791
Other 215 1,343,440
Servers 39 1,018,644
These assets have a renewal value of $4,291,903.
Assumptions
This Plan is based on current service level and original purchase costs of assets. It does not take into consideration any new equipment or systems that may be implemented over the coming year.
Consulting or contractor costs for implementation of replacement equipment have not been included in the replacement cost, however it is planned that this will be included in future revisions of this plan.
Exclusions
Leased assets are not included in replacement, although at some point in time in the future these leased assets may be owned by the City of Playford.
Most Council software is not currently included in the asset management database, although these assets will be included in future revisions of this plan.
Key stakeholders in the preparation and implementation of this are:
Asset Strategy Governance and Asset Management Strategies
Councillors/Board Members Represent needs of community/shareholders,
Allocate resources to meet the organisation’s objectives in providing services while managing risks,
Ensure organisation is financially sustainable. CEO/General Manager Manage organisation operational activities and future planning
strategic direction.
ICT Services Team Operational and service levels, data information and analysis.
Asset Management Team Data management and asset management advice.
Finance Team Long Term Financial Plans and operational financial data.
- 5 -
CITY OF PLAYFORD – ICT SERVICES - ASSET MANAGEMENT PLAN (Endorsed by Council – 23/06/15)
2.2 Goals and Objectives of Asset Management
The Council exists to provide services to its community. Some of these services are provided by ICT and associated assets. Council has acquired ICT assets by ‘purchase’, by contract, or operating lease to meet increased levels of service.
Council’s goal in managing ICT assets is to meet the defined level of service (as amended from time to time) in the most cost effective manner for present and future consumers. The key elements of ICT asset management are:
Taking a life cycle approach
Developing cost-effective management strategies for the long term.
Providing a defined level of service and monitoring performance.
Understanding and meeting the demands of growth through demand management and technology investment.
Managing risks associated with asset failures.
Sustainable use of physical resources.
Continuous improvement in asset management practices.2
2.3 Plan Framework
Key elements of the plan are:
Levels of service – specifies services and levels of service to be provided by Council.
Future demand – how this will impact on future service delivery and how this is to be met.
Life cycle management – how Council will manage its existing and future assets to provide the required services.
Financial summary – what funds are required to provide the required services.
Asset management practices.
Monitoring – how the plan will be monitored to ensure it is meeting Council’s objectives.
Asset Management Improvement Plan.
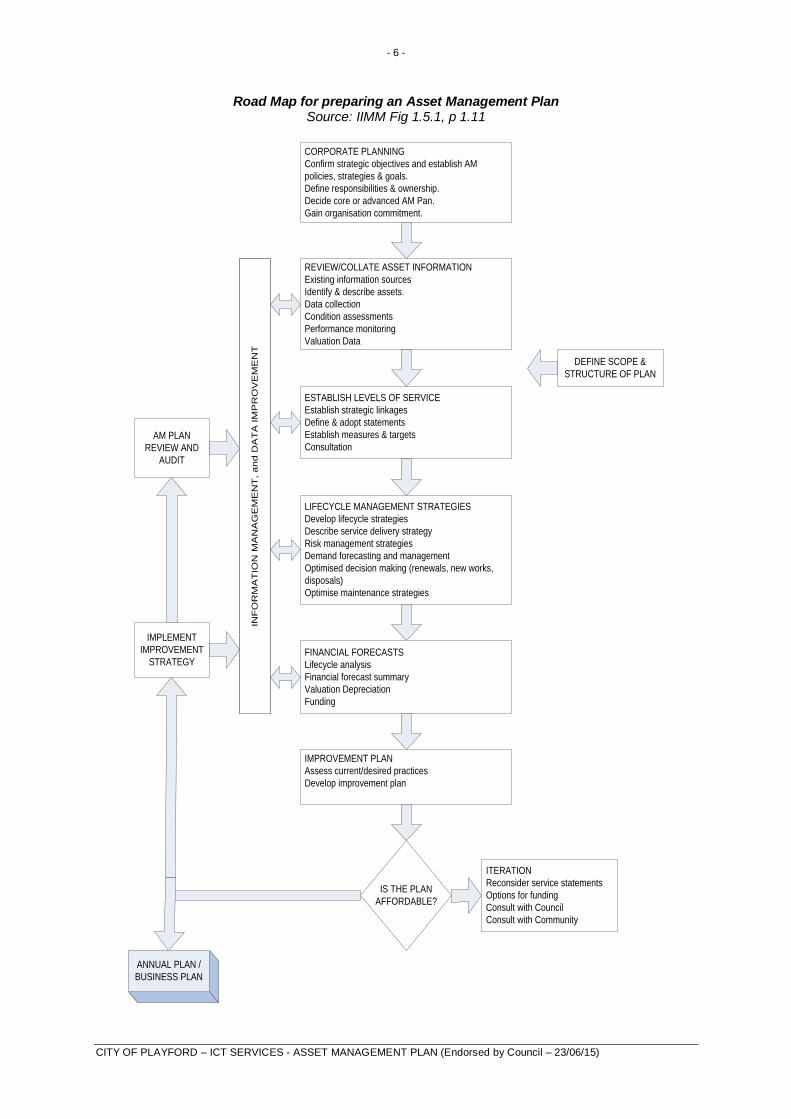
A road map for preparing an Asset Management Plan is shown below.
2 IIMM 2006 Sec 1.1.3, p 1.3
- 6 -
CITY OF PLAYFORD – ICT SERVICES - ASSET MANAGEMENT PLAN (Endorsed by Council – 23/06/15)
Road Map for preparing an Asset Management Plan Source: IIMM Fig 1.5.1, p 1.11
IS THE PLAN
AFFORDABLE?
CORPORATE PLANNING
Confirm strategic objectives and establish AM
policies, strategies & goals.
Define responsibilities & ownership.
Decide core or advanced AM Pan.
Gain organisation commitment.
REVIEW/COLLATE ASSET INFORMATION
Existing information sources
Identify & describe assets.
Data collection
Condition assessments
Performance monitoring
Valuation Data
ESTABLISH LEVELS OF SERVICE
Establish strategic linkages
Define & adopt statements
Establish measures & targets
Consultation
LIFECYCLE MANAGEMENT STRATEGIES
Develop lifecycle strategies
Describe service delivery strategy
Risk management strategies
Demand forecasting and management
Optimised decision making (renewals, new works,
disposals)
Optimise maintenance strategies
FINANCIAL FORECASTS
Lifecycle analysis
Financial forecast summary
Valuation Depreciation
Funding
IMPROVEMENT PLAN
Assess current/desired practices
Develop improvement plan
ITERATION
Reconsider service statements
Options for funding
Consult with Council
Consult with Community
DEFINE SCOPE &
STRUCTURE OF PLAN
INF
OR
MA
TIO
N M
AN
AG
EM
EN
T, a
nd
DA
TA
IM
PR
OV
EM
EN
T
AM PLAN
REVIEW AND
AUDIT
IMPLEMENT
IMPROVEMENT
STRATEGY
ANNUAL PLAN /
BUSINESS PLAN
INF
OR
MA
TIO
N M
AN
AG
EM
EN
T, a
nd
DA
TA
IM
PR
OV
EM
EN
T
- 7 -
CITY OF PLAYFORD – ICT SERVICES - ASSET MANAGEMENT PLAN (Endorsed by Council – 23/06/15)
2.4 Core and Advanced Asset Management
This ICT Asset Management Plan is prepared as a ‘core’ asset management plan in accordance with the International Infrastructure Management Manual. It is prepared to meet minimum legislative and organisational requirements for sustainable service delivery and long term financial planning and reporting. Core asset management is a ‘top down’ approach where analysis is applied at the ‘system’ or ‘network’ level
Future revisions of this will move towards ‘advanced’ asset management using a ‘bottom up’ approach for gathering asset information for individual assets to support the optimisation of activities and programs to meet agreed service levels.
2.5 Community Consultation
This ‘core’ asset management plan is prepared to facilitate community consultation initially through feedback on public display of draft asset management plans prior to adoption by the Council. Future revisions of the asset management plan will incorporate community consultation on service levels and costs of providing the service. This will assist the Council and the community in matching the level of service needed by the community, service risks and consequences with the community’s ability and willingness to pay for the service.
- 8 -
CITY OF PLAYFORD – ICT SERVICES - ASSET MANAGEMENT PLAN (Endorsed by Council – 23/06/15)
3. LEVELS OF SERVICE
3.1 Customer Research and Expectations
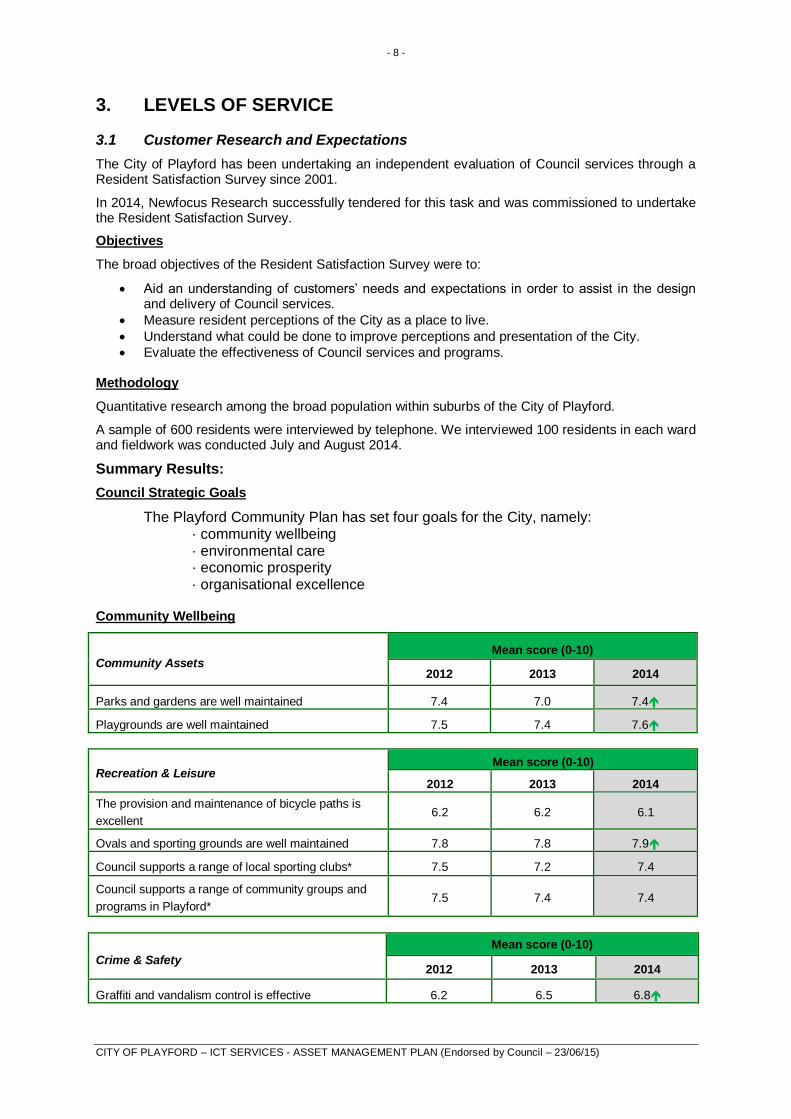
The City of Playford has been undertaking an independent evaluation of Council services through a Resident Satisfaction Survey since 2001.
In 2014, Newfocus Research successfully tendered for this task and was commissioned to undertake the Resident Satisfaction Survey.
Objectives
The broad objectives of the Resident Satisfaction Survey were to:
Aid an understanding of customers’ needs and expectations in order to assist in the design and delivery of Council services.
Measure resident perceptions of the City as a place to live.
Understand what could be done to improve perceptions and presentation of the City.
Evaluate the effectiveness of Council services and programs. Methodology
Quantitative research among the broad population within suburbs of the City of Playford.
A sample of 600 residents were interviewed by telephone. We interviewed 100 residents in each ward and fieldwork was conducted July and August 2014.
Summary Results:
Council Strategic Goals
The Playford Community Plan has set four goals for the City, namely: · community wellbeing · environmental care · economic prosperity · organisational excellence
Community Wellbeing
Community Assets Mean score (0-10)
2012 2013 2014
Parks and gardens are well maintained 7.4 7.0 7.4
Playgrounds are well maintained 7.5 7.4 7.6
Recreation & Leisure Mean score (0-10)
2012 2013 2014
The provision and maintenance of bicycle paths is
excellent 6.2 6.2 6.1
Ovals and sporting grounds are well maintained 7.8 7.8 7.9
Council supports a range of local sporting clubs* 7.5 7.2 7.4
Council supports a range of community groups and
programs in Playford* 7.5 7.4 7.4
Crime & Safety
Mean score (0-10)
2012 2013 2014
Graffiti and vandalism control is effective 6.2 6.5 6.8

- 9 -
CITY OF PLAYFORD – ICT SERVICES - ASSET MANAGEMENT PLAN (Endorsed by Council – 23/06/15)
Environmental Care
Environment & City
Mean score (0-10)
2012 2013 2014
The City of Playford is well presented 6.7 6.7 6.8
Verges are well maintained 6.0 6.1 5.9
The Council is environmentally responsible 7.4 7.2 7.3
Waste Management Mean score (0-10)
2012 2013 2014
The streets are clean 6.8 6.8 6.8
I am satisfied with the kerbside garbage collection service 8.4 8.2 8.3
I am satisfied with the hard waste collection service 7.5 7.4 7.5
City Infrastructure
City Infrastructure Mean score (0-10)
2012 2013 2014
Footpaths are well maintained 5.6 5.6 5.4
The street lighting is adequate 6.6 6.5 6.6
Storm water drainage in your street is adequately maintained 6.7 6.6 6.5
The local streets are well maintained 6.0 5.9 5.8
The rural roads are well maintained 5.6 5.7 5.5
Organisational Excellence
Communications Mean score (0-10)
2012 2013 2013
The Council's goals and vision are clear and communicated to
residents 6.2 6.3 5.7
The Council communicates well with its residents 6.0 6.1 5.5
Government & Strategy Mean score (0-10)
2012 2013 2014
The Council is responsive to community needs 6.2 6.2 5.9
The Council invites residents to participate in decision-making 5.9 5.9 5.4
The Council is open and accountable to the community 6.2 6.3 5.8
The Council provides value for money in return for the rates I
pay each year 5.1 5.5 5.0
The Council plans for the future 6.7 6.7 6.4
Elected Members do their job of representing my views well 5.7 5.8 5.2

- 10 -
CITY OF PLAYFORD – ICT SERVICES - ASSET MANAGEMENT PLAN (Endorsed by Council – 23/06/15)
Overall Satisfaction with Council
Satisfaction score 4 Year
Target% 2012 % 2013 % 2014 %
Overall satisfaction with the Council 72 68 68 65
Value for Money
Mean score (0-10)
2012 2013 2014
The Council provides value for money in return for the rates I
pay each year 5.1 5.5 5.0
Council uses this information in developing the Strategic Management Plan and in allocation of resources in the budget.
3.2 Strategic and Corporate Goals
The current vision and goals of the Council are outlined in the Strategic Plan as aligned with the Playford Community Vision 2043.
The AMPs have been developed in accordance with the strategies outlined. The table below summarises the key strategic points.
Table 3.2. Council Strategies that are addressed in this Plan
Goal Plan Objective
Our foundations – services, city presentation and community pride
- Liveable City with mix of services and facilities
- Environmental responsibility - Attractive and sustainable open spaces - Improved Visual amenity - Enhanced reputation
Securing Playford’s future and
building value
- Well planned and sustainable City
- Diversified and expanding economic base
Elizabeth, Adelaide’s northern CBD - Provision of CBD facilities and services
- Vibrant, walkable and cosmopolitan lifestyle
- Opportunities for social interactions
Securing Playford’s future in the
global economy
- Key economic drive of the State
- Robust local economy with local job opportunities - Part of Southern Food Bowl with national and international links - Re-focused manufacturing to support economic growth in the north of the State
Building our capabilities - Highly performing organisation
- Delivering value for money services - Effective government and private sector partnerships
- 11 -
CITY OF PLAYFORD – ICT SERVICES - ASSET MANAGEMENT PLAN (Endorsed by Council – 23/06/15)
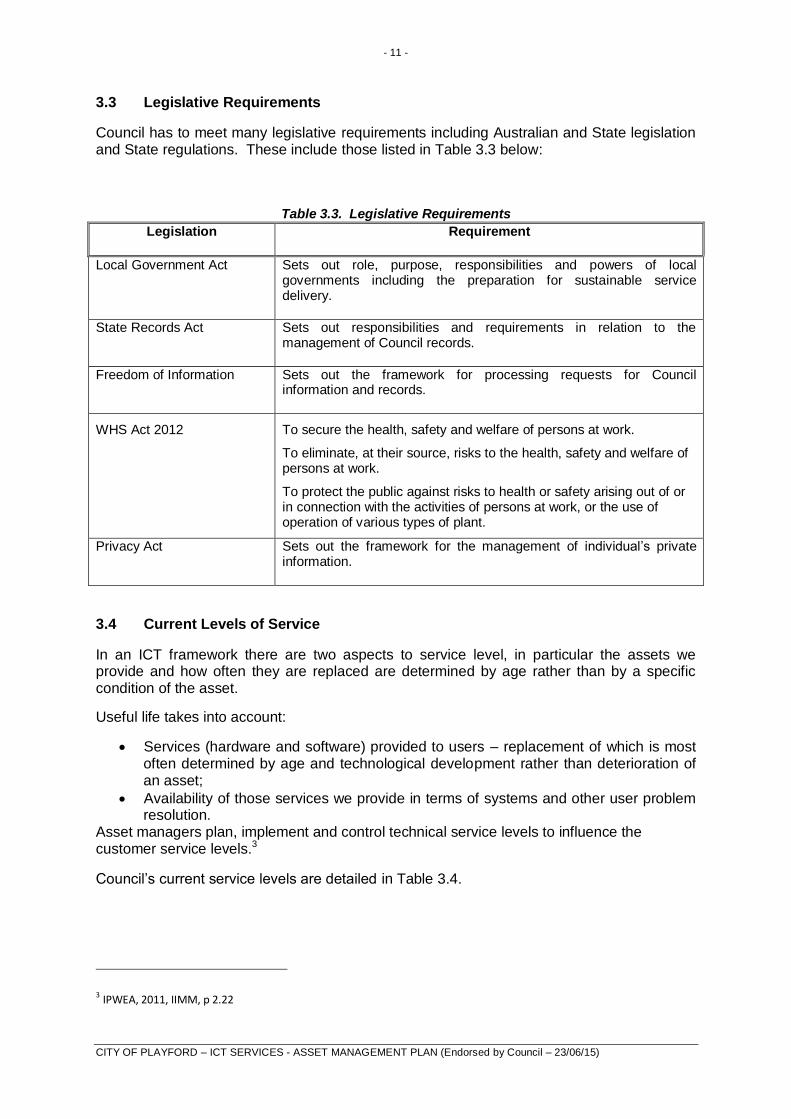
3.3 Legislative Requirements
Council has to meet many legislative requirements including Australian and State legislation and State regulations. These include those listed in Table 3.3 below:
Table 3.3. Legislative Requirements
Legislation Requirement
Local Government Act Sets out role, purpose, responsibilities and powers of local governments including the preparation for sustainable service delivery.
State Records Act Sets out responsibilities and requirements in relation to the management of Council records.
Freedom of Information Sets out the framework for processing requests for Council information and records.
WHS Act 2012 To secure the health, safety and welfare of persons at work.
To eliminate, at their source, risks to the health, safety and welfare of persons at work.
To protect the public against risks to health or safety arising out of or in connection with the activities of persons at work, or the use of operation of various types of plant.
Privacy Act Sets out the framework for the management of individual’s private information.
3.4 Current Levels of Service
In an ICT framework there are two aspects to service level, in particular the assets we provide and how often they are replaced are determined by age rather than by a specific condition of the asset.
Useful life takes into account:
Services (hardware and software) provided to users – replacement of which is most often determined by age and technological development rather than deterioration of an asset;
Availability of those services we provide in terms of systems and other user problem resolution.
Asset managers plan, implement and control technical service levels to influence the customer service levels.3
Council’s current service levels are detailed in Table 3.4.
3 IPWEA, 2011, IIMM, p 2.22
- 12 -
CITY OF PLAYFORD – ICT SERVICES - ASSET MANAGEMENT PLAN (Endorsed by Council – 23/06/15)
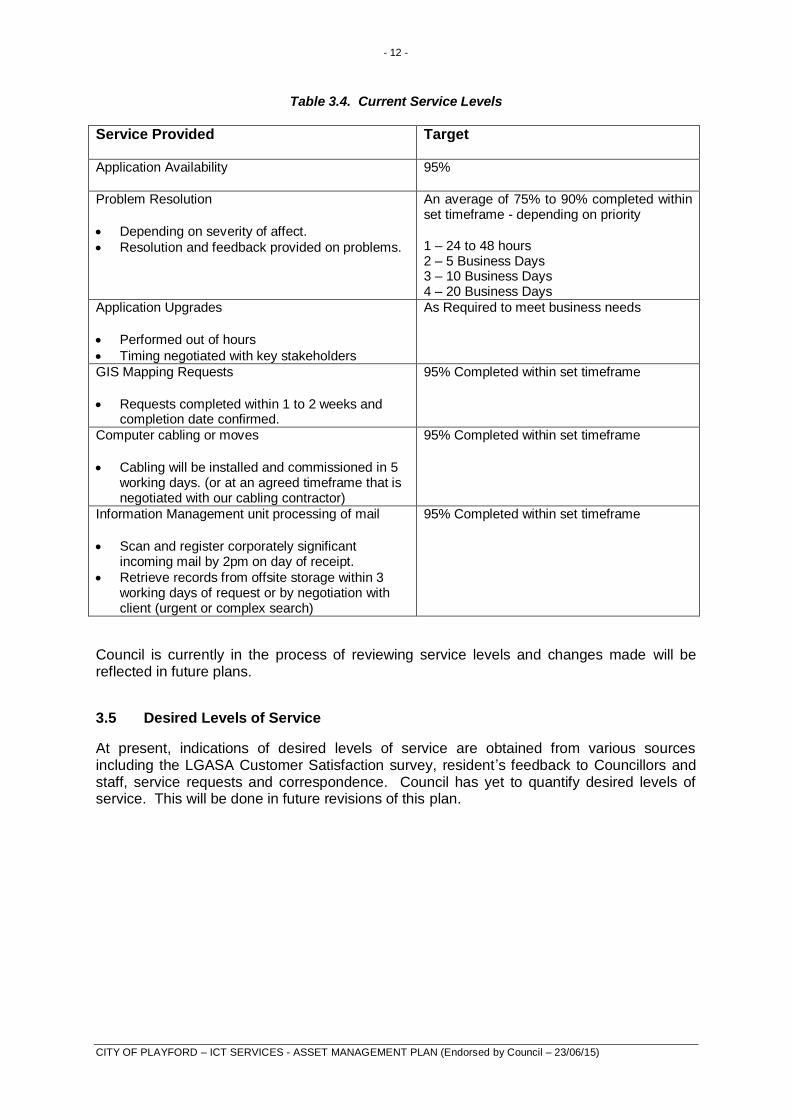
Table 3.4. Current Service Levels
Service Provided Target
Application Availability 95%
Problem Resolution
Depending on severity of affect.
Resolution and feedback provided on problems.
An average of 75% to 90% completed within set timeframe - depending on priority
1 – 24 to 48 hours 2 – 5 Business Days 3 – 10 Business Days 4 – 20 Business Days
Application Upgrades
Performed out of hours
Timing negotiated with key stakeholders
As Required to meet business needs
GIS Mapping Requests
Requests completed within 1 to 2 weeks and completion date confirmed.
95% Completed within set timeframe
Computer cabling or moves
Cabling will be installed and commissioned in 5 working days. (or at an agreed timeframe that is negotiated with our cabling contractor)
95% Completed within set timeframe
Information Management unit processing of mail
Scan and register corporately significant incoming mail by 2pm on day of receipt.
Retrieve records from offsite storage within 3 working days of request or by negotiation with client (urgent or complex search)
95% Completed within set timeframe
Council is currently in the process of reviewing service levels and changes made will be reflected in future plans.
3.5 Desired Levels of Service
At present, indications of desired levels of service are obtained from various sources including the LGASA Customer Satisfaction survey, resident’s feedback to Councillors and staff, service requests and correspondence. Council has yet to quantify desired levels of service. This will be done in future revisions of this plan.
- 13 -
CITY OF PLAYFORD – ICT SERVICES - ASSET MANAGEMENT PLAN (Endorsed by Council – 23/06/15)
4. FUTURE DEMAND
4.1 Demand Drivers
Drivers affecting demand include population change, changes in demographics, seasonal factors, consumer preferences and expectations, technological changes, economic factors, and environmental awareness. These drivers are also considered when forecasting future demand.
4.2 Demand Forecast
Factors affecting demand include but are not limited to population change, changes in demographics, seasonal factors, consumer preferences and expectations, economic factors, environmental awareness, and technological developments. Playford continues to experience new residential development, most recently in Andrews Farm, Craigmore, Hillbank and Blakeview. The most significant gains in population are expected in Andrews Farm, Angle Vale, Blakeview, Craigmore, Munno Para, Munno Para West, Munno Para Downs, Virginia, Waterloo Corner,Buckland Park and Smithfield.
Elizabeth East and Elizabeth Downs are expecting the most significant population decreases during this period, with both areas expected to have little growth in housing stock. The forecast population growth rates are lower than household growth in most areas as a result of the decreasing number of people per household. The exceptions to this pattern are Munno Para, Munno Para West, and Munno Para Downs, which are expected to have a relatively stable household size as a result of the in-migration of families during this period and Elizabeth where the average household size is already very low and the existing household structure is likely to be maintained.
There is a need to resolve a range of issues to manage the growth in a way that it retains City of Playford as a desirable location in which to live. Such issues include land availability, infrastructure, regional facilities, industrial land, employment opportunities, and transport.
4.3 Demand Impact on Assets
Demand factor trends and impacts on service delivery are summarised in Table 4.3
Table 4.3. Demand Factors, Projections and Impact on Services
Demand factor Present position Projection Impact on services
Increase End Users and Remote Community Services
Resources are allocated to what we can fund or provide, not service driven.
Increased Staff and Community users due to population growth to around 165,000 within the next 20 years.
Increased need for ICT assets and systems (software). Increase costs and resourcing.
Demographics Reactive approach for any changes in demographics and population growth.
A significant increase for this need due to aging and multicultural community.
Changing customer demands which will result in a greater focus on online services.
Environmental Implementation of environmentally friendly equipment when renewal is due.
Reduce and measure our carbon footprint.
Possible new software for reporting and greater focus on environmental cost of systems and technology.
- 14 -
CITY OF PLAYFORD – ICT SERVICES - ASSET MANAGEMENT PLAN (Endorsed by Council – 23/06/15)
4.4 Demand Management Plan
Demand for new services will be managed through a combination of managing existing assets, upgrading of existing assets and providing new assets to meet demand and demand management. Demand management practices include non-asset solutions, insuring against risks and managing failures.
Non-asset solutions focus on providing the required service without the need for the organisation to own the assets and management actions including reducing demand for the service, reducing the level of service (allowing some assets to deteriorate beyond current service levels) or educating customers to accept appropriate asset failures4. Examples of non-asset solutions include providing services from existing infrastructure such as aquatic centres and libraries that may be in another community area or public toilets provided in commercial premises.
Opportunities identified to date for demand management are shown in Table 4.4. Further opportunities will be developed in future revisions of this plan.
Table 4.4. Demand Management Plan Summary
Service Activity Demand Management Plan
Planning ICT will aim to realise the following actions within the City’s Strategic Plans:
Ensure that we are providing systems and solutions to enable staff to deliver appropriate services to the community.
Ensure staff have access to tools that enable efficiency and productivity in the delivery of services.
Enable Council to move towards best practice in relation to its technology systems and equipment.
Service Delivery To ensure that the services required are driving the demand for our IT assets.
Financial Developing long term financial management plans to ensure financial sustainability.
4.5 Asset Programs to Meet Demand
Changes to the size and scope of City of Playford’s ICT is an ongoing issue that can be driven by changes in work practices, technology, staffing or increasing work load due to a number of factors. Current strategies to address this are triggered when the item of technology is due for renewal, projected population growth, and consultation with the users of the plan occurs.
4 IPWEA, 2011, IIMM, Table 3.4.1, p 3|58.
- 15 -
CITY OF PLAYFORD – ICT SERVICES - ASSET MANAGEMENT PLAN (Endorsed by Council – 23/06/15)
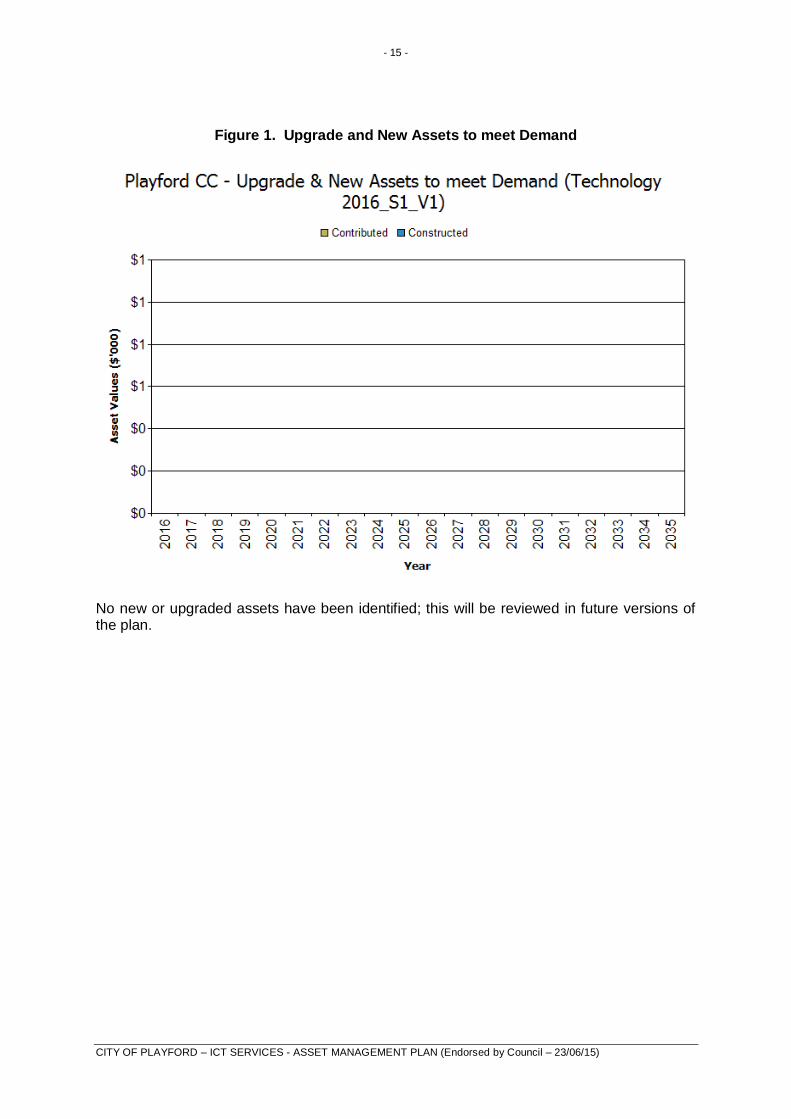
Figure 1. Upgrade and New Assets to meet Demand
No new or upgraded assets have been identified; this will be reviewed in future versions of the plan.
- 16 -
CITY OF PLAYFORD – ICT SERVICES - ASSET MANAGEMENT PLAN (Endorsed by Council – 23/06/15)
5. LIFECYCLE MANAGEMENT PLAN
The Lifecycle Management Plan details how Council plans to manage and operate the assets at the agreed levels of service (defined in Section 3) while optimising life cycle costs.
5.1 Background Data
This data only covers currently owned assets; there are a significant number of assets that are currently leased by council which may at a future point in time become an asset of Council. These assets still require ongoing maintenance and replacement at end of life but have not been specifically addressed in this version of the plan. It is anticipated that this will be an element of consideration in future revisions of this plan.
5.1.1 Physical parameters
The Council owned assets covered by this are shown in Table 2.1.
The useful life of an asset is defined as a period over which a depreciable asset is expected to be fully utilised.
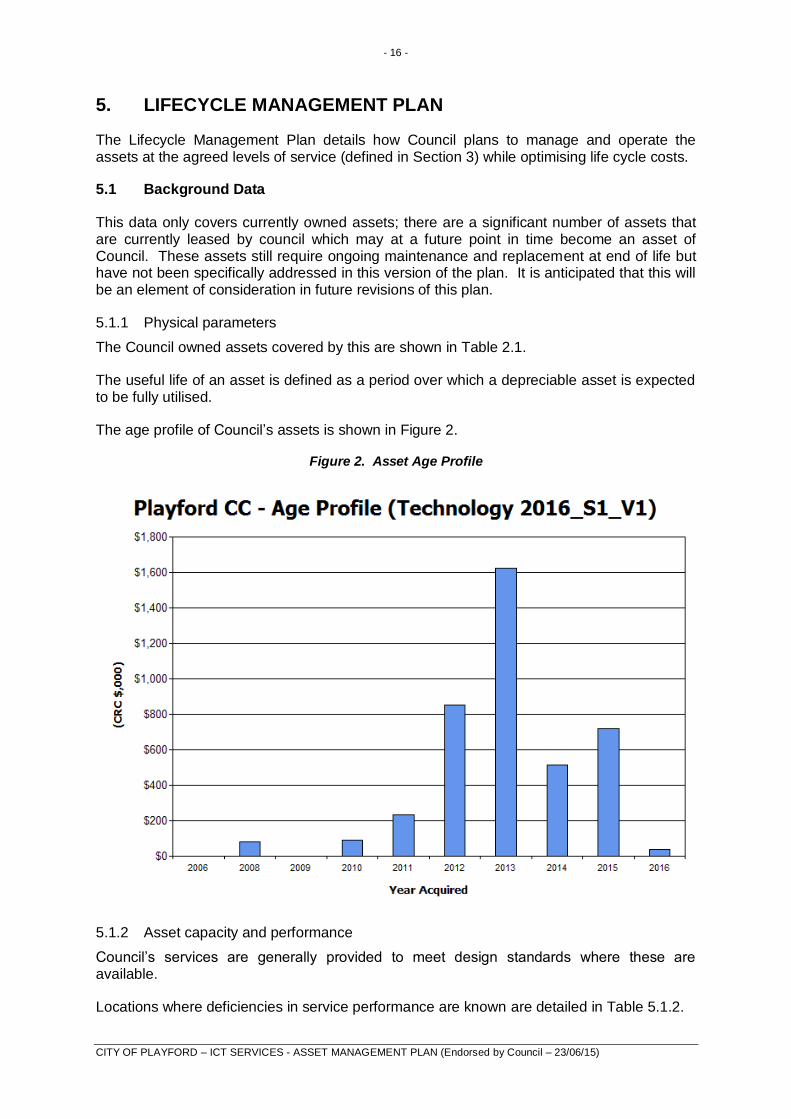
The age profile of Council’s assets is shown in Figure 2.
Figure 2. Asset Age Profile
5.1.2 Asset capacity and performance
Council’s services are generally provided to meet design standards where these are available.
Locations where deficiencies in service performance are known are detailed in Table 5.1.2.

- 17 -
CITY OF PLAYFORD – ICT SERVICES - ASSET MANAGEMENT PLAN (Endorsed by Council – 23/06/15)
Table 5.1.2. Known Service Performance Deficiencies
Activity Service Deficiency
Equipment Failure No resource for failures and effect to business continuity.
Underutilised central knowledge management systems
Increased load demands on infrastructure and resources.
Staff Training Increased Helpdesk requests, which impacts on operational service delivery.
The above service deficiencies were identified from Customer Requests and knowledge management framework.
5.1.3 Asset condition
Due to relative short life of ICT assets condition is not a key driver for renewal. Technology and service requirement drivers are the main performance measure.
5.1.4 Asset valuations
The value of assets as at 2014/2015 covered by this is summarised below. Assets are not reindexed. Assets are replacement rates.
Playford CC - Report 2 - Section 5.1.4 Valuations (Technology 2016_S1_V1)
Asset Values ('$000)
Current Replacement Value $4,151
Depreciable Amount $3,823
Depreciated Replacement Cost $1,796
Annual Depreciation Charge $638
Rate of Annual Asset Consumption 16.70%
Rate of Annual Asset Renewal 15.30%
Rate of Annual Asset Upgrade 0%
Rate of Asset Upgrade (Including Contributed Assets)
0%
Asset renewals as percentage of consumption
92%
Percentage Increase in asset stock 0%
Council’s sustainability reporting reports the rate of annual asset consumption and compares this to asset renewal and asset upgrade and expansion.
Various ratios of asset consumption and expenditure have been prepared to help guide and gauge asset management performance and trends over time.
In the financial year the organisation plans to renew assets at 92% of the rate they are being consumed.
- 18 -
CITY OF PLAYFORD – ICT SERVICES - ASSET MANAGEMENT PLAN (Endorsed by Council – 23/06/15)
5.2 Risk Management Plan
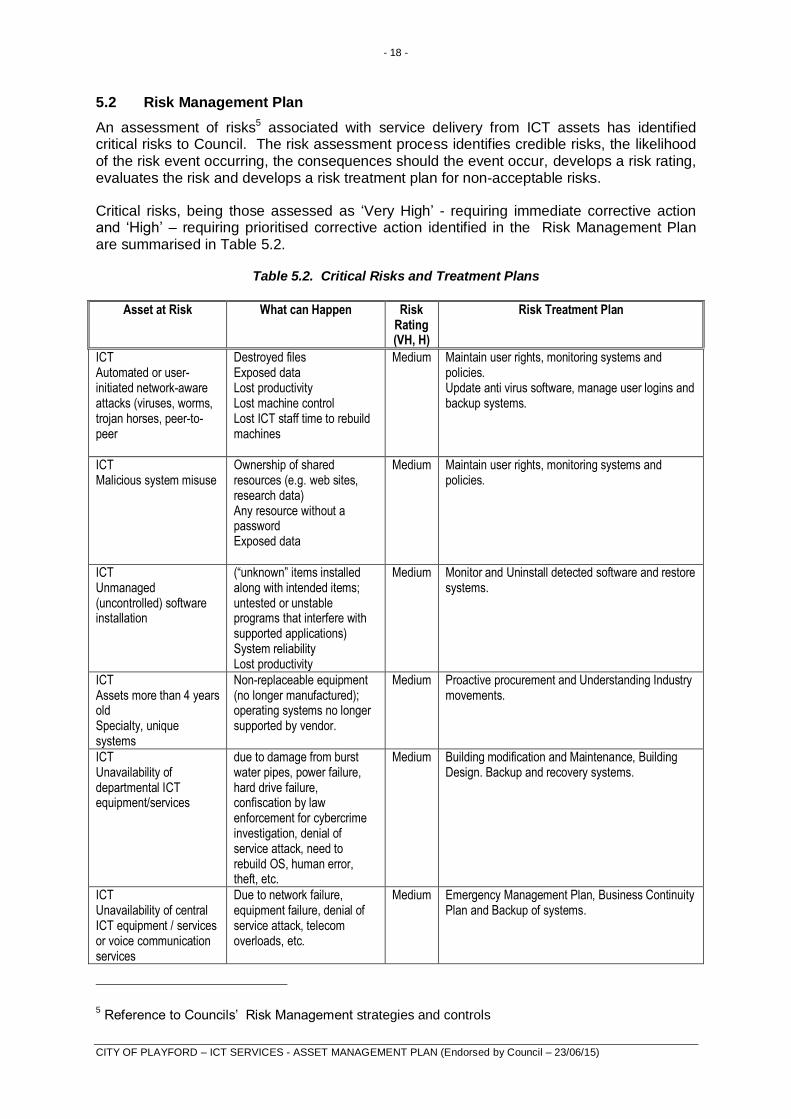
An assessment of risks5 associated with service delivery from ICT assets has identified critical risks to Council. The risk assessment process identifies credible risks, the likelihood of the risk event occurring, the consequences should the event occur, develops a risk rating, evaluates the risk and develops a risk treatment plan for non-acceptable risks.
Critical risks, being those assessed as ‘Very High’ - requiring immediate corrective action and ‘High’ – requiring prioritised corrective action identified in the Risk Management Plan are summarised in Table 5.2.
Table 5.2. Critical Risks and Treatment Plans
Asset at Risk What can Happen Risk Rating (VH, H)
Risk Treatment Plan
ICT Automated or user-initiated network-aware attacks (viruses, worms, trojan horses, peer-to-peer
Destroyed files Exposed data Lost productivity Lost machine control Lost ICT staff time to rebuild machines
Medium Maintain user rights, monitoring systems and policies. Update anti virus software, manage user logins and backup systems.
ICT Malicious system misuse
Ownership of shared resources (e.g. web sites, research data) Any resource without a password Exposed data
Medium Maintain user rights, monitoring systems and policies.
ICT Unmanaged (uncontrolled) software installation
(“unknown” items installed along with intended items; untested or unstable programs that interfere with supported applications) System reliability Lost productivity
Medium Monitor and Uninstall detected software and restore systems.
ICT Assets more than 4 years old Specialty, unique systems
Non-replaceable equipment (no longer manufactured); operating systems no longer supported by vendor.
Medium Proactive procurement and Understanding Industry movements.
ICT Unavailability of departmental ICT equipment/services
due to damage from burst water pipes, power failure, hard drive failure, confiscation by law enforcement for cybercrime investigation, denial of service attack, need to rebuild OS, human error, theft, etc.
Medium Building modification and Maintenance, Building Design. Backup and recovery systems.
ICT Unavailability of central ICT equipment / services or voice communication services
Due to network failure, equipment failure, denial of service attack, telecom overloads, etc.
Medium Emergency Management Plan, Business Continuity Plan and Backup of systems.
5 Reference to Councils’ Risk Management strategies and controls
- 19 -
CITY OF PLAYFORD – ICT SERVICES - ASSET MANAGEMENT PLAN (Endorsed by Council – 23/06/15)
5.3 Routine Operations and Maintenance Plan
Routine maintenance is the regular ongoing work that is necessary to keep assets operating, including instances where portions of the asset fail and need immediate repair to make the asset operational again.
5.3.1 Operations and Maintenance plan
Operations activities affect service levels including quality and function through street sweeping and grass mowing frequency, intensity and spacing of street lights and cleaning frequency and opening hours of building and other facilities.
Maintenance includes all actions necessary for retaining an asset as near as practicable to an appropriate service condition including regular ongoing day-to-day work necessary to keep assets operating, eg road patching but excluding rehabilitation or renewal. Maintenance may be classifies into reactive, planned and specific maintenance work activities.
Reactive maintenance is unplanned repair work carried out in response to service requests and management/supervisory directions.
Planned maintenance is repair work that is identified and managed through a maintenance management system (MMS). MMS activities include inspection, assessing the condition against failure/breakdown experience, prioritising, scheduling, actioning the work and reporting what was done to develop a maintenance history and improve maintenance and service delivery performance.
Specific maintenance is replacement of higher value components/sub-components of assets that is undertaken on a regular cycle including repainting, replacing air conditioning units, etc. This work falls below the capital/maintenance threshold but may require a specific budget allocation.
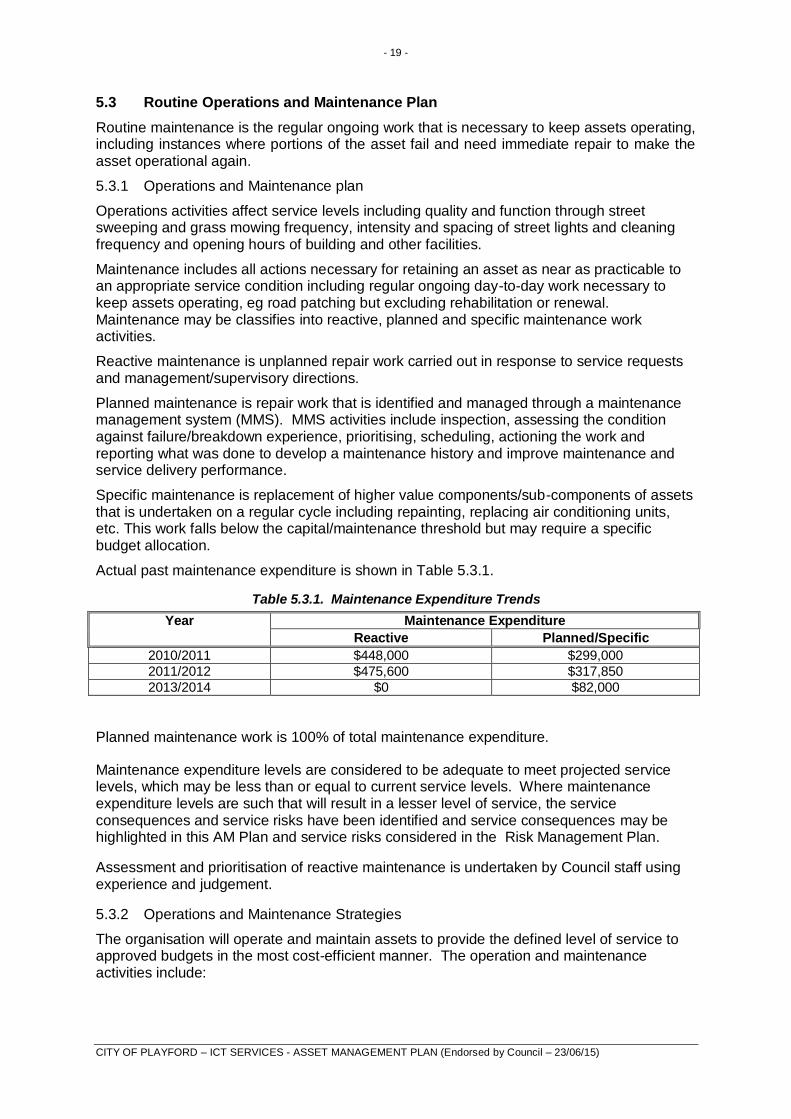
Actual past maintenance expenditure is shown in Table 5.3.1.
Table 5.3.1. Maintenance Expenditure Trends
Year Maintenance Expenditure
Reactive Planned/Specific
2010/2011 $448,000 $299,000
2011/2012 $475,600 $317,850
2013/2014 $0 $82,000
Planned maintenance work is 100% of total maintenance expenditure.
Maintenance expenditure levels are considered to be adequate to meet projected service levels, which may be less than or equal to current service levels. Where maintenance expenditure levels are such that will result in a lesser level of service, the service consequences and service risks have been identified and service consequences may be highlighted in this AM Plan and service risks considered in the Risk Management Plan.
Assessment and prioritisation of reactive maintenance is undertaken by Council staff using experience and judgement.
5.3.2 Operations and Maintenance Strategies
The organisation will operate and maintain assets to provide the defined level of service to approved budgets in the most cost-efficient manner. The operation and maintenance activities include:
- 20 -
CITY OF PLAYFORD – ICT SERVICES - ASSET MANAGEMENT PLAN (Endorsed by Council – 23/06/15)
Scheduling operations activities to deliver the defined level of service in the most efficient manner,
Undertaking maintenance activities through a planned maintenance system to reduce maintenance costs and improve maintenance outcomes. Undertake cost-benefit analysis to determine the most cost-effective split between planned and unplanned maintenance activities (> 70% planned desirable as measured by cost),
Maintain a current asset risk register for assets and present service risks associated with providing services from assets and reporting Very High and High risks and residual risks after treatment to management and Council/Board,
Review current and required skills base and implement workforce training and development to meet required operations and maintenance needs,
Review asset utilisation to identify underutilised assets and appropriate remedies, and over utilised assets and customer demand management options,
Maintain a current hierarchy of critical assets and required operations and maintenance activities,
Develop and regularly review appropriate emergency response capability,
Review management of operations and maintenance activities to ensure Council is obtaining best value for resources used.
Asset hierarchy
An asset hierarchy provides a framework for structuring data in an information system to assist in collection of data, reporting information and making decisions. The hierarchy includes the asset class and component used for asset planning and financial reporting and service level hierarchy used for service planning and delivery.
The organisation’s service hierarchy is shown is Table 5.3.2.
Table 5.3.2: Asset Service Hierarchy
Service Hierarchy Service Level Objective
To be reviewed in future plans
Critical Assets
Critical assets are those assets which have a high consequence of failure but not necessarily a high likelihood of failure. By identifying critical assets and critical failure modes, organisations can target and refines investigative activities, maintenance plans and capital expenditure plans at the appropriate time.
Operations and maintenances activities may be targeted to mitigate critical assets failure and maintain service levels. These activities may include increased inspection frequency, higher maintenance intervention levels, etc. Critical assets failure modes and required operations and maintenance activities are detailed in Table 5.3.2.1.
5.3.2.1: Critical Assets and Service Level Objectives
Critical Assets Critical Failure Mode Operations & Maintenance Activities
To be reviewed in future plans
- 21 -
CITY OF PLAYFORD – ICT SERVICES - ASSET MANAGEMENT PLAN (Endorsed by Council – 23/06/15)
Standards and specifications
Maintenance work is carried out in accordance with the following Standards and Specifications.
Service Provided Target Hardware As per manufacturer warranty conditions
Software As per manufacturer warranty conditions
5.3.3 Summary of future operations and maintenance expenditures
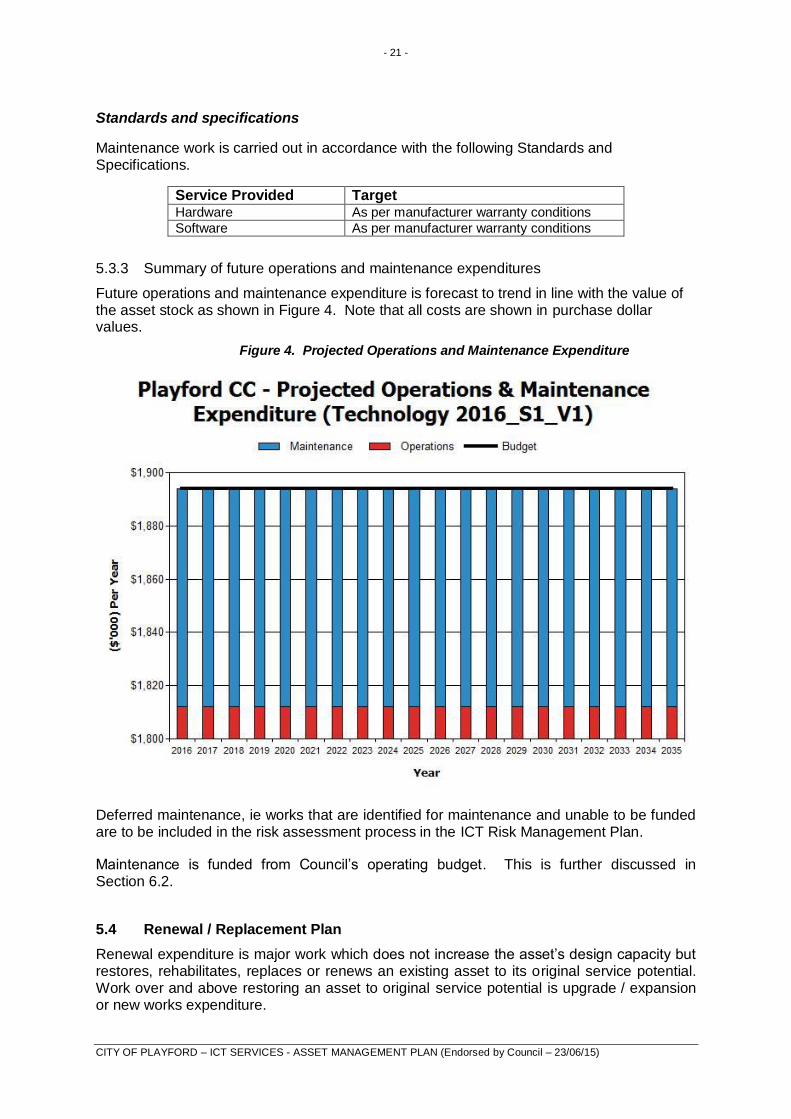
Future operations and maintenance expenditure is forecast to trend in line with the value of the asset stock as shown in Figure 4. Note that all costs are shown in purchase dollar values.
Figure 4. Projected Operations and Maintenance Expenditure
Deferred maintenance, ie works that are identified for maintenance and unable to be funded are to be included in the risk assessment process in the ICT Risk Management Plan.
Maintenance is funded from Council’s operating budget. This is further discussed in Section 6.2.
5.4 Renewal / Replacement Plan
Renewal expenditure is major work which does not increase the asset’s design capacity but restores, rehabilitates, replaces or renews an existing asset to its original service potential. Work over and above restoring an asset to original service potential is upgrade / expansion or new works expenditure.
- 22 -
CITY OF PLAYFORD – ICT SERVICES - ASSET MANAGEMENT PLAN (Endorsed by Council – 23/06/15)
5.4.1 Renewal plan
Assets requiring renewal are identified from estimates of remaining life obtained from the asset register through the ‘Renewal Model’. Candidate proposals are inspected to verify
accuracy of remaining life estimate and to develop a preliminary renewal estimate.
Assets requiring renewal/replacement are identified from one of three methods provided in the ‘Expenditure Template’.
Method 1 uses Asset Register data to project the renewal costs using acquisition year and useful life to determine the renewal year, or
Method 2 uses capital renewal expenditure projections from external condition modelling systems (such as Pavement Management Systems), or
Method 3 uses a combination of average network renewals plus defect repairs in the Renewal Plan and Defect Repair Plan worksheets on the ‘Expenditure template’.
Method 1 was used for this asset management plan.
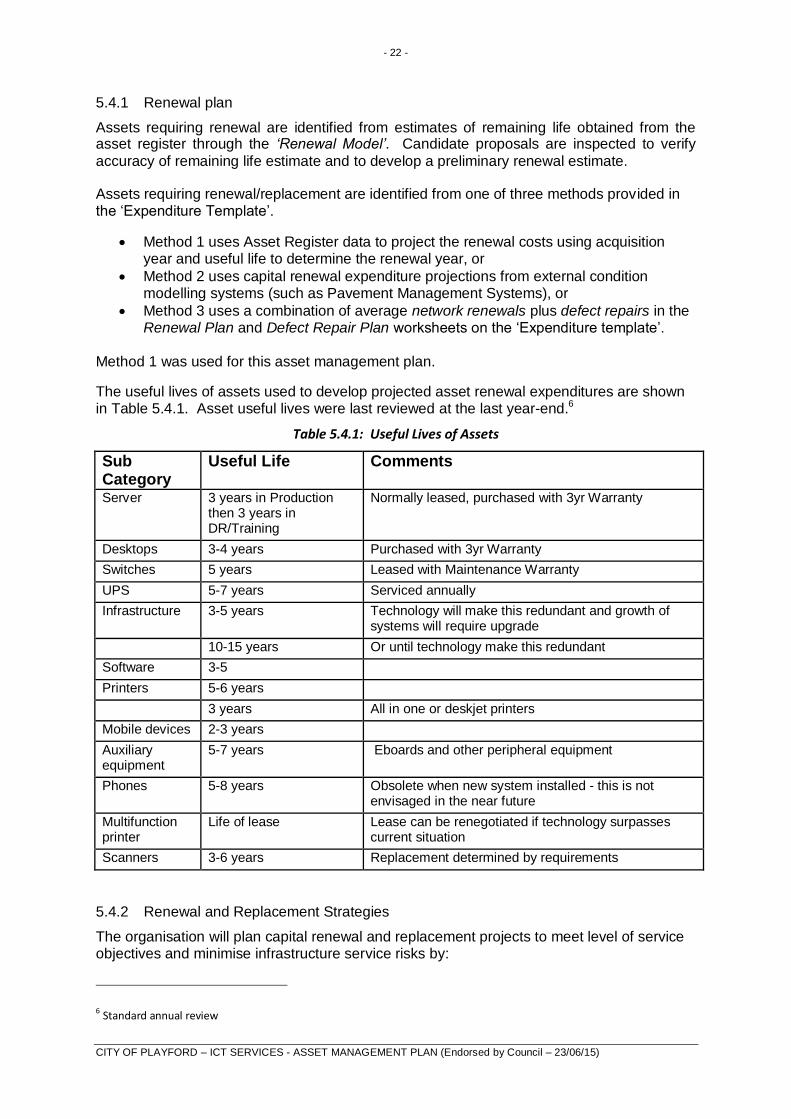
The useful lives of assets used to develop projected asset renewal expenditures are shown in Table 5.4.1. Asset useful lives were last reviewed at the last year-end.6
Table 5.4.1: Useful Lives of Assets
Sub Category
Useful Life Comments
Server 3 years in Production then 3 years in DR/Training
Normally leased, purchased with 3yr Warranty
Desktops 3-4 years Purchased with 3yr Warranty
Switches 5 years Leased with Maintenance Warranty
UPS 5-7 years Serviced annually
Infrastructure 3-5 years Technology will make this redundant and growth of systems will require upgrade
10-15 years Or until technology make this redundant
Software 3-5
Printers 5-6 years
3 years All in one or deskjet printers
Mobile devices 2-3 years
Auxiliary equipment
5-7 years Eboards and other peripheral equipment
Phones 5-8 years Obsolete when new system installed - this is not envisaged in the near future
Multifunction printer
Life of lease Lease can be renegotiated if technology surpasses current situation
Scanners 3-6 years Replacement determined by requirements
5.4.2 Renewal and Replacement Strategies
The organisation will plan capital renewal and replacement projects to meet level of service objectives and minimise infrastructure service risks by:
6 Standard annual review
- 23 -
CITY OF PLAYFORD – ICT SERVICES - ASSET MANAGEMENT PLAN (Endorsed by Council – 23/06/15)
Planning and scheduling renewal projects to deliver the defined level of service in the most efficient manner,
Undertaking project scoping for all capital renewal and replacement projects to identify:
o the service delivery ‘deficiency’, present risk and optimum time for renewal/replacement,
o the project objectives to rectify the deficiency, o the range of options, estimated capital and life cycle costs for each options
that could address the service deficiency, o and evaluate the options against evaluation criteria adopted by Council, and o select the best option to be included in capital renewal programs,
Using ‘low cost’ renewal methods (cost of renewal is less than replacement) wherever possible,
Maintain a current infrastructure risk register for assets and service risks associated with providing services from infrastructure assets and reporting Very High and High risks and residual risks after treatment to management and Council,
Review current and required skills base and implement workforce training and development to meet required construction and renewal needs,
Maintain a current hierarchy of critical assets and capital renewal treatments and timings required
Review management of capital renewal and replacement activities to ensure Council is obtaining best value for resources used.
Renewal ranking criteria
Asset renewal and replacement is typically undertaken to either:
Ensure the reliability of the existing infrastructure to deliver the service it was constructed to facilitate (eg replacing a bridge that has a 5 t load limit), or
To ensure the infrastructure is of sufficient quality to meet the service requirements (eg roughness of a road).7
It is possible to get some indication of capital renewal and replacement priorities by identifying assets or asset groups that:
Have a high consequence of failure,
Have a high utilisation and subsequent impact on users would be greatest,
The total value represents the greatest net value to the organisation,
Have the highest average age relative to their expected lives,
Are identified in the AM Plan as key cost factors,
Have high operational or maintenance costs, and
Where replacement with modern equivalent assets would yield material savings.8
The ranking criteria used to determine priority of identified renewal and replacement proposals is detailed in Table 5.4.2.
7 IPWEA, 2011, IIMM, Sec 3.4.4, p 3|60. 8 Based on IPWEA, 2011, IIMM, Sec 3.4.5, p 3|66.
- 24 -
CITY OF PLAYFORD – ICT SERVICES - ASSET MANAGEMENT PLAN (Endorsed by Council – 23/06/15)
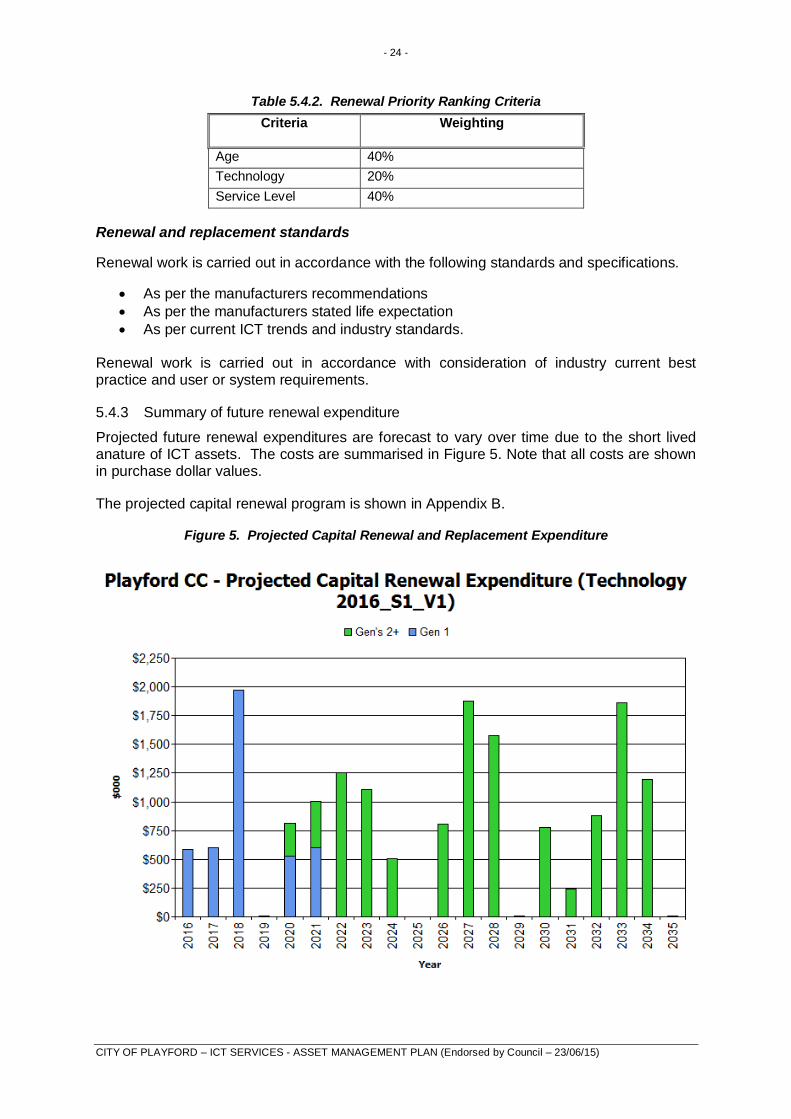
Table 5.4.2. Renewal Priority Ranking Criteria
Criteria Weighting
Age 40%
Technology 20%
Service Level 40%
Renewal and replacement standards
Renewal work is carried out in accordance with the following standards and specifications.
As per the manufacturers recommendations
As per the manufacturers stated life expectation
As per current ICT trends and industry standards. Renewal work is carried out in accordance with consideration of industry current best practice and user or system requirements.
5.4.3 Summary of future renewal expenditure
Projected future renewal expenditures are forecast to vary over time due to the short lived anature of ICT assets. The costs are summarised in Figure 5. Note that all costs are shown in purchase dollar values.
The projected capital renewal program is shown in Appendix B.
Figure 5. Projected Capital Renewal and Replacement Expenditure
- 25 -
CITY OF PLAYFORD – ICT SERVICES - ASSET MANAGEMENT PLAN (Endorsed by Council – 23/06/15)
Deferred renewal, i.e. those assets identified for renewal and not scheduled for renewal in capital works programs are to be included in the risk assessment process in the Risk Management Plan.
Renewals are to be funded from Council’s Capital Works. This is further discussed in Section 6.2.
5.5 Creation/ Acquisition / Upgrade Plan
New works are those works that create a new asset that did not previously exist, or works which upgrade or improve an existing asset beyond its existing capacity. They may result from growth, social or environmental needs.
5.5.1 Selection criteria
New assets and upgrade / expansion of existing assets are identified from various sources such as service requests, or proposals identified by strategic plans. Candidate proposals are inspected to verify need and to develop a preliminary renewal estimate. Verified proposals are ranked by priority and available funds and scheduled in future works programmes. The priority ranking criteria is detailed below.
Table 5.5.1. New Assets Priority Ranking Criteria
Criteria Weighting
Risk exposure if work not done 20%
Risk likelihood 20%
Costs 20%
Benefits provided if work done 20%
Financial Sustainability 20%
5.5.2 Capital Investment Strategies
The organisation will plan capital upgrade and new projects to meet level of service objectives by:
Planning and scheduling capital upgrade and new projects to deliver the defined level of service in the most efficient manner,
Undertake project scoping for all capital upgrade/new projects to identify: o the service delivery ‘deficiency’, present risk and required timeline for delivery
of the upgrade/new asset, o the project objectives to rectify the deficiency including value management for
major projects, o the range of options, estimated capital and life cycle costs for each options
that could address the service deficiency, o management of risks associated with alternative options, o and evaluate the options against evaluation criteria adopted by
Council/Board, and o select the best option to be included in capital upgrade/new programs,
Review current and required skills base and implement training and development to meet required construction and project management needs,
Review management of capital project management activities to ensure Council is obtaining best value for resources used.
- 26 -
CITY OF PLAYFORD – ICT SERVICES - ASSET MANAGEMENT PLAN (Endorsed by Council – 23/06/15)
Standards and specifications for new assets and for upgrade/expansion of existing assets are the same as those for renewal shown in Section 5.4.2.
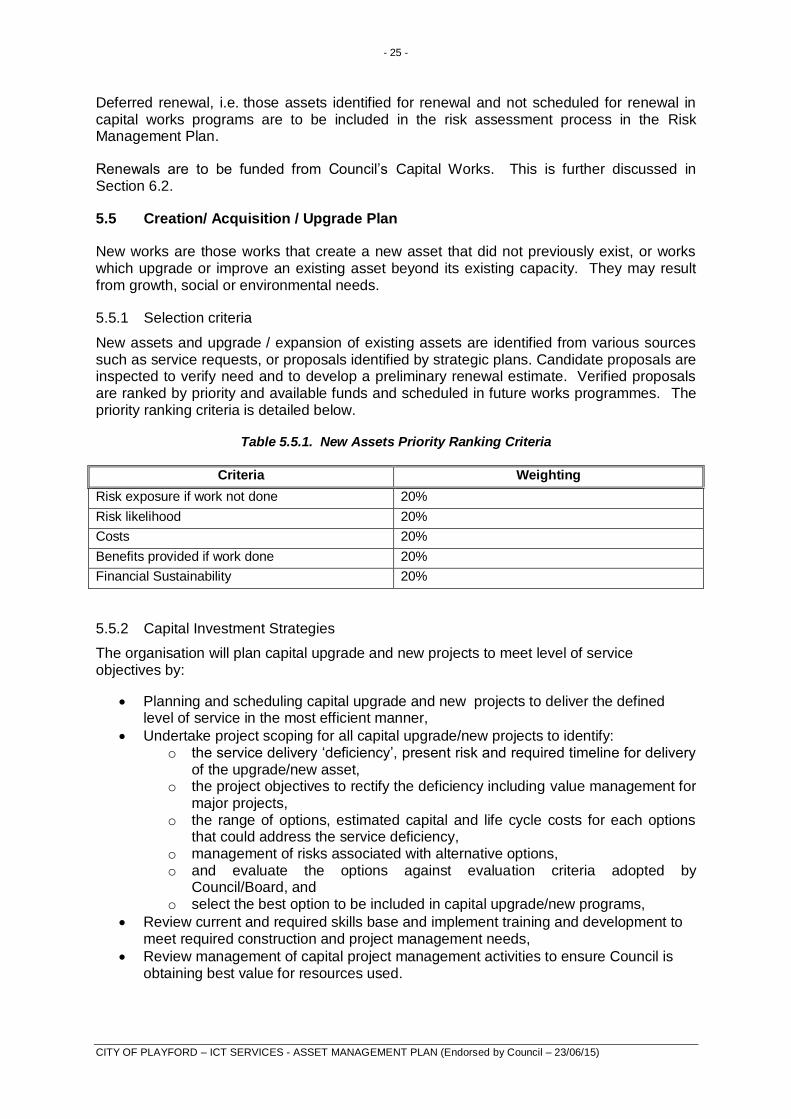
5.5.3 Summary of future upgrade / new assets expenditure
Planned upgrade / new asset expenditures are summarised in figure 6. The planned upgrade/new capital works program is shown in Appendix C. All costs are shown in purchase dollar values.
Figure 6. Planned Capital Upgrade / New Asset Expenditure
No new or upgraded assets have been identified; this will be reviewed in future versions of the plan. New assets and services are to be funded from Council’s capital works program and grants where available. This is further discussed in Section 6.2. 5.6 Disposal Plan Disposal includes any activity associated with disposal of a decommissioned asset including sale, demolition or relocation. Assets identified for possible decommissioning and disposal are shown in Table 5.6, together with estimated annual savings from not having to fund operations and maintenance of the assets. These assets will be further reinvestigated to determine the required levels of service and see what options are available for alternate service delivery, if any. Any revenue gained from asset disposals is accommodated in the organisation’s long term financial plan.
Where cashflow projections from asset disposals are not available, these will be developed in future revisions of this asset management plan.
Table 5.6. Assets identified for Disposal
Asset Reason for Disposal Timing Cashflow from disposal
No Assets Identified in this Version of the Plan
- 27 -
CITY OF PLAYFORD – ICT SERVICES - ASSET MANAGEMENT PLAN (Endorsed by Council – 23/06/15)
6. FINANCIAL SUMMARY
This section contains the financial requirements resulting from all the information presented in the previous sections of this plan. The financial projections will be improved as further information becomes available on desired levels of service and current and projected future asset performance.
6.1 Financial Statements and Projections
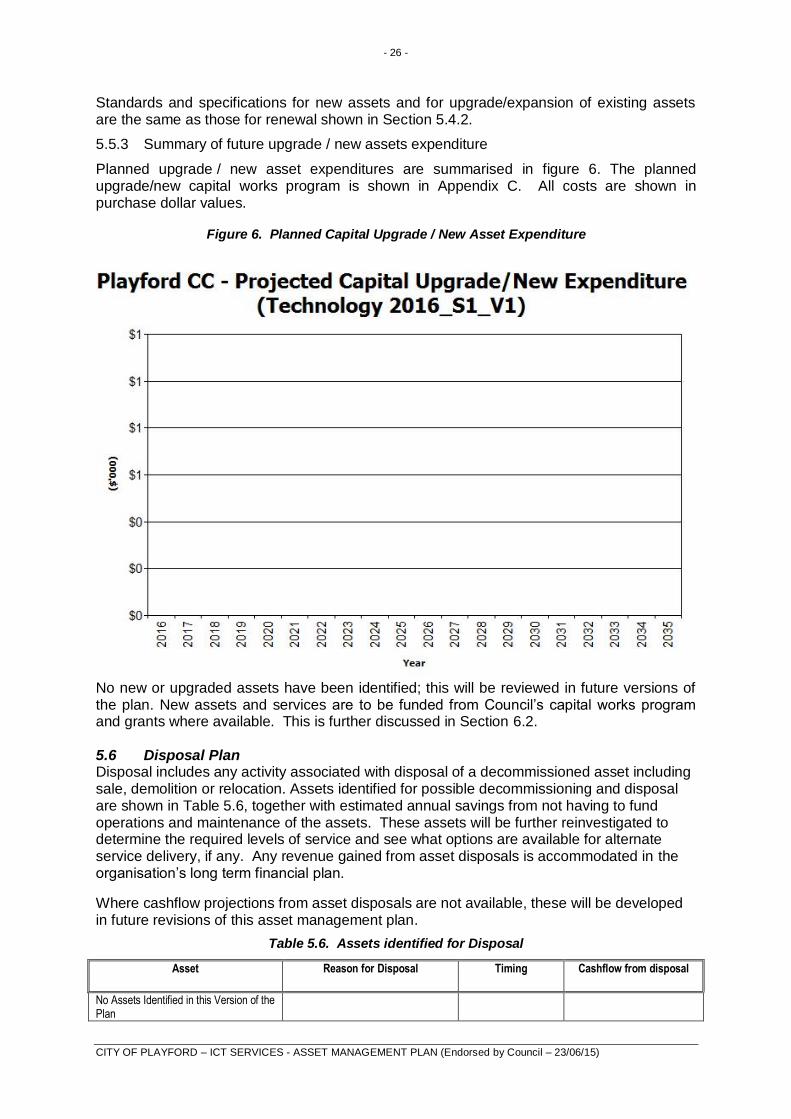
The financial projections are shown in figure 7 for planned operating (operations and maintenance) and capital expenditure (renewal and upgrade/expansion/new assets).
Figure 7. Planned Operating and Capital Expenditure
Note that all costs are shown in purchase dollar values.
6.1.1 Sustainability of service delivery
There are four key indicators for service delivery sustainability that have been considered in the analysis of the services provided by this asset category, these being the asset renewal funding ratio, long term life cycle costs/expenditures and medium term projected/budgeted expenditures over 5 and 10 years of the planning period.
Asset Renewal Funding Ratio
The Asset Renewal Funding Ratio9is the most important indicator and reveals that over the next 10 years, the organisation is forecasting to the target of 100% of the funds required for the optimal renewal and replacement of its assets.
9 AIFMG, 2009, Financial Sustainability Indicator 8, Sec 2.6, p 2.18
- 28 -
CITY OF PLAYFORD – ICT SERVICES - ASSET MANAGEMENT PLAN (Endorsed by Council – 23/06/15)
Long term - Life Cycle Cost
Life cycle costs (or whole of life costs) are the average costs that are required to sustain the service levels over the asset life cycle. Life cycle costs include operations and maintenance expenditure and asset consumption (depreciation expense). The life cycle cost for the services covered in this asset management plan is $2.5m per year (average operations and maintenance expenditure plus depreciation expense projected over 10 years).
Life cycle costs can be compared to life cycle expenditure to give an initial indicator of affordability of projected service levels when considered with age profiles. Life cycle expenditure includes operations, maintenance and capital renewal expenditure. Life cycle expenditure will vary depending on the timing of asset renewals. The life cycle expenditure over the 10 year planning period is $2.7m per year (average operations and maintenance plus capital renewal budgeted expenditure in LTFP over 10 years).
A shortfall between life cycle cost and life cycle expenditure is the life cycle gap. The life cycle gap for services covered by this asset management plan is $0.17m per year (-ve = gap, +ve = surplus).
Life cycle expenditure is 107% of life cycle costs.
The life cycle costs and life cycle expenditure comparison highlights any difference between present outlays and the average cost of providing the service over the long term. If the life cycle expenditure is less than that life cycle cost, it is most likely that outlays will need to be increased or cuts in services made in the future.
Knowing the extent and timing of any required increase in outlays and the service consequences if funding is not available will assist organisations in providing services to their communities in a financially sustainable manner. This is the purpose of the asset management plans and long term financial plan.
Medium term – 10 year financial planning period
This asset management plan identifies the projected operations, maintenance and capital renewal expenditures required to provide an agreed level of service to the community over a 10 year period. This provides input into 10 year financial and funding plans aimed at providing the required services in a sustainable manner.
These projected expenditures may be compared to budgeted expenditures in the 10 year period to identify any funding shortfall. In a core asset management plan, a gap is generally due to increasing asset renewals for ageing assets.
The projected operations, maintenance and capital renewal expenditure required over the 10 year planning period is $2.6m on average per year.
Estimated (budget) operations, maintenance and capital renewal funding is $2.7m on average per year. This indicates that Council expects to have 101% of the projected expenditures needed to provide the services documented in the asset management plan.
Medium Term – 5 year financial planning period
The projected operations, maintenance and capital renewal expenditure required over the first 5 years of the planning period is $2.6m on average per year.
Estimated (budget) operations, maintenance and capital renewal funding is $2.6m on average per year. This indicates that Council expects to have 100% of projected expenditures required to provide the services shown in this asset management plan.
- 29 -
CITY OF PLAYFORD – ICT SERVICES - ASSET MANAGEMENT PLAN (Endorsed by Council – 23/06/15)
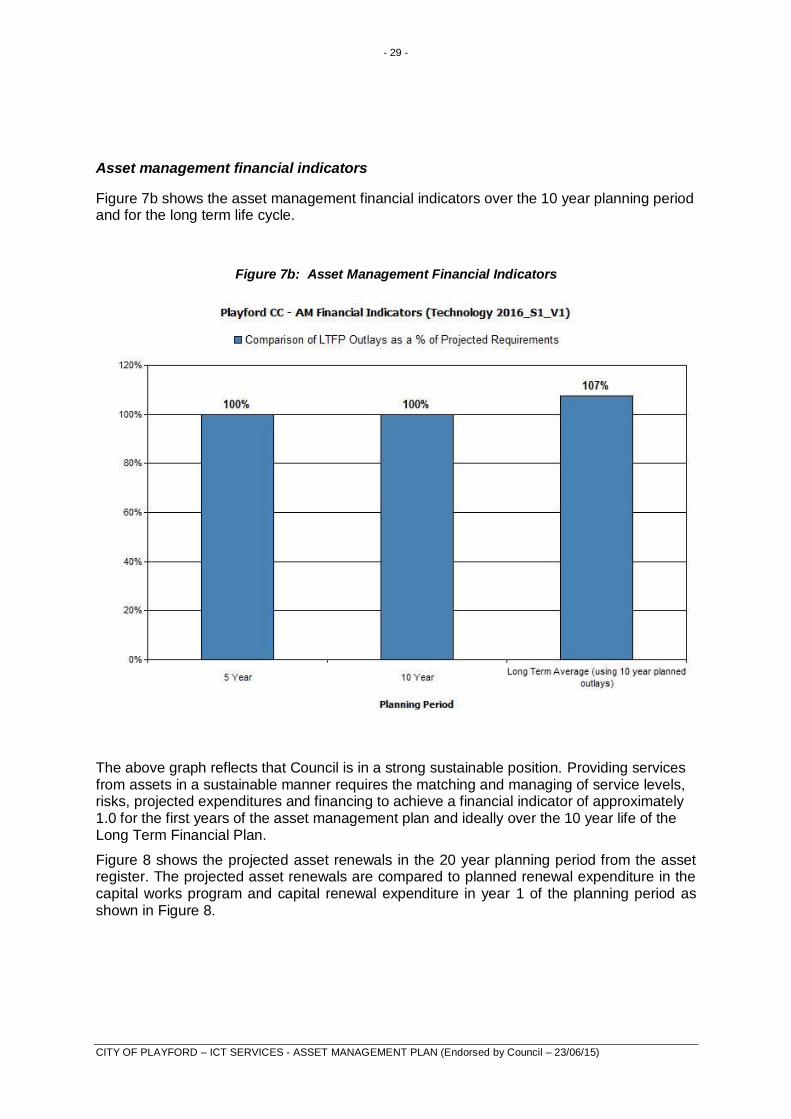
Asset management financial indicators
Figure 7b shows the asset management financial indicators over the 10 year planning period and for the long term life cycle.
Figure 7b: Asset Management Financial Indicators
The above graph reflects that Council is in a strong sustainable position. Providing services from assets in a sustainable manner requires the matching and managing of service levels, risks, projected expenditures and financing to achieve a financial indicator of approximately 1.0 for the first years of the asset management plan and ideally over the 10 year life of the Long Term Financial Plan.
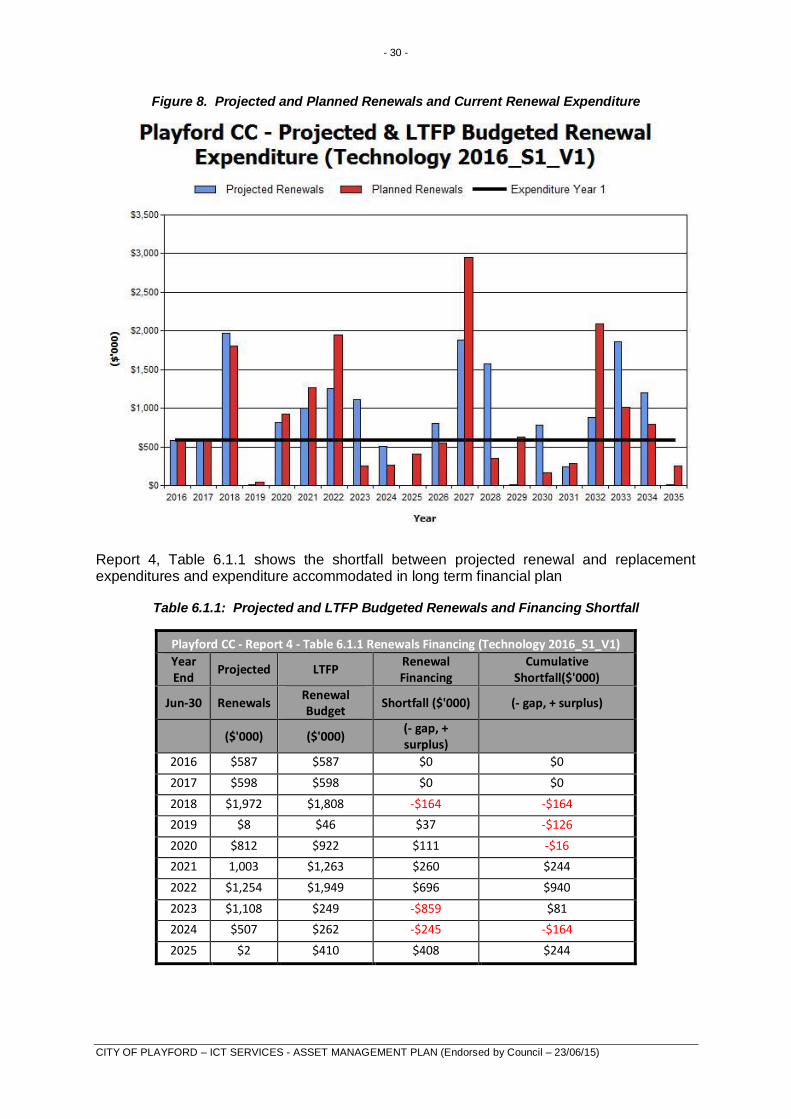
Figure 8 shows the projected asset renewals in the 20 year planning period from the asset register. The projected asset renewals are compared to planned renewal expenditure in the capital works program and capital renewal expenditure in year 1 of the planning period as shown in Figure 8.
- 30 -
CITY OF PLAYFORD – ICT SERVICES - ASSET MANAGEMENT PLAN (Endorsed by Council – 23/06/15)
Figure 8. Projected and Planned Renewals and Current Renewal Expenditure
Report 4, Table 6.1.1 shows the shortfall between projected renewal and replacement expenditures and expenditure accommodated in long term financial plan
Table 6.1.1: Projected and LTFP Budgeted Renewals and Financing Shortfall
Playford CC - Report 4 - Table 6.1.1 Renewals Financing (Technology 2016_S1_V1)
Year End
Projected LTFP Renewal Financing
Cumulative Shortfall($'000)
Jun-30 Renewals Renewal Budget
Shortfall ($'000) (- gap, + surplus)
($'000) ($'000) (- gap, + surplus)
2016 $587 $587 $0 $0
2017 $598 $598 $0 $0
2018 $1,972 $1,808 -$164 -$164
2019 $8 $46 $37 -$126
2020 $812 $922 $111 -$16
2021 1,003 $1,263 $260 $244
2022 $1,254 $1,949 $696 $940
2023 $1,108 $249 -$859 $81
2024 $507 $262 -$245 -$164
2025 $2 $410 $408 $244
- 31 -
CITY OF PLAYFORD – ICT SERVICES - ASSET MANAGEMENT PLAN (Endorsed by Council – 23/06/15)
Providing services in a sustainable manner will require matching of projected asset renewal and replacement expenditure to meet agreed service levels with the corresponding capital works program accommodated in the long term financial plan.
A gap between projected asset renewal/replacement expenditure and amounts accommodated in the LTFP indicates that further work is required on reviewing service levels in the AM Plan (including possibly revising the LTFP) before finalising the asset management plan to manage required service levels and funding to eliminate any funding gap.
We will manage the ‘gap’ by developing this asset management plan to provide guidance on future service levels and resources required to provide these services, and review future services, service levels and costs with the community.
Table 6.1.2 shows the projected expenditures for the 10 year long term financial plan.
Table 6.1.2: Projected Expenditures for Long Term Financial Plan ($000)
Playford CC - Report 5 - Table 6.1.2 Long Term Financial Plan (Technology 2016_S1_V1)
Year Operations Maintenance
Projected Capital (‘$000) Disposals
Renewal Upgrade/New
2016 $1,812.00 $82.00 $586.80 $0.00 $0.00
2017 $1,812.00 $82.00 $597.63 $0.00 $0.00
2018 $1,812.00 $82.00 $1,972.18 $0.00 $0.00
2019 $1,812.00 $82.00 $8.10 $0.00 $0.00
2020 $1,812.00 $82.00 $811.56 $0.00 $0.00
2021 $1,812.00 $82.00 $1,002.68 $0.00 $0.00
2022 $1,812.00 $82.00 $1,253.60 $0.00 $0.00
2023 $1,812.00 $82.00 $1,108.32 $0.00 $0.00
2024 $1,812.00 $82.00 $507.04 $0.00 $0.00
2025 $1,812.00 $82.00 $1.84 $0.00 $0.00
6.2 Funding Strategy
Projected expenditure identified in Section 6.1 is to be funded from Council’s operating and capital budgets. The funding strategy is detailed in the Council’s 10 Year Long Term Financial Plan.
Achieving the financial strategy will require informing the Long Term Plan, and link our asset provision to the service delivery and developing growth and future demand modelling.
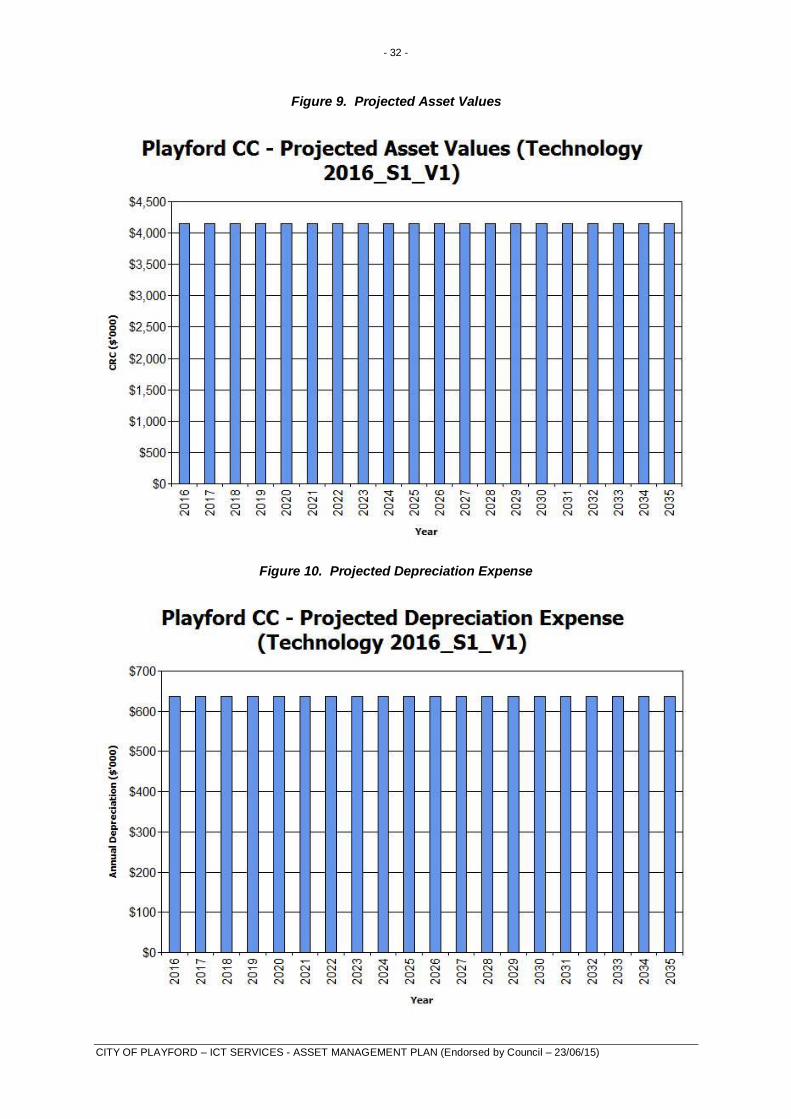
6.3 Valuation Forecasts
Asset values are forecast to increase as additional assets are added to the asset stock from acquisition by Council. Figure 9 shows the projected replacement cost asset values over the planning period in purchase dollar values.
Figure 9 shows the projected replacement cost asset values over the planning period. Depreciation expense values are forecast in line with asset values as shown in Figure 10.
- 32 -
CITY OF PLAYFORD – ICT SERVICES - ASSET MANAGEMENT PLAN (Endorsed by Council – 23/06/15)
Figure 9. Projected Asset Values
Figure 10. Projected Depreciation Expense
- 33 -
CITY OF PLAYFORD – ICT SERVICES - ASSET MANAGEMENT PLAN (Endorsed by Council – 23/06/15)
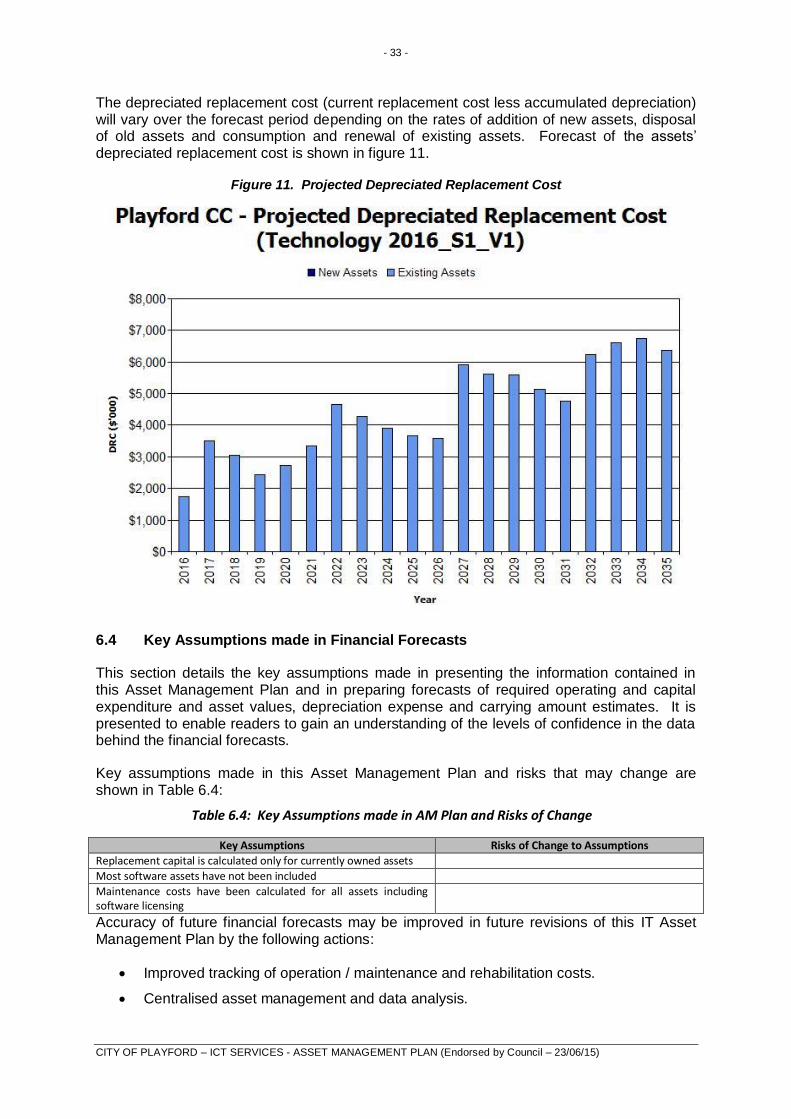
The depreciated replacement cost (current replacement cost less accumulated depreciation) will vary over the forecast period depending on the rates of addition of new assets, disposal of old assets and consumption and renewal of existing assets. Forecast of the assets’ depreciated replacement cost is shown in figure 11.
Figure 11. Projected Depreciated Replacement Cost
6.4 Key Assumptions made in Financial Forecasts
This section details the key assumptions made in presenting the information contained in this Asset Management Plan and in preparing forecasts of required operating and capital expenditure and asset values, depreciation expense and carrying amount estimates. It is presented to enable readers to gain an understanding of the levels of confidence in the data behind the financial forecasts.
Key assumptions made in this Asset Management Plan and risks that may change are shown in Table 6.4:
Table 6.4: Key Assumptions made in AM Plan and Risks of Change
Key Assumptions Risks of Change to Assumptions
Replacement capital is calculated only for currently owned assets
Most software assets have not been included
Maintenance costs have been calculated for all assets including software licensing
Accuracy of future financial forecasts may be improved in future revisions of this IT Asset Management Plan by the following actions:
Improved tracking of operation / maintenance and rehabilitation costs.
Centralised asset management and data analysis.
- 34 -
CITY OF PLAYFORD – ICT SERVICES - ASSET MANAGEMENT PLAN (Endorsed by Council – 23/06/15)
Asset audit and improved data collection.
Ongoing review and identification of limitations and application of improved processes.
6.5 Forecast Reliability and Confidence
The expenditure and valuations projections in this AM Plan are based on best available data. Currency and accuracy of data is critical to effective asset and financial management. Data confidence is classified on a 5 level scale10 in accordance with Table 6.5.
Table 6.5: Data Confidence Grading System
Confidence Grade
Description
A Highly reliable Data based on sound records, procedures, investigations and analysis, documented properly and recognised as the best method of assessment. Dataset is complete and estimated to be accurate ± 2%
B Reliable Data based on sound records, procedures, investigations and analysis, documented properly but has minor shortcomings, for example some of the data is old, some documentation is missing and/or reliance is placed on unconfirmed reports or some extrapolation. Dataset is complete and estimated to be accurate ± 10%
C Uncertain Data based on sound records, procedures, investigations and analysis which is incomplete or unsupported, or extrapolated from a limited sample for which grade A or B data are available. Dataset is substantially complete but up to 50% is extrapolated data and accuracy estimated ± 25%
D Very Uncertain
Data is based on unconfirmed verbal reports and/or cursory inspections and analysis. Dataset may not be fully complete and most data is estimated or extrapolated. Accuracy ± 40%
E Unknown None or very little data held.
The estimated confidence level for and reliability of data used in this AM Plan is shown in Table 6.5.1.
Table 6.5.1: Data Confidence Assessment for Data used in AM Plan
Data Confidence Assessment Comment
Demand drivers Uncertain
Growth projections Reliable
Operations expenditures
Reliable
Maintenance expenditures
Reliable
Projected Renewal exps.
Reliable
Asset values
Asset residual values Reliable
Asset useful lives Reliable
Condition modelling Reliable
Network renewals Uncertain
Defect repairs Uncertain
Upgrade/New expenditures
Uncertain
Disposal expenditures Reliable
Over all data sources the data confidence is assessed as a reliable confidence level for data used in the preparation of this AM Plan.
10 IPWEA, 2011, IIMM, Table 2.4.6, p 2|59.

- 35 -
CITY OF PLAYFORD – ICT SERVICES - ASSET MANAGEMENT PLAN (Endorsed by Council – 23/06/15)
7. PLAN IMPROVEMENT AND MONITORING
7.1 Status of Asset Management Practices
7.1.1 Accounting and financial systems
The City of Playford uses Technology One’s “One Council” financial system. This system has General Ledger module.
Accountabilities for financial systems
The finance module is the responsibility of the Finance function. . There is joint responsibility for ensuring the integrity of the system and asset financial information overall.
Accounting standards and regulations
The City of Playford prepares general purpose financial reports in accordance with Australian equivalents to International Financial Reporting Standards (AIFRS) as they apply to not-for-profit entities, other authoritative pronouncements of the Australian Accounting Standards Board, Urgent Issues Group Interpretations (UIGs) and relevant South Australian legislation.
Capital/maintenance threshold
As outlaid in the Accounting for Property, Plant, Equipment and Infrastructure Policy, the objective of this policy is to provide guidance around identifying, classifying, valuing, recording and disposing of non-current physical assets. This will provide for greater understanding and accuracy of City of Playford’s capital requirements and depreciation expenses in the context of financial sustainability and intergenerational equity as well as ensuring that City of Playford is meeting its statutory reporting obligations.
Required changes to accounting financial systems arising from this AM Plan
Any changes to our current financial systems will be driven from the service review and the asset strategy framework.
7.2.1 Asset management system
Asset registers
The City of Playford uses Technology One’s “One Council”, financial system. This system has an Asset Database module.
Linkage from asset management to financial system
The GL module references transactions from the asset module through an asset number field. Transfer of financial information from the asset to the GL module is automatic via system posting transactions.
Accountabilities for asset management system and data maintenance
The asset module is the responsibility of the Asset Services function. There is joint responsibility for ensuring the integrity of the system and asset financial information overall.

- 36 -
CITY OF PLAYFORD – ICT SERVICES - ASSET MANAGEMENT PLAN (Endorsed by Council – 23/06/15)
Required changes to asset management system arising from this AM Plan
Any changes to our current financial systems will be driven from the service review and the asset strategy framework.
7.2 Improvement Program
The asset management improvement plan generated from this Plan is shown in Table 7.2.
Table 7.2. Improvement Plan
Task No
Task Responsibility Resources Required
Timeline
1. Review process to develop a model to support decision making in regard to leasing or purchasing of Assets
ICT Team Current Resources
2014/2015
2. Software audit and data capture ICT Team Current Resources
2014/2015
3. Develop tools to assist growth modelling for technology assets
ICT Team Current Resources
2014/2015
4. Develop model to redefine service levels ICT Team Current Resources
2014/2015
7.3 Monitoring and Review Procedures
This asset management plan will be reviewed during annual budget planning processes and amended to recognise any material changes in service levels and/or resources available to provide those services as a result of budget decisions.
The AM Plan will be updated annually to ensure it represents the current service level, asset values, projected operations, maintenance, capital renewal and replacement, capital upgrade/new and asset disposal expenditures and projected expenditure values incorporated into the Council’s long term financial plan.
The mandatory AM Plan has a life of 4 years (Council/Board election cycle) and is due for complete revision and updating within 12 months of each Council/Board election. City of Playford also reviews and published updated plans annually as a part of the long term planning process.
7.4 Performance Measures
The effectiveness of the asset management plan can be measured in the following ways:
The degree to which the required projected expenditures identified in this asset management plan are incorporated into the organisation’s long term financial plan,
The degree to which 1-5 year detailed works programs, budgets, business plans and organisational structures take into account the overarching works program trends provided by the asset management plan,
The degree to which the existing and projected service levels and service consequences (what we cannot do), risks and residual risks are incorporated into the organisation’s Strategic Plan and associated plans,
The Asset Renewal Funding Ratio achieving the target of 1.0.
- 37 -
CITY OF PLAYFORD – ICT SERVICES - ASSET MANAGEMENT PLAN (Endorsed by Council – 23/06/15)
8. REFERENCES
IPWEA, 2006, ‘International Infrastructure Management Manual’, Institute of Public Works Engineering Australia, Sydney, www.ipwea.org.au/IIMM
IPWEA, 2008, ‘NAMS.PLUS Asset Management’, Institute of Public Works Engineering Australia, Sydney, www.ipwea.org.au/namsplus.
IPWEA, 2009, ‘Australian Infrastructure Financial Management Guidelines’, Institute of Public Works Engineering Australia, Sydney, www.ipwea.org.au/AIFMG.
IPWEA, 2011, ‘International Infrastructure Management Manual’, Institute of Public Works Engineering Australia, Sydney, www.ipwea.org.au/IIMM
Organisation, ‘Strategic Plan’,
Organisation, ‘Annual Business Plan’.
- 38 -
CITY OF PLAYFORD – ICT SERVICES - ASSET MANAGEMENT PLAN (Endorsed by Council – 23/06/15)
9. APPENDICES
Appendix A Maintenance Response Levels of Service
Appendix B Projected 10 year Capital Renewal and Replacement Works Program
Appendix C Projected 10 year Capital Upgrade/New Works Program
Appendix D Budgeted Expenditures Accommodated in LTFP
Appendix E Abbreviations
Appendix F Glossary
- 39 -
CITY OF PLAYFORD – ICT SERVICES - ASSET MANAGEMENT PLAN (Endorsed by Council – 23/06/15)
Appendix A Maintenance Response Levels of Service
To be developed
- 40 -
CITY OF PLAYFORD – ICT SERVICES - ASSET MANAGEMENT PLAN (Endorsed by Council – 23/06/15)
Appendix B Projected 10 year Capital Renewal and Replacement Program
To be developed

- 41 -
CITY OF PLAYFORD – ICT SERVICES - ASSET MANAGEMENT PLAN (Endorsed by Council – 23/06/15)
Appendix C Projected Upgrade/Exp/New 10 year Capital Works Program
To be developed
- 42 -
CITY OF PLAYFORD – ICT SERVICES - ASSET MANAGEMENT PLAN (Endorsed by Council – 23/06/15)
Appendix D Budgeted Expenditures Accommodated in LTFP
To be developed

- 43 -
CITY OF PLAYFORD – ICT SERVICES - ASSET MANAGEMENT PLAN (Endorsed by Council – 23/06/15)
Appendix E ABBREVIATIONS
AAAC Average annual asset consumption
AM Asset management
AMPlan Asset management plan
ARI Average recurrence interval
ASC Annual service cost
BOD Biochemical (biological) oxygen demand
CRC Current replacement cost
CWMS Community wastewater management systems
DA Depreciable amount
DRC Depreciated replacement cost
EF Earthworks/formation
IRMP Infrastructure risk management plan
LCC Life Cycle cost
LCE Life cycle expenditure
LTFP Long term financial plan
MMS Maintenance management system
PCI Pavement condition index
RV Residual value
SoA State of the Assets
SS Suspended solids
vph Vehicles per hour
WDCRC Written down current replacement cost
- 44 -
CITY OF PLAYFORD – ICT SERVICES - ASSET MANAGEMENT PLAN (Endorsed by Council – 23/06/15)
APPENDIX F GLOSSARY
Annual service cost (ASC) 1) Reporting actual cost The annual (accrual) cost of providing a
service including operations, maintenance, depreciation, finance/opportunity and disposal costs less revenue.
2) For investment analysis and budgeting An estimate of the cost that would be
tendered, per annum, if tenders were called for the supply of a service to a performance specification for a fixed term. The Annual Service Cost includes operations, maintenance, depreciation, finance/ opportunity and disposal costs, less revenue.
Asset A resource controlled by an entity as a result of past events and from which future economic benefits are expected to flow to the entity. Infrastructure assets are a sub-class of property, plant and equipment which are non-current assets with a life greater than 12 months and enable services to be provided.
Asset category Sub-group of assets within a class hierarchy for financial reporting and management purposes.
Asset class A group of assets having a similar nature or function in the operations of an entity, and which, for purposes of disclosure, is shown as a single item without supplementary disclosure.
Asset condition assessment The process of continuous or periodic inspection, assessment, measurement and interpretation of the resultant data to indicate the condition of a specific asset so as to determine the need for some preventative or remedial action.
Asset hierarchy A framework for segmenting an asset base into appropriate classifications. The asset hierarchy can be based on asset function or asset type or a combination of the two.
Asset management (AM) The combination of management, financial, economic, engineering and other practices applied to physical assets with the objective of providing the required level of service in the most cost effective manner.
Asset renewal funding ratio The ratio of the net present value of asset renewal funding accommodated over a 10 year period in a long term financial plan relative to the net present value of projected capital renewal expenditures identified in an asset management plan for the same period [AIFMG Financial Sustainability Indicator No 8].
Average annual asset consumption (AAAC)* The amount of an organisation’s asset base consumed during a reporting period (generally a year). This may be calculated by dividing the depreciable amount by the useful life (or total future economic benefits/service potential) and totalled for each and every asset OR by dividing the carrying amount (depreciated replacement cost) by the remaining useful life (or remaining future economic benefits/service potential) and totalled for each and every asset in an asset category or class.
Borrowings A borrowing or loan is a contractual obligation of the borrowing entity to deliver cash or another financial asset to the lending entity over a specified period of time or at a specified point in time, to cover both the initial capital provided and the cost of the interest incurred for providing this capital. A borrowing or loan provides the means for the borrowing entity to finance outlays (typically physical assets) when it has insufficient funds of its own to do so, and for the lending entity to make a financial return, normally in the form of interest revenue, on the funding provided.
Capital expenditure Relatively large (material) expenditure, which has benefits, expected to last for more than 12 months. Capital expenditure includes renewal, expansion and upgrade. Where capital projects involve a combination of renewal, expansion and/or upgrade expenditures, the total project cost needs to be allocated accordingly.
Capital expenditure - expansion Expenditure that extends the capacity of an existing asset to provide benefits, at the same standard as is currently enjoyed by existing beneficiaries, to a new group of users. It is discretionary expenditure, which increases future operations and maintenance costs, because it increases the organisation’s asset base, but may be associated with additional revenue from the

- 45 -
CITY OF PLAYFORD – ICT SERVICES - ASSET MANAGEMENT PLAN (Endorsed by Council – 23/06/15)
new user group, eg. extending a drainage or road network, the provision of an oval or park in a new suburb for new residents.
Capital expenditure - new Expenditure which creates a new asset providing a new service/output that did not exist beforehand. As it increases service potential it may impact revenue and will increase future operations and maintenance expenditure.
Capital expenditure - renewal Expenditure on an existing asset or on replacing an existing asset, which returns the service capability of the asset up to that which it had originally. It is periodically required expenditure, relatively large (material) in value compared with the value of the components or sub-components of the asset being renewed. As it reinstates existing service potential, it generally has no impact on revenue, but may reduce future operations and maintenance expenditure if completed at the optimum time, eg. resurfacing or resheeting a material part of a road network, replacing a material section of a drainage network with pipes of the same capacity, resurfacing an oval.
Capital expenditure - upgrade Expenditure, which enhances an existing asset to provide a higher level of service or expenditure that will increase the life of the asset beyond that which it had originally. Upgrade expenditure is discretionary and often does not result in additional revenue unless direct user charges apply. It will increase operations and maintenance expenditure in the future because of the increase in the organisation’s asset base, eg. widening the sealed area of an existing road, replacing drainage pipes with pipes of a greater capacity, enlarging a grandstand at a sporting facility.
Capital funding Funding to pay for capital expenditure.
Capital grants Monies received generally tied to the specific projects for which they are granted, which are often upgrade and/or expansion or new investment proposals.
Capital investment expenditure See capital expenditure definition
Capitalisation threshold The value of expenditure on non-current assets above which the expenditure is recognised as capital expenditure and below which the
expenditure is charged as an expense in the year of acquisition.
Carrying amount The amount at which an asset is recognised after deducting any accumulated depreciation / amortisation and accumulated impairment losses thereon.
Class of assets See asset class definition
Component Specific parts of an asset having independent physical or functional identity and having specific attributes such as different life expectancy, maintenance regimes, risk or criticality.
Core asset management Asset management which relies primarily on the use of an asset register, maintenance management systems, job resource management, inventory control, condition assessment, simple risk assessment and defined levels of service, in order to establish alternative treatment options and long-term cashflow predictions. Priorities are usually established on the basis of financial return gained by carrying out the work (rather than detailed risk analysis and optimised decision- making).
Cost of an asset The amount of cash or cash equivalents paid or the fair value of the consideration given to acquire an asset at the time of its acquisition or construction, including any costs necessary to place the asset into service. This includes one-off design and project management costs.
Critical assets Assets for which the financial, business or service level consequences of failure are sufficiently severe to justify proactive inspection and rehabilitation. Critical assets have a lower threshold for action than noncritical assets.
Current replacement cost (CRC) The cost the entity would incur to acquire the asset on the reporting date. The cost is measured by reference to the lowest cost at which the gross future economic benefits could be obtained in the normal course of business or the minimum it would cost, to replace the existing asset with a technologically modern equivalent new asset (not a second hand one) with the same economic benefits (gross service potential) allowing for any

- 46 -
CITY OF PLAYFORD – ICT SERVICES - ASSET MANAGEMENT PLAN (Endorsed by Council – 23/06/15)
differences in the quantity and quality of output and in operating costs.
Deferred maintenance The shortfall in rehabilitation work undertaken relative to that required to maintain the service potential of an asset.
Depreciable amount The cost of an asset, or other amount substituted for its cost, less its residual value.
Depreciated replacement cost (DRC) The current replacement cost (CRC) of an asset less, where applicable, accumulated depreciation calculated on the basis of such cost to reflect the already consumed or expired future economic benefits of the asset.
Depreciation / amortisation The systematic allocation of the depreciable amount (service potential) of an asset over its useful life.
Economic life See useful life definition.
Expenditure The spending of money on goods and services. Expenditure includes recurrent and capital outlays.
Expenses Decreases in economic benefits during the accounting period in the form of outflows or depletions of assets or increases in liabilities that result in decreases in equity, other than those relating to distributions to equity participants.
Fair value The amount for which an asset could be exchanged, or a liability settled, between knowledgeable, willing parties, in an arms length transaction.
Financing gap A financing gap exists whenever an entity has insufficient capacity to finance asset renewal and other expenditure necessary to be able to appropriately maintain the range and level of services its existing asset stock was originally designed and intended to deliver. The service capability of the existing asset stock should be determined assuming no additional operating revenue, productivity improvements, or net financial liabilities above levels currently planned or projected. A current financing gap means service levels have already or are currently falling.
A projected financing gap if not addressed will result in a future diminution of existing service levels.
Heritage asset An asset with historic, artistic, scientific, technological, geographical or environmental qualities that is held and maintained principally for its contribution to knowledge and culture and this purpose is central to the objectives of the entity holding it.
Impairment Loss The amount by which the carrying amount of an asset exceeds its recoverable amount.
Infrastructure assets Physical assets that contribute to meeting the needs of organisations or the need for access to major economic and social facilities and services, eg. roads, drainage, footpaths and cycleways. These are typically large, interconnected networks or portfolios of composite assets. The components of these assets may be separately maintained, renewed or replaced individually so that the required level and standard of service from the network of assets is continuously sustained. Generally the components and hence the assets have long lives. They are fixed in place and are often have no separate market value.
Investment property Property held to earn rentals or for capital appreciation or both, rather than for: (a) use in the production or supply of goods or
services or for administrative purposes; or (b) sale in the ordinary course of business.
Key performance indicator A qualitative or quantitative measure of a service or activity used to compare actual performance against a standard or other target. Performance indicators commonly relate to statutory limits, safety, responsiveness, cost, comfort, asset performance, reliability, efficiency, environmental protection and customer satisfaction.
Level of service The defined service quality for a particular service/activity against which service performance may be measured. Service levels usually relate to quality, quantity, reliability, responsiveness, environmental impact, acceptability and cost.
- 47 -
CITY OF PLAYFORD – ICT SERVICES - ASSET MANAGEMENT PLAN (Endorsed by Council – 23/06/15)
Life Cycle Cost * 1. Total LCC The total cost of an asset
throughout its life including planning, design, construction, acquisition, operation, maintenance, rehabilitation and disposal costs.
2. Average LCC The life cycle cost (LCC) is average cost to provide the service over the longest asset life cycle. It comprises average operations, maintenance expenditure plus asset consumption expense, represented by depreciation expense projected over 10 years. The Life Cycle Cost does not indicate the funds required to provide the service in a particular year.
Life Cycle Expenditure The Life Cycle Expenditure (LCE) is the average operations, maintenance and capital renewal expenditure accommodated in the long term financial plan over 10 years. Life Cycle Expenditure may be compared to average Life Cycle Cost to give an initial indicator of affordability of projected service levels when considered with asset age profiles.
Loans / borrowings See borrowings.
Maintenance All actions necessary for retaining an asset as near as practicable to an appropriate service condition, including regular ongoing day-to-day work necessary to keep assets operating, eg road patching but excluding rehabilitation or renewal. It is operating expenditure required to ensure that the asset reaches its expected useful life. • Planned maintenance
Repair work that is identified and managed through a maintenance management system (MMS). MMS activities include inspection, assessing the condition against failure/breakdown criteria/experience, prioritising scheduling, actioning the work and reporting what was done to develop a maintenance history and improve maintenance and service delivery performance.
• Reactive maintenance Unplanned repair work that is carried out in response to service requests and management/ supervisory directions.
• Specific maintenance Maintenance work to repair components or replace sub-components that needs to be identified as a specific maintenance item in the maintenance budget.
• Unplanned maintenance Corrective work required in the short-term to restore an asset to working condition so it can continue to deliver the required service or to maintain its level of security and integrity.
Maintenance expenditure * Recurrent expenditure, which is periodically or regularly required as part of the anticipated schedule of works required to ensure that the asset achieves its useful life and provides the required level of service. It is expenditure, which was anticipated in determining the asset’s useful life.
Materiality The notion of materiality guides the margin of error acceptable, the degree of precision required and the extent of the disclosure required when preparing general purpose financial reports. Information is material if its omission, misstatement or non-disclosure has the potential, individually or collectively, to influence the economic decisions of users taken on the basis of the financial report or affect the discharge of accountability by the management or governing body of the entity.
Modern equivalent asset Assets that replicate what is in existence with the most cost-effective asset performing the same level of service. It is the most cost efficient, currently available asset which will provide the same stream of services as the existing asset is capable of producing. It allows for technology changes and, improvements and efficiencies in production and installation techniques
Net present value (NPV) The value to the organisation of the cash flows associated with an asset, liability, activity or event calculated using a discount rate to reflect the time value of money. It is the net amount of discounted total cash inflows after deducting the value of the discounted total cash outflows arising from eg the continued use and subsequent disposal of the asset after deducting the value of the discounted total cash outflows.
Non-revenue generating investments Investments for the provision of goods and services to sustain or improve services to the community that are not expected to generate any savings or revenue to the Council, eg. parks and playgrounds, footpaths, roads and bridges, libraries, etc.
- 48 -
CITY OF PLAYFORD – ICT SERVICES - ASSET MANAGEMENT PLAN (Endorsed by Council – 23/06/15)
Operations Regular activities to provide services such as public health, safety and amenity, eg street sweeping, grass mowing and street lighting.
Operating expenditure Recurrent expenditure, which is continuously required to provide a service. In common use the term typically includes, eg power, fuel, staff, plant equipment, on-costs and overheads but excludes maintenance and depreciation. Maintenance and depreciation is on the other hand included in operating expenses.
Operating expense The gross outflow of economic benefits, being cash and non cash items, during the period arising in the course of ordinary activities of an entity when those outflows result in decreases in equity, other than decreases relating to distributions to equity participants.
Operating expenses Recurrent expenses continuously required to provide a service, including power, fuel, staff, plant equipment, maintenance, depreciation, on-costs and overheads.
Operations, maintenance and renewal financing ratio Ratio of estimated budget to projected expenditure for operations, maintenance and renewal of assets over a defined time (eg 5, 10 and 15 years).
Operations, maintenance and renewal gap Difference between budgeted expenditures in a long term financial plan (or estimated future budgets in absence of a long term financial plan) and projected expenditures for operations, maintenance and renewal of assets to achieve/maintain specified service levels, totalled over a defined time (e.g. 5, 10 and 15 years).
Pavement management system (PMS) A systematic process for measuring and predicting the condition of road pavements and wearing surfaces over time and recommending corrective actions.
PMS Score A measure of condition of a road segment determined from a Pavement Management System.
Rate of annual asset consumption * The ratio of annual asset consumption relative to the depreciable amount of the assets. It measures the amount of the consumable parts of assets that are consumed in a period (depreciation) expressed as a percentage of the depreciable amount.
Rate of annual asset renewal * The ratio of asset renewal and replacement expenditure relative to depreciable amount for a period. It measures whether assets are being replaced at the rate they are wearing out with capital renewal expenditure expressed as a percentage of depreciable amount (capital renewal expenditure/DA).
Rate of annual asset upgrade/new * A measure of the rate at which assets are being upgraded and expanded per annum with capital upgrade/new expenditure expressed as a percentage of depreciable amount (capital upgrade/expansion expenditure/DA).
Recoverable amount The higher of an asset's fair value, less costs to sell and its value in use.
Recurrent expenditure Relatively small (immaterial) expenditure or that which has benefits expected to last less than 12 months. Recurrent expenditure includes operations and maintenance expenditure.
Recurrent funding Funding to pay for recurrent expenditure.
Rehabilitation See capital renewal expenditure definition above.
Remaining useful life The time remaining until an asset ceases to provide the required service level or economic usefulness. Age plus remaining useful life is useful life.
Renewal See capital renewal expenditure definition above.
Residual value The estimated amount that an entity would currently obtain from disposal of the asset, after deducting the estimated costs of disposal, if the asset were already of the age and in the condition expected at the end of its useful life.
- 49 -
CITY OF PLAYFORD – ICT SERVICES - ASSET MANAGEMENT PLAN (Endorsed by Council – 23/06/15)
Revenue generating investments Investments for the provision of goods and services to sustain or improve services to the community that are expected to generate some savings or revenue to offset operating costs, eg public halls and theatres, childcare centres, sporting and recreation facilities, tourist information centres, etc.
Risk management The application of a formal process to the range of possible values relating to key factors associated with a risk in order to determine the resultant ranges of outcomes and their probability of occurrence.
Section or segment A self-contained part or piece of an infrastructure asset.
Service potential The total future service capacity of an asset. It is normally determined by reference to the operating capacity and economic life of an asset. A measure of service potential is used in the not-for-profit sector/public sector to value assets, particularly those not producing a cash flow.
Service potential remaining A measure of the future economic benefits remaining in assets. It may be expressed in dollar values (Fair Value) or as a percentage of total anticipated future economic benefits. It is also a measure of the percentage of the asset’s potential to provide services that is still available for use in providing services (Depreciated Replacement Cost/Depreciable Amount).
Specific Maintenance Replacement of higher value components/sub-components of assets that is undertaken on a regular cycle including repainting, replacement of air conditioning equipment, etc. This work generally falls below the capital/ maintenance threshold and needs to be identified in a specific maintenance budget allocation.
Strategic Longer-Term Plan A plan covering the term of office of councillors (4 years minimum) reflecting the needs of the community for the foreseeable future. It brings together the detailed requirements in the Council’s longer-term plans such as the asset management plan and the long-term financial plan. The plan is prepared in consultation with the community and details where the Council is at that point in time, where it wants to go, how it is going
to get there, mechanisms for monitoring the achievement of the outcomes and how the plan will be resourced.
Sub-component Smaller individual parts that make up a component part.
Useful life Either: (a) the period over which an asset is expected to
be available for use by an entity, or (b) the number of production or similar units
expected to be obtained from the asset by the entity.
It is estimated or expected time between placing the asset into service and removing it from service, or the estimated period of time over which the future economic benefits embodied in a depreciable asset, are expected to be consumed by the Council.
Value in Use The present value of future cash flows expected to be derived from an asset or cash generating unit. It is deemed to be depreciated replacement cost (DRC) for those assets whose future economic benefits are not primarily dependent on the asset's ability to generate net cash inflows, where the entity would, if deprived of the asset, replace its remaining future economic benefits.
Source: IPWEA, 2009, Glossary
Additional and modified glossary items shown *

- 50 -
CITY OF PLAYFORD – ICT SERVICES - ASSET MANAGEMENT PLAN (Endorsed by Council – 23/06/15)