Embed Size (px)
Citation preview


i
Since January 1, 1987, medical facilities in Wisconsin have been required to report selected information on patients who obtained induced abortions. Wisconsin Stat. § 69.186 also mandates the Department of Health Services to publish an annual demographic summary of the information reported. A copy of the statute can be found in the Appendix. The Department of Health Services (DHS) produced this publication, which was prepared in the Office of Health Informatics, Division of Public Health (DPH). This annual report, Reported Induced Abortions in Wisconsin, was formerly titled Reported Induced Terminations of Pregnancy in Wisconsin. The name was changed to reflect the language in the statute. This report was compiled by Erica Garcia-Lago and edited by Monica Palese in the Health Analytics Section of the Office of Health Informatics, Health Analytics Unit Supervisor Laurie Taylor and Health Analytics Section Chief Milda Aksamitauskas supervised report preparation. Oskar Anderson, Director of the Office of Health Informatics, provided overall direction. This publication is available on the DHS website, at https://www.dhs.wisconsin.gov/stats/itop.htm. For further information about these tables, please contact:
Erica Garcia-Lago Office of Health Informatics Division of Public Health 1 W. Wilson Street Madison, WI 53701 Telephone: 608-267-1742 Email: [email protected]
Foreword

Foreword ....................................................................................................................................................................................i
Introduction .............................................................................................................................................................................. 1
Key Findings .............................................................................................................................................................................. 2
Statewide Historical Data, 1977-2017
Table 1. Number, Ratio, and Rate of Reported Induced Abortions that Occurred in Wisconsin, 1977-2017 ............ 4
Summary Distributions
Table 2. Reported Induced Abortions that Occurred in Wisconsin, by State of Residence, 2017 .............................. 6
Table 3. Reported Induced Abortions by Age, Wisconsin 2017 ..................................................................................... 6
Table 4. Reported Induced Abortions Among Minors (Age Less Than 18 Years) by Legal Status of Patient,
Wisconsin Residents, 2017 ................................................................................................................................... 7
Table 5. Reported Induced Abortions by Marital Status, Wisconsin 2017 ........................................................................ 8
Table 6. Reported Induced Abortions by Race and Hispanic Origin, Wisconsin 2017 ....................................................... 8
Table 7. Reported Induced Abortions by Education, Wisconsin 2017 ............................................................................... 9
Table 8. Reported Induced Abortions by Estimated Gestation, Wisconsin 2017 .............................................................. 9
Table 9. Reported Induced Abortions by Reported Complications, Wisconsin 2017 ...................................................... 10
Table 10. Reported Induced Abortions by Type of Procedure, Wisconsin Residents, 2017 ............................................ 10
Demographic Characteristics of Patients
Table 11. Reported Induced Abortions by Age, Race, and Hispanic Origin, Wisconsin Residents, 2017 ......................... 11
Table 12. Reported Induced Abortions by Age and Marital Status, Wisconsin Residents, 2017 ..................................... 12
Table 13. Reported Induced Abortions by Education, Race, and Hispanic Origin, Wisconsin Residents, 2017 ............... 12
Table 14. Reported Induced Abortions by Marital Status, Race, and Hispanic Origin, Wisconsin Residents, 2017 ........ 13
Estimated Gestation and Patient Age
Table 15. Reported Induced Abortions by Estimated Gestation and Age, Wisconsin Residents, 2017 ........................... 14
County of Residence and Patient Age
Table 16. Reported Induced Abortions by Selected County of Residence and Age, Wisconsin Residents, 2017 ............ 15
Trend Information, 2013-2017
Table 17. Number and Rate of Reported Induced Abortions by Age, Wisconsin Residents, 2013-17............................. 16
Table 18. Number and Rate of Reported Induced Abortions by County of Residence, Wisconsin Residents, 2013-17 .. 17
Three-Year Annual Averages, 2015-2017
Table 19. Three-Year Annual Average Number of Reported Induced Abortions by County of Residence,
Wisconsin Residents, 2015-2017 ...................................................................................................................... 19
Table 20. Three-Year Annual Average Number of Reported Induced Abortions by Selected County of Residence
by Age, Wisconsin Residents, 2015-2017 ........................................................................................................ 20
Table 21. Three-Year Annual Average Number of Reported Induced Abortions by Selected County of Residence
by Age and Selected Racial Categories, Wisconsin Residents, 2015-2017 ...................................................... 21
Table 22. Three-Year Annual Average Number of Reported Induced Abortions by Selected County of Residence
by Age and Hispanic Origin, Wisconsin Residents, 2015-2017 ........................................................................ 22
Table 23. Three-Year Annual Average Number of Reported Induced Abortions by Selected County of Residence
by Race and Hispanic Origin, Wisconsin Residents, 2015-2017 ...................................................................... 23
Appendix
Induced Abortion Reporting (Wis. Stat. § 69.186) .................................................................................................................. 24
Contents

1
Reported Induced Abortions in Wisconsin, 2017 presents summary tables of information collected through the Wisconsin Induced Abortion Reporting System. The Induced Abortion Report form collects only statutorily required information. Each facility that receives a supply of reporting forms is given a code number by which it is identified on the forms. That facility code and the patient number are used solely for data collection purposes, as stipulated in Wis. Stat. § 69.186. The original reporting forms are destroyed after the data set is complete. The facility code is used for purposes of information accuracy only and is deleted from the data set after editing (the patient number is never entered). These practices are required to ensure the anonymity of the patient who receives an induced abortion; the health care provider who performs an induced abortion; and the hospital, clinic, or other facility in which an abortion is performed. The tables in this publication summarize data for calendar year 2017, trend information for the years 2013-2017, and three-year annual average information by county. The tables categorize and cross-classify reported induced abortions by patient characteristics that include age, educational attainment, marital status, race and ethnicity, and state and county of residence; by an estimate of gestational age; and by reported complications. The data are based on reports of induced abortions performed in Wisconsin both for residents and nonresidents. Data Limitations and Caveats. The accuracy of the data presented in these tables is affected by a number of factors. State and county of residence, race, ethnicity, and marital status are self-defined and reported by patients, which can affect accuracy of the characteristics measured. The educational attainment measure is defined in the reporting form as the highest grade completed. However, some patients may overlook the definition and give the highest grade attended. A major limitation is the unknown number of induced abortions obtained by Wisconsin residents in other states. This report includes only those reported induced abortions that occurred in Wisconsin and cannot provide information on all Wisconsin residents who sought and obtained abortions. Assessing the incidence of complications is somewhat problematic. Facilities are asked to complete the reporting form during the visit in which the procedure is performed. However, some complications do not occur immediately or become apparent while the patient is in post-procedure recovery. A few providers, particularly hospitals, complete the report form at a later date using medical records. These reports are more likely to reflect later complications, and also are more likely to be for second-trimester procedures, for which there are higher risks.
Introduction

2
The number of induced abortions reported for Wisconsin residents in 2017 was 5,640, an increase of three percent over the 5,472 induced abortions reported in 2016.
The total number of induced abortions reported as occurring in Wisconsin in 2017 was 5,818, close to a 3.7 percent increase over the 5,612 induced abortions reported in 2016 (see Table 1).
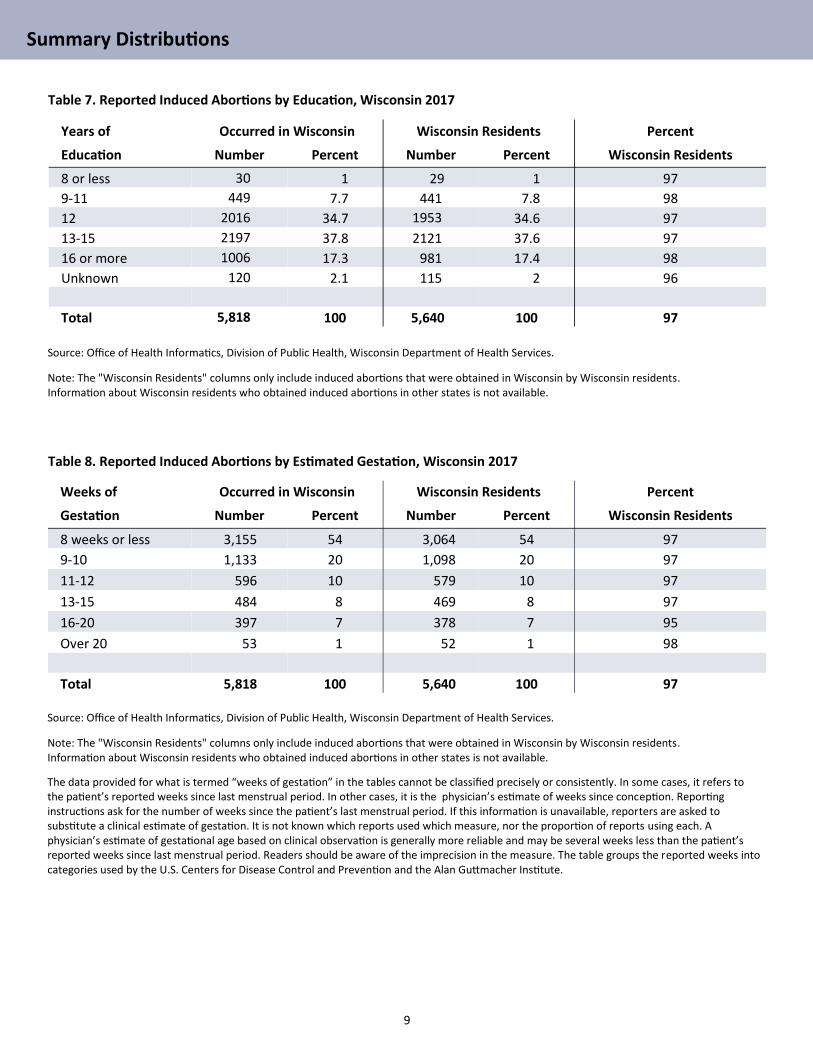
The estimated 2017 Wisconsin resident induced abortion rate was 5.2 per 1,000 women ages 15-44, compared to 5.2 in 2016. According to the U.S. Centers for Disease Control and Prevention, the national rate was 12.1 per 1,000 women ages 15-44 in 2014 (this is the most recent year for which national data are available1).
The estimated Wisconsin resident induced abortion ratio is the number of reported induced abortions per 100 live births. This ratio was 9.4 per 100 live births in Wisconsin in 2017, compared to 9.1 in 2016. The most recent national ratio was 18.6 per 100 live births in 2014.1, 2
Women in the age group 20-24 accounted for the largest proportion (30%) of reported induced abortions for Wisconsin residents in 2017. Thirteen percent of reported induced abortions were for women 35 years of age or older. Those aged 18-19 obtained 6 percent of the reported induced abortions, and those aged 15-17 obtained 3 percent (see Table 3).
In 2017, there were 189 induced abortions reported for Wisconsin residents who were minors (less than 18 years of age). Written consent (by a parent, guardian, legal custodian, or adult family member) was provided in 176 of the cases; the patient was an emancipated minor in four cases; and a court granted a petition to waive the parental consent requirement in nine cases (see Table 4).
By law, the adult consent requirement for a minor’s induced abortion is waived if the pregnancy was the result of sexual assault, if the procedure was a medical emergency, or if the pregnancy was the result of sexual intercourse with a caregiver. There were no such waivers reported in 2017.
Key Findings
1 Centers for Disease Control and Prevention. Abortion surveillance—United States, 2014. Surveillance Summaries, November 24, 2017, 66(24);1–48, MMWR.
2 Calculation of estimated ratio and rate of Wisconsin resident induced abortions required the number of induced abortions by Wisconsin residents reported to both Wisconsin and Minnesota. The 2017 ratio and rate estimates can be obtained using the Wisconsin reported induced abortions by Wisconsin residents (5,640) plus 635 reported in Minnesota in 2017, divided by the number of Wisconsin resident live births for 2016 (66,593), and by the estimated population of females aged 15 to 44 in Wisconsin in 2016 (1,080,890). Based on these figures, the estimated Wisconsin resident abortion ratio in 2017 was nine reported induced abortions per 100 live births. The 2017 estimated resident abortion rate calculated using these figures was six reported induced abortions per 1,000 women aged 15-44.

3
Eighty percent of reported induced abortions for Wisconsin residents were obtained by women who had never been married; 14 percent were obtained by currently married women; 5 percent were obtained by women who were divorced; less than 1 percent were obtained by women who were widowed; and 2 percent were obtained by women whose marital status was unknown (see Table 5).
Fifty-three percent of induced abortions reported for Wisconsin residents were obtained by white women, 29 percent by black women, 1 percent by American Indian women, 5 percent by Asian/Pacific Islander women, and 13 percent by women of other or unknown race. Ten percent of induced abortions were obtained by Hispanic women (of any race), while 88 percent were obtained by non-Hispanic women (see Table 6).
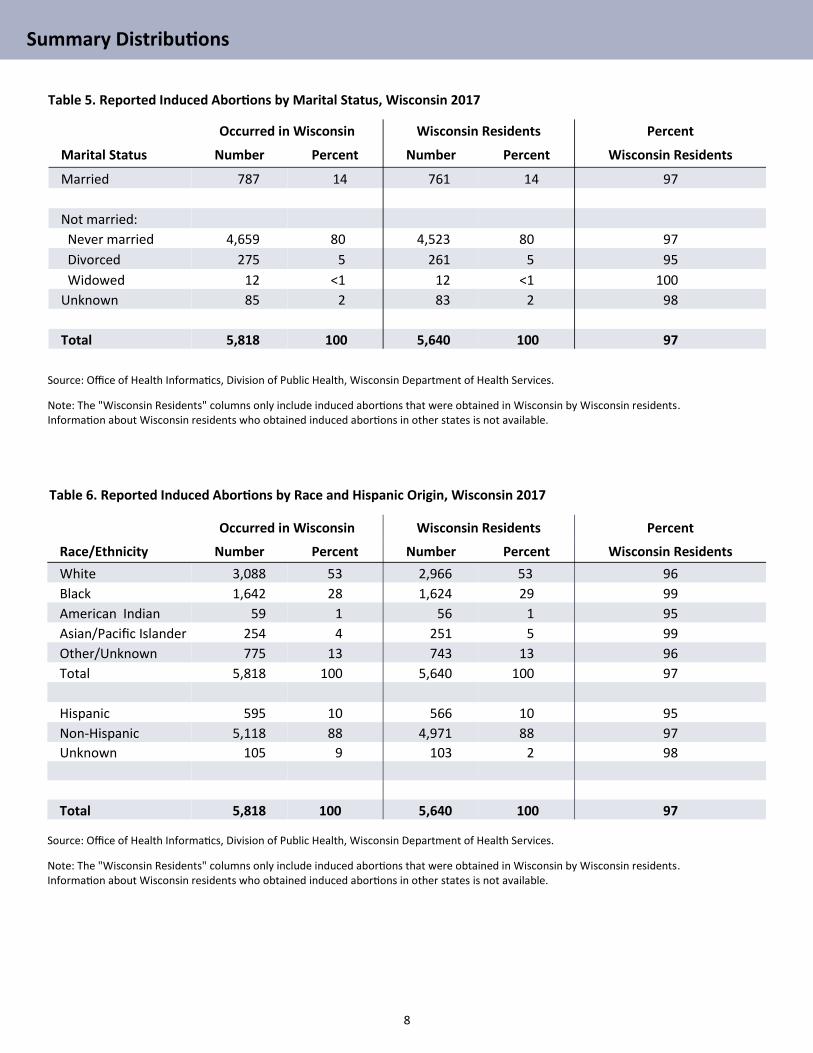
Fifty-four percent of reported induced abortions among Wisconsin residents in 2017 were obtained within the first eight weeks of gestation (see Table 8).
Of the 5,640 reported induced abortions among Wisconsin residents in 2017, 79 percent were surgical, 21 percent were chemically induced, and 0.1 percent were intrauterine instillation procedures. In 2016, these proportions were 78 percent, 22 percent, and 0.2 percent, respectively (see Table 10).
Key Findings

4
Statewide Historical Data, 1977-2017
Year Number Ratio** Rate***
Annual Facility Survey*
1977 16,133 24 16
1978 17,764 26 17
1979 20,035 28 18
1980 21,754 29 20
1981 20,819 28 19
1982 19,412 26 18
1983 18,866 26 17
1984 18,836 26 17
1985 17,309 24 15
1986 17,454 24 15
Table 1. Number, Ratio, and Rate of Reported Induced Abortions that Occurred in Wisconsin, 1977-2017
Source: Office of Health Informatics, Division of Public Health, Wisconsin Department of Health Services.
The source for the pre-1987 numbers reported in this table is Maternal and Child Health Statistics, Wisconsin, 1986.
* Note: The reporting of induced abortions on a case basis began in Wisconsin on January 1, 1987. Before that date, an annual survey was
conducted of medical facilities and provided only the total number of reported induced abortions in the state.
** The ratio is the number of reported induced abortions occurring in Wisconsin per 100 Wisconsin live births.
(The 2017 ratio is based on the number of live births in 2016.)
*** The rate is the number of reported induced abortions occurring in Wisconsin per 1,000 Wisconsin women aged 15-44.
(The 2017 rate is based on population estimates for July 1, 2016.)
(continued on page 5)

5
Statewide Historical Data, 1977-2017
Table 1. Number, Ratio, and Rate of Reported Induced Abortions that Occurred in Wisconsin, 1977-2017 (cont.)
Year Number Ratio** Rate***
Case-Based Continuous Reporting System*
1987 17,318 24 16
1988 17,986 25 16
1989 17,575 25 16
1990 16,848 23 15
1991 16,237 23 14
1992 15,549 22 14
1993 14,671 21 13
1994 13,396 20 12
1995 12,782 19 11
1996 13,673 20 12
1997 13,218 20 11
1998 11,681 18 10
1999 11,013 16 9
2000 11,040 16 10
2001 10,925 16 9
2002 10,489 15 9
2003 10,557 16 9
2004 9,943 14 9
2005 9,817 14 8
2006 9,580 14 8
2007 8,267 11 7
2008 8,229 11 7
2009 8,542 12 8
2010 7,825 11 7
2011 7,249 11 7
2012 6,927 10 6
2013 6,462 10 6
2014 5,800 9 5
2015 5,660 8 5
2016 5,612 8 5
2017 5,818 9 5
Source: Office of Health Informatics, Division of Public Health, Wisconsin Department of Health Services.
The source for the pre-1987 numbers reported in this table is Maternal and Child Health Statistics, Wisconsin, 1986.
* Note: The reporting of induced abortions on a case basis began in Wisconsin on January 1, 1987. Before that date, an annual survey was
conducted of medical facilities and provided only the total number of reported induced abortions in the state.
** The ratio is the number of reported induced abortions occurring in Wisconsin per 100 Wisconsin live births.
(The 2017 ratio is based on the number of live births in 2016.)
*** The rate is the number of reported induced abortions occurring in Wisconsin per 1,000 Wisconsin women aged 15-44.
(The 2017 rate is based on population estimates for July 1, 2016.)

6
Summary Distributions
State of Residence Number Percent
Wisconsin 5,640 97
Illinois 116 2
Michigan 22 <1
Iowa 11 <1
Minnesota 5 <1
Other State 24 <1
Other Country 0 0
Total 5,818 100
Occurred in Wisconsin Wisconsin Residents Resident Age-Specific
Age Number Percent Number Percent Rate per 1,000*
<15 17 0.3 17 0.3
15-17 176 3.0 171 3.0 (<18) 1.5
18-19 382 6.6 361 6.4 4.7
20-24 1,745 30.0 1,684 29.9 8.2
25-29 1,685 29.0 1,649 29.2 9.1
30-34 1,039 17.9 1,008 17.9 5.4
35-39 583 10 565 10 3.2
40-44 175 3 171 3 (40+) 1.0
45+ 16 0.3 14 0.2
Total (15-44) 5,818 100 5,640 100 100 5.0
Table 2. Reported Induced Abortions that Occurred in Wisconsin, by State of Residence, 2017
Source: Office of Health Informatics, Division of Public Health, Wisconsin Department of Health Services.
Table 3. Reported Induced Abortions by Age, Wisconsin 2017
Source: Office of Health Informatics, Division of Public Health, Wisconsin Department of Health Services.
Note: The “Wisconsin Residents” columns only include induced abortions obtained in Wisconsin by Wisconsin residents.
Information about Wisconsin residents who obtained induced abortions in other states is not available.
* Total rate is the number of reported induced abortions per 1,000 Wisconsin women aged 15-44 (based on July 1, 2016, population counts);
age-specific rates are the number per 1,000 women in each age group. The rate among females less than 18 years of age was calculated using
the female population aged 15-17; the rate among females aged 40 and older was calculated using the female population aged 40-44.

7
Summary Distributions
Legal Status Number
A. If the patient is less than 18 years old, indicate the circumstances of the patient.
1. Patient is an emancipated minor. 4
2. A court granted a petition to waive the parental consent. 9
3. Consent was provided by an adult on behalf of the patient (go to B). 176
4. None of the above apply (go to C). 0
Total <18 189
B. Specify the status of the adult providing written consent for the patient’s abortion.
1. Parent 146
2. Guardian or legal custodian 1
3. Adult family member 28
4. Foster parent or treatment foster parent 1
Total <18 for whom adult provided consent 176
C. Specify the reason that consent was not legally required in this case.
1. A medical emergency exists that requires an immediate abortion. 0
2. The minor provided a written statement that the pregnancy was the result of a sexual assault; the assault was reported as required by law.
0
3. A psychiatrist or licensed psychologist provided a written statement that the minor is likely to commit suicide rather than file a petition or approach a person empowered to give consent.
0
4. The minor provided a written statement that the pregnancy is the result of sexual intercourse with a caregiver; this was reported as required by law.
0
5. The minor provided a written statement that she has been abused by a person empowered to give consent; this was reported as required by law.
0
Table 4. Reported Induced Abortions Among Minors (Age Less Than 18 Years) by Legal Status of Patient,
Wisconsin Residents, 2017
Source: Office of Health Informatics, Division of Public Health, Wisconsin Department of Health Services.
Note: This table only includes induced abortions that were obtained in Wisconsin by Wisconsin residents.
Information about Wisconsin residents who obtained induced abortions in other states is not available.
8
Summary Distributions
Occurred in Wisconsin Wisconsin Residents Percent
Marital Status Number Percent Number Percent Wisconsin Residents
Married 787 14 761 14 97
Not married:
Never married 4,659 80 4,523 80 97
Divorced 275 5 261 5 95
Widowed 12 <1 12 <1 100
Unknown 85 2 83 2 98
Total 5,818 100 5,640 100 97
Occurred in Wisconsin Wisconsin Residents Percent
Race/Ethnicity Number Percent Number Percent Wisconsin Residents
White 3,088 53 2,966 53 96
Black 1,642 28 1,624 29 99
American Indian 59 1 56 1 95
Asian/Pacific Islander 254 4 251 5 99
Other/Unknown 775 13 743 13 96
Total 5,818 100 5,640 100 97
Hispanic 595 10 566 10 95
Non-Hispanic 5,118 88 4,971 88 97
Unknown 105 9 103 2 98
Total 5,818 100 5,640 100 97
Table 5. Reported Induced Abortions by Marital Status, Wisconsin 2017
Source: Office of Health Informatics, Division of Public Health, Wisconsin Department of Health Services.
Note: The "Wisconsin Residents" columns only include induced abortions that were obtained in Wisconsin by Wisconsin residents. Information about Wisconsin residents who obtained induced abortions in other states is not available.
Table 6. Reported Induced Abortions by Race and Hispanic Origin, Wisconsin 2017
Source: Office of Health Informatics, Division of Public Health, Wisconsin Department of Health Services.
Note: The "Wisconsin Residents" columns only include induced abortions that were obtained in Wisconsin by Wisconsin residents. Information about Wisconsin residents who obtained induced abortions in other states is not available.
9
Summary Distributions
Years of Occurred in Wisconsin Wisconsin Residents Percent
Education Number Percent Number Percent Wisconsin Residents
8 or less 30 1 29 1 97
9-11 449 7.7 441 7.8 98
12 2016 34.7 1953 34.6 97
13-15 2197 37.8 2121 37.6 97
16 or more 1006 17.3 981 17.4 98
Unknown 120 2.1 115 2 96
Total 5,818 100 5,640 100 97
Weeks of Occurred in Wisconsin Wisconsin Residents Percent
Gestation Number Percent Number Percent Wisconsin Residents
8 weeks or less 3,155 54 3,064 54 97
9-10 1,133 20 1,098 20 97
11-12 596 10 579 10 97
13-15 484 8 469 8 97
16-20 397 7 378 7 95
Over 20 53 1 52 1 98
Total 5,818 100 5,640 100 97
Source: Office of Health Informatics, Division of Public Health, Wisconsin Department of Health Services.
Note: The "Wisconsin Residents" columns only include induced abortions that were obtained in Wisconsin by Wisconsin residents. Information about Wisconsin residents who obtained induced abortions in other states is not available.
Table 7. Reported Induced Abortions by Education, Wisconsin 2017
Table 8. Reported Induced Abortions by Estimated Gestation, Wisconsin 2017
Source: Office of Health Informatics, Division of Public Health, Wisconsin Department of Health Services.
Note: The "Wisconsin Residents" columns only include induced abortions that were obtained in Wisconsin by Wisconsin residents. Information about Wisconsin residents who obtained induced abortions in other states is not available.
The data provided for what is termed “weeks of gestation” in the tables cannot be classified precisely or consistently. In some cases, it refers to the patient’s reported weeks since last menstrual period. In other cases, it is the physician’s estimate of weeks since conception. Reporting instructions ask for the number of weeks since the patient’s last menstrual period. If this information is unavailable, reporters are asked to substitute a clinical estimate of gestation. It is not known which reports used which measure, nor the proportion of reports using each. A physician’s estimate of gestational age based on clinical observation is generally more reliable and may be several weeks less than the patient’s reported weeks since last menstrual period. Readers should be aware of the imprecision in the measure. The table groups the reported weeks into categories used by the U.S. Centers for Disease Control and Prevention and the Alan Guttmacher Institute.

10
Summary Distributions
Complications Occurred in Wisconsin Wisconsin Residents
None 5,380 5,221
Hemorrhage 2 2
Infection 1 1
Uterine Perforation 2 2
Cervical Laceration 0 0
Retained Products 45 42
Other 388 372
Total Reported Induced Abortions 5,818 5,640
Type of Procedure Number Percent
Chemically Induced (any nonsurgical procedure including oral, injected, and vaginally inserted chemicals)
1,200 21
Surgical 4,437 79
Intrauterine Instillation (intra-amniotic injection, typically with saline, prostaglandin, or urea)
3 <1
Total 5,640 100
Table 9. Reported Induced Abortions by Reported Complications, Wisconsin 2017
Source: Office of Health Informatics, Division of Public Health, Wisconsin Department of Health Services.
Note: The "Wisconsin Residents" columns only include induced abortions that were obtained in Wisconsin by Wisconsin residents. Information about Wisconsin residents who obtained induced abortions in other states is not available.
Assessing the incidence of complications is somewhat problematic. Facilities are asked to complete the reporting form during the visit in which the procedure is performed. However, some complications do not occur immediately or become apparent while the patient is in post-procedure recovery. A few providers, particularly hospitals, complete the report form at a later date using medical records. These reports are more likely to reflect later complications and they also are more likely to be for second-trimester procedures, for which there are higher risks.
Each induced abortion could have more than one type of complication reported. Reporting instructions ask providers to report “any and all complications that are identified which are a result of the procedure and which occurred during the visit in which the procedure was performed. For chemically induced abortions, wait until the procedure is completed to answer this question.”
Table 10. Reported Induced Abortions by Type of Procedure, Wisconsin Residents, 2017
Source: Office of Health Informatics, Division of Public Health, Wisconsin Department of Health Services.
Note: This table only includes induced abortions that were obtained in Wisconsin by Wisconsin residents. Information about Wisconsin residents who obtained induced abortions in other states is not available.

11
Demographic Characteristics of Patients
Race Ethnicity
White Black/African
American American Indian/
Alaska Native Asian/Pacific
Islander Other/
Unknown Total
Hispanic (Any Race)
Age Num Pct Num Pct Num Pct Num Pct Num Pct Num Pct Num Pct
<15 5 <1 6 <1 <5 2 <5 <1 <5 <1 17 <1 <5 <1
15-17 83 3 59 4 <5 2 <5 1 26 4 171 3 22 4
15 16 9 0 0 11 36 9
16 30 18 0 <5 9 59 9
17 37 32 <5 0 6 76 <5
18-19 188 6 107 7 <5 4 8 3 56 8 361 6 47 8
18 61 43 <5 6 22 134 19
19 127 64 0 <5 34 227 28
20-24 904 31 480 30 16 29 48 19 236 32 1684 30 193 34
20 172 76 <5 5 55 312 48
21 160 82 6 11 46 305 38
22-24 572 322 6 32 135 1,067 107
25-29 800 27 566 35 22 39 63 25 198 27 1,649 29 146 26
30-34 539 18 251 16 7 13 71 28 140 19 1,008 18 100 18
35-39 335 11 112 8 <5 7 42 17 62 8 565 10 39 7
40+ 112 4 33 2 <5 5 16 6 21 3 185 3 15 3
Total 2,966 100 1,624 100 56 100 251 100 743 100 5,640 100 566 100
Table 11. Reported Induced Abortions by Age, Race, and Hispanic Origin, Wisconsin Residents, 2017
Source: Office of Health Informatics, Division of Public Health, Wisconsin Department of Health Services.
Note: This table only includes induced abortions that were obtained in Wisconsin by Wisconsin residents. Information about Wisconsin residents who obtained induced abortions in other states is not available.
A “<5” indicates there were fewer than five reports.

12
Demographic Characteristics of Patients
Marital Status
Married Never Married Divorced Widowed Unknown Total
Age Num Pct Num Pct Num Pct Num Pct Num Pct Num Pct
<15 0 0 17 <1 0 0 0 0 0 0 17 <1
15-17 0 0 170 4 0 0 0 0 <5 1 171 3
18-19 <5 <5 357 8 0 0 0 0 <5 4 383 6
20-24 59 8 1,576 35 26 10 0 0 23 30 1,684 30
25-29 189 25 1,391 31 45 17 <5 8 23 30 1,649 29
30-34 261 34 643 14 77 30 5 42 22 27 1,008 18
35-39 185 24 291 6 76 29 <5 33 9 11 565 10
40+ 66 9 78 2 37 14 <5 17 <5 2 185 3
Total (15-44)
761 100 4,523 100 261 100 12 100 83 100 5,640 100
Ethnicity Race
Years of
White Black/African
American American Indian/
Alaska Native Asian/Pacific
Islander Other/
Unknown Total
Hispanic (Any Race)
Education Num Pct Num Pct Num Pct Num Pct Num Pct Num Pct Num Pct
8 or less 6 <1 6 <1 0 0 <5 <1 16 2 29 <1 15 3
9-11 174 6 163 10 7 13 12 5 85 11 441 8 68 12
12 931 31 653 40 21 38 44 18 304 41 1,953 35 250 44
13-15 1,178 40 631 39 22 39 66 26 224 30 2,121 38 166 30
16+ 648 22 139 9 5 9 118 47 71 10 981 17 45 8
Unknown 29 1 32 2 <5 2 10 4 43 6 115 2 22 4
Total 2,966 100 1,624 100 56 100 251 100 743 100 5,640 100 566 100
Table 12. Reported Induced Abortions by Age and Marital Status, Wisconsin Residents, 2017
Source: Office of Health Informatics, Division of Public Health, Wisconsin Department of Health Services.
Note: This table only includes induced abortions that were obtained in Wisconsin by Wisconsin residents. Information about Wisconsin residents who obtained induced abortions in other states is not available. A “<5” indicates there were fewer than five reports.
Table 13. Reported Induced Abortions by Education, Race, and Hispanic Origin, Wisconsin Residents, 2017
Source: Office of Health Informatics, Division of Public Health, Wisconsin Department of Health Services.
Note: This table only includes induced abortions that were obtained in Wisconsin by Wisconsin residents. Information about Wisconsin residents who obtained induced abortions in other states is not available.

13
Demographic Characteristics of Patients
Race Ethnicity
Marital
White Black/African
American American Indian/
Alaska Native Asian/Pacific
Islander Other/
Unknown Total
Hispanic (Any Race)
Status Num Pct Num Pct Num Pct Num Pct Num Pct Num Pct Num Pct
Married 449 15 70 4 6 11 122 49 114 15 761 14 76 13
Not married:
Never married 2,291 77 1,490 92 46 82 118 47 578 78 4,523 80 460 81
Divorced 194 7 32 2 <5 7 5 2 26 4 261 5 20 4
Widowed 8 <1 <5 <1 0 0 0 0 <5 <1 12 <1 0 0
Unknown 24 <1 29 2 0 0 6 2 24 3 83 2 10 2
Total 2,966 100 1,642 100 56 100 251 100 743 100 5,640 100 566 100
Table 14. Reported Induced Abortions by Marital Status, Race, and Hispanic Origin, Wisconsin Residents, 2017
Source: Office of Health Informatics, Division of Public Health, Wisconsin Department of Health Services.
Note: This table only includes induced abortions that were obtained in Wisconsin by Wisconsin residents.
Information about Wisconsin residents who obtained induced abortions in other states is not available.
A “<5” indicates there were fewer than five reports.

14
Estimated Gestation and Patient Age
Age
Weeks of <15 15-17 18-19 20-24 25-29 30-34 35-39 40+ Total
Gestation Num Pct Num Pct Num Pct Num Pct Num Pct Num Pct Num Pct Num Pct Num Pct
8 weeks or less 6 35 74 43 184 51 874 52 885 54 578 57 341 60 122 66 3,064 54
9-10 <5 6 39 23 73 20 364 22 328 20 173 17 93 17 27 15 1,098 20
11-12 <5 12 22 13 41 11 185 11 169 10 96 10 48 9 16 9 579 10
13-15 6 35 17 10 29 8 134 8 153 9 78 8 39 7 13 7 469 8
16-20 <5 12 16 9 30 8 113 7 100 6 71 7 40 7 6 3 378 7
Over 20 0 0 <5 2 <5 1 14 <1 14 <1 12 1 <5 <1 <5 <1 52 <1
Total 17 100 171 100 361 100 1,684 100 1,649 100 1,008 100 565 100 185 100 5,640 100
Source: Office of Health Informatics, Division of Public Health, Wisconsin Department of Health Services.
Note: The "Wisconsin Residents" columns only include induced abortions that were obtained in Wisconsin by Wisconsin residents. Information about Wisconsin residents who obtained induced abortions in other states is not available. A “<5” indicates there were fewer than five reports.
The data provided for what is termed “weeks of gestation” in the tables cannot be classified precisely or consistently. In some cases, it refers to the patient’s reported weeks since last menstrual period. In other cases, it is the physician’s estimate of weeks since conception. Reporting instructions ask for the number of weeks since patient’s last menstrual period. If this information is unavailable, reporters are asked to substitute a clinical estimate of gestation. It is not known which reports used which measure, nor the proportion of reports using each. A physician’s estimate of gestational age based on clinical observation is generally more reliable and may be several weeks less than the patient’s reported weeks since last menstrual period. Readers should be aware of the imprecision in the measure. The table groups the reported weeks into categories used by the U.S. Centers for Disease Control and Prevention and the Alan Guttmacher Institute.
Table 15. Reported Induced Abortions by Estimated Gestation and Age, Wisconsin Residents, 2017

15
County of Residence and Patient Age
Age
County <20 20-24 25-34 35+ Total
Brown 22 44 79 23 168
Columbia 5 23 29 6 63
Dane 86 261 392 121 860
Dodge 6 22 26 7 61
Fond du Lac 5 28 31 10 74
Jefferson 6 14 21 12 53
Kenosha 17 48 64 20 149
La Crosse 5 19 21 8 53
Milwaukee 206 663 1,186 292 2,347
Outagamie 18 42 57 19 136
Portage 6 21 16 5 48
Racine 19 57 77 23 176
Rock 14 53 67 22 156
Sauk 7 14 19 10 50
Sheboygan 7 23 43 8 81
Walworth 9 29 27 12 77
Washington 5 26 34 14 79
Waukesha 17 85 130 51 283
Winnebago 12 43 55 13 123
Wood 7 15 30 7 59
Other Counties 70 154 253 67 544
Total 549 1,684 2,657 750 5,640
Source: Office of Health Informatics, Division of Public Health, Wisconsin Department of Health Services.
Note: This table only includes induced abortions that were obtained in Wisconsin by Wisconsin residents. Information about Wisconsin residents who obtained induced abortions in other states is not available; therefore, the counts underestimate frequencies for some counties.
Only counties that had at least five reports for each age group are shown in this table.
Table 16. Reported Induced Abortions by Selected County of Residence and Age, Wisconsin Residents, 2017
16
Trend Information, 2013-2017
2013 2014 2015 2016 2017
Age Number Rate* Number Rate* Number Rate* Number Rate* Number Rate*
<18 215 1.9 196 1.8 214 1.9 193 1.7 188 1.6
18-19 507 6.5 461 5.9 422 5.4 383 5.1 361 4.7
20-24 2,117 11.1 1,892 9.7 1,813 9.3 1,640 8.2 1,684 8.2
25-29 1,656 9.2 1,473 8.4 1,403 8.0 1,525 8.8 1,649 9.1
30-34 967 5.4 902 4.9 955 5.2 985 5.4 1,008 5.4
35-39 580 3.6 515 3.1 482 2.9 559 3.3 565 3.2
40+ 209 1.1 201 1.1 172 1.0 187 1.1 185 1.1
Total (15-44) 6,251 5.8 5,640 5.2 5,461 5.0 5,472 5.0 5,640 5.0
Table 17. Number and Rate of Reported Induced Abortions by Age, Wisconsin Residents, 2013-2017
Source: Office of Health Informatics, Division of Public Health, Wisconsin Department of Health Services.
Note: This table only includes induced abortions that were obtained in Wisconsin by Wisconsin residents. Information about Wisconsin residents who obtained induced abortions in other states is not available.
* The total rate is the number of reported induced abortions per 1,000 women aged 15-44; age-specific rates are the number per 1,000 women in each age group. The rate among females less than 18 years of age was calculated using the female population aged 15-17; the rate among females aged 40 and older was calculated using the female population aged 40-44.
17
Trend Information, 2013-2017
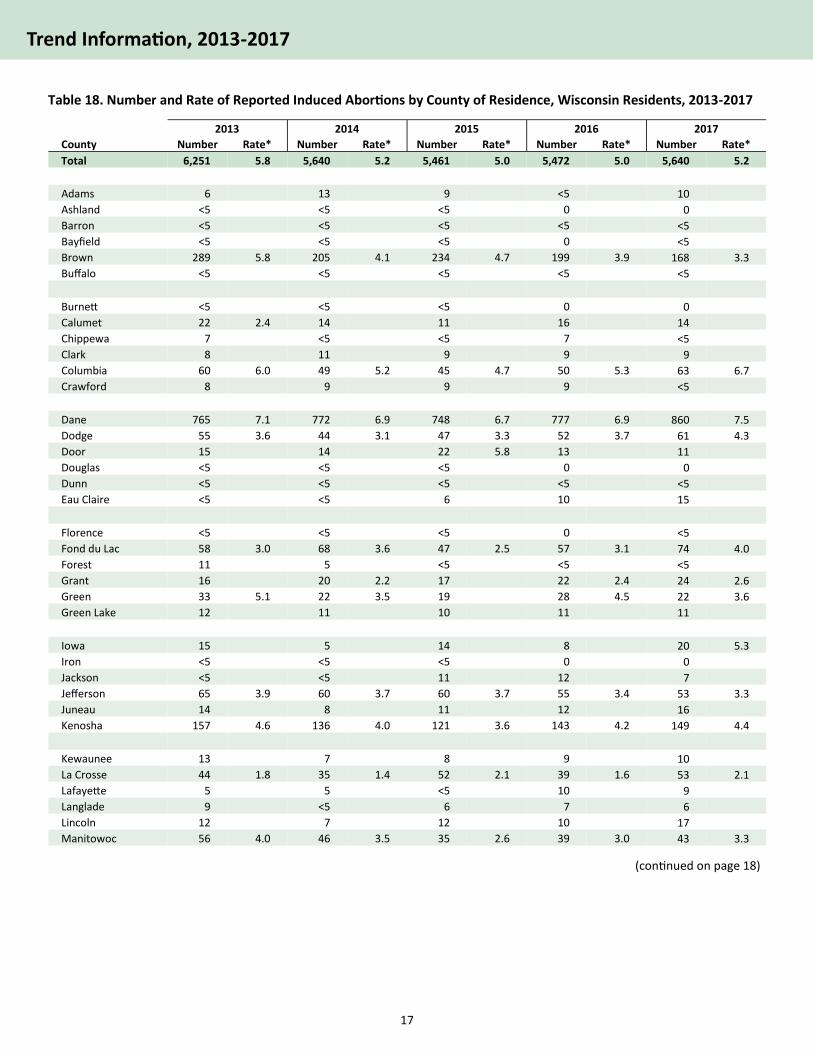
Table 18. Number and Rate of Reported Induced Abortions by County of Residence, Wisconsin Residents, 2013-2017
(continued on page 18)
2013 2014 2015 2016 2017
County Number Rate* Number Rate* Number Rate* Number Rate* Number Rate*
Total 6,251 5.8 5,640 5.2 5,461 5.0 5,472 5.0 5,640 5.2
Adams 6 13 9 <5 10
Ashland <5 <5 <5 0 0
Barron <5 <5 <5 <5 <5
Bayfield <5 <5 <5 0 <5
Brown 289 5.8 205 4.1 234 4.7 199 3.9 168 3.3
Buffalo <5 <5 <5 <5 <5
Burnett <5 <5 <5 0 0
Calumet 22 2.4 14 11 16 14
Chippewa 7 <5 <5 7 <5
Clark 8 11 9 9 9
Columbia 60 6.0 49 5.2 45 4.7 50 5.3 63 6.7
Crawford 8 9 9 9 <5
Dane 765 7.1 772 6.9 748 6.7 777 6.9 860 7.5
Dodge 55 3.6 44 3.1 47 3.3 52 3.7 61 4.3
Door 15 14 22 5.8 13 11
Douglas <5 <5 <5 0 0
Dunn <5 <5 <5 <5 <5
Eau Claire <5 <5 6 10 15
Florence <5 <5 <5 0 <5
Fond du Lac 58 3.0 68 3.6 47 2.5 57 3.1 74 4.0
Forest 11 5 <5 <5 <5
Grant 16 20 2.2 17 22 2.4 24 2.6
Green 33 5.1 22 3.5 19 28 4.5 22 3.6
Green Lake 12 11 10 11 11
Iowa 15 5 14 8 20 5.3
Iron <5 <5 <5 0 0
Jackson <5 <5 11 12 7
Jefferson 65 3.9 60 3.7 60 3.7 55 3.4 53 3.3
Juneau 14 8 11 12 16
Kenosha 157 4.6 136 4.0 121 3.6 143 4.2 149 4.4
Kewaunee 13 7 8 9 10
La Crosse 44 1.8 35 1.4 52 2.1 39 1.6 53 2.1
Lafayette 5 5 <5 10 9
Langlade 9 <5 6 7 6
Lincoln 12 7 12 10 17
Manitowoc 56 4.0 46 3.5 35 2.6 39 3.0 43 3.3

18
Trend Information, 2013-2017
Table 18. Number and Rate of Reported Induced Abortions by County of Residence, Wisconsin Residents, 2013-2017 (cont.)
Source: Office of Health Informatics, Division of Public Health, Wisconsin Department of Health Services.
Note: This table only includes induced abortions that were obtained in Wisconsin by Wisconsin residents. Information about Wisconsin residents who obtained induced abortions in other states is not available; therefore, the counts underestimate frequencies in some counties.
* The rate is the number of induced abortions per 1,000 women aged 15-44. Wisconsin provisional population estimates for July 1, 2016, prepared by the Office of Health Informatics, were used to calculate the 2017 rates.
A “<5” indicates there were fewer than five reports for county residents. Rates based on fewer than 20 reports are omitted because they are subject to large random fluctuations.
2013 2014 2015 2016 2017
County Number Rate* Number Rate* Number Rate* Number Rate* Number Rate*
Marathon 74 3.0 86 3.6 69 2.9 72 3.0 52 2.2
Marinette 16 18 18 15 16
Marquette 14 11 5 11 17
Menominee 10 9 12 9 8
Milwaukee 2,591 13.0 2,448 11.6 2,366 11.3 2,330 11.0 2,347 11.1
Monroe 15 14 24 3.1 24 3.0 21 2.7
Oconto 17 20 3.4 15 18 14
Oneida 21 3.8 13 20 4.0 13 10
Outagamie 171 4.8 185 5.4 153 4.4 120 3.5 136 3.9
Ozaukee 83 5.6 43 3.0 64 4.4 50 3.4 40 2.8
Pepin <5 <5 <5 <5 0
Pierce <5 <5 <5 <5 0
Polk <5 <5 <5 0 <5
Portage 60 4.2 47 3.2 52 3.5 53 3.6 48 3.3
Price <5 <5 <5 <5 <5
Racine 244 6.7 197 5.5 159 4.5 205 5.7 176 5.0
Richland 6 5 6 15 12
Rock 136 4.4 137 4.5 161 5.2 160 5.2 156 5.1
Rusk <5 <5 <5 <5 0
St. Croix <5 <5 <5 <5 <5
Sauk 76 6.8 76 6.9 54 4.9 39 3.5 50 4.6
Sawyer <5 <5 <5 <5 <5
Shawano 33 4.6 28 4.1 23 3.4 14 16
Sheboygan 95 4.5 55 2.8 83 4.2 71 3.6 81 4.1
Taylor <5 5 <5 <5 <5
Trempealeau 7 <5 5 8 <5
Vernon 9 11 8 6 6
Vilas 10 7 6 8 12
Walworth 95 5.1 94 4.9 96 5.0 85 4.4 77 4.1
Washburn <5 <5 <5 <5 <5
Washington 93 3.9 72 3.2 90 3.9 92 4.0 79 3.5
Waukesha 338 4.9 215 3.2 172 2.6 238 3.5 283 4.2
Waupaca 30 3.3 36 4.4 27 3.3 29 3.6 23 2.9
Waushara 14 11 14 6 10
Winnebago 174 5.2 167 5.1 129 3.9 116 3.5 123 3.8
Wood 52 4.0 42 3.4 52 4.2 37 3.0 59 4.8
Unknown <5 <5

19
Three-Year Annual Averages, 2015-2017
Annual Average Annual Average
County Number County Number
Adams 8 Marathon 64
Ashland 0 Marinette 16
Barron <5 Marquette 11
Bayfield <5 Menominee 10
Brown 200 Milwaukee 2,348
Buffalo <5 Monroe 23
Burnett 0 Oconto 16
Calumet 14 Oneida 14
Chippewa 5 Outagamie 136
Clark 9 Ozaukee 51
Columbia 53 Pepin <5
Crawford 8 Pierce <5
Dane 795 Polk <5
Dodge 53 Portage 51
Door 15 Price <5
Douglas 0 Racine 180
Dunn <5 Richland 11
Eau Claire 10 Rock 159
Florence <5 Rusk <5
Fond du Lac 59 St. Croix <5
Forest <5 Sauk 48
Grant 21 Sawyer <5
Green 23 Shawano 18
Green Lake 11 Sheboygan 78
Iowa 14 Taylor <5
Iron 0 Trempealeau 5
Jackson 10 Vernon 7
Jefferson 56 Vilas 9
Juneau 13 Walworth 86
Kenosha 138 Washburn <5
Kewaunee 9 Washington 87
La Crosse 48 Waukesha 231
Lafayette 7 Waupaca 26
Langlade 6 Waushara 10
Lincoln 13 Winnebago 123
Manitowoc 39 Wood 49
Unknown <5
Three-Year Annual Average 5,524
Table 19. Three-Year Annual Average Number of Reported Induced Abortions by County of Residence,
Wisconsin Residents, 2015-2017
Source: Office of Health Informatics, Division of Public Health, Wisconsin Department of Health Services.
Note: This table only includes induced abortions that were obtained in Wisconsin by Wisconsin residents. Information about Wisconsin residents who obtained induced abortions in other states is not available; therefore, the counts underestimate frequencies in some counties.
A “<5” indicates there were fewer than five reports for county residents.

20
Three-Year Annual Averages, 2015-2017
Table 20. Three-Year Annual Average Number of Reported Induced Abortions by Selected County of Residence by Age,
Wisconsin Residents, 2015-2017
Source: Office of Health Informatics, Division of Public Health, Wisconsin Department of Health Services.
Note: This table only includes induced abortions that were obtained in Wisconsin by Wisconsin residents.
Information about Wisconsin residents who obtained induced abortions in other states is not available; therefore, the counts
underestimate frequencies in some counties.
Women age 25 and older were grouped into a single category for which three-year averages could be shown.
Columns may not sum to the three-year annual average totals due to rounding.
A “<5” indicates there were fewer than five reports.
Age
County <20 20-24 25+ Total
Brown 24 58 118 200
Calumet <5 <5 9 14
Columbia 5 18 29 53
Dane 77 254 464 795
Dodge 5 20 28 53
Door <5 5 8 15
Eau Claire <5 <5 <5 10
Fond du Lac 8 18 33 59
Grant <5 8 9 21
Green <5 9 12 23
Iowa <5 <5 7 14
Jackson <5 <5 5 10
Jefferson 6 13 37 56
Juneau <5 <5 7 13
Kenosha 17 44 77 138
La Crosse <5 19 25 48
Lincoln <5 5 5 13
Manitowoc <5 13 22 39
Marathon 8 17 39 64
Marinette <5 <5 10 16
Milwaukee 225 705 1,418 2,348
Three-Year Annual
Average Total 587 1,712 3,225 5,524
Age
County <20 20-24 25+ Total
Monroe <5 9 12 23
Oconto <5 6 8 16
Oneida <5 <5 8 14
Outagamie 18 44 75 136
Ozaukee 7 11 33 51
Portage 6 20 25 51
Racine 27 59 94 180
Rock 17 54 88 159
Sauk 6 16 26 48
Shawano <5 8 7 18
Sheboygan 9 23 47 78
Shawano <5 8 11 22
Sheboygan 9 20 40 70
Walworth 13 35 38 86
Washington 8 30 49 87
Waukesha 19 67 145 231
Waupaca <5 6 18 26
Waushara <5 <5 7 10
Winnebago 11 44 67 123
Wood 7 13 29 49
Other 17 37 81 135

21
Age
County <18 18-19 20-24 25+ Total
Dane 25 51 254 464 795
White 12 26 158 295 490
Black 8 12 52 73 145
Milwaukee 77 148 705 1,418 2,348
White 16 46 218 468 748
Black 48 77 376 706 1,207
Racine 11 17 59 94 180
White 7 9 33 56 105
Black <5 <5 18 23 47
Three-Year Annual
Average Total 198 389 1,713 3,225 5,525
White 103 218 969 1,834 3,125
Black 64 103 485 860 1,512
Three-Year Annual Averages, 2015-2017
Table 21. Three-Year Annual Average Number of Reported Induced Abortions by Selected County of Residence by Age
and Selected Racial Categories, Wisconsin Residents, 2015-2017
Source: Office of Health Informatics, Division of Public Health, Wisconsin Department of Health Services.
Note: This table only includes induced abortions that were obtained in Wisconsin by Wisconsin residents. Information about Wisconsin residents who obtained induced abortions in other states is not available; therefore, the counts underestimate frequencies in some counties.
Counties shown had at least five reported induced abortions in each age group during 2015-2017.
Women age 25 and older were grouped into a single category for which three-year averages could be shown.
Columns may not sum to the three-year annual average totals due to rounding.

22
Age
County <18 18-19 20-24 25+ Total
Brown 8 16 58 118 200
Non-Hispanic 7 15 48 107 176
Hispanic <5 <5 9 10 22
Unknown 0 0 0 <5 <5
Dane 25 51 254 464 795
Non-Hispanic 21 43 231 421 716
Hispanic <5 8 23 42 78
Unknown 0 0 0 <5 <5
Milwaukee 77 148 705 1,418 2,348
Non-Hispanic 63 122 613 1,240 2,038
Hispanic 13 25 86 163 288
Unknown <5 <5 5 15 23
Racine 11 17 59 94 180
Non-Hispanic 9 13 50 81 152
Hispanic <5 <5 8 13 27
Unknown 0 0 0 <5 <5
Three-Year Annual Average Total 198 389 1,713 3,225 5,525
Non-Hispanic 168 330 1,517 2,890 4,929
Hispanic 29 57 187 312 595
Unknown <5 <5 8 23 34
Three-Year Annual Averages, 2015-2017
Table 22. Three-Year Annual Average Number of Reported Induced Abortions by Selected County of Residence by Age
and Hispanic Origin, Wisconsin Residents, 2015-2017
Source: Office of Health Informatics, Division of Public Health, Wisconsin Department of Health Services.
Note: This table only includes induced abortions that were obtained in Wisconsin by Wisconsin residents. Information about Wisconsin residents who obtained induced abortions in other states is not available; therefore, the counts underestimate frequencies in some counties.
Counties shown had at least five reported induced abortions in each age group during 2015-2017.
Women age 25 and older were grouped into a single category for which three-year averages could be shown.
Columns may not sum to the three-year annual average totals due to rounding.
23
Race Ethnicity
County White
Black/African American
Asian/Pacific Islander
Total Hispanic
(Any Race)
Brown 148 12 10 200 22
Dane 490 145 73 795 78
Kenosha 91 25 <5 138 20
La Crosse 40 <5 <5 48 <5
Milwaukee 748 1,207 97 2,348 288
Outagamie 109 6 8 136 12
Racine 105 47 <5 180 27
Sheboygan 61 <5 6 78 8
Washington 78 <5 <5 87 <5
Waukesha 173 11 21 231 23
Winnebago 96 9 8 123 10
Total 3,329 1,451 269 5,525 595
Three-Year Annual Averages, 2015-2017
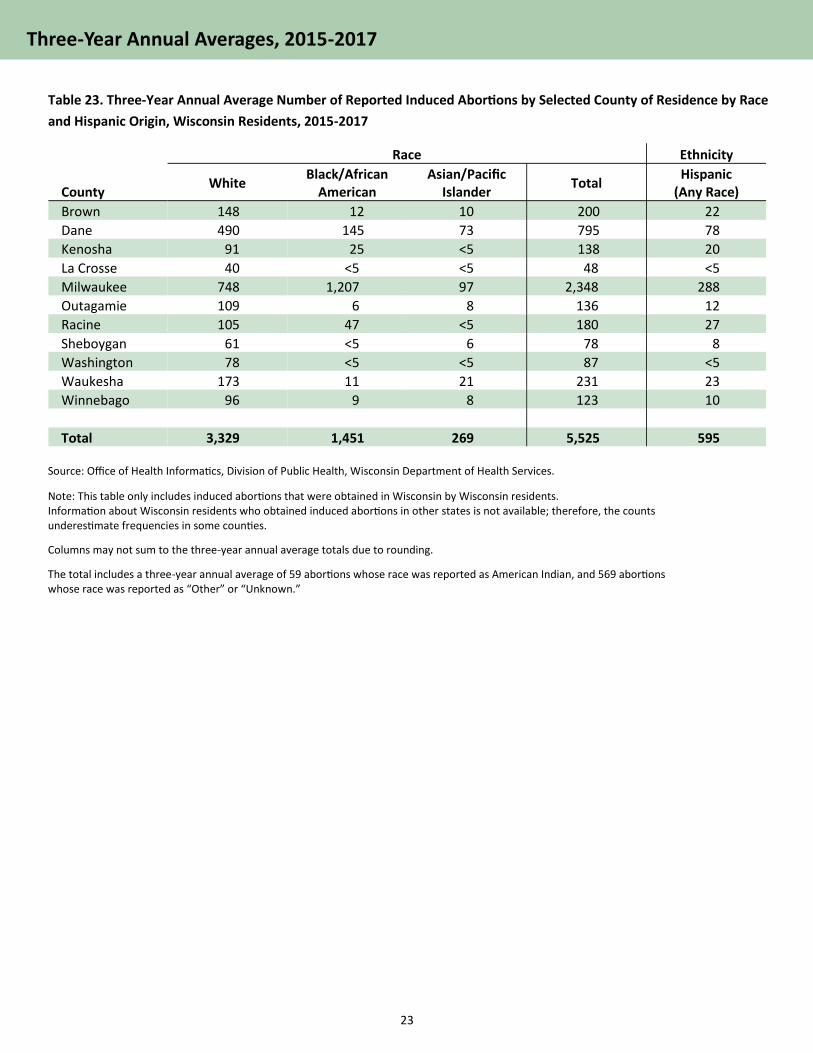
Table 23. Three-Year Annual Average Number of Reported Induced Abortions by Selected County of Residence by Race
and Hispanic Origin, Wisconsin Residents, 2015-2017
Source: Office of Health Informatics, Division of Public Health, Wisconsin Department of Health Services.
Note: This table only includes induced abortions that were obtained in Wisconsin by Wisconsin residents. Information about Wisconsin residents who obtained induced abortions in other states is not available; therefore, the counts underestimate frequencies in some counties.
Columns may not sum to the three-year annual average totals due to rounding.
The total includes a three-year annual average of 59 abortions whose race was reported as American Indian, and 569 abortions whose race was reported as “Other” or “Unknown.”

24
Appendix
Induced Abortion Reporting (Wis. Stat. § 69.186)
(1) On or before January 15 annually, each hospital, clinic or other facility in which an induced abortion is performed shall file with the department a report for each induced abortion performed in the hospital, clinic or other facility in the previous calendar year. Each report shall contain all of the following information with respect to each patient obtaining an induced abortion in the hospital, clinic or other facility:
(a) The state and, if this state, the county, of residence. (b) Patient number. (c) Race. (d) Age. (e) Marital status. (f) Month and year in which the induced abortion was performed. (g) Education. (h) The number of weeks since the patient’s last menstrual period. (hm) Whether the abortion was a chemically induced abortion, a surgical abortion or a surgical abortion following a failed or incomplete chemical abortion. (i) Complications, if any, resulting from performance of the induced abortion. (j) If the patient is a minor, whether consent was provided under s. 48.375(4) (a) 1. for the abortion and, if so, the relationship of the individual providing consent to the minor; or, if consent under s. 48.375 (4) (a) 1. was not provided, on which of the bases under s. 48.375 (4) (a) 2. or (b) 1., 1g., 1m., 2. or 3. the abortion was performed. (2) The department shall collect the information under sub. (1) in a manner which the department shall specify and which ensures the anonymity of a patient who receives an induced abortion, a health care provider who provides an induced abortion and a hospital, clinic or other facility in which an induced abortion is performed. The department shall publish annual demographic summaries of the information obtained under this section, except that the department may not disclose any information obtained under this section that reveals the identity of any patient, health care provider or hospital, clinic or other facility and shall ensure anonymity in all of the following ways:
(a) The department may use information concerning the patient number under sub. (1)(b) or concerning the identity of a specific reporting hospital, clinic or other facility for purposes of information collection only and may not reproduce or extrapolate this information for any purpose.
(b) The department shall immediately destroy all reports submitted under sub. (1) after information is extrapolated from the reports for use in publishing the annual demographic summary under this subsection.
In section 69.186, the term “induced abortion” means:
The termination of a uterine pregnancy by a physician of a woman known by the physician to be pregnant, for a purpose other than to produce a live birth or to remove a dead fetus.
Enacted October 11, 1997.
Note on Statute Revision: The Induced Abortion Reporting Statute (section 69.186, Wisconsin Statutes) was revised in 1997 to add collection of data on minor patient legal status (j) and type of abortion (hm). (1998 was the first year in which these data were collected.)

Wisconsin Department of Health Services Division of Public Health
Office of Health informatics Reported Induced Abortions in Wisconsin, 2017
P-45360-17 (12/2018)