Embed Size (px)
Citation preview
1/24/12
1
informa-on visualisa-on
Alan Dix
Lancaster University and Talis
www.hcibook.com/alan/teaching/Promise2012/
Birmingham
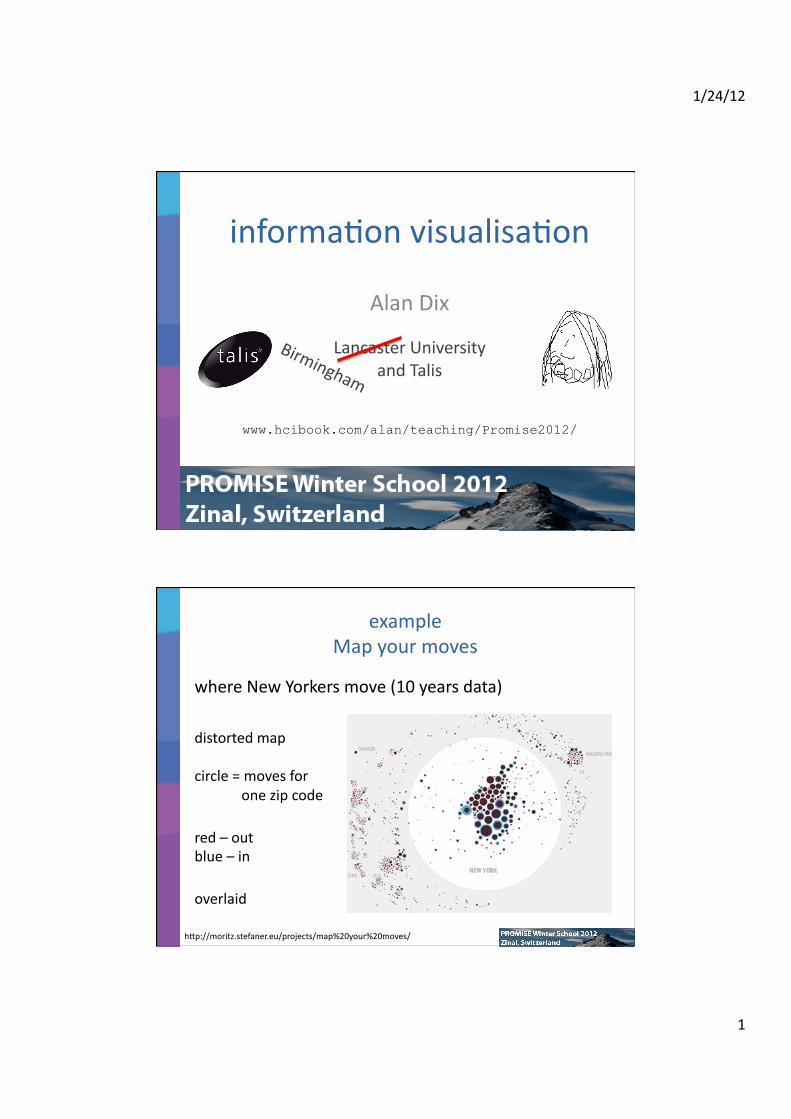
example Map your moves
where New Yorkers move (10 years data)
distorted map
circle = moves for one zip code
red – out blue – in
overlaid
hMp://moritz.stefaner.eu/projects/map%20your%20moves/

1/24/12
2
example Map your moves
interac-ve: selec-ng a zip code shows where movements to/from
also hiding: what you don’t show also important
hMp://moritz.stefaner.eu/projects/map%20your%20moves/
what is visualis-on?
making data easier to understand using direct sensory experience
especially visual!
but can have aural, tac-le ‘visualisa-on’

1/24/12
3
direct sensory experience
N.B. sensory rather than linguisi-c
sort of right/leX brain stuff!
but ... may include text, numbers, etc.
visualising in text alignment -‐ numbers
think purpose!
which is biggest?
532.56 179.3
256.317 15
73.948 1035 3.142
497.6256

1/24/12
4
visualising in text alignment -‐ numbers
visually:
long number = big number
align decimal points
or right align integers
627.865 1.005763
382.583 2502.56 432.935
2.0175 652.87 56.34
visualising in text
TableLens like a‘spreadsheet’ ...
... but some rows squashed to one pixel high numbers become small histogram bars

1/24/12
5
visualising in text TableLens
N.B. also an example of focus+context
context whole dataset
can also be seen in overview
focus some rows in full detail
especially visual
visual cortex is 50% of the brain!
... but disability, context, etc., may mean non-‐visual forms needed

1/24/12
6
why visualisa-on?
for the data analyst scien-st, sta-s-cian, probably you!
for the data consumer audience, client, reader, end-‐user
why visualisa-on?
consumer understanding
rhetoric
focus on well understood, simple representa-ons

1/24/12
7
why visualisa-on?
consumer understanding
rhetoric
to help others see what the analyst has already seen
infographics
data journalism
hMp://www.guardian.co.uk/news/datablog/2010/oct/18/deficit-‐debt-‐government-‐borrowing-‐data
why visualisa-on?
consumer understanding
rhetoric
to persuade readers of par-cular point (and not others!) lies, damn lies,
and graphs
the business plan hockey s-ck!

1/24/12
8
why visualisa-on?
analyst understanding
explora-on
powerful, oXen novel visualisa-ons, training possible
why visualisa-on?
consumer understanding
explora-on
to make more clear par-cular aspects of data
confirming hypotheses
e.g. box plots in stats
no-cing excep-ons
graph from: Measurement of the neutrino velocity with the OPERA detector in the CNGS beam

1/24/12
9
why visualisa-on?
consumer understanding
explora4on to find new things that have not been previously considered
seeking the unknown
avoiding the obvious
wary of happenstance

1/24/12
10
a brief history of visualisa-on
from 2500 BC to 2012
a brief history ...
sta-c visualisa-on – the first 2500 years
interac-ve visualisa-on – the glorious ’90s
and now? – web and mass data
– visual analy-cs

1/24/12
11
sta-c visualisa-on from clay tablets to TuXe
Mesopotamian tablets
sta-c visualisa-on from clay tablets to TuXe
Mesopotamian tablets 10th Century -me line

1/24/12
12
sta-c visualisa-on from clay tablets to TuXe
Mesopotamian tablets 10th Century -me line
1855 Paris-‐Lyon train -metable

1/24/12
13
sta-c visualisa-on from clay tablets to TuXe
Mesopotamian tablets 10th Century -me line
1855 Paris-‐Lyon train -metable
Excel etc.
sta-c visualisa-on
read TuXe’s books ... – The Visual Display of Quan2ta2ve Informa2on
– Envisioning Informa2on
– Visual Explana2ons

1/24/12
14
interac-ve visualisa-on
early 1990s growing graphics power – 3D graphics – complex visualisa-ons – real-‐-me interac-on possible
... and now
loads of data
web visualisa-on
data journalism
hMp://www.guardian.co.uk/news/datablog/2010/oct/18/deficit-‐debt-‐government-‐borrowing-‐data
hMp://www-‐958.ibm.com/soXware/data/cognos/manyeyes/

1/24/12
15
and visual analy-cs!

1/24/12
16
visualisa-on in context
data visualisa-on
plain visualisa-on

1/24/12
17
direct interac-on
data visualisa-on
visual analy-cs
processing
world
organisa-onal social & poli-cal
context
direct interac-on
data visualisa-on
decision
ac-on
processing
the big picture

1/24/12
18
designing visualisa-on

1/24/12
19
choosing representa-ons
visualisa-on factors – visual ‘affordances’
• what we can see – objec-ves, goals and tasks
• what we need to see – aesthe-cs
• what we like to see
what we can see
what we need to see
what we like to see
trade-‐off
visualisa-on factors – visual affordances – objec-ves, goals and tasks – aesthe-cs
sta-c representa-on ⇒ trade-‐off interac-on reduces trade-‐off
– stacking histogram, overview vs. detail, etc. etc. interaction reduces trade-off
– stacking histogram, overview vs. detail, etc. etc.

1/24/12
20
relaxing constraints
normal stacked histogram
good for: – overall trend – rela-ve propor-ons – trend in boMom category
bad for others – what is happening to bananas?
?
make your own (iii)
relaxing constraints interac-ve stacking histograms ...
or ... dancing histograms
normal histogram except ...
normal histogram except ...
dancing histograms

1/24/12
21
make your own (iii)
relaxing constraints interac-ve stacking histograms ...
or ... dancing histograms
normal histogram except ...
hover over cell to show detail
make your own (iii)
relaxing constraints interac-ve stacking histograms ...
or ... dancing histograms
normal histogram except ...
hover over cell to reveal detail
click on legend to change baseline
demonstration

1/24/12
22
kinds of interac-on
highligh-ng and focus
drill down and hyperlinks
overview and context
changing parameters
changing representa-ons
temporal fusion
Shneiderman’s visualisa-on mantra
overview first, zoom and filter,
then details on demand
hMp://www.sapdesignguild.org/community/book_people/visualiza-on/controls/FilmFinder.htm
overview
zoom and filter using sliders
details on demand

1/24/12
23
classic visualisa-ons

1/24/12
24
displaying groups/clusters
numeric aMributes – use average
or region
categorical aMributes – show values of aMributes common to cluster
text, images, sound – no sensible ‘average’ to display – use typical documents/images
– central to cluster ... or spread within cluster
using clusters the scaMer/gather browser
take a collec-on of documents scaMer:
– group into fixed number of clusters – displays clusters to user
gather: – user selects one or more clusters
– system collects these together
scaMer: – system clusters this new collec-on ...

1/24/12
25
displaying clusters scaMer-‐gather browser
keywords (created by clustering algorithm)
‘typical’ documents (with many cluster keywords)
hierarchical data
hierarchies are everywhere! – file systems
– organisa-on charts – taxonomies – classifica-on trees – ontologies – xml

1/24/12
26
problems with trees ...
width grows rapidly hard to fit text labels
overlapping low level nodes
use 3D?
cone tree – use stacked circles of subtrees

1/24/12
27
good use of 3D
s-ll have occlusion ... but ‘normal’ in 3D
shadows help to disambiguate
but text labels difficult
cone trees → cam trees
horizontal layout makes labels readable small things maMer!

1/24/12
28
x x/a – 4 x/b – 2
y y/c – 1 y/d – 1 y/e – 1
disect 2D space -‐ treemaps
takes tree of items with some ‘size’ – e.g. file hierarchy, financial accounts
alterna-vely divides space horizontally/ver-cally for each level, propor-onate to total size
x [6] y [3]
x/a [4]
x/b [2] y/e [1]
y/c [1]
y/d [1]
hMp://www.cs.umd.edu/hcil/treemap-‐history/
treemaps (2)
later variants improved the shape and appearance of maps

1/24/12
29
treemaps (3)
plus algorithms for vast data sets, for thumbnail images, etc. etc.
distort space ...
tree branching factor b: – number of nodes at depth d = bd
Euclidean 2D space: – amount of space at radius r = 2πr – not enough space!
non-‐Euclidean hyperbolic space: – exponen-al space at radius r
hyperbolic browser – lays out tree in hyperbolic space – then uses 2D representa-on of hyperbolic space

1/24/12
30
mul-ple aMributes
oXen data items have several aMributes e.g. document:
– type (journal, conference, book) – date of publica-on – author(s) – mul-ple keywords (perhaps in taxonomy)
– cita-on count – popularity
tradi-onal approach ... boolean queries
> new query ? type=‘journal’ and keyword=‘visualisa-on’ = query processing complete -‐ 2175 results list all (Y/N)
> N > refine query refine: type=‘journal’ and keyword=‘visualisa-on’ + author=‘smith’ = query processing complete -‐ 0 results

1/24/12
31
faceted browsing e.g. HiBrowse (one of the earliest)
mul-ple selec-on boxes – ‘or’ within box -‐ ‘and’ between boxes
digital libraries HCI 173 formal models interaction 157 task analysis visualisation 39 web
keywords all 173 catarci 53 dix 9 jones 17 shneiderman 153 smith 0 wilson 22
authors all 173 book conference journal 173 other
types
(keyword=‘interaction’ or ‘visualisation’) and type=‘journal’
digital libraries HCI 173 formal models interaction 157 task analysis visualisation 39 web
keywords all 173 catarci 53 dix 9 jones 17 shneiderman 153 smith 0 wilson 22
authors all 173 book conference journal 173 other
types
HiBrowse (ii)
shows how many items with par-cular value – e.g. 39 documents with keyword=‘visualisation’ and type=‘journal’ e.g. 39 documents with keyword=‘visualisation’ and type=‘journal’

1/24/12
32
digital libraries HCI 173 formal models interaction 157 task analysis visualisation 39 web
keywords all 173 catarci 53 dix 9 jones 17 shneiderman 153 smith 0 wilson 22
authors all 173 book conference journal 173 other
types
HiBrowse (iii)
can predict the effect of refining selec-on – e.g. selec-ng ‘smith’ would give empty result e.g. selecting ‘smith’ would give empty result
digital libraries HCI 173 formal models interaction 157 task analysis visualisation 39 web
all 173 catarci 53 dix 9 jones 17 shneiderman 153 smith 0 wilson 22
all 173 book conference journal 173 other
keywords authors digital libraries HCI 39 formal models interaction task analysis visualisation 39 web
all 39 book conference journal 39 other
all 39 catarci 18 dix 1 jones 3 shneiderman 21 smith 0 wilson 7
types
HiBrowse (iv)
refining selec-on updates counts in real -me
all 45 book 6 conference journal 39 other
all 45 catarci 19 dix 1 jones 5 shneiderman 24 smith 0 wilson 8
digital libraries HCI 45 formal models interaction task analysis visualisation 45 web

1/24/12
33
starfield (i)
scaMer plot for two aMributes colour/shape codes for more
adjust rest with sliders dots appear/disappear as slider values change
dynamic filtering
starfield (ii)
when few enough points more details appear

1/24/12
34
Influence Explorer (i)
developed for engineering models
like Starfield ... but sliders show histogram
how many in category (like HiBrowse) ... and how many ‘just miss’
red = full match black = all but one attribute greys = fewer matching attr’s
Influence Explorer (ii)
some versions highlight individual items in each histogram
similar technique has been used to match mul-ple taxonomic classifica-ons

1/24/12
35
Informa-on Scent
Starfield shows what is selected
• explore using trial and error
HiBrowse and Influence Explorer show what happen
Pirolli et al. call this Informa-on Scent – things in the interface that help you know what ac-ons to take to find the informa-on you want
very large datasets
too many points/lines to see
solu-ons ...
space-‐filling single-‐pixel per item Keim’s VisD
random selec-on (see Geoff Ellis’ thesis)
clustering visualise groups not individuals