Embed Size (px)
Citation preview

Institut de Recerca en Economia Aplicada Regional i Pública Document de Treball 2013/05, 34 pàg. Research Institute of Applied Economics Working Paper 2013/05, 34 pag.
Grup de Recerca Anàlisi Quantitativa Regional Document de Treball 2013/03, 34 pàg.
Regional Quantitative Analysis Research Group Working Paper 2013/03, 34 pag.
“Informality and Overeducation in the Labor Market of a
Developing Country” Paula Herrera-Idárraga, Enrique López-Bazo and Elisabet Motellón

Research Institute of Applied Economics Working Paper 2013/05, pàg. 2 Regional Quantitative Analysis Research Group Working Paper 2013/03, pag. 2
WEBSITE: www.ub-irea.com • CONTACT: [email protected]
WEBSITE: www.ub.edu/aqr/ • CONTACT: [email protected]
Universitat de Barcelona Av. Diagonal, 690 • 08034 Barcelona
The Research Institute of Applied Economics (IREA) in Barcelona was founded in 2005, as a research institute in applied economics. Three consolidated research groups make up the institute: AQR, RISK and GiM, and a large number of members are involved in the Institute. IREA focuses on four priority lines of investigation: (i) the quantitative study of regional and urban economic activity and analysis of regional and local economic policies, (ii) study of public economic activity in markets, particularly in the fields of empirical evaluation of privatization, the regulation and competition in the markets of public services using state of industrial economy, (iii) risk analysis in finance and insurance, and (iv) the development of micro and macro econometrics applied for the analysis of economic activity, particularly for quantitative evaluation of public policies. IREA Working Papers often represent preliminary work and are circulated to encourage discussion. Citation of such a paper should account for its provisional character. For that reason, IREA Working Papers may not be reproduced or distributed without the written consent of the author. A revised version may be available directly from the author. Any opinions expressed here are those of the author(s) and not those of IREA. Research published in this series may include views on policy, but the institute itself takes no institutional policy positions.
Research Institute of Applied Economics Working Paper 2013/05, pàg.3 Regional Quantitative Analysis Research Group Working Paper 2013/03, pag. 3
3
Abstract In this paper, we explore the connection between labor market segmentation in two sectors, a modern protected formal sector and a traditional- unprotected-informal sector, and overeducation in a developing country. Informality is thought to have negative consequences, primarily through poorer working conditions, lack of social security, as well as low levels of productivity throughout the economy. This paper considers an aspect that has not been previously addressed, namely the fact that informality might also affect the way workers match their actual education with that required performing their job. We use micro-data from Colombia to test the relationship between overeducation and informality. Empirical results suggest that, once the endogeneity of employment choice has been accounted for, formal male workers are less likely to be overeducated. Interestingly, the propensity of being overeducated among women does not seem to be closely related to the sector choice.
JEL classification: O15; J21; J24. Keywords: Segmented labor markets, Formal/Informal employment, Human capital, Economic development
Paula Herrera-Idárraga. AQR Research Group-IREA. Department of Econometrics. University of Barcelona, Av. Diagonal 690, 08034 Barcelona, Spain, and Pontificia Universidad Javeriana. E-mail: [email protected] Enrique López-Bazo. AQR Research Group-IREA. Department of Econometrics. University of Barcelona, Av. Diagonal 690, 08034 Barcelona, Spain. E-mail: [email protected] Elisabet Motellón. Universitat Oberta de Catalunya and AQR Research Group-IREA. Department of Econometrics. University of Barcelona, Av. Diagonal 690, 08034 Barcelona, Spain. E-mail: [email protected] Acknowledgements The authors gratefully acknowledge financial support from the Spanish Ministry of Science and
Innovation, Plan Nacional de I+D+i, Project ECO2011-30260-C03-03, and the European
Commission under the 7th Framework Programme project SEARCH, SSH-2010-2.2-266834. Paula
Herrera-Idárraga also acknowledges financial support from the Agència de Gestiò d’Ajuts
Universitaris i de Recerca (AGAUR) (grant FI-DGR 2012) and from the Pontificia Universidad
Javeriana.

Research Institute of Applied Economics Working Paper 2013/05, pàg.4 Regional Quantitative Analysis Research Group Working Paper 2013/03, pag. 4
4
1. Introduction
A main feature of almost all developing countries is the presence of a large proportion of workers
employed in the unregulated-unprotected-informal sector.1 According to the dualistic view, based
on the Harris and Todaro (1970) model, jobs are rationed in the formal sector due to labor market
rigidities of an institutional nature, such as labor unions and minimum wages legislation. As a
result some workers are forced to accept informal sector jobs characterized by precarious
working conditions, lack of social security and inferior earnings. Most studies of labor markets in
developing countries find that some characteristics are better rewarded in formal jobs (e.g.,
Pradhan and Van Soest 1995; Tansel 2000; Gong and Van Soest 2002; Botelho and Ponczek
2011). However it is possible that rigidities associated with formal jobs might also affect the way
workers match their actual education with the one required to perform their job. In a segmented
labor market of such characteristics, as long as the more highly educated workers tend to be
more productive than their less skilled counterparts, education may not provide access to good
jobs. A highly skilled worker who is unable to obtain a high-skill job in the formal sector may
accept a low-skill job in the informal sector for which she is overeducated. An individual worker is
said to be overeducated if she has acquired more education than what is required to perform her
job. Overeducation is, thus, often taken to imply that resources are not efficiently used, since
overeducated workers make lower returns on their investment relative to similarly educated
individuals whose jobs match appropriately their level of education. Here, we assume that
overeducation in a developing country is not independent of market segmentation into formal and
informal sector.
There is now a substantial body of literature addressing the phenomenon of
overeducation in developed countries.2 An increasing amount of this literature is concerned with
1 Throughout this article, as in Botelho and Ponczek (2011), the informal sector term is related to the nature of the job and not of the firm in which the workers is employed. This is so because our data relates only to workers and not to firms. The definition of an informal job that will be used in this article is that of a job that does not pays contributions to the social security system. 2Duncan and Hoffman (1981), Verdugo and Verdugo (1989), Sicherman (1991), Tsang, Rumberger and Levin (1991), McGoldrick and Robst (1996) studied the phenomenon for the United States; Alpin, Shackleton and Walsh (1998), Green, McIntosh and Vignoles (2002), Dolton and Vignoles (2000) and Chevalier (2003) for the UK; Hartog and Oosterbeek (1998) and Groot and Massen van den Brink (2000) for Holland; Bauer (2002) and Buchel and van Ham (2003) for Germany; Kiker, Santos and De Oliveira (1997) and Mendes de Oliveira, Santos and Kiker (2000) for Portugal; Alba-Ramirez (1993) for Spain. For

Research Institute of Applied Economics Working Paper 2013/05, pàg.5 Regional Quantitative Analysis Research Group Working Paper 2013/03, pag. 5
5
providing an explanation for overeducation that is consistent with one of the theoretical
frameworks of the labor market: human capital theory (Becker 1964), the job competition model
(Thurow 1975) or the assignment models (Tinbergen 1956). The majority of studies tend to
support the assignment interpretation, arguing that earnings depend to some extent on both
individual and job characteristics. These models also imply that there is no reason to expect
wage rates to be correlated only to acquired schooling or other individual attributes (human
capital theory), nor should it be expected that individual productivity and, hence, earnings will be
determined solely by job characteristics (job competition model). In addition, a number of studies
have also estimated the effects of overeducation on earnings. These studies show that
overeducated workers tend to earn higher returns to their years of schooling than co-workers who
are not overeducated, but lower returns than workers with a similar level of education who are
employed in jobs that require the same level of education that they possess.
To the best of our knowledge, few studies have examined overeducation in developing
countries. Quinn and Rubb (2006) study the phenomenon for Mexico, Abbas (2008) for Pakistan
and Mehta et al. (2011) for India, Mexico, the Philippines and Thailand. One reason for this
paucity of studies might be data limitations that hinder identification of the education levels
required for specific jobs. Moreover, despite the increase in recent decades in average schooling
attainment in developing countries, the average presented in these economies is lower than that
presented in high-income countries. In Latin American and Caribbean Countries the average
educational attainment for females and males between the ages of 21 and 24 are 9.6 and 9.3
years, respectively (Duryea et al. 2007). By comparison, the average for the OECD countries is
12.5 for males and 12.8 for females aged between 25 and 34 (OECD Education at a Glance
2010). The fact that educational attainment remains low in developing countries means that the
overeducation is a somewhat contradictory phenomenon for these economies. Nevertheless,
previous studies find evidence of overeducation in developing countries (Quinn and Rubb 2006
for Mexico; Abbas 2008 for Pakistan and Mehta et al. 2011 for unskilled jobs in the Philippines)
and report that the incidence of overeducation is similar to that present in developed economies.
Given the differences between the labor markets of developed and developing
economies, it is plausible that the factors accounting for overeducation may differ. As has already
been mentioned labors markets of developing economies are characterized by a high degree of
informality. In the specific case of Latin America, the informal sector employs between 30 and an extensive review of overeducation in developed countries see McGuinness (2006) and for a recent survey on overeducation see Leuven and Oosterbeek (2011).

Research Institute of Applied Economics Working Paper 2013/05, pàg.6 Regional Quantitative Analysis Research Group Working Paper 2013/03, pag. 6
6
70% of the urban work force (Maloney 2004), embracing a variety of heterogeneous activities,
such as self-employed entrepreneurs, salaried workers employed in large and small firms, and
unpaid domestic workers. Besides the well-known negative implications of informality, primarily
the result of poorer working conditions, a segmented labor market (divided between a formal and
an informal jobs) might also affect the way workers match their acquired education with the
education required to perform their job. As Berry and Sabot (1978) affirm, “one of the
inefficiencies associated with segmentation, more difficult to document but possibly imposing
greater resource costs on the economies of developing countries, involves the failure of the
market to move the ‘right’ resources into high wage sectors, a failure commonly described by the
term ‘mismatch’”. Building on this statement, here we assume that the study of overeducation in a
developing economy with a large informal sector cannot fail to examine the role played by this
segmentation.
Our assumption also builds on a model developed by Charlot and Decreuse (2005). This
model shows that self-selection in education is inefficient in presence of labor market
segmentation. As workers do not internalize the impact of their education decision on the others
wage and employment perspectives, too many workers are willing to acquire education and this
leads to overeducation. In our opinion, this is a reasonable explanation for educational mismatch
in the labor markets of developing countries that presents labor market segmentation into a
formal and an informal sector. In contrast with (some) developed countries in which
overeducation is clearly associated with large endowments of education, the population in
developing economies presents low or moderate levels of education attainment. Formal and
informal labor market segmentation is, thus, a phenomenon that could account for overeducation
in these economies. However, this model it is not able to predict in which sector the incidence of
overeducation will be highest; in this regard our empirical exercise tries to shed light on this issue.
Colombia is a good example of a developing country characterized by the high degree of
informality in its labor market, and the country’s informal employment makes an interesting case
to study for several reasons. First, informality today is at the center of economic debate in the
country because of the high levels that prevail. Second, in Colombia there is a high incidence of
the minimum wage, i.e. a relatively high proportion of formal sector employees receive a salary
similar to the minimum, which points to the existence of important labor market rigidities. Third,
previous studies have found overeducation to exist in Colombia (Mora 2005, Castillo 2007,

Research Institute of Applied Economics Working Paper 2013/05, pàg.7 Regional Quantitative Analysis Research Group Working Paper 2013/03, pag. 7
7
Dominguez Moreno 20093). Finally, studies of informality in Colombia and other developing
countries focus primarily on the size of the informal sector, on the likelihood that workers
enter/exit the informal sector and on the formal/informal sector wage differentials.4 However, little
attention has been paid to the effects of a large informal sector on the way workers match their
education with the one required to perform their job. If labor market segmentation can lead to
education-occupation mismatches, then it may also affect the allocation of resources in the
educational system, one manifestation of which is the bias toward academic training (Berry and
Sabot 1978).
Summing up, in this paper we study the contribution of working in a formal or an informal
job on the probability of being overeducated in a developing country with low or moderate
educational attainment. We hypothesize that in developing countries with a large informal sector,
educated workers that do not find a high skilled formal job may accept an unskilled informal job
for which she is overeducated, i.e. informal workers are more likely to be overeducated than
formal workers. We test the positive relationship between informality and overeducation by
exploiting information in a micro-data set for Colombian workers. In so doing, two types of
empirical models are used: firstly, a simple univariate probit model that assumes that the
unobservable characteristics that affect an individual’s chances of working in either formal or
informal jobs are independent of those determining her propensity to be overeducated; and,
secondly, a bivariate probit model that enables us to control for the likely endogeneity of the
selection of the formal or informal job. Our results confirm that, conditional on other individual and
family characteristics, formal workers present a significantly lower probability of being
overeducated. This general result seems to be driven by the fact that male informal workers face
3 Using micro-data for Colombia, Dominguez Moreno (2009) studies the probability of working in the formal sector, including as an explanatory variable whether the worker is overeducated or not. In our view, this direction of the causal relationship between informality and overeducation is not correct. As a matter of fact, educational mismatch is observed after the match has happened and it is not a worker's intrinsic condition. If that were the case, studies analyzing the determinants of the probability of employment should include over-education in the list of explanatory variable. As far as we know this has not been the practice so far. On the top of that, Dominguez Moreno (2009) did not consider the likely endogeneity of overeducation caused by the effect of omitted unobserved factors influencing both informality and overeducation. 4 See, e.g., Magnac (1991), Nuñez (2002), Maloney and Nuñez (2004), Floréz (2002), Kugler and Kugler (2009) and Mondragón-Vélez, Peña and Wills (2010) for Colombia; Gindling (1991) for Costa Rica; Pradhan and van Soest (1995) for Bolivia; Amuedo-Dorantes (2004) for Chile; Pratap and Quintin (2006) for Argentina Günther; Tansel (2000) for Turkey; Marcouiller, Ruiz de Castilla and Woodruff (1997) and Gong and Van Soest (2002) for Mexico; Pisani and Pagán (2004) for Nicaragua; Botelho and Ponczek (2011) for Brazil; Badaoui, Strobl and Walsh (2008) for South Africa.

Research Institute of Applied Economics Working Paper 2013/05, pàg.8 Regional Quantitative Analysis Research Group Working Paper 2013/03, pag. 8
8
a greater probability of being overeducated, whereas no significant differences are detected
between informal and formal female workers.
The rest of the paper is organized as follows. Next section gives the details concerning the data
and presents some selected descriptors, while the empirical approach is presented in section 3.
Section 4 summarizes the estimate results of the empirical models, section 5 presents some
robustness checks and, finally, section 6 contains the conclusions
2. Data and descriptive statistics
We use data from the 2008 wave of the Colombian Household Survey (CHS), a repeated cross-
section conducted by the National Statistics Department (DANE). This survey gathers information
about employment conditions for a population aged 12 years or more and includes data about
income, occupation, industry, and firm size, in addition to the individual’s general characteristics
of sex, age, marital status and educational attainment. Certain household characteristics, such as
the head of the household, the number of children, and the level of education of all its members,
are also included. The CHS covers the thirteen major metropolitan areas of Colombia, which in
2008 accounted for 45% of the country’s population. It should be noted that this survey has been
used for various empirical studies analyzing labor market issues in Colombia (see, for example,
Magnac 1991; Attanasio, Goldberg and Pavcnik 2004; Goldberg and Pavcnik 2005).
The analysis conducted herein was limited to employed individuals between the ages of 15
and 60 that were not undertaking formal studies and who reported working more than 16 hours
per week. Government employees, household employees, the self-employed, bosses or
employers, unpaid family workers, workers without pay in enterprises or other family businesses
were not included in the sample. The subsequent sample used in the analysis comprised 15,104
observations.
As a starting point in our analysis, we had to use a criterion to determine whether a worker
in the sample is overeducated, and if that worker is employed in the formal or informal sector.
Four basic methods have been suggested in the literature for measuring the education required
for a job and, consequently, for determining overeducation. The first ‘subjective’ approach uses
self-assessment to define the job’s educational requirements and then compares this with the

Research Institute of Applied Economics Working Paper 2013/05, pàg.9 Regional Quantitative Analysis Research Group Working Paper 2013/03, pag. 9
9
worker’s actual education (Battu, Belfield and Sloane 2000; McGuinness 2003). The second is a
variation on the above and involves asking the worker directly whether he or she is overeducated
(Devillanova 2012). Overeducation can also be calculated objectively by using job analysts
definitions of the educational requirement for each occupation, as available in the United States
Dictionary of Occupational Titles, and comparing this with the workers educational level
(Rumberger 1987; Hartog and �Oosterbeek 1988; Kiker, Santos and Mendes de Oliveira 1997;
Chevalier 2003). An alternative objective measure is obtained by analyzing the distribution of
education in each occupation; employees who depart from the mean (Verdugo and Verdugo
1989) or mode (Mendes de Oliveira, Santos and Kiker 2000) by more than one standard
deviation are classified as being overeducated. This last approach is usually known as the
‘statistical’ method.
Since the CHS does not supply information to construct a subjective measure of
overeducation, and taking into account that the requirements of education in the rather broad
categories of occupations (two-digit ISCO classification) available in the CHS are likely to differ
from those in the US economy, we decided to follow other studies in the literature in applying the
‘statistical’ approach based on the mean of the distribution of education within each two-digit
occupation.5 By using such an objective measure, the overall incidence of overeducation in the
sample was found to be 15%, a figure similar to that reported for other developing economies
(Quinn and Rubb 2006) and lower than the incidence of overeducation in developed economies
(McGuinness 2006).
As regards informality, alternative definitions and corresponding ways of measuring it have
been proposed in the literature. This lack of consensus largely reflects issues of data availability
in each study. In the particular case of Colombia, according to DANE, informal workers are those
who fall into at least one of these categories: (i) work in firms with five or fewer employees; (ii) are
unpaid family workers and housekeepers; (iii) are self employed who work in places of up to five
persons other than independent professionals and technicians; or (iv) are business owners of
firms with five or less employees. This definition, in line with that proposed by the International
Labor Office, has been criticized in the literature because it does not take into account the
benefits associated with formal employment, such as inclusion in the social security system
5 As stressed in Ramos and Sanromà (2011), a two-digit classification of occupations is not optimal for applying the mode criterion. In addition, Mehta et al. (2011) emphasized that the modal education is more prone to shift even when technology and the jobs-pool do not. In any case, we also computed the results of the following sections using the mode criterion, and the main conclusions remained the same as those derived from results using the mean criteria (results are available upon request).

Research Institute of Applied Economics Working Paper 2013/05, pàg.10 Regional Quantitative Analysis Research Group Working Paper 2013/03, pag. 10
10
(Flórez 2000). Nevertheless, the data made available by the CHS allow us to determine whether
the workers in the sample are covered or not by the social security system, and it even
distinguishes between contributions to the retirement pension and to the health system. Using
this information, we classified workers as formally or informally employed according to their
degree of inclusion in the social security system. That is to say, an individual was classified as a
formal worker if she contributed to both health and retirement pension systems. Applying this
condition, as many as 33.3% of individuals in the entire sample worked in informal jobs.6
The incidence of overeducation in the entire sample and in the two sectors and the
percentage of Colombian workers in the formal and in the informal sector are shown in the first
set of rows in Table 1. This table also displays basic summary statistics concerning the
distribution of the individual and job characteristics considered in the subsequent analysis,
distinguishing in this regard between workers in the formal and informal jobs. In addition, to
obtain some insights into differences by gender in the magnitudes under analysis, figures were
computed for the entire sample and for men and women separately.
As mentioned above, 15% of Colombian urban workers were overeducated, this figure
being higher in the case of formal workers (17%) than for those employed in informal jobs (11%).
This gap of six percentage points is found for both male and female workers. As for the
distribution of workers in each sector, around one third had an informal job in 2008, this
percentage being higher for men (35%) than for women (31%). Differences in overeducation
between the two sectors and by gender might simply be caused by disparities in the distribution
of the characteristics that are assumed to affect the incidence of overeducation. Actually, the
comparison of the figures reported in Table 1 confirms that there are substantial differences in
some of the observable worker and job characteristics of formal and informal workers. As a
matter of example, the number of years of schooling, as a measure of education, are not only
useful as a proxy for general human capital but they are also likely to be correlated with
unobserved individual ability. What the figures show is that informal workers are more likely to
have education levels below those of formal workers: whereas 45% of informal workers in the
entire sample have at most basic secondary education, the percentage of workers in formal jobs
with secondary or tertiary education is as high as 81% (45% with tertiary education). If, as
expected, there is a strong association between education and the likelihood of overeducation,
6 Self-employment in Latin America generally constitutes one of the principle sources of employment and a large proportion of the self-employed operate in the informal sector. If the sample is not restricted to exclude self-employees, the percentage of informal workers increases up to 59% for 2008.

Research Institute of Applied Economics Working Paper 2013/05, pàg.11 Regional Quantitative Analysis Research Group Working Paper 2013/03, pag. 11
11
such a gap in educational attainment could explain much of the difference observed in the
overeducation figures between the two sectors.
There are significant differences in other characteristics as well. The percentage of female
workers in formal jobs is higher than that in informal, perhaps due to the fact that our sample
excludes self-employed individuals. A much larger proportion of the workforce in formal jobs is
married, and workers in those jobs tend to accumulate much more tenure than informal workers,
suggesting a higher stability of employment for formal workers. As for the occupational structure,
the share of informal workers in unskilled occupations (42%), and the share in merchant, vendor
and service jobs (36%) is larger than that in the formal sector, while administrative staff (24%)
and professionals and technicians are more strongly represented in formal jobs. Finally, it is
worth mentioning that more than two thirds of informal workers are employed in small firms, with
10 or less workers. This is in sharp contrast with figures of formal jobs, where more than half
formal workers work in firms with more than 100 employees, and around two thirds in firms with
at least 50 employees. In short, these figures indicate a close connection between informality and
firm size in Colombia.
As for the gender component, Table 1 shows that male and female workers differ in some
of the characteristics that are supposed to affect overeducation. Interestingly, the most
remarkable differences affect the distribution of education levels and occupations. Broadly
speaking, female workers are more highly educated than their male counterparts, and find
themselves concentrated in occupations such as administrative staff (24%), merchant and vendor
jobs (22%) and service work (20%), while men are more highly concentrated in unskilled
occupations (48%), which are associated with higher levels of informality.
This simple descriptive analysis suggests i) the presence of quite large levels of
overeducation in Colombia, ii) apparently, affecting more intensively formal workers than informal
workers, and iii) that formal and informal workers differ in their levels of educational attainment,
occupational distribution, and other individual and job characteristics, which are thought to exert
an influence on the individual’s probability of being overeducated. Since the greater incidence of
overeducation in formal jobs might well be caused by a composition effect (for example,
associated with the higher education of workers in that jobs), in the section that follows we
estimate the impact of informality on overeducation but in relation to the conditioning factors of

Research Institute of Applied Economics Working Paper 2013/05, pàg.12 Regional Quantitative Analysis Research Group Working Paper 2013/03, pag. 12
12
observable worker and job characteristics.
3. Informality and overeducation. Empirical specification
A multivariate empirical model needs to be specified in order to assess the impact of formal or
informal sector on the probability of Colombian workers being overeducated, conditional on other
observed individual, household and job characteristics. In so doing, we first assume that the
allocation of a worker to a formal or informal sector is exogenous to her chances of being
overeducated. Under such an assumption, a univariate probabilistic specification provides
consistent estimates of the effect of the sector on the chances of the worker having more
education than that required for her occupation. However, the endogeneity assumption can easily
be questioned. Were this to be the case, the standard probabilistic specification with exogenous
covariates would lack consistency. To address this issue, we estimate the effect of the sector by
means of a bivariate specification in which this variable is instrumented.
Briefly, a simple way to identify the determinants of educational mismatch is to assume a
latent continuous (unobserved) variable for the probability of overeducation of worker i, which
is related to a linear index function and an additive error term, :
(1)
where is a vector of individual and firm characteristics (including age, gender, marital
status, head of household, education, tenure, occupation, industry sector, contract type and the
unemployment rate of the metropolitan area), is a dummy variable for the sector (formal or
informal), and is a normally distributed error with zero mean and unit variance.
The observed dichotomous realization of the latent variable is as follows:
if the individual is overeducated
Research Institute of Applied Economics Working Paper 2013/05, pàg.13 Regional Quantitative Analysis Research Group Working Paper 2013/03, pag. 13
13
otherwise
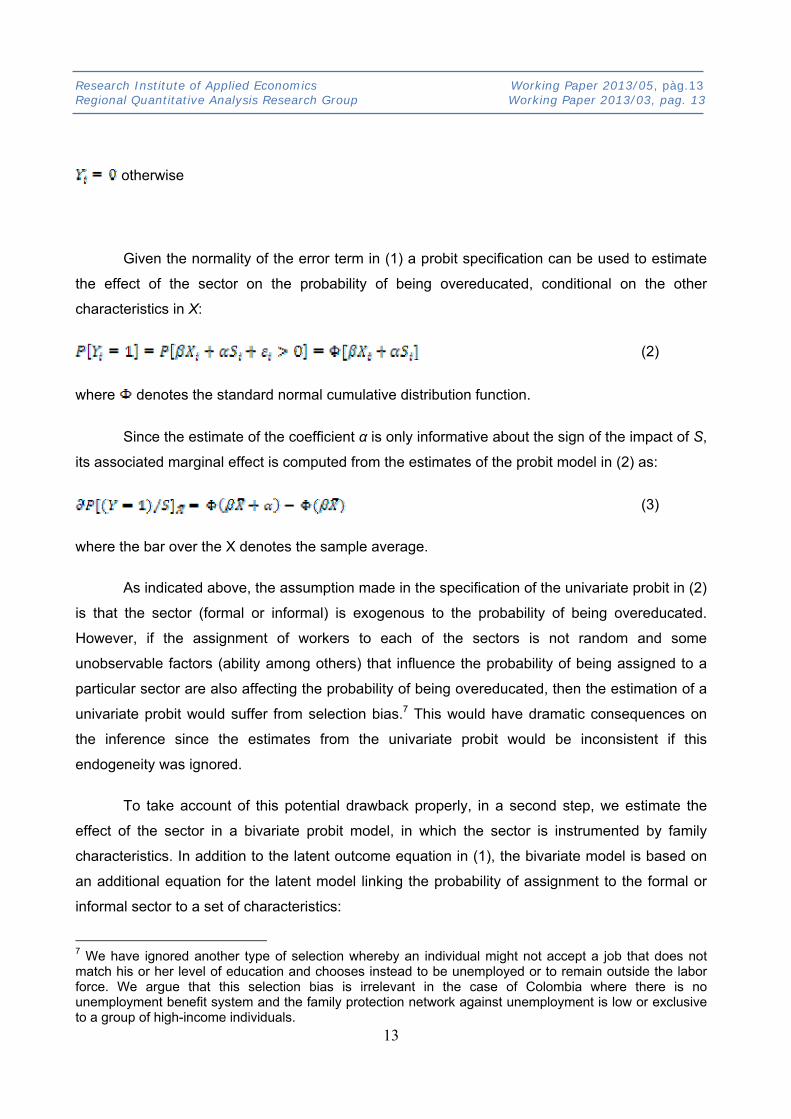
Given the normality of the error term in (1) a probit specification can be used to estimate
the effect of the sector on the probability of being overeducated, conditional on the other
characteristics in X:
(2)
where denotes the standard normal cumulative distribution function.
Since the estimate of the coefficient α is only informative about the sign of the impact of S,
its associated marginal effect is computed from the estimates of the probit model in (2) as:
(3)
where the bar over the X denotes the sample average.
As indicated above, the assumption made in the specification of the univariate probit in (2)
is that the sector (formal or informal) is exogenous to the probability of being overeducated.
However, if the assignment of workers to each of the sectors is not random and some
unobservable factors (ability among others) that influence the probability of being assigned to a
particular sector are also affecting the probability of being overeducated, then the estimation of a
univariate probit would suffer from selection bias.7 This would have dramatic consequences on
the inference since the estimates from the univariate probit would be inconsistent if this
endogeneity was ignored.
To take account of this potential drawback properly, in a second step, we estimate the
effect of the sector in a bivariate probit model, in which the sector is instrumented by family
characteristics. In addition to the latent outcome equation in (1), the bivariate model is based on
an additional equation for the latent model linking the probability of assignment to the formal or
informal sector to a set of characteristics:
7 We have ignored another type of selection whereby an individual might not accept a job that does not match his or her level of education and chooses instead to be unemployed or to remain outside the labor force. We argue that this selection bias is irrelevant in the case of Colombia where there is no unemployment benefit system and the family protection network against unemployment is low or exclusive to a group of high-income individuals.

Research Institute of Applied Economics Working Paper 2013/05, pàg.14 Regional Quantitative Analysis Research Group Working Paper 2013/03, pag. 14
14
(4)
where Zi is a vector of observed individual and family characteristics, and i is a normally
distributed error term. Zi includes the set of characteristics in Xi plus some additional variables
used as instruments for the assignment to the sector, .
Since we can only observe the sector for each individual, the link between the observed
binary variable and the latent variable is assumed to be as follows:
if the individual is overeducated
otherwise
Therefore, the probit specification associated with the probability of working in a formal
job, conditioned to the characteristics in Z, stands as:
(5)
The bivariate probit thus consists of equations (2) and (5), where i and i are distributed bivariate
normal, with E[i] = E[i] = 0, var[i] = var[i] = 1 and cov[i,i] = . In other words, the empirical
model allows for the likely correlation of the unobserved determinants of overeducation and the
unobserved determinants of the sector. In such a framework, there are four possible states of the
world (Yi = 0 or 1 and Si = 0 or 1), and the corresponding log-likelihood function associated to this
set of events is (for further details see Wooldridge 2002, p.478):
+
(6)
The inference in the bivariate probit model is based on the maximization of the log-
likelihood in eq. (6) with respect to the parameters , , and . If is statistically different from
0, the endogeneity of the assignment to the formal or the informal sector would be confirmed, and
thus estimates from the bivariate probit are preferable; otherwise conclusions regarding the

Research Institute of Applied Economics Working Paper 2013/05, pàg.15 Regional Quantitative Analysis Research Group Working Paper 2013/03, pag. 15
15
impact of the sector could be based on the estimate of the univariate probit in eq. (2).8 As in the
case of the univariate probit model, marginal effects are computed from the estimates of the
bivariate probit model to assess the contribution of each variable to the probability of being
overeducated.
Two issues that usually result from the estimation of a bivariate probit model with an
endogenous binary regressor are identification and the selection of valid instruments.
Identification can be achieved by relying solely on the functional form and the distributional
assumptions. However, the objective of forming a consistent estimator for becomes
manageable if we can construct at least one instrument for Si . A variable Ii would be a valid
instrument for Si if it were a determinant of the sector of employment and it were not correlated
with the error term of the overeducation equation (outcome equation). The first condition is easy
to check; we can verify whether Zi is correlated with Si , once the other variables have been
controlled for. However, it is harder to test if the instrument is valid or not. In the context of the
bivariate probit model, this condition relies on the economic or institutional knowledge related to
the problem under study.
As in many other studies, finding suitable instrumental variables is far from
straightforward, since almost any regressor that determines the probability of being overeducated
could plausibly affect assignment into formal and informal jobs as well. Previews studies about
informality control for household characteristics, that may affect a person’s propensity to be
employed in the informal sector, such as the number of children in a household, number of
inactive adults in a household, and earnings of other household members (Hill 1983; Magnac
1991, Marcouiller, Ruiz de Castilla and Woodruff 1997; Goldberg and Pavcnik 2003; Pisani and
Pagán 2004; Maloney 2004). To the best of our knowledge, in the over-education literature only
Mavromaras and McGuinness (2012) use the presence of children as a control variable in probit
estimations of overskilling, situation where a worker reports that their skills are not fully utilized in
their job. The authors only report a marginal statistical significance for the coefficient of this
variable, and only for the group of moderately overskilled workers. Thus, it could be the case that
certain family characteristics influence an individual’s choice regarding formal or informal
employment but do not affect overeducation, such as the presence of children in the household
and the earnings of other household members. One reason why such family characteristics may 8 A bivariate probit model with an endogenous binary regressor has been used in, for instance, Evans and Schwab (1995) to analyze the effect of catholic schools on finishing high school and starting college.

Research Institute of Applied Economics Working Paper 2013/05, pàg.16 Regional Quantitative Analysis Research Group Working Paper 2013/03, pag. 16
16
affect the sector of employment is because they are closely related to the households income
needs. For instance, having more children means more expenses for the household and increase
the need of finding a job, which is presumably more easily available in the informal sector. On the
other side, informal sector is characterized by greater flexibility in the working hours, which aids
combining working life with childcare. The assumption here is that the presence of children does
not exert a significant effect on the propensity to be overeducated. Another family characteristic
that is thought to influence the choice of employment sector but not the individual’s propensity to
be overeducated is the social status, which we suggest is captured by the educational
achievement of other members of the household. Accordingly, we construct the average number
of years of schooling of other household members and use this as an additional instrument for
the sector of employment.
4. Informality and overeducation. Results
The maximum likelihood estimates of the coefficients when running the univariate probit model
are reported in Table 2 both for the entire sample and separately for male and female workers.
The corresponding marginal effects for the average individual as defined in eq. (3) are also
reported. Our results show that after controlling for other characteristics, formal workers are less
likely to be overeducated than their informal counterparts. In other words, when we compare
formal and informal workers with similar individual, household, and firm characteristics, those in
the former group have a lower propensity to be overeducated. This contrasts sharply with the raw
probabilities derived from the sample since, as the descriptive analysis in section 2 shows, the
share of overeducated workers in the formal sector is greater than that in the informal sector.
Thus, these results suggest that a sorting effect drives the gap in the raw propensities.
Yet, it should be mentioned that the marginal effect associated with working in formal jobs
is of a moderate magnitude. The probability that a formal worker is overeducated is just 2.5
percentage points (pp) less than that for an otherwise similar informal worker. The impact on
probability is even lower for men at 1.86 pp, and somewhat higher for women at 2.72 pp.
Interestingly, the coefficient and the corresponding marginal effect are statistically significant only
at the 5% confidence level in the separate samples for both genders. Thus, the results from the
univariate probit model suggest a modest impact of formality on overeducation having first
controlled for education and other observable characteristics.

Research Institute of Applied Economics Working Paper 2013/05, pàg.17 Regional Quantitative Analysis Research Group Working Paper 2013/03, pag. 17
17
In the case of the estimates of the coefficients for the control variables, the results shown
in Table 2 are consistent with previous findings in the literature. For the sake of brevity, we only
comment on the results for the whole sample. As expected, the probability of being overeducated
increases with educational attainment (Alba-Ramirez 1993; Kiker, Santos and Mendes de
Oliveira 1997 ; Quinn and Rubb 2006). Overeducated workers may substitute education for a lack
of job experience, taking jobs that require less education than they actually possess in order to
accumulate experience and improve their chances of finding a better job match (Rosen 1972;
Sicherman and Galor 1990; Mendes de Oliveira, Santos and Kiker 2000). As such, we expect
overeducated workers to have less job experience. To test this hypothesis we use a variable that
measures experience, specifically potential experience calculated as an individual’s age minus
five years of education. On the other hand, several studies report that overeducation may have a
negative effect on job satisfaction (Tsang, Rumberger and Levin 1991), if this is the case, then
overeducated workers with more tenure in a firm can be expected to be more prone to turnover.
Consequently we hypothesize that overeducated workers will have less tenure. The results for
the estimated marginal effect of general experience confirm the expected negative effect of this
variable on the probability of an average worker in the sample being overeducated. However, it
should be pointed out that this marginal effect is only significantly different from zero at a 10%
confidence level. The impact of tenure is also negative, though almost negligible and, not in fact
statistically significant. Therefore, the results for Colombia are in conflict with the evidence on the
substitutability between education and other forms of human capital postulated by the human
capital theory, according to which overeducation might be seen as a transitory situation.
The results also indicate that females are less likely to be overeducated than males
presenting similar characteristics, and that marital status does not have a statistically significant
impact on the probability of being overeducated for both genders. Significant differences do exist
however in terms of industry and firm size. Compared to individuals employed in Agriculture,
mining, electricity, gas and water (our reference category), those employed in construction are
more likely to be overeducated, while those working in transportation, financial intermediation and
social services are less likely to be overeducated. As for firm size, the incidence of overeducation
conditional on other characteristics is slightly lower for small (4 to 50 workers) and substantially
lower for medium size firms (51 to 100 workers). Finally, it is worth mentioning that local labor

Research Institute of Applied Economics Working Paper 2013/05, pàg.18 Regional Quantitative Analysis Research Group Working Paper 2013/03, pag. 18
18
market conditions do not seem to be relevant, as the coefficient of the metropolitan
unemployment rate, although positive, is not statistically significant.
However, it should be borne in mind that the specification used to obtain these results
assumes the exogeneity of the employment and the absence of a simultaneous impact of the
unobservable characteristics on the probability of overeducation and on the assignment of formal
or informal sector. The violation of these assumptions would invalidate the results.
Our estimates of the effect of the sector, when relaxing the assumption of exogeneity and
the lack of correlation between the unobservable variables that influence both overeducation and
formality/informality, are summarized in Table 3. These results correspond to the maximum
likelihood estimates obtained from the bivariate probit model described in section 3, using
instruments for the employment sector and the same set of control variables as those employed
in the univariate probit model. Here, the discussion focuses solely on the coefficients of the
equation for the probability of being overeducated since the estimates obtained for the
parameters in the formal/informal sector equation (see Table A1 in the appendix) are relatively
standard, and largely conform to results reported elsewhere (Magnac 1991; Pradhan and van
Soest 1995). Below, we first examine the entire sample of Colombian workers, and then discuss
the differences that emerge between the samples of male and female workers.
The coefficient of the formal sector and the corresponding marginal effect are estimated to
be negative and highly significant. In fact, the magnitude of the marginal effect of working in the
formal sector estimated from the bivariate probit model is substantially higher than that estimated
by the univariate probit model. The results suggest that, for otherwise similar workers, working in
the formal sector reduces the probability of overeducation by 16.44 pp. This finding confirms that
selection bias strongly affects the estimate of the effect of the employment sector on the
probability of being overeducated and, hence, the need to account for it. On the other hand, it
seems that, in addition to the benefits associated with receiving social security and higher wages,
being a formal worker also ensures a better use of one’s skills in the workplace. Or, alternatively,
informal workers, in addition to receiving lower wages and no health and pension cover, are less
likely to make proper use of their acquired knowledge in the workplace. As discussed in the
introduction, to the best of our knowledge this finding has not previously been recorded, and
represents a novel contribution of this study.

Research Institute of Applied Economics Working Paper 2013/05, pàg.19 Regional Quantitative Analysis Research Group Working Paper 2013/03, pag. 19
19
Note that the estimate of (correlation between the error terms of the overeducation and
the employment sector equations) is positive and statistically significant, suggesting that non-
observable characteristics that exert a positive effect on the probability of being formal employed
also have a positive impact on the probability of being overeducated. This could be interpreted as
evidence that in the case of formal workers overeducation is caused, to some extent, by the
desire to form part of the formal sector (better employment opportunities, social system
protection, etc.). A worker with a certain level of education might take a job for which less
education is actually required, simply because that job is protected, for example, by the minimum
wage.
An alternative interpretation of the positive effect of unobservable factors on the
probability of being overeducated can be made from within an internal labor market framework
(Doeringer and Piore 1972). Internal labor markets are those in which workers are hired into
entry-level jobs, while higher levels are filled from within. Certain rules differentiate the members
of the internal labor market from outsiders and accord them rights and privileges that would not
otherwise be available. Typically these internal rights include certain guarantees of job security
and opportunities for career mobility. If an internal labor market exists, then there must be some
jobs, presumably at high levels, that are filled almost exclusively through internal promotion and
there must be other port-of-entry jobs, presumably at low levels, that are filled through external
hiring. In this context, individuals in any given firm are hired into its lower or middle levels and
subsequently succeed in advancing to higher levels. Workers that do not have the qualifications
for particular entry-level jobs are thus excluded from accessing the entire job ladder. For this
reason, workers may initially accept a job for which their actual education is higher than that
actually required in exchange for the benefits of gaining access to an internal labor market. It
should be stressed that internal labor markets operate in the primary sector (formal) rather than in
the secondary sector (informal).
As for the estimate of the coefficients, and the associated marginal effects of the other
observable characteristics in the overeducation equation, they are, in general, roughly identical to
those estimated with the univariate probit, with the exception of firm size. The estimates from the
bivariate probit model indicate that compared to individuals working for micro-firms (those with
less than 10 workers), workers in small, medium and large firms are more likely to be
overeducated. This result can be interpreted as follows: large firms usually have better job
opportunities (as well as paying higher wages), and workers have better chances of being
promoted and of receiving more on-the-job training. These characteristics mean that job offers

Research Institute of Applied Economics Working Paper 2013/05, pàg.20 Regional Quantitative Analysis Research Group Working Paper 2013/03, pag. 20
20
from large firms are valued highly by job seekers who might apply for vacancies in which the
required level of education is less than the one they have acquired. Likewise, large firms in the
formal sector are in a position to select the most highly skilled from the pool of available workers.
Yet, it should be pointed out that the impact on overeducation is weaker in the case of medium
size firms (between 50 and 100 workers), where the coefficient is not, in fact, statistically
significant.
Finally, we should stress that the results by gender point to a substantial difference in the
impact of the sector on the probability of being overeducated. Whereas, for a male, having a
formal job reduces the propensity of overeducation by 20.09 pp compared to a similar informal
male worker, for females the effect is lower, 10.71 pp and its only statistical significance at the
5% confidence level. Interestingly, for the female workers we do not find a significant correlation
between the errors of the two equations in contrast with the highly significant correlation
coefficient for males.
5. Robustness checks. Validity of the instruments
The estimates of the bivariate probit presented in Table 3 are consistent and unbiased as long as
the instruments are correlated with the probability of working in formal or informal sector but not
with the error term of the over-education equation in (2). In order to investigate if the selected
instruments are valid we implement a procedure suggested by Cohen-Zadar and Elder (2009)
and also implemented by Kim (2011). This approach is based on the idea that the instruments,
presence of children and average years of education of the other members of the household,
exert an effect on the probability of over-education only through the sector, if it is formal or
informal, but not directly. If the instruments do not influence the probability of overeducation apart
from its effect on the sector, it should have no effect in the overeducation in a subsample of
workers for whom the probability of working in either informal or formal jobs is closely to zero.
One can argue that public employees are a specific group of workers for whom the
probability of working in informal jobs is approximately zero.9 Then, for this subsample of workers,
the instruments should have no effect in the probability of being overeducated. Table 4 reports
9 As a matter of fact, only 3.9% of the public employees report that they don’t make contribution to the health and old insurance system in contrast with the 33% of workers from private firms.

Research Institute of Applied Economics Working Paper 2013/05, pàg.21 Regional Quantitative Analysis Research Group Working Paper 2013/03, pag. 21
21
the effects of the educational achievement of other members of the household and the presence
of children estimated from a probit overeducation equation for public employees, conditioning on
the other set of controls used for the estimates of the probit overeducation equation for private
employees in Table 3. Results in Table 4, for the total sample and for women working in the
public sector, confirm that the coefficients of the instruments are not statistically significant, which
means that the instruments do not exert a direct effect on the probability of being overeducated.
In the case of men the educational achievement of other members of the household is statistical
significant only at 5% but its marginal effect is considerably low -0.0075. Although an insignificant
estimate for the coefficient associated to this variable is not guarantee of exogeneity, it does
provide some evidence that its use as an instrument is likely not to be problematic.
Last as a sensitive analysis for the IV estimates, we estimate the effect of the sector of
employment on the probability of being overeducated using different set of the instruments. This
sensitive analysis is presented in Table 5. For simplicity, and for purposes of comparison, the
estimates of Table 3 are presented in column [1]. The results of the biprobit when using only the
average years of education of the other members of the household as an instrument are
summarized in column [2], whereas those using only the presence of children as an instrument
are shown in column [3]. As it can be seen the results reported in Table 5 shows that the
estimated effect of the sector of employment on the probability of being overeducated is fairly
robust to the set of instrument chosen. Still, in the entire sample and for males, the effect of the
sector of employment is estimated to be lower when using as instruments only the dummies for
the presence of children. In the sample of females, none of the two types of instruments provides
with a significant estimate of the effect of the sector of employment.
6. Conclusions
This study has sought to add to the overeducation literature examining developing countries by
analyzing the connection between labor market segmentation (the modern, protected, formal
sector, on the one hand, and the traditional, unprotected, informal sector, on the other) and
overeducation in Colombia. To date, studies concerned with informality in developing countries
have focused primarily on the size of this sector, on the effects of labor market rigidities on
employment, wages and their distribution, and on the probability of a worker entering the informal
sector. However, no attention has been paid to the effects that a large informal sector has on the

Research Institute of Applied Economics Working Paper 2013/05, pàg.22 Regional Quantitative Analysis Research Group Working Paper 2013/03, pag. 22
22
way workers match their education with that required to perform their particular jobs. This study
offers some new evidence in this respect.
Using micro-data for Colombia, we have estimated two types of empirical models in order
to test the relationship between overeducation and informality: a simple univariate probit model
for the probability of being overeducated that includes the sector in which the individual is
employed as an explanatory factor, formal or informal; and a bivariate probit model with an
endogenous regressor that considers that the assignment of workers to each of the sector is not
random and some unobservable factors which influence the probability of choosing a particular
sector, could also affect the probability of being overeducated. The results of the univariate probit
estimation indicate that formal workers are less likely to be overeducated than their informal
counterparts. However, we have also shown that the assignment of workers to the formal or
informal jobs is not random and that some unobservable characteristics that influence the
probability of choosing a particular sector also affect the probability of being overeducated,
particularly as regards male workers.
The results obtained from the bivariate probit model for the probability of overeducation,
once the potential endogeneity of sector choice and overeducation were taken into account,
confirm that formal workers are less likely to be overeducated and that non-observable
characteristics that exert a positive effect on the probability of being a formal worker have a
positive impact on the probability of being overeducated, in the case of male workers only. This
could be interpreted as evidence that for formal male workers, overeducation is caused, at least
in part, by a desire to have a formal job (better employment opportunities, social system
protection, etc.). A worker with a good education may take a job for which less education is
required, because that job is protected, for example, by the minimum wage.
Although we are aware that our results have some shortcomings, including the standard
criticism on the suitability of instruments, we believe that they are conclusive in terms of the
correlations reported and in providing an initial understanding of the importance of the effect of
labor market segmentation on the probability of being overeducated. According to our results it
seems that, in addition to the benefits associated with receiving social security and earning higher
wages, being a formal worker also ensures a better use of acquired skills in the workplace. To the
best of our knowledge, no study has presented evidence of this to date.

Research Institute of Applied Economics Working Paper 2013/05, pàg.23 Regional Quantitative Analysis Research Group Working Paper 2013/03, pag. 23
23
References
Abbas, Q. 2008. “Over-education and Under-education and Their Effects on Earnings: Evidence from Pakistan,1998–2004.” SAARC Journal of Human Resource Development 4: 109–125. Alba-Ramírez, A. 1993. “Mismatch in the Spanish Labor Market: Overeducation?” The Journal of Human Resources 28: 259-278. Alpin, C., Shackleton, J. R., & Walsh, S. 1998. “Over- and Undereducation in the UK Graduate Labour Market.” Studies in Higher Education 23: 17-34. Amaral, P. S., & Quintin, E. 2006. “A Competitive Model of the Informal Sector.” Journal of Monetary Economics 53: 1541-1553. Amuedo�Dorantes, C. 2004. “Determinants and Poverty Implications of Informal Sector Work in Chile.” Economic Development and Cultural Change 52:347-368. Attanasio, O., Goldberg, P. K., & Pavcnik, N. 2004. “Trade Reforms and Wage Inequality in Colombia.” Journal of Development Economics 74: 331-366. Badaoui, E., Strobl, E., & Walsh, F. 2008. “Is There an Informal Employment Wage Penalty? Evidence from South Africa. ” Economic Development and Cultural Change 56: 683-710. Battu, H., Belfield, C., & Sloane, P. 2000. “How Well Can We Measure Graduate Overeducation and Its Effects?” National Institute Economic Review 171: 82–93. Bauer, T. K. 2002. “Educational Mismatch and Wages: A Panel Analysis.” Economics of Education Review 21: 221-229. Becker, Gary S. 1964. Human Capital: A Theoretical and Empirical Analysis with Special Reference to Education. New York: Columbia University Press. Berry, A., & Sabot, R. H. 1978. “Labour Market Performance in Developing Countries: A Survey.” World Development 6:1199-1242. Buchel, F., & van Ham, M. 2003. “Overeducation, Regional Labor Markets, and Spatial Flexibility.” Journal of Urban Economics 53: 482-493. Botelho, F. & Ponczek, V. 2011. “Segmentation in The Brazilian Labor Market.” Economic Development and Cultural Change” 59: 437-463. Castillo, M. 2007. “Desajuste Educativo por Regiones en Colombia: ¿Competencia por Salarios o por Puestos de Trabajo?” Revista Cuadernos de Economía 26: 107–145.

Research Institute of Applied Economics Working Paper 2013/05, pàg.24 Regional Quantitative Analysis Research Group Working Paper 2013/03, pag. 24
24
Charlot, O., & Decreuse, B. 2005. “Self-Selection in Education with Matching Frictions.” Labour Economics 12: 251-267. Chevalier, A. 2003. “Measuring Over-education.” Economica 70: 509-531. Cohen-Zada, D., & Elder, T. 2009. “Historical Religious Concentrations and the Effects of Catholic Schooling.” Journal of Urban Economics 66: 65-74. Devillanova, C. 2012. “Over-Education and Spatial Flexibility: New Evidence From Italian Survey Data.” Papers in Regional Science, in press. Doeringer, P., & Piore, M. 1971. Internal Labor Markets and Manpower Analysis. Lexington, Mass.: Heath. Dolton, P., & Vignoles, A. 2000. “The Incidence and Effects of Overeducation in the U.K. Graduate Labour Market.” Economics of Education Review 19: 179-198. Duncan, G. J., & Hoffman, S. D. 1981. “The Incidence and Wage Effects of Overeducation.” Economics of Education Review 1: 75-86. Dominguez Moreno, J. A. 2009. “Sobreeducación en el Mercado Laboral Urbano de Colombia para el Año 2006.” Revista Sociedad y Economía 16:139-158. Duryea, S., Galiani, S., Nopo, H., & Piras, C. C. 2007. “The Educational Gender Gap in Latin America and the Caribbean.” IDB Working Paper no. 502, Inter-American Development Bank, Washington, DC. Evans, W. N., & Schwab, R. M. 1995. “Finishing High School and Starting College: Do Catholic Schools Make a Difference.” Quarterly Journal of Economics 110: 947-974. Flórez, C. E. 2002. “The Function of the Urban Informal Sector in Employment: Evidence from Colombia 1984-2000.” Documento CEDE no. 2002-04, Universidad de Los Andes, Bogotá D.C. Gindling, T.H. 1991. “Labor Market Segmentation and the Determination of Wages in the Public, Private-Formal, and Informal Sectors in San José, Costa Rica.” Economic Development and Cultural Change 39: 585. Goldberg, P. K., & Pavcnik, N. 2005. “Trade, Wages, and the Political Economy of Trade Protection: Evidence from the Colombian Trade Reforms.” Journal of International Economics 66: 75-105. Gong, X., & Van Soest, A. 2002. “Wage Differentials and Mobility in the Urban Labor Market: A Panel Data Analysis for Mexico.” Labour Economics 9: 513-529. Green, F., McIntosh, S., & Vignoles, A. 2002. “The Utilization of Education and Skills: Evidence from Britain.” The Manchester School 70: 792-811. Groot, W., & van den Brink, H. 2000. “Skill mismatches in the Dutch labor market.” International Journal of Manpower 21: 584–595.

Research Institute of Applied Economics Working Paper 2013/05, pàg.25 Regional Quantitative Analysis Research Group Working Paper 2013/03, pag. 25
25
Hartog, J., & Oosterbeek, H. 1988. “Education, Allocation and Earnings in the Netherlands: Overschooling? ” Economics of Education Review, 7:185-194. Harris, J.R., & Todaro, M.P. 1970. “Migration, Unemployment and Development: A Two-Sector Analysis.” American Economic Review 60: 126–142. Hill, M. A. 1983. “Female Labor Force Participation in Developing and Developed Countries-- Consideration of the Informal Sector.” The Review of Economics and Statistics 65: 459-468. Kiker, B. F., Santos, M. C., & de Oliveira, M. M. 1997. “Overeducation and Undereducation: Evidence for Portugal.” Economics of Education Review 16: 111-125. Kim, Y.-J. 2011. “Catholic Schools or School Quality? The Effects of Catholic Schools on Labor Market Outcomes.” Economics of Education Review 30: 546-558. Kugler, A., & Kugler, M. 2009. “The Labor Market Effects of Payroll Taxes in a Middle Income Country: Evidence from Colombia.” Economic Development and Cultural Change 57: 335-358. Leuven, E., & Oosterbeek, H. 2011. “Overeducation and Mismatch in the Labor Market.” In Handbook of the Economics of Education, vol 4, ed. Eric A. Hanushek, Stephen Machin and Ludger Woessmann 283-326. Amsterdam: Elsevier Science. Magnac, T. 1991. “Segmented or Competitive Labor Markets.” Econometrica 59: 165–187. Maloney, W. F. 2004. “Informality Revisited.” World Development 32: 1159-1178. Maloney, W. F., & Núñez, J. 2004. “Measuring the Impact of Minimum wages: Evidence from Latin America.” In Law and Employment: Lessons from Latin America and the Caribbean, ed. James Heckman & Carmen Pagés, 109–130. Chicago: The University of Chicago Press. Marcouiller, D., Ruiz de Castilla, V., & Woodruff, C. 1997. “Formal Measures of the Informal-Sector Wage Gap in Mexico, El Salvador, and Peru.” Economic Development and Cultural Change 45: 367-392. Mavromaras, K., & McGuinness, S. 2012. “Overskilling Dynamics and Education Pathways.” Economics of Education Review 31: 619-628. McGoldrick, K., & Robst, J. 1996. “Gender Differences in Overeducation: A Test of the Theory of Differential Overqualification.” American Economic Review 86: 280-284 McGuinness, S. (2003). “Graduate overeducation as a sheepskin effect: Evidence from Northern Ireland.” Applied Economics 35: 597–608. McGuinness, S. 2006. “Overeducation in the Labour Market.” Journal of Economic Surveys 20: 387-418. Mehta, A., Felipe, J., Quising, P., & Camingue, S. 2011. “Overeducation in Developing Economies: How Can We Test for It, and What Does It Mean?” Economics of Education Review 30: 1334-1347. Mendes de Oliveira, M., Santos, M. C., & Kiker, B. F. 2000. “The Role of Human Capital and Technological Change in Overeducation.” Economics of Education Review 19: 199-206.
Research Institute of Applied Economics Working Paper 2013/05, pàg.26 Regional Quantitative Analysis Research Group Working Paper 2013/03, pag. 26
26
Mondragón-Veléz, C., Peña, X., & Wills, D. 2010. “Labor Market Rigidities and Informality in Colombia.” Journal of LACEA economia, LACEA - LATIN AMERICA AND CARIBBEAN Rumberger, R. 1987. “The Impact of Surplus Schooling on Productivity and Earnings.” Journal of Human Resources 22: 24–50. Sicherman, N. 1991. “Overeducation in the Labor Market.” Journal of Labor Economics 9: 101–122. Sicherman, N., & Galor, O. 1990. “A Theory of Career Mobility.” Journal of Political Economy 98: 169–192. Tansel, A. 2000. “Formal versus Informal Sector Choice of Wage Earners and Their Wages in Turkey.” In Informal Sector, ed. T. Bulutay. Vol. 1. Ankara: State Institute of Statistics. Thurow, L. C. 1975 . Generating Inequality. New York: Basic Books. Tinbergen, J. 1956. “On the Theory of Income Distribution.” Weltwirtchaftliches Archiv 77: 156–175. Tsang, M. C., Rumberger, R. W., & Levin, H. M. 1991. “The Impact of Surplus Schooling on Worker Productivity.” Industrial Relations: A Journal of Economy and Society 30: 209-228. Verdugo, R., & Verdugo, N. 1989. “The Impact of Surplus Schooling on Earnings.” Journal of Human Resources 24: 629–643. Wooldridge, J. M. 2002. Econometric Analysis of cross section and panel data. Cambridge,MA: MIT Press.

Research Institute of Applied Economics Working Paper 2013/05, pàg.27 Regional Quantitative Analysis Research Group Working Paper 2013/03, pag. 27
27
Table 1. Descriptive statistics for the main variables in the analysis
Total Sample Men Women Variable Total Informal Formal Total Informal Formal Total Informal FormalOvereducation 0.15 0.12 0.17 0.16 0.12 0.18 0.15 0.11 0.17 Informal 0.33 - - 0.35 - - 0.31 - -
Age (years) 33.93 32.38 34.69 34.09 32.19 35.11 33.71 32.67 34.17 Experience (years) 17.97 18.23 17.85 18.77 18.64 18.84 16.91 17.60 16.60 Tenure (months) 48.56 27.51 59.00 48.69 27.92 59.84 48.39 26.90 57.94 Women 0.43 0.40 0.44 - - - - - - Married 0.53 0.48 0.55 0.61 0.54 0.65 0.41 0.39 0.42 Household Head 0.40 0.37 0.41 0.54 0.47 0.58 0.21 0.23 0.21 Educational Attainment Basic Primary or below 0.13 0.23 0.08 0.17 0.28 0.11 0.09 0.16 0.05 Basic secondary 0.14 0.22 0.10 0.17 0.25 0.13 0.10 0.17 0.07 Secondary 0.36 0.37 0.36 0.38 0.34 0.39 0.35 0.41 0.32 Higher education or more 0.36 0.18 0.45 0.28 0.13 0.37 0.46 0.26 0.56 Education (years) 10.96 9.16 11.85 10.32 8.55 11.27 11.80 10.07 12.57 Occupation Unskilled 0.33 0.42 0.28 0.48 0.60 0.41 0.13 0.15 0.12 Professionals and Technicians 1 0.07 0.02 0.09 0.07 0.02 0.09 0.06 0.02 0.09 Professionals and Technicians 2 0.05 0.04 0.05 0.03 0.03 0.04 0.07 0.06 0.07 Managers and Public Officials 0.03 0.02 0.04 0.03 0.01 0.04 0.04 0.03 0.04 Administrative Staff 0.20 0.14 0.24 0.14 0.10 0.16 0.28 0.19 0.33 Merchant and Vendor 0.17 0.18 0.16 0.12 0.13 0.12 0.22 0.26 0.21 Service Worker 0.16 0.18 0.15 0.13 0.10 0.14 0.20 0.29 0.15 Firm size Micro (1 -10 workers) 0.32 0.68 0.15 0.33 0.68 0.14 0.31 0.67 0.16 Small (11 - 50 workers) 0.22 0.18 0.24 0.22 0.18 0.24 0.22 0.18 0.23 Medium (51 - 100 workers) 0.07 0.03 0.09 0.07 0.04 0.09 0.06 0.03 0.08 Large (101 workers or more) 0.39 0.11 0.53 0.38 0.10 0.53 0.40 0.13 0.53 Sector Mining, electricity, gas and water 0.03 0.01 0.04 0.04 0.02 0.05 0.02 0.01 0.02 Industry 0.24 0.21 0.25 0.26 0.23 0.28 0.20 0.19 0.20 Construction 0.08 0.14 0.04 0.12 0.23 0.07 0.01 0.01 0.01 Sales, Hotels and Restaurants 0.28 0.36 0.24 0.26 0.31 0.24 0.31 0.44 0.26 Transportation 0.08 0.07 0.09 0.10 0.08 0.10 0.07 0.07 0.07 Financial Intermediation 0.12 0.07 0.14 0.12 0.08 0.14 0.13 0.07 0.15 Social Services 0.17 0.12 0.20 0.10 0.06 0.12 0.26 0.21 0.29 Observations 15104 5006 10098 8629 3013 5616 6475 1993 4482 Note. Figures are in percentages, excepting Age, Experience, Tenure and Education whose units of measurement are indicated in parenthesis.

Research Institute of Applied Economics Working Paper 2013/05, pàg.28 Regional Quantitative Analysis Research Group Working Paper 2013/03, pag. 28
28
Table 2. Estimates from the univariate probit over-education model Total Men Women
Coefficient Marginal
Effect Coefficient Marginal
Effect Coefficient Marginal
Effect Formal -0.1498** -0.0250** -0.1321* -0.0186* -0.1457* -0.0272* [0.0384] [0.0065] [0.0518] [0.0073] [0.0579] [0.0109] Schooling years 0.2409** 0.0401** 0.2700** 0.0381** 0.2166** 0.0404** [0.0056] [0.0012] [0.0078] [0.0017] [0.0087] [0.0018] Experience (years) 0.0096+ -0.0006+ -0.001 -0.0015 0.0190* 0.0011* [0.0056] [0.0003] [0.0081] [0.0004] [0.0082] [0.0005] Experience2 -0.0004* - -0.0002 - -0.0004+ - [0.0001] - [0.0002] - [0.0002] - Tenure (months) -0.0006 -0.0001 -0.0003 0 -0.0009 -0.0002 [0.0006] [0.0001] [0.0008] [0.0001] [0.0009] [0.0001] Tenure2 0 - 0 - 0 - [0.0000] - [0.0000] - [0.0000] - Women -0.2398** -0.0400** - - - - [0.0419] [0.0070] - - - - Married -0.0232 -0.0039 0.0111 0.0016 -0.0505 -0.0094 [0.0493] [0.0082] [0.0524] [0.0074] [0.0458] [0.0086] Women Married -0.001 -0.0002 - - - - [0.0661] [0.0110] - - - - Household head -0.049 -0.0082 -0.0283 -0.004 0.0744 0.0139 [0.0493] [0.0082] [0.0525] [0.0074] [0.0532] [0.0099] Women Household head 0.1782* 0.0297* - - - - [0.0712] [0.0119] - - - - Industry 0.0737 0.0123 0.1432 0.0202 -0.04 -0.0075 [0.0845] [0.0141] [0.1068] [0.0150] [0.1507] [0.0281] Construction 0.5034** 0.0839** 0.6339** 0.0894** -0.1767 -0.033 [0.0983] [0.0164] [0.1207] [0.0171] [0.2187] [0.0408] Sales, Hotels, Restaurants -0.1029 -0.0171 -0.1376 -0.0194 -0.0354 -0.0066 [0.0848] [0.0142] [0.1082] [0.0153] [0.1490] [0.0278] Transportation -0.3531** -0.0588** -0.4494** -0.0634** -0.1926 -0.0359 [0.0928] [0.0156] [0.1207] [0.0173] [0.1590] [0.0297] Financial Intermediation -0.4160** -0.0693** -0.5263** -0.0742** -0.2867+ -0.0535+ [0.0895] [0.0150] [0.1167] [0.0167] [0.1533] [0.0286] Social Services -0.4907** -0.0818** -0.7589** -0.1070** -0.3402* -0.0635* [0.0879] [0.0147] [0.1214] [0.0173] [0.1487] [0.0277] Firm Size Small -0.0271 -0.0045 -0.0945 -0.0133 0.0594 0.0111 [0.0428] [0.0071] [0.0584] [0.0082] [0.0640] [0.0120] Firm Size Medium -0.2150** -0.0358** -0.2305* -0.0325* -0.1645 -0.0307 [0.0662] [0.0110] [0.0896] [0.0126] [0.1012] [0.0189] Firm Size Large 0.0022 0.0004 -0.1092+ -0.0154+ 0.1421* 0.0265* [0.0414] [0.0069] [0.0573] [0.0081] [0.0609] [0.0114] Metropolitan Area Unemployment Rate 0.0054 0.0009 0.0049 0.0007 0.0082 0.0015 [0.0078] [0.0013] [0.0108] [0.0015] [0.0114] [0.0021] Constant -3.6861** - -3.9013** - -3.8544** - [0.1484] - [0.2000] - [0.2373] - Observations 15675 8890 6785
Log pseudolikelihood -5242.92 -2800.57 -2384.24 Note. Robust standard errors in [].+ p<0.1, * p<0.05, ** p<0.01

Research Institute of Applied Economics Working Paper 2013/05, pàg.29 Regional Quantitative Analysis Research Group Working Paper 2013/03, pag. 29
29
Table 3. Estimates from the bivariate probit model for the over-education equation Total Men Women
Coefficient Marginal
Effect Coefficient Marginal
Effect Coefficient Marginal
Effect Formal -0.9075** -0.1644** -1.1884** -0.2009** -0.5617* -0.1071* [0.1760] [0.0380] [0.2030] [0.0468] [0.2242] [0.0459] Schooling years 0.2509** 0.0454** 0.2750** 0.0465** 0.2250** 0.0429** [0.0056] [0.0021] [0.0080] [0.0030] [0.0094] [0.0026] Experience (years) 0.0122* -0.0002* 0.0079 -0.0009 0.0171* 0.0011* [0.0056] [0.0003] [0.0078] [0.0004] [0.0083] [0.0006] Experience2 -0.0004** - -0.0004+ - -0.0003 - [0.0001] - [0.0002] - [0.0002] - Tenure (months) 0.0007 0.0001 0.0009 0.0001 0.0004 0 [0.0006] [0.0001] [0.0008] [0.0001] [0.0011] [0.0001] Tenure2 0.0000 - 0 - 0 - [0.0000] - [0.0000] - [0.0000] - Women -0.2013** -0.0365** - - - - [0.0421] [0.0075] - - - - Married 0.0278 0.005 0.0647 0.0109 -0.0566 -0.0108 [0.0525] [0.0095] [0.0541] [0.0092] [0.0462] [0.0089] Women Married -0.0614 -0.0111 - - - - [0.0682] [0.0124] - - - - Household head -0.0661 -0.012 -0.0466 -0.0079 0.0792 0.0151 [0.0520] [0.0094] [0.0537] [0.0091] [0.0586] [0.0111]
Women Household head 0.1967* 0.0356* - - - - [0.0765] [0.0137] - - - - Industry 0.0362 0.0066 0.0902 0.0153 -0.0577 -0.011 [0.0847] [0.0153] [0.1046] [0.0176] [0.1511] [0.0289] Construction 0.3834** 0.0694** 0.4043** 0.0683** -0.1085 -0.0207 [0.1026] [0.0179] [0.1249] [0.0199] [0.2180] [0.0416] Sales, Hotels, Restaurants -0.1266 -0.0229 -0.1639 -0.0277 -0.0343 -0.0065 [0.0846] [0.0154] [0.1057] [0.0180] [0.1491] [0.0285] Transportation -0.3724** -0.0674** -0.4605** -0.0778** -0.2033 -0.0388 [0.0924] [0.0171] [0.1177] [0.0205] [0.1593] [0.0305] Financial Intermediation -0.4038** -0.0731** -0.4760** -0.0805** -0.2901+ -0.0553+ [0.0903] [0.0163] [0.1164] [0.0196] [0.1539] [0.0293] Social Services -0.5382** -0.0975** -0.8044** -0.1360** -0.3604* -0.0687* [0.0881] [0.0166] [0.1196] [0.0217] [0.1491] [0.0286] Firm Size Small 0.2540** 0.0460** 0.3062** 0.0518** 0.2190* 0.0418* [0.0765] [0.0154] [0.0982] [0.0194] [0.0986] [0.0198] Firm Size Medium 0.1438 0.0261 0.2765* 0.0467* 0.0326 0.0062 [0.1029] [0.0194] [0.1288] [0.0241] [0.1383] [0.0265] Firm Size Large 0.3624** 0.0656** 0.4151** 0.0702** 0.3382** 0.0645** [0.0901] [0.0186] [0.1147] [0.0233] [0.1129] [0.0232] Metropolitan Area Unemployment Rate -0.0005 -0.0001 -0.0051 -0.0009 0.0062 0.0012 [0.0079] [0.0014] [0.0106] [0.0018] [0.0118] [0.0022] Constant -3.4673** - -3.4839** - -3.7693** - [0.1702] - [0.2268] - [0.2544] - 0.4347** - 0.5987** - 0.2424+ - [0.1211] - [0.1670] - [0.1331] -
Observations 15104 8629 6475
Log pseudolikelihood -11384.32 -6346.62 -4952.43

Research Institute of Applied Economics Working Paper 2013/05, pàg.30 Regional Quantitative Analysis Research Group Working Paper 2013/03, pag. 30
30
Note. Robust standard errors in [].+ p<0.1, * p<0.05, ** p<0.01
Table 4. Reduced-form relationship between family characteristics and overeducation probability among public employees
Total Men Women
Coefficient Marginal
Effect Coefficient Marginal
Effect Coefficient Marginal
Effect
Average years of education other members -0.0169 -0.0036 -0.0385* -0.0075* -0.0057 -0.0013
[0.0117] [0.0025] [0.0192] [0.0037] [0.0155] [0.0035] Number of kids age 0 0.2367 0.051 0.226 0.0438 0.3455 0.0773
[0.1832] [0.0395] [0.2525] [0.0490] [0.2823] [0.0631] Number of kids age 1 0.0261 0.0056 -0.1384 -0.0268 0.3952 0.0884
[0.2318] [0.0500] [0.3191] [0.0617] [0.3319] [0.0741] Number of kids age 2 0.1287 0.0278 0.1939 0.0376 0.0395 0.0088
[0.2065] [0.0445] [0.3155] [0.0614] [0.2791] [0.0625] Number of kids age 3 -0.0103 -0.0022 0.1534 0.0297 -0.2101 -0.047
[0.1643] [0.0354] [0.2066] [0.0398] [0.2831] [0.0634] Number of kids age 4 0.105 0.0226 0.3126 0.0605 -0.49 -0.1097
[0.1679] [0.0362] [0.2156] [0.0415] [0.3222] [0.0721] Number of kids age 5 0.1433 0.0309 0.0563 0.0109 0.2933 0.0656
[0.1860] [0.0401] [0.2602] [0.0504] [0.2904] [0.0649] Number of kids age 6 -0.0861 -0.0186 -0.0475 -0.0092 -0.2374 -0.0531
[0.1948] [0.0420] [0.2894] [0.0560] [0.2814] [0.0632] Number of kids age 7 -0.0882 -0.019 -0.1797 -0.0348 0.0336 0.0075
[0.1528] [0.0330] [0.2163] [0.0418] [0.2103] [0.0471] Number of kids age 8 0.0324 0.007 -0.3145 -0.0609 0.2897 0.0648
[0.1690] [0.0365] [0.2365] [0.0457] [0.2189] [0.0489]
Wald Test - Joint Significance
�2 p-value �2 p-value �2 p-value
Average years of educ. 2.07 0.1501 4.01 0.0451 0.14 0.7115 Num. of kids age 0 - 8 3.48 0.9421 6.85 0.6531 9.54 0.3892 All instruments 5.73 0.8377 11.52 0.3182 9.76 0.4617
Observations 1823 882 938
Log pseudolikelihood -691.89739 -304.19913 -368.02025 Note. Robust standard errors in [].+ p<0.1, * p<0.05, ** p<0.01. Other explanatory variables, except the sector of employment, listed in Table 2 are also included in the regression

Research Institute of Applied Economics Working Paper 2013/05, pàg.31 Regional Quantitative Analysis Research Group Working Paper 2013/03, pag. 31
31
Table 5. Estimates of the sector of employment on over-education with different set of instruments
Total Biprobit - IV
[1] [2] [3] Formal job -0.1644** -0.1581** -0.1151**
[0.0380] [0.0438] [0.0434] 0.4657** 0.4406** 0.2991* [0.1211] [0.1395] [0.1390]
Men Biprobit - IV
[1] [2] [3] Formal job -0.2009** -0.2175** -0.1658**
[0.0468] [0.0459] [0.0718] 0.6911** 0.7440** 0.5529* [0.1670] [0.1642] [0.2527]
Women Biprobit - IV
[1] [2] [3] Formal job -0.1071* -0.0616 -0.0749+
[0.0459] [0.0444] [0.0419] 0.2473+ 0.109 0.1455 [0.1331] [0.1322] [0.1220]
Instruments Average years of education other members
Yes Yes
Num. Children 0 - 8 years old Yes Yes Note. Marginal effects are presented. The exogenous variables of individual’s characteristics, job’s characteristics and the unemployment rate of the metropolitan listed in Table 3 are included in all regressions. Robust standard errors are in []. + p<0.1, * p<0.05, ** p<0.01

Research Institute of Applied Economics Working Paper 2013/05, pàg.32 Regional Quantitative Analysis Research Group Working Paper 2013/03, pag. 32
32
Table A1. Estimates from the bivariate probit model for the job equation (formal=1) Total Men Women
Coefficient
Coefficient Coefficient
Schooling years 0.0720** 0.0597** 0.0889** [0.0051] [0.0063] [0.0084] Experience 0.0309** 0.0345** 0.0283** [0.0042] [0.0057] [0.0065] Experience2 -0.0006** -0.0006** -0.0006** [0.0001] [0.0001] [0.0002] Tenure (months) 0.0089** 0.0070** 0.0117** [0.0005] [0.0007] [0.0009] Tenure2 -0.0000** -0.0000** -0.0000** [0.0000] [0.0000] [0.0000] Women 0.1124** - - [0.0392] - - Married 0.1578** 0.1240* -0.0284 [0.0490] [0.0502] [0.0448] Women Married -0.2146** - - [0.0625] - - Household head 0.0123 0.0002 -0.0674 [0.0472] [0.0475] [0.0534] Women Household head -0.1344* - - [0.0668] - - Industry -0.1677+ -0.1422 -0.1744 [0.0895] [0.1025] [0.1754] Construction -0.4423** -0.4828** -0.3387 [0.0961] [0.1072] [0.2387] Sales, Hotels and Restaurants -0.0913 -0.0659 -0.0949 [0.0893] [0.1028] [0.1739] Transportation -0.156 -0.1542 -0.1814 [0.0965] [0.1112] [0.1860] Financial Intermediation 0.1458 0.1435 0.1448 [0.0964] [0.1131] [0.1829] Social Services -0.3247** -0.3393** -0.3206+ [0.0926] [0.1132] [0.1744] Firm Size Small 1.0304** 1.0576** 1.0007** [0.0319] [0.0418] [0.0499] Firm Size Medium 1.4108** 1.4002** 1.4456** [0.0556] [0.0698] [0.0925] Firm Size Large 1.6865** 1.7470** 1.6118** [0.0331] [0.0449] [0.0506] Metropolitan Area Unemployment Rate -0.0285** -0.0190* -0.0413** [0.0069] [0.0091] [0.0105]
Note. Robust standard errors in [].+ p<0.1, * p<0.05, ** p<0.01.

Research Institute of Applied Economics Working Paper 2013/05, pàg.33 Regional Quantitative Analysis Research Group Working Paper 2013/03, pag. 33
33
Table A1. Continued. Total Men Women
Coefficient
Coefficient Coefficient
Average years of education other members 0.0301** 0.0360** 0.0243** [0.0046] [0.0060] [0.0071] Number of kids age 0 -0.0916* -0.1150* -0.0344 [0.0439] [0.0528] [0.0771] Number of kids age 1 -0.0803+ -0.0920+ -0.0666 [0.0432] [0.0558] [0.0680] Number of kids age 2 -0.0573 -0.0053 -0.1549* [0.0429] [0.0553] [0.0692] Number of kids age 3 -0.0761+ -0.0594 -0.0871 [0.0449] [0.0562] [0.0732] Number of kids age 4 -0.0886* -0.0965+ -0.086 [0.0441] [0.0564] [0.0694] Number of kids age 5 -0.0534 -0.0158 -0.0797 [0.0453] [0.0580] [0.0724] Number of kids age 6 -0.0973* -0.0473 -0.1701* [0.0463] [0.0587] [0.0735] Number of kids age 7 -0.1567** -0.1384* -0.1752** [0.0435] [0.0579] [0.0658] Number of kids age 8 -0.1525** -0.0986 -0.2039** [0.0446] [0.0604] [0.0671] Constant -1.5313** -1.5984** -1.3881** [0.1395] [0.1748] [0.2426] Observations 15104 8629 6475 Note. Robust standard errors in [].+ p<0.1, * p<0.05, ** p<0.01.

Research Institute of Applied Economics Working Paper 2013/04, pàg. 5 Regional Quantitative Analysis Research Group Working Paper 2013/02, pag. 5