Embed Size (px)
Citation preview
1
Did the Introduction of Free Personal Care in
Scotland Result in a Reduction of Informal Care?
David Bell,
Department of Economics
Alison Bowes
Department of Applied Social Science
University of Stirling
Axel Heitmueller
London Business School,
IZA Bonn
May 2006
Abstract There are more than 5 million carers in the UK. These provide a vital low cost resource to support frail older people. Without their continued participation in caring activities, governments would face a steep increase in formal care costs. Therefore the issue of substitution between formal and informal care is a vital policy issue. This paper explores a recent “natural experiment” in care provision. In 2002, the Scottish Parliament agreed to provide personal care free of charge to all those in need of such care. This policy was not followed elsewhere in the UK. Social conditions and data resources are largely uniform throughout the UK; this permits a reasonably rigorous evaluation of the initial impact of the policy of free personal care on informal caring behaviour. Using a difference-in-difference methodology with the British Household Panel Survey, the authors show that informal caring in Scotland did not decrease relative to the rest of the UK after the substantial expansion in formal provision in Scotland. While the finding is in line with other international evidence, the paper argues that it may partly be explained by changes in the type of care that informal carers provide following the policy change.
Thanks are due to Elizabeth Roberts for invaluable research assistance and to the ESRC/Scottish Executive for research funding under award RES-342-25-0006.

2
Introduction
Informal caring provides a valuable source of support for frail older people. The size of the
population of the “oldest old” will increase substantially in most developed countries during
the next three decades and there will be increased demand for care, both formal and informal.
Formal care is provided either by the private sector or a government agency, while informal
care is provided by family and friends. There are no immediate financial transactions
associated with informal care costs, while formal care costs may be met by the individual, by
the family or friends, or by government. The relationship between the supply of formal and
informal care is of considerable interest to governments since in many countries, individuals
do not have adequate financial provision against the formal costs of the long-term care and
the state may be expected to be the provider of last resort.
This paper analyses the relationship between the supply of formal and informal care in the
context of a “natural experiment” in care provision in the UK that began in July 2002. This
was the provision of “free personal care” to those aged 65 and over in Scotland, who were
assessed by social services as being in need of such care. In England and Wales, countries
where the social and economic characteristics of carers and carees are very similar to those in
Scotland, disabled people were expected to continue to pay for any personal care they
received either privately or from social services.
We use a well-known longitudinal dataset, the British Household Panel Survey (BHPS),
which has a common structure throughout Great Britain and a boosted sample in Scotland, to
analyse the effects of this policy. Specifically, we use a difference-in-difference analysis to
test whether there was a change in informal caring behaviour following the introduction of the
free personal care policy.
The paper proceeds as follows: in Section 1, we examine recent relevant literature on informal
care. Section 2 further discusses the theoretical issues and suggests possible improvements. In
Section 3 we describe the context for our empirical work Section 4 describes our model and
results. Section 5 concludes.
3
Literature Review
There is an extensive social science literature covering the social, psychological and
economic aspects of informal caring. In economics attention has been given to transfers of
labour and income between disabled people and the family and/or friends who look after them
informally. Further work has examined household restructuring as a response to disability,
while another strand has considered how caring affects labour market activity and whether
caring disadvantages those wishing to access the labour market.
The policy motivation for these analyses lies in the importance of informal carers providing a
service to the disabled that would be extremely costly to replace with publicly funded formal
care. In the future, population ageing will increase the overall demand for care. Shifts away
from informal care could increase the demand for formal care and add to the fiscal stresses
caused by population ageing. Yoo, Battycharya, McDonald and Garber (2004) estimate that
the presence of a spouse caregiver is worth $28,840 per annum in reduced formal long-term
care costs, while the presence of a child caregiver is worth between $310 and $3830. Other
policy concerns involve the negative effect that informal caring may have on the income and
employment prospects of carers. For all of these reasons, the factors that influence the
provision of informal care are of considerable policy significance.
One key aspect of this debate is substitution between informal and formal care. If increased
public provision of care simply results in reduced informal caring, then the public costs of
care may rise substantially without discernible effect on older peoples’ well-being. The net
effect on public finances also depends on the additional tax revenues raised if informal carers
decrease care provision while increasing their labour market participation.
This section first examines theoretical aspects of the literature on informal caring and then

4
goes on to discuss empirical findings in relation to the substitution between formal and
informal care.
Recent contributions relating to the literature on substitution between formal and informal
caring include Stern (1995), Pezzin, Kemper and Reschosky (1996), Hoerger, Picone and
Sloane (1996), Pezzin and Schone (1999a), Pezzin and Schone (1999b), Engers and Stern
(2002). Their empirical applications have been to US datasets. Empirical analysis of informal
caring behaviour in Europe is much less advanced.
The context for the modelling of long-term care is the economics of the family. Families
typically are assumed to comprise a disabled parent and one or more children. The case of a
spouse caring for a disabled partner is not prominent in this literature, even though caring
activities are usually more intense with this form of caring arrangement.
The standard approach is to assume that the family optimises with respect to living
arrangements, private consumption, labour market participation, transfers between family
members, payments to formal care providers and informal caring. Optimisation depends on
the structure of the utility function(s) in the family. These have varied quite widely.
Hoerger, Picone and Sloane (1996) use a family utility function defined over three living
arrangements: living independently, forming a joint household or for the disabled parent to
enter a care home. In each setting, the amount of formal and informal care provided directly
enters the utility function. Pezzin and Schone (1999a) argue that the family decision making
framework is untenable, since adult children and their elderly parents do not behave
consistently with the “common preference” model. They suggest that a bargaining approach
would be more suitable and use a Nash bargaining rule to determine family living
arrangements as well as care provision. In their model, the utility functions of the parent and
child both include the public good, W, which represents the parent’s state of health. This
device allows the carer to behave altruistically. W is responsive to the amount of formal and
5
informal care received and is conditional on the exogenous level of parental disability.
Further arguments in the utility functions may include tastes for independent living; these are
likely to differ between parent and child. The threat point for the Nash bargain is the level of
utility under the assumption of independent living. If utility gains to both parties exist relative
to independent living, then it is argued that a joint household will be formed.
Extending this model to include more than one child, Engers and Stern (2002) also use a
bargaining framework to determine which child(ren) will care for the disabled parent. In the
voluntary model, each child can decide whether to participate in the care decision. In the
collective model all children participate. Side payments may form part of the optimal strategy.
Each may contribute towards the care of the older person by direct care provision or in kind.
Choice of caring arrangements may reflect relative efficiencies in the production of care and
of goods as well as preferences for living independently.
Pezzin, Pollack and Schone (2005) construct a theoretical model of a two-stage bargaining
process where at the first stage the living arrangements of parent and children are determined,
while at the second stage the amounts of assistance given by each child are allocated. They
argue that children will be unwilling to commit to live jointly with the parent at the first stage
of the game because this decision weakens their bargaining power at the second stage. This
weighs the balance against joint residence arrangements even though they may be Pareto
efficient. Intervention in the form of subsidising the co-residing child or taxing the non co-
resident children may improve efficiency.
It is also important to identify who controls the resources available to family members. Pezzin
and Schone (1997) show that household expenditure patterns vary with such control. This
clearly has implications for government decisions whether to allocate cash transfers to carer
or caree. Bargaining outcomes within households may take the allocation of transfers as a
determinant of threat points and reservation utilities.
6
Having determined the structure and solution method for the inter-family caring arrangement,
different forms of budget constraint are added to the models. These usually involve the
allocation of the child(ren)’s time between work, leisure and informal caring. The income
generation potential of child(ren) may be affected by living arrangements. The parent may
also have sources of income, either from pensions or state transfers. Hoerger, Picone and
Sloane (1996) introduce income contingent state subsidised care payments into the parent’s
budget constraint.
In both the case of a family budget constraint and individual budget constraints, some income
is allocated to each family member’s private consumption. The remainder can be used to meet
the costs of formal care and of housing. With individual budget constraints, transfers between
carer and caree can be used to meet the costs of formal care.
Solving the constrained optimisation problem leads to a set of reduced form relationships that
can be estimated, given appropriate data. We now focus on how far these estimates are able to
shed light on the extent of substitution between formal and informal care. This evidence
extends beyond the literature just described. That is, some of the empirical estimates do not
derive their empirical strategy from a theoretical analysis of family behaviour. Most findings
are based on relatively small scale surveys specifically designed to analyse informal caring
behaviour within a particular policy and institutional framework.
The US National Long Term Care Demonstration (Carcagno and Kemper 1988) examined
how the structure of elderly care changed when services provided to the disabled living at
home were reorganised, extended and made more affordable. One of the key concerns in this
exercise was that increased home provision of formal care would reduce informal caring. An
experimental design was used with control and treatment groups.
Carcagano and Kemper suggested that improved information flows on the availability of
services had no effect on informal care provision. Increased funding for formal home care
7
services (reductions in their relative price) reduced the proportion receiving informal care by
6.5 per cent. This was mainly concentrated on care provided by neighbours and friends rather
than by relatives. Primary caregivers did not reduce their care even when the price of formal
provision was significantly reduced. In another study of the Long-Term Care Demonstration,
(Christianson 1988) concluded that: “a 5 per cent increase in percent receiving in-home
formal care services was associated with a 1 per cent decrease in the percent receiving
informal care”.
Pezzin, Kemper and Reschovsky (1996) used the same dataset, but their analysis permitted
the endogenous determination of living arrangements. Indirect effects on informal caring
caused by changes in living arrangements result in relatively small substitution effects. Only
unmarried individuals were significantly more likely to live independently as a result of
additional financial support for formal care provision.
Substitution effects, conditional on living arrangements, were small. In particular, there was
no evidence of a significant change on the hours of informal care provided, either for married
or unmarried carees. The correction term for living arrangements used in the hours equation
indicated that endogenous living arrangements lead to more informal care hours being
supplied than would be the case if reallocation was not permitted.
Pezzin and Schone (1999a) used the Hebrew Rehabilitation Centre for the Aged (HRCA)
Survey of the Elderly and the subsequent HRCA-NBER Child Survey to examine the labour
force participation and informal caring decisions of children, as well as decisions about co-
residence when a parent requires care. Their results were based on a set of 424 parent-child
pairs. They found that provision of formal care reduces the likelihood of joint living and thus
the provision of informal care. They used the results to simulate a stylised version of non
means-tested home care policy with features similar to policies adopted in states such as
Oregon, Washington and Massachusetts. Their results suggested that such a program would
8
reduce the probability of co-residence by 58 per cent and the provision of informal care by 46
per cent. This signifies a major reduction in informal caring behaviour as a result of the
policy change. They argue that their findings suggest that the negative impact of changes in
living arrangements and informal caring could reduce the total (formal plus informal) care
received by frail elderly persons.
Tennstedt, Crawford and McKinlay (1993) use longitudinal data from a seven-year study in
Massachusetts. They investigate the impact on informal caring of variations in the availability
of community services at little or no cost to older people. In particular, they focus on whether
informal hours decrease as formal hours increase. These transitions formed the focus of their
results. They subdivided care into six types, such as personal care, housekeeping etc. They
conclude that although some substitution was detected in the sample, there was no evidence
of strong substitution effects. There was some indication that substitution was more likely for
certain types of care than others. For example, informal carers were more likely to opt out of
arranging services for the disabled person.
Li (2005) used Michigan's Home- and Community-Based Medicaid Waiver Program over a 3
year period. She found an initial decline in informal caring just after the provision of publicly
paid home care. This decline, however, ended quite quickly. She argued that publicly
provided long-term care helps formal and informal carers to work together to support disabled
older people.
Thus, aside from Pezzin and Schone (1999a), the burden of evidence suggests that the
extent of substitution from informal to formal care when the price of formal care is
reduced is small. Existing theoretical models are certainly consistent with substitution
between formal and informal care. However the mechanisms are predicated on the
assumption that formal and informal carers supply the same services to the disabled
person. In the next section we suggest possible extensions to these models which provide
9
a richer explanation of why one might observe low rates of substitution.
Theoretical Developments
In this section we discuss some of the assumptions implicit in existing models of informal
care. Following from this analysis, we propose a different formulation for the production of
informal care which has application to the empirical analysis that follows.
The implicit assumptions in the family utility and Nash-bargaining models of informal care
include:
1. Well-functioning markets exist both for care homes and for care at home.
These markets are often characterised by uncertainty due to the role of public
providers. In many countries, it is the public sector that is the dominant provider of
formal care. Such public provision may be subject to substantial fluctuations due to
changes in budget allocations. The uncertainty caused by such fluctuations may deter
private providers from market entry.
2. These markets clear, implying no unmet demand for care.
There is an extensive literature in social policy on unmet need that is summarised, for
example, in Cordingley, Hughes and Challis (2001). One of the key issues in
determining the existence of unmet demand is the perspective from which need is
assessed. The economics literature tends to ignore this issue whereas the social policy
literature acknowledges that carees, carers and professionals may take different views
on an individual’s level of unmet demand. If public funds are to support care
provision, then it is likely that professional assessments will play a major role in
determining the allocation of formal care to the disabled person. Additional private
purchases of care will therefore be contingent on the difference between the
professional assessment and the individual or carer’s assessment of care needs.
10
Hoerger, Picone and Sloane (1996) is an exception. Their model allows for rationing
of care home places. Such rationing is dependent on state level variables such as the
relative supply of nursing home provision in the state, and the difference between
Medicaid and private care payments.
3. Identification of personal care needs is costless
Health economists approach to ill health involves uncertainty on the part of the
patient due to lack of understanding of the causes and remedies for his/her condition.
In contrast, the literature on care does not focus on uncertainty and assessment by a
medical practitioner and/or others. But care needs have both medical and social
aspects and are normally assessed by professionals in these disciplines. In practice
assessments play a key role in diagnosing chronic conditions associated with ageing
as well as defining the role of the informal carers.
4. All parties are capable of making rational decisions.
This is a difficult issue since the standard economic orthodoxy of rational decision
making is difficult to reconcile with the evidence of the large numbers of older people
with severe cognitive impairment. The evidence suggests that in 2002, 3.1 per cent of
English residents aged 75-84 suffered from severe cognitive impairment. This share
rose exponentially to 40.2 per cent of those aged 95+ (Wanless and Forder 2006).
5. Care is an undifferentiated service.
In practice, care is a spectrum of services which stretch from regular medical
interventions required by those with chronic conditions to domestic tasks such as
shopping and gardening. Formal care providers can specialise in certain aspects of
care. Disabled individuals consume the benefits provided by these services rather
than directly consuming formal care or informal care per se.
While existing models have concentrated on the determinants of living arrangements and on
11
the structure of family decision making, the implications of these other assumptions have not
been fully explored. Here we focus on the last of these issues, leaving the others for future
work. Thus we consider how to extend models of caring behaviour to include different forms
of care.
First, we would suggest that it is not formal or informal care that directly enters the disabled
person’s utility function, but rather the amounts of the care services produced through the use
of formal or informal care. Using a production function in implicit form and assuming n
forms of care output, we may write
1 1 1( ,.. , ... , ... ) 0n n n
g c c IC IC FC FC = (1)
where c1, c2,.. cn are the types of care produced, IC1 , IC2 …. ICn are informal care inputs to
the care types and FC1, FC2 …. FCn are the equivalent formal care inputs. Using the
subscripts P (D) to indicate the client (carer), their utility functions are, respectively
1
1 1 2
( , ( ,.. ; ), )
( , ( ,.. ; ), , .. , , )
P P n P
D D n n D
U X W c c D
U X W c c D IC IC IC L
φ
φ (2)
where X is private consumption and W is a public good that measures the disabled person’s
well-being or health. , IC1, IC2 …. ICn represent the (dis)utility that the carer incurs, which
varies over the type of care provided. We also introduceφ , which is a parameter reflecting
the client’s (carer’s) preferences over who provides care. This is a form of process utility and
reflects the observation that older people are more comfortable with carers whom they know,
particularly family members, while children may prefer to provide care directly rather than
pay for the equivalent quantity of formal care.
This way of describing care allows us to analyse substitution between formal and informal
care more extensively. We assume that formal care and informal care are only used in the
12
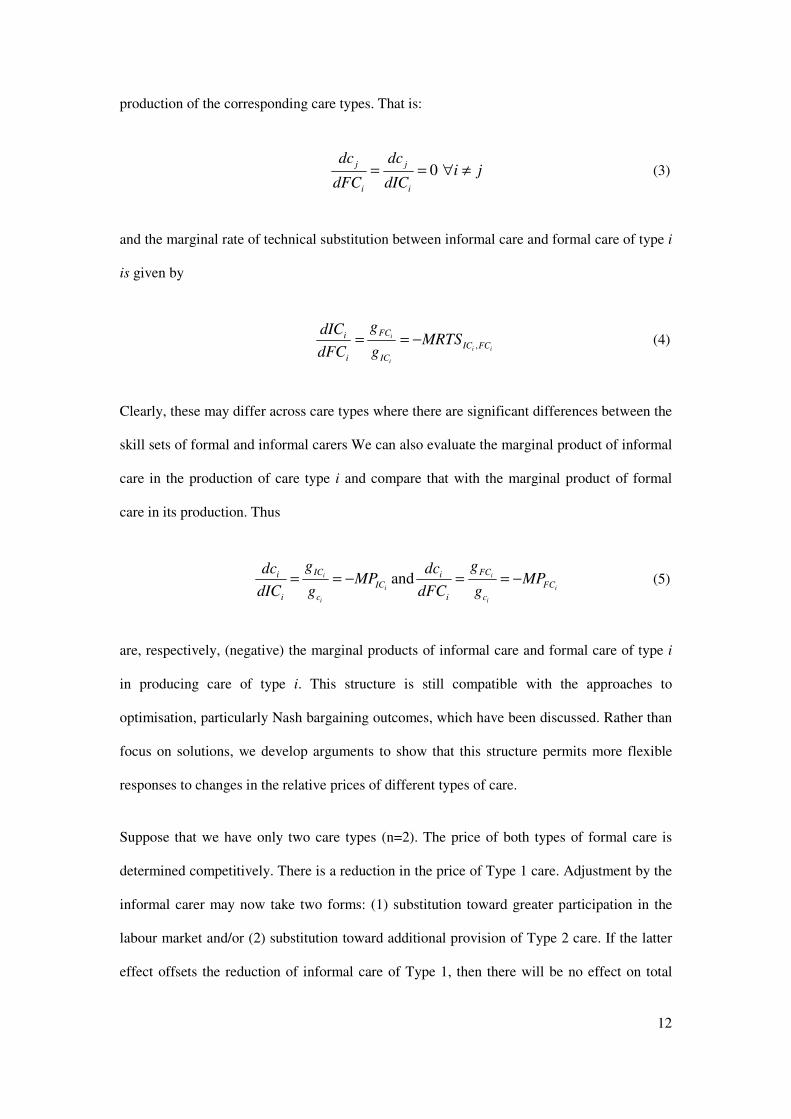
production of the corresponding care types. That is:
0j j
i i
dc dci j
dFC dIC= = ∀ ≠ (3)
and the marginal rate of technical substitution between informal care and formal care of type i
is given by
,i
i i
i
FCiIC FC
i IC
gdICMRTS
dFC g= = − (4)
Clearly, these may differ across care types where there are significant differences between the
skill sets of formal and informal carers We can also evaluate the marginal product of informal
care in the production of care type i and compare that with the marginal product of formal
care in its production. Thus
andi i
i i
i i
IC FCi iIC FC
i c i c
g gdc dcMP MP
dIC g dFC g= = − = = − (5)
are, respectively, (negative) the marginal products of informal care and formal care of type i
in producing care of type i. This structure is still compatible with the approaches to
optimisation, particularly Nash bargaining outcomes, which have been discussed. Rather than
focus on solutions, we develop arguments to show that this structure permits more flexible
responses to changes in the relative prices of different types of care.
Suppose that we have only two care types (n=2). The price of both types of formal care is
determined competitively. There is a reduction in the price of Type 1 care. Adjustment by the
informal carer may now take two forms: (1) substitution toward greater participation in the
labour market and/or (2) substitution toward additional provision of Type 2 care. If the latter
effect offsets the reduction of informal care of Type 1, then there will be no effect on total
13
informal care provided.
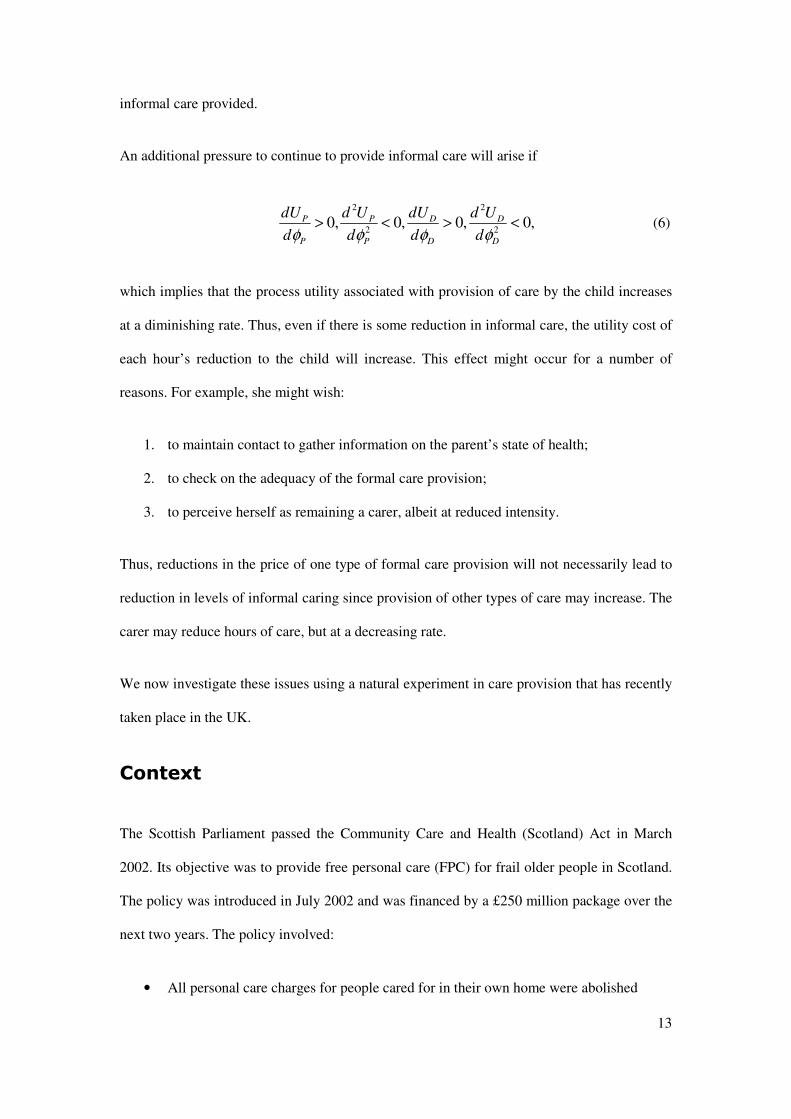
An additional pressure to continue to provide informal care will arise if
2 2
2 20, 0, 0, 0,P P D D
P P D D
dU d U dU d U
d d d dφ φ φ φ> < > < (6)
which implies that the process utility associated with provision of care by the child increases
at a diminishing rate. Thus, even if there is some reduction in informal care, the utility cost of
each hour’s reduction to the child will increase. This effect might occur for a number of
reasons. For example, she might wish:
1. to maintain contact to gather information on the parent’s state of health;
2. to check on the adequacy of the formal care provision;
3. to perceive herself as remaining a carer, albeit at reduced intensity.
Thus, reductions in the price of one type of formal care provision will not necessarily lead to
reduction in levels of informal caring since provision of other types of care may increase. The
carer may reduce hours of care, but at a decreasing rate.
We now investigate these issues using a natural experiment in care provision that has recently
taken place in the UK.
Context
The Scottish Parliament passed the Community Care and Health (Scotland) Act in March
2002. Its objective was to provide free personal care (FPC) for frail older people in Scotland.
The policy was introduced in July 2002 and was financed by a £250 million package over the
next two years. The policy involved:
• All personal care charges for people cared for in their own home were abolished
14
• Everyone needing nursing care received it free of charge
• For those cared for in a care home and who were funding the cost of their care, a
“free personal care” payment of £145 per week was provided
We wish to focus on the first of these provisions: the removal of all charges for personal care
to those being cared for in their own homes.
Personal care was defined to include:
• Personal hygiene such as bathing and showering;
• Continence management – help with toilet and skin care;
• Food and diet including assistance with eating;
• Help with mobility;
• Counselling and support services;
• Assistance with medication and simple treatments; and
• Personal assistance such as help getting up and into bed.
Personal care did not include help with domestic tasks such as shopping and gardening.
Hence it only covered part of the spectrum of care services that a disabled person might wish
to consume.
In passing this legislation, Scotland was the only part of the UK to put into practice the
recommendation of the Royal Commission on Long Term Care (1998) that personal care
should be free in all settings and should be paid through general taxation. The potential
financial impacts of the policy were evaluated in 2001 by the Scottish Executive. In assessing
its costs, one of the key issues was whether the provision of free personal care would result in
a reduction in the provision of informal care by friends and family and consequent increases
in the costs of providing formal care. Based on the evidence from the Channelling
Experiment, it was recommended that £10m be set aside to provide for substitution between
informal and formal care.
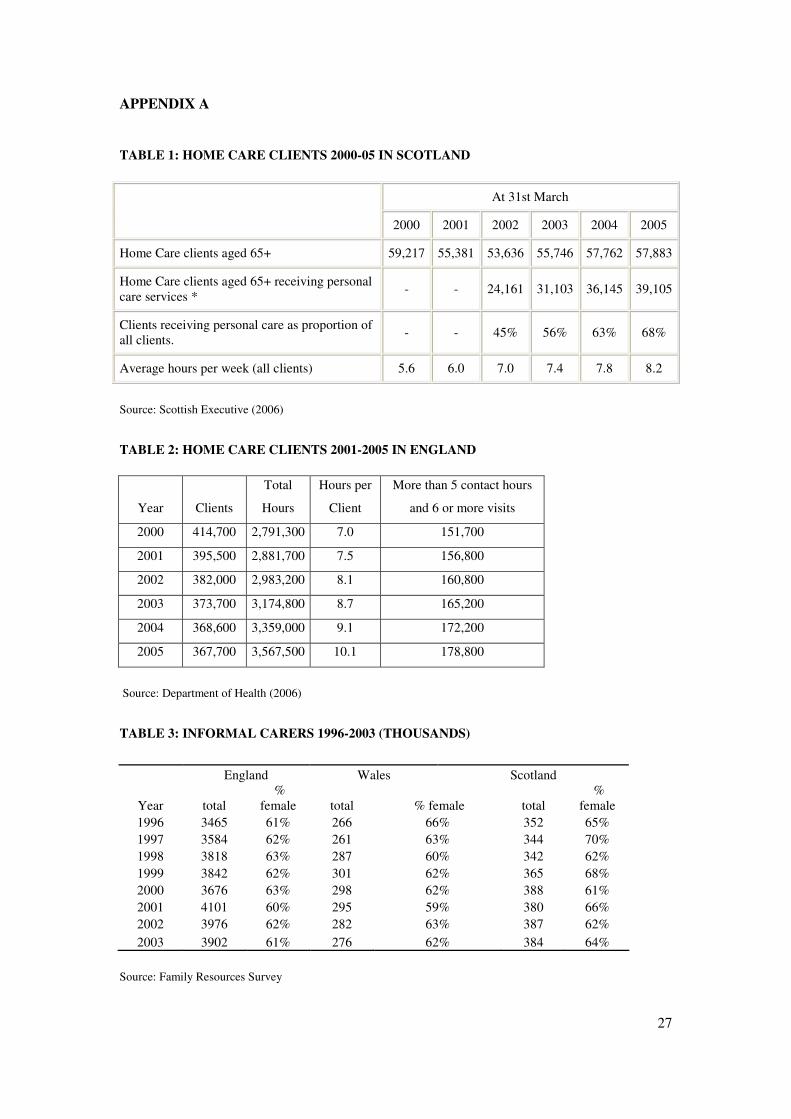
Throughout the UK, it is the responsibility of local authorities to deliver social care to
disabled individuals. Table 1 shows the number of clients receiving home care services
15
from local authorities in Scotland between 2000 and 2005 – before and after the introduction
of the policy. It indicates that the total number of home care clients receiving some service
has varied between 54 thousand and 59 thousand over this period. However the share of this
group receiving free personal care has increased rapidly from 45 per cent of the total when the
policy was first introduced, to 68 per cent in 2005. The average number of hours of care
received by clients has also increased significantly over the period, from 5.6 to 8.2 hours. And
expenditure on free personal care for home care clients rose from £116 million in 2003-04 to
£136 million in 2004-05 (Scottish Executive, 2006).
Table 2 shows broadly equivalent home care statistics for England. (England comprises
around 82 per cent of the population of the UK and therefore dominates the “Rest of the UK”
in comparisons between Scotland and the Rest of the UK). Administrative data on social care
are not collected on the same basis in Scotland and England. Personal care is not separately
identified in England though more intensive home care packages, which involve longer hours
and multiple visits, are shown. In England the data relate to all adults, while in Scotland those
aged 65 and over, to whom the free personal care policy applies, are identified. Care clients
aged 65 and over outnumber those aged less than 65 by around 5 to 1.
The data in Table 2 show that there was a substantial decline in the number of local authority
clients in England between 2000 and 20051. This may be due to a withdrawal by some local
authorities from some domestic home care activities such as help with shopping. However the
number receiving intensive care packages rose from 151 thousand to 178 thousand. Between
2000 and 2005, average hours per client rose more quickly in England (from 7.0 to 10.1 hours
per week) than in Scotland (from 5.6 to 8.2 hours per week).
1 Around 11% of home care hours in England are supplied by private providers to private clients (Mathew 2004 and Department of Health 2006)
16
In both areas the average hours per client data suggest that formal care provision has
increasingly focussed on intensive care packages. In Scotland these tend to involve personal
care, while in England, though data on personal care is not available, they involve frequent
visits and long weekly hours, which suggests that they are similar to the intensive care
packages being supplied in Scotland. The main difference between Scotland and England is
the decline in the total number of local authority clients in England compared with the broad
stability in client numbers in Scotland. The decline in England may have occurred for
budgetary reasons. This is quite possible because the method for allocating resources to local
authorities is quite different in Scotland and England.
There is no evidence of a sudden decline in demand in either jurisdiction. Indeed some
evidence (Wanless and Forder 2006) suggests that demand is rising and will continue to do
so. This is partly due to increases in unhealthy life expectancy and rising awareness and
expectations of public provision. Thus, the decline in local authority supply in England
suggests that demand has had to be met from other providers or there has been an increase in
unmet need.
The other important difference relates to charging. In England, individuals with assets in
excess of £12,500 (excluding housing assets) are expected to contribute towards their
personal care costs, while in Scotland since July 2002 these costs have been fully met by the
local authority. Thus, in Scotland, with the introduction of free personal care, there was a fall
in the price of formal care relative to England.
If there is a significant fall in the relative price of personal care in Scotland and a decline in
supply in England, what will happen to relative levels of informal caring? The most obvious
prediction would be that there would be a reduction in informal caring in Scotland relative to
England.
Table 3 presents data from the Family Resources Survey on informal caring in Scotland,

17
England and Wales during the period 1996 to 2003. The Family Resources Survey is an
annual cross-sectional survey of the income and circumstances of households in the UK,
covering around 29,000 households. This sample period covers two years after the
introduction of free personal care and does not show any significant relative change in the
number of informal carers in Scotland compared with England and Wales in 2002 and 2003.
Thus, there is no suggestion from these aggregate data of a change in informal caring
behaviour in Scotland following the introduction of free personal care. However, these
comparisons are based on unconditional means which do not allow for unobserved
heterogeneity. In the next section we test for relative changes in informal caring using the
British Household Panel Survey (BHPS) which allows us both to control for exogenous
influences on caring behaviour and for unobserved heterogeneity.
Model and Results
To capture any change in informal care behaviour following the introduction of free personal
care in Scotland, we employ a simple difference-in-difference approach to model whether an
adult provides care to a disabled person or not. In particular we estimate the following
equation:
ititit landstimelandstimexy εγϕδβ ++++= cot*cot* (7)
where the latent dependent variable is the probability that an individual provides informal
care to an elderly (aged 65 and over) disabled person, conditional on a set of explanatory
variables. These left-hand-side variables include a set of explanatory variables x, a time
dummy which is zero before the policy change and unity after, a location dummy for Scotland
and an interaction term of time and location. Hence, the main parameter of interest isγ ; a
significantly negative sign would indicate that informal care provision has declined in the

18
aftermath of the introduction of free personal care while a significantly positive sign would
suggest the opposite.
Though the left-hand-side variable is latent, we nevertheless estimate the models using a
linear formulation, adjusting for heteroscedasticty and correcting for unobserved
heterogeneity by using a fixed effects estimator. We also estimated probit models to check for
the robustness of the results and find very little difference.2
We include a series of exogenous variables to control for socio-economic status including
age, marital status, education, number of children in household, household size, ownership of
accommodation, number of disabled in household and own disability status. Estimations are
done separately for co-residential and extra-residential carers.
The implementation of (7) is based on data from BHPS from 1999 to 2003. Each year over
5,000 households consisting of roughly 10,000 individuals have been interviewed. Most of
these are re-interviewed in subsequent years, allowing us to follow their behaviour over time
for a maximum of 13 years. The BHPS offers a wide range of variables for our variables and
is nationally representative. Individuals are classified as carers if they provide an affirmative
answer to at least one of the following questions:
Co-residential carer: “Is there anyone living with you who is sick, disabled or
elderly whom you look after or give special help to? “
Extra-Residential carer: “Do you provide some regular service or help for any sick,
disabled or elderly person not living with you?“
2 A problem with estimating difference-in-difference models using non-linear estimators is that standard errors from these estimations are invalid and need to be adjusted (see Ai and Norton 2003). However, this is rather estimation-time consuming and results were very similar for the models in which we used both linear and non-linear estimators.

19
To account for the fact that free personal care is only available to those aged 65 and over
resident in Scotland, we restricted the care definition further. We distinguish between the co-
residential (within the home) and extra-residential (outside the home) carers. Information on
the age of the caree is available for co-residential carers in the BHPS but not for extra-
residential ones. For extra-residential care we used the age of the carer to infer the age of the
caree, given that we knew the relationship between carer and caree. Thus we included only
middle-aged individuals who care for a parent or parent in law or grandparent.
Our model abstracts from the endogeneity of living arrangements. This may be acceptable for
the short-run analysis that we are able to conduct at present, given that our data only cover
two years following the introduction of the policy. In the longer run, given that understanding
of the policy was initially limited and that new sets of decisions on living arrangements are
now being made as successive cohorts of older people require care, this may be a difficult
argument to maintain.
There is no evidence of actions taken in anticipation of the policy, such as movements of
older people requiring care from England to Scotland. This may be partly because the policy
was introduced quickly and its details were initially not well understood (Bell and Bowes
2006).
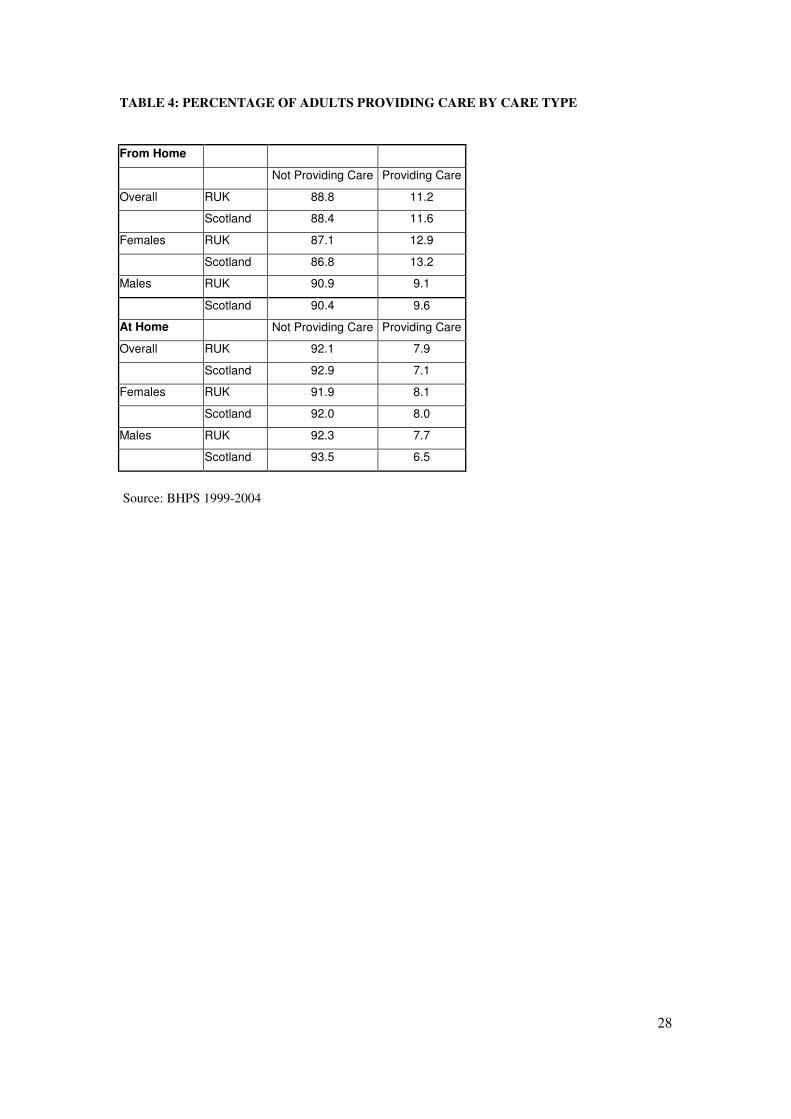
Table 4 summarises the care characteristics of the BHPS sample. It shows that around 11.3
per cent of all adults in GB provide extra residential care, while about 7.8 per cent provide
care at home. Subsumed within these groups is 1 percent of adults who provide care both
within and outside the home. In general females provide more care than males. The gender
imbalance is greatest for extra-residential caring.
Table 5 shows further characteristics of carers in Great Britain drawn from our BHPS sample.
Around 11 per cent of the adult population provides extra-residential care. This group
accounts for a slightly smaller share of full-time workers (9.9 per cent) and a larger share
20
(13.6 per cent) of part-time workers. These outcomes are consistent with the findings of
Heitmueller and Inglis (2004) who argue that informal carers face significant disadvantages in
the labour market, both in terms of labour market participation and wages. The causal links
between employment and care are also explored in Heitmueller and Michaud (2006).
There is a distinctive age pattern in both co-residential and extra-residential caring. Table 5
shows that extra-residential caring peaks in the age group 50-60, while for co-residential
caring there is a steady increase through retirement age. This reflects the higher prevalence of
caring for a spouse among co-resident carers. Finally, the shares by qualification of extra-
residential carers broadly mirror their population share, albeit with a slightly lower proportion
holding first degrees. In contrast, co-residential carers are much less well-qualified than the
population as a whole. Co-residential carers are, as we have already seen, likely to be older,
and therefore less likely to be well-qualified. However, the low level of educational
qualifications among co-resident carers may also stem from selection of cost-minimising
housing arrangements when opportunity costs in the labour market are relatively low.
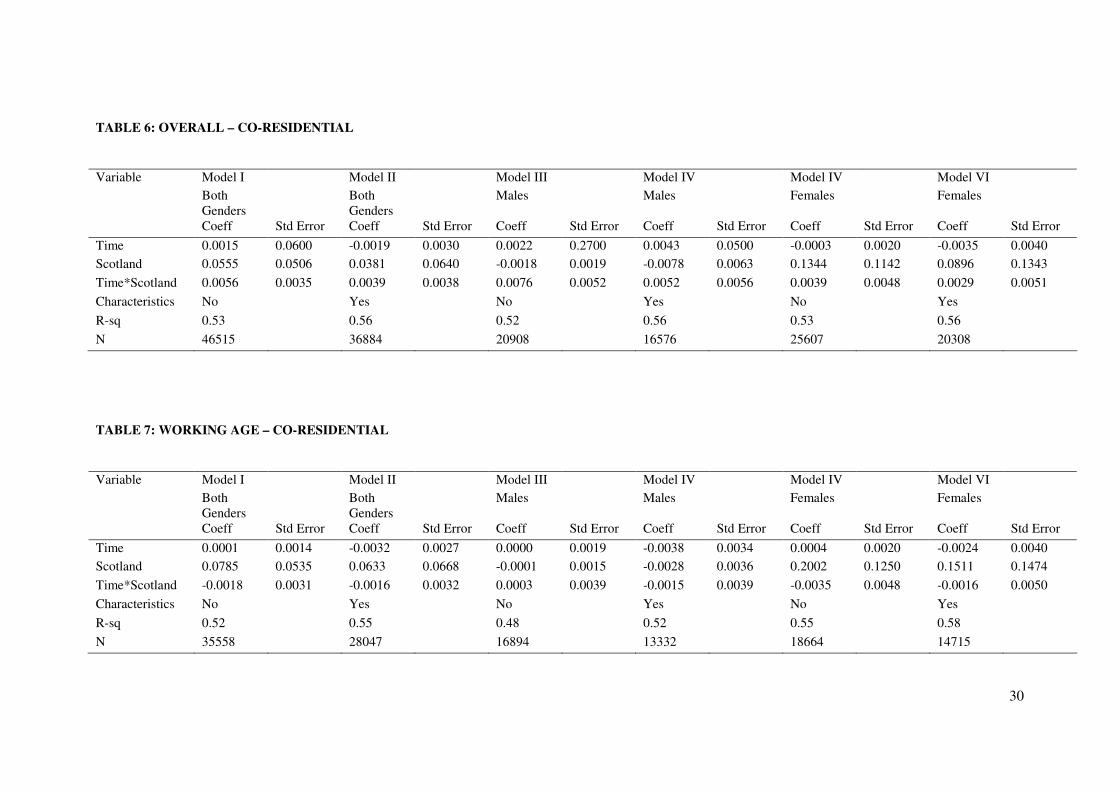
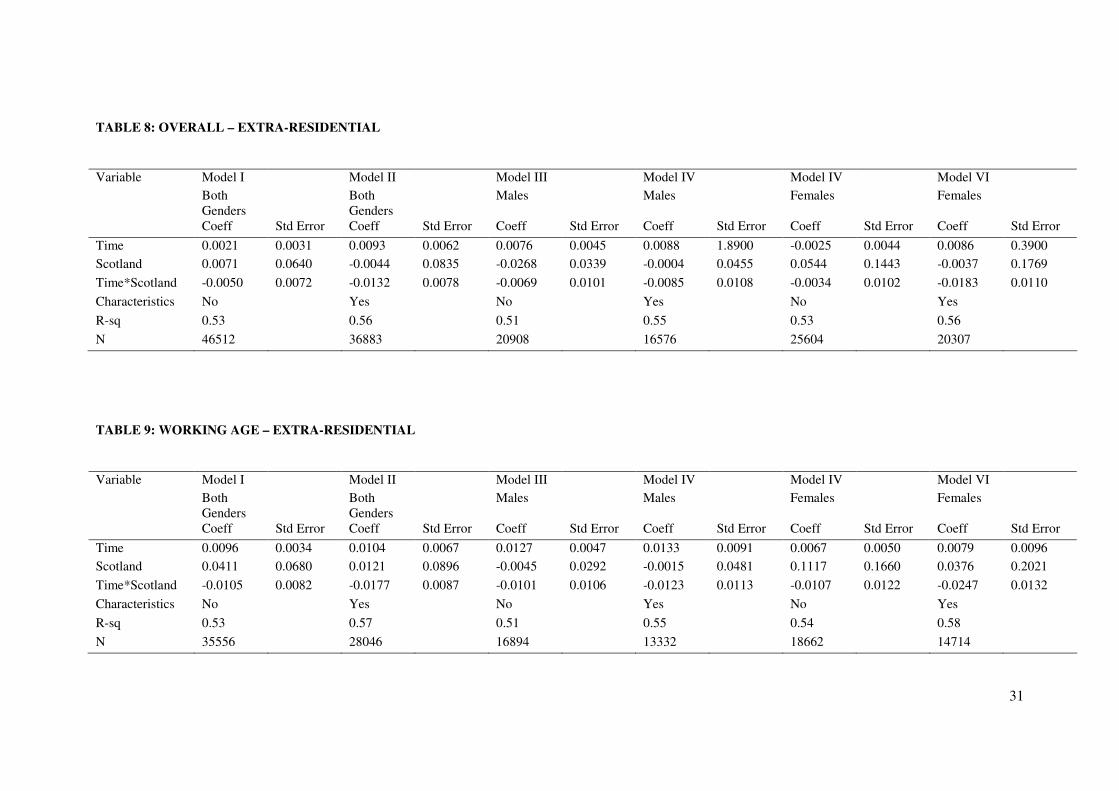
We now turn to our estimates of the effects of the introduction of free personal care on co-
residential and extra-residential caring. Tables 6 to 9 report our results for various versions of
equation (7). There are six dependent variables - each and both genders, and co-residential or
extra-residential carers. Each of these six cases is estimated with controls for additional
characteristics present or absent. Estimates are constructed for all adult respondents and then
the dataset is restricted to adults of working age to determine whether significantly different
behaviour is observed among carers that might be active in the labour market3.
As mentioned previously, our main concern is the sign and significance of the difference-in-
difference coefficient. For all models involving co-residential carers, none of the interaction
3 Cross-section weights are applied to rescale the booster sample for Scotland.

21
(diffindiff) terms is significant regardless of the model specification. In other words, the
introduction of free personal care does not seem to have changed the provision of informal
care in Scotland for those caring for an elderly person within the same household.
The picture is slightly different for extra-residential carers. Irrespective of whether additional
controls are added, there appears to be a significant reduction in the probability of informal
caring by females of around 1 per cent. This effect is only significant at the 10 per cent level
and its magnitude is very small.
We have argued that a change in the relative costs of some categories of formal care might
lead to changes in the types of care being provided informally. We know that the publicly
supplied care type is personal care. This will normally imply high-intensity care. Thus, if
there is substitution between personal care and other forms of care by informal carers we may
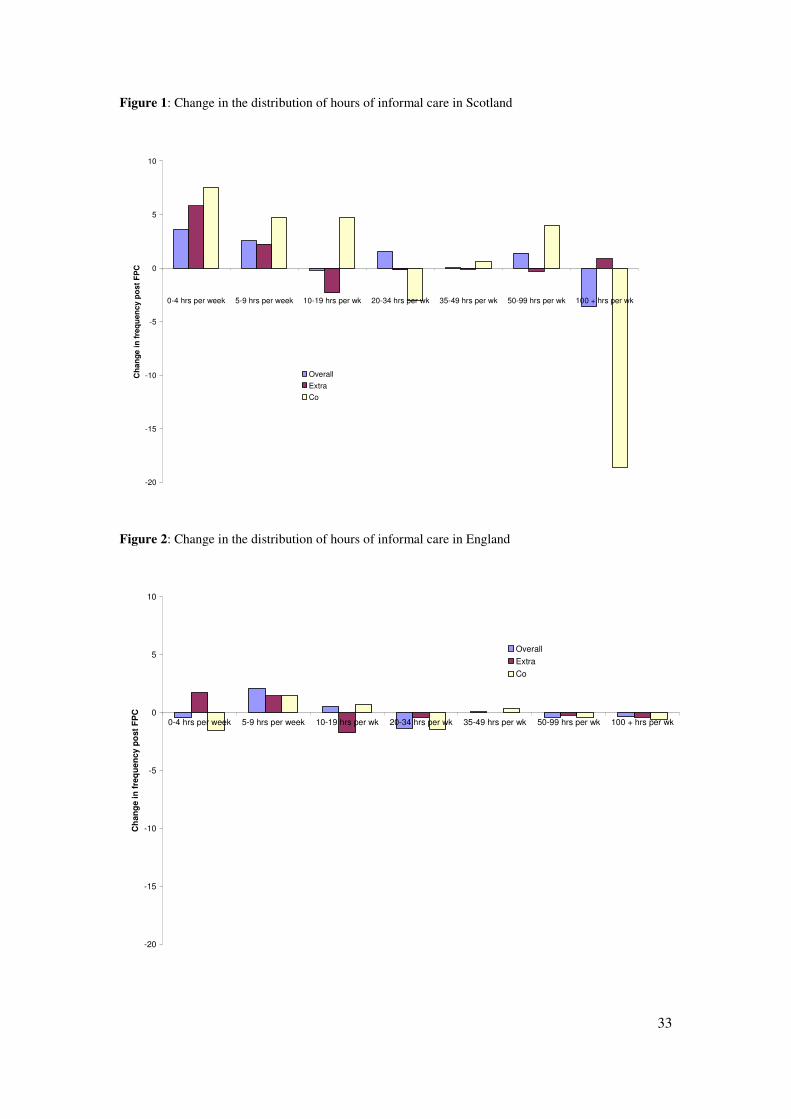
observe a shift in the hours of care supplied. Thus far we have neglected the intensive margin
of care provision. Unfortunately, the information on hours of care provided is patchy and
banded. Hence, we simply compare changes in the distribution of hours of informal care
before and after the introduction of the policy in Scotland and England rather then replicate
our difference-in-difference estimation. Figures 1 and 2 summarise our results.
There was virtually no change in the distribution hours of care in England following the
introduction of free personal care in Scotland. One would certainly not expect the Scottish
policy to affect the English distribution. But this finding also implies that there were no other
major changes happening in England that might have altered the distribution. In contrast,
there is a dramatic change in the Scottish distribution. Most noticeably, there has been a sharp
decline for people caring for more than 100 hours per week in their own home (from 85 to 50
individuals or 46% to 27%). There was a corresponding increase in lower intensity co-
residential care (between 0 and 19 hours per week). There was also a significant increase in
the 0-9 hour band among extra-residential carers.

22
Thus, although we have found no difference in the probability that co-resident adults will
describe themselves as carers, there does appear to be some reduction in the intensity of
support that they provide. This is probably because co-resident carers provide the most
intensive support, which is more likely to involve personal care. Extra-residential carers are
more likely to provide general domestic support and it is therefore not surprising that changes
in the distribution of hours are less significant for this group when the price of personal care is
reduced to zero.
These changes in the distribution of the hours of care in Scotland compared with England are
most likely associated with the policy. While our difference-in-difference models did not
indicate any substantial reduction in informal caring in Scotland on the extensive margin, the
data on hours of care do suggest that informal carers may have reduced the intensity of the
care they provide and/or are providing different types of care.
Conclusions
The existing literature on substitution between formal and informal care provision tends to
imply that any reductions in informal care brought about by reductions in the price of formal
care tend to be small. Most of this literature has used US data and tends to operate within a
theoretical framework that does not distinguish between different types of care and the
varying efficiency of informal carers in providing these forms of care.
Our paper examines one of the largest natural experiments in care provision to frail older
people. This was the provision of free personal care in Scotland from July 2002. In the rest of
Great Britain, notably England, those frail older people who required personal care and had
non-housing assets of more than £12,500, had to continue contributing towards the cost of
that care. The impacts of the policy change can be assessed using a GB-wide longitudinal
dataset that was established before the introduction of the policy.
23
Our difference-in-difference approach examines the impact of the policy. Its effect on the
probability of informal care provision on almost all categories of carer is insignificantly
different from zero. The only exception is female extra-residential carers. However, the
negative effect is mildly significant and its magnitude is small. These results are consistent
with much of the earlier literature from other countries on the effects of subsidised public care
provision on willingness to supply informal care.
The data do imply that the introduction of the policy may have affected the balance of
informal care provision towards less intensive support. This is consistent with a model in
which the effect of a policy change is to encourage substitution both between types of care
and between informal caring and the labour market.
There are a number of caveats we should add. First, this assessment of its impact is being
made only two years after the policy has been introduced; further adjustments to informal
caring behaviour may evolve as the policy matures. Second, more information is needed on
the types of task that informal carers undertake and how they select these tasks. Only with
such direct information will we be able to determine how informal care adapts and evolves
when the price of formal care drops. Finally, any longer term study should address the
endogeneity of living arrangements to determine how they are affected by additional public
support for care at home. These effects will include impacts on both the housing and labour
markets.
24
References
Ai, C., Norton, E. (2003). Interaction terms in logit and probit models. Economics Letters, 80:
123-129
Bell, D,N,F and Bowes, A. (2006). Financial Care Models in Scotland and the UK, Joseph
Rowntree Foundation
Carcagno, G.J. and Kemper, P. (1988). “An Overview of the Channelling Demonstration and
its Evaluation”, Health Services Research, Vol 23, 1, pp 1-22
Cordingley, L. Hughes, J. and Challis, D. (2001). “Unmet need and older people: Towards a
synthesis of user and provider views”, Joseph Rowntree Foundation
Christianson J.B. and Stephens, S. A. (1984). “Informal Care to the Impaired Elderly: Report
of the Channeling Survey of Informal Caregivers”, U.S. Department of Health and Human
Services
Christianson, J.B. (1988). The Effect of Channelling on Informal Caregiving”, Health
Services Research, Vol 23, 1, pp 99-117
Department of Health (2006). Community Care Statistics: Home Care Services for Adults,
England
(http://www.dh.gov.uk/PublicationsAndStatistics/Statistics/StatisticalWorkAreas/StatisticalSo
cialCare/StatisticalSocialCareArticle/fs/en?CONTENT_ID=4086767&chk=4eMvuk)
Engers, M. and Stern, S. (2002). “Long-term Care and Family Bargaining”, International
Economic Review, 43, 1, February, 73-114
Heitmueller, A. and Inglis, K. (2004). “Carefree? Participation and Pay Differentials for
Informal Carers in Britain”, IZA, Discussion Paper 1273
Heitmueller, A. and Michaud, P, (2006). “Informal Care and Employment in England:
Evidence from the British Household Panel Survey”, IZA Discussion Paper 2010
Hoerger, T.J., Picone, G. and Sloan, F. (1996). Public Subsidies, Private Provision of Care
and Living Arrangements of the Elderly, The Review of Economics and Statistics, 78,3, Aug,
25
428-440
Kemper, P. Brown, R.P., Carcagno, G.J., Applebaum, R.A., Christianson, J. B., Corson, W.,
Miller Dunstan, S., Grannemann, T., Harrigan, M., Holden, N., Phillips, B., Schore, J.,
Thornton, C., Wooldridge, J., and Skidmore F. (1986). “The Evaluation of the National Long
Term Care Demonstration: Final Report”, U.S. Department of Health and Human Services.
May, http://aspe.hhs.gov/daltcp/reports/chanes.htm
Li, L. W., (2005). “Longitudinal Changes in the Amount of Informal Care Among Publicly
Paid Home Care Recipients” The Gerontologist 45:465-473
Mathew, D (2004). “Changing Practice: Delivering Quality”, UK Home Care Association,
ISBN 0-9534-243-3-2
Pezzin, L. Kemper, P. and Reschovsky, J. (1996). “Does Publicly Provided Home Care
Substitute for Family Care? Experimental Evidence with Endogenous Living Arrangements”
The Journal of Human Resources, XXXI (3), 650-676
Pezzin, Pollak and Schone (2005), Efficiency in Family Bargaining: Living Arrangements
and Caregiving Decisions of Adult Children and Elderly Parents (preliminary draft)
Pezzin, L.and Schone, B.S., (1999a). “Intergenerational Household Formation, Female Labor
Supply and Informal Caregiving: A Bargaining Approach”, Journal of Human Resources,
XXXIV, 3, 475-503
Pezzin, L.and Schone, B.S., (1999b). “Parental Marital Disruption and Intergenerational
Transfers: An Aanalysis of Lone Elderly Parents and Their Children””, Demography,
XXXIV, 3, 475-503
Scottish Executive (2006) Statistics Release on Free Personal Care, March,
(http://www.scotland.gov.uk/Publications/2006/03/27130345/0)
Stern, S. (1995) “Estimating Family Long-Term Care Decisions in the Presence of
Endogenous Child Characteristics”, Journal of Human Resources, XXX, 3, 551-580
Royal Commission on Long Term Care (1999). “With Respect to Old Age: Long Term Care
– Rights and Responsibilities”, Cm 4192-I: 1999, London: The Stationery Office
Wanless, D. and Forder, J. (2006). “Securing Good Care for Older People: Taking a Long-

26
term View”, King’s Fund
Yoo, B. Bhattacharya, J. McDonald, K.M. and Garber, A. M. (2004). “Impacts of Informal
Caregiver Availability on Long-term Care Expenditures in OECD Countries”, OECD Health
Services Research 39:6, II , December
27
APPENDIX A
TABLE 1: HOME CARE CLIENTS 2000-05 IN SCOTLAND
At 31st March
2000 2001 2002 2003 2004 2005
Home Care clients aged 65+ 59,217 55,381 53,636 55,746 57,762 57,883
Home Care clients aged 65+ receiving personal care services *
- - 24,161 31,103 36,145 39,105
Clients receiving personal care as proportion of all clients.
- - 45% 56% 63% 68%
Average hours per week (all clients) 5.6 6.0 7.0 7.4 7.8 8.2
Source: Scottish Executive (2006)
TABLE 2: HOME CARE CLIENTS 2001-2005 IN ENGLAND
Year Clients
Total
Hours
Hours per
Client
More than 5 contact hours
and 6 or more visits
2000 414,700 2,791,300 7.0 151,700
2001 395,500 2,881,700 7.5 156,800
2002 382,000 2,983,200 8.1 160,800
2003 373,700 3,174,800 8.7 165,200
2004 368,600 3,359,000 9.1 172,200
2005 367,700 3,567,500 10.1 178,800
Source: Department of Health (2006)
TABLE 3: INFORMAL CARERS 1996-2003 (THOUSANDS)
England Wales Scotland
Year total %
female total % female total %
female
1996 3465 61% 266 66% 352 65%
1997 3584 62% 261 63% 344 70%
1998 3818 63% 287 60% 342 62%
1999 3842 62% 301 62% 365 68%
2000 3676 63% 298 62% 388 61%
2001 4101 60% 295 59% 380 66%
2002 3976 62% 282 63% 387 62%
2003 3902 61% 276 62% 384 64%
Source: Family Resources Survey
28
TABLE 4: PERCENTAGE OF ADULTS PROVIDING CARE BY CARE TYPE
From Home
Not Providing Care Providing Care
Overall RUK 88.8 11.2
Scotland 88.4 11.6
Females RUK 87.1 12.9
Scotland 86.8 13.2
Males RUK 90.9 9.1
Scotland 90.4 9.6
At Home Not Providing Care Providing Care
Overall RUK 92.1 7.9
Scotland 92.9 7.1
Females RUK 91.9 8.1
Scotland 92.0 8.0
Males RUK 92.3 7.7
Scotland 93.5 6.5
Source: BHPS 1999-2004

29
TABLE 5: CHARACTERISTICS OF CO-RESIDENTIAL AND EXTRA-RESIDENTIAL
CARERS
Co-Residential Extra-Residential
Total (Share of Adult Population) 7.7% 11.2%
Economic Activity
Full-time work 4.1% 9.9%
Part-time work 4.9% 13.6%
Retired 15.7% 11.6%
Other 11.0% 10.9%
Deviation from Average Labour Income Average Labour Income
Full-time work -6.9% -1.7% £1,669.7
Part-time work -10.4% -7.6% £913.2
Retired 19.7% 54.2% £6.3
Other -64.8% -35.5% £84.5
Age
21-25 3.8% 5.5%
26-30 3.1% 5.6%
31-35 3.8% 7.3%
36-40 4.4% 8.3%
41-45 6.1% 10.3%
46-50 6.5% 14.6%
51-55 8.5% 18.6%
56-60 10.1% 18.8%
60-64 12.4% 17.6%
65+ 15.4% 10.6%
Qualification
higher degree 4.3% 11.0%
1st degree 3.4% 9.3%
hnd, hnc, teaching 5.1% 12.5%
a level 4.9% 10.6%
o level 5.9% 11.6%
cse 6.9% 11.5%
none of these 13.6% 11.5%
30
TABLE 6: OVERALL – CO-RESIDENTIAL
Variable Model I Model II Model III Model IV Model IV Model VI
Both Genders
Both Genders
Males Males Females Females
Coeff Std Error Coeff Std Error Coeff Std Error Coeff Std Error Coeff Std Error Coeff Std Error
Time 0.0015 0.0600 -0.0019 0.0030 0.0022 0.2700 0.0043 0.0500 -0.0003 0.0020 -0.0035 0.0040
Scotland 0.0555 0.0506 0.0381 0.0640 -0.0018 0.0019 -0.0078 0.0063 0.1344 0.1142 0.0896 0.1343
Time*Scotland 0.0056 0.0035 0.0039 0.0038 0.0076 0.0052 0.0052 0.0056 0.0039 0.0048 0.0029 0.0051
Characteristics No Yes No Yes No Yes
R-sq 0.53 0.56 0.52 0.56 0.53 0.56
N 46515 36884 20908 16576 25607 20308
TABLE 7: WORKING AGE – CO-RESIDENTIAL
Variable Model I Model II Model III Model IV Model IV Model VI
Both Genders
Both Genders
Males Males Females Females
Coeff Std Error Coeff Std Error Coeff Std Error Coeff Std Error Coeff Std Error Coeff Std Error
Time 0.0001 0.0014 -0.0032 0.0027 0.0000 0.0019 -0.0038 0.0034 0.0004 0.0020 -0.0024 0.0040
Scotland 0.0785 0.0535 0.0633 0.0668 -0.0001 0.0015 -0.0028 0.0036 0.2002 0.1250 0.1511 0.1474
Time*Scotland -0.0018 0.0031 -0.0016 0.0032 0.0003 0.0039 -0.0015 0.0039 -0.0035 0.0048 -0.0016 0.0050
Characteristics No Yes No Yes No Yes
R-sq 0.52 0.55 0.48 0.52 0.55 0.58
N 35558 28047 16894 13332 18664 14715
31
TABLE 8: OVERALL – EXTRA-RESIDENTIAL
Variable Model I Model II Model III Model IV Model IV Model VI
Both Genders
Both Genders
Males Males Females Females
Coeff Std Error Coeff Std Error Coeff Std Error Coeff Std Error Coeff Std Error Coeff Std Error
Time 0.0021 0.0031 0.0093 0.0062 0.0076 0.0045 0.0088 1.8900 -0.0025 0.0044 0.0086 0.3900
Scotland 0.0071 0.0640 -0.0044 0.0835 -0.0268 0.0339 -0.0004 0.0455 0.0544 0.1443 -0.0037 0.1769
Time*Scotland -0.0050 0.0072 -0.0132 0.0078 -0.0069 0.0101 -0.0085 0.0108 -0.0034 0.0102 -0.0183 0.0110
Characteristics No Yes No Yes No Yes
R-sq 0.53 0.56 0.51 0.55 0.53 0.56
N 46512 36883 20908 16576 25604 20307
TABLE 9: WORKING AGE – EXTRA-RESIDENTIAL
Variable Model I Model II Model III Model IV Model IV Model VI
Both Genders
Both Genders
Males Males Females Females
Coeff Std Error Coeff Std Error Coeff Std Error Coeff Std Error Coeff Std Error Coeff Std Error
Time 0.0096 0.0034 0.0104 0.0067 0.0127 0.0047 0.0133 0.0091 0.0067 0.0050 0.0079 0.0096
Scotland 0.0411 0.0680 0.0121 0.0896 -0.0045 0.0292 -0.0015 0.0481 0.1117 0.1660 0.0376 0.2021
Time*Scotland -0.0105 0.0082 -0.0177 0.0087 -0.0101 0.0106 -0.0123 0.0113 -0.0107 0.0122 -0.0247 0.0132
Characteristics No Yes No Yes No Yes
R-sq 0.53 0.57 0.51 0.55 0.54 0.58
N 35556 28046 16894 13332 18662 14714

33
Figure 1: Change in the distribution of hours of informal care in Scotland
-20
-15
-10
-5
0
5
10
0-4 hrs per week 5-9 hrs per week 10-19 hrs per wk 20-34 hrs per wk 35-49 hrs per wk 50-99 hrs per wk 100 + hrs per wk
Ch
an
ge
in
fre
qu
en
cy p
ost
FP
C
Overall
Extra
Co
Figure 2: Change in the distribution of hours of informal care in England
-20
-15
-10
-5
0
5
10
0-4 hrs per week 5-9 hrs per week 10-19 hrs per wk 20-34 hrs per wk 35-49 hrs per wk 50-99 hrs per wk 100 + hrs per wk
Ch
an
ge in
fre
qu
en
cy p
ost
FP
C
Overall
Extra
Co