Embed Size (px)
Citation preview

Appendix 4E Preliminary final report
30/6/2010 Appendix 4E
Infomedia Ltd
ABN 63 003 326 243
Appendix 4E
Year Ended 30 June 2010
CONTENTS
• Result For Announcement To The Market
• Commentary On Results For the Period
• Annual Financial Report
• Independent Audit Report

Appendix 4E Preliminary final report
30/6/2010 Appendix 4E
Appendix 4E
Preliminary final report Name of entity
Infomedia Ltd ABN or equivalent company reference
Half yearly (tick)
Preliminary final (tick)
Financial year ended (‘current period’)
A.B.N 63 003 326 243 12 months ended 30 June 2010
Results for announcement to the market $A'000
Sales revenue
Down 17% to 45,339
Profit after income tax attributable to members Up 8% to 11,336 Profit (loss) from extraordinary items after tax attributable to members
Nil
Net profit for the period attributable to members Up 8% to 11,336
Dividends (distributions) Amount per security Franked amount per security
Current Year: Final dividend – declared and not paid 1.2¢ 0¢ Special dividend – paid - - Interim dividend – paid 1.2¢ 0¢ Previous Corresponding Period: Final dividend 2.1¢ 0.7¢ Special dividend - - Interim dividend 0.7¢ 0.7¢
Record date for determining entitlements to the dividend
7 September 2010
Date the dividends are payable
21 September 2010
Brief explanation of any of the figures reported above necessary to enable the figures to be understood:

Appendix 4E Preliminary final report
30/6/2010 Appendix 4E
Infomedia Ltd Year Ended 30 June 2010 The report is based on accounts that have been audited. Commentary on the results for the period:
The earnings per security and nature of any dilution aspects:
Earnings per share were 3.66 cents (2009: 3.32 cents). Refer to income statement and note 5 to the accounts for more information.
Net Tangible Assets per security Cents The Company’s net tangible assets per security are as follows:
• Net tangible assets per share at 30 June 2010 1.7 • Net tangible assets per share at 30 June 2009 3.4
Return to shareholders including distributions and buy backs:
The Company is pleased to advise a final dividend payment of 1.2 cents unfranked which together with the interim dividend of 1.2 cents and share buy back reflects a payout ratio of 80% of net profit after tax reported for the full year. The record date to determine entitlements to the dividend distribution is 7 September 2010 and the date on which the dividend is payable is 21 September 2010.
Final dividend distributions:
Significant features of operating performance:
The Company reports net profit after tax of $11,336,000 for the 2010 financial year which is within the range previously advised in its guidance, released to the market on 11 December 2009. The Company’s reported sales revenue for the year was $45,339,000 which represents a 16.6% reduction over the previous corresponding period. The major cause of the reduction in sales revenue was due to the strengthening of the Australian dollar over the 2010 financial year. As part of the Company’s foreign currency hedging program, favourable hedge translation rates were achieved. The effect of these, whilst not included in the sales revenue number, had a significant positive impact on the net profit and is shown separately within the statutory accounts. In constant currency terms, revenue decreased by $2.9 million. The impact of a $3.9 million revenue reduction from the conclusion of a previously disclosed data licence was offset by organic growth from Electronic Parts Catalogues, Superservice Menus™ and the Company’s newest parts solution for the collision industry, Auto PartsBridge™. During the year the Company signed a new extended lease on its headquarters in Sydney. The new lease led to provisions of approximately $900,000 pre tax to be credited to the profit and loss account during the year. The Company also saw an improvement in its debtor position and consequently reduced its provision for doubtful debts by $283,000, which had the impact of increasing its pre tax profit by the same amount. The net profit result included a tax adjustment of $488,000 down from the previous corresponding period of $1,067,000. This had the effect of increasing the Company’s effective tax rate from 17.5% in 2009 to 21.8% in 2010. The Company anticipates its 2011 effective tax rate to return closer to historical averages. Cash flows from operations increased to $10,174,000 primarily due to the absence of an advanced royalty paid in 2009. During the year the Company repurchased 6,694,918 shares for $1,732,000 under its buy back program.
The result of segments that are significant to an understanding of the business as a whole:
Details of segmental results are located in the Financial Report (Note 24).
A discussion of trends in performance:
In the year ahead the Company expects to continue to release its internet-based products. The company expects to continue increasing Superservice Menu™ revenue.
Any other factors which have affected the results in the period or which are likely to affect results in the future, including those where the effect could not be quantified

Appendix 4E Preliminary final report
30/6/2010 Appendix 4E
Factors that may influence or affect future results either favourably or unfavourably include: • Movements in foreign currency exchange rates • Renewal of data licence contracts with automakers and other key suppliers • Continuous research & development of leading edge technology products • Rate of rollout & growth of new and existing products

Infomedia Ltd
ABN 63 003 326 243
Annual Financial Report for the year ended 30 June 2010

I n f o m e d i a L t d A n n u a l R e p o r t
1
ABN 63 003 326 243 Directors Richard Graham – Chairman Gary Martin – Chief Executive Officer Frances Hernon Myer Herszberg Andrew Moffat Company Secretary Nick Georges Chief Financial Officer Jonathan Pollard Registered Office 357 Warringah Road Frenchs Forest NSW Australia 2086 Auditors Ernst & Young Share Register Registries Ltd Solicitors Thomson Playford Lawyers Internet Address www.infomedia.com.au

I n f o m e d i a L t d A n n u a l R e p o r t
CONTENTS
2
Directors’ Report .......................................................................................................................................................... 3 Auditor’s Independence Declaration ........................................................................................................................ 14 Statement of Comprehensive Income ....................................................................................................................... 15 Balance Sheet .............................................................................................................................................................. 16 Cash Flow Statement .................................................................................................................................................. 17 Statement of Changes in Equity ................................................................................................................................ 18 Notes to the Financial Statements ............................................................................................................................. 19
Note 1 - Corporate information ...................................................................................................................... 19 Note 2 - Summary of significant accounting policies ..................................................................................... 19 Note 3 - Expenses ........................................................................................................................................... 27 Note 4 - Income tax ........................................................................................................................................ 28 Note 5 - Earnings per share ........................................................................................................................... 29 Note 6 - Dividends proposed or paid ............................................................................................................. 30 Note 7 - Trade and other receivables .............................................................................................................. 31 Note 8 - Inventories ........................................................................................................................................ 32 Note 9 - Property, plant and equipment .......................................................................................................... 32 Note 10 - Intangible assets and goodwill .......................................................................................................... 34 Note 11 - Impairment testing of goodwill and intangibles with indefinite lives ............................................... 36
Note 12 - Trade and other payables .................................................................................................................. 37 Note 13 - Provisions (current) .......................................................................................................................... 37 Note 14 - Deferred revenue .............................................................................................................................. 37 Note 15 - Provisions (non-current) ................................................................................................................... 38 Note 16 - Contributed equity and reserves ....................................................................................................... 39 Note 17 - Statement of cash flows .................................................................................................................... 41 Note 18 - Commitments and contingencies ...................................................................................................... 42 Note 19 - Share-based payment plans .............................................................................................................. 43 Note 20 - Pensions and other post-employment benefit plans .......................................................................... 44 Note 21 - Key Management Personnel disclosures .......................................................................................... 45 Note 22 - Auditors’ remuneration .................................................................................................................... 47 Note 23 - Related party disclosures .................................................................................................................. 47 Note 24 - Segment information ........................................................................................................................ 48 Note 25 - Financial risk management objectives and policies .......................................................................... 50 Note 26 - Financial instruments........................................................................................................................ 54 Note 27 - Subsequent events ............................................................................................................................ 54 Note 28 - Parent entity information .................................................................................................................. 54
Directors’ Declaration ................................................................................................................................................ 55 Independent Audit Report ......................................................................................................................................... 56

I n f o m e d i a L t d A n n u a l R e p o r t
DIRECTORS’ REPORT
3
Your Directors submit their report for the year ended 30 June 2010. DIRECTORS Directors were in office from the beginning of the financial year until the date of this report, unless otherwise stated. The names and details of the Directors of the Company in office during the financial year and until the date of this report are: Names, qualifications, experience and special responsibilities Richard Graham Non-executive Chairman
Mr Richard Graham has held senior management positions in the American and Australian computer industry since 1977. Mr Graham co-founded the Company in 1988 and was its Chairman and Managing Director/CEO from its establishment until he retired as CEO in December 2004. Since then Mr Graham has continued as Chairman.
Mr Graham was last re-elected to the Board in October 2008 Gary Martin Chief Executive Officer
Gary Martin was promoted to the position of Chief Executive Officer on 1 January 2005. Mr Martin has extensive experience in the automotive industry. He has been with Infomedia since 1998, when he joined the Company as International Sales Manager. Mr Martin was appointed as General Manager, Electronic Catalogues Division in August 2001. Prior to joining Infomedia, he had 12 years of experience at automotive dealerships, including as General Manager, Parts & Accessories of a large multi-franchised dealership group. In his time with Ford dealers, Mr Martin was awarded the Ford Management Excellence Award in four consecutive years and participated on various Automaker committees. Mr Martin was elected to the Board in October 2004.
Frances Hernon Non-executive Director
Frances Hernon was appointed to the Infomedia Board of Directors on 19 June 2000. Ms Hernon has extensive experience in media, publishing, marketing and technology. She has held senior editorial positions at News Ltd and Murdoch Magazines and was General Manager, Harrison Communications, Director of Publicity at Channel Ten, Managing Editor of the NRMA's member magazine The Open Road, Manager, Business Communications for NRMA, and Senior Account Manager, Group IT&T for the Insurance Australia Group (IAG). Ms Hernon is currently Corporate Affairs Manager for Nestlé Australia Ltd. Ms Hernon currently serves on the Audit, Risk & Governance Committee and
also serves the Board as Lead Non-executive Director for all matters that formerly fell within the ambit of the Remuneration & Nomination Committee.
Ms Hernon was last re-elected to the Board in October 2009. Myer Herszberg Non-executive Director
Myer Herszberg has been a Director of Infomedia since 1992. Mr Herszberg has extensive consumer electronics experience and was active in bringing home computers to Australia in the early 1980s as well as many other leading edge electronic products. He also has extensive experience in the commercial property market, and is active in a number of community service organisations. Mr Herszberg currently serves on the Company’s Audit, Risk & Governance Committee. Mr Herszberg was last re-elected to the Board in October 2008.

I n f o m e d i a L t d A n n u a l R e p o r t
DIRECTORS’ REPORT
4
Directors (Continued)
Andrew Moffat Non-executive Director
(Chairman of Audit, Risk & Corporate Governance Committee)
Andrew Moffat was appointed to the Infomedia Board of Directors on 31 March 2005. Mr Moffat has more than 20 years of corporate and investment banking experience and is the sole principal of Cowoso Capital Pty Ltd, a company providing strategic corporate advisory services. Andrew was a Director of Equity Capital Markets & Advisory for BNP Paribas Equities (Australia) Limited with principal responsibility for mergers and acquisition advisory services and a range of equity capital raising mandates including placements, initial public offerings, rights issues and dividend reinvestment plan underwritings. His corporate banking experience was gained whilst working in the United Kingdom and Australia with Standard Chartered Bank Group, National Westminster Banking Group and BNP Paribas. Mr Moffat was last re-elected to the Board in October 2007.
COMPANY SECRETARY Nick Georges General Counsel & Company Secretary
Nick Georges is a qualified lawyer, admitted to the Supreme Courts of Victoria in 1991 and New South Wales in 1999. Prior to joining Infomedia and becoming its General Counsel & Company Secretary in 1999, Mr Georges worked in general practice as a solicitor in Victoria before moving to Sydney to take up an executive role with Altium Limited where he obtained extensive experience in the information technology industry.
Interests in the shares and options of the Company and related bodies corporate As at the date of this report, the interests of the Directors in the shares and options of the Company were:
Infomedia Ltd Ordinary Shares
fully paid Options over Ordinary
Shares Wiser Equity Pty Limited 101,076,028 - Yarragene Pty Limited 23,421,589 - Wiser Centre Pty Limited 1,000,000 - Richard Graham 926,559 - Gary Martin 655,590 1,000,000 Andrew Moffat 300,000 - Frances Hernon 5,000 -
Richard Graham is the sole Director and beneficial shareholder of Wiser Equity Pty Limited. Richard Graham is a Director of Wiser Centre Pty Limited, trustee for the Wiser Centre Pty Ltd Superannuation Fund. Myer Herszberg is a Director and major shareholder of Yarragene Pty Limited. Directorships of other publicly listed entities During the past five years, Andrew Moffat has been the non-executive director of Cash Converters Ltd. He is chairman of Pacific Star Network Limited and also a non-executive Director of Rubik Financial Limited and itX Group Limited.

I n f o m e d i a L t d A n n u a l R e p o r t
DIRECTORS’ REPORT
5
PRINCIPAL ACTIVITIES Infomedia Ltd is a company limited by shares that is incorporated and domiciled in Australia. The principal activities during the year of entities within the consolidated group were: • developer and supplier of electronic parts catalogues and service quoting systems for the automotive industry
globally; and • information management, analysis and creation for the domestic automotive and oil industries. There have been no significant changes in the nature of those activities during the year. EMPLOYEES The company employed 225 (2009: 240) full time employees as at 30 June 2010. DIVIDENDS Cents $’000 Final dividends recommended: On ordinary shares – final – unfranked 1.2 3,644 Dividends paid in the year: On ordinary shares – 2010 interim – unfranked 1.2 3,729 Final for the 2009 year: On ordinary shares – as recommended in the 2009 report, franked at 0.7c 2.1 6,534 NET TANGIBLE ASSETS PER SECURITY Cents The Company’s net tangible assets per security are as follows:
• Net tangible assets per share at 30 June 2010 1.7 • Net tangible assets per share at 30 June 2009 3.4 REVIEW AND RESULTS OF OPERATIONS The following table presents sales revenue and profit after tax. There were no non-recurring significant items during the 2009 or 2010 financial years: CONSOLIDATED
2010 2009
$’000 $’000
Sales revenue 45,339 54,342
Foreign exchange movement on hedges closed out during the period 5,181 (3,024)
50,520 51,317
Profit after tax 11,336 10,536

I n f o m e d i a L t d A n n u a l R e p o r t
DIRECTORS’ REPORT
6
REVIEW AND RESULTS OF OPERATIONS (CONTINUED) The Company reports net profit after tax of $11,336,000 for the 2010 financial year which is within the range previously advised in its guidance, released to the market on 11 December 2009. The Company’s reported sales revenue for the year was $45,339,000 which represents a 16.6% reduction over the previous corresponding period. The major cause of the reduction in sales revenue was due to the strengthening of the Australian dollar over the 2010 financial year. As part of the Company’s foreign currency hedging program, favourable hedge translation rates were achieved. The effect of these, whilst not included in the sales revenue number, had a significant positive impact on the net profit and is shown separately within the statutory accounts. In constant currency terms, revenue decreased by $2.9 million. The impact of a $3.9 million revenue reduction from the conclusion of a previously disclosed data licence was offset by organic growth from Electronic Parts Catalogues, Superservice Menus™ and the Company’s newest parts solution for the collision industry, Auto PartsBridge™. During the year the Company signed a new extended lease on its headquarters in Sydney. The new lease led to provisions of approximately $900,000 pre tax to be credited to the profit and loss account during the year. The Company also saw an improvement in its debtor position and consequently reduced its provision for doubtful debts by $283,000, which had the impact of increasing its pre tax profit by the same amount. The net profit result included a tax adjustment of $488,000 down from the previous corresponding period of $1,067,000. This had the effect of increasing the Company’s effective tax rate from 17.5% in 2009 to 21.8% in 2010. The Company anticipates its 2011 effective tax rate to return closer to historical averages. Cash flows from operations increased to $10,174,000 primarily due to the absence of an advanced royalty paid in 2009. During the year the Company repurchased 6,694,918 shares for $1,732,000 under its buy back program. The Company is pleased to advise a final dividend payment of 1.2 cents unfranked which together with the interim dividend of 1.2 cents and share buy back reflects a payout ratio of 80% of net profit after tax reported for the full year. The record date to determine entitlements to the dividend distribution is 7 September 2010 and the date on which the dividend is payable is 21 September 2010. SIGNIFICANT CHANGES IN THE STATE OF AFFAIRS There has been no significant change in the state of affairs of the Company since the last Directors’ Report.
SIGNIFICANT EVENTS AFTER THE BALANCE DATE The Chief Executive Officer notified the Board that he will not be seeking to renew his service agreement when it expires on 31 December 2010. Other than this, there has been no matter or circumstance that has arisen since the end of the financial year that has significantly affected the operations of the Company, the results of those operations, or the state of affairs of the Company. LIKELY DEVELOPMENTS AND EXPECTED RESULTS In the year ahead the Company expects to continue to release its internet-based products. The company expects to continue increasing Superservice Menu™ revenue. ENVIRONMENTAL REGULATION AND PERFORMANCE The Company is not subject to any particular or significant environmental regulation under a law of the Commonwealth of Australia or of a State or Territory. SHARE OPTIONS Unissued shares At the date of this report, there were 2,150,000 unissued ordinary shares under options. Refer to Note 19 of the financial statements for further details of the options outstanding. Shares issued as a result of the exercise of options There were no shares issued as a result of the exercise of options during the year. Since the end of the financial year there have been no options exercised.

I n f o m e d i a L t d A n n u a l R e p o r t
DIRECTORS’ REPORT
7
INDEMNIFICATION AND INSURANCE OF DIRECTORS AND OFFICERS During the year the Company paid a premium in relation to insuring Directors and other officers against liability incurred in their capacity as a Director or officer of the Company. The insurance contract specifically prohibits the disclosure of the nature of the policy and amount of premium paid.
REMUNERATION REPORT – AUDITED This remuneration report outlines the director and executive remuneration arrangements of the Company and the Group in accordance with the requirements of the Corporations Act 2001 and its regulations. For the purposes of this report, key management personnel (KMP) of the Group are defined as those persons having authority and responsibility for planning, directing and controlling the major activities of the Company and the Group, directly or indirectly, including any director (whether executive or otherwise) of the parent company.
Details of Key Management Personnel
(i) Directors
Richard Graham Non-executive Chairman
Gary Martin Chief Executive Officer
Myer Herszberg Non-executive Director
Frances Hernon Non-executive Director
Andrew Moffat Non-executive Director
(ii) Executives
Jonathan Pollard Chief Financial Officer
Michael Bodner* Chief Information Officer
Nick Georges Company Secretary and Legal Counsel
Andrew Pattinson Director of Operations and Global Solutions
Michael Roach
Director of Sales & General Manager Asia Pacific
*resigned 31 May 2010
Compensation Philosophy The performance of the Company depends upon the quality of its Directors and Executives. To prosper, the Company must attract, motivate and retain highly skilled Directors and executives. To this end, the Company embodies the following principles in its compensation framework: • Provide competitive rewards to attract high calibre executives; • Link executive rewards to shareholder value; and • Establish appropriate performance hurdles in relation to variable executive compensation. Remuneration Decisions Ms. Hernon, in her capacity as lead director for all matters that formally fell within the former Remuneration & Nomination Committee of the Board of Directors is responsible for recommending to the Board the Company’s remuneration and compensation policy arrangements for all Key Management Personnel. Ms. Hernon, together with the non-executive members of the Board assess the appropriateness of the nature and amount of these emoluments on a periodic basis by reference to relevant employment market conditions with the overall objective of ensuring maximum stakeholder benefit from the retention of a high quality board and executive team. Compensation Structure In accordance with best practice corporate governance recommendations, the structure of non-executive Director and senior executive compensation is separate and distinct. Non-executive Director Compensation Objective The Board seeks to set aggregate compensation at a level which provides the Company with the ability to attract and retain Directors of appropriate calibre, whilst incurring a cost which is acceptable to shareholders.

I n f o m e d i a L t d A n n u a l R e p o r t
DIRECTORS’ REPORT
8
REMUNERATION REPORT (CONTINUED) – AUDITED Structure The Constitution and the ASX Listing Rules specify that the aggregate compensation of non-executive Directors shall be determined from time to time by a general meeting. An amount not exceeding the amount determined is then available between the Directors as appropriate (for the year ending 30 June 2010 non-executive Directors’ compensation totalled $309,341 (2009: $309,341). The latest determination was at the Annual General Meeting held on 30 October 2002 when shareholders approved a maximum aggregate compensation of $450,000 per year. The Board has historically considered the advice from external consultants as well as the fees paid to non-executive Directors of comparable companies when undertaking a review process. Senior Executive and Executive Director Compensation Objective The Company aims to reward executives with a level and mix of compensation commensurate with their position and responsibilities within the Company and so as to: • reward executives for Company and individual performance against targets set by reference to appropriate benchmarks; • align the interests of executives with those of shareholders; • link reward with the strategic goals and performance of the Company; and • ensure total compensation is competitive by market standards. Structure In determining the level and make-up of executive compensation, the Remuneration Committee engages an external consultant from time to time to provide independent advice in the form of a written report detailing market levels of compensation for comparable executive roles. Compensation consists of the following key elements: - Fixed Compensation; - Variable Compensation - Short Term Incentive (‘STI’); and - Variable Compensation - Long Term Incentive (‘LTI’). The actual proportion of fixed compensation and variable compensation (potential short term and long term incentives) is established for Key Management Personnel (excluding the CEO and non-executive Directors) by the CEO in conjunction with the lead director (Ms. Hernon) for all remuneration matters, and in the case of the CEO, by the Chairman of the Board in conjunction with Ms. Hernon. Other executive salaries are determined by the CEO with reference to market conditions. Fixed Compensation Objective The level of fixed compensation is set so as to provide a base level of compensation which is both appropriate to the position and is competitive in the market. Fixed compensation is reviewed periodically by the CEO in conjunction with Ms. Hernon for the Key Management Personnel (excluding the CEO and non-executive Directors), and in the case of the CEO, by the Chairman of the Board in conjunction with Ms. Hernon. All other executive positions are reviewed periodically by the CEO. As noted above, Ms. Hernon has access to external advice independent of management. Structure Executives are given the opportunity to receive their fixed (primary) compensation in a variety of forms including cash or other designated employee expenditure such as motor vehicles. It is intended that the manner of payment chosen will be optimal for the recipient without creating undue cost for the Company.

I n f o m e d i a L t d A n n u a l R e p o r t
DIRECTORS’ REPORT
9
REMUNERATION REPORT (CONTINUED) - AUDITED Variable Compensation – Short Term Incentive (STI) Objective The objective of short term compensation is to link the achievement of both individual performance and Company performance with the compensation received by the executive. Structure The structure of short term compensation is a cash bonus dependent upon a combination of individual performance objectives and Company objectives being met. This reflects the Company wide practice of ‘Performance Planning & Review’ (PPR) procedures. Individual performance objectives centre on key focus areas. Company objectives include achieving budgetary targets that are set at the commencement of the financial year (adjusted where necessary for currency fluctuations). These performance conditions were chosen, in the case of individual performance objectives, to promote and maintain the individual’s focus on their own contribution to the Company’s strategic objectives through individual achievement in key result areas (KRAs) which include, for example, ‘leadership’, ‘decision making’, ‘results’ and ‘risk management’. In the case of Company objectives, budgetary performance conditions were chosen to promote and maintain a collaborative, Company wide focus on the achievement of those targets. In assessing whether an individual performance condition has been satisfied, pre-agreed key performance indicators (KPIs) are used. In assessing whether Company objectives have been satisfied, Board level pre-determined budgetary targets are used. These methods have been chosen to create clear and measurable performance targets. Variable Compensation – Long Term Incentive (LTI) Objective The objective of the LTI plan is to reward executives in a manner which aligns this element of compensation with the creation of shareholder wealth. As such LTI grants are made to executives who are able to influence the generation of shareholder wealth and thus have a direct impact on the Company's performance against the relevant long term performance hurdle. Structure The structure of long term compensation is in the form of share options pursuant to the employee option and employee share plans. Performance hurdles have been introduced for all share options issued after 31 December 2004 and are determined upon grant of those share options. These hurdles typically relate to the Company’s share price reaching or exceeding a particular level. These methods were chosen to create clear and measurable performance expectations.

I n f o m e d i a L t d A n n u a l R e p o r t
DIRECTORS’ REPORT
10
REMUNERATION REPORT (CONTINUED) - AUDITED Key Management Personnel and the five highest remunerated specified executives for the year ended 30 June 2010 and 30 June 2009.
Short-Term Post
Employment Share Based
Payments
Long Service leave
Termination payments Total
Percentage Performance
Related
2010 Financial Year: Salary &
Fees Bonus
Non Monetary
Benefits Superannuation Options
$ $ $ $ $ $ $ $ %
Directors:
Richard Graham 115,000 - - 10,350 - - - 125,350 -
Gary Martin 300,000 60,000 - 27,000 14,976 5,000 - 406,976 15%
Myer Herszberg 56,300 - - 5,067 - - - 61,367 -
Frances Hernon 56,250 - - 5,062 - - - 61,312 -
Andrew Moffat 56,250 - - 5,062 - - - 61,312 -
Executives:
Andrew Pattinson 280,000 36,800 - 25,200 3,629 4,667 - 350,296 10%
Michael Bodner* 240,038 - 13,840 - 8,770 - 130,930 393,578 -
Michael Roach 200,000 32,000 - 18,000 3,486 3,333 - 256,819 12%
Nick Georges 190,000 29,975 - 17,100 3,744 3,167 - 243,986 12%
Jonathan Pollard 180,000 21,600 - 16,200 5,442 1,800 - 225,042 10%
1,673,838 180,375 13,840 129,041 40,047 17,967 130,930 2,186,038
2009 Financial Year:
Directors:
Richard Graham 115,000 - - 10,350 - - 125,350 -
Gary Martin 300,000 105,000 - 27,000 34,524 5,000 471,524 22%
Myer Herszberg 56,300 - - 5,067 - - 61,367 -
Frances Hernon 56,250 - - 5,062 - - 61,312 -
Andrew Moffat 56,250 - - 5,062 - - 61,312 -
Executives:
Andrew Pattinson 288,952 49,377 65,578 26,006 1,960 4,667 436,540 11%
Michael Bodner 304,169 66,928 16,031 - 19,616 - 406,744 16%
Michael Roach 190,000 36,000 - 17,100 3,360 3,333 249,793 14%
Nick Georges 190,000 29,125 - 17,100 8,634 3,167 248,026 12%
Jonathan Pollard 172,784 43,512 - 15,504 6,930 1,500 240,230 18%
1,729,705 329,942 81,609 128,251 75,024 17,667 2,362,198
*Resigned 31 May 2010
I n f o m e d i a L t d A n n u a l R e p o r t
DIRECTORS’ REPORT
11
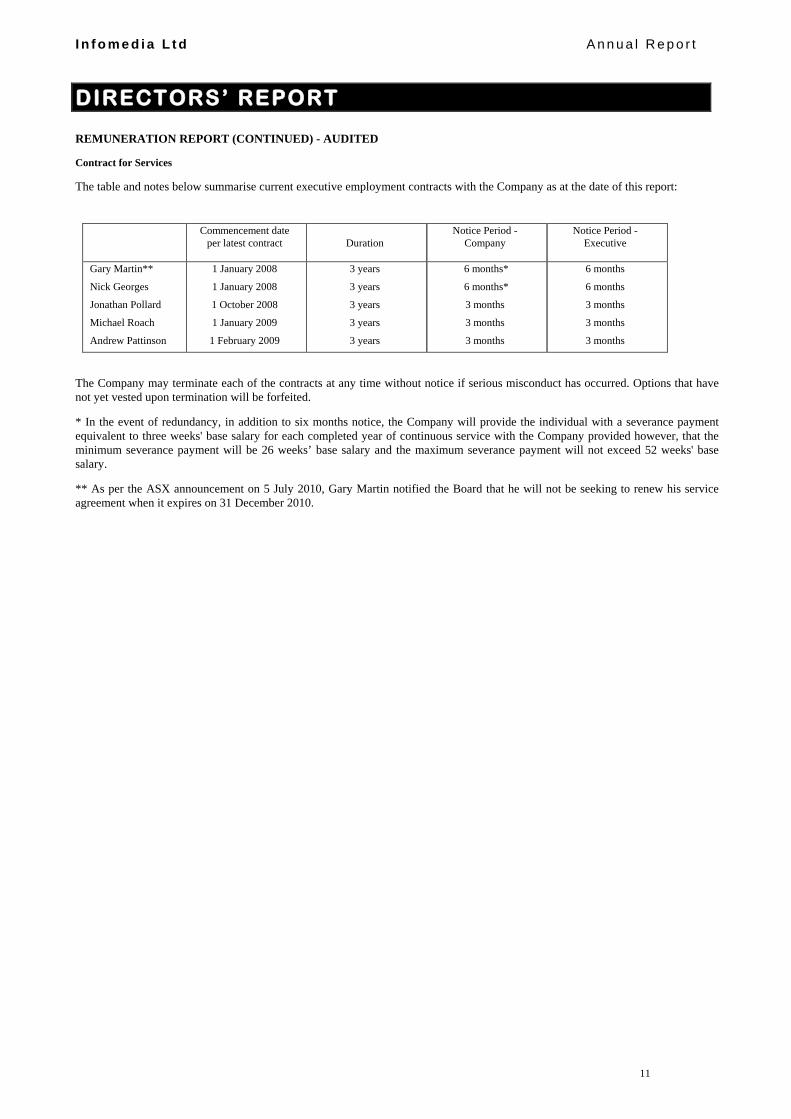
REMUNERATION REPORT (CONTINUED) - AUDITED
Contract for Services
The table and notes below summarise current executive employment contracts with the Company as at the date of this report:
Commencement date
per latest contract Duration Notice Period -
Company Notice Period -
Executive Gary Martin** 1 January 2008 3 years 6 months* 6 months
Nick Georges 1 January 2008 3 years 6 months* 6 months
Jonathan Pollard 1 October 2008 3 years 3 months 3 months
Michael Roach 1 January 2009 3 years 3 months 3 months
Andrew Pattinson 1 February 2009 3 years 3 months 3 months
The Company may terminate each of the contracts at any time without notice if serious misconduct has occurred. Options that have not yet vested upon termination will be forfeited.
* In the event of redundancy, in addition to six months notice, the Company will provide the individual with a severance payment equivalent to three weeks' base salary for each completed year of continuous service with the Company provided however, that the minimum severance payment will be 26 weeks’ base salary and the maximum severance payment will not exceed 52 weeks' base salary.
** As per the ASX announcement on 5 July 2010, Gary Martin notified the Board that he will not be seeking to renew his service agreement when it expires on 31 December 2010.

I n f o m e d i a L t d A n n u a l R e p o r t
DIRECTORS’ REPORT
12
REMUNERATION REPORT (CONTINUED) - AUDITED
Shares issued on exercise of compensation options (Consolidated)
No options were exercised during the year.
Compensation options: Granted during the year 30 June 2010
No options were granted during the year.
Compensation options: Vested during the year 30 June 2010
Terms and Conditions for each Grant Vested Options Issued
No. Grant date Fair value per
option at grant date ($)
Exercise price per option ($)
Expiry date No. %
Directors Gary Martin
1,000,000
1/1/2008
0.078
0.53
5/2/2011
666,666
66.6%
Executives Nick Georges
250,000
1/1/2008
0.078
0.53
5/2/2011
166,666
66.6% Jonathan Pollard
250,000 1/10/2008
0.061
0.37
31/10/2011
83,333 33.3%
Michael Roach 250,000 1/1/2009 0.032 0.29 5/1/2012 83,333 33.3% Andrew Pattinson 250,000 1/2/2009 0.031 0.29 5/2/2012 83,333 33.3% Total 2,000,000 1,083,331 54.2%
Compensation options: Granted and vested during the year 30 June 2009
Terms and Conditions for each Grant Vested Options Issued
No. Grant date Fair value per
option at grant date ($)
Exercise price per option ($)
Expiry date No. %
Directors Gary Martin
1,000,000
1/1/2008
0.078
0.53
5/2/2011
333,333
33.3%
Executives Michael Bodner* Nick Georges
500,000 250,000
1/5/2008
1/1/2008
0.071
0.078
0.42
0.53
13/4/2011
5/2/2011
166,666
83,333
33.3%
33.3% Jonathan Pollard 250,000 1/10/2008 0.061 0.37 31/10/2011 - - Michael Roach
250,000
1/01/2009
0.032
0.29
5/01/2012
-
-
Andrew Pattinson
250,000
1/02/2009
0.031
0.29
5/02/2012
-
-
Total 2,500,000 583,332 23.3%
*Options expired on resignation 31 May 2010

I n f o m e d i a L t d A n n u a l R e p o r t
DIRECTORS’ REPORT
13
DIRECTORS’ MEETINGS The number of meetings of Directors (including meetings of committees of Directors) held during the year and the numbers of meetings attended by each Director were as follows: Committee Meetings Directors’
Meetings Audit, Risk & Governance
Number of meetings held: 8 3 Number of meetings attended: Richard Graham 8 - Gary Martin 8 - Myer Herszberg 6 3 Frances Hernon 7 3 Andrew Moffat 8 3 ROUNDING
The amounts contained in this report and in the financial report have been rounded to the nearest $1,000 (where rounding is applicable) under the option available to the Company under ASIC Class Order 98/0100. The Company is an entity to which the Class Order applies.
AUDITOR INDEPENDENCE AND NON-AUDIT SERVICES
The Directors received an auditor’s independence declaration from the auditor of the Company (refer page 14). NON-AUDIT SERVICES
Ernst & Young provided corporate advisory consulting services totaling $47,825 during the financial year ended 30 June 2010. The directors are satisfied that the provision of non-audit services is compatible with the general standard of Independence for auditors imposed by the Corporations Act 2001. The nature and scope of the non-audit service provided means that auditor independence was not compromised.
Signed in accordance with a resolution of the Directors.
Richard David Graham
Chairman
Sydney, 24 August 2010

14
Liability limited by a scheme approved under Professional Standards Legislation
Auditor’s Independence Declaration to the Directors of Infomedia Ltd In relation to our audit of the financial report of Infomedia Ltd for the financial year ended 30 June 2010, to the best of my knowledge and belief, there have been no contraventions of the auditor independence requirements of the Corporations Act 2001 or any applicable code of professional conduct.
Ernst & Young
J K Haydon Partner 24 August 2010

I n f o m e d i a L t d A n n u a l R e p o r t
STATEMENT OF COMPREHENSIVE INCOME
15
YEAR ENDED 30 June 2010 Notes CONSOLIDATED
2010 2009
$’000 $’000
Sales revenue 45,339 54,341
Foreign exchange movement on hedges closed out during the period 5,181 (3,024)
50,520 51,317
Cost of sales 3(i) (21,904) (22,107)
Gross Profit 28,616 29,210
Finance revenue 103 419
Employee benefits expense 3(ii) (10,705) (9,306)
Depreciation and amortisation 3(iii) (3,745) (3,442)
Finance costs (36) (61)
Operating lease rental (1,167) (1,373)
Other income/(expenses) 1,431 (2,674)
Profit before income tax 14,497 12,773
Income tax expense 4 (3,161) (2,237)
Profit after income tax 11,336 10,536
Other comprehensive income
Foreign currency translation differences for foreign operations
(290) 192
Effective cashflow hedges movement recognised in equity (857) 2,351
Ineffective cashflow hedges gain/(loss) recognised in the profit and loss - -
Other comprehensive income/(expense) for the period, net of tax (1,147) 2,543
Total comprehensive income for the period 10,189 13,079
Basic earnings per share (cents per share) 5 3.66 3.32
Diluted earnings per share (cents per share) 5 3.66 3.32
Dividends per share - ordinary (cents per share) 6 2.40 2.80

I n f o m e d i a L t d A n n u a l R e p o r t
BALANCE SHEET
16
AT 30 June 2010 Notes CONSOLIDATED
2010 2009
CURRENT ASSETS $’000 $’000
Cash and cash equivalents 17(b) 5,789 8,005 Trade and other receivables 7 4,160 4,396 Inventories 8 56 54 Prepayments 2,507 1,983 Derivatives 26 3,028 4,252 Income tax receivable - 386
TOTAL CURRENT ASSETS 15,540 19,076
NON-CURRENT ASSETS
Property, plant and equipment 9 1,305 1,837 Prepayments 751 1,720 Intangible assets and goodwill 10 28,696 24,976
TOTAL NON-CURRENT ASSETS 30,752 28,533
TOTAL ASSETS 46,292 47,609
CURRENT LIABILITIES
Trade and other payables 12 3,738 3,605 Provisions 13 2,000 2,400 Income tax payable 626 - Deferred revenue 14 481 458
TOTAL CURRENT LIABILITIES 6,845 6,463
NON-CURRENT LIABILITIES
Provisions 15 306 1,108 Deferred tax liabilities 4 5,400 4,534
TOTAL NON-CURRENT LIABILITIES 5,706 5,642
TOTAL LIABILITIES 12,551 12,105
NET ASSETS 33,741 35,504
EQUITY
Contributed equity 16 11,131 12,863 Reserves 16 3,161 4,265 Retained profits 19,449 18,376
TOTAL EQUITY 33,741 35,504

I n f o m e d i a L t d A n n u a l R e p o r t
CASH FLOW STATEMENT
17
YEAR ENDED 30 June 2010 Notes CONSOLIDATED
2010 2009 $’000 $’000 CASH FLOWS FROM OPERATING ACTIVITIES
Receipts from customers 51,294 52,073 Payments to suppliers and employees (40,348) (45,016) Interest received 103 419 Income tax paid (875) (2,272) NET CASH FLOWS FROM OPERATING ACTIVITIES
17 (a) 10,174 5,204
CASH FLOWS FROM INVESTING ACTIVITIES Acquisition of property, plant and equipment (395) (801) Purchase of intellectual property 10 - (441) NET CASH FLOWS USED IN INVESTING ACTIVITIES
(395) (1,242)
CASH FLOWS FROM FINANCING ACTIVITIES Share buy back payment 16 (1,732) (3,505) Dividends paid on ordinary shares 6 (10,263) (6,699) NET CASH FLOWS USED IN FINANCING ACTIVITIES (11,995) (10,204) NET (DECREASE) IN CASH HELD (2,216) (6,242) Add opening cash brought forward 8,005 14,247 CLOSING CASH CARRIED FORWARD
17 (b) 5,789 8,005

I n f o m e d i a L t d A n n u a l R e p o r t
STATEMENT OF CHANGES IN EQUITY
18
YEAR ENDED 30 June 2010 CONSOLIDATED
Contributed equity
Retained earnings
Employee equity
benefits reserve
Cashflow hedge
reserve
Foreign currency
translation reserve Total
$’000 $’000 $’000
$’000 $’000
$’000 At 1 July 2009
12,863 18,376 1,152 2,976 137 35,504
Profit for the period - 11,336 - - - 11,336
Other comprehensive income - - - (857) (290) (1,147)
Total comprehensive income for the year - 11,336 - (857) (290) 10,189 Share based payments - - 43 - - 43
Share buy back (1,732) - - - - (1,732) Equity dividends - (10,263) - - - (10,263)
At 30 June 2010 11,131 19,449 1,195 2,119 (153) 33,741
YEAR ENDED 30 June 2009 CONSOLIDATED
Contributed equity
Retained earnings
Employee equity
benefits reserve
Cashflow hedge reserve
Foreign currency
translation reserve Total
$’000 $’000
$’000 $’000
$’000 $’000
At 1 July 2008
16,368 14,539 1,058 625 (55) 32,535
Profit for the period - 10,536 - - - 10,536
Other comprehensive income - - - 2,351 192 2,543
Total comprehensive income for the year 16,368 10,536 - 2,351 192 13,079 Share based payments - - 94 - - 94
Share buy back (3,505) - - - - (3,505) Equity dividends - (6,699) - - - (6,699) At 30 June 2009 12,863 18,376 1,152 2,976 137 35,504
I n f o m e d i a L t d A n n u a l R e p o r t
NOTES TO THE FINANCIAL STATEMENTS
19
30 June 2010 1. CORPORATE INFORMATION The financial report of Infomedia Ltd for the year ended 30 June 2010 was authorised for issue in accordance with a resolution of the Directors on 24 August 2010. Infomedia Ltd is a company limited by shares incorporated and domiciled in Australia whose shares are publicly traded on the Australian stock exchange. The nature of the operations and principal activities of the Company are described in the Directors’ Report. 2. SUMMARY OF SIGNIFICANT ACCOUNTING POLICIES (a) Basis of preparation The financial report is a general-purpose financial report, which has been prepared in accordance with the requirements of the Corporations Act 2001 and Australian Accounting Standards. The financial report has also been prepared on a historical cost basis, except for derivative financial instruments that have been measured at fair value. (b) Statement of compliance This financial report complied with Australian Accounting Standards as issued by the Australian Accounting Standards Board. This financial report also complied with the International Financial Reporting Standards (IFRS) as issued by the International Accounting Standards Board. As a result of Corporate Reporting Reform Act 2010, effective for 30 June 2010 year end financial reporting, the Company is relieved of the requirement to present financial statements for both the parent entity and the consolidated entity. A summary of the parent entity financial information has been disclosed in note 28 of the financial statements. The accounting policies adopted are consistent with those of the previous financial year except as follows: The Group has adopted the following new and amended Australia Accounting Standards and AASB Interpretations as of 1 January 2009.
• AASB 7 Financial Instruments: Disclosures effective 1 January 2009; • AASB 8 Operating Segments effective 1 January 2009; and • AASB 101 Presentation of Financial Statements (revised 2007) effective 1 January 2009.
Other new/revised standards and interpretations applicable for the year commencing 1 July 2009 have been reviewed and it has been determined that those new/revised standards and interpretations do not have a material effect on the measurement and recording of items in the balance sheet and statement of comprehensive income. Certain Australian Accounting Standards and interpretations have recently been issued or amended but are not yet effective and have not been adopted by Infomedia Ltd for the current reporting period. The Directors have not yet assessed the impact of these new or amended standards (to the extent relevant to Infomedia Ltd) and interpretations. (c) Basis of consolidation The consolidated financial statements comprise the financial statements of Infomedia Ltd and its subsidiaries (‘the Company’). The financial statements of subsidiaries are prepared for the same reporting period as the parent company, using consistent accounting policies. Adjustments are made to bring into line any dissimilar accounting policies that may exist. All intercompany balances and transactions, including unrealised profits arising from intra-group transactions, have been eliminated in full. Unrealised losses are eliminated unless costs cannot be recovered. Subsidiaries are consolidated from the date on which control is transferred to the Company and cease to be consolidated from the date on which control is transferred out of the Company. Where there is loss of control of a subsidiary, the consolidated financial statements include the results for the part of the reporting period during which Infomedia Ltd has control. (d) Significant accounting judgments, estimates and assumptions
Significant accounting estimates and assumptions The carrying amounts of certain assets and liabilities are often determined based on estimates and assumptions of future events. The key estimates and assumptions that have a significant risk of causing a material adjustment to the carrying amounts of certain assets and liabilities within the next annual reporting period are:
• Impairment of goodwill The Company determines whether goodwill is impaired at least on an annual basis. This requires an estimation of the
recoverable amount of the cash generating units to which the goodwill and intangibles with indefinite useful lives are allocated. The assumptions used in this estimation of recoverable amount and the carrying amount of goodwill and intangibles with indefinite useful lives are discussed in Note 10.

I n f o m e d i a L t d A n n u a l R e p o r t
NOTES TO THE FINANCIAL STATEMENTS
20
30 June 2010 2. SUMMARY OF SIGNIFICANT ACCOUNTING POLICIES (CONTINUED)
• Share-based payment transactions The Company measures the cost of equity-settled transactions with employees by reference to the fair value of the
equity instruments at the date at which they are granted. The fair value is determined by an external valuer using a binomial model, using the assumptions detailed in Note 19.
• Research & Development Development costs are only capitalised by the Group when it can be demonstrated that the technical feasibility of completing the intangible asset is valid so that the asset will be available for use or sale.
Translation of foreign currency transactions Transactions in foreign currencies of the Company are converted to local currency at the rate of exchange ruling at the date of the transaction. Amounts payable to and by the Company that are outstanding at the balance date and are denominated in foreign currencies have been converted to local currency using rates of exchange ruling at the end of the reporting period. All currency exchange differences in the consolidated financial report are taken to the income statement. Translation of financial reports of overseas operations Both the functional and presentation currency of Infomedia Ltd and its Australian subsidiaries is Australian dollars (A$). Non-monetary items that are measured in terms of historical cost in a foreign currency are translated using the exchange rate as at the date of the initial transaction. The functional currency of the overseas subsidiaries is as follows: IFM Europe Ltd Euros IFM Germany GmbH Euros IFM North America Inc United States Dollars (USD) As at the reporting date the assets and liabilities of these overseas subsidiaries are translated into the presentation currency of Infomedia Ltd at the rate of exchange ruling at the balance sheet date and the income statements are translated at the weighted average exchange rates for the period. The exchange differences arising on the retranslation are taken directly to a separate component of equity. (f) Cash and cash equivalents Cash on hand and in banks and short-term deposits are stated at nominal values. For the purposes of the Cash Flow Statement, cash includes cash on hand and in banks, and money market investments readily convertible to cash within three months, net of outstanding bank overdrafts. (g) Trade and other receivables Trade receivables, which generally have 30-60 day terms, are recognised and carried at original invoice amount less an allowance for any uncollectible amounts. An allowance for doubtful debts is made when there is objective evidence that the Company will not be able to collect the debts. Bad debts are written off when identified. (h) Investments and other financial assets Financial assets in the scope of AASB 139 Financial Instruments: Recognition and Measurement are classified as either financial assets at fair value through profit or loss, loans and receivables, held-to-maturity investments, or available-for-sale investments, as appropriate. For the Company the relevant categories are listed below: Loans and receivables Loans and receivables are non-derivative financial assets with fixed or determinable payments that are not quoted in an active market. Such assets are carried at amortised cost using the effective interest method. Gains and losses are recognised in profit or loss when the loans and receivables are derecognised or impaired, as well as through the amortisation process. Investments in Subsidiaries Investments in subsidiaries are recorded at cost. (i) Inventories Inventories are valued at the lower of cost and net realisable value. Costs incurred in bringing each product to its present location and condition are accounted for as follows:
• Raw materials – purchase cost on a first-in-first-out basis

I n f o m e d i a L t d A n n u a l R e p o r t
NOTES TO THE FINANCIAL STATEMENTS
21
30 June 2010 2. SUMMARY OF SIGNIFICANT ACCOUNTING POLICIES (CONTINUED) (j) Goodwill Goodwill acquired in a business combination is initially measured at cost being the excess of the cost of the business combination over the Company’s interest in the net fair value of the acquiree's identifiable assets, liabilities and contingent liabilities. Following initial recognition, goodwill is measured at cost less any accumulated impairment losses. Goodwill is reviewed for impairment annually or more frequently if events or changes in circumstances indicate that the carrying value may be impaired. For the purpose of impairment testing, goodwill acquired in a business combination is, from the acquisition date, allocated to each of the Company’s cash-generating units, or groups of cash generating units, that are expected to benefit from the synergies of the combination, irrespective of whether other assets or liabilities of the Company are assigned to those units or groups of units. Each unit or group of units to which the goodwill is so allocated: • represents the lowest level within the Company at which the goodwill is monitored for internal management purposes; and • is not larger than a segment based on either the Company’s primary or the Company’s secondary reporting format determined in accordance with AASB 114 Segment Reporting. Impairment is determined by assessing the recoverable amount of the cash-generating unit (group of cash-generating units), to which the goodwill relates. When the recoverable amount of the cash-generating unit (group of cash-generating units) is less than the carrying amount, an impairment loss is recognised. When goodwill forms part of a cash-generating unit (group of cash-generating units) and an operation within that unit is disposed of, the goodwill associated with the operation disposed of is included in the carrying amount of the operation when determining the gain or loss on disposal of the operation. Goodwill disposed of in this manner is measured based on the relative values of the operation disposed of and the portion of the cash generating unit retained. Impairment losses recognised for goodwill are not subsequently reversed.
(k) Intangible assets Intangible assets acquired separately or in a business combination are initially measured at cost. The cost of an intangible asset acquired in a business combination is its fair value as at the date of acquisition. Following initial recognition, intangible assets are carried at cost less any accumulated amortisation and any accumulated impairment losses. Internally generated intangible assets, excluding capitalised development costs, are not capitalised and expenditure is charged against profits in the year in which the expenditure is incurred. Research costs are expensed as incurred. Development costs are capitalised and an intangible asset for development expenditure on an internal project is recognised only when the Company can demonstrate the technical feasibility of completing the intangible asset so that it will be available for use or sale, its intention to complete and its ability to use or sell the asset, how the asset will generate future economic benefits, the availability of resources to complete the development and the ability to measure reliably the expenditure attributable to the intangible asset during its development. Following the initial recognition of the development expenditure, the cost model is applied requiring the asset to be carried at cost less any accumulated amortisation and accumulated impairment losses. Any expenditure so capitalised is amortised over the period of expected benefits from the related project commencing from the commercial release of the project. The carrying value of an intangible asset arising from development expenditure is tested for impairment annually when the asset is not yet available for use or more frequently when an indication of impairment arises during the reporting period. Gains or losses arising from derecognition of an intangible asset are measured as the difference between the net disposal proceeds and the carrying amount of the asset and are recognised in profit or loss when the asset is derecognised. The useful lives of intangible assets are assessed to be either finite or indefinite. Intangible assets with finite lives are amortised over the useful life and assessed for impairment whenever there is an indication that the intangible asset may be impaired. The amortisation period and the amortisation method for an intangible asset with a finite useful life is reviewed at least at each financial year-end. Changes in the expected useful life or the expected pattern of consumption of future economic benefits embodied in the asset are accounted for by changing the amortisation period or method, as appropriate, which is a change in accounting estimate. The amortisation expense on intangible assets with finite lives is recognised in profit or loss in the expense category consistent with the function of the intangible asset. Intangible assets with indefinite useful lives are tested for impairment annually either individually or at the cash-generating unit level. Such intangibles are not amortised. The useful life of an intangible asset with an indefinite life is reviewed each reporting period to determine whether indefinite life assessment continues to be supportable. If not, the change in the useful life assessment from indefinite to finite is accounted for as a change in an accounting estimate and is thus accounted for on a prospective basis.

I n f o m e d i a L t d A n n u a l R e p o r t
NOTES TO THE FINANCIAL STATEMENTS
22
30 June 2010 2. SUMMARY OF SIGNIFICANT ACCOUNTING POLICIES (CONTINUED) (l) Impairment of assets The Company assesses at each reporting date whether there is an indication that an asset may be impaired. If any such indication exists, or when annual impairment testing for an asset is required, the Company makes an estimate of the asset’s recoverable amount. An asset’s recoverable amount is the higher of its fair value less costs to sell and its value in use and is determined for an individual asset, unless the asset does not generate cash inflows that are largely independent of those from other assets or groups of assets and the asset's value in use cannot be estimated to be close to its fair value. In such cases the asset is tested for impairment as part of the cash generating unit to which it belongs. When the carrying amount of an asset or cash-generating unit exceeds its recoverable amount, the asset or cash-generating unit is considered impaired and is written down to its recoverable amount. In assessing value in use, the estimated future cash flows are discounted to their present value using a pre-tax discount rate that reflects current market assessments of the time value of money and the risks specific to the asset. Impairment losses relating to continuing operations are recognised in those expense categories consistent with the function of the impaired asset unless the asset is carried at revalued amount (in which case the impairment loss is treated as a revaluation decrease). An assessment is also made at each reporting date as to whether there is any indication that previously recognised impairment losses may no longer exist or may have decreased. If such indication exists, the recoverable amount is estimated. A previously recognised impairment loss is reversed (with the exception of goodwill) only if there has been a change in the estimates used to determine the asset’s recoverable amount since the last impairment loss was recognised. If that is the case the carrying amount of the asset is increased to its recoverable amount. That increased amount cannot exceed the carrying amount that would have been determined, net of depreciation, had no impairment loss been recognised for the asset in prior years. Such reversal is recognised in profit or loss unless the asset is carried at revalued amount, in which case the reversal is treated as a revaluation increase. After such a reversal the depreciation charge is adjusted in future periods to allocate the asset’s revised carrying amount, less any residual value, on a systematic basis over its remaining useful life. (m) Property, plant and equipment Property, plant and equipment is stated at cost less accumulated depreciation and any accumulated impairment losses. Land and buildings are measured at cost less accumulated depreciation on buildings and less any impairment losses recognised. Depreciation is calculated on a straight-line basis over the estimated useful life of the assets as follows: Major depreciation periods are: 2010 2009 Leasehold improvements: 5 to 20 years 5 to 20 years Other plant and equipment: 3 to 15 years 3 to 15 years The assets' residual values, useful lives and amortisation methods are reviewed, and adjusted if appropriate, at each financial year end. (i) Derecognition and disposal An item of property, plant and equipment is derecognised upon disposal or when no further future economic benefits are expected from its use or disposal. Any gain or loss arising on derecognition of the asset (calculated as the difference between the net disposal proceeds and the carrying amount of the asset) is included in profit or loss in the year the asset is derecognised.

I n f o m e d i a L t d A n n u a l R e p o r t
NOTES TO THE FINANCIAL STATEMENTS
23
30 June 2010 2. SUMMARY OF SIGNIFICANT ACCOUNTING POLICIES (CONTINUED) (n) Leases Operating lease payments are recognised as an expense in the income statement on a straight-line basis over the lease term. Lease incentives are recognised in the income statement as an integral part of the total lease expense. (o) Trade and other payables Trade payables and other payables are carried at amortised costs and represent liabilities for goods and services provided to the Company prior to the end of the financial year that are unpaid and arise when the Company becomes obliged to make future payments in respect of the purchase of these goods and services. (p) Provisions Provisions are recognised when the Company has a present obligation (legal or constructive) as a result of a past event, it is probable that an outflow of resources embodying economic benefits will be required to settle the obligation and a reliable estimate can be made of the amount of the obligation. Where the Company expects some or all of a provision to be reimbursed, for example under an insurance contract, the reimbursement is recognised as a separate asset but only when the reimbursement is virtually certain. The expense relating to any provision is presented in the income statement net of any reimbursement. If the effect of the time value of money is material, provisions are determined by discounting the expected future cash flows at a pre-tax rate that reflects current market assessments of the time value of money and, where appropriate, the risks specific to the liability. Where discounting is used, the increase in the provision due to the passage of time is recognised as a borrowing cost. (q) Deferred revenue Certain contracts allow annual subscriptions to be invoiced in advance. The components of revenue relating to the subscription period beyond balance date are recorded as a liability. (r) Contributed equity Ordinary shares are classified as equity. Incremental costs directly attributable to the issue of new shares or options are shown in equity as a deduction, net of tax, from the proceeds. (s) Revenue recognition Revenue is recognised to the extent that it is probable that the economic benefits will flow to the entity and the revenue can be reliably measured. The following specific recognition criteria must also be met before revenue is recognised: Subscriptions Subscription revenue is recognised when the copyright article has passed to the buyer with related support revenue being recognised over the service period. Where the copyright article and related support revenue are inseparable then the revenue is recognised over the service period. Interest Control of a right to receive consideration for the provision of, or investment in, assets has been attained. (t) Cost of sales Cost of sales includes the direct cost of raw materials, direct salary and wages, and agency costs associated with the manufacture and distribution of the product.

I n f o m e d i a L t d A n n u a l R e p o r t
NOTES TO THE FINANCIAL STATEMENTS
24
30 June 2010 2. SUMMARY OF SIGNIFICANT ACCOUNTING POLICIES (CONTINUED) (u) Derivative financial instruments and hedging Derivatives are carried as assets when their fair value is positive and as liabilities when their fair value is negative. Derivative financial instruments are measured at fair value. Any gains or losses arising from changes in the fair value of derivatives, except for those that qualify as cash flow hedges, are taken directly to profit or loss for the year. The fair value of forward currency contracts are calculated by reference to current forward exchange rates for contacts with similar maturity profiles. For the purpose of hedge accounting, hedges are classified as cash flow hedges when they hedge the exposure to variability in cash flows that is attributable either to a particular risk associated with a recognised asset or liability or to a forecast transaction. Infomedia Limited currently has cash flow hedges attributable to future foreign currency sales. Cash flow hedges Cash flow hedges are hedges of the Group’s exposure to variability in cash flows that is attributable to a particular risk associated with anticipated future sales that could affect profit or loss. The effective portion of the gain or loss on the hedging instrument is recognised directly in equity, while the ineffective portion is recognised in profit or loss. Amounts taken to equity are transferred out of equity and included in the measurement of the hedged transaction when the forecast transaction occurs. The Group tests each of the designated cash flow hedges for effectiveness on a monthly basis both retrospectively and prospectively using the “matched terms” principle. At each balance date, hedge effectiveness is measured in the first instance by determining whether there have been any changes to these “matched terms”. When there have been no changes to these “matched terms”, the hedge is considered to be highly effective. Where there has been a change to these terms, effectiveness is measured using the hypothetical derivative method. The parent entity (Infomedia Ltd) sells software to its wholly owned subsidiaries (i.e. IFM North America Inc and IFM Europe Ltd). Sales to IFM North America Inc are denominated in USD. Sales to IFM Europe Ltd are denominated in Euros. Sales to these wholly owned subsidiaries (‘distributors’) are immediately on-sold to customers in the same currency. There is no inventory held by the subsidiaries with the exception of fulfilling new first time through orders. First time through orders will not be hedged. The Group hedges foreign exchange exposure on intra-group sales as this exposure affects consolidated profit when the sale is made to the external customer. (v) Income tax
Current tax assets and liabilities for the current and prior periods are measured at the amount expected to be recovered from or paid to the taxation authorities. The tax rates and tax laws used to compute the amount are those that are enacted or substantively enacted by the balance sheet date. Deferred income tax is provided on all temporary differences at the balance sheet date between the tax bases of assets and liabilities and their carrying amounts for financial reporting purposes. Deferred income tax liabilities are recognised for all taxable temporary differences except: • when the deferred income tax liability arises from the initial recognition of goodwill or of an asset or liability in a transaction that is not a business combination and that, at the time of the transaction, affects neither the accounting profit nor taxable profit or loss; or • when the taxable temporary difference is associated with investments in subsidiaries, associates or interests in joint ventures, and the timing of the reversal of the temporary difference can be controlled and it is probable that the temporary difference will not reverse in the foreseeable future. Deferred income tax assets are recognised for all deductible temporary differences, carry-forward of unused tax assets and unused tax losses, to the extent that it is probable that taxable profit will be available against which the deductible temporary differences and the carry-forward of unused tax credits and unused tax losses can be utilised, except: • when the deferred income tax asset relating to the deductible temporary difference arises from the initial recognition of an asset or liability in a transaction that is not a business combination and, at the time of the transaction, affects neither the accounting profit nor taxable profit or loss; or • when the deductible temporary difference is associated with investments in subsidiaries, associates or interests in joint ventures, in which case a deferred tax asset is only recognised to the extent that it is probable that the temporary difference will reverse in the foreseeable future and taxable profit will be available against which the temporary difference can be utilised.

I n f o m e d i a L t d A n n u a l R e p o r t
NOTES TO THE FINANCIAL STATEMENTS
25
30 June 2010 2. SUMMARY OF SIGNIFICANT ACCOUNTING POLICIES (CONTINUED) (v) Income tax (continued) Deferred income tax assets and liabilities are measured at the tax rates that are expected to apply to the year when the asset is realised or the liability is settled, based on tax rates (and tax laws) that have been enacted or substantively enacted at the balance sheet date. Income taxes relating to items recognised directly in equity are recognised in equity and not in profit or loss. Deferred tax assets and deferred tax liabilities are offset only if a legally enforceable right exists to set off current tax assets against current tax liabilities and the deferred tax assets and liabilities relate to the same taxable entity and the same taxation authority. The tax consolidated current tax liability and other deferred tax assets are required to be allocated to the members of the tax consolidated group in accordance with UIG 1052. The group uses a group allocation method for this purpose where the allocated current tax payable, deferred tax assets and other tax credits for each member of the tax consolidated group is determined as if the company is a stand-alone taxpayer but modified as necessary to recognise membership of a tax consolidated group. Recognition of amounts allocated to members of the tax consolidated group has regard to the tax consolidated groups future tax profits. (w) Other taxes
Revenues, expenses and assets are recognised net of the amount of Goods and Services Tax (“GST”) except: • when the GST incurred on a purchase of goods and services is not recoverable from the taxation authority, in which case the GST is recognised as part of the cost of acquisition of the asset or as part of the expense item as applicable; and • receivables and payables, which are stated with the amount of GST included. The net amount of GST recoverable from, or payable to, the taxation authority is included as part of receivables or payables in the balance sheet. Cash flows are included in the Cash Flow Statement on a gross basis and the GST component of cash flows arising from investing and financing activities, which is recoverable from, or payable to, the taxation authority are classified as operating cash flows. Commitments and contingencies are disclosed net of the amount of GST recoverable from, or payable to, the taxation authority. (x) Employee leave benefits
(i) Wages, salaries and annual leave Liabilities for wages and salaries, including non-monetary benefits, and annual leave expected to be settled within 12 months of the reporting date are recognised in other payables in respect of employees’ services up to the reporting date. They are measured at the amounts expected to be paid when the liabilities are settled. Liabilities for non-accumulating sick leave are recognised when the leave is taken and are measured at the rates paid or payable. (ii) Long service leave The liability for long service leave is recognised in the provision for employee benefits and measured as the present value of expected future payments to be made in respect of services provided by employees up to the reporting date. Consideration is given to expected future wage and salary levels, experience of employee departures, and period of service. Expected future payments are discounted using market yields at the reporting date on national government bonds with terms to maturity and currencies that match, as closely as possible, the estimated future cashflows. (iii) Post employment and termination benefits A Superannuation expense at 9% of salaries is recognised on a straight line basis . Termination benefits are recognised at the point of being incurred where relevant.

I n f o m e d i a L t d A n n u a l R e p o r t
NOTES TO THE FINANCIAL STATEMENTS
26
30 June 2010 2. SUMMARY OF SIGNIFICANT ACCOUNTING POLICIES (CONTINUED) (y) Share-based payment transactions The Company provides benefits to employees in the form of share-based payment transactions, whereby employees render services in exchange for shares or options over shares (‘equity-settled transactions’). There are currently two plans in place to provide these benefits: (i) the Employee Share Plan (ESP), and (ii) the Employee Option Plan (EOP). The cost of these equity-settled transactions with employees is measured by reference to the fair value at the date at which they are granted. The fair value is determined by an external valuer using a binomial model. In valuing equity-settled transactions, no account is taken of any performance conditions, other than conditions linked to the price of the shares of Infomedia Ltd (‘market conditions’). The cost of equity-settled transactions is recognised, together with a corresponding increase in equity, over the period in which the performance conditions are fulfilled, ending on the date on which the relevant employees become fully entitled to the option (‘vesting date’). The cumulative expense recognised for equity-settled transactions at each reporting date until vesting date reflects (i) the extent to which the vesting period has expired and (ii) the number of options that, in the opinion of the Directors of the Company, will ultimately vest. This opinion is formed based on the best available information at balance date. No adjustment is made for the likelihood of market performance conditions being met as the effect of these conditions is included in the determination of fair value at grant date. Where the terms of an equity-settled option are modified, as a minimum an expense is recognised as if the terms had not been modified. In addition, an expense is recognised for any increase in the value of the transaction as a result of the modification, as measured at the date of modification. Where an equity-settled option is cancelled, it is treated as if it had vested on the date of cancellation, and any expense not yet recognised for the option is recognised immediately. However, if a new option is substituted for the cancelled option, and designated as a replacement option on the date that it is granted, the cancelled and new option are treated as if they were a modification of the original option, as described in the previous paragraph. The dilutive effect, if any, of outstanding options is reflected as additional share dilution in the computation of earnings per share. (z) Earnings per share Basic earnings per share is determined by dividing the profit attributed to members of the parent after related income tax expense by the weighted average number of ordinary shares outstanding during the financial year. Diluted earnings per share is calculated as net profit attributable to members, adjusted for: - cost of servicing equity (other than dividends); - the after tax effect of dividends and interest associated with dilutive potential ordinary shares that have been recognised as
expenses; and - other non-discretionary changes in revenue or expenses during the period that would result from the dilution of potential
ordinary shares; divided by the weighted average number of ordinary shares and dilutive potential ordinary shares, adjusted for any bonus element.

I n f o m e d i a L t d A n n u a l R e p o r t
NOTES TO THE FINANCIAL STATEMENTS
27
30 June 2010 Notes CONSOLIDATED
2010 2009
$’000 $’000
3. EXPENSES
(i) Cost of sales Direct wages 13,413 13,829 Other 8,491 8,278 Total cost of sales 21,904 22,107 (ii) Employee benefit expense Salaries and wages (including on-costs) 10,662 9,213 Share based payment expense 19 43 93 Total employee benefit expense 10,705 9,306
(iii) Depreciation and amor tisation Depreciation of non-current assets: - Leasehold improvements 106 132 - Office equipment 510 624 - Furniture and fittings 30 24 - Plant and equipment 131 218 Total depreciation of non-current assets 777 998 Amortisation of non-current assets - Intellectual property 147 607 - Deferred development costs 2,821 1,837
Total amortisation of non-current assets 2,968 2,444
Total depreciation and amortisation 3,745 3,442 (iv) Research & development costs Total research & development costs incurred during the period 9,683 10,880 Less: development costs deferred 10 (6,688) (6,526) Net research and development costs expensed 2,995 4,354

I n f o m e d i a L t d A n n u a l R e p o r t
NOTES TO THE FINANCIAL STATEMENTS
28
30 June 2010 Notes CONSOLIDATED
2010 2009
$’000 $’000
4. INCOME TAX
The major components of income tax expense are: Income statement Current income tax Current income tax charge 2,415 2,576 Adjustments in respect of current income tax of previous years. (488) (1,067) Deferred income tax Relating to origination and reversal of temporary differences 1,234 728 Income tax expense reported in the income statement 3,161 2,237
A reconciliation between tax expense and the product of accounting profit before income tax multiplied by the Company's applicable income tax rate is as follows:
Accounting profit before income tax 14,497 12,773
4,349 3,832 At the Company's statutory income tax rate of 30% (2009: 30%)
Adjustments in respect of income tax of previous years (677) (1,185) Additional research and development deduction (596) (592) Expenditure not allowable for income tax purposes 85 182 Income tax expense reported in the income statement 3,161 2,237
Tax consolidation Effective 1 July 2002, for the purposes of income taxation, Infomedia Ltd and its 100% owned Australian subsidiaries have formed a tax consolidated group. Members of the group have entered into a tax sharing arrangement in order to allocate income tax expense to the wholly-owned subsidiaries. In addition the agreement provides for the allocation of income tax liabilities between the entities should the head entity default on its tax payment obligations. At the balance date, the possibility of default is remote.
Members of the tax consolidated group have also entered into a tax funding agreement. The tax funding agreement provides for the funding of allocated tax liabilities, tax losses and foreign tax credits for the current period based on the recognition criteria set out in the accounting policy for income taxes. Allocations under the tax funding agreement are made after the finalisation of the group’s income tax return. The allocation of taxes under the tax funding agreement is recognised as an increase/decrease in the subsidiaries' intercompany accounts with the tax consolidated group head company, Infomedia Ltd.

I n f o m e d i a L t d A n n u a l R e p o r t
NOTES TO THE FINANCIAL STATEMENTS
29
30 June 2010 Notes BALANCE SHEET INCOME STATEMENT 2010 2009 2010 2009
4. INCOME TAX (CONTINUED) $’000 $’000 $’000 $’000
Deferred income tax Deferred income tax at 30 June relates to the following: CONSOLIDATED Deferred tax liabilities Derivatives (908) (1,276) - - Property plant and equipment - - - (90) Deferred development costs (5,965) (4,805) 1,160 1,406 Intellectual property (81) (125) (44) (50) Other (78) - 78 (6) (7,032) (6,206)
CONSOLIDATED Deferred tax assets Allowance for doubtful debts 46 148 102 (100) Other payables 145 207 62 (115) Employee entitlement provisions 737 625 (112) (85) Other provisions 461 346 (115) 62 Currency exchange 243 346 103 (294) Gross deferred income tax assets 1,632 1,672 Deferred tax income/ (expense) 1,234 728
5. EARNINGS PER SHARE
Basic earnings per share amounts are calculated by dividing net profit for the year attributable to ordinary equity holders of the parent by the weighted average number of ordinary shares outstanding during the year.
Diluted earnings per share amounts are calculated by dividing the net profit attributable to ordinary shareholders by the weighted average number of ordinary shares outstanding during the year (adjusted for the effects of dilutive options).
The following reflects the income and share data used in the total operations basic and diluted earnings per share computations:
Notes CONSOLIDATED
2010 2009
$’000 $’000
Net profit attributable to equity holders from continuing operations 11,336 10,536
Number of
shares Number of
shares Weighted average number of ordinary shares for basic earnings per share 309,754,267 317,723,325 Effect of dilution: Share options 24,417 57,416 Adjusted weighted average number of ordinary shares for diluted earnings per share 309,778,684 317,780,741 Since the reporting date, prior to the completion of these financial statements, the company has repurchased a further 1,117,182 shares through its buy back program at a weighted average price of 25.85 cents per share. Total equivalent shares outstanding on out-of-the-money options that were not dilutive for the respective periods but could potentially dilute earnings per share in the future were 1,650,000 (2009: 2,150,000)

I n f o m e d i a L t d A n n u a l R e p o r t
NOTES TO THE FINANCIAL STATEMENTS
30
30 June 2010 Notes
CONSOLIDATED
2010 2009
$’000 $’000
6. DIVIDENDS PROPOSED OR PAID
(a) Dividends paid during the year:
Interim dividend – 1.2 cents unfranked (2009: 0.7 cents fully franked) per share
3,729 2,215
Prior year final dividend – 2.1 cents, franked at 0.7c (2009: 1.4 cents fully franked) per share
6,534 4,485
Rounding - (1)
Total dividends paid during the year 10,263 6,699
(b) Dividends proposed and not recognised as a liability:
Final dividend – 1.2 cents per share, unfranked. (2009: 2.1 cents, franked at 0.7 cents)
3,644 6,534
(c) Franking credit balance:
The amount of franking credits available for the subsequent financial year are:
– franking account balance as at the end of the financial year
92 113
– franking credits/(debits) that will arise from the payment/(receipt) of income tax payable/(receivable) as at the end of the financial year
864 (113)
956 -
If fully franked, the tax rate on dividends is 30% (2009: 30%).

I n f o m e d i a L t d A n n u a l R e p o r t
NOTES TO THE FINANCIAL STATEMENTS
31
30 June 2010 CONSOLIDATED
2010 2009
7. TRADE AND OTHER RECEIVABLES (CURRENT)
$’000 $’000
Trade debtors 4,330 4,945
Allowance for impairment loss (a) (218) (644)
4,112 4,301
Other debtors 48 95
4,160 4,396
(a) Allowance for impairment loss
Trade receivables are non-interest bearing and are generally on 30-60 day terms. A provision for impairment loss is recognised when there is objective evidence that an individual trade receivable is impaired. An impairment gain of $283,000 (2009: $742,000 loss) has been recognised by the group in the current year. These amounts have been included in the other expenses item. The amount of the allowance/impairment loss is recognised as the difference between the carrying amount of the debtor and the estimated future cash flows expected to be received from the relevant debtors.
Movements in the provision for impairment loss were as follows:
At 1 July 644 272
Charge/(release) for the year (283) 742
Foreign exchange translation (16) (17)
Amounts written off (127) (353)
At 30 June 218 644 At 30 June the aging analysis of trade receivables is as follows:
Total 0-60 days NI*
0-60 days CI*
61-120 days NI*
61-120 days CI*
121+ days NI*
121+ days CI*
2010 Consolidated 4,330 3,714 22 188 13 210 183
2009 Consolidated 4,945 3,732 270 516 137 53 237 * Not impaired (NI) Considered impaired (CI)

I n f o m e d i a L t d A n n u a l R e p o r t
NOTES TO THE FINANCIAL STATEMENTS
32
30 June 2010 Notes CONSOLIDATED
2010 2009
$’000 $’000
8. INVENTORIES
Raw materials
At cost 56 54
Total inventories at the lower of cost and net realisable value
56 54
Notes CONSOLIDATED
2010 2009
9. PROPERTY, PLANT & EQUIPMENT $’000 $’000
(a)
Leasehold improvements
At cost 428 950
Accumulated amortisation (373) (644)
55 306
Office equipment
At cost 6,845 6,702
Accumulated depreciation (6,003) (5,493)
842 1,209
Furniture and fittings
At cost 403 272
Accumulated depreciation (161) (131)
242 141
Plant and equipment
At cost 3,137 3,021
Accumulated depreciation (2,971) (2,840)
166 181
Total property, plant and equipment
At cost 10,813 10,945
Accumulated depreciation and amortisation (9,508) (9,108)
Total written down amount 1,305 1,837

I n f o m e d i a L t d A n n u a l R e p o r t
NOTES TO THE FINANCIAL STATEMENTS
33
30 June 2010 CONSOLIDATED
9. PROPERTY, PLANT & EQUIPMENT (CONTINUED)
2010 2009
$’000 $’000
(b) Reconciliation of property, plant and equipment carrying values
Leasehold Improvements
Carrying amount – opening balance 306 432
Additions - 6
Disposals (145) -
Depreciation (106) (132)
Carrying amount – closing balance 55 306
Office equipment
Carrying amount – opening balance 1,209 1,146
Additions 148 703
Disposals (5) (16)
Depreciation (510) (624)
Carrying amount – closing balance 842 1,209
Furniture and fittings
Carrying amount – opening balance 141 159
Additions 131 8
Disposals - (2)
Depreciation (30) (24)
Carrying amount – closing balance 242 141
Plant and equipment
Carrying amount – opening balance 181 315
Additions 116 84
Depreciation (131) (218)
Carrying amount – closing balance 166 181
Total property, plant and equipment
Carrying amount – opening balance 1,837 2,052 Additions 395 801 Disposals (150) (18) Depreciation (777) (998)
Carrying amount – closing balance 1,305 1,837

I n f o m e d i a L t d A n n u a l R e p o r t
NOTES TO THE FINANCIAL STATEMENTS
34
30 June 2010
10. INTANGIBLE ASSETS AND GOODWILL
CONSOLIDATED
Development costs
$000
1 Intellectual Property
$’000
2 Goodwill
$’000
2 Total
$’000
At 1 July 2009
Cost (gross carrying amount) 21,983 2,537 8,541 33,061
Accumulated amortisation (5,965) (2,120) - (8,085)
Net carrying amount 16,018 417 8,541 24,976
Year ended 30 June 2010
At 1 July 2009, net of accumulated amortisation and impairment 16,018 417 8,541 24,976
Additions 6,688 - - 6,688
Amortisation (2,821) (147) - (2,968)
At 30 June 2010, net of accumulated amortisation and impairment 19,885 270 8,541 28,696
At 30 June 2010
Cost (gross carrying amount) 28,671 2,537 8,541 39,749
Accumulated amortisation (8,786) (2,267) - (11,053)
Net carrying amount 19,885 270 8,541 28,696
1. Internally generated 2. Purchased as part of business/territory acquisition Development costs that meet the recognition criteria as an intangible asset have been capitalised at cost. This intangible asset has been assessed as having a finite life and is amortised using the straight-line method over a period not exceeding four years commencing from the commercial release of the project. If an impairment indication arises, the recoverable amount is estimated and an impairment loss is recognised to the extent that the recoverable amount is lower than the carrying amount. Intellectual property includes intangible assets acquired through business or territory acquisition and relates primarily to copyright and software code over key products. Intellectual property is amortised over its useful life being 3 years.

I n f o m e d i a L t d A n n u a l R e p o r t
NOTES TO THE FINANCIAL STATEMENTS
35
10. INTANGIBLE ASSETS AND GOODWILL (CONTINUED)
CONSOLIDATED
Development costs
$000
Intellectual Property
$’000
Goodwill
$’000
Total
$’000
At 1 July 2008
Cost (gross carrying amount) 15,457 2,096 8,541 26,094
Accumulated amortisation (4,128) (1,513) - (5,641)
Net carrying amount 11,329 583 8,541 20,453
Year ended 30 June 2009
At 1 July 2008, net of accumulated amortisation and impairment 11,329 583 8,541 20,453
Purchase from wholly owned subsidiary - - - -
Additions 6,526 441 - 6,967
Amortisation (1,837) (607) - (2,444)
At 30 June 2009, net of accumulated amortisation and impairment 16,018 417 8,541 24,976
At 30 June 2009
Cost (gross carrying amount) 21,983 2,537 8,541 33,061
Accumulated amortisation (5,965) (2,120) - (8,085)
Net carrying amount 16,018 417 8,541 24,976

I n f o m e d i a L t d A n n u a l R e p o r t
NOTES TO THE FINANCIAL STATEMENTS
36
11. IMPAIRMENT TESTING OF GOODWILL Goodwill acquired through business combinations or territory acquisition have been allocated to four individual cash generating units, each of which is a reportable segment (refer note 24) for impairment testing as follows: • Asia Pacific; • Europe; • North America; and • Latin and South America The recoverable amount of each cash generating unit has been determined based on a value in use calculation using cash flow projections as at 30 June 2010 based on financial budgets approved by The Board for the 2011 financial year extrapolated for a five year period on the basis of 5% growth together with a terminal value. The pre-tax discount rate applied to cash flow projections is 14% (2009: 14 %). The discount rate reflects management estimate of the time value of money and the rates specific to the unit. Carrying amount of goodwill allocated to each of the cash generating units is as follows: Total
Asia Pacific
Europe North America
Latin and South
America
2010 2009
$’000 $’000 $’000 $’000 $’000 $’000
CONSOLIDATED Carrying amount of goodwill 1,938 4,074 1,954 575 8,541 8,541
Key assumptions used in value in use calculations: The following describes each key assumption on which management has based its cash flow projections when determining the value in use of its cash generating units:
• The Company will continue to have access to the data supply from automakers over the budgeted period; • The Company will not experience any substantial adverse movements in currency exchange rates; • The Company’s research and development program will ensure that the current suite of products remain leading edge; • The company is able to maintain its current gross margins; and • The discount rates estimated by management are reflective of the time value of money. • Management has used an AUD/USD exchange rate of $0.92 and an AUD/EUR exchange rate of $0.67 in its cash flow projections.
Sensitivity to changes in assumptions:
Growth rate assumptions –Management notes if negative growth rates are applied to revenues, by 5% over the five year period, this still yields a recoverable amount to be above its carrying amount. Discount rate assumptions – Management recognises that the time value of money may vary from what they have estimated. Management notes that applying a discount rate of double the current rate still yields the recoverable amount to be above its carrying amount. Foreign exchange rate assumptions –Management notes that applying an AUD/USD exchange rate of $1.00 and an AUD/EUR exchange rate of $0.75 still yields the recoverable amount to be above its carrying amount.

I n f o m e d i a L t d A n n u a l R e p o r t
NOTES TO THE FINANCIAL STATEMENTS
37
30 June 2010 Notes CONSOLIDATED
2010 2009
$’000 $’000
12. TRADE AND OTHER PAYABLES (CURRENT)
Trade creditors 12(a) 1,027 686
Other creditors 2,711 2,919
3,738 3,605
(a) Trade creditors are non-interest bearing and are normally settled on 30 day terms.
Due to the short term nature of these payables, their carrying value is assumed to approximate their fair value.
13. PROVISIONS (CURRENT)
Employee benefits 15(c) 2,000 2,135
Provision for non-cancellable surplus lease space and other lease incentives 15(a) - 265
2,000 2,400
14. DEFERRED REVENUE (CURRENT)
Revenue in advance 481 458
481 458

I n f o m e d i a L t d A n n u a l R e p o r t
NOTES TO THE FINANCIAL STATEMENTS
38
30 June 2010 Notes CONSOLIDATED
2010 2009
$’000 $’000
15. PROVISIONS (NON-CURRENT)
Employee benefits 306 254
Provision for non-cancellable surplus lease space and other lease incentives 15(a) - 354
Make good provision 15(b) - 500
306 1,108
(a) Movement in non-cancellable surplus lease space and other lease incentives provision:
Carrying amount at the beginning of the year 619 858
Utilised (226) (300)
Reversal of provision due to new lease and revision of terms (422) -
Discount rate adjustment 29 61
Carrying amount at the end of the year - 619
Current 13 - 265
Non-current - 354
- 619
The provision for non-cancellable lease space and other lease incentives has been made pursuant to the lease obligations under contract to the extent that no future benefits are anticipated.
(b) Movement in make good provision:
Carrying amount at the beginning of the year 500 500
Arising during the year - -
Reversal of provision due to new lease and revision of terms (500) -
Carrying amount at the end of the year - 500
The provision for make good has been estimated pursuant to the Company’s obligation to restore leased premises to original condition at the end of the lease term.
(c) Movement in employee benefit provision:
Carrying amount at the beginning of the year 2,389 2,056
Utilised (1,798) (1,869)
Arising during the year 1,715 2,202
Carrying amount at the end of the year 2,306 2,389
Current 13 2,000 2,135
Non-current 306 254
2,306 2,389

I n f o m e d i a L t d A n n u a l R e p o r t
NOTES TO THE FINANCIAL STATEMENTS
39
30 June 2010 Notes CONSOLIDATED
2010 2009
16. CONTRIBUTED EQUITY AND RESERVES $’000 $’000
Ordinary shares 11,131 12,863
11,131 12,863
Fully paid ordinary shares carry one vote per share and carry the right to dividends.
Notes Number $’000
Movement in ordinary shares on issue:
At 1 July 2008 322,373,606 16,368
Shares repurchased (11,103,612) (3,505)
At 30 June 2009 311,269,994 12,863
Shares repurchased (6,694,918) (1,732)
At 30 June 2010 304,575,076 11,131
On 1 April 2008 the company commenced a share buy back (on market within 10/12 limit). This was reinitiated on 1 April 2009. As at 30 June 2010 the company had repurchased 21,396,496 shares for a total consideration of $6,607,000. Capital management When managing capital, the company’s objective is to ensure the entity continues as a going concern as well as to maintain optimal returns to shareholders and benefits for other stakeholders. Subject to the company’s financial position and future financial performance, the company’s current dividend policy is to distribute, in the order of 75-85% of profit after tax. During the 2010 financial year, the company paid dividends of $10.3 million (2009: $6.7 million). The company has no current plans to issue further shares on the market but intends to further reduce the capital structure through its share buy back policy.

I n f o m e d i a L t d A n n u a l R e p o r t
NOTES TO THE FINANCIAL STATEMENTS
40
16. CONTRIBUTED EQUITY AND RESERVES (CONTINUED) Employee Option Plan There were nil (2009: 900,000) options issued during the current year at an average exercise price of $nil (2009: $0.33). 30 June 2010 CONSOLIDATED
Employee equity benefits
reserve
Foreign currency
translation reserve
Cashflow hedge reserve
Total
$’000 $’000 $’000 $’000
Movement in reserves:
At 1 July 2008 1,058 (56) 625 1,627 Currency translation differences - 193 - 193
Share based payments 94 - - 94 Derivatives marked to market - - 2,351 2,351
At 30 June 2009 1,152 137 2,976 4,265 Currency translation differences - (290) - (290)
Share based payments 43 - - 43 Derivatives marked to market - - (857) (857)
At 30 June 2010 1,195 (153) 2,119 3,161
Nature and purpose of reserves
Employee equity benefits reserve This reserve is used to record the value of equity benefits provided to employees and Directors as part of their compensation. Refer to Note 19 for further details. Foreign currency translation reserve The foreign currency translation reserve is used to record exchange differences arising from the translation of the financial statements of foreign subsidiaries. It is also used to record the effect of hedging net investments in foreign operations. Cashflow hedge reserve The derivatives reserve is used to record the mark to market valuation of forward currency contracts at the balance sheet date that are considered effective hedges.

I n f o m e d i a L t d A n n u a l R e p o r t
NOTES TO THE FINANCIAL STATEMENTS
41
30 June 2010 Notes CONSOLIDATED
2010 2009
17. STATEMENT OF CASH FLOWS $’000 $’000
(a) Reconciliation of profit after tax to the net cash flows from operations
Profit from ordinary activities after income tax expense 11,336 10,536 Depreciation of non-current assets 777 998 Amortisation of non-current assets 2,968 2,444 Amortisation of employee options 43 93 Disposal of property, plant, and equipment 150 18 Other - (5) Changes in assets and liabilities (Increase)/decrease in trade and other debtors 371 645 (Increase)/decrease in inventories (3) 28 (Increase)/decrease in prepayments 446 (3,174) (Increase)/decrease in deferred development costs (6,688) (6,526) Increase/(decrease) in trade and other creditors 134 (221) Increase/(decrease) in allowance for doubtful debts (426) 371 Increase/(decrease) in provision for employee entitlements (83) (239) Increase/(decrease) in other provisions (1,121) 336 Increase/(decrease) in income tax payable 1,013 (717) Increase/(decrease) in deferred income tax liability 1,234 728 Increase/(decrease) in revenue in advance 23 (111)
Net cash flow from operating activities 10,174 5,204
(b) Reconciliation of cash
Cash balance comprises: – cash at bank 898 928 – cash on deposit 4,891 7,077
5,789 8,005

I n f o m e d i a L t d A n n u a l R e p o r t
NOTES TO THE FINANCIAL STATEMENTS
42
30 June 2010 Notes CONSOLIDATED
2010 2009
18. COMMITMENTS & CONTINGENCIES $’000 $’000
(a) Lease expenditure commitments
Operating leases (non-cancellable):
Minimum lease payments
– not later than one year 1,207 1,446
– later than one year and not later than five years 3,556 1,261
– later than five years 1,301 -
– aggregate operating lease expenditure contracted for at balance date 6,064 2,707
Operating lease commitments are for office accommodation both in Australia and abroad.
(b) Performance Bank Guarantee
Infomedia Ltd has a performance bank guarantee to a maximum value of $700,000 (2009: $700,000) relating to the lease commitments of its corporate headquarters.

I n f o m e d i a L t d A n n u a l R e p o r t
NOTES TO THE FINANCIAL STATEMENTS
43
19. SHARE BASED PAYMENT PLANS
Employee Option Plan
The Employee Option Plan entitles the Company to offer ‘eligible employees’ options to subscribe for shares in the Company. Options will be granted at a nil issue price unless otherwise determined by the Directors of the Company and each Option enables the holder to subscribe for one Share. The exercise price for the Options granted will be as specified on the option certificate or, if not specified, the volume weighted average price for Shares of the Company for the five days trading immediately before the day on which the options were granted. The Options may be exercised in accordance with the date determined by the Board, which must be within four years of the option being granted.
Information with respect to the number of options granted under the employee share incentive scheme is as follows:
Notes 2010 2009
Number of
options
Weighted average
exercise price Number of
options
Weighted average exercise
price
Balance at beginning of year 19(a) 2,650,000 0.44 1,950,000 $0.50
- granted 19(b) - - 900,000 $0.33
- expired 19(c) (500,000) 0.42 (200,000) $0.49
- exercised 19(d) - - - -
Balance at end of year 19(e) 2,150,000 0.45 2,650,000 $0.44
(a) Options held at the beginning of the year: The following table summarises information about options held by employees at 1 July 2009
Number of options Grant date Earliest vesting
date Expiry date
Weighted average
exercise price
1,000,000
1/01/2008 1/01/2009 5/02/2011 0.53
250,000
1/02/2009 1/02/2010 5/02/2012 0.29
250,000
1/01/2008 1/01/2009 5/02/2011 0.53
250,000
1/01/2009 1/01/2010 5/01/2012 0.29
500,000
1/05/2008 1/05/2009 13/04/2011 0.42
250,000
1/10/2008 1/10/2009 31/10/2011 0.37
150,000 1/07/2008 1/07/2009 5/11/2011 0.38
(b) Options granted during the year: There were no options granted during the year.
(c) Options expired during the year: The following table summarises information about options expired during the year.
Number of options Grant date Earliest vesting
date Expiry date
Weighted average
exercise price
500,000 1/05/2008 1/05/2009 13/04/2011 $0.42
(d) Options exercised during the year: There were no options exercised during the year.
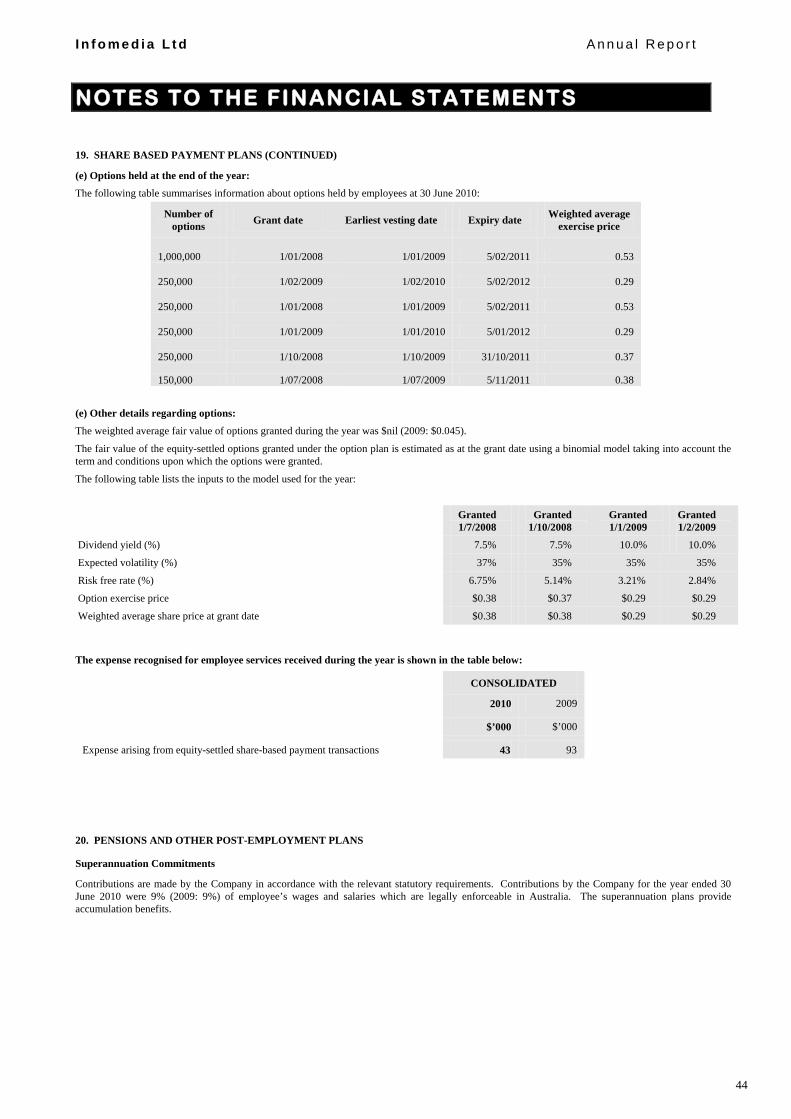
I n f o m e d i a L t d A n n u a l R e p o r t
NOTES TO THE FINANCIAL STATEMENTS
44
19. SHARE BASED PAYMENT PLANS (CONTINUED)
(e) Options held at the end of the year: The following table summarises information about options held by employees at 30 June 2010:
Number of
options Grant date Earliest vesting date Expiry date Weighted average exercise price
1,000,000 1/01/2008 1/01/2009 5/02/2011 0.53
250,000 1/02/2009 1/02/2010 5/02/2012 0.29
250,000 1/01/2008 1/01/2009 5/02/2011 0.53
250,000 1/01/2009 1/01/2010 5/01/2012 0.29
250,000 1/10/2008 1/10/2009 31/10/2011 0.37
150,000 1/07/2008 1/07/2009 5/11/2011 0.38
(e) Other details regarding options: The weighted average fair value of options granted during the year was $nil (2009: $0.045).
The fair value of the equity-settled options granted under the option plan is estimated as at the grant date using a binomial model taking into account the term and conditions upon which the options were granted.
The following table lists the inputs to the model used for the year:
Granted 1/7/2008
Granted 1/10/2008
Granted 1/1/2009
Granted 1/2/2009
Dividend yield (%) 7.5% 7.5% 10.0% 10.0%
Expected volatility (%) 37% 35% 35% 35%
Risk free rate (%) 6.75% 5.14% 3.21% 2.84%
Option exercise price $0.38 $0.37 $0.29 $0.29
Weighted average share price at grant date $0.38 $0.38 $0.29 $0.29
The expense recognised for employee services received during the year is shown in the table below:
CONSOLIDATED
2010 2009
$’000 $’000
Expense arising from equity-settled share-based payment transactions 43 93
20. PENSIONS AND OTHER POST-EMPLOYMENT PLANS
Superannuation Commitments
Contributions are made by the Company in accordance with the relevant statutory requirements. Contributions by the Company for the year ended 30 June 2010 were 9% (2009: 9%) of employee’s wages and salaries which are legally enforceable in Australia. The superannuation plans provide accumulation benefits.

I n f o m e d i a L t d A n n u a l R e p o r t
NOTES TO THE FINANCIAL STATEMENTS
45
21. KEY MANAGEMENT PERSONNEL DISCLOSURES (a) Compensation of Key Management Personnel
(i) Compensation by Category: Key Management Personnel
CONSOLIDATED
2010 2009
$ $
Short-Term 1,868,053 2,141,256
Post Employment 129,041 128,251
Other Long-Term 17,967 17,667
Termination benefits 130,930 -
Share-based Payments 40,047 75,024
2,186,038 2,362,198
(b) Option holdings of Key Management Personnel (Consolidated)
30 June 2010
Balance at beginning of
period Granted as
compensation Options
exercised Expired Balance at
end of period Vested at 30 June 2010
1 July 2009 30 June 2010 Total
Not exercisable Exercisable
Directors
Gary Martin 1,000,000 - - - 1,000,000 1,000,000 333,334 666,666
Executives
Michael Bodner* 500,000 - - (500,000) - - - -
Nick Georges 250,000 - - - 250,000 250,000 83,334 166,666
Michael Roach 250,000 - - - 250,000 250,000 166,667 83,333
Andrew Pattinson 250,000 - - - 250,000 250,000 166,667 83,333
Jonathan Pollard 250,000 - - - 250,000 250,000 166,667 83,333
2,500,000 - - (500,000) 2,000,000 2,000,000 916,669 1,083,331
30 June 2009
Balance at beginning of
period Granted as
compensation Options
exercised Net change
other Balance at
end of period Vested at 30 June 2009
1 July 2008 30 June 2009 Total
Not exercisable Exercisable
Directors
Gary Martin 1,000,000 - - - 1,000,000 1,000,000 666,667 333,333
Executives
Michael Bodner 500,000 - - - 500,000 500,000 333,333 166,667
Nick Georges 250,000 - - - 250,000 250,000 166,667 83,333
Michael Roach 200,000 250,000 - (200,000) 250,000 250,000 250,000 -
Andrew Pattinson - 250,000 - - 250,000 250,000 250,000 -
Jonathan Pollard - 250,000 - - 250,000 250,000 250,000 -
1,950,000 750,000 - (200,000) 2,500,000 2,500,000 1,916,667 583,333
* Resigned 31 May 2010.

I n f o m e d i a L t d A n n u a l R e p o r t
NOTES TO THE FINANCIAL STATEMENTS
46
21. KEY MANAGEMENT PERSONNEL DISCLOSURES (CONTINUED)
(c) Shareholdings of Key Management Personnel
30 June 2010
Number of shares held in Infomedia Ltd Balance 30 June
2009 Granted as
compensation On exercise of options
Net change other
Balance 30 June 2010
Directors
Richard Graham 102,204,060 - - 798,527 103,002,587
Myer Herszberg 23,421,589 - - - 23,421,589
Gary Martin 607,590 - - 48,000 655,590
Frances Hernon 5,000 - - - 5,000
Andrew Moffat - - - 300,000 300,000
Executives
Andrew Pattinson 2,447,567 - - - 2,447,567
Nick Georges 24,421 - - - 24,421
Michael Roach 18,721 - - - 18,721
Jonathan Pollard 1,996 - - - 1,996
Total 128,730,944 - - 1,146,527 129,877,471
30 June 2009
Number of shares held in Infomedia Ltd Balance 1 July
2008 Granted as
compensation On exercise of options
Net change other
Balance 30 June 2009
Directors
Richard Graham 102,204,060 - - - 102,204,060
Myer Herszberg 23,421,589 - - - 23,421,589
Gary Martin 507,590 - - 100,000 607,590
Frances Hernon 5,000 - - - 5,000
Executives
Andrew Pattinson 2,447,567 - - - 2,447,567
Nick Georges 24,421 - - - 24,421
Michael Roach 18,721 - - - 18,721
Jonathan Pollard 1,996 - - - 1,996
Total 128,630,944 - - 100,000 128,730,944
All equity transactions with key management personnel other than those arising from the exercise of compensation options and compensation shares have been entered into under terms and conditions no more favourable than those the entity would have adopted if dealing at arm’s length.

I n f o m e d i a L t d A n n u a l R e p o r t
NOTES TO THE FINANCIAL STATEMENTS
47
21. KEY MANAGEMENT PERSONNEL DISCLOSURES (CONTINUED)
(d) Loans to Key Management Personnel
There were no loans at the beginning or the end of the reporting period to key management personnel. No loans were made available during the reporting period to key management personnel.
(e) Other transactions and balances with Key Management Personnel (including related entities)
(i) Infomedia Ltd received financial consulting services from Cowoso Capital Pty Limited in the prior year, a company in which Andrew Moffat is a Director. The total consulting services paid for the year ended 30 June 2010 of $nil (2009: $17,600) were on normal commercial terms.
22. AUDITORS’ REMUNERATION CONSOLIDATED
2010 2009
$ $
Amounts received or due and receivable by the auditors of Infomedia Ltd for:
– an audit or review of the financial report of the entity and any other entity in the consolidated entity
180,250 194,428
– corporate advisory consulting services in relation to the entity and any other entity in the consolidated entity
47,825 18,540
228,075 212,968
23. RELATED PARTY DISCLOSURES
Ultimate Parent Infomedia Ltd is the ultimate Australian parent company
Wholly-owned group transactions (a) An unsecured, trade receivable of $481,545 (2009: $620,116) remains owing to IFM Europe Ltd from Infomedia Ltd.
(b) An unsecured, trade receivable of $1,650,603 (2009: $733,565) remains owing from IFM North America Inc. to Infomedia Ltd.
(c) During the year Infomedia Ltd received $16,817,282 (2009: $18,562,696) from IFM Europe Ltd for intra-group sales.
(d) During the year Infomedia Ltd received $7,467,452 (2009: $9,165,428) from IFM North America Inc. for intra-group sales
(e) During the year IFM Europe paid $547,159 (2009: $728,553) to IFM Germany GmbH for intra-group distribution services.
Entity with deemed significant influence over the Company Wiser Equity Pty Limited, a company in which Richard Graham is a Director, owns 33.82% of the ordinary shares in Infomedia Ltd (2009: 32.2%).

I n f o m e d i a L t d A n n u a l R e p o r t
NOTES TO THE FINANCIAL STATEMENTS
48
24. SEGMENT INFORMATION
30 June 2010
Business Segments
Asia Pacific
Europe North America
Latin & South
America Corporate Total
Notes $’000 $’000 $’000 $’000 $’000 $’000 REVENUE Sales revenue 10,285 21,627 10,374 3,053 - 45,339 Consolidated revenue 45,339 Segment result 6,796 16,221 5,955 2,329 (16,871) 14,430 Finance revenue - - - - 103 103 Finance costs - - - - (36) (36) Consolidated profit before income tax 6,796 16,221 5,955 2,329 (16,804) 14,497 Income tax expense 4 (3,161) Consolidated profit after income tax 11,336
Assets Segment assets - 2,166 (512) - - 1,654 Unallocated assets 44,638
Total assets 46,292
Liabilities Segment liabilities - 788 457 - - 1,245 Unallocated liabilities 11,306 Total liabilities 12,551
Capital Expenditure - - 228 - 167 395 Amortisation - - - - 2,968 2,968 Depreciation 56 10 87 - 247 400

I n f o m e d i a L t d A n n u a l R e p o r t
NOTES TO THE FINANCIAL STATEMENTS
49
24. SEGMENT INFORMATION (CONTINUED)
30 June 2009
Business Segments
Asia Pacific Europe North America
Latin & South
America
Corporate Total
Notes $’000 $’000 $’000 $’000 $’000 $’000 REVENUE Sales revenue 11,187 25,282 12,731 5,141 - 54,341 Consolidated revenue 54,341
Segment result 5,359 20,116 8,123 3,878 (25,061) 12,415 Finance revenue - 9 - - 410 419 Finance costs - - - - (61) (61) Consolidated profit before income tax 5,359 20,125 8,123 3,878 (24,712) 12,773 Income tax expense 4 (2,237) Consolidated profit after income tax 10,536
Assets Segment assets - 6,416 2,895 - - 9,311 Unallocated assets 38,298 Total assets 47,609
Liabilities Segment liabilities - 909 1,292 - - 2,201 Unallocated liabilities 9,904 Total liabilities 12,105
Capital Expenditure - 31 232 - 538 801 Amortisation - - - - 2,444 2,444 Depreciation 92 17 58 - 831 998
Identification of reportable segments The group has identified its operating segments based on the internal reports that are reviewed and used by the Board of Directors (the chief operating decision makers) in assessing performance and in determining the allocation of resources. The operating segments are identified by management based on the region in which the product is sold. Discrete financial information about each of these operating businesses is reported to the Board of Directors regularly. The reportable segments are based on aggregated operating segments determined by the similarity of the products produced and sold as these are the sources of the Group’s major risks and have the most effect of the rates of return. Accounting policies and inter-segment transactions The accounting policies used by the Group in reporting segments internally are the same as those contained in note 2 to the accounts and in the prior period. The group accounting policies for segments are applied to the respective segments up to the segment result level. Major customers The Group has many customers to which it provides products. There is no significant reliance of any single customer.

I n f o m e d i a L t d A n n u a l R e p o r t
NOTES TO THE FINANCIAL STATEMENTS
50
25. FINANCIAL RISK MANAGEMENT OBJECTIVES AND POLICIES The Company’s principal financial instruments, other than derivatives, comprise cash and short-term deposits. The Company has various other financial assets and liabilities such as trade receivables and trade payables, which arise directly from its operations. The Company also enters into derivative transactions through forward currency contracts. The purpose is to manage the currency risks arising from the Company’s operations. It is, and has been throughout the period under review, the Company’s policy that no trading in financial instruments shall be undertaken. The main risks arising from the Company’s financial instruments are cash flow interest rate risk, liquidity risk, foreign currency risk and credit risk.
Details of the significant accounting policies and methods adopted, including the criteria for recognition, the basis of measurement and the basis on which income and expenses are recognised, in respect of each class of financial asset, financial liability and equity instrument are disclosed in Note 2 to the financial statements.
(a) Interest rate risk
The Company’s exposure to the risk of changes in market interest rates relates solely to the Company’s cash holding of $5,789,000 (2009: $8,005,000) with a floating interest rate.
The Company’s policy is to accept the floating interest rate risk with both its cash holdings and bank loans. Cash is held primarily with leading Australian banks for periods not exceeding 30 days, as such any reasonably expected change in interest rates (+/- 1%) would not have a significant impact on post tax profit or other comprehensive income.
(b) Foreign currency risk The Company has transactional currency exposures. These exposures mainly arise from the transactional sale of products and to a lesser extent the associated cost of sales component relating to these products. As the Company’s product offerings are typically made on a recurring monthly subscription basis, there is a relatively high degree of reliability in estimating a proportion of future cashflow exposures. Approximately half of the Company’s sales are denominated in United States Dollars and around one-third of the Company’s sales are denominated in Euro. The Company seeks to mitigate exposure to movements in these currencies by entering into forward exchange derivative contracts under an approved hedging policy. As a result of the Company’s recent investment in both its European and United States subsidiaries, the Company’s balance sheet can be affected by movements in both the Euro and United States dollar against the Australian dollar. At 30 June 2010, the Group had the following exposure to US$ foreign currency that is not designated in cash flow hedges:
Consolidated 2010 2009 $’000 $’000 Financial Assets Cash and cash equivalents 11 116 Derivatives 1,585 (2,860) 1,596 2,744

I n f o m e d i a L t d A n n u a l R e p o r t
NOTES TO THE FINANCIAL STATEMENTS
51
25. FINANCIAL RISK MANAGEMENT OBJECTIVES AND POLICIES (CONTINUED) At 30 June 2010, the Group had the following exposure to EUR foreign currency that is not designated in cash flow hedges:
Consolidated 2010 2009 $’000 $’000 Financial Assets Cash and cash equivalents 3 47 Derivatives 1,284 (1,323) 1,287 (1,276)
The following sensitivity is based on the foreign currency risk exposures in existence at the balance sheet date:
At 30 June 2010, had the Australian Dollar moved, as illustrated in the table below, with all other variables held constant, post tax profit and total equity would have been affected as follows:
Judgments of reasonably possible movements:
Post tax profit Total equity Higher/(Lower) Higher/(Lower) 2010 2009 2010 2009 $’000 $’000 $’000 $’000 Consolidated AUD/USD +10% (1) (10) 979 1,408
AUD/USD – 15% 2 20 (1,486) (2,437)
AUD/EUR +10% - (4) 651 1,011
AUD/EUR – 15% - 8 (1,286) (2,035)
Management believe the balance date risk exposures are representative of the risk exposure inherent in the financial instruments. (c) Credit risk The Company’s credit risk with regard to accounts receivables is spread broadly across three automotive groups - manufacturers, distributors and dealerships. Receivable balances are monitored on an ongoing basis with the result that the Company’s exposure to bad debts is not significant. As the products typically have a monthly life cycle and are priced on a relatively low subscription price, the concentration of credit risk is typically low with automotive manufacturers being the exception.
With respect to credit risk arising from the other financial assets of the Company, which comprise cash and cash equivalents, and certain derivative instruments, the Company’s exposure to credit risk arises from default of the counter party, with a maximum exposure equal to the carrying amount of these instruments.
Since the Company trades only with recognised third parties, collateral is not requested nor is it the Group’s policy to securitise its trade and other receivables.
(d) Price risk There are no items on the balance sheet as at 30 June 2010 that are subject price risk.

I n f o m e d i a L t d A n n u a l R e p o r t
NOTES TO THE FINANCIAL STATEMENTS
52
25. FINANCIAL RISK MANAGEMENT OBJECTIVES AND POLICIES (CONTINUED)
(e) Liquidity risk The Company’s exposure to liquidity risk is minimal given the relative strength of the balance sheet and cash flows from operations. Given the nature of the Company’s operations and no borrowings, the Company does not have fixed or contracted payments at balance sheet date other than with respect of its cash flow hedges which are disclosed below. Consequently the remaining contractual maturity of the group entity’s financial liabilities is as stated in the balance sheet and is less than 60 days. Deferred revenue requires no cash outflow.
Liquidity and Interest rate risk The following table sets out the carrying amount, by maturity, of the financial instruments exposed to interest rate or liquidity risk:
CONSOLIDATED
YEAR ENDED 30 JUNE 2010
Less than one year
$’000
Two to five years
$’000
Greater than five
years $’000
Weighted average effective
interest rate %
Floating rate
Cash and cash equivalents 5,789 - - 3.7
Trade and other receivables 4,160 - - -
Trade and other payables (3,738) - - -
CONSOLIDATED
YEAR ENDED 30 JUNE 2009
Less than one year
$’000
Two to five years
$’000
Greater than five
years $’000
Weighted average effective
interest rate %
Floating rate
Cash and cash equivalents 8,005 - - 2.7
Trade and other receivables 4,396 - - -
Trade and other payables (3,605) - - -
Interest on financial instruments classified as floating rate is repriced at intervals of less than one year. Interest on financial instruments classified as fixed rate is fixed until maturity of the instrument. The other financial instruments of the Group that are not included in the above tables are non-interest bearing and are therefore not subject to interest rate risk.

I n f o m e d i a L t d A n n u a l R e p o r t
NOTES TO THE FINANCIAL STATEMENTS
53
25. FINANCIAL RISK MANAGEMENT OBJECTIVES AND POLICIES (CONTINUED) (f) Fair value Derivative instruments use valuation techniques other than quoted prices in active markets with only observable market inputs for the asset or liability , either directly (as prices) or indirectly (derived from prices)to determine the fair value of foreign exchange contracts Derivative contracts The following table summarises the forward exchange contracts on hand at 30 June 2010.
CONSOLIDATED
Maturity Company
buys Company
sells Exchange
rate
Company sells United States Dollars (USD) $A’000 USD’000
Less than one year 10,700 7,443 0.696
Company sells Euros (E) $A’000 E’000
Less than one year 8,909 5,280 0.593
Company sells United States Dollars (USD) $A’000 USD’000
Greater than one year and not greater than two years 4,258 3,401 0.799
Company sells Euros (E) $A’000 E’000
Greater than one year and not greater than two years 2,714 1,700 0.626
The mark to market valuation of these contracts at 30 June 2010 was $3,028,000 which is booked directly in equity. Derivative contracts The following table summarises the forward exchange contracts on hand at 30 June 2009.
CONSOLIDATED
Maturity Company
buys Company
sells Exchange
rate
Company sells United States Dollars (USD) $A’000 USD’000
Less than one year 13,481 9,306 0.690
Company sells Euros (E) $A’000 E’000
Less than one year 13,080 6,760 0.517
Company sells United States Dollars (USD) $A’000 USD’000
Greater than one year and not greater than two years 10,067 6,943 0.690
Company sells Euros (E) $A’000 E’000
Greater than one year and not greater than two years 4,486 2,400 0.535
The mark to market valuation of these contracts at 30 June 2009 was $4,252,000, which is booked directly in equity.

I n f o m e d i a L t d A n n u a l R e p o r t
NOTES TO THE FINANCIAL STATEMENTS
54
26. FINANCIAL INSTRUMENTS
Fair values Set out below is a comparison by category of carrying amounts and fair values of all of the Company’s financial instruments recognised in the financial statements. The fair values of derivatives have been calculated by discounting the expected future cash flows at prevailing interest rates.
Carrying Amount Fair Value
CONSOLIDATED 2010 2009 2010 2009
Financial assets $’000 $’000 $’000 $’000
Cash and cash equivalents 5,789 8,005 5,789 8,005 Trade and other debtors 7,418 8,100 7,418 8,100 Derivatives 3,028 4,252 3,028 4,252
Financial liabilities
Trade and other creditors 3,738 3,605 3,738 3,605
27. SUBSEQUENT EVENTS Gary Martin notified the Board that he will not be seeking to renew his service agreement when it expires on 31 December 2010. Other than this, there has been no matter or circumstance that has arisen since the end of the financial year that has significantly affected the operations of the Company, the results of those operations, or the state of affairs of the Company. 28. PARENT ENTITY INFORMATION Parent Entity 2010 2009 $’000 $’000 Current assets 13,154 16,871 Total assets 44,923 45,363 Current liabilities 5,674 5,119 Total liabilities 11,307 10,703 Contributed equity 11,131 12,863 Retained earnings 19,171 17,669 Employee equity benefit reserve 1,195 1,151 Cashflow hedge reserve 2,119 2,977 Total shareholders’ equity 33,616 34,660 Profit or loss of the parent entity 11,765 16,641 Total comprehensive income of the parent entity 10,908 18,992

55
Directors’ Declaration In accordance with a resolution of the directors of Infomedia Limited, I state that: In the opinion of the directors: (a) the financial statements and notes of the consolidated entity are in accordance with the Corporations Act 2001, including: (i) giving a true and fair view of the consolidated entity’s financial position as at 30 June 2010 and of their performance for the year ended on that date; and (ii) complying with Accounting Standards and the Corporations Regulations 2001; and (b) the financial statements and notes also comply with International Financial Reporting Standards as disclosed in note 2b (c) there are reasonable grounds to believe that the consolidated entity will be able to pay its debts as and when they become due and payable. (d) this declaration has been made after receiving the declarations required to be made to the Directors in accordance with section 295A of the Corporations Act 2001 for the financial year ending 30 June 2010. On behalf of the Board
Richard David Graham Chairman Sydney 24 August 2010
56
Liability limited by a scheme approved under Professional Standards Legislation
Independent auditor’s report to the members of Infomedia Ltd
Report on the Financial Report We have audited the accompanying financial report of Infomedia Ltd, which comprises the balance sheet as at 30 June 2010, and the statement of comprehensive income, statement of changes in equity and cash flow statement for the year ended on that date, a summary of significant accounting policies, other explanatory notes and the directors’ declaration of the consolidated entity comprising the company and the entities it controlled at the year’s end or from time to time during the financial year.
Directors’ Responsibility for the Financial Report The directors of the company are responsible for the preparation and fair presentation of the financial report in accordance with the Australian Accounting Standards (including the Australian Accounting Interpretations) and the Corporations Act 2001. This responsibility includes establishing and maintaining internal controls relevant to the preparation and fair presentation of the financial report that is free from material misstatement, whether due to fraud or error; selecting and applying appropriate accounting policies; and making accounting estimates that are reasonable in the circumstances. In Note 2, the directors also state that the financial report, comprising the financial statements and notes, complies with International Financial Reporting Standards as issued by the International Accounting Standards Board.
Auditor’s Responsibility Our responsibility is to express an opinion on the financial report based on our audit. We conducted our audit in accordance with Australian Auditing Standards. These Auditing Standards require that we comply with relevant ethical requirements relating to audit engagements and plan and perform the audit to obtain reasonable assurance whether the financial report is free from material misstatement.
An audit involves performing procedures to obtain audit evidence about the amounts and disclosures in the financial report. The procedures selected depend on our judgment, including the assessment of the risks of material misstatement of the financial report, whether due to fraud or error. In making those risk assessments, we consider internal controls relevant to the entity’s preparation and fair presentation of the financial report in order to design audit procedures that are appropriate in the circumstances, but not for the purpose of expressing an opinion on the effectiveness of the entity’s internal controls. An audit also includes evaluating the appropriateness of accounting policies used and the reasonableness of accounting estimates made by the directors, as well as evaluating the overall presentation of the financial report.
We believe that the audit evidence we have obtained is sufficient and appropriate to provide a basis for our audit opinion.
Independence In conducting our audit we have met the independence requirements of the Corporations Act 2001. We have given to the directors of the company a written Auditor’s Independence Declaration, a copy of which is included on page 14 of the directors’ report. In addition to our audit of the financial report, we were engaged to undertake the services disclosed in the notes to the financial statements. The provision of these services has not impaired our independence.

57
Auditor’s Opinion In our opinion: 1. the financial report of Infomedia Ltd is in accordance with the Corporations Act 2001, including:
i) giving a true and fair view of the consolidated entity’s financial position at 30 June 2010 and of its performance for the year ended on that date; and
ii) complying with Australian Accounting Standards (including the Australian Accounting Interpretations) and the Corporations Regulations 2001.
2. the financial report also complies with International Financial Reporting Standards as issued by the International Accounting Standards Board.
Report on the Remuneration Report We have audited the Remuneration Report included in the directors’ report for the year ended 30 June 2010. The directors of the company are responsible for the preparation and presentation of the Remuneration Report in accordance with section 300A of the Corporations Act 2001. Our responsibility is to express an opinion on the Remuneration Report, based on our audit conducted in accordance with Australian Auditing Standards.
Auditor’s Opinion In our opinion the Remuneration Report of Infomedia Ltd for the year ended 30 June 2010, complies with section 300A of the Corporations Act 2001.
Ernst & Young
J K Haydon Partner Sydney 24 August 2010