Embed Size (px)
Citation preview

SHPN: (HP NSW) 170557 Page | 1
Influenza Annual Epidemiology Report 2018, NSW
This report describes the surveillance for influenza and other respiratory pathogens, undertaken by
NSW Health to date. This includes data from a range of surveillance systems.
For weekly communicable disease surveillance updates refer to the Communicable Disease
Weekly Reports at http://www.health.nsw.gov.au/Infectious/reports/Pages/CDWR.aspx .
1. Annual summary
NSW had a mild influenza season in 2018 which was dominated by the influenza A(H1N1)
strain.
The influenza season commenced in early August, much later than usual, and activity returned
to inter-seasonal levels in early October.
There was higher than usual influenza activity in the summer months – in January and
February and again in December.
Emergency department (ED) presentations in the All respiratory illness, fever and unspecified
infections category were lower than usual throughout 2018.
There were 17,467 laboratory-confirmed influenza notifications for the year, well below the
record high 103,220 notifications reported in 2017.
The peak of influenza activity based on laboratory testing was during the week ending
9 September when there was an influenza test positivity rate of 12.1 %.
Influenza A strains accounted for 82% of influenza notifications, with A(H1N1) strains more
common than A(H3N2) strains.
Influenza B strains accounted for 18% of notifications, with B/Yamagata lineage strains
predominant over B/Victoria lineage strains.
There were 12 cases of influenza with severe complications in children less than 15 years of
age in NSW reported to the Australian Paediatric Surveillance Unit (APSU), compared with 56
cases in 2017.
Influenza was associated with at least 43 deaths in 2018, less than 10 percent of the 653
deaths identified in 2017.
There were 46 influenza outbreaks reported in institutions, a dramatic decrease from the 591
outbreaks reported in 2017. Outbreaks were predominantly in residential care facilities and due
to influenza A.
Hospital Surveillance
Emergency department surveillance
NSW emergency department (ED) surveillance for influenza-like illness (ILI) and other respiratory
illnesses is conducted through PHREDSS [1]. The PHREDSS surveillance system uses a statistic
[1] NSW Health Public Health Rapid, Emergency Disease and Syndromic Surveillance system. Managed by the Centre for
Epidemiology and Evidence, NSW Ministry of Health. Data from 60 NSW emergency departments are included. Comparisons are made with data for the preceding five years. Recent counts are subject to change. This includes data from 59 NSW emergency departments (EDs), representing approximately 85% of metropolitan ED presentations and approximately 60% of rural ED presentations.
SHPN: (HP NSW) 170557 Page | 2
called the ‘index of increase’ to indicate when ILI presentations [2] are increasing at a statistically
significant rate. It accumulates the difference between the previous day’s count of presentations
and the average for that weekday over the previous 12 months. An index of increase value of 15 is
considered an important signal for the start of the influenza season in NSW as it suggests
influenza is circulating widely in the community.
From 1 January to 31 December 2018:
Based on the index of increase for ILI, the 2018 PHREDSS ILI season was almost 12 weeks,
shorter than the 2017 season of 14 weeks. This year, the PHREDSS ‘seasonal threshold’ for
ILI2 of 15.0 was exceeded on Monday 16 July, peaked on 10 September at 34.4 and fell below
15.0 on 5 October.
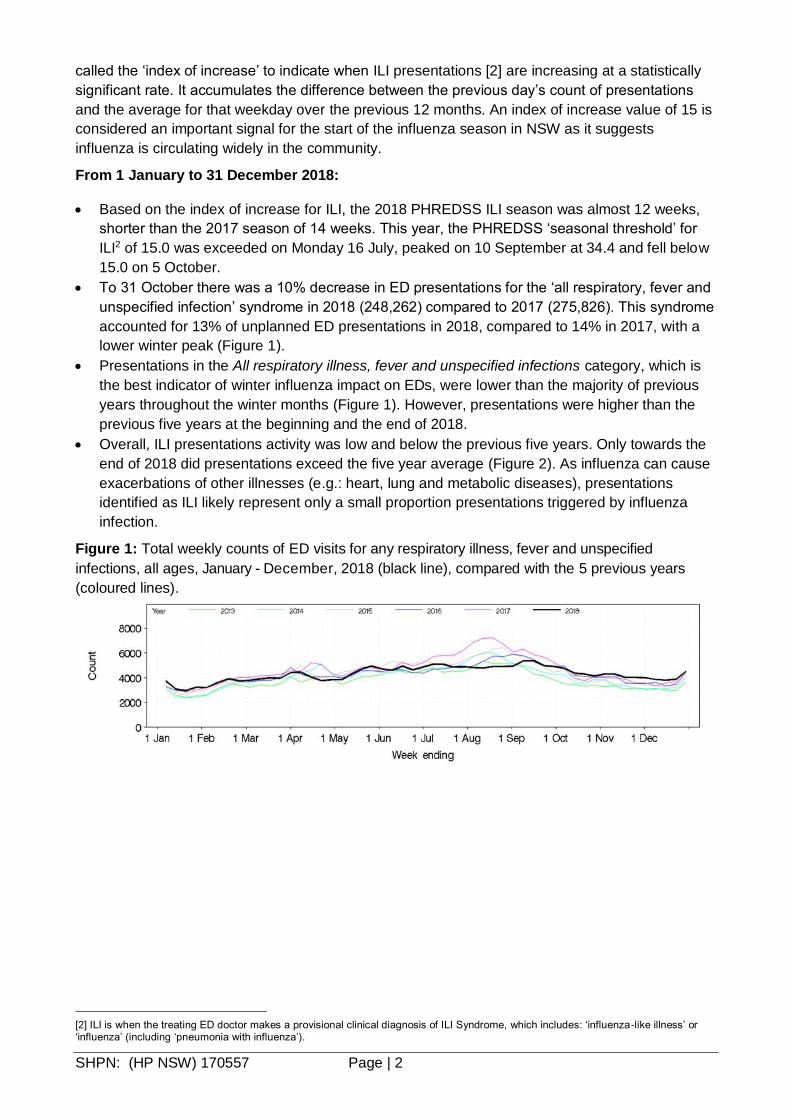
To 31 October there was a 10% decrease in ED presentations for the ‘all respiratory, fever and
unspecified infection’ syndrome in 2018 (248,262) compared to 2017 (275,826). This syndrome
accounted for 13% of unplanned ED presentations in 2018, compared to 14% in 2017, with a
lower winter peak (Figure 1).
Presentations in the All respiratory illness, fever and unspecified infections category, which is
the best indicator of winter influenza impact on EDs, were lower than the majority of previous
years throughout the winter months (Figure 1). However, presentations were higher than the
previous five years at the beginning and the end of 2018.
Overall, ILI presentations activity was low and below the previous five years. Only towards the
end of 2018 did presentations exceed the five year average (Figure 2). As influenza can cause
exacerbations of other illnesses (e.g.: heart, lung and metabolic diseases), presentations
identified as ILI likely represent only a small proportion presentations triggered by influenza
infection.
Figure 1: Total weekly counts of ED visits for any respiratory illness, fever and unspecified
infections, all ages, January - December, 2018 (black line), compared with the 5 previous years
(coloured lines).
[2] ILI is when the treating ED doctor makes a provisional clinical diagnosis of ILI Syndrome, which includes: ‘influenza-like illness’ or ‘influenza’ (including ‘pneumonia with influenza’).

SHPN: (HP NSW) 170557 Page | 3
Figure 2: Total weekly counts of ED visits for influenza-like illness, all ages, January – December,
2018 (black line), compared with the 5 previous years (coloured lines).
Figure 3 Total weekly counts of ED presentations for pneumonia, from January – December 2018
(black line), compared with each of the 5 previous years (coloured lines), for 59 NSW hospitals.
Figure 4: Total weekly counts of ED presentations for pneumonia or influenza-like illness and
admitted to a critical care ward, from January – December 2018 (black line), compared with each
of the 5 previous years (coloured lines), for 59 NSW hospitals.
Figure 5: Total weekly counts of ED presentations for bronchiolitis, from January - December 2018
(black line), compared with each of the five previous years (coloured lines), persons of all ages, for
59 NSW hospitals.

SHPN: (HP NSW) 170557 Page | 4
APSU Paediatric Surveillance of influenza with severe complications
The Australian Paediatric Surveillance Unit (APSU), based at The Children‘s Hospital at
Westmead, is a national research resource established in 1993 to facilitate active surveillance of
uncommon childhood diseases, rare serious complications of common diseases or rare adverse
effects of treatment (please refer to the case definition for severe complications).
APSU contributors are clinicians working in paediatrics and child health who provide weekly
reports on 17 different conditions under surveillance. All positive reports of cases generate a brief
questionnaire requesting de-identified information about the child‘s demographics, details of
diagnosis, management and short-term outcome from the clinician. For more details on APSU
methods see the APSU website: www.apsu.org.au.
Since 2009, surveillance for severe complications from influenza has been conducted by the APSU
from July to September. For this reporting period in 2018 there were 12 cases of influenza with
severe complications in children less than 15 years of age in NSW reported to the APSU with the
following characteristics:
All 12 cases involved infections with influenza A strains. Ten cases were males and there were
three females. The median age of cases was 4.6 years (range 17 days to 12.2 years). There
were three cases under 6 months of age (25%).
Of the nine cases aged 6 months or older (and so old enough to be vaccinated for influenza),
no cases were known to be vaccinated for influenza. However, the influenza vaccination status
of 6 (70%) cases was not known.
Four (33%) of the cases had an underlying chronic medical condition.
Seven (58%) of the cases required intensive care admission during their hospitalisation and
there was one death recorded. Three (25%) cases required ongoing treatment post discharge
from hospital. The median length of stay in hospital was 8 days (range 1-29 days).
Medical complications were recorded for all 12 cases including pneumonia (4 cases), bacterial co-
infections, mechanical ventilation (3 cases) and encephalitis (2 cases).
Influenza Complications Alert Network (FluCAN)
In 2009, a rapid alert system for severe respiratory illness: the FluCAN Surveillance System was
created with the involvement and support of the Thoracic Society of Australia and New Zealand
and funding from the NH&MRC.
The aim of FluCAN was to establish and maintain a real-time sentinel hospital surveillance system
for acute respiratory disease requiring hospitalisation, which could provide a reliable and timely
source of information that could be used to inform public health policy. Since 2010, FluCAN
surveillance has been supported by the Commonwealth Department of Health, with data
management provided by Monash University, Melbourne.
In NSW, FluCAN includes three sentinel monitoring sites for influenza hospitalisations: The
Children’s Hospital at Westmead (CHW), John Hunter Hospital and Westmead Hospital. FluCAN
only includes cases confirmed by PCR (i.e. nucleic acid testing).
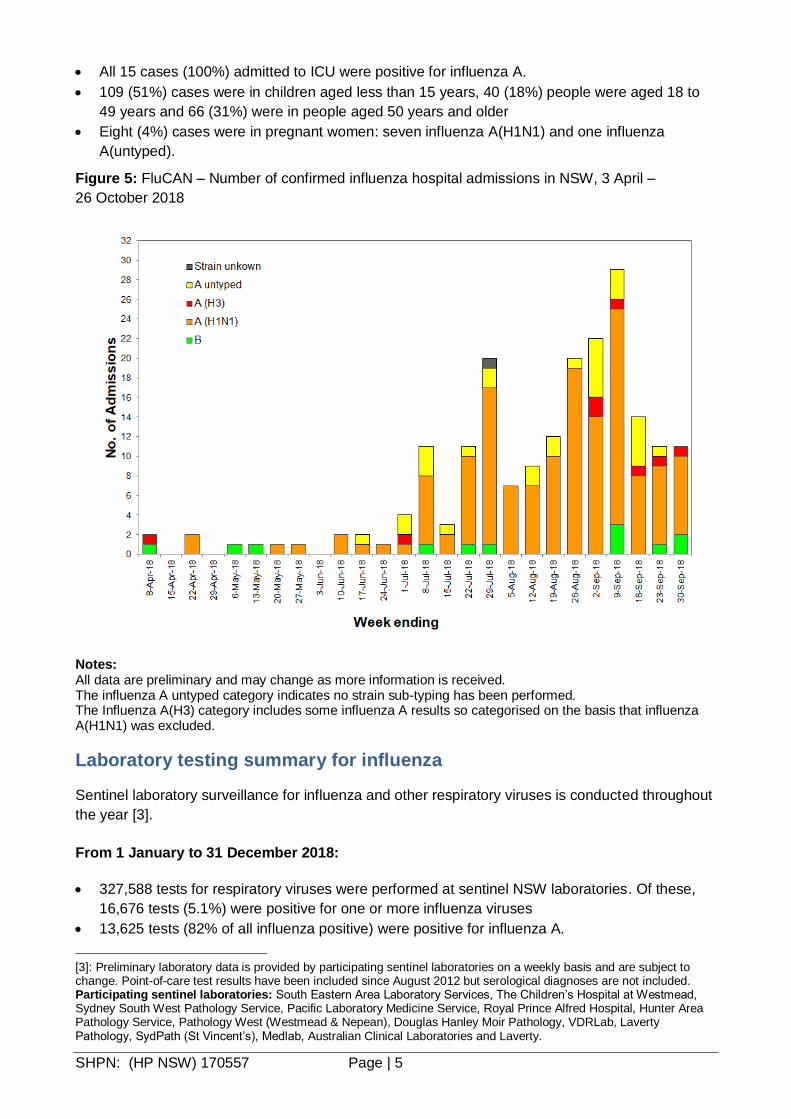
From 3 April to 26 October 2018, FluCAN reported 215 hospital admissions with confirmed
influenza from the three NSW sites (Figure 5), with the following characteristics:
200 (92%) cases were admitted to either a general ward or a respiratory ward and 15 (7%)
were admitted to an intensive care unit.
200 (93%) cases were influenza A positive: of these, 157 were typed as influenza A(H1N1), 10
were influenza A(H3N2) and the remaining 33 were untyped.
14 (7%) cases were influenza B positive and 1 case’s result is unknown.
SHPN: (HP NSW) 170557 Page | 5
All 15 cases (100%) admitted to ICU were positive for influenza A.
109 (51%) cases were in children aged less than 15 years, 40 (18%) people were aged 18 to
49 years and 66 (31%) were in people aged 50 years and older
Eight (4%) cases were in pregnant women: seven influenza A(H1N1) and one influenza
A(untyped).
Figure 5: FluCAN – Number of confirmed influenza hospital admissions in NSW, 3 April –
26 October 2018
Notes: All data are preliminary and may change as more information is received. The influenza A untyped category indicates no strain sub-typing has been performed. The Influenza A(H3) category includes some influenza A results so categorised on the basis that influenza A(H1N1) was excluded.
Laboratory testing summary for influenza
Sentinel laboratory surveillance for influenza and other respiratory viruses is conducted throughout
the year [3].
From 1 January to 31 December 2018:
327,588 tests for respiratory viruses were performed at sentinel NSW laboratories. Of these,
16,676 tests (5.1%) were positive for one or more influenza viruses
13,625 tests (82% of all influenza positive) were positive for influenza A.
[3]: Preliminary laboratory data is provided by participating sentinel laboratories on a weekly basis and are subject to change. Point-of-care test results have been included since August 2012 but serological diagnoses are not included. Participating sentinel laboratories: South Eastern Area Laboratory Services, The Children’s Hospital at Westmead, Sydney South West Pathology Service, Pacific Laboratory Medicine Service, Royal Prince Alfred Hospital, Hunter Area Pathology Service, Pathology West (Westmead & Nepean), Douglas Hanley Moir Pathology, VDRLab, Laverty Pathology, SydPath (St Vincent’s), Medlab, Australian Clinical Laboratories and Laverty.

SHPN: (HP NSW) 170557 Page | 6
o 1,028 were H1N1 (7.5% of all influenza A positive), including 275 that were further characterised as A/Michigan/45/2015 (H1N1)pdm09-like virus.
o 454 were H3N2 (3.3% of all influenza A positive), including 78 that were further characterised as A/Singapore/INFIHM-16-0019/2016 (H3N2)-like virus.
o 12,161 influenza A samples were not further typed
3,051 tests (2.7% of all influenza tests) were positive for influenza B, including 88 further
characterised as B/Phuket/3073/2013-like (Yamagata lineage) and two characterised as
B/Brisbane/60/2008-like and 3three characterised as B/Colorado/06/2017-like virus (Victoria
lineage)
Sentinel laboratories reported that at least 63 of the patients with confirmed influenza were
known to have been admitted to an intensive care unit, 59 to a high dependency unit and eight
to a coronary care unit.
The peak of influenza testing activity was in the week ending 9 September when there were 1,245
tests positive for influenza and an influenza test positivity rate of 12.1 per cent, one of the lowest
test positivity peaks since surveillance began in 1999 (Figures 6-7).
The peaks in the influenza test positivity rate have closely matched the timing and intensity of the
peaks in ED presentations for the Any respiratory illness, fever and unspecified infections category
since the pandemic year in 2009 (Figure 8).
Both influenza A (predominantly H1N1) and influenza B circulated at much lower levels in this
year’s influenza season than in 2017. However, higher than usual influenza activity was seen
outside of the influenza season - in the months of January and February, and again in December.
The increases in the influenza-test positivity rates in these months (Table 1, Figures 6-7) suggest
that this was not an artefact of increased influenza testing by clinicians.
The inter-seasonal increases are believed to be linked, at least in part, to international travellers
arriving with influenza infections acquired during the northern hemisphere winter and causing
localised transmission on their return.
Table 1: Summary of testing for influenza and other respiratory viruses at sentinel NSW
laboratories, 1 January to 31 December 2018.

SHPN: (HP NSW) 170557 Page | 7
Notes: * Five week reporting period used; ** HMPV - Human metapneumovirus. Note that while all samples are tested for influenza viruses, not all samples are tested for all of the other viruses listed.
Figure 6: Weekly influenza positive test results by type and sub-type reported by NSW sentinel
laboratories, 1 January to 31 December 2018.
Figure 7: Percent of weekly laboratory tests positive for influenza A and influenza B reported by
NSW sentinel laboratories, 1 January 2013 to 31 December 2018.

SHPN: (HP NSW) 170557 Page | 8
Figure 8: Percent of weekly laboratory tests positive for influenza (A and B) reported by NSW
sentinel laboratories (red line), and total weekly counts of ED visits for Any respiratory illness, fever
and unspecified infections, all ages (black line), 2009 to 2018.
Community Surveillance
Influenza notifications by Local Health District (LHD)
From 1 January to 31 December 2018:
There were a total of 17,260 influenza notifications reported for all LHDs combined, with the
highest weekly number of notifications (1069) reported in week 36 (week ending 9 September).
Western Sydney LHD had the highest number of influenza notifications and the highest rate per
100,000 population in the state (Table 2), and influenza notifications and population rates were
generally higher in metropolitan Sydney LHDs than other LHDs.
The Northern NSW LHD was a notable outlier with its annual influenza notification rate (283.4 per
100,000 population) higher than usual and similar to the metropolitan Sydney LHDs. This increase
reflects both activity during the influenza season and the unusually high levels of influenza activity
experienced along the northern coast of NSW in November and December.

SHPN: (HP NSW) 170557 Page | 9
Table 2: Annual notifications of laboratory-confirmed influenza by Local Health District (LHD)
Influenza outbreaks in institutions
In 2018 there were 46 influenza outbreaks reported in institutional facilities. Of these, 33 (72%)
were due to influenza A and 13 (28%) were due to influenza B. All but four of these outbreaks
occurred in residential care facilities. A total of 390 residents were reported to have had ILI
symptoms and 46 were hospitalised. There were also 10 deaths in residents linked to these
outbreaks, all of whom were noted to have other significant co-morbidities.
Table 3: Reported influenza outbreaks in NSW institutions per year, 2011-2018.
Year 2011 2012 2013 2014 2015 2016 2017 2018
Number of outbreaks
4 39 12 120 103 279 591 46
The Australian Sentinel Practices Research Network (ASPREN)
ASPREN is a network of sentinel general practitioners (GPs) run through the RACGP and
University of Adelaide that has collected de-identified information on influenza like illness and other
conditions seen in general practice since 1991.
GP’s participating in the program report on the proportion of patients presenting with an ILI. The
number of GP’s participating on a weekly basis may vary. For 2018, an average of 55 NSW GP
practices provided activity reports each week.
During this time, the GP ILI consultation rate had two small peaks, one at 8.9% during week 29
(week ending 22 July) and again at 8.3% during week 35 (week ending 2 September). Both were
much lower than the exceptionally high peak of 36.8% seen in 2017 (Figure 9).
For further information please see the ASPREN website.

SHPN: (HP NSW) 170557 Page | 10
Figure 9: ASPREN – NSW and National GP ILI rates per 1000 consultations – 2018 compared to
2017.
FluTracking.net
FluTracking.net is an online health surveillance system to detect epidemics of influenza. It is a project
of the University of Newcastle, the Hunter New England Local Health District and the Hunter Medical
Research Institute. Participants complete a simple online weekly survey which is used to generate
data on the rate of ILI symptoms in communities.
For 2018, the peak and magnitude of ILI symptom reporting in NSW was lower than that seen
in previous years (Figure 10).
The highest weekly ILI symptom activity reported from FluTracking participants in NSW was for
the week ending 19 August when reports were received for 11,581 individuals. The number of
respondents reporting fever and cough for this week was 2.0% (Figure 10).
The proportion of vaccinated FluTracking participants who reported fever and cough was
similar to that of unvaccinated participants (Figure 10).
Overall, 1.0% of respondents reported fever, cough and absence from normal duties.

SHPN: (HP NSW) 170557 Page | 11
Figure 10: FluTracking – Fever and cough percent overall and by reported influenza vaccination
status for NSW participants in 2018 compared to the 5 year average.*
Notes: From 2017, if a participant reported influenza-like illness symptoms for more than one consecutive week, only the first reported week of symptoms is included. Participants are not considered vaccinated until two or more weeks have elapsed since their recorded time of vaccination. Vaccinated and unvaccinated rates are calculated using the total number of vaccinated respondents and the total number of unvaccinated respondents as denominators, respectively. The 5-year annual mean is calculated from years 2013 to 2017. For further information on the project and how to participate see the FluTracking website.
Influenza associated deaths
In 2018 there were 43 reported influenza-associated deaths. This included:
41 influenza-associated deaths were reported from the Births Deaths and Marriages Registry
and all but four of these events could be matched to a notified influenza case.
One death in a 3 year old was reported by the Coroner’s office (included in B, D & M data)
Two deaths were notified to the local PHU.
Deaths with pneumonia or influenza reported on the death certificate
Deaths registration data is routinely reviewed for deaths attributed to pneumonia or influenza.
While pneumonia has many causes, a well-known indicator of seasonal and pandemic influenza
activity is an increase in the number of death certificates that mention pneumonia or influenza as a
cause of death. The predicted seasonal baseline estimates the predicted rate of influenza or
pneumonia deaths in the absence of influenza epidemics. If deaths exceed the epidemic threshold,
then it may be an indication that influenza is beginning to circulate widely.

SHPN: (HP NSW) 170557 Page | 12
From 1 January to 28 December 2018:
In 2018, among all 51,744 death certificates there were 41 which mentioned influenza: one
death was in a person aged <10 years, one death was in a person aged 15 -24 years and one
in a person aged 35 to 54 years, three deaths were in people aged 55 to 64 years, and 35
deaths were in people aged 65 years and over.
A total of 4424 (8.5%) of death certificates had pneumonia as a contributing cause of death.
Death rates for both influenza and pneumonia as a proportion of the NSW population exceeded
the forecast epidemic threshold briefly in the week ending 12 October, otherwise were well
below the epidemic threshold. Overall, death rates were significantly lower in 2018 compared
with previous years (Figure 11).
Figure 11: Rate of deaths classified as influenza and pneumonia per 100 000 NSW population,
2013 - 2018.
Source: NSW Registry of Births, Deaths and Marriages. Notes on interpreting death data:
The number of deaths mentioning “Pneumonia or influenza” is reported as a rate per 100,000 NSW population. Using the NSW population provides a more stable and reliable denominator than deaths from all causes. This is because pneumonia and influenza are known to contribute to increases in deaths from non-respiratory illnesses, such as deaths due to ischaemic heart disease. As the number of these deaths will increase with rises in influenza activity, the actual effect of influenza on mortality rates will be obscured if all-cause mortality is used as the denominator. This limitation is avoided by using the NSW population, which is relatively constant throughout the year, as the denominator.
Deaths referred to a coroner during the reporting period may not be available for analysis. Deaths in younger people may be more likely to require a coronial inquest. Therefore influenza-related deaths in younger people may be under-represented in these data.
The interval between death and death data availability is usually at least 7 days, and so these data are one week behind reports from emergency departments and laboratories. In addition, previous weekly rates may also change due to longer delays in reporting some deaths.

SHPN: (HP NSW) 170557 Page | 13
National and International Influenza Surveillance
National summary
Nationally the 2018 influenza season was mild. Activity reached a peak in early September,
however several States and Territories noted increased activity towards the end of 2018. Overall
the 2018 season was significantly lower than the previous year.
Severity –Clinical severity for the season, as measured through the proportion of patients
admitted directly to ICU, and deaths attributed to influenza, is moderate.
Impact – The impact of circulating influenza on society, as measured through the proportion of
people with ILI taking time off work, and the burden on hospitals, is low.
Virology – The majority of confirmed influenza cases reported nationally were influenza A
(83%), and where subtyping data were available, influenza A(H1N1)pdm09 was the dominant
subtype.
At-risk populations: Children aged less than 10 years appeared to be more commonly
infected with influenza; however the severity of illness in this population is on par with other
age-groups.
Vaccine effectiveness: Based on currently available data, vaccinated individuals were 68%
less likely to present to a GP and 58% less likely to be hospitalised due to influenza, when
compared to unvaccinated individuals.
Follow the link for the archive of Australian Influenza Surveillance Reports.
Composition of 2019 Australian influenza vaccines
WHO influenza vaccine strain recommendations for the Southern Hemisphere in
2019
The WHO Consultation on the Composition of Influenza Vaccines for the 2019 Southern
Hemisphere was held in Atlanta on 24-26 September 2018.
Following the Consultation, WHO announced its recommendations for the composition of trivalent
vaccines for use in the 2019 Southern Hemisphere influenza season, which includes changes in
the influenza A(H3N2) component and the influenza B (Victoria lineage), as follows:
an A/Michigan/45/2015 (H1N1)pdm09-like virus
an A/Switzerland/8060/2017 (H3N2)-like virus 4
a B/Colorado/06/2017-like virus (B/Victoria lineage) 5
It was recommended that quadrivalent vaccines containing two influenza B viruses contain the
above three viruses and a second B component as follows:
a B/Phuket/3073/2013-like virus (B/Yamagata lineage)5.
More details about the most recent influenza vaccine recommendations can be found at:
http://www.who.int/influenza/vaccines/virus/recommendations/2019_south/en/.
4 This replaces A/Singapore/INFIMH-16-0019/2016 (H3N2)-like virus used in the 2018 seasonal influenza vaccines. 5 The B/Colorado/06/2017-like virus replaces the B/Brisbane/60/2008-like virus in the B/Victoria lineage. It is also now the preferred B strain component for 2019 Southern Hemisphere trivalent influenza vaccines, replacing the B/Yamagata lineage strain, B/Phuket. The B/Phuket strain remains the recommended B/Yamagata lineage strain for 2019 quadrivalent vaccines.

SHPN: (HP NSW) 170557 Page | 14
Australian influenza vaccine strain recommendations for the 2019 influenza season
While WHO makes recommendations for the influenza vaccine, it is up to national authorities to
decide on the final composition for their individual countries. The Australian Influenza Vaccine
Committee (AIVC) met in Canberra in October 2017 made the same recommendations as by WHO
for the quadrivalent vaccine.
However, the recommendation for the Australian trivalent vaccine includes a B/Yamagata lineage
virus (a B/Phuket/3073/2013-like virus), rather than the B/Victoria lineage virus. This is because in
Australia, the vast majority of recently circulating influenza B viruses have been of the B/Yamagata
lineage and few B/Victoria lineage viruses have been detected.
The Therapeutic Goods Administration (TGA) has accepted the AIVC recommendations for 2019.
Information on NSW seasonal influenza vaccination activities, including free vaccine for all children
aged 6 months to less than 5 years can be found at:
http://www.health.nsw.gov.au/immunisation/Pages/seasonal_flu_vaccination.aspx .
WHO influenza vaccine strain recommendations for the Northern Hemisphere in
2018-19
The WHO consultation on the composition of influenza vaccines for the Northern Hemisphere 2018-
19 influenza season was held in February 2018. WHO announced its recommendations for the
composition of quadrivalent vaccines for use in the 2018-19 Northern Hemisphere influenza
season, which includes changes in the influenza A(H3N2) and influenza B (Victoria lineage)
components, as follows:
an A/Michigan/45/2015 (H1N1)pdm09-like virus6;
an A/Singapore/INFIMH-16-0019/2016 (H3N2)-like virus;
a B/Colorado/06/2017-like virus (B/Victoria/2/87 lineage)7; and
a B/Phuket/3073/2013-like virus (B/Yamagata/16/88 lineage).
More details about the most recent influenza vaccine recommendations can be found at:
http://www.who.int/influenza/vaccines/virus/en/ .
6 This replaces A/Hong Kong/4801/2014 (H3N2)-like virus used in the 2017-8 seasonal influenza vaccines. 7 This replaces B/Brisbane/60/2008-like virus used in the 2017-8 seasonal influenza vaccines. The B/Colorado will make up the B component of the trivalent vaccine.