Embed Size (px)
Citation preview
INFLUENTIAL EVALUATIONS:DETAILED CASE STUDIES
Operations Evaluation
Department
WORLD BANK OPERATIONS EVALUATION DEPARTMENT
JANUARY 2005

T H E W O R L D B A N K O P E R A T I O N S E V A L U A T I O N D E P A R T M E N T
Influential Evaluations: Detailed Case Studies
Evaluators are often asked the question by decision-makers: why should I take evaluation seriously, and devote time and effort to doing it well? This volume illustrates the potential benefits fromevaluation by presenting eight case studies of evaluations which were highly cost-effective and of considerable utility to the intended users. A central message is that well-designed evaluations, conducted at the right time and developed in close consultation with intended users, can be a highly cost-effective way to improve the performance of development interventions.
www.worldbank.org.oed/ecd
January 2005The World Bank
Washington, D.C.
ENHANCING DEVELOPMENT EFFECTIVENESS THROUGH EXCELLENCE AND INDEPENDENCE IN EVALUATION The Operations Evaluation Department (OED) is an independent unit within the World Bank; it reports directly to the Bank’s Board of Executive Directors. OED assesses what works, and what does not; how a borrower plans to run and maintain a project; and the lasting contribution of the Bank to a country’s overall development. The goals of evaluation are to learn from experience, to provide an objective basis for assessing the results of the Bank’s work, and to provide accountability in the achievement of its objectives. It also improves Bank work by identifying and disseminating the lessons learned from experience and by framing recommendations drawn from evaluation findings. Evaluation Capacity Development (ECD) helps build sound governance in countries—improving transparency and building a performance culture within governments to support better management and policymaking, including the budget process—through support for the creation or strengthening of national/sectoral monitoring and evaluation systems. OED aims to identify and help develop good-practice approaches in countries, and to share the growing body of experience with such work. The findings, interpretations, and conclusions expressed here are those of the author(s) and do not necessarily reflect the views of the Board of Executive Directors of the World Bank or the governments they represent.
Contact: Knowledge Programs and Evaluation Capacity Development Group (OEDKE) e-mail: [email protected] Telephone: 202-458-4497 Facsimile: 202-522-3125 http:/www.worldbank.org/oed/ecd
i
Abbreviations and Acronyms AsDB Asian Development Bank
AusAID Australian Government Agency for International Development
BAPPENAS National Development Planning Agency
BATF Bangalore Agenda Task Force
BCC Bangalore City Corporation
BDA Bangalore Development Authority
BMC Bangalore Municipal Corporation
BSTDB Black Sea Trade and Development Bank
BWSSB Bangalore Water Supply and Sewage Board
CCICED China Council for International Cooperation for Environment and Development
DRDA District Rural Development Agency
EAP Environmental Action Plan
EAS
FCI
Employment Assurance Scheme
Food Corporation of India
ECG Evaluation Cooperation Group
FMTE Focused Mid-Term Evaluations
FWSSRDP Flores Water Supply and Sanitation Reconstruction and Development Project
GOI Government of Indonesia
IFPRI International Food Policy Research Institute
IMF
IUCN
International Monetary Fund
World Conservation Union
KCM
KEB
Kombinat za Czvetni S.A.
Karnataka Electricity Board
KfW/GTZ German Development Bank/German Agency for International Cooperation
MPA Methodology for Participatory Assessment
MRAE Ministry of Rural Areas and Employment
PAC Public Affairs Centre
PED Post Evaluation Department
PEO Programme Evaluation Organisation
PETS Public Expenditure Tracking Surveys
PIDE Pakistan Institute of Development Economics
PRI Panchayati Raj Institutions
PSA Public Service Agencies
PTA Parent-Teacher Association
QSDS Quantitative Service-Delivery Survey
SGRY Sampoorna Grameen Rojgar Yojana
TFG Taskforce in Forests and Grasslands
UNICEF United Nations Children’s Fund
WASPOLA Indonesian Water Supply and Sanitation Policy Formulation and Action Planning Project
WCD World Commission on Dams
WMOS Water Management Organizations
WSP-EAP World Bank’s Water and Sanitation Program for East Asia and the Pacific
WSS Water Supply and Sanitation Infrastructure
ii
Acknowledgements This Influential Evaluations: Detailed Case Studies volume was prepared as a team effort, with substantive contributions from a number of individuals. Michael Bamberger was the principal researcher and advisor for the study, and he also prepared the case studies on the Bangalore report card and the Uganda public expenditure tracking surveys. Valuable support was provided by Elaine Wee-Ling Ooi (consultant), who also prepared a detailed case study on the China forest evaluation. Other authors of the individual case studies are listed below. • S.P Pal and Amar Singh, Improving the Efficiency of the Indian Employment
Assurance Scheme • Richard Hopkins and Nilanjana Mukherjee, Assessing the Effectiveness of Water and
Sanitation Interventions in Flores, Indonesia • Mita Marra, Broadening the Policy Framework Criteria for Assessing the Viability of
Large Dams • James Garrett and Yassir Islam, The Abolition of Wheat-Flour Ration Shops in
Pakistan • Todor Dimitrov, Enhancing the Performance of a Major Environmental Project in
Bulgaria A companion volume, Influential Evaluations, presents these case studies in summary form. These publications are also available from OED’s evaluation capacity development website: http://www.worldbank.org/oed/ecd/ OED would like to thank all of the authors of the evaluation case studies. The task manager for the Influential Evaluations study was Keith Mackay (OEDKE). A substantive contribution was also made by Dr A. Ravindra, who undertook a detailed review of the impact of the Bangalore citizens' report card; this is presented in a recent OED working paper (An Assessment of the Impact of Bangalore Citizen Report Cards on the Performance of Public Agencies). Valuable information and feedback on individual case studies were provided by Ananya Basu, Stephen Howes, Jikun Huang, Xu Jintao, Uma Lele, Radhika Nayak, Dr Samuel Paul, Ulrich Schmitt and Susan Shen. Valued support was provided by Lydia Ndebele and Juicy Qureishi-Huq. The peer reviewers for this paper were Zhengfang Shi and Susan Stout. Klaus Tilmes Manager Knowledge Programs & Evaluation Capacity Development (OEDKE)
111
Table of Contents
Abbreviations and Acronyms i
Acknowledgements ii
Executive Summary iv
Introduction 11.
2. Improving the Efficiency of the Indian Employment Assurance Scheme6
3. Using Citizen Report Cards to Hold the State to Account in Bangalore,India 13
4. Assessing the Effectiveness of Water and Sanitation Interventions inVillages in Flores, Indonesia 22
5. Broadening the Policy Criteria for Assessing the Viability of Large Dams31
6. The Abolition of the Wheat-Flour Ration Shops in Pakistan38
7. Improving the Delivery of Primary Education Services in UgandaThrough Public Expenditure Tracking Surveys 45
8. Enhancing The Performance Of A Major Environmental Project inBulgaria 50
9. Helping Reassess China's National Forest Policy 58
10. Designing Influential Evaluations: Lessons Learned 64
Annex A. Means of Verification of Each Case Study 69
iv
Executive Summary
Evaluators are often asked the question by senior decision-makers: why should I take evaluation seriously, and devote time and effort to doing it well? The answer to this question centers on the value of the information and understanding which evaluation can offerin support of ongoing management, decision-making, resource allocation, and in accounting for results achieved.
This volume is intended to illustrate the potential benefits from evaluation. It presents eight case studies where evaluations were highly cost-effective and of considerable practical utility to the intended users. The case studies comprise evaluations of development projects, programs and policies from different regions and sectors. The report’s central message is that well-designed evaluations, conducted at the right time and developed in close consultation with intended users, can be a highly cost-effective way to improve the performance of development interventions.
Each case study addresses five questions. What were the impacts to which the evaluation contributed? How were the findings and recommendations used? How do we know that the benefits were due to the evaluation and not to some other factors? How was the cost-effectiveness of the evaluation measured? What lessons can be learned for the design of future evaluations?
The case studies
The case studies were prepared by the World Bank, a regional development bank, a bilateral development agency, a government evaluation agency in a developing country, a national NGO, and an international research institute. The cases were selected from an initial list of 25 potential evaluations suggested by some 300 evaluation practitioners and users from the World Bank and the alumni of the International Program for Development Evaluation Training (IPDET). The initial list of potential cases was screened to identify examples with potentially high levels of utilization, and to eliminate those where it was not possible to ascertain that the findings and recommendations had actually been used.
Measuring the benefits and impacts of the evaluations
Assessing the cost-effectiveness of the evaluations involved a two-step process. First, the potential benefits and impacts of the evaluations were identified and quantified. Five different indicators were used to assess the impacts and benefits to which the evaluation may have contributed. It was possible to estimate a monetary value for the benefits of the first three indicators while for the remaining two only a qualitative assessment could be made.
• Financial or other resource savings, and increased revenue;
• Increased income and employment for the target population;
• Improved utilization of public funds;
• Improved quality of services; and
• Integrating economic and social concerns into development policies.
v
The second step involved an attribution analysis to estimate whether, and to what extent, the evaluation had contributed to these changes. Inevitably, most evaluations are commissioned on topics of current concern to policy makers, planners and managers, and consequently the decision-makers were usually influenced by a number of different sources of information and pressure in addition to the evaluation. Consequently, even if many of the recommendations of the evaluation have been implemented, it is difficult to determine the extent to which the evaluation contributed to these decisions. It is almost never possible to develop a strong counter-factual or to use a quasi-experimental design to assess how the results of an evaluation have been used. In practice, the assessment must rely heavily on information and opinions from the evaluator and other key stakeholders, all of whom may have an interest in either overstating or understating the impacts and utility of the evaluation. A further difficulty is that many agencies may be reluctant to provide any comments on the evaluation. Within this context a combination of one or more of the following approaches was used in the attribution analysis of each case study.
• A survey of key stakeholders was conducted using e-mail and personal interviews;
• Key stakeholders were requested to give their opinions on the utility and impacts of the evaluation;
• Available documents were reviewed to assess how the evaluation findings had been incorporated into government policy or planning documents In some cases, this was supported by discussion in the media;
• Evidence is presented to show that the evaluation contributed to a policy being implemented or a program action being taken earlier than would otherwise have been the case. The benefits are then estimated as the additional revenues or cost-savings resulting from these timely actions; and
• Costs savings are estimated from the reorganization of government programs through reduced salaries, elimination of waste and duplication, or economies of scale.
Where possible, independent verification was obtained through the review of the case studies by people familiar with the programs or policies. A detailed note on the means of verification for each case study is contained in Annex A.
Lessons learned on the design of useful evaluations
The following factors were found to influence the likelihood that the results of the evaluation would be used and would have a significant impact on current or future projects, programs or policies:
• The importance of a conducive policy environment. The findings of the evaluation are much more likely to be used if they address current policy concerns, if the findings can be prepared in a timely manner, and if there is a commitment by funding or policy agencies to accept the political consequences of implementing the evaluation’s recommendations.
• The timing of the evaluation. The evaluation should be launched at a time when there is a recognition that information is required or decisions must be made. It is essential to ensure that the findings are delivered in time for them to affect decisions. This will often mean that initial findings must be communicated informally before the publication of the final report.
vi
• Understanding the role of the evaluation. The evaluation is rarely the only, or even the most important, source of information or influence for policy makers and managers. Consequently, a successful evaluation must be adapted to the context within which it will be implemented and discussed, and the evaluator must understand when and how the findings can most effectively be used.
• Building a relationship with the client and developing effective communication approaches for the evaluation findings. It is essential to establish a good relationship with key stakeholders, to listen carefully to their needs, to understand their perceptions of the political context, and to keep them informed of the progress of the evaluation. This relationship will ensure that there are “no surprises” when the evaluation findings are produced and disseminated.
• Who should conduct the evaluation? The case studies identified two main options, both with potential strengths and weaknesses. In the first, the evaluation is conducted by the evaluation unit of the managing or funding agency. This has the advantage of better understanding of the program and its organizational and political context, and better access to the key actors and to data. A potential risk is that if the evaluator has been closely involved in the program’s management, it might be difficult to provide an independent view, or to explore sensitive areas. In the second option, the evaluation is conducted by an independent agency. This can ensure independence, objectivity and credibility, while placing the evaluation in a broader context and making it easier to explore sensitive issues such as local political pressures or the exclusion of vulnerable groups. However, the outside evaluator may have considerably less program understanding and less access to decision-makers. A third option, not reflected in these case studies, is to attempt to achieve the advantages of the first two optionsby managing and/or conducting an evaluation jointly, involving some combination of external or independent agencies together with program staff.
• The scope and methodology of the evaluation. There is no single best evaluation methodology, as the approach must be adapted to the specific context, the evaluation questions and priorities, and the available resources. One lesson was that it can often be helpful for the evaluator to propose broadening the scope of the evaluation initially requested by the client to assess, for example, the implementation process as well as outcomes, or to study the social and political context within which the program operates. A second lesson was to use a multi-method approach, combining quantitative and qualitative data collection and analysis methods, both to increase the reliability of the findings and to provide a broader framework for their interpretation.
1
1. Introduction
This volume presents eight case studies describing evaluations of development projects, programs and policies from different regions and sectors where the evaluations were judged to be cost-effective and of practical utility to the intended users. The purpose of the report is to provide examples of useful evaluations and to present lessons learned on how to increase the likelihood that evaluations will be useful and that they will be influential. The report’s central message is that well-designed evaluations, conducted at the right time and developed in close consultation with intended users, can be a highly cost-effective way to improve the performance of development interventions.
The case studies address five questions:
• What were the impacts to which the evaluation contributed?
• How were the findings and recommendations used?
• How do we know that the benefits were due to the evaluation and not to some other factors?
• How was the cost-effectiveness of the evaluation measured?
• What lessons can be learned for the design of future evaluations?
The volume is inspired by two current issues in the field of development evaluation. The first is a widespread concern that the utilization rate, even for methodologically sound evaluations, is very low. This is true both for development evaluations (Picciotto 2002) and for evaluations conducted in countries such as the United States where the resources and technical expertise are greater and where it might be supposed that there is a management culture conducive to the use of evaluation findings to improve program performance (for example, Patton 1996). The second is the growing pressure for accountability in international development (Picciotto 2003, Patton 1996) and the emergence of “evidence-based” policy making.
Many reasons have been given for the low rate of evaluation utilization, including: poor timing; lack of consultation with the evaluation clients and a failure to understand their information needs; findings that are not disseminated in a timely way to the potential users; or information not presented in a way which makes it easy to use. A frequent complaint is that evaluators are too concerned with questions of evaluation methodology and pay too little attention to why the evaluation is being done or how it will be used. Finally, the culture of many organizations makes it difficult to accept the kinds of criticisms which evaluations inevitably present; and a common defensive reaction in the face of criticism is to say the evaluation was not useful.
Experts who have expressed concern about evaluation utilization have made recommendations on how to improve the situation; others cite examples of evaluations which have had an important impact on policy formulation or program effectiveness. For example, Michael Patton published a very influential book “Utilization-Focused Evaluation” (1996) which is full of examples of useful evaluations. Caracelli and Preskill (2000) trace the steady expansion of the role of program evaluation and identify a wider range of ways in which evaluations are being utilized. In the development evaluation field, Garrett (1999) presents six examples of policy evaluations, conducted by the International Food Policy Research Institute (IFPRI), which had a significant impact on resource utilization and policy formulation, in some cases helping governments to save tens of millions of dollars. A number
2
of IFPRI publications have also made the case for impact evaluation and policy research as cost-effective management and policy tools (Garrett and Islam 1998, Ryan 2002). Ingram and Feinstein (2001) report on how the findings from World Bank evaluations have been used to produce “user friendly evaluation products.”
The eight case studies presented in this volume provide further evidence that well planned evaluations can be a useful and highly cost-effective tool for development planners and managers.
How the cases were selected
Approximately 100 World Bank evaluation practitioners and staff interested in evaluation, and the approximately 200 alumni of the 2001 and 2002 International Program for Development Evaluation Training (IPDET) were invited to suggest examples of evaluations which had proved of practical utility to the intended users or which had an impact on the performance of the project, program or policy evaluated. Some 50 responses were received and from these a preliminary list of 25 potential case studies of useful evaluations was prepared. While most of the recommended evaluations were methodologically sound, it proved difficult in many cases to determine whether the findings or recommendations of the evaluation had actually been used to improve program performance. The eight cases presented in this volume were selected through the identification of examples with potentially high levels of utilization, and the elimination of cases where it was not possible to ascertain that the findings and recommendations had actually been used. While the cases were not selected randomly, they all represent common types of development evaluation. The review process ensured that all of the evaluations are methodologically sound and that all of the evaluations have produced benefits to the program (in terms of greater efficiency or impacts) which far exceed the costs of conducting the evaluations.
The case studies
A total of eight case studies of development evaluations are presented in this volume. The evaluations were conducted by:
• The World Bank (3 evaluations)
> Large dams evaluation
> Public expenditure tracking studies (PETS) in Uganda
> China’s forest policy;
• A regional development bank (the Black Sea Trade and Development Bank)
> Environmental project (KCM) in Bulgaria;
• A government evaluation agency (the Programme Evaluation Organisation, government of India)
> The Indian employment assurance scheme (EAS);
• An international research organization (the International Food Policy Research InstituteIFPRI)
> Wheat-flour ration shops in Pakistan;
3
• A bilateral aid agency in cooperation with the World Bank (AusAID)
> Water and sanitation interventions in Flores, Indonesia;
• A national non-governmental organization (The Public Affairs Centre, Bangalore India)
> Citizen report cards (CRC) on public services.
Measuring the benefits and impacts of evaluation
Assessing the cost-effectiveness of the evaluations involved a two-step process. First, the potential benefits and impacts were identified and quantified. These were the observed changes to which the evaluation may potentially have contributed. Second, an attribution analysis was conducted to estimate whether, and to what extent, the evaluation had contributed to these changes.
Five different indicators were used to assess the impacts and benefits to which the evaluation may have contributed. With the first three indicators, it is possible to quantify the benefits and impacts, whereas for the last two indicators quantification was not possible, at least within the scope of these evaluations.
• Financial or other resource savings, or increased revenue. For example: the Bulgaria case study estimated the money saved through reducing fines for non-compliance with safety and environmental regulations; the India Employment Assurance Scheme evaluation recommended reductions in the wage bill for program staff and reduction of grain storage costs through consolidating food programs; the Pakistan evaluation led to the elimination of the expensive wheat grain ration shops; and the Bulgaria evaluation recommended ways to generate additional revenue through advancing the start date for the sale of the zinc and chemicals.
• Increased income and employment for the target population. The India Employment Assurance Scheme evaluation recommended ways to increase income and employment by enforcing the required wage/material ratios in community infrastructure construction.
• Greater utilization of public funds. The Uganda Public Expenditure Tracking Studies significantly increased the proportion of approved education funds which actually reached the schools.
• Improved quality of services (which have not been monetized in the evaluations). For example, the Citizen Report Card evaluation in India helped improve the quality of delivery of public services; and the Water and Sanitation study in the Philippines helped improve the efficiency of water supply and sanitation services, and their accessibility to poor households.
• Integrating economic and social concerns into development policies. The Large Dams study resulted in greater attention being given to social considerations in the design of large dams.
Attribution methodology
While it was often relatively easy to obtain evidence that the intended clients (or at least the people who attended the workshops or conferences where the evaluation findings were presented) found the evaluations “useful”, it was much more difficult to determine whether
4
these evaluations actually had any impact on the implementation of the ongoing project, program or policy or on the formulation of future ones. Inevitably, most evaluations are commissioned on topics of current concern to policy-makers, planners and managers. Consequently, decision-makers usually have access to a number of different sources of information in addition to the evaluation. Even if many of the recommendations of the evaluation have been implemented, it is usually difficult to determine whether, and to what extent, the evaluation contributed to these decisions. Often the main sources of information on evaluation utilization are either the evaluation practitioners, who may have an incentive to show that their study was useful; or the clients and decision-makers who may either wish to downplay or to exaggerate the value of the evaluation. Information from all of these sources must be critically assessed and, where possible, cross-checked from other sources. It is almost never possible to assess the impact of the evaluation through the kind of experimental or quasi-experimental designs to which evaluators aspire.
The following menu of approaches was used in these case studies to assess and attribute the impacts of the evaluations. In some cases a stakeholder analysis was conducted as part of the preparation of the case study, while in other cases the authors report on the methodology they had used in the original study.
• A survey of key stakeholders was conducted using e-mail and personal interviews (CRC);
• Key stakeholders were requested to give their opinions on the utility and impacts of the evaluation but no formal stakeholder survey was conducted (Flores, KCM, Large Dams);
• A paper trail was presented to document how the evaluation findings had been incorporated into government policy or planning documents (PETS, EAS, KCM). In some cases this is supported by discussion in the media (PETS, CRC);
• Evidence is presented to show that the evaluation contributed to a policy being taken earlier than would otherwise have been the case. The benefits are then estimated as the additional revenues or cost-savings resulting from these timely actions (IFPRI, KCM); and
• Costs savings are estimated from the reorganization of government programs to reduce salaries or eliminate waste and duplication (EAS).
Where possible independent verification was obtained through a review of the case studies by people familiar with the programs evaluated (CRC, EAS).
A more detailed note on the attribution methodology used for the eight case studies is presented in Annex A.
5
References
Valerie Caracelli and Hallie Preskill. 2000. The Expanding Scope of Evaluation Use. New Directions for Evaluation No. 88. American Evaluation Association. Jossey-Bass: San Francisco.
Osvaldo Feinstein. 2002. The use of evaluations and the evaluation of their use. Keynote speech at the IV Annual Meeting of the Italian Evaluation Association. June.
James Garrett. 1999. Research that Matters: The Impact of IFPRI’s Policy Research. International Food Policy Research Institute: Washington D.C.
and Yassir Islam. 1998. Policy Research and the Policy Process: do the Twain Ever Meet? Gatekeeper Series No. 74. International Institute for Environment and Development: London.
Gregory Ingram and Osvaldo Feinstein. 2001. Learning from Evaluation: The World Bank’s Experience. Evaluation Insights. 3(1): 4-6.
Operations Evaluation Department (OED). 2002. 2002 Annual Report on Operations Evaluation. World Bank: Washington D.C.
Michael Quinn Patton. 1996. Utilization-Focused Evaluation. Third Edition. Sage Publications : Thousand Oaks, California.
Robert Picciotto. 2003. International Trends and Development Evaluation: The Need for Ideas. American Journal of Evaluation, 24 (2), pp. 227-234.
. 2002. Development Cooperation and Performance Evaluation: the Monterrey Challenge. Operations Evaluation Department. World Bank: Washington D.C.
A. Ravindra. 2004. An Assessment of the Impact of Banglalore Citizen Report Cards on the Performance of the Public Agencies: An Evaluation Report. Operations Evaluation Department ECD Working Paper No 12. World Bank: Washington D.C.
Jim Ryan. 2002. Synthesis Report on Workshop on Assessing the Impact of Policy-Oriented Social Science Research. Impact Assessment Discussion Paper 15. International Food Policy Research Institute: Washington D.C.
Swedish International Cooperation Agency (SIDA). 1999. Are Evaluations Useful? Cases from Swedish Development Cooperation. Department for Evaluation and Internal Audit. Stockholm.
Carol Weiss (ed.). 1997. Using Social Research in Public Policy Making. Lexington Books: Lexington, MA.
Joseph Wholey et al. 1970. Federal Evaluation Policy: Analyzing the Effects of Public Programs. Urban Institute: Washington D.C.
World Bank. 2002. Final Outcome of the International Conference on Financing for Development March 22, 2002. Monterrey, Mexico.
6
2. Improving the Efficiency of the Indian Employment Assurance Scheme1 The Employment Assurance Scheme (EAS) was launched in 1993 to provide employment to households in poor and drought-prone regions of India and to create economic and social infrastructure for these communities. The case study reports on an evaluation of EAS conducted by the government’s Programme Evaluation Organisation as part of a national policy promoted by the Planning Commission and the Ministry of Finance to improve effectiveness and reduce expenditures on government-sponsored development programs. The evaluation recommended a number of ways to improve implementation, to increase and improve utilization of funds, and to ensure impacts benefited the most disadvantaged groups and regions. The cost of the evaluation was approximately $146,000. The evaluation is judged to have contributed to a number of savings including the consolidation of food grain stocks, which would save over $13 million each year, in addition to annual savings of $100,000 in civil service staffing costs.
The Scheme The India Employment Assurance Scheme (EAS) was launched in October 1993 in 1,778 rural blocks which are drought prone and disadvantageously located. The primary objective of the scheme was to assure gainful employment of up to 100 person/days per year to the “rural poor who are needy and want work during lean agricultural season” (Ministry of Rural Development 1993). The secondary objective was to create economic infrastructure and community assets for sustained employment and rural development. In April 1997, the scheme was extended to cover all the remaining blocks of the country. The blocks were classified into three groups depending on the size of their total population as well as the Scheduled Caste/Tribe population. 80% of the fund for EAS was contributed by the central government and 20% by the state governments. The total (central and state government together) annual budgetary allocation to EAS worked out to Rs.24.6 billion or US$518 million in 1997-98. The central Ministry of Rural Areas and Employment (MRAE) was responsible for planning, supervision and guidance. The scheme was implemented through the development administration of the state governments. The Ministry (MRAE) issued detailed guidelines for implementation to help planning and implementation, and to prevent misuse and diversion of funds allocated to the scheme. The following guidelines have a direct correspondence with the findings of the evaluation:
•
•
•
•
The states were required to prepare block-wise annual plans containing budget provisions, cost estimates of identified projects, estimates of direct employment opportunities and potential for sustained employment. The District Rural Development Agency (DRDA) was responsible for organizing the planning activities for all the blocks in the district; A block was to be taken as the unit of planning. All wage-employment seekers within the block were required to register with the village Panchayat (local self-government); For all works, the wage-material ratio was fixed at 60:40 to ensure selection of labor-intensive works; 40% of block-level funds were to be allocated for watershed development and 20% each for minor irrigation, rural link roads and school buildings; and
1 This case study was prepared by S.P. Pal, Adviser (Evaluation), and Amar Singh, Director, Programme Evaluation Organisation (PEO), Planning Commission, Government of India. This note is a shorter version of a paper containing more detailed documentation on the evaluation and its utilization.
7
The assets created under EAS were to be handed over to local bodies for maintenance and upkeep.
•
Context for the Evaluation In support of the government’s goal of ensuring fiscal stability, the Planning Commission sought to identify ways to enhance effectiveness of programs through reduction in avoidable expenditures and rationalization of allocative decisions. Two proposed strategies for understanding inadequacies of the EAS and in deciding on the framework and guidelines of the new scheme (Sampoorna Grameen Rojgar Yojana (SGRY)the Rural Full-Employment Scheme) were consolidation of similar schemes and zero-based budgeting. The Programme Evaluation Organisation (PEO) was asked by the Planning Commission to assess the performance of the Employment Assurance Scheme and suggest measures for improvement. In view of reported unsatisfactory performance of EAS and other poverty alleviation schemes, the reforms were already on the agenda of the government. However, an independent evaluation was needed to judge performance on the basis of hard data from the grassroots, and to determine how exactly the restructuring could be undertaken. Focus of the Evaluation The Central Planning Commission, which approves the annual budget for plan schemes, was concerned with continuing under-utilization of funds allocated to the EAS, diversion of funds to unintended uses, and poor performance (as revealed in audit reports), and adverse observations on the performance of the scheme in the Parliament and by the media, NGOs and researchers. The Commission asked the PEO to undertake a comprehensive evaluation of the scheme, and it sought the involvement and cooperation of the Ministry of Rural Development and of state governments to enable PEO to conduct an objective evaluation of the EAS. The Terms of Reference included assessment of: (a) the procedures being followed at the grassroots for identification of projects and beneficiaries; (b) whether guidelines for implementation were being followed; (c) the nature of flow and utilization of funds at the district and block level; (d) the extent of coverage of target groups; (e) whether the scheme was generating adequate employment opportunities and income for the intended beneficiaries; (f) whether the assets created are of quality and being maintained; (g) whether there exist inter-state and inter-district variations in the implementation and impact of the scheme; and (h) whether and what type of restructuring is required to realize its objectives. The Organization and Design of the Evaluation The PEO, an independent organization of the Government of India, evaluates development programs all over India. It is independent of line ministries and is located in the Planning Commission, a major user of lessons from evaluation. PEO has its own field units (15) to generate primary data from villages, households and individuals through sample surveys. The cost of the EAS evaluation was approximately Rs.7 million (US$146,000) and took about 15 months.
8
The evaluation questions for the study were of descriptive and normative type. Some of the issues could have been addressed through analysis of secondary data maintained at different nodes of development administration. However, a preliminary analysis of published data and feedback from the field offices of PEO revealed that the quality, consistency and reliability of secondary information would have to be verified through collection of primary data at the village and beneficiary level. Some evaluation questions were, however, outcome-related and thus warranted primary data collection. In order to capture spatial variations in implementation and performance across states, PEO adopted a multi-site evaluation approach with a non-experimental design. A multi-stage stratified sample design included 28 districts, 56 blocks, 112 villages and 1120 beneficiaries spread over 14 states of India. Except for the first stage units (states, which were selected purposively on the basis of prior knowledge) a stratified random sampling method was adopted to select representative sample units at each stage. Structured instruments were developed and pre-tested and sent to the concerned officers for the selected states, districts, blocks, villages and to the beneficiaries to generate the required data for the study. In addition, qualitative information from knowledgeable persons, direct observation and published information were used in the study. The representatives of the Planning Commission and MRAE were involved actively in the study design, and in identification of evaluation issues and data needs for the study. PEO field teams held discussions on various aspects of implementation of EAS with the officers at different nodes of the implementing agencies to ensure adequate understanding of the actual operation of the scheme. Main Findings
Before finalization, the findings were presented at a seminar in the Planning Commission and also discussed with a peer group. The comments warranted a re-survey of sample units of a few blocks in one state to fill certain data gaps and to check the veracity of a finding. This was done and the necessary revision undertaken in the final report (Programme Evaluation Organisation 2000). Implementation Guidelines
There was little evidence of advance planning with regard to identification of works and beneficiaries at the district or block level. The primary concern of local agencies was to ensure maximum utilization of funds within the fiscal year;
•
•
•
•
•
There were no coordination/monitoring committees in 5 out of 14 states. In some other cases, committees existed on paper but were ineffective; One-fourth of the sample beneficiaries did not belong to the target group. Sample verification of Master Rolls in those blocks where the demand for wage employment was low revealed large scale fictitious entries: up to 90% in one state; In violation of the prescribed norms, many states devoted more than 60% (against the norm of 40%) of EAS funds to materials for link roads, buildings etc. Three states did not spend any of the required 40% of funds for watershed development projects; A high proportion of the funds were used for the renovation/repair of existing assets, or for the creation of small additional facilities in existing schools and Anganwadis (child care centers). Most of the works under EAS were executed through contractors without any active involvement of the villagers, and assets were not transferred to local bodies for maintenance, as envisaged in guidelines; and
9
In some of the main activities, the wages paid were found to be 5 to 10 times the prevailing market wage rates.
•
•
•
•
•
•
•
•
•
•
•
Utilization of Funds
• Administrative delays were largely responsible for low utilization of EAS funds; and • The reported utilization rates at district levels (about 90%) were significantly higher
than the actual observed rates (62%) at block level. The analysis of records found that many district authorities had inflated the reported utilization rates in order to maximize the flow of EAS funds from the central government.
Impact
Many villagers were unaware of the details of the scheme and only learned about employment opportunities through middlemen and contractors; Only around 5% of the target group got employment each year under EAS. The proportions range from 1% in Madhya Pradesh state to 16% in Gujarat; While project records reported a typical EAS beneficiary got around 63 days of employment as against an entitlement of 100 days/annum, field work found an average of only 31 days per beneficiary, ranging from 12 days in Karnataka to 49 days in Uttar Pradesh; and A high proportion of the target population had income significantly below the poverty line, suggesting that more employment opportunities need to be provided if a significant reduction were to be made in rural poverty.
Recommendations of the Evaluation
All rural wage employment schemes should be integrated and linked to food security schemes (food-for-work). This would save on storage cost of public food stocks, improve nutrition of the poor, minimize misuse/diversion of funds and reduce administrative costs; Villagers should participate actively in identification of works, implementation of projects, and maintenance of assets created; A block being the planning unit, the Block Samitis (middle tier of the three-tier local self government) must be responsible for examining the feasibility and execution of the proposed block schemes with technical and administrative inputs from the Block Development Office and the District Rural Development Agencies; To avoid allocation of excess funds to blocks with negligible demand for wage employment, it would be appropriate allocate funds on the basis of a deprivation/ development indexbased on occupational patterns, cultivatable land and its distribution, rainfall patterns, and availability of physical and social infrastructure; Book keeping with respect to inventory of assets was found to be faulty. Separate records for each scheme were recommended; and It was also recommended that the state level co-ordination committees be activated, and that they meet at least twice a year to review progress and recommend follow-up actions on the results of monitoring and evaluation.
10
Dissemination of Evaluation Results
The findings of the study were widely circulated and a Planning Commission seminar was organized at which the representatives of MRAE and state governments participated. In their Mid-Term Appraisal of the Ninth Plan,2 the Planning Commission made extensive use of the findings of the study and drew attention to the corrective steps needed to improve the performance of the scheme. During annual plan discussions, the Commission impressed upon the state governments and MRAE the need for follow-up actions on the results of monitoring and evaluation. The Annual Reports of MRAE also contained information about the commencement and completion of the PEO study.3 Utilization of the Evaluation The Planning Commission was convinced that restructuring of the EAS was needed, and it asked the MRAE to examine the Mid-Term Appraisal, the PEO evaluation report, and findings of other micro-level studies on rural development programs, and to then make a proposal for restructuring the scheme. The evaluation report was extensively discussed by the MRAE consultative committee, and a proposal for restructuring was made. Evidence of this is that many clauses and articles of the guidelines of the restructured schemethe Rural Full Employment Scheme (SGRY)are based closely on the specific recommendations and findings of the evaluation. A number of these are discussed below. Restructuring of EAS EAS was subsequently restructured thoroughly during 2000-2002. Important corrective actions, which have a bearing on the findings of the PEO study, are the following:
•
•
•
•
•
•
•
All rural employment generation schemes were brought under one program, the SGRY, with gradual phasing out of EAS and other similar schemes; The new scheme is linked to food security. Fifty per cent of the annual budget of SGRY is now met by drawing down the excess public stock of foodgrains; The DRDAs are now required to allocate funds and foodgrains to block and village authorities on the basis of a development index, which should include the size of the disadvantaged groups and per capita income from agriculture. This is done to avoid excess flow of funds to blocks where there is no demand for wage employment; The Panchayati Raj Institutions (PRIs, a three-tier local self government) were given a greater role by transferring funds directly to the block and village level PRIs instead of routing through line departments. The village local government (Gram Panchayat) is required to maintain the employment register of workers, and to explain the details of works and employment to the village general body; Advance planning of works to be taken up under the scheme has been made mandatory for approval of funds; The vigilance and monitoring committees are made fully responsible for ensuring successful implementation of SGRY4; and Implementation guidelines have been designed to eliminate undue involvement of contractors and to ensure that implementing agencies adhere to the required wage-material ratio and the norms for inter-sectoral allocation.
2 Planning Commission (2000), pp. 144-145. 3 Ministry of Rural Affairs and Employment (1997-98 to 2000-01). 4 Ministry of Rural Affairs and Employment (2000-01).

11
Assessing the Impacts of the Evaluation Measuring Benefits from Restructuring EAS The reform process underway in the Indian economy since 1991 has increased the demand for evaluation results in support of effective use of public funds and good governance. This is not meant to imply that the entire restructuring of EAS was only due to evaluation results. However, the findings of the evaluation have helped the government to verify the reported poor performance of EAS and the reasons thereof, and the detailed diagnosis and recommendations contained in the evaluation have helped in restructuring the scheme. Benefits arising out of changes to the EAS and other rural employment generation schemes which can be directly related to specific findings and recommendations of the evaluation study include the following:
The consolidation of employment generation and food security programs has made it possible to increase the budgetary allocation to all rural employment generation schemes from about Rs.40 billion (prior to restructuring) to Rs.100 billion now. Ceteris paribus, this step-up in allocation is likely to extend the coverage of the target group from about 10% to 25%;
•
•
•
•
•
The draw-down of excess public stocks of food grains will lead to a potential saving of Rs.3.6 billion per annum in the cost for buffer stock of the Food Corporation of India (FCI), representing about 3.6% of the annual allocation of SGRY; The post-restructuring staff strength of MRAE is about 20% less, leading to an annual saving of Rs.5.1 million in the salary bill of MRAE. About 50% is due to consolidation of employment generation schemes; If the wage-material ratio of 60:40 were strictly adhered to, it would have been possible to generate 22.8% additional employment annually with the current level of spending, or to enhance the annual earning of the existing beneficiaries by 38%. Alternatively, it would have been possible to achieve the existing level of employment under EAS by using only 85% of the current level of spending; and Allowing the PRIs to spend up to 15% of the allocated fund for maintenance will help keep the assets created in working condition and realize EAS’ secondary objective of generating sustained employment opportunities in rural areas.
Given the extent of utilization of the evaluation’s findings, it can be regarded as highly cost-effective. The evaluation cost Rs.7 million (about US$146,000), compared with an annual cost of EAS of Rs.24.6 billion (US$518 million). For example, ceteris paribus, just financing 50% of the (pre-evaluation) allocation of EAS by draw-down of excess public stocks of food grains would have led to an annual saving of about Rs.690 million in the form of reduction in the cost of buffer stock operation. Similarly, the reduced staffing levels could save around Rs.2.5 billion, and adherence to the wage-material ratios could potentially increase employment generation by 22.8% with the current expenditure level. The cost of the evaluation study is about 0.2% of one year’s saving of the Food Corporation of India and is less than .03% of the cost of the EAS program. Lessons Learned The effectiveness of evaluation depends on a number of demand and supply side factors. The following factors can be identified as having influenced follow-up actions on the evaluation findings of (EAS):
12
The demand for evaluation originated from the agency (Planning Commission) which approves plan schemes and their annual budgetary allocations, and which is responsible for their success or failure;
•
•
•
• •
An enabling environment helped the fund-approving authority prevail over the implementing agencies to ensure effective use of public funds and delivery of benefits of development programs to target groups; The location of the evaluation agency within the planning agency allowed a close understanding of the planning agency’s information needs, the overall context and environment, the functioning and incentive structure of the development administration, and it facilitated the effective participation of these stakeholders in the conduct of the evaluation; Functional and financial independence of the evaluator from the users of funds; and Simultaneous assessment of design, implementation and impact of the scheme led to better understanding of the observed phenomena and hence to practical solutions.
References Comptroller and Auditor General of India. 1997. Performance Reviews of Centrally Sponsored Schemes, No. 3. Government of India.
. 2003. Performance Appraisals, No. 3. Government of India
Estimates Committee. 1993. 30th Report. Government of India.
Food Corporation of India. 2002. Annual Report, 2001-2002. Government of India.
Ministry of Rural Areas and Employment. Annual Report (various). Government of India.
. 2002. Guidelines for Sampoorna Grameen Rozgar Yojana (SGRY).
Ministry of Rural Development. 1993. Guidelines for Employment Assurance Scheme (EAS). Government of India.
Planning Commission. 2000. Mid-term Appraisal of Ninth Five Year Plan, 1997-2002. Government of India.
. 2002. Tenth Five Year Plan, 2002-07. Government of India.
Programme Evaluation Organisation. 2000. Evaluation Study on Employment Assurance Scheme (EAS). Planning Commission, Government of India.
Public Accounts Committee. 1987. 94th Report. Government of India.
13
3. Using Citizen Report Cards to Hold the State to Account in Bangalore, India1 In 1993, a group of private citizens in Bangalore, inspired by the methods used by private firms to obtain feedback from their customers, designed a Citizen Report Card to obtain similar feedback from public service delivery agencies in Bangalore, India. This initiative later led to the founding of the Public Affairs Centre, an Indian NGO, which took over the initiative. A sample of households were asked to rate the performance of the principal public service agencies (water and sanitation, hospitals, telephones, power, public transport and land management). The report found a high level of dissatisfaction with the behavior of public servants, a low proportion of problems of ordinary citizens being solved, and a high incidence of “speed money” (bribes). The report’s findings were widely discussed in the media and resulted in public service agencies paying greater attention to the quality of services. A repeat survey in 1999 found a significant improvement in the level of customer satisfaction even though the ratings of most agencies continued to be quite low. Interviews with representatives of public service agencies, senior State Government officials, representatives of civil society organizations and the media all confirmed that the Report Cards, and the resulting increased public awareness contributed significantly to the improved performance of public service agencies. Background: the Poor Quality of Public services in Bangalore In the early 1990s, Bangalore, in common with many other cities in India and other developing countries, was experiencing poor quality of delivery of public services such as water, electricity, transport, public hospitals and the regulation of land. Also in common with other cities most of the population, and particularly the slum dwellers, were resigned to the fact that service delivery would remain poor, that government officials would be unresponsive and that the only way increase likelihood of obtaining services was through bribes (“speed money”). The Citizen Report Card Initiative In 1993, a group of private citizens, inspired by the methods used by private firms working in competitive markets to obtain feedback from their customers, designed a Citizen Report Card to obtain similar feedback from public service delivery agencies in the city of Bangalore. The Report Card asked questions about households' use of all major public services, the reasons why they interacted with the public agencies, their level of satisfaction with the services provided, and the problems they faced in dealing with government service providers, including corruption and delays. Unlike many public opinion surveys, the survey on which the Report Card was based covered only those who had used the specific services, or who had interactions with the public agencies. Such service users possess fairly accurate information on whether a public agency failed to solve their problems or whether they had to pay bribes to officials (Paul 2002).
1 This case study was prepared by Michael Bamberger, a retired World Bank staffer. The case study draws on a detailed review conducted by Ravindra (2004).
14
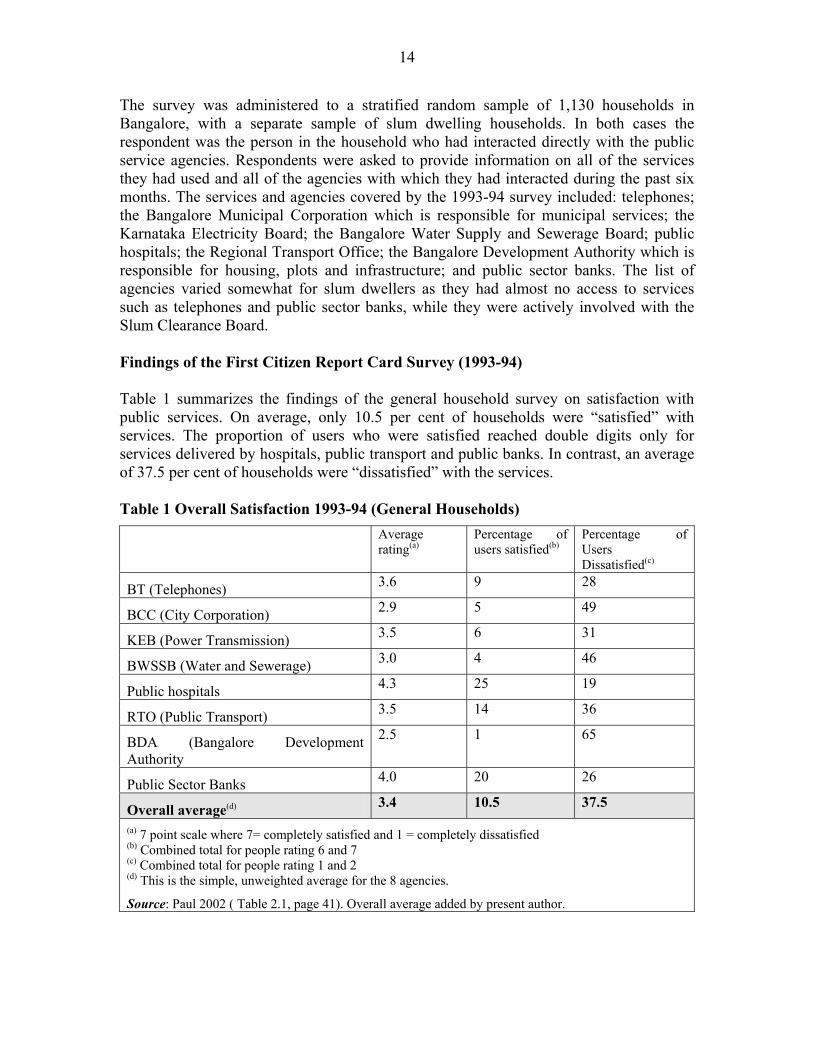
The survey was administered to a stratified random sample of 1,130 households in Bangalore, with a separate sample of slum dwelling households. In both cases the respondent was the person in the household who had interacted directly with the public service agencies. Respondents were asked to provide information on all of the services they had used and all of the agencies with which they had interacted during the past six months. The services and agencies covered by the 1993-94 survey included: telephones; the Bangalore Municipal Corporation which is responsible for municipal services; the Karnataka Electricity Board; the Bangalore Water Supply and Sewerage Board; public hospitals; the Regional Transport Office; the Bangalore Development Authority which is responsible for housing, plots and infrastructure; and public sector banks. The list of agencies varied somewhat for slum dwellers as they had almost no access to services such as telephones and public sector banks, while they were actively involved with the Slum Clearance Board. Findings of the First Citizen Report Card Survey (1993-94) Table 1 summarizes the findings of the general household survey on satisfaction with public services. On average, only 10.5 per cent of households were “satisfied” with services. The proportion of users who were satisfied reached double digits only for services delivered by hospitals, public transport and public banks. In contrast, an average of 37.5 per cent of households were “dissatisfied” with the services. Table 1 Overall Satisfaction 1993-94 (General Households) Average
rating(a) Percentage of users satisfied(b)
Percentage of Users Dissatisfied(c)
BT (Telephones) 3.6 9 28
BCC (City Corporation) 2.9 5 49
KEB (Power Transmission) 3.5 6 31
BWSSB (Water and Sewerage) 3.0 4 46
Public hospitals 4.3 25 19
RTO (Public Transport) 3.5 14 36
BDA (Bangalore Development Authority
2.5 1 65
Public Sector Banks 4.0 20 26
Overall average(d) 3.4 10.5 37.5
(a) 7 point scale where 7= completely satisfied and 1 = completely dissatisfied (b) Combined total for people rating 6 and 7 (c) Combined total for people rating 1 and 2 (d) This is the simple, unweighted average for the 8 agencies.
Source: Paul 2002 ( Table 2.1, page 41). Overall average added by present author.
15
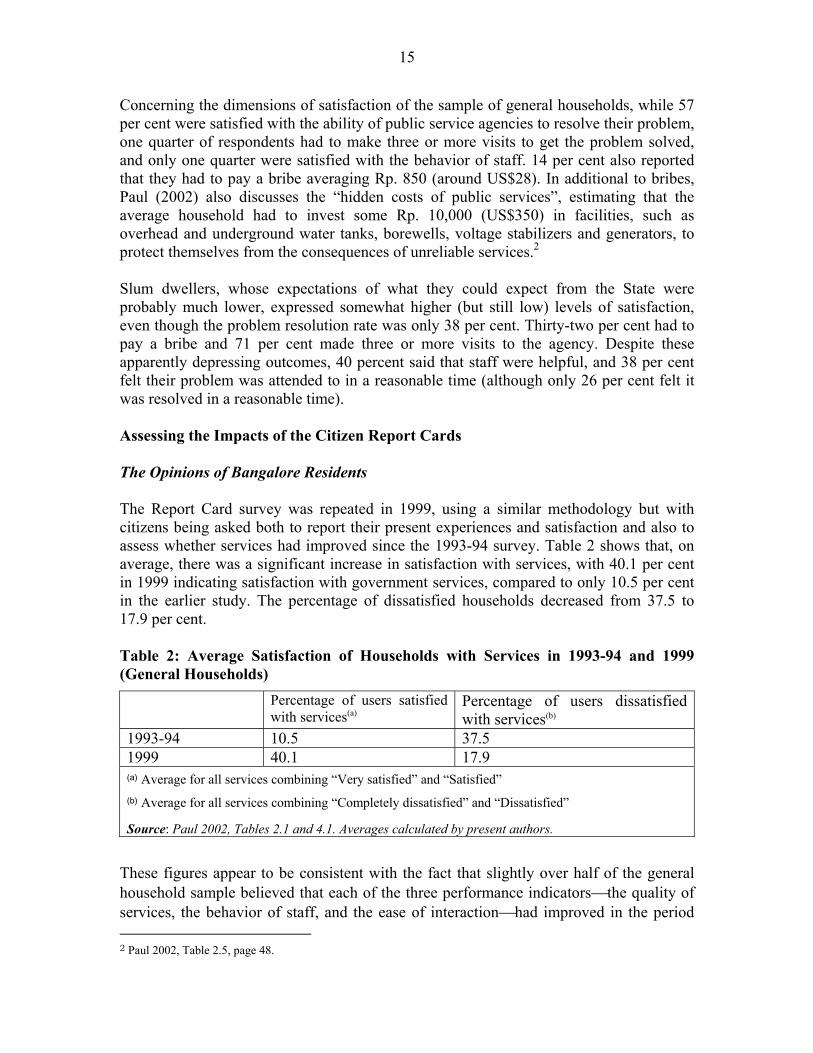
Concerning the dimensions of satisfaction of the sample of general households, while 57 per cent were satisfied with the ability of public service agencies to resolve their problem, one quarter of respondents had to make three or more visits to get the problem solved, and only one quarter were satisfied with the behavior of staff. 14 per cent also reported that they had to pay a bribe averaging Rp. 850 (around US$28). In additional to bribes, Paul (2002) also discusses the “hidden costs of public services”, estimating that the average household had to invest some Rp. 10,000 (US$350) in facilities, such as overhead and underground water tanks, borewells, voltage stabilizers and generators, to protect themselves from the consequences of unreliable services.2 Slum dwellers, whose expectations of what they could expect from the State were probably much lower, expressed somewhat higher (but still low) levels of satisfaction, even though the problem resolution rate was only 38 per cent. Thirty-two per cent had to pay a bribe and 71 per cent made three or more visits to the agency. Despite these apparently depressing outcomes, 40 percent said that staff were helpful, and 38 per cent felt their problem was attended to in a reasonable time (although only 26 per cent felt it was resolved in a reasonable time). Assessing the Impacts of the Citizen Report Cards The Opinions of Bangalore Residents The Report Card survey was repeated in 1999, using a similar methodology but with citizens being asked both to report their present experiences and satisfaction and also to assess whether services had improved since the 1993-94 survey. Table 2 shows that, on average, there was a significant increase in satisfaction with services, with 40.1 per cent in 1999 indicating satisfaction with government services, compared to only 10.5 per cent in the earlier study. The percentage of dissatisfied households decreased from 37.5 to 17.9 per cent. Table 2: Average Satisfaction of Households with Services in 1993-94 and 1999 (General Households)
Percentage of users satisfied with services(a)
Percentage of users dissatisfied with services(b)
1993-94 10.5 37.5 1999 40.1 17.9 (a) Average for all services combining “Very satisfied” and “Satisfied” (b) Average for all services combining “Completely dissatisfied” and “Dissatisfied”
Source: Paul 2002, Tables 2.1 and 4.1. Averages calculated by present authors.
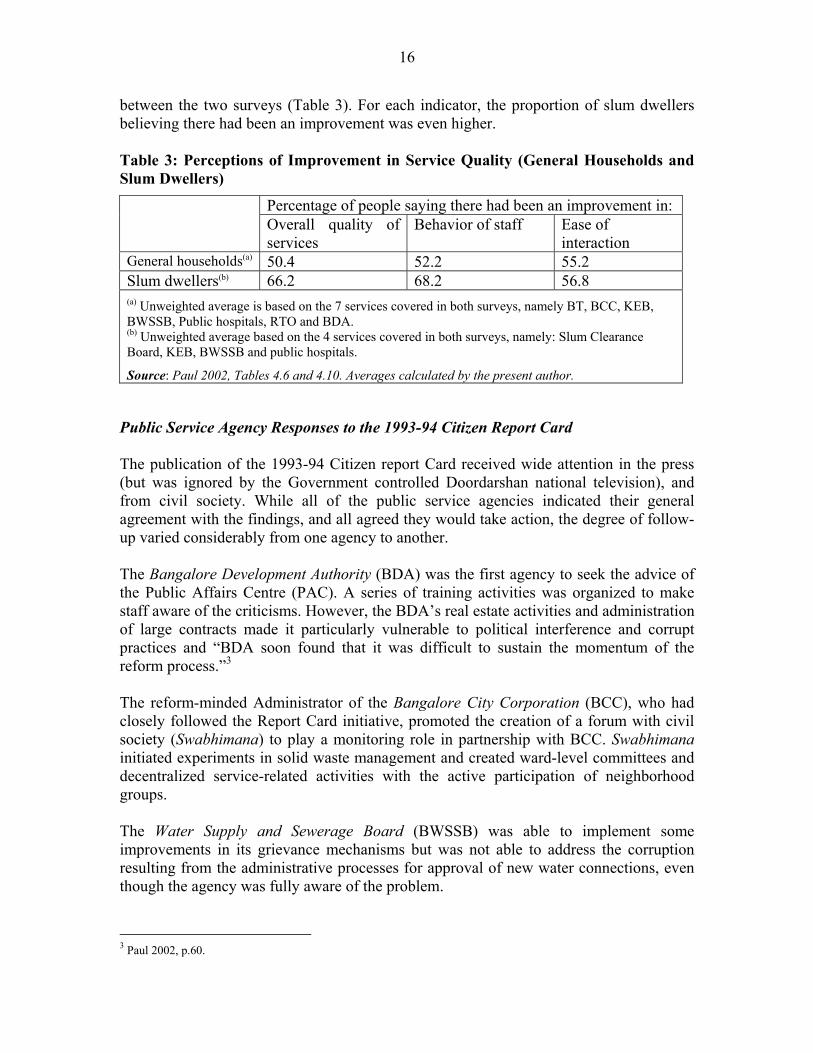
These figures appear to be consistent with the fact that slightly over half of the general household sample believed that each of the three performance indicatorsthe quality of services, the behavior of staff, and the ease of interactionhad improved in the period 2 Paul 2002, Table 2.5, page 48.
16
between the two surveys (Table 3). For each indicator, the proportion of slum dwellers believing there had been an improvement was even higher. Table 3: Perceptions of Improvement in Service Quality (General Households and Slum Dwellers)
Percentage of people saying there had been an improvement in: Overall quality of services
Behavior of staff Ease of interaction
General households(a) 50.4 52.2 55.2 Slum dwellers(b) 66.2 68.2 56.8 (a) Unweighted average is based on the 7 services covered in both surveys, namely BT, BCC, KEB, BWSSB, Public hospitals, RTO and BDA. (b) Unweighted average based on the 4 services covered in both surveys, namely: Slum Clearance Board, KEB, BWSSB and public hospitals.
Source: Paul 2002, Tables 4.6 and 4.10. Averages calculated by the present author.
Public Service Agency Responses to the 1993-94 Citizen Report Card The publication of the 1993-94 Citizen report Card received wide attention in the press (but was ignored by the Government controlled Doordarshan national television), and from civil society. While all of the public service agencies indicated their general agreement with the findings, and all agreed they would take action, the degree of follow-up varied considerably from one agency to another. The Bangalore Development Authority (BDA) was the first agency to seek the advice of the Public Affairs Centre (PAC). A series of training activities was organized to make staff aware of the criticisms. However, the BDA’s real estate activities and administration of large contracts made it particularly vulnerable to political interference and corrupt practices and “BDA soon found that it was difficult to sustain the momentum of the reform process.”3 The reform-minded Administrator of the Bangalore City Corporation (BCC), who had closely followed the Report Card initiative, promoted the creation of a forum with civil society (Swabhimana) to play a monitoring role in partnership with BCC. Swabhimana initiated experiments in solid waste management and created ward-level committees and decentralized service-related activities with the active participation of neighborhood groups. The Water Supply and Sewerage Board (BWSSB) was able to implement some improvements in its grievance mechanisms but was not able to address the corruption resulting from the administrative processes for approval of new water connections, even though the agency was fully aware of the problem.
3 Paul 2002, p.60.
17
While the Electricity Board was able to implement some minor improvements, its ability to introduce more far-reaching changes was limited by periodic shortages of electricity and difficulties in controlling theft of electricity. Finally there were significant improvements in the performance of the telephone company but this was during a period in which BT was exposed to competition from private cell phone providers. For this reason it is difficult to assess to what extent the improvements were influenced by the Report Card. By the time the second Report Card was published, the new Chief Minister of Karnataka had formed the “Bangalore Agenda Task Force” (BATF), consisting of prominent city residents. BATF was tasked to come up with suggestions on ways to improve the quality of services and infrastructure. According to Wagle and Shah (2003), this was the first time a Chief Minister had responded to persistent citizen demands in this way. While the above information makes a plausible case that the Report Cards stimulated or contributed to efforts to improve performance on the part of most of the agencies studied, a key question is to what extent these efforts can be attributed to the Report Cards rather than to the effects of other factors. Feedback from Key Stakeholders on the Effects of the Report Cards4 In 2003, a local consultant was commissioned to interview a sample of senior officials from several of the larger public service agencies (PSAs), together with State officials and representatives of local NGOs and the local media, to obtain their perspectives on the impacts of the Report Cards. Thirty-one persons were interviewed19 heads and officials of public service agencies, five senior state officials, seven representatives of citizen groups and four from the media. A substantial majority agreed with the Report Card findings and recommendations. Most judged that the Report Cards had contributed to the improvement of the quality of public services, by making both the agencies and general public aware for the first time of the generally poor quality of services, by proposing specific and practical improvements which could be made, and by serving as a catalyst both to stimulate the agencies to start taking actions to improve the services and to provide a set of issues around which civil society could organize. Feedback from Public service agencies (PSA) Karnataka Electricity Board: Four senior officials were interviewed. There was general agreement about the Report Card being a good feedback mechanism. It was considered, by and large, an “indicator of the state of affairs” and that it gave a “fairly accurate picture of what the user really faces”. It thus served as a wakeup call to the authorities to deal with the problems in their organizations. All the respondents referred to the reforms introduced in KEB and the resultant improvements. Examples included a training program for staff aimed at behavioral change and skill development, developing a citizen’s charter, and launching a website to 4 This section is a summary of Ravindra 2004.
18
provide information to customers. Some specific measures leading to positive outcomes were: computerization of billing to overcome wrong billing (this problem had caused the most complaints, and was emphasized in the findings of the first Report Card); electronic payment facility; adequate supply of application forms; elimination of the requirement that applications be routed through electrical contractors; setting up reception counters to receive applications and complaints; voice recording systems to reduce response time; and a mobile facility for receiving payments in remote areas. The reforms were the outcome of a number of factors, including the State Government’s policies, the Electricity Regulatory Commission’s service delivery code, the support of the Bangalore Agenda Task Force (BATF), and citizen pressure. The Report Card had helped create awareness about KEB’s shortcomings and accelerated the reforms. Bangalore Water Supply and Sewage Board (BWSSB): Four senior officers were interviewed. In the absence of any such previous study, the opinion was that the Report Cards had helped create awareness about the role of PSAs and how ordinary people viewed them. All the respondents were quick to point out that BWSSB had taken several measures towards customer orientation; staff behavior had improved following training programs. A public grievance redress system had been developed. Water adalats (water courts) now meet periodically to sort out consumer problems. The various services provided by the agency, along with time limits, are displayed in all offices of the Board, thereby promoting access to information. Services to the poor had improved through provision of individual water connections to their houses. However, all these changes could not be attributed solely or even largely to the Report Card. The changes were more the outcome of BWSSB’s own initiatives and government support, with the Report Card acting as a catalyst. The role of citizen groups and resident associations in demanding better services was also acknowledged. Bangalore Municipal Corporation: The five senior officers interviewed were well informed about the Citizen Report Cards and quite appreciative of its utility. They felt it was a good tool to obtain people’s feedback; all of them had interacted with the Public Affairs Centre on more than one occasion. They generally agreed with the findings. Solid waste management had seen marked improvement with the introduction of door-to-door collection of garbage. Committees had been constituted for inspection of roads to ensure quality control. A manual on road maintenance had been made available to citizens. The assessment of property tax had been made simple and transparent through a self assessment scheme. This had resulted in increased tax collection and reduced corruption. Time limits had been prescribed to attend to public complaints. Staff behavior had improved and there is now greater interaction with citizen groups. In view of its numerous functions and the presence of elected representatives, BMC receives public scrutiny to a considerable extent. The respondents admitted that public pressure does push them to better performance. They also noted the increased civic activism in Bangalore in recent years, given the large number of NGOs and resident
19
groups. BMC had in fact taken the initiative in setting up Swabhimana, a forum to work together with citizen groups. They judged the Report Card to have served as a good tool to keep up public pressure and increase accountability. Feedback from State officials Five senior State officials, familiar with the Report Cards, all considered that the impact of the Report Card was positive. The Principal Secretary to the Chief Minister stated that “the work done by the Public Affairs Centre, especially in the context of analyzing citizen satisfaction levels and feedback on the quality of public services, has had a profound impact on my work as a public manager” He believed that “both public policy and its implementation are considerably refined by an energetic and comprehensive Report Card system”. The Finance Secretary of the State, who had earlier worked as Director (Finance) in the Electricity Board said that the PAC enjoyed credibility as an impartial and independent organization. The Report Card “reflected what the user faces” and “helped to deal with the problems as seen by the users”. At the launch of the Millennial Survey of Kerala’s Public Services, the Chief Minister said: “I would like several Public Affairs Centres to be set up in this state. I need to get citizen feedback on government’s services without bias or expectation of favors. I want independent feedback that can be trusted. That it has been presented here without fear or bias is the merit of the PAC findings even though they are critical of our services. I propose to act on the findings provided by the PAC study”. Respondents also mentioned some limitations of the Report Card, such as lack of sufficient publicity. The first Report Card particularly was not well known. One reason could be that the Report Card was prepared in English, and the local language translations were not brought out. Even in PSAs, the findings of Report Cards were known mostly to top management. Moreover, the findings projected the PSAs in negative light, ignoring their achievements. Feedback from Citizen Groups Representatives of seven citizen’s groups were interviewed. All of them were well acquainted with the Report Card and the PAC, and were generally appreciative of the work done by the latter. They generally agreed with the findings of the Report Cards and believed that they reflected people’s perceptions. One of them said that the Report Card could serve as an "eye opener" to the PSAs. The Report Card had helped citizen’s groups understand the processes of citizen – government interaction, especially how service providers respond to the needs of the people. A few of them were able to take up some of the issues raised in the Report Cards with the concerned agencies, such as the redress of public grievances and setting up ward committees with the government to press for decentralized governance. One perception shared by all respondents was that the service providers had become more transparent. The interaction between the PSAs and the citizens, especially the
20
resident associations, increased, and officials became more prepared to share information. After the second Report Card, the State Government also showed considerably more interest in city affairs and set up the Bangalore Agenda Task Force. Improvements in the quality of service and the behavior of staff were visible in all the agencies, though in varying degrees. Government and PSAs had become more proactive and started collaborating with citizen groups including PAC in improving the quality of life. The Report Card had served to focus attention on people's voice and to increase public awareness. While the Report Card had created greater awareness among those who had access to it, the respondents felt that the dissemination was poor. In the absence of local language versions, knowledge of the Report Cards seemed confined to the English speaking public. Opinions of the Media The four media representatives interviewed all opined that the Report Card constituted a productive effort at creating awareness about how the PSAs fared in the eyes of the people. The findings were realistic and "brought to light what existed". However, the study ignored the constraints faced by the PSAs in bringing about reforms. In terms of impacts and outcomes, the general view was that in the absence of self-evaluation by PSAs, the Report Card served to highlight the problems faced by the people and exert pressure on the agencies to take corrective action. A number of factors accounted for the actual improvement in the quality of public servicesgovernment initiatives; people pushing for reforms; and media pressure. The contribution of the Report Card was to accelerate the process. While the impact of the first Report Card was limited, the media had also participated in the public meetings organized by the PAC after the second Report Card, and this had contributed to greater awareness. The media reported the findings of the Report Cards but it was admitted by the respondents that there was no sustained effort on their part to track the action taken by the PSAs on the Report Card findings. One media representative stated that “Dr. Paul and his Public Affairs Centre have opened doors, even windows for a healthy tête-à-tête with our service providers… (At the public hearing, officials responded) not in anger, but with humility, admitting their faults and making very clear that they mean business: the welfare of the citizenry, the betterment in the quality of life, was uppermost on their agenda……The Public Affairs Centre will, no doubt, keep up the pressure. And so should we.” Some Criticisms of the Report Card Studies Despite the generally favorable reactions to the Report Cards, a number of criticisms were expressed in the interviews. The main criticism by PSAs concerned the fact that only customers were consulted; the views of the service provider agencies were not solicited. In their opinion this introduced a serious bias as only the negative side of the story was presented and no reference was made either to the serious constraints (such as
21
budget constraints) affecting many of the agencies, or to the significant progress made by many of the agencies over the period covered by the study. Both PSAs and civil society felt that the design of the study could have been improved if they had been consulted. It was also felt that the impact of the reports was limited by only being published in English and by their relatively limited dissemination. Was the Evaluation Cost-Effective? Each Report Card took about 7 months to complete and cost $10-12,000 to prepare. In addition, the PAC devoted considerable time to dissemination of the survey findings, persuasion of government departments about the need for change, and direct support for several departments which had asked for assistance. The available evidence suggests that while other factors were also at work, the Report Cards made an important contribution to the improvements in public service delivery in Bangalore. The investment of about $22,000 in the two Report Cards, plus follow-up dissemination and collaboration with government departments, helped contribute to an estimated 50 per cent improvement in satisfaction with all major public services. Thus, the report cards do appear to have been highly cost-effective. References A. Ravindra. 2004. An Assessment of the Impact of Banglalore Citizen Report Cards on the Performance of the Public Agencies: An Evaluation Report. Operations Evaluation Department ECD Working Paper No 12. World Bank: Washington D.C.
Samuel Paul. 2002. Holding the State to Account: Citizen Monitoring in Action. Books for Change. ACTIONAID: Karnataka. India.
Swarnim Wagle and Parmesh Shah. 2003. Bangalore India: Participatory Approaches in Budgeting and Public Expenditure Management. Social Development Notes No. 70. Social Development Family. Environmentally and Socially Sustainable Development Network. World Bank: Washington D.C.
22
4. Assessing the Effectiveness of Water and Sanitation Interventions in Villages in Flores, Indonesia1
The Flores Water Supply and Sanitation Reconstruction and Development Project (FLOWS) was designed to increase the provision, access, effective use and sustainability of rural and urban water supply and sanitation facilities with an emphasis on development and strengthening of project management. The case study describes an evaluation which used the “Methodology for Participatory Assessment” (MPA) to look at the delivery, quality and sustainability of FLOWS services through the eyes of both user communities and external technical researchers. The evaluation found that: (a) while most projects were completed, the quality of services was declining, (b) most of the benefits were monopolized by the better-off sectors of the community, with the poor significantly under-served, and (c) the program failed to address issues of social conflict which continued to undermine project effectiveness. The evaluation made a significant contribution to the Government of Indonesia’s Water and Sanitation Policy by showing firstly, that many of the policy’s stated principles of community management through gender and social equity were often not translated into practice, and secondly, that when these principles were implemented, they led to significantly better outcomes for the intended populations. The evaluation cost an estimated $150,000, compared to a project cost of around $20 million. Background In December 1992, Flores island in the eastern archipelago of Indonesia suffered a major earthquake and tidal wave. This event claimed several thousand lives and destroyed most of the existing, meager infrastructure. Some of the subsequent emergency relief efforts progressively evolved, or gave way to longer-term development projects. The water and sanitation sector was a priority. One such project was the AusAID2-assisted Flores Water Supply and Sanitation Reconstruction and Development Project (FWSSRDP, later known as FLOWS). An evaluation was conducted about five years after the projects had been completed. The aim of the five-year FLOWS Project was to assist the Government of Indonesia (GOI) with reconstruction and development of water supply and sanitation facilities in urban, peri-urban and under-served rural areas of Flores Island, in Nusa Tenggara Timur Province. It was intended that the initial emergency assistance would be followed by longer-term assistance with the reconstruction and development of water supply and sanitation (WSS) infrastructure. The project officially commenced in July 1994. The project goal was to promote social and economic development by increasing the provision, access, effective use and sustainability of water supply and sanitation facilities in urban and rural communities, with emphasis on development and strengthening of project management.
1 This case study was prepared by Richard Hopkins and Nilanjana Mukherjee, and is based on the findings detailed in the full study report Flores Revisited, written by Christine van Wijk, Kumala Sari and the Pradipta Paramitha team, Nina Shatifan, Ruth Walujan, Ishani Mukherjee and Richard Hopkins, draft dated December 2002. 2 AusAIDthe Australian Government Agency for International Development.
23
A number of key aspects of the project design were based on AusAID experience from earlier projects in the Eastern Islands, including: targeting of economically disadvantaged communities and families; community participation, and engagement in decision-making processes; integrated environmental health education to reinforce the sanitation program; demand-driven interventions; cost recovery through community capital cost contribution and user fees; training, human resource and institutional strengthening; and involvement and development of local NGOs. The Australian contribution to project costs covered technical assistance and training, and the procurement of goods and equipment. The balance of materials and equipment, and the costs of construction work were met by the GOI, with communities also making significant contributions to the rural component works. Total estimated project costs exceeded US $20 million. The Evaluation Methodology and Costs The universe for the study was defined as all 260 sites in Flores where village water supply and sanitation projects were carried out between 1994-97. The universe thus included sites covered under the AusAID-supported FLOWS project, a World Bank project, village projects assisted by CARE International, and by national NGOs. A stratified random sample of 63 sites was drawn from the total of 260, properly representing the geographic spread in 5 mainland districts, the different projects, scheme size and type of technology, topographical and climate variations across the main island, and different levels of accessibility. The Methodology for Participatory Assessment (MPA)3 was used for the study, with fine-tuning of the tools to the local culture and language. The MPA combines a set of participatory research tools with quantitative analysis to assess sustainability and effective use of water supply and sanitation services, while also assessing the extent of gender- and social- equity achieved in project processes and outcomes. It uses specific techniques to involve groups that may not otherwise be consulted. For reasons of lack of access and non-functioning of some selected facilities, it was only possible to complete the full MPA assessment in 52 of these 63 villages. For the rest, key informants and secondary data sources provided the information collected. Gender-balanced teams of Indonesian researchers with a mix of technical and social assessment skills, and trained in the MPA, facilitated the participatory assessments in the local communities. Within each village, sampling was carefully undertaken to ensure that all groups, especially those traditionally marginalizedwomen and the poorwere included in the assessments. Training, field supervision, analysis and quality assurance support were provided by the World Bank’s Water and Sanitation Program for East Asia and the Pacific (WSP-EAP). The approximate total direct costs for the study were: US$45,000 for international consultants, and US$105,000 equivalent for the national inputs. The study took 12 months from conceptualization to the completion of the first draft report in English. 3 Methodology for Participatory Assessments (MPA). See Mukherjee and van Wijk (2003).
24
The study looked at present water supply, sanitation and hygiene conditions through the eyes of both the user community and external technical researchers. It examined the extent and effectiveness of the communities’ use of the improved water supply and sanitation facilities provided through the project and reasons underlying these. Institutional, poverty and gender aspects of project outcomes were studied and their links with service sustainability were investigated. Conclusions and recommendations were then made to contribute to ongoing policy development and institutional reform processes in Indonesia. Key Findings What was working? Water supply schemes had been completed in 87% of the sample villages. Almost all were still working to some degree, 3-8 years after construction. The communities themselves kept the schemes operating, with minor maintenance and repairs. However, service levels had fallen significantly at more than half the sites, and 22 per cent of the systems were providing little or no water for more than three months of the year. In the area of sanitation, household toilets constructed by the projects were almost all still functional. The distribution of toilets between and within villages was very uneven, ranging from 6% to 100 % in different villages, with an average of 54% of households owning improved toilets. What was not working and why? In 13 per cent of the sample villages water supply schemes were never completedin some cases not even beguneven though communities had contributed cash and labor. Social conflict was the major reason, especially concerning the sharing of water resources between villages. The projects had no mechanisms to deal with this important determinant of sustainability, neither in brokering agreements nor in facilitating alternative supply options in the absence of reasonable agreements. The more ambitious schemes were more likely to expose conflicts, and conflicts tended to be more severe in drier areas, where competition for scarce resources, especially during the dry season, was more pronounced. Did the poor gain access to improved water supply and hygiene? Access to improved water supplies was rated as “good”4 by the users in 85% of villages. While there was no evidence of systematic exclusion of the poor, the adequacy of water was generally less for this group. More than half the water supply schemes had been modified from their original project designs, almost always through house connections from the piped network. As the systems were designed for communal standpipes only, take-offs for house connections affected flows in the rest of the network. These adaptations resulted in inequitable capturing of benefits by certain sections of the community, usually the better-off and the powerful. Where public standpipes were functioning, some curious restrictions had been imposed on their use, ostensibly for hygiene-related purposes. Their origin and rationale were unclear but mostly those without house connections, i.e. the poor, felt the burden. The 4 According to users “good” was a relative concept, only meaning that access was “better than before the project”, when they used to have to walk to water sources much farther away.
25
projects generally provided up to 45 “demonstration packages” of toilet construction materials to each village, leaving the village leaders to decide who should get them. In many villages ordinary men and women either never got to know about these packages, or were unaware who had received them, while village leaders were reluctant to explain what had happened. Households which currently own improved toilets are predominantly from the upper or middle classes of village populations. Access to improved toilets was extremely variable in different villages. While almost all toilets were being used, three-quarters of all adults and children still defecated in places other than toilets at times, and infant feces continued to be disposed of unsafely, in places other than into toilets. Most poor women and men considered frequent hand washing both unnecessary and less than feasiblegiven that they rarely have house connections and must carry all their water home from external sources. Due to the project-promoted “rule”, most women and men in the study communities also tend to believe bathing and washing of children at public taps to be a “bad hygiene practice”. This is actually a good hygiene practice, especially in dry areas, as prevention against skin and eye infections, amongst other things. It also reduces the workload of women and girls. This “rule” evidently further inhibits the practice of good hygiene by poor households. A few made key decisions for many. All the sampled projects were designed around participatory, community-based approaches, in theory. But in implementation, ordinary villagers (both men and women) had little say in the key project decisions. They had participated in less than 20 per cent of decisions about choice of technology, level of service or locations for facilities; and in less than half of decisions regarding the selection of committee members and financing arrangements. These matters were typically decided by project staff with the village elite or community leaders. Financial sustainability was threatened and the poor burdened unfairly. User payments did not cover full recurrent costs, and 59 per cent of communities even had major shortfalls in covering direct operating costs. Almost all villages had set fixed contribution rates per household for construction of the facilities and flat rates for water user fees for all consumers irrespective of economic means and lifestyles. The flat rates disadvantage the poor, who tend to consume less water, but for whom the water tariff represents a greater proportion of their incomeresulting in the poor actually subsidizing the better-off households. The rich are also the vocal elite group in villages, who interact with project functionaries to influence decisions about locations of water facilities. This was confirmed by community mapping, which showed poor households to be farther away from water facilities than the better-off classes. These inequities likely reflect the lack of participation of poor households in community decision-making, which the projects did not specifically address. Gender and social equity made for better-managed and more sustainable services. Only 31 per cent of the communities still had active Water Management Organizations (WMOs) 3-8 years after project completion. Those with higher proportions of women were more active. More equitable (gender and poverty inclusive) WMOs were associated with better performing services, more effective management and better cost recovery
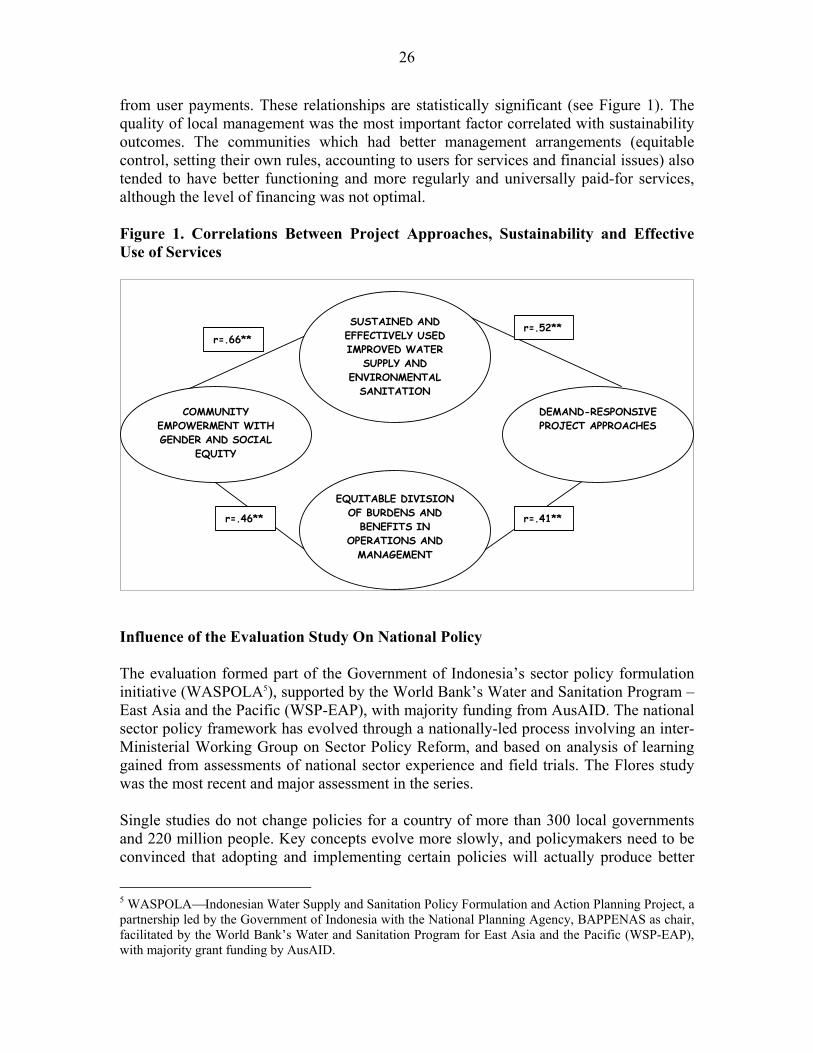
26
from user payments. These relationships are statistically significant (see Figure 1). The quality of local management was the most important factor correlated with sustainability outcomes. The communities which had better management arrangements (equitable control, setting their own rules, accounting to users for services and financial issues) also tended to have better functioning and more regularly and universally paid-for services, although the level of financing was not optimal. Figure 1. Correlations Between Project Approaches, Sustainability and Effective Use of Services
fluence of the Evaluation Study On National Policy
he evaluation formed part of the Government of Indonesia’s sector policy formulation
ingle studies do not change policies for a country of more than 300 local governments
EQUITABLE DIVISION OF BURDENS AND
BENEFITS IN OPERATIONS AND
MANAGEMENT
DEMAND-RESPONSIVE PROJECT APPROACHES
COMMUNITY EMPOWERMENT WITH GENDER AND SOCIAL
EQUITY
SUSTAINED AND EFFECTIVELY USED IMPROVED WATER
SUPPLY AND ENVIRONMENTAL
SANITATION
r=.52** r=.66**
r=.41** r=.46**
In Tinitiative (WASPOLA5), supported by the World Bank’s Water and Sanitation Program – East Asia and the Pacific (WSP-EAP), with majority funding from AusAID. The national sector policy framework has evolved through a nationally-led process involving an inter-Ministerial Working Group on Sector Policy Reform, and based on analysis of learning gained from assessments of national sector experience and field trials. The Flores study was the most recent and major assessment in the series. Sand 220 million people. Key concepts evolve more slowly, and policymakers need to be convinced that adopting and implementing certain policies will actually produce better
5 WASPOLAIndonesian Water Supply and Sanitation Policy Formulation and Action Planning Project, a partnership led by the Government of Indonesia with the National Planning Agency, BAPPENAS as chair, facilitated by the World Bank’s Water and Sanitation Program for East Asia and the Pacific (WSP-EAP), with majority grant funding by AusAID.
27
sector outcomes. In the present case, assessing impacts is even more difficult because the immediate impacts of the evaluation are on the national policy framework, but the ultimate responsibility for water supply and sanitation services rests with local governments, and the first trial implementations with local governments are only just beginning. In fact, the really big impacts, which will take even longer to assess, are through the mobilization of complementary community contributions when projects are designedas was the Flores projectto promote community participation. Experience from earlier projects has suggested that community contributions can be up to 10 times greater than government and donor financial contributions.6 However, while recognizing that this case study can only present a preliminary and
or a number of reasons, the Flores evaluation study was such a key step. The most
he findings raised policymakers’ awareness about the challenges in translating policies
ox 2 presents the view of the AusAID Technical Advisor, who considered that the
indicative assessment of the potential impacts of the evaluation, well-designed and executed research can encourage policymakers to take the next step in the process and convince those who are uncertain of the effectiveness of the proposed approaches. Fimportant reason was that all the major sector projects implemented over the 1990s in Flores were designed in accordance with the principles underlying the new sector policy. The study revealed that these principles were infrequently translated into practice, but where they were, they did in fact result in better outcomes for the intended project populations. Thus it doubly reinforced the foundations of the new policy, linking sustainability and effective use of services (policy objectives) with gender- and poverty-sensitive, demand-responsive approaches (elements of sector strategy). Tinto practice at community level. When project implementers were ill-informed about overall goals or misunderstood them, the goals could be compromised or negated entirely by contradictory project rules. The challenges extended through all aspects of implementation, monitoring and reporting which did not involve the users, leaving managers and project agencies ill-equipped to address the problems that emerged as a result. The views of a representative of the National Planning Agency (BAPPENAS) show how national policy-makers viewed the utility of the evaluation (Box 1). Bevaluation both showed that many seemingly small design issues can have long-term impacts, and also identified some of the broader policy issues.
6 See for example, WASPOLA project field trials in UNICEF WES project in West Java, 2000-02 (report forthcoming), which showed that once communities are empowered with real decision-making based on informed choice, they make very substantial contributions (7 to 10 times the value of the project contribution) to services and facilities they demand, and feel that they own.
28
Box 1. A Perspective From the National Planning Agency (BAPPENAS) on the Utility of the Evaluation “This evaluation highlighted for us that there are many gaps between policies and their implementation. Some major drawbacks were identified, i.e. the incongruity between project schedules, government’s fiscal year and time frames for community planning. Community-managed approaches require longer time frames and timetables cannot be set by outsiders. The study clearly illustrated how sustainability of services depends on planning realistically for operation and maintenance, which includes anticipating possible social conflicts over sharing of water resources. In order to bring out and resolve such issues and to adapt projects better to local conditions, policies must require projects to offer service choices to all groups within communities. Providing adequate information about the choices is also essential, to build community capacities to choose according to their capacity to sustain.” Basah Hernowo, Director for Housing and Human Settlements, National Development Planning Agency (BAPPENAS), Government of Indonesia and Chairman of the WASPOLA WSES Policy Working Group. The evaluation identified social conflict as a major cause of system failure, which in turn highlighted shortcomings in project approaches. The nature of sustainability, with its inter-dependent social, institutional, technical, environmental and financial components was brought into better focus. On a more positive note, this particular study illustrated in practical ways how to achieve policy objectives in practice. The Flores evaluation is the most recent in a series of sector studies undertaken in Indonesia since 1998, when WSP-EAP introduced participatory evaluations in large-scale projects,7 using methodologies that brought the user communities’ voices into policy debates, in a quantifiable and therefore measurable manner.8 Because of its sampling and Box 2. A Perspective of the Funding Agency on the Utility of the Evaluation “From my perspective (and I suppose my comments are somewhat 'tainted' by an engineering focus), the great value in the work done in the Flores evaluation is that a great deal of analysis has been undertaken to differentiate the things that have had impact "on the ground". The study provides detailed evidence that some (seemingly) small issues in project delivery can have significant longer-term impacts. Despite the complexity and depth of the analysis, the messages coming from the study confirm that there are still basic and fundamental lessons that need to be applied in the water and sanitation sector, both from a technical and management perspective. For example, the need for a thorough and 'lateral-thought' analysis of any project-specific rules is a key application for any external support agency. The study also reinforces the need for policies to adopt an integrated and whole-of-life-cycle approach to water and sanitation, and this includes not only the environmental and infrastructure components, but also the institutional and community frameworks.” Carmel Krogh, Technical Advisor, Australian Government Agency for International Development.
7 Includes participatory assessments in projects supported by UNICEF, Asian Development Bank, World Bank, OECF, AusAID, Government of Indonesia, CARE International and several national NGOs. 8 Using the Methodology for Participatory Assessments (MPA).
29
methodological rigor, the Flores study has proved particularly powerful in highlighting several hitherto-little-recognized factors critical for ensuring sustainability of sector investments and for achieving impact on the lives of the poor, with key stakeholders in Indonesia. A number of the key findings and recommendations from the evaluation have been incorporated into the final draft (Draft 4)9 of the Indonesia sector policy document10 and have already begun to be reflected in the designs of new large-scale projects in the pipeline in Indonesia supported by the World Bank, the Asian Development Bank and bilateral donors like KfW/GTZ. Indicators of utilization by policy makers. There has not been a revision of the draft sector policy document since the release of the Flores evaluation report. The workshop for discussion of the detailed revisions to the current draft version was held in May 2003. During that workshop, one half-day session was dedicated to the review of key activities since the issue of the last draft document: the Flores evaluation, a field trial on inter-project cooperation, and trial implementation of the draft policy document with selected local governments. These were all substantial, applied research activities, each raising a set of issues to be checked in the detailed discussions of policy revisions, and the Flores evaluation ranked highly in that setting. As indicated earlier, these reports were quoted in the final draft of the policy document. The following is a practical example of how important it was to have such a forceful and authoritative set of findings as provided by the Flores evaluation: during the review of the statements of general policy, some workshop participants suggested that, in order to reduce the number of policy statements, the specific statements on poverty and the role of women could be amalgamated with a more general statement on the active participation of communities. However, the participants were reminded of the Flores evaluation which clearly identified the need to have gender and social equity issues explicitly addressed, and participants finally agreed to keep those separate and explicit statements in the general policy. Was the Study Cost-Effective? The evaluation cost an estimated $150,000, compared to the project’s cost of $20 million. The Government’s annual expenditure in the water and sanitation sector over the next 5 to 10 years is estimated to be in the range of $150 million to $250 million. Given these very large projected investments in the national water supply strategy, the $150,000
9 Only minor stylistic changes to reconcile the English and Bahasa versions of the draft are expected before the policy is finalized. 10 For example, proposed Strategy 4 (Enable the community’s decision-making in all aspects of WSES development and management) says “Recent studies (the Flores study is cited) confirm that the greater the gender and social equity achieved in community empowerment for operation and management of WSES, the better the services are used and sustained. In addition the more demand-responsive the approach used, the better WSES systems are sustained and effectively used.” Strategy 13 (Apply specific efforts to target the disadvantaged community members, particularly women and the poor, to achieve equity of WSES services) quotes directly from the evaluation, stating “When gender and poverty-sensitive planning and capacity building are integrated through community empowerment, WSES infrastructure services are better sustained and used.”
30
expenditure on the evaluation will have been very cost-effective if the implementation of the evaluation findings could improve program efficiency and sustainability by even a few per cent. The equity impacts could be even greater if the recommendations can correct revealed weaknesses in gender and poverty targeting of water supply and sanitation. References Nilanjana Mukherjee and Christine van Wijk (eds.). 2003. Sustainability Planning and Monitoring: A Guide on the MPA for Community-Driven Development Programs. Water and Sanitation Program / IRC International Water and Sanitation Centre. World Bank: Washington D.C.
Christine van Wijk, Kumala Sari, Nina Shatifan, Ruth Walujan, Ishani Mukherjee and Richard Hopkins. 2002. Flores Revisited. Draft report.
31
5. Broadening the Policy Criteria for Assessing the Viability of Large Dams1
By the early 1990s, the controversy surrounding large dams made many potential borrowers reluctant to approach the World Bank and other development agencies for assistance, even for justified power and irrigation projects. The Operations Evaluation Department of the World Bank conducted a cost-benefit analysis of World Bank financed large dams to clarify the issues involved in deciding on such projects in the future. The evaluation concluded that only about one quarter of earlier projects would have complied with the Bank’s newer and stricter standards, but that measures to mitigate adverse social and environmental impacts would have made about 74 per cent of the projects economically justified under the new standards. External criticism of these estimates encouraged the World Bank, in association with the World Conservation Union (IUCN), to organize a workshop in 1997 on large dams which ultimately led to the creation of the World Commission on Dams. This, in turn, led to the creation of a mechanism for the integration of both social and economic factors in the evaluation of large dams. Within the World Bank, the evaluation encouraged greater attention to resettlement plans, environmental assessments, and safety issues. The evaluation also increased attention to minimizing technical and environmental effects of obsolescence and degradation of existing dams. Thus the OED report proved to be a catalyst for a process which resulted in the broadening of the criteria for the evaluation of proposals for new dams. The OED evaluation cost around $200,000; by comparison, the World Bank alone lent $1.064 billion for new dams in financial year 2000. The Debate on the Role of Large Dams in Development The OED Large Dams Evaluation assessed the economic and social costs and benefits associated with 50 World Bank-financed large dams (OED 1996). Most of the large dam projects reviewed came into being before the Bank adopted operational directives concerning resettlement and environmental assessment. The dams range were approved between 1956 and 1987. Thus, all projects under review were initiated before the Bank’s current set of guidelines on involuntary resettlement, dam safety, indigenous people, and environmental protection came into effect. The purpose of the evaluation was to assess the economic justification of Bank-financed dam projects and to classify them as to whether they had satisfied both old and new policy benchmarks for impact mitigation (Marra 2003). The evaluation’s rationale was stated as follows: The controversy surrounding large dams has made potential borrowers reluctant to approach the World Bank and other development agencies for assistance even for justified projects. Yet, many developing countries are unable to finance on their own the scale of investments required to tap fully the economic and social development potential of their river basins and meet ever pressing demands for additional water, power, and flood control. To draw the appropriate lessons and clarify the issues involved in deciding on such projects in the future, this report initiates a review of the Bank experience with large dams. 1 This case study was prepared by Mita Marra.
32
The evaluation focused primarily on the indirect social costs associated with dams and particularly on relocation plans, compensation schemes related to involuntary resettlement, and environmental damages caused by dams. The intended use of the evaluation was implicitly defined to provide lessons from the experience and clarify the major social and environmental implications of dam projects. However, the evaluation also played an unintended formative role by looking at what kinds of mid-course corrections were required to keep large dams on track. The primary clients of the evaluation were identified as (i) the World Bank Board of Directors, and (ii) borrower countries to better inform their decisions and actions involving dams. Other stakeholders included bilateral agencies, regional banks, private investors, private dam construction and consulting companies and industry organizations, and finally international and local NGOs. The OED Evaluation Methodology The evaluation design consisted of an ex-post, cost-benefit analysis of 50 Bank-financed large dams. The study built on a desk review of project documents and on survey data collected from a number of borrowing countries and dam management agencies in the field. The evaluation took two years to complete, at an estimated cost of about $200,000. The evaluation was largely summative in purpose, that is, concerned with whether dams accomplished their intended development purposes: whether objectives were met; whether alternatives to dams were ensuring better outcomes; and what factors affected dams’ performance.2 The evaluation considered dams’ general impact under the old and new safeguard policies by estimating: •
•
•
•
•
The benefits of large dams in terms of power generation, irrigation, water supply, flood control, and navigation; The distribution of benefits geographically, intergenerationally, and in support of poverty alleviation; The relative environmental impacts of such alternatives as large-scale power generation, small-scale power generation, and alternatives for water management; and; Social and environmental impacts of large dams (including downstream impacts) on health, water quality, fisheries, natural habits, reservoir sedimentation, the degradation of watershed, salinity, water logging, and resettlement.
The evaluation also took into account the key factors affecting large dam projects’ performance:
Size of dam projects relative to demand for electricity and risk management;
2 The evaluation methodology permitted an assessment of projected costs and benefits, but did not encompass an assessment of actual performance of the projects covered.
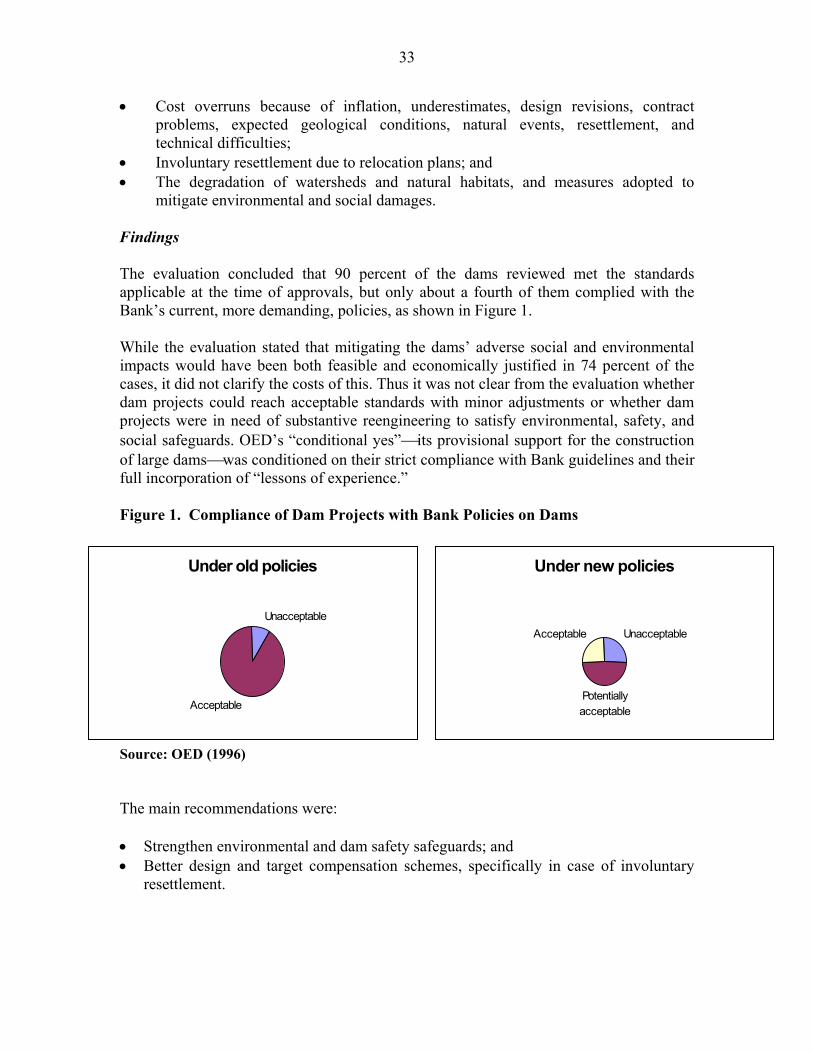
33
Cost overruns because of inflation, underestimates, design revisions, contract problems, expected geological conditions, natural events, resettlement, and technical difficulties;
•
• •
• •
Involuntary resettlement due to relocation plans; and The degradation of watersheds and natural habitats, and measures adopted to mitigate environmental and social damages.
Findings The evaluation concluded that 90 percent of the dams reviewed met the standards applicable at the time of approvals, but only about a fourth of them complied with the Bank’s current, more demanding, policies, as shown in Figure 1. While the evaluation stated that mitigating the dams’ adverse social and environmental impacts would have been both feasible and economically justified in 74 percent of the cases, it did not clarify the costs of this. Thus it was not clear from the evaluation whether dam projects could reach acceptable standards with minor adjustments or whether dam projects were in need of substantive reengineering to satisfy environmental, safety, and social safeguards. OED’s “conditional yes”its provisional support for the construction of large damswas conditioned on their strict compliance with Bank guidelines and their full incorporation of “lessons of experience.” Figure 1. Compliance of Dam Projects with Bank Policies on Dams
Under old policies
Unacceptable
Acceptable
Under new policies
Unacceptable
Potentially acceptable
Acceptable
Source: OED (1996) The main recommendations were:
Strengthen environmental and dam safety safeguards; and Better design and target compensation schemes, specifically in case of involuntary resettlement.

34
Follow-up to the OED Evaluation Conducted as a desk review, stakeholder participation was limited until the study dissemination phase began. The report was an internal Bank document, with the major findings made public in an OED Précis in 1996. But the main report leaked out to the NGO community immediately. The International River Network, an environmental NGO based in California, released a 30-page critique, which it posted on its website. After the principal evaluator presented the report to the Bank’s Board, the Board itself promoted the idea of consulting external stakeholders on the crucial issues concerning dams. (The evaluation gave rise to some controversy between the Board and Bank management, leading to increased pressure on managers to respect environmental and safety standards.) To tackle one of the most controversial “debates in sustainable development,” (IUCN and World Bank, 1997) OED, on behalf of the World Bank, took the initiative in association with the World Conservation Union (IUCN) to organize a workshop on large dams held in Gland, Switzerland, in April 1997. The workshop was not merely meant to disseminate OED’s findings, but to provide an open space for 37 stakeholders from around the world, representing diverse perspectives on large dams, to discuss large dams’ development effectiveness and how to apply lessons learned to future decisions about whether dams should play a major role in land, water, and energy development and how particular dams should be selected, constructed, and operated (IUCN and World Bank 1997). At the Gland workshop, there were five participants from the IUCN, seven from the World Bank, six from government agencies, five from NGOs in developing countries, eight from private dam construction and consulting companies, and industry organizations, and four from academia/research. The workshop served as an open forum to address basic questions about dams. Participants at the Gland workshop agreed to establish, by November 1997, a two-year World Commission on Dams (WCD) that would:
Assess experience with existing, new and proposed large dam projects with an eye to improving existing practices and social and environmental conditions;
•
•
• •
•
•
Develop decision-making criteria and policy and regulatory frameworks for assessing alternatives for energy and water resources development; Evaluate the development effectiveness of large dams; Develop and promote internationally acceptable standards for the planning, assessment, design, construction, operation and monitoring of large dam projects and, when dams are built, ensure affected peoples are better off; Identify the implications for institutional, policy, and financial arrangements so that benefits, costs, and risks are equitably shared at the global, national and local levels; and; Recommend interim modificationswhere necessaryof existing polices and guidelines, and promote “best practices” (IUCN and World Bank 1997).
The Commission was created in 1997 and composed of eight members, led by an internationally recognized chairperson. After a broad-based, two-year research effort, in
35
November 2000 the Commission released its evaluation report entitled “Dams and Development: A New Framework for Decision-Making” (WCD 2000). Assessing the Impact of the OED Evaluation Methodology The approach used to assess the impact of the OED evaluation comprised the author’s participant observation, and a number of semi-structured interviews of Bank decision-makers, managers, and dam experts, whose responses were subject to contents analysis, plus a review of World Bank and other documents (Marra 2003). Eighteen individuals were interviewed, comprising: seven Bank task managers of dams projects; four decision-makers (i.e., Board members and senior Bank managers); four experts on large dams; and three OED staff responsible for the OED evaluation. First, the OED staff who conducted the Large Dams Evaluation were interviewed to explain the intended use of the report and to reconstruct how the evaluation was designed, implemented, and disseminated within and outside the Bank. Second, decision-makers were interviewed to gain insights into how they reacted to evaluation-based information, their pattern of evaluation use for policy making, and their attitudes toward evaluation. Third, program managers were interviewed to understand which evaluation factors were associated with the willingness and experience to use the evaluation for program design and implementation. Finally, experts in the field of dam building and infrastructure were interviewed to gather their comments on the technical aspects of the study. Although all interviews were confidential, background information was collected for all interviewees, including their position and length of time in the organization, prior work experience, education, professional field, and political orientation. The Contribution of the Evaluation Fifteen interviewees recognized that the evaluation focused the attention of major international stakeholders on the issues, and that the Gland workshop, by providing a space for public debate, created the conditions for stakeholders from governments, NGOs, and multilateral and bilateral agencies to begin an international dialogue, building on information from OED’s evaluation.
“…it is useful to have an international public debate so as people from governments, and NGOs, and multilateral and bilateral agencies come together…”
Ten intervieweesinfrastructure managers, engineers, environmental and dam specialists reported that the dam evaluation was the catalyst for the constitution of the World Commission on Dams (WCD). Interviewees were also asked, “What has been the contribution of this OED evaluation to the work of your department/unit/project?” Seven interviewees reported greater attention
36
being paid to resettlement plans, environmental assessments, and safety issues. Especially in the Bank’s Europe and Central Asia region, where most dam safety projects are underway, attention is now concentrated on minimizing the adverse technical and environmental effects produced by obsolescence, and degradation of the dam infrastructure. In the Africa and East Asia & Pacific regions, an ever-increasing demand for hydropower energy calls for choosing whether to apply the Bank’s costly safeguards or let the private sector take over. Five managers interviewed acknowledged that the Bank’s involvement would help ensure better social, technical, and environmental standards but noted that Bank involvement might come at too high a price in terms of finance and damage to the Bank’s reputation. Three interviewees suggested that the OED evaluation increased the climate for assessment and accountability, discouraging lending for new dams. But 7 out of 18 people interviewed attributed the steady decline in lending for dam building instead to senior management’s “risk aversion”one risk being that NGO demonstrations and World Bank Inspection Panel investigations could jeopardize the career of senior managers. Respondents reported greater awareness and pressure from outside stakeholders, especially environmental NGOs, leading to the Bank’s renewed emphasis on safeguards and quality standards, as emerges from the statement below:
“…We cannot say that the OED evaluation has been the cause for reducing lending for dams…but we can say that OED evaluation, promoting the creation of the WCD, has intensified this process of assessment…”
The Bank’s involvement in large dams has been decreasing over the past two decades, and is currently focusing more on financing dam rehabilitation and safety and less on financing new dams (Marra 2003). Between 1970 and 1985, the World Bank completed about 26 dam related projects per year, eight of which involved direct financing of the dam while the rest involved funding associated facilities. With regard to the World Bank’s entire lending portfolio in FY00, about 1.3 percent ($1.5 billion) was for dam-related costs, and about 0.9 percent ($1.064 billion) was for new dams. Some Final Considerations The $200,000 budget for OED’s evaluation was considered sufficient to complete a desk review of 50 dams, coupled with survey data but with very limited field research. Despite some criticisms of the cost-benefit desk analysis undertaken, most program managers interviewed thought the clear, basic arguments for and against large dams spelled out in the report clarified the issues and provided an analytical framework for decision-making. Although three dam experts considered the report to be insufficiently technical, they viewed the study as useful in framing for debate the energy alternatives to dams and their social and environmental impacts. By contrast, the $9 million spent in preparing the WCD evaluation, drawing upon 17 thematic reviews, with findings cross-checked against survey data for 125 dams, eight case studies, two country studies, and 947 submissions from over 80 countries,
37
constituted a major research and consultative effort with far more robust conclusions but at a significant cost. An issue that those considering undertaking evaluations should consider carefully is the relative cost-effectiveness of alternative evaluation approaches and designssuch as the value of desk review vis-à-vis detailed field research. A final issue to consider is the extent and timing of participation and consultation to be undertaken. In the case of OED’s Large Dams evaluation, participation of stakeholders occurred at the end of the evaluation process, when the report was already issued. The evaluation team took the initiative to share information and debate its implications for decision-making. And, interactively, evaluators and decision-makers agreed to embark on a subsequent evaluation effort to address in much greater depth the costs of resettlement and the development impact of dams. OED itself decided to undertake follow-up evaluations into the issue of involuntary resettlement resulting from Bank-financed large dams and other infrastructure projects (OED 1998; 2000). References IUCN–World Conservation Union and The World Bank. 1997. Large Dams: Learning from the Past, Looking at the Future, Workshop Proceedings, Gland, Switzerland, April 11-12, 1997. IUCN: Gland, Switzerland. World Bank: Washington, D.C.
Mita Marra. 2003. Dynamics of Evaluation Use as Organizational Knowledge. The Case of the World Bank. Ph.D. Dissertation, The George Washington University.
Operations Evaluation Department. 1996. World Bank Lending for Large Dams: A Preliminary Review of Impact. OED Précis. World Bank: Washington D.C.
. 1998. Recent Experience With Involuntary Resettlement. Thailand – Pak Mun. World Bank: Washington D.C.
. 2000. Involuntary Resettlement: The Large Dam Experience. OED Précis. World Bank: Washington D.C.
World Commission on Dams. 2000. Dams and Development: A New Framework for Decision-making. EarthScan Publications: London and Sterling, VA.
38
6. The Abolition of the Wheat-Flour Ration Shops in Pakistan1 Since before Independence, the Government of Pakistan had been operating wheat-flour ration shops intended to provide subsidized wheat-flour to low income groups. By the mid 1980s, the system had come under increasing attack because it was inefficient and because most of the cheap flour was not in fact reaching the intended target groups. However, fears of the political backlash from affected groups made policy makers reluctant to eliminate the program. The International Food Policy Research Institute (IFPRI) was contracted to conduct an independent evaluation of the wheat-flour ration shops. The evaluation found that more than 70 per cent of the subsidized wheat never found its way to the ration-shop consumers or subsidized bakeries. The study also found that very few poor consumers benefited from the subsidies, and that alternative measures could be taken to reduce the negative impacts of eliminating the program on the wheat-flour shops and distributors. The rapid, informal communication of the findings before the formal reports were published, and at a time when the issue was being debated at the highest policy levels, provided the political cover required to eliminate the program. While not the only reason for the elimination of the ration shops, the IFPRI study, which cost around $500,000, made a significant contribution to the implementation of policies, producing net annual savings to the Government of at least $40 million. Increasingly, policy researchers need to show how their research influenced policy choices and contributed to achieving the ultimate goals of those policies, such as reductions in poverty or malnutrition. To explore this question and gauge its own impact, the International Food Policy Research Institute (IFPRI) has conducted a number of case studies of how particular research efforts have contributed to policy decisions. This chapter describes one of the case studies on the contribution of IFPRI research to the abolition of the wheat-flour ration shops in Pakistan. The study looked closely at how research information was produced, communicated, and used in the policymaking process leading to the decision. A case study is especially helpful in identifying the multiple socio-political factors that affect the use of research information. It can also help identify critical decision points and decision-makers, and provide lessons about what a research organization can do to increase both the relevance and impact of its research activities.2 It can also help develop additional methodologies and indicators. The real-world nature of a case study prevents an experimental-control-type evaluation; neither a control group nor a genuine counterfactual can be constructed. Nor can the contribution be precisely quantified, given the nature of the policy process. Such quantification is not, however, essential. As in comparative historical and political analyses, a careful examination of the facts surrounding the event can provide an opportunity to see if one can construct a plausible argument that research mattered to the policy decision.
1 This case study was prepared by James Garrett, a research fellow in the Food Consumption and Nutrition Division of IFPRI, and Yassir Islam, formerly a research analyst at IFPRI. 2 In general, we consider research information has an "impact" on policymaking when policymakers use it to inform their policy choices.
39
In selecting a case study, we attempted to identify a policy decision that seemed closely tied to a particular piece of IFPRI research, and it was decided to select IFPRI’s evaluation of the Pakistan subsidized wheat ration shops, which contributed to the elimination of these shops in 1987. The IFPRI team spent three weeks in February and March 1997 in Islamabad, Pakistan, conducting the case study. The Pakistan Institute of Development Economics (PIDE), an institution with which IFPRI had collaborated in the past, provided logistical and administrative support. Although a decade had passed since the flour ration shops were abolished, most key researchers, policymakers, and other actors were available to meet with us. To guide the case study, we placed the assessment of the use of information in the context of the cycle of a research project and the policy process. A research project cycle has essentially five stages: (i) client consultation and research design; (ii) implementation; (iii) communication of results; (iv) policymaking; and (v) impact assessment. To conduct the case study, we asked at each stage who the key actors were, what activities they engaged in, and what factors shaped their decisions and the “policy space” in which they operated, including whom they attempted to influence, who attempted to influence them, and how. We then interviewed these actors, specifically highlighting the decision-making process and the sources and use of information and the role of IFPRI-PIDE research. We also reviewed related documentation when available. The total cost of researchers’ time and travel to carry out the case study was approximately $50,000. IFPRI and the Abolition of the Wheat-flour Ration Shops In 1987, the Government of Pakistan made a decision to abolish the wheat ration-shop system, an institution that in one form or another had existed since before the birth of modern Pakistan. What had started as a food rationing program during World War II in colonial India had degenerated by the 1980s into a system that failed to reach the poor and was, according to one former government bureaucrat, a "monument to institutional corruption". Though few in Pakistan would disagree with this statement, the ration-shop system was not abolished until 1987. Why did it take so long for this monument to be dismantled? Our findings suggest that, while the convergence of specific economic and political factors encouraged this move, IFPRI research on this issue also played a timely role. IFPRI's Research on the Wheat Ration Shops The ration shop system worked like this: the government established a monthly amount of wheat-flour, based on household size, that each household could obtain at a subsidized price from the ration shop. Provincial government food departments provided ration cards to consumers in the areas where they lived. By the mid-1980s, this policy was not strictly followed, and in some regions consumers did not need the cards. The quota was supposed to supply only a portion of the total amount of flour the household needed. As a result,
40
the system became somewhat self-targeting: as incomes increased, families were less likely to purchase flour at the ration shop, apparently relying instead on purchases of open-market flour, which was perceived to be of higher quality, to make up the difference. The cost of the subsidy to the government was large but had been declining. In the early 1970s, the subsidy on wheat-flour cost the government almost 5 billion rupees ($313 million in 1985 dollars). The amount varied over time, reaching a low of about 1.3 billion rupees in the early 1980s and rising again to about 3 billion rupees in the mid-1980s. This represented about 30 percent of the costs of all subsidies and somewhat less than 1 percent of Pakistan’s GDP. Numerous household surveys attempted to estimate the actual rate of utilization by households, and although the numbers vary, the statistics do indicate a decline in usage during the 1970s and 1980s. By 1986, only 5 percent of rural households and 19 percent of urban households bought flour in the ration shops. Urban households used the ration shops much more than rural households, despite the higher incidence of poverty in rural areas, apparently because ration shops were never as prevalent in rural as in urban areas. By the 1980s, with a cushion provided by ample stocks of stored wheat, Pakistan's policymakers were becoming more concerned about widespread corruption of the ration shops and keen to reduce the government's subsidy costs in an atmosphere of deregulation. They concluded that the time was ripe to re-examine the ration-shop system. Under a program funded by USAID, IFPRI was chosen to conduct the review in 1985, partly because of its experience on similar issues in Egypt. Many government bureaucrats also saw IFPRI as an independent, and thus objective, “outsider,” a characteristic that could enhance its credibility and the weight given its findings. Prior to the IFPRI study, Pakistani researchers had found that the ration shops, which involved transactions among a number of agents, provided ample opportunities for corruption. Existing studies, however, analyzed neither the impact of the ration-shop system on the food consumption nor the expenditure patterns of the poor in significant detail. They were also not widely known among policymakers. Using innovative public opinion polls and household surveys, IFPRI, working with researchers from the PIDE, looked more closely at this issue and communicated results directly to key decision-makers. The opinion polls quickly provided some initial data on the availability and use of ration shops and were especially useful in starting a dialogue between researchers and Pakistani policymakers about changes to make in the system. IFPRI-PIDE researchers found that almost 70 percent of the subsidized wheat released by the Pakistan government to millers never found its way to ration-shop consumers or subsidized bakeries. Communication of these research results to policymakers began in 1986. IFPRI’s chief of party, as well as other researchers, formed close links with key policy actors, including a special advisor to the Prime Minister; the USAID project manager; and a highly-placed
41
civil servant, the joint secretary of the Ministry of Food and Agriculture. Researchers met with collaborators to present the findings as they literally came out of their computers. They also presented results in academic conferences. Through these multiple channels of communication, the findings reached most of the key researchers and policymakers in Pakistan well before the final IFPRI report was released in May 1988. A study of impact that looked only at published output, then, would have easily missed the importance of research to policy choice because it would have only seen research completed after a decision had been made. From Research Results to Policy Reform In late 1986, the joint secretary prepared a summary brief on the wheat ration shops for ministerial review, with the prime minister’s special advisor overseeing the process. This brief used IFPRI findings to back up the arguments for abolishing the wheat ration shops. It was presented to the cabinet in February 1987. Pakistan policymakers had numerous concerns about abolishing the ration shops, ranging from fears of public protest to worsening the food and nutrition situation of the poor. The summary paper dealt with these concerns. The cabinet also confronted evidence of detailed corruption and findings that promised government savings from elimination of the system without creating significant harm for either the poor or the ration-shop owners. Consequently, the cabinet announced its decision to abolish the wheat-flour ration shops as of April 15, 1987. As part of its policy package, the government unveiled a number of compensatory measures: It raised wages for low-income government workers, many of whom did use the ration shops. It provided loans to help ration-shop owners, who feared a loss of revenue, to convert to fair price shops. And, to protect general consumers, it agreed to release unlimited quantities of wheat at a fixed price lower than the going market rate. No riots or wheat shortages accompanied the move, as some had predicted. One IFPRI researcher, noting the absence of public reaction, attributed this to the characteristics of the ration-shop system itself and steps taken by the government to minimize adverse public reaction. In essence, the government abolished a corrupt and inefficient program and replaced it with a general subsidy on the open-market price of wheat. Rents and benefits accruing to upstream administrators were thus diverted to a general consumer surplus. This was achieved at the cost of a loss of benefits to those poor households, however few there were, that actually relied on the ration shops. The IFPRI-PIDE researchers suggested that the government target these populations through special programs to provide them with long-term benefits, though the government apparently did not take this advice. Elimination of the subsidies on rationed flour saved the government approximately $200 million each year. The compensatory policies, however, including the general subsidy, transport and wage increase for government employees, cost about $160 million, giving overall budget savings of only about $40 million per year.
42
Elements of Success A number of factors, which previous studies have indicated encourage the use of research information by policymakers, helped ensure the success of this particular research enterprise. Of foremost importance was that the policy environment in Pakistan was conducive to a research program and policy debate on derationing. IFPRI thus found itself in the enviable position of conducting research on a topic for which there was a ready audience for results. Pressured gently by policymakers to reveal findings, and aided by the introduction of computers for data entry and analysis, the IFPRI-PIDE team was able to complete the surveys in about one year, thus responding to and sustaining the momentum of interest in the topic. Dissemination of findings was predicated on close contact between IFPRI researchers and their Pakistani collaborators, and bolstered by the full-time presence of an IFPRI researcher in Islamabad, the capital. Even without a formal communications strategy, the researchers did, as a communications strategist might suggest, increase their impact by conveying their relatively straightforward messages repeatedly over time to a number of key audiences in a variety of ways. The characteristics of those receiving the advice seem to have been as important as those who gave it. Among the collaborators, the project manager, the joint secretary, and the prime minister’s advisor, were all key players in positions to make things happen. Each brought different skills and abilities to advance the discussion and process of policy formulation, based on a common underlying commitment to the research program. With the results made available freely to all interested parties, researchers and policy actors were able to anticipate and respond to concerns raised by others. There were no surprises to come when the cabinet met to make its decision. Furthermore, policymakers paid attention to the IFPRI-PIDE findings because they came from a reputable institution trusted to be objective and do good research. This research confirmed their own experiences and expectations; it indicated a concrete course of action; and it challenged an existing institutional arrangement, all factors known to encourage use of research information by decision-makers. Assessing the Impacts of IFPRI’s Research All these factors converged at a particular moment when the economic and political environment provided a window of opportunity for action. What, though, was the contribution of IFPRI's research to this decision? Without IFPRI's research, would the same decision have been made? Certainly IFPRI research was a key input into the decision and provided a catalyst for action. Without a substantial body of hard evidence to show that the ration shops were indeed wasteful and corrupt, and that they failed to significantly benefit the poor, it seems unlikely that the institution could have been dismantled without supporters of reform, like the prime minister’s advisor, having to use up important amounts of political capital. It seems fairly clear that though policymakers may have drawn from a reservoir of information, anecdotal or otherwise, to mold their
43
opinions of the wheat ration shops, the cold hard numbers provided by the IFPRI-PIDE research provided, in the words of one Pakistani researcher, “the nail in the coffin”. Was the research worth the cost? It is impossible to determine how much of the decision was due to the study findings. But as is often the case in such studies, a precise figure is not necessary to answer the question. IFPRI’s total research program in Pakistan spanned a number of years, and a number of activities, and cost $6 million; the ration-shop study was only one of a number of studies. Although precise figures are not available, total cost of the ration-shop study likely did not exceed $500,000. The benefits of savings on government expenditure would have extended into the future, accumulating budget savings far beyond the initial $200 million (depending on annual ups and downs, as described earlier). As noted, however, the government may have eliminated the ration shops with or without the study. A major “benefit” of the study, then, was in advancing the timing of this decision and subsequent “savings.” Even if we consider only one year of savings, research costing $500,000 arguably produced savings of $200 million, a benefit-cost ratio of 400. A more conservative approach still yields net benefits. The study’s terms of reference did not ask IFPRI to evaluate potential complementary policies, so it is somewhat difficult to contend that their impact should be tied to calculations of costs and benefits of the IFPRI research. Still, one could argue that the changes wrought by the abolition of the ration shops included the compensatory policies. This would reduce net savings to the $40 million mentioned above. Assuming net savings of $40 million against the total $6 million cost of the IFPRI program (and assume that the other research activities had only neutral impacts), the benefit-cost ratio is 6.67. A more reasonable calculation tying more likely actual costs of the study (say, $500,000) to these net savings gives a benefit-cost ratio of 80. The range of these estimates show the difficulty of quantifying returns to investment in research, particularly when it depends on assigning a percentage to “how much” of the decision or outcome to attribute to the research itself. Given the multiple information sources used by a policymaker and the give-and-take of the policy process, this is not easy. Still, in the last example, even if the research “accounted” for only 1/80 of the outcome, the benefit-cost ratio remains positive. These figures demonstrate the enormous leverage policy research can have, and the likelihood of being confident of a positive rate of return to research, even if figures are not precise. A relatively small investment can produce significant social benefits. Of course, if the analysis is “wrong” and the decision is “bad,” negative effects can be equally large. Enhancing the Impact of Research A number of lessons emerge from this case study that could help research institutions increase their impact on policymaking. Starting from the proposition that effective communication of research findings is a prerequisite for impact, some specific lessons include:
44
Incorporate characteristics that increase the usefulness of research to policymakers into the formulation of research questions and the presentation of findings;
•
•
• •
•
Use non-traditional methodologies and context-specific innovations to improve the relevance of research; Target research information to all influential audiences; Build relationships with individuals who are in a position to influence the policy environment; and Make sure researchers possess good communication skills and are as comfortable meeting with the press, opinion leaders, and policymakers as they are with other researchers.
Integrating the lessons learned from this case study into strategies for communication and advocacy can enhance the “usefulness” and “usability” of research information, and ultimately its impact on policymaking.
45
7. Improving the Delivery of Primary Education Services in Uganda Through Public Expenditure Tracking Surveys
In the early 1990s, Uganda, like many other countries, was concerned with the poor performance of public services such as education and health. It was believed that a major cause was the “leakage” of allocated funds which did not reach frontline agencies such as schools and health clinics, but no research instruments were available to assess the importance of these leakages. This case describes the pioneering work of Uganda in the use of Public Expenditure Tracking Surveys (PETS) in the education sector. Comparing budget allocations to actual spending, and examining budget flows through various tiers of government, the PETS estimated that only 13 per cent of the annual capitation (non-salary) grants actually reached the schools. Following the publication of the survey findings, the central Government began publishing the monthly intergovernmental transfers of public funds in the main newspapers, broadcasting information on the radio, and requiring all public schools to post information on the flow of funds for all to see. As a result of these actions, there was a dramatic increase in the flow of funds and it was estimated that between 80 and 90 per cent of the funds began to reach schools. Similar PETS surveys have now been conducted in many countries in Africa, Latin America and Asia in the health and education sectors, often, but not always with equally significant results. Background Despite substantial increases in public spending on education in Uganda since economic recovery started in the late 1980s, official estimates of primary school enrolment remained stagnant. It was widely believed that one of the main reasons for the poor performance was that public funds did not reach the intended schools either because of corruption or because they were used by local authorities for purposes other than education. While this phenomenon was widespread in government provision of education, health and other services in Africa and other developing regions, obtaining detailed information on the disbursement and use of public funds is very difficult. Uganda was the first country to address the issue through a systematic Public Expenditure Tracking Survey (PETS) conducted in 1996. The PETS was a collaborative effort involving the Ugandan government, the World Bank, and two domestic consulting firms (Reinikka and Svensson 2002). The PETS Methodology The PETS compared budget allocations to actual spending, and the timing of budget flows through various tiers of government, including frontline service delivery points, in primary education. Adequate public accounts were not available to report on actual spending, so the surveys of 19 districts (out of 39), 250 government primary schools and 100 health clinics collected a panel dataset on spending (including in-kind transfers) and outputs for 1991–95. Initially, the objective of the PETS was purely diagnostic, to provide a reality check on public spending. Subsequently, it became apparent that a quantitative tool like the PETS can provide useful microeconomic data for analyzing, for example, service provider behavior and incentives in the same fashion as household surveys are used to explore household behavior. The PETS was complemented by a more
46
comprehensive facility-based quantitative service-delivery survey (QSDS), which combined interviews with service providers and a review of provider records with surveys of local governments, umbrella NGOs and private provider associations to assess the quality and quantity of services provided. The findings of the QSDS are not discussed in this paper. Similar PETS and QSDS studies, also not discussed here, were conducted in the health sector. Main Findings Leakage of Funds Allocated to Public Schools The Ugandan school survey provided a stark picture of public funding on the frontlines. On average, only 13 percent of the annual capitation (per student) grant from the central government for non-salary school expenditures reached schools in 1991–95. The remaining 87 per cent disappeared for private gain or was used by district officials for purposes unrelated to education. Most schools received very little, and 73 percent of the schools received less than 5 percent of the allocated funds, while only 10 percent of the schools received more than 50 percent of the intended funds. It was not possible to precisely track teachers’ salaries, but available evidence suggested that in 1993 about 20 percent of funds allocated for teachers salaries went to “ghost workers” who either did not exist or were not working as teachers. The Critical Role of Parents in Funding Education Instead of being stagnant as official statistics indicated, the school survey also showed a 60 percent increase in primary enrollments during the survey period of 1991–95. This was mainly because primary education was mostly funded by parents who, on average, contributed up to 73 percent of total school spending in 1991. Strikingly, parental contributions continued to increase in real terms despite higher public spending. The Impacts of Unequal Access to Information on Public Spending Apart from the high degree of leakage, the PETS also revealed large variations in leakage across schools and over time. In the absence of central government oversight, local government officials and schools bargain over the non-wage expenditures (per-student capitation grant), which the central government disburses to local governments (districts). In principle, a parent-teacher association (PTA) could obtain information on disbursements of the capitation grant but in practice contacting central government is costly. Even if the PTA decides to incur the cost of obtaining the necessary information, exercising their voice is also costly. It would require organizing the parents and teachers, and then lodging a complaint with a higher authority. As a result, the school-level data showed that larger schools appear to receive a larger share of the intended funds (per student). Schools with children of better-off parents also experience a lower degree of leakage, while schools with a higher share of unqualified teachers experience higher leakage. The results suggest that a systematic effort to
47
increase citizens’ ability to monitor and challenge abuses of the system, and inform them about their rights and entitlements, are important aspects in controlling corruption. Impact of the Survey Findings Following publication of the survey findings, the central government initiated a swift effort to remedy the situation. It began publishing the monthly intergovernmental transfers of public funds in the main newspapers, broadcasting information on them on radio, and required primary schools to post information on inflows of funds on public notice boards for all to see. This not only made information available to PTAs, but also signaled to local governments that the center had resumed its oversight function. The central Government has also limited the discretion of local Government, with four-fifths of their funding now provided in the form of highly conditional grants. Local Governments are now required to use the funds in ways determined at the center, and with specific planning, reporting and accounting requirements (Foster and Mijumbi 2002). Initial assessments of these reforms a few years later, through two locally implemented follow-up PETS, show that the flow of funds had improved dramatically, from 13 percent (on average) reaching schools in 1991–95 to about 80 to 90 percent of intended capitation grants reaching schools in 1999 and 2000. The great majority of schools did not receive any of their capitation grant in the earlier period, while by 1999 less than 10 per cent of schools were not receiving any of their grant, and 90 per cent were receiving their full entitlement. This compared to the earlier period when 73 per cent received less than 5 per cent of their non-wage entitlement. However, delays in transfers were still considerable and, depending on whether or not the delayed payments were received the following year, this might increase the total leakage. The Importance of Giving Voice to the Local Community The survey also illustrates the positive impact that collection and dissemination of quantitative data on public services can have as a tool to mobilize “voice.” When individual complaints about services are made or the characterization about services offered are based on isolated experiences, they tend to be brushed aside as anecdotal evidence or at best partial evidence. But when that public feedback is backed by systematic comparative data, it is difficult to ignore and, as the Uganda case shows, it can then provide a spark for public action. The objective of the public information campaign, described above, was to promote transparency and increase public sector accountability by giving citizen access to information needed to understand and examine the workings of the capitation grant program for primary schools. The idea was that, by providing adequate information, schools and citizens would be empowered to monitor and challenge abuses of the system. As a result, the flow of funds improved greatly. The Government of Uganda subsequently decided to undertake PETS surveys annually in each basic service sector, including health, education, water & sanitation, and justice, law & orderthis indicates that the Government views PETS as being highly cost-effective.
48
Costs, Timing and Cost-Effectiveness of the PETS The first PETS in Uganda cost $60,000 for the education sector and $100,000 for the health sector. The costs might be reduced for subsequent surveys once a national capacity has been established. Each survey took five to six months to complete with the field surveys taking 1-2 months. The best estimate of government annual non-salary education expenditures (capitation grants) for primary education in 1999 is around $27.7 million. The PETS surveys estimated the percentage of expenditures reaching schools increased from 13 percent to at least 80 percentan increase of over $18.5 million. Thus the $60,000 cost of the initial PETS survey was highly cost-effective. Use of Public Expenditure Tracking Surveys in Other Countries The problem of low percentages of transfers of public funds reaching the intended front-line education or health agencies, discussed in the Uganda PETS, occurs in many countries in Africa and other developing regions. This fact, combined with the significant impact that the surveys have had on increasing the proportion of funds reaching their intended front-line agency, and the impact that this in turn has on the quality of service delivery, has led to the application of the PETS and QSDS in an increasing number of countries. PETS have already been completed or are underway in Chad, Ghana, Honduras, Peru, Rwanda, Senegal and Tanzania; and QSDS are underway in Chad, Laos, Madagascar, Mozambique, Nigeria, Papua New Guinea, Uganda and Zambia. References Mick Foster and Peter Mijumbi. 2002. How, When and Why Does Poverty Get Budget Priority: Poverty Reduction Strategy and Public Expenditure in Uganda. Overseas Development Institute Working Paper 163. ODI: London. Operations Evaluation Department. 1999. The Role of Civil Society in Assessing Public Sector Performance in Ghana: Proceedings of a Workshop. World Bank: Washington D.C. Ritva Reinikka. 1999. Using Surveys for Public Sector Reform. PREM Note No. 23. World Bank: Washington D.C. and Jakob Svensson. 2001. Assessing Frontline Service Delivery. Development Research Group. World Bank: Washington D.C. Swarnim Wagle and Parmesh Shah. 2003. Uganda: Participatory Approaches in Budgeting and Public Expenditure Management. Social Development Notes No. 74.

49
Environmentally and Socially Sustainable Development Network. World Bank: Washington D.C. World Bank. 2003. Making Services Work for Poor People. 2004 World Development Report. World Bank and Oxford University Press: Washington D.C.
50
8. Enhancing The Performance Of A Major Environmental Project in Bulgaria1
Prior to privatization, KCM,2 a Bulgarian metallurgical and chemical production company, had been responsible for widespread hazardous contamination of large residential and agricultural areas. Following privatization, the Black Sea Trade and Development Bank approved in 2001 a six year loan to finance improved environmental technology and operating methods, and to avoid the risk of the company having to restrict or even terminate operations. The case study describes a “Focused Mid-term Evaluation” that recommended: (a) speedier implementation of the environmental action plan advancing the starting date of production of zinc and chemicals, (b) improved enforcement of safety policies reducing accidents and avoiding fines for non-compliance, and (c) a hedging strategy permitting KCM to compensate for falling metal prices. It is estimated that the implementation of the evaluation recommendations produced at least $135,000, and possibly up to $500,000, of economic benefits, which compares favorably with the estimated cost of the evaluation of around $4,500. The Black Sea Trade and Development Bank (BSTDB) commenced operations in 1999. In order to strengthen projects that are new for the Bank, the Post Evaluation Department developed a methodology for Focused Mid-Term Evaluations (FMTE). The methodology is designed to have a high benefit-cost ratio through identifying a limited number of potential problems which could be corrected or where impact could be enhanced. This case study illustrates how the FMTE methodology was applied in 2002 to detect and address potential problems regarding a major environmental project in Bulgaria. Background: the KCM Environmental Improvement Project Prior to its privatization, KCM operations had been responsible for widespread hazardous contamination of large residential and agricultural areas. In 2001 the BSTDB approved a six year US$9.2 million loan to KCM to finance some components of a large-scale environmental project in Bulgaria.3 The project applies BSTDB’s environmental policy by promoting the introduction of improved environmental technology and operating methods. The project is also intended to avoid the situation where it would have become necessary to restrict or even terminate operations, thus placing at risk 1540 jobs in an economically depressed area and 1.31% of Bulgaria’s annual exports.4
1 This case study was prepared by Todor Dimitrov, Manager, Post Evaluation Department, Black Sea Trade and Development Bank. 2 Kombinat za Czvetni Metali S.A. 3 These components include the installation of: (i) a central waste water treatment plant to reduce the discharge of heavy metals and other harmful effluent to nearby rivers which are used for irrigation; (ii) a closed-water-circle technology to reduce industrial wastewater discharge from 300 to 4 m3/h; (iii) expansion of the zinc cake filtering department, including new ventilation to reduce by 80% harmful dust and acid emissions that cause serious respiratory and other health damages; and (iv) modernization of the zinc tank house including better air ventilation. 4 All data relate to 2002, except the total export figure which relates to 2001.
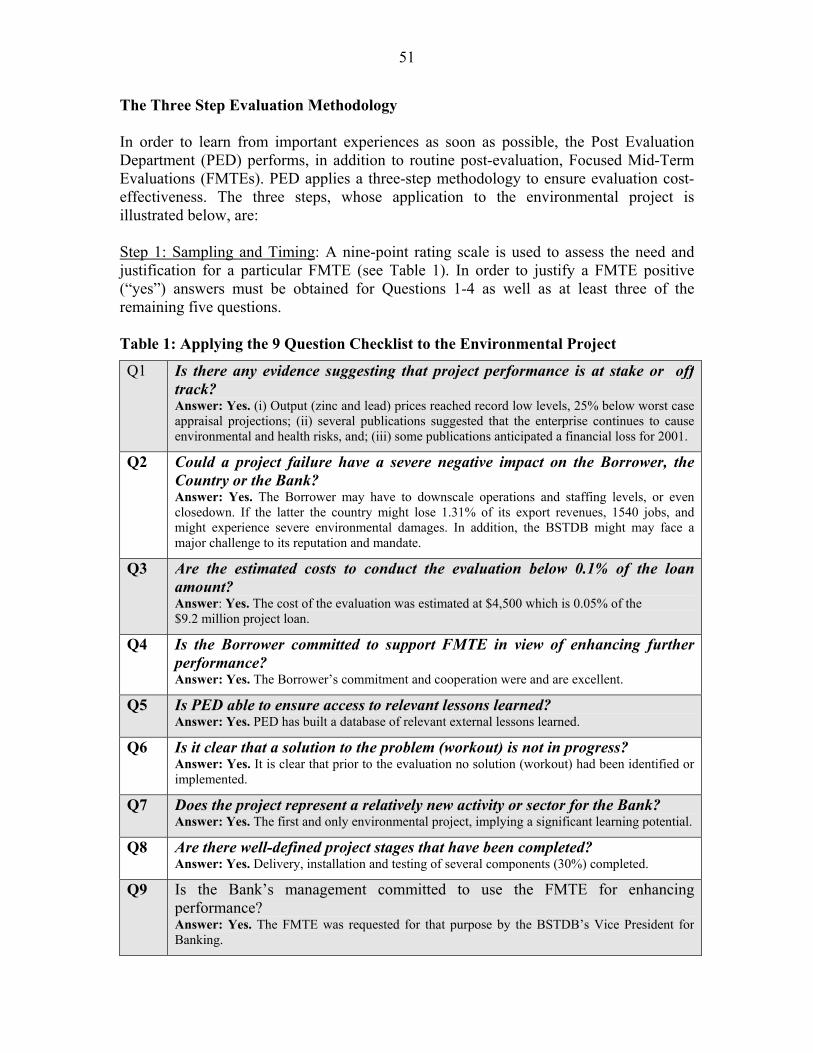
51
The Three Step Evaluation Methodology In order to learn from important experiences as soon as possible, the Post Evaluation Department (PED) performs, in addition to routine post-evaluation, Focused Mid-Term Evaluations (FMTEs). PED applies a three-step methodology to ensure evaluation cost-effectiveness. The three steps, whose application to the environmental project is illustrated below, are: Step 1: Sampling and Timing: A nine-point rating scale is used to assess the need and justification for a particular FMTE (see Table 1). In order to justify a FMTE positive (“yes”) answers must be obtained for Questions 1-4 as well as at least three of the remaining five questions. Table 1: Applying the 9 Question Checklist to the Environmental Project
Q1 Is there any evidence suggesting that project performance is at stake or off track? Answer: Yes. (i) Output (zinc and lead) prices reached record low levels, 25% below worst case appraisal projections; (ii) several publications suggested that the enterprise continues to cause environmental and health risks, and; (iii) some publications anticipated a financial loss for 2001.
Q2 Could a project failure have a severe negative impact on the Borrower, the Country or the Bank? Answer: Yes. The Borrower may have to downscale operations and staffing levels, or even closedown. If the latter the country might lose 1.31% of its export revenues, 1540 jobs, and might experience severe environmental damages. In addition, the BSTDB might may face a major challenge to its reputation and mandate.
Q3 Are the estimated costs to conduct the evaluation below 0.1% of the loan amount? Answer: Yes. The cost of the evaluation was estimated at $4,500 which is 0.05% of the $9.2 million project loan.
Q4 Is the Borrower committed to support FMTE in view of enhancing further performance? Answer: Yes. The Borrower’s commitment and cooperation were and are excellent.
Q5 Is PED able to ensure access to relevant lessons learned? Answer: Yes. PED has built a database of relevant external lessons learned.
Q6 Is it clear that a solution to the problem (workout) is not in progress? Answer: Yes. It is clear that prior to the evaluation no solution (workout) had been identified or implemented.
Q7 Does the project represent a relatively new activity or sector for the Bank? Answer: Yes. The first and only environmental project, implying a significant learning potential.
Q8 Are there well-defined project stages that have been completed? Answer: Yes. Delivery, installation and testing of several components (30%) completed.
Q9 Is the Bank’s management committed to use the FMTE for enhancing performance? Answer: Yes. The FMTE was requested for that purpose by the BSTDB’s Vice President for Banking.
52
Step 2: Focus: A brief desk review explores some of the initial screening questions in more depth to: define the type of risks and to identify the indicators that may confirm or reject these risks (Question 1); determine the Borrower’s commitment and whether lessons can be learned which can be applied to other projects (Questions 3 and 4); and determine the policy implicationsproject-specific or wider (Questions 7 to 9). Step 3: Evaluation: An FMTE is only conducted if the expected benefits from the evaluation are at least twice its expected cost. To ensure a high benefit-cost ratio, evaluations focus on potential problems which can be mitigated, or areas in which impacts can be enhanced. If initial analysis shows the potential problems to be less serious, or more intractable than initially assumed, the FMTE is immediately terminated. If, however, the concerns are confirmed, a rapid evaluation is conducted using interviews, focus groups and direct observation. Key assumptions are verified by triangulation: cross-checking essential information and evidence from at least three independent sources, such as borrower, industry or peer data, market analysts, and local community (NGOs, workers, press). Once the evaluation has been completed, attribution analysis is used to assess its impacts through the construction of counterfactuals and by comparing actual data with appraisal projections. Application of the FMTE Methodology to the Environmental Project
The FMTE process and findings, obtained through the three steps described above, are summarized as follows: Step 1: SamplingWhy FMTE for This Project?
Given the positive response to all nine checklist questions (Table 1), PED concluded that there was a clear justification for an FMTE for the following reasons:
• If financial, management or other developments (Answer 1) cause a failure to implement the environmental project in a timely manner, there might be serious social and economic losses (Answer 2) including down-scaling or closing the enterprise, loss of 1.31% of national export revenue and up to 1540 jobs as well as severe environmental damage; and
• On the positive side, Answers 4 to 9 suggest a good potential for cost-effectiveness and impact with strong management support for the implementation of the recommendations.
Step 2: Focus
Through a further desk study (including collection of data from project files, NGOs, press, official statistics, etc.), it was confirmed that without the implementation of the evaluation recommendations, the risks outlined under (i) above were very likely to occur. It was therefore decided that the FMTE should focus on (a) environmental impacts, progress and prospects in implementing the environmental project, and (b) mitigating the negative effects of zinc and lead price developments on the project’s effectiveness and sustainability.
53
Step 3: The Evaluation
The methods used included a desk review and a two-day field visit to the borrower’s site and a neighboring community. The evaluation took two months to complete. Through the field visit, the evaluation conducted:
• two focus groups, guided by open-ended questionnaires: one with the borrower’s management and one with representatives of the local community;
• three semi-structured interviews with the borrower’s managers and staff and a key project contractor; and
• three site verifications on compliance with randomly selected components of the project, the environmental action plan (EAP), and the use and availability of new equipment and technology. Unobtrusive observations of safety measures such as smoking restrictions, use of helmets, and monitoring of toxic gases and substances were also conducted.5
To ensure independence and avoid any concern that the FMTE was conducted to justify a pre-decided action, such as continuation of a sensitive project, the following procedures were used:
•
•
•
Clear articulation of the project risks, stakeholders’ commitment and external lessons learnedidentified upon the FMTE outset through Answers 1, 4, 5 and 9;
Triangulation, i.e. obtaining and comparing sensitive data from at least three independent sources, e.g. BSTDB, Borrower, contractor, press, NGO or local community, external auditors, on-site observation and verification. For example, data on measures to prevent the use of waste water being used for irrigation or any other inappropriate purpose (as part of the EAP) were obtained from the borrower, local farmers, and from on-site observation of the installed “Danger” sign-posts. Comparing these data, the evaluation concluded that while potentially harmful use of waste-water has been considerably reduced, further efforts (concrete sealing of the waste water canal) were needed to achieve full compliance with the EAP, as the hazardous waste waters are easily accessible by animals and humans; and
Observing the ECG6 good practice standards, ensuring independence from operations. For example, the PED is obliged to report to the BSTDB President any subtle pressure on the evaluation process that might compromise its objectiveness.
5 With unobtrusive observation, the evaluator observes staff without asking questions or explaining the purpose of the evaluation. In the KCM case, the evaluator used the pretext of checking on the installation of environmental equipment to visit without prior notice many different locations of the industrial site. He dressed exactly as other workers, and unobtrusively took note of compliance with some of the safety requirements, e.g. use of helmets and other protective gear, smoking restrictions, etc. 6 Evaluation Cooperation Group of the Multilateral Development Banks, a source of good practice standards and harmonization in evaluation.
54
FMTE Findings, Recommendations and Impact Assessing the Contribution of the FMTE to Improved Project Performance In order to assess the extent to which the positive impacts could be attributed to the evaluation, and not to other concurrent factors, the PED conducted simulation and extrapolation of cause-effect trends on the basis of with-and-without FMTE scenarios. The “without” scenario was estimated on the basis of assumptions about: (i) the critical mass of information that would have had to reach the Bank in order for it to have independently decided to implement measures which were recommended in the evaluation; (ii) how long it would have taken to reach these decisions and (iii) the likelihood that these decisions would have been taken.7 The simulation estimates have been tested and confirmed through rigorous comparisons of data and projections from three key sources (i) project files and management; (ii) borrower’s financial department (independent from operations); and (iii) estimates and projections on EAP and project timing and impact for each component, done by the borrower’s engineering and environmental teams, independently verified by the Bank’s environmental unit. For example, PED estimated that, given KCM’s misunderstanding of the hedging covenant and their focus on hedging and cost-saving issues, it is possible that KCM would not have recognized and addressed these off-track signals until the second quarter of 2003, if not later. By that time, the negative developments would have been sufficient to require a monitoring review and eventual project enhancement. Moreover, it is quite possible that these measures may have only partially addressed the issues, and at a much higher cost (due to late timing). A follow-up stakeholder survey with KCM and BSTDB (summarized in Box 1) confirmed that both organizations found the evaluation to have been useful. Both agreed with it, and implemented the main recommendations. They also agreed with the estimated benefits resulting from the evaluation. Evaluation Findings, Recommendations and Impacts8 It is noteworthy that, while the impacts described below have been triggered by the FMTE, they could not have been achieved without the strong commitment of the BSTDB and the Borrower. Three sets of findings are presented below: Finding 1: Due to the borrower’s concern with mitigating the effects of falling commodity prices, the implementation of the EAP had not been given sufficient priority and progress was vaguely reported. In the effort to mitigate the price effects, the Borrower breached a hedging covenant. 7 The extrapolations took into account the following: (a) the continuous low levels of price and revenue throughout 2002 and 2003 (confirmed by independent market analysts); (b) likely delays in implementing, and reporting on the EAP due to preoccupation with cash-flow mitigation and cost saving; and (c) the implications of the continued and cumulative breach of the hedging covenant, exceeding the allowed ceiling by a factor of four, which arose because the borrower did not understand the legal requirements. 8 Some of the checklist components were ambiguous in terms of attribution, and therefore are not presented here.
55
Recommendation: (i) Enhance the EAP implementation and reporting, and (ii) adjust the covenant in line with industry hedging norms. Impact: The timely adjustment of the hedging covenant helped mitigate price volatility risks by ensuring a hedging resource three times greater than the one previously available. This allowed the implementation of the EAP to be advanced by at least three months, reducing the environmental hazards by 25% overall and in some areas by 80%, and preventing likely implementation delays of three to twelve months. It could be argued that if the project was forced to close, the environmental hazards would have ceased, so that the above mentioned environmental improvements should not be considered as a benefit (compared to the counterfactual). However, without the evaluation, the environmental hazards would have been bigger and would have lasted longer because the project would have continueddownscaling or closure (effectively terminating the source of pollution) would have happened only after a further contamination and health loss. Box 1: Client Feedback on the Utility and Accuracy of the Evaluation Both KCM and the Black Sea Trade and Development Bank (BSTDB) were consulted on the utility of the evaluation and on its estimated benefits to the project. Most of the responses were given by e-mail with follow-up discussions where necessary. The KCM Project Team and Management prepared a consolidated response to the survey indicating that they were generally in agreement with the contents of the evaluation and that they had found the conclusions useful for: improvement of the project; timely provision of information to the Bank; and for the reformulation of the financial covenant for commodity hedging. They also agreed with the estimate that the evaluation had produced at least $135,000 in benefits as a result of earlier utilization of the capacity for production of zinc and H2S04. They found the recommendations concerning hedging to have been particularly useful. Finally, KCM appreciated the fact that the evaluation only required about 1-2 days of management time for discussion and correspondence. The BSTDB Project Team Leader and the Vice President for Banking also prepared a consolidated response. They found the evaluation very comprehensive and in-depth and found it useful because it helped them “keep an eye on the project in addition to monitoring which may sometimes be subjective and is based mainly on information provided by the client.” The recommendations concerning hedging and breach of covenants were considered particularly useful as the KCM project “has been even now in breach of covenants.” BSTDB also agreed was the estimate that the evaluation produced at least $135,000 in benefits. Source: Follow-up stakeholder survey conducted by the BSTDB Post Evaluation Department, May 2003.
Assuming that all of the observed benefits and impacts could be attributed directly, and exclusively, to the evaluation, the economic benefit of the evaluation, including an enhancement of the project’s sustainability, could be estimated in the range of $542,000 to $1,084,000 depending on the assumptions made about market prices. Two examples are given to illustrate how the impact was estimated. First, a key project component, the
56
air filtering system was originally expected to be operational by January 2003, but implementation was speeded-up due to the FMTE and the facility commenced operations in October 2002. The direct effects of making the filtering facility operational three months ahead of schedule were: a zinc output gain of 1,000 tons translating into a maximum revenue and export gain of $800,000. To obtain a more conservative estimate which assumes less favorable market pricesinvolving a reduction in sales by 50 per centgives a lower-range impact of $400,000. Second, resolving a covenant issue without the FMTE, could have taken an additional ten months. In turn, the implementation of several EAP components would have experienced a similar delay. For example, accelerating the introduction of a new technology for producing H2SO4, enabled the borrower to produce 12,500 tons more H2SO4 (without harming the environment), and this has a monetary value of $222,000. A lower range estimate is produced by reducing this by 50 per cent. In addition, the air filtering work, combined with other EAP measures, allowed the borrower to reduce the cost of environmental non-compliance penalties for harmful air emissions from $73,000 in 2002 to $44,000, and to reduce the cases of industrial sickness (basically the toxic effects of heavy metals resulting in long-term health damage) from 1-5 cases per year to zero at the end of 2002. Finding 2: Weak enforcement of new safety procedures. Recommendation: Enhance or speed up implementation of various measures already underway, such as financial incentives. Impact: Recommendations helped achieve a reduction in the number of accidents at work from 30 accidents in 2001 to 22 in 2002. While it is difficult to assign a monetary value to such benefits, an indicative estimate of $100,000 has been calculated taking into account factors such as average days of absence per accident (21), production interruption costs, the salary costs for the time of absence, the loss of staff income and social costs (average hospitalization cost per accident). The “without-FMTE” scenario has a likely delay of at least four months in addressing these measures (due to apparent project “off-track” developments). Consequently it was assumed that one third of the reduction ($33,000) could be attributed to the FMTE, with a low-case estimate of $16,500. Costs, Timing and Cost-Effectiveness of the FMTE The evaluation was conducted as early as possible (one year after project inception) and took two months to complete. The FMTE cost was estimated at $4,500well below the benchmark of $9,200, with the following breakdown: 75% PED staff time, 10% site visit, 10% data collection and processing, and 5% other costs. The evaluation did not require external evaluators’ costs. The borrower’s effort was kept minimaltwo person-days. The low cost and early timing, along with the sampling methodology, ensured a good cost-effectiveness, i.e. a prompt and efficient mitigation of apparent risks in a strategically important project.
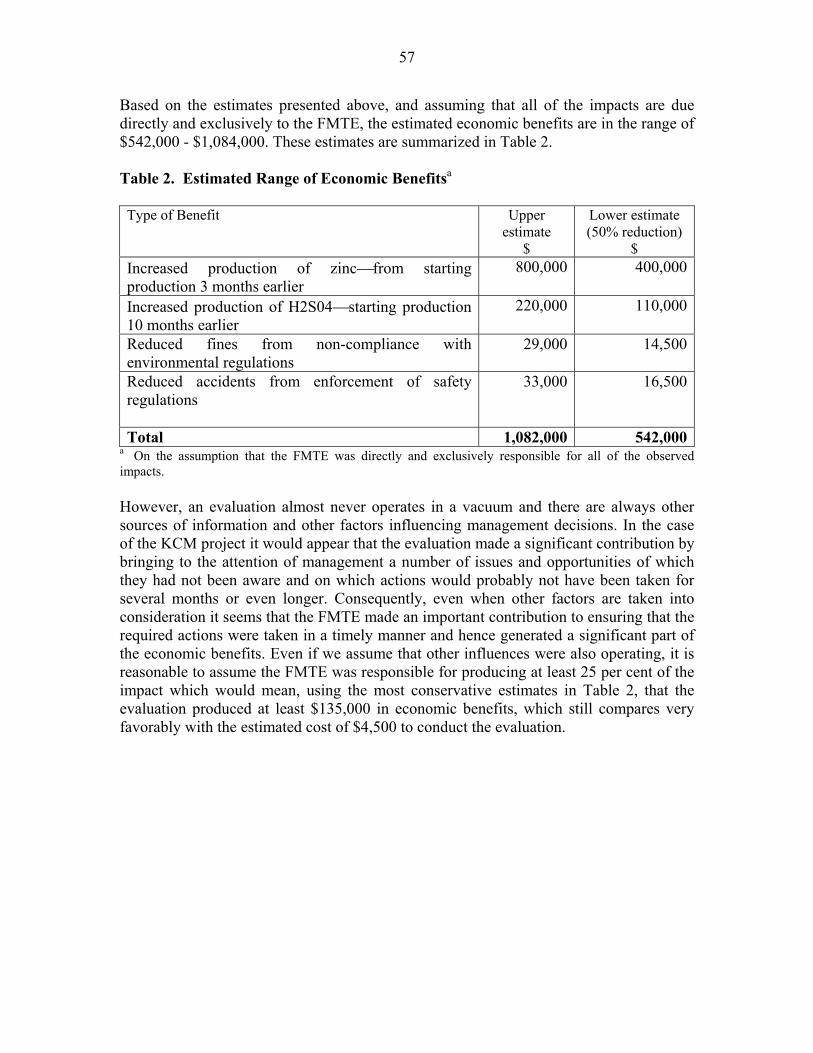
57
Based on the estimates presented above, and assuming that all of the impacts are due directly and exclusively to the FMTE, the estimated economic benefits are in the range of $542,000 - $1,084,000. These estimates are summarized in Table 2. Table 2. Estimated Range of Economic Benefitsa Type of Benefit Upper
estimate $
Lower estimate (50% reduction)
$ Increased production of zincfrom starting production 3 months earlier
800,000 400,000
Increased production of H2S04starting production 10 months earlier
220,000 110,000
Reduced fines from non-compliance with environmental regulations
29,000 14,500
Reduced accidents from enforcement of safety regulations
33,000 16,500
Total 1,082,000 542,000a On the assumption that the FMTE was directly and exclusively responsible for all of the observed impacts. However, an evaluation almost never operates in a vacuum and there are always other sources of information and other factors influencing management decisions. In the case of the KCM project it would appear that the evaluation made a significant contribution by bringing to the attention of management a number of issues and opportunities of which they had not been aware and on which actions would probably not have been taken for several months or even longer. Consequently, even when other factors are taken into consideration it seems that the FMTE made an important contribution to ensuring that the required actions were taken in a timely manner and hence generated a significant part of the economic benefits. Even if we assume that other influences were also operating, it is reasonable to assume the FMTE was responsible for producing at least 25 per cent of the impact which would mean, using the most conservative estimates in Table 2, that the evaluation produced at least $135,000 in economic benefits, which still compares very favorably with the estimated cost of $4,500 to conduct the evaluation.
58
9. Helping Reassess China’s National Forest Policy1 In 1998, OED initiated a review of the World Bank’s 1991 Forest Strategy, in order to assess its impact on World Bank lending and whether the strategy remained relevant. The 1991 Strategy had pursued a green agenda, by restricting the Bank from supporting production activities which entailed the logging of tropical moist forests. It had also promoted a participatory, consultative approach to forest sector activities. OED’s evaluation included six country studies, including the China Study “From Afforestation to Poverty Reduction and National Forest Management”. China was one of the few countries in which Bank forestry activities had expanded during the 1990s. However, in response to major flooding and drought, the government had instituted a logging ban in 1998 which had potentially serious impacts on the economy of the forest sector without being proved effective in combating floods. OED’s China Study contributed to the creation of the high-level China Forestry Task Force, and the study also encouraged the Task Force to rethink China’s forestry policies. Thus, OED’s expenditure of $80,000 on the China Study had an impact on the reformulation of China’s forest sector policies, which involve billions of dollars of government investment. Background The World Bank’s 1991 Forest Strategy restricted Bank support for the logging of tropical moist forests. It also promoted a participatory approach to forest sector activities. In 1998, OED commenced an evaluation of the Bank’s Forest Strategy. Its objective was to assess the impact on Bank lending in the sector and on forest management and conservation practices in member countries. The OED evaluation (OED 2000a) included six country case studies, and one of these was on China. The case studies were designed to provide in-depth understanding of the sector in each country. The 1991 Forest Strategy did not result in a decline of Bank projects in China because the country had few tropical moist forests. Indeed, the Bank’s portfolio of forest sector investments in China has grown over the past decade, reaching a total value of $1 billion value, and China became the Bank’s largest client in the sector. Even so, Bank investment has provided only a minor portion of the country’s overall forest program. In 1998, a logging ban was instituted in response to two natural disasters: the drying up of the Yellow River in 1997, and the devastating floods from the Yangtse River in 1998. China Study A team of Bank consultants, including a senior and well-known Chinese researcher and an external counterpart, undertook desk and field work for the China Study. Sixty non-forest projects from the agriculture, transportation and other sectors were examined in addition to the Bank’s portfolio in forestry. The effectiveness of the Bank’s role in China was examined, as well as the impact it may have had on overall forest outcomes in the country.
1 This case study was prepared by Elaine Wee-Ling Ooi, OED consultant. This note is a shorter version of a paper providing more detailed documentation on the China Study evaluation and its impact.
59
Study Findings OED’s China Study (OED 2000b) concluded that:
Overall, the Bank’s forest portfolio in China had been successfulindeed, very successful if compared to Bank performance in other countries;
•
•
•
•
•
The Bank’s portfolio had been strong in developing technical and management institutional capabilities in the sector but less successful in policy analysis and dialogue; Bank support had focused more on production aspects of forestry, and less so on the regulatory framework in the sector; The efficiency of China’s afforestation programs had considerably improved, with concomitant benefits in soil and water conservation, and in carbon sequestration. In general the projects had contributed to poverty alleviation; and The report questioned the logging ban and its severe economic consequences for the poor. It noted Chinese estimates that the government expected to have to spend $22 billion over 13 years to redeploy nearly 1.2 million jobs expected to be lost directly, and another 1.2 million jobs lost indirectly as a result of the ban.
A difficulty encountered in conducting the China Study was a lack of socio-economic data concerning forest-dependent households across the country. This made it difficult to make judgments about the benefits of specific forest programs and innovations. Thus the Study recommended improvements in systematic monitoring and evaluation of the outcomes and impacts of forest programsthose of both the Bank and also the government’s own-funded forest programs. The OED evaluation also demonstrated the considerable environmental and poverty alleviation benefits that can be derived from agricultural and off-farm employment activities, outside of the forest sector. A more integrated approach to sector analytical work was therefore recommended, including a greater focus on agricultural land use changes and the impact of forest policies on farming households. Study Dissemination Dissemination of the China Study encompassed a very broad audience. Relevant Bank staff were targeted, as were in-country decision makers and government officials. The report was translated into Chinese and presented at a multi-stakeholder workshop held in Beijing in November 1999, and interested academic and policy research groups were invited. Thirty-five participants attended from the State Forestry Administration, State Development and Planning Commission, Ministry of Finance, State Environmental Protection Agency, Chinese Academy of Social Sciences, provincial project management offices, the private sector, World Wildlife Fund/China, and the World Bank. The inclusive nature of the workshop enabled the participation of stakeholders with broad and divergent views, including those from other sectors. The China Study findings found broad support at the workshop. However, some of the analysispertaining to the impact of forest sector activities on the poor and on farming
60
communitieswas challenged on the grounds of insufficient data. The complexity of conservation activities was acknowledged by participants, as was the need to consider socio-economic impacts on other sectors, and there was broad agreement on the need for better monitoring and evaluation of the impact on the poor and on biodiversity. Subsequent Developments in China OED’s China Study was completed at a timely juncture, when Chinese attention to environmental and conservation issues was at an all-time high. At the same time, the World Bank was proposing the creation of a high-level working group on forestry, to investigate socio-economic issues relating to the sector. By mid-2000, the Taskforce on Forests and Grasslands (TFG) was set up under the aegis of the China Council for International Cooperation for Environment and Development (CCICED). Chaired by the Chinese Vice Premier, and comprised of Ministers, Vice Ministers, experts and heads of international organizations, the Council is a highly influential body. The Taskforce was mandated to assess the environmental and social impacts of government programs which prohibited logging and which required the conversion of farmlands to grasslands and forests. OED’s task manager of its evaluation of the World Bank’s forest strategy (and of the China Study) was appointed co-chair of the Taskforce. The Taskforce involved the participation of a Chinese policy institute in Beijing as the Taskforce’s secretariat, and a number of researchers from the affected provinces were involved in data collection and analysisthis substantive Chinese involvement increased considerably the national ownership of the Taskforce’s work. In support of this work, a number of international experts were brought to China to exchange the experience of their countries in improved forestry management. This learning emphasis on good and bad experience in other countries also helped to increase the receptivity of Chinese stakeholders to the findings and recommendations of the Taskforce. The TFG: •
•
•
•
•
Conducted 1400 household surveys in 10 provinces, to elicit grassroots perspectives on the impact of forest programs and policies; Documented in a convincing and comprehensive manner the many complex issues affecting the effectiveness of the government’s forest programs; Assessed, through the use of in-depth empirical work, the impacts of major government initiatives in forest conservation and demonstrated some unintended negative impacts;2 Recommended that the government’s top-down approach to forest planning and management be replaced by more participatory and flexible approaches; Recommended replacement of the complete logging ban with pro-active forest land-use planning, to achieve sustainable forest management; and
2 Significant environmental benefits had been achieved, but both programs had unintended adverse impacts. The logging ban had the objective of restricting logging of mostly natural forests in selected regions but, in practice, many provinces had unilaterally extended the ban to include collective forests and timber plantations. Compensation for not being able to harvest their forests, however, was available only to families of state enterprises, thus excluding ordinary farm communities. These and other measures resulted in substantial economic deprivation for many farmers.
61
Advocated a strategic approach to M&E in the forest sector, including the development of independent policy analysis and research capacities (CCICED Task Force on Forests and Grasslands 2001).
•
•
•
•
•
•
In response, the government is now revising its forest policy and programs in areas such as forest management and land ownership/use. Collectively, these initiatives constitute a substantive change to the application of the logging ban. The TFG has been assessedvia an evaluation of its performance (CCICED Task Force on Forests and Grasslands 2002)as having had a number of impacts, including:
Helped to legitimize rigorous policy research and analysis within the government’s forest administration organization. As a result, household surveys became an accepted monitoring and analytical tool, and a state forest research center was created. Further research is being conducted on how to extend government compensation schemes to households outside the state-owned enterprises; and Made a substantive input to the development of a new forest strategy. While the TFG’s recommendation to lift the logging ban has not been realized, logging restrictions on timber plantations have been relaxed.
Influence of OED’s China Study A consultant was engaged to conduct a detailed document review, and to interview key stakeholders for the China Study and for the subsequent work of the TFG. Interviews, both structured and open-ended, were conducted via face to face, email and telephone. Key respondents fell into four groups: (a) two task managers and two consultants who prepared the China Study and the evaluation of the TFG; (b) six World Bank operational staff; (c) four representatives of bilateral and international organizations engaged in China’s forestry sector; and (d) two senior Chinese counterparts engaged in forest policy analysis and research. Respondents were asked their opinions on the value and usefulness of the China Study, and the extent to which they felt it may have impacted or influenced the forest sector in China, particularly in the area of policy analysis. The China Study was found to have contributed to subsequent developments in China through:
Helping legitimize debate among senior officials, researchers and others on forest policy and the government’s recently imposed logging ban; Engendering broad agreement by the Chinese on the need for improved M&E, and also the need for in-depth research and policy analysis of the impact of forest sector projects on the poor and on biodiversity; and Fostering participation by the Chinese research community and beneficiary farmers in forest programs, and fostering collaboration among key Chinese stakeholders who had previously not interacted.
A sample of statements from key respondents is presented in Box 1.
62
Box 1. Influence of the China Study on the Taskforce on Forests and Grasslands (TFG)
“...The Study was an important precursor to the quick implementation of the Task Force which had several innovative features. They seemed largely attributable to the .....Study. Specifically it enabled Task Force members to see how beneficial it would be to use the case study approach in order to collect detailed and convincing data for presentation to government (this had rarely been done so effectively before by CCICED Working Groups); and to look at the broad socioeconomic impact of the logging ban and not just the immediate and short term environmental benefits which had motivated the government.” A principal (international) member of the CCICED. “ ...The report played a critical role by setting important precedents in methodology and message. It, in many ways, was the platform that the Task Force stood on to make the dramatic progress that it did. It created an appetite for more independent and critical analysis in the forestry sector and set the important precedent of using Chinese experts outside of the State Forest Administration to conduct the review.” A lead CCICED Task Force (international) collaborator. “...The Study contributed to the Chinese forest sector using more rigorous and methodologically sound evidence-based data collection and research, and there has been increasing demand for quantitative studies from officials and researchers from the forest academic community... I do think the OED Study had influenced both directly and indirectly the Government’s decision to examine the impact of the (Government’s logging and grasslands policies), but it is only one of many factors leading to this.” A leading Chinese official.
There appear to have been several aspects of the China Study evaluation which helped it be influential:
Timeliness of the Study; • •
•
•
Acknowledged high quality of the Study, managed by a credible and persuasive evaluator; High level of stakeholder consultation while the Study was being conducted, and high level of stakeholder participation in workshops to disseminate the Study’s findings. These efforts helped build a constituency for reform. They also deepened the connectivity between academia/research groups in China and high-level decision-makers; and Advocated and helped establish a good-practice evaluative modus operandi for such Chinese research in the future: including stakeholder participation; advocacy of data-driven (including surveys) approach to policy and program analysis; concern with economic and social issues extending beyond the sector; a balanced presentation of the conclusions and recommendations.
63
Some Final Considerations The very substantial scale of the forestry sector in China, and the nature of the difficult environmental challenges, mean that policy change comes slowly, after considerable deliberation. OED’s China Study cost about $80,000 and came at an opportune time. It added to the momentum for a re-examination of China’s forest strategy, and in particular via its advocacy for a more evidence-based approach to policy analysis. This momentum led to the creation by the Chinese government of a high-level taskforce, which in turn undertook a major research effort designed to better inform policy choicesthis subsequent evaluative work cost about $1.02 million. Government policy has already changed in some important respects. This case study illustrates the complex ways in which evaluations can influence policy. Policy may be determined only after long debates, consideration of a wide array of data and research, and after protracted political negotiations. In particular, if the policy has far-reaching economic, social and environmental implications, its revision may be likely to entail several steps because of the imperative for careful consideration of the advantages and disadvantages of alternative courses of action. References CCICED Task Force on Forests and Grasslands. 2001. Lessons and Policy Recommendations Implementing the Natural Forest Protection Program and the Sloping Land Conversion Program. CCICED: Beijing.
. Evaluation Report of China Council for International Cooperation on Environment and Development (CCICED) Western China Forests and Grasslands Task Force 2000-2002. CCICED: Beijing.
Operations Evaluation Department. 2000a. The World Bank Forest StrategyStriking the Right Balance. World Bank: Washington D.C.
. 2000b. China: From Afforestation to Poverty Alleviation and Natural Forest Management. World Bank: Washington D.C.
64
10. Designing Influential Evaluations: Lessons Learned
During the preparation of this report, more than 25 potentially useful evaluations were reviewed and discussions were held with evaluation practitioners and managers inside and outside the World Bank concerning when, why and how evaluations have been found useful. A number of general lessons and guidelines were identified concerning how to design and manage useful evaluations and how to address the question of attribution. Specific lessons are included in many of the case studies. Key Lessons 1. The Importance of a Conducive Policy Environment The findings and recommendations of an evaluation are much more likely to be used when:
• They address current policy concerns (e.g., the desire to reduce government expenditures and eliminate duplication (EAS); recognition that a subsidy was not reaching the target group (IFPRI); and recognition of the need to be more client oriented (CRC));
• There is a strong commitment by funding, policy and executing agencies to implement the recommendations (e.g., both the funding agency and the borrower were committed to addressing environmental problems (KCM); and the Indonesian Planning Agency wished to ensure the effective implementation of its water and sanitation policies (Flores)); and
• There are dynamic local level organizations able to follow-up and implement or monitor the implementation of the policies (e.g., parent teacher associations in Uganda (PETS); and community organizations and the media in Bangalore (CRC)).
2. The Timing of the Evaluation is Crucial The likelihood that the results of the evaluation will be used is greatly enhanced when:
• The evaluation is launched at a time when the issues studied are being widely debated or when decisions have to be made in the near future (e.g., increasing public criticism of the poor quality of public services (CRC));
• There is an awareness that failure to take immediate actions will have serious consequences (e.g., the KCM project risked closure or heavy fines if the environmental problems were not resolved (KCM));
• The findings are communicated to key decision makers in time for them to use the results. Often this requires the informal communication of key findings before the main report is published (IFPRI); and
• Findings are communicated in a timely manner to all key stakeholders, and not just to an inner circle (EAS, CRC).
65
3. Understanding the Role of Evaluation
An important lesson from the study is that an evaluation is very rarely the only, or even the most important, source of information or influence on policy makers and managers. Consequently a successful evaluation strategy must recognize and adapt to the context within which it will be implemented and discussed:
• Since the evaluation is only “one piece of the puzzle”, it is essential to understand how the evaluation can complement other activities and also what are the factors which may mitigate against its successful utilization. For example, one of the stakeholders described the IFPRI evaluation as the “nail in the coffin” which finally convinced policy makers to abolish the wheat grain subsidy (IFPRI);
• Often the evaluation is providing political cover for decision-makers who already know what needs to be done but who prefer that unpopular or sensitive messages come from the outside expert. For example, the IFPRI study allowed Pakistani policy makers to avoid using their own political capital to gain support for a sensitive action (IFPRI);
• The credibility and perceived independence of the evaluation team is often a critical factor (IFPRI);
• Because the evaluator is not involved in the day-to-day activities of the program, she or he can often help policy makers to see the broader picture and to understand the social, political and economic context within which the program operates (KCM, EAS). The evaluator can also observe the social and political pressures which may restrict the access of more vulnerable groups to program benefits (Flores) in a way which program staff often cannot;
• In some cases the evaluator may provide new knowledge or understanding. This is often the case when funding is obtained from an international agency which has different rules and procedures, or when an agency is subjected to international regulations with which it is not familiar. In Bulgaria, the KCM company was not familiar with the international covenants concerning hedging, and the evaluation provided considerable savings and increased earnings by clarifying the regulations; and
• The evaluation may also have a catalytic function in providing a forum in which a wider range of stakeholders can come together to discuss a broad issue. In some cases the ultimate outcomes may be different from findings of the original evaluation report. In the case of the large dams study, the recommendations following the Gland Conference went far beyond the original OED report.
4. Building a Relationship with the Client, and Communicating and Marketing the Evaluation Findings and Recommendations • It is important to establish a good relationship with key stakeholders and to keep
them informed of the progress of the evaluation; • It is important to ensure the evaluator has good communication skills; • The evaluator must also be a good listener and must ensure that the needs and
concerns of the clients are understood, and that the evaluation will specifically address them;
66
• The relationship with the client also permits a better understanding of the whole decision-making process so as to identify the points at which the evaluation can have maximum impact;
• The needs of all key stakeholders must be understood and addressed; • There is a delicate balance between maintaining good relationships with the client
and not making too many demands on their time. For example, KCM management commented favorably on the fact that the evaluation only required 2-3 days of their time;
• The timely presentation of findings is critical. Results can be communicated informally before the final report is completed. In the IFPRI evaluation, key policy decisions, using the evaluation findings, had already been taken long before the final reports were published;
• “No surprises” is an important part of the communication strategy. Key clients should be informed ahead of time of likely findings, particularly those which are controversial or potentially negative for the client;
• Ensure the evaluation findings reach all key stakeholders and are not limited to an inner circle. Different communication and dissemination strategies may be required for different groups (CRC); and
• The evaluation should identify and provide guidance on how to address any potentially negative consequences of implementing the evaluation findings. The IFPRI evaluation recognized that the elimination of wheat subsidies could have negative consequences for the wheat distributors and ration shops, and presented specific recommendations on how to address and mitigate these consequences.
5. Who Should Conduct the Evaluation?
• Conducting the evaluation through the research arm of the decision-making agency sometimes increases the likelihood that the results will be used. The EAS case study argued that the use of the PEO, which is located in the Planning Commission, provided easier access to all key agencies, provided a better understanding of the national political context, and contributed significantly to the acceptance of the evaluation findings;
• In other cases it may be advantageous to use an external evaluation agency to provide greater independence and objectivity and to permit exploration of issues (such as social and political control mechanisms) that might be more difficult for an in-house agency to address (Flores); and
• The independence of the evaluation agency may also be needed to ensure the credibility of the findings (IFPRI).
6. Scope and Methodology of the Evaluation
Additional options to consider within the context of each evaluation are as follows:
• While the client is mainly concerned with outcomes and impacts, it may also be important to examine the design and implementation phases of the program or policy so as to understand the implementation process and the linkages between these stages and program outcomes (EAS);
67
• It can also be important to study the social, economic and political contexts within which the program or policy is being implemented. This can also help the client to understand the “broader picture”;
• A multi-method approach, combining quantitative and qualitative methods permits the use of triangulation to strengthen the reliability of estimates and to provide a broader framework for interpreting the findings (EAS, Flores, KCM); and
• Even when the client is mainly interested in the perceptions of one group of stakeholders, it is often advisable to also study the perceptions of other groups, both for consistency and to provide a broader analytical framework for interpreting the findings. The Citizen Report Card stakeholder survey found that service delivery agencies felt that the analysis was limited and biased as only the customers were interviewed and the perspective of service providers was not addressed.
Attribution: Assessing the Contribution of an Evaluation to the Observed Outcomes A number of the following points provide lessons on difficulties in conducting an attribution analysis, without in several cases providing points on how to overcome the difficulties.
1. Difficulties in getting agencies to provide feedback on the evaluation
• It is often difficult to get agency staff to acknowledge that an evaluation had been useful when this would suggest that the evaluation had pointed out things which the project staff should already have known, and that by implication suggesting that they had not been doing their job properly; and
• Government agencies may be unwilling to comment on the utility of an evaluation conducted by another government agency. In some cases the process of obtaining clearance to solicit these opinions can be extremely time-consuming and may require the involvement of high level officials.
2. Assessing the reliability of stakeholder feedback
• For many evaluations which must be conducted rapidly and economically, the only way to obtain feedback from key stakeholders is through the intermediation of the evaluator who wrote the case study. It is difficult, in practical terms, to assess whether the evaluator may have inadvertently introduced a bias in the way that the request for comments was phrased or the findings were presented;
• Different stakeholders may also have an incentive to over- or under-estimate the impact of the evaluation. For example, the client who commissioned the evaluation may wish to over-estimate the impact of the evaluation, while on the other hand a local agency may wish to under-estimate the impact of an evaluation commissioned by the funding agency or conducted by independent consultants. There is often a tendency to state that the observed actions were decided
68
independently of the evaluation, or that the agency was already aware of all of the points brought up; and
• There may be difficulties of recall, particularly when the evaluation was conducted some time ago, or when a number of different studies and policy workshops have been conducted and respondents find it difficult to separate this evaluation from other activities which were going on at the same time.
3. Alternative approaches to attribution analysis
A number of different approaches to attribution analysis were identified:
• A survey of key stakeholders can be conducted using e-mail and/or personal interviews (CRC);
• Key stakeholders can be requested to give their opinions on the utility and impacts of the evaluation without a formal stakeholder survey (Flores, KCM);
• A paper trail can be identified to document how the evaluation findings were incorporated into government policy or planning documents (PETS, EAS, KCM). In some cases this is supported by discussion in the media (PETS, CRC);
• Evidence can be presented to show that the evaluation contributed to a policy being implemented earlier than would otherwise have been the case. The benefits are then estimated as the additional revenues or cost-savings resulting from these timely actions (IFPRI, KCM); and
• Costs savings can be estimated from staff reductions or the elimination of waste and duplication (EAS).
4. Tracking unanticipated outcomes In many cases an evaluation can have a catalytic role, promoting a number of activities and policies which were not planned or anticipated. The following are some ways to track this: • A process analysis of events after the completion of the evaluation can track the
later outcomes (Large Dams); • Were other follow-up studies conducted and can they be linked to the original
evaluation? (CRC, KCM); and • Were similar studies conducted in other countries? (CRC, PETS).
69
Annex A. Means of Verification of Each Case Study
This Influential Evaluations report focuses on the utilization of eight evaluations. These case studies were selected from an initial list of 25 potential evaluations suggested by some 300 evaluation practitioners and users from the World Bank, IPDET alumni, and others contacted by e-mail. The initial list of potential cases was screened to identify examples with potentially high levels of utilization, and to eliminate those where it was not possible to ascertain that the findings and recommendations had actually been used.
The attribution assessments for each case study were based on publications and other secondary data, combined with: (a) new stakeholder consultations conducted by the original case study authors (Flores and KCM), or by OED consultants (China Forests and Bangalore Citizen Report Card); (b) the findings of an earlier stakeholder consultation conducted by the case study authors (IFPRI and the Large Dams study); or (c) external assessments conducted by local World Bank staff (India EAS). None of these methods of attribution analysis can achieve the level of methodological rigor which could be obtained from a large-scale quasi experimental design built into the original evaluation. However, between them, they probably represent the highest level of rigor which will be possible in most operational settings where the analysis must be conducted under time and budget constraints.
1. Improving the Efficiency of the Indian Employment Assurance Scheme
The evaluation of the Indian government’s Employment Assurance Scheme (EAS) was conducted by the government’s independent Programme Evaluation Organisation (PEO). The two authors of this case study, respectively the adviser and director of PEO, conducted a document review to investigate the impact of the evaluation, including the Planning Commission’s mid-term appraisal of the government’s Ninth Plan and the annual reports of the Ministry of Rural Areas and Employment (MRAE), which has functional responsibility for the EAS. PEO staff had also been involved in extensive discussions with MRAE staff when the EAS was being restructured. The case study authors were able to trace several specific decisions on the EAS back to the evaluation report. They were able to point to specific sections of the mid-term appraisal of the Ninth Plan and MRAE planning documents which included references to recommendations from the evaluation. The draft case study was reviewed and verified by two World Bank staffers in the New Delhi office, and a number of changes and clarifications were made by the authors in response to these comments. (Other Bank and IMF staff were given the opportunity to comment.)
2. Using Citizen Report Cards to Hold the State to Account in Bangalore, India
The citizen report cards (CRC) approach has been thoroughly documented by the NGO which initiated themthe Bangalore Public Affairs Centre (PAC)and both the modus operandi and the results have been presented publicly on numerous occasions, including at World Bank seminars and at a large number of conferences, seminars and workshops around the world. In addition, the Bank has publicly reported on the Bangalore CRC
70
experience on a number of occasions (e.g. World Bank 1997, 2003; OED 1999; Wagle and Shah 2003a).
For this Influential Evaluations report, OED commissioned a review of the impacts of the CRC approach in Bangalore to complement the above mentioned reports. This involved primary research, including interviews with 19 heads and officials of four of the public service agencies covered in the Report Card study, 5 state officials familiar with the report cards, 7 representatives of citizen groups involved in the follow-up and 4 media representatives. The review was undertaken by Dr A. Ravindra, a former chief minister of Karnataka state, and has been published by OED (Ravindra 2004). All of the respondents recognized the important contribution of the Report Card study and its catalytic role in stimulating actions to improve the quality of service deliveryalthough inevitably they differed among themselves with respect to the relative importance of the Report Cards compared to other factors.
3. Assessing the Effectiveness of Water and Sanitation Interventions in Flores, Indonesia
This case study focuses on a 2002 World Bank evaluation (Flores Revisited, by Christine van Wijk et al.) of an AusAID-assisted project. The evaluation was commissioned in direct support of a process, led by the Indonesian government, to reformulate the government’s water and sanitation sector policy. The two authors of this case study for the Influential Evaluations report are Bank staffers working on Indonesia water & sanitation issues. They also participated in a workshop in Indonesia where the findings of the evaluation report were presented and discussed. And they contacted the Indonesian chair of the sector policy working group and the AusAID technical adviser, to ascertain their views on the impacts of the evaluation report. The authors have also been involved in many of the Government planning meetings for the preparation of the new national water and sanitation strategy, and they identified a number of specific references to the Flores study in the government’s planning documents.
4. Broadening the Policy Framework for Assessing the Viability of Large Dams
The impact of OED’s large dams evaluation (OED 1996) was the focus of a review conducted by a consultant contracted by OED and reported in her PhD thesis and in a forthcoming book. This review included interviews of Bank sector managers, dams experts and OED evaluators, and a review of a number of World Bank and other documents. For the purposes of this Influential Evaluations report, OED commissioned the consultant to prepare a case study based on her research findings concerning the large dams evaluation.
5. The Abolition of Wheat-Flour Ration Shops in Pakistan
The International Food Policy Research Institute (IFPRI) regularly conducts and publishes in-depth studies to trace the extent of impact of some of its research work and evaluations on policy decisions. This case study reports one such investigation, which focused on how the evaluation findingsprepared jointly by IFPRI and the Pakistan
71
Institute of Development Economicswere produced, communicated, and used in the policy-making process leading to a government decision. The investigation, which cost $50,000 to complete, included a 3-week IFPRI mission in Pakistan which allowed in-depth interviews of key researchers, policymakers and others. The investigation also included a document review.
6. Improving the Delivery of Primary Education Services in Uganda
This case study focuses on the Public Expenditure Tracking Surveys (PETS) conducted jointly by the World Bank, Makerere University and the Government of Uganda. Experience with the PETS, and their impacts, have been reported publicly by the Bank on a large number of occasions (e.g. Reinikka 1999; OED 1999; Reinikka and Svensson 2001; Wagle and Shah 2003b; World Bank 2003). The case study for this Influential Evaluations report was based on these published reports of the PETS and of their impacts. The case draws on published material to show that the findings of the PETS had a direct influence on government actions (such as the publication of the PETS findings in the press, the requirement that all schools publicly post information on the approval and flow of funds, and the tighter monitoring of the funds release process) to address the reasons for “leakage” of government funds.
7. Enhancing the Performance of a Major Environmental Project in Bulgaria
The evaluation office of the Black Sea Trade and Development Bank (BSTDB) conducted a mid-term review of a BSTDB project (the KCM Environmental Improvement Project in Bulgaria) in 2002, using a rapid review approach. The evaluation office developed a simulation approach (sensitivity analysis) to estimate and value the benefits of the mid-term review. The financial benefits of the actions taken by the borrower (avoiding fines by implementing the environmental action plan, advancing the start of production, and sale of chemicals and steel products etc) were very clear and the main question was to determine to what extent the evaluation contributed to these actions being taken, or being taken earlier. With our guidance, a formal stakeholder questionnaire was designed to identify the impacts of the evaluation, and in particular to verify the accuracy of the benefit estimates. The survey was conducted by the manager of the BSTDB evaluation office, and it covered key staff within the BSTDB and the KCM project. All respondents agreed that the evaluation had contributed to making the borrower and the lender aware of the need to take these decisions, and they felt that the assumptions about the financial impact of the evaluation were reasonable.
8. Helping Re-assess the Chinese National Forest Policy The impact of OED’s China forestry evaluation (one of the 6 country case studies conducted and published as part of OED’s evaluation, The World Bank Forest StrategyStriking the Right Balance), was the focus of a review conducted by a consultant contracted by OED. The OED task manager of the OED forestry evaluation helped to identify key stakeholders within the Bank, other multilaterals, bilaterals, and the Chinese government. These and other stakeholders were contacted by telephone or email (or in some cases involving face-to-face interview) to ascertain their judgments
72
concerning the impact of OED’s china forestry evaluation. Stakeholders from whom responses were obtained included, for example, a former World Bank Executive Director, now head of a policy secretariat to the Chinese government. Drawing on published material, including published interviews with a government minister, the OED consultant was able to trace several policy recommendations submitted to the highest legislative body in China (the State Council) back to OED’s China forestry evaluation. A detailed note on these findings has been prepared. References Operations Evaluation Department. 1996. World Bank Lending for Large Dams: A Preliminary Review of Impact. OED Précis: Washington DC. . 1999. The Role of Civil Society in Assessing Public Sector Performance in Ghana: Proceedings of a Workshop. World Bank: Washington D.C. . 2000. The World Bank Forest StrategyStriking the Right Balance. World Bank: Washington D.C. A. Ravindra. 2004. An Assessment of the Impact of Banglalore Citizen Report Cards on the Performance of the Public Agencies: An Evaluation Report. Operations Evaluation Department ECD Working Paper No 12. World Bank: Washington D.C. Ritva Reinikka. 1999. Using Surveys for Public Sector Reform. PREM Note No. 23. World Bank: Washington D.C. and Jakob Svensson. 2001. Explaining Leakage of Public Funds. Policy Research Working Paper No. 2709. World Bank: Washington D.C. Swarnim Wagle and Parmesh Shah. 2003a. Bangalore India: Participatory Approaches in Budgeting and Public Expenditure Management. Social Development Notes No. 70. Environmentally and Socially Sustainable Development Network. World Bank: Washington D.C. . 2003b. Uganda: Participatory Approaches in Budgeting and Public Expenditure Management. Social Development Notes No. 74. Environmentally and Socially Sustainable Development Network. World Bank: Washington D.C. Christine van Wijk, Kumala Sari, Nina Shatifan, Ruth Walujan, Ishani Mukherjee and Richard Hopkins. 2002. Flores Revisited. Draft report. World Bank. 1997. The State in a Changing World. 1997 World Development Report. Oxford University Press: New York. . 2003. Making Services Work for Poor People. 2004 World Development Report. World Bank and Oxford University Press: Washington D.C.
73
OED Resource Materials on Evaluation Capacity Development
Working Papers
#1: Keith Mackay, Lessons from National Experience.
#2: Stephen Brushett, Zimbabwe: Issues and Opportunities.
#3: Alain Barberie, Indonesia’s National Evaluation System.
#4: Keith Mackay, The Development of Australia’s Evaluation System.
#5: R. Pablo Guerrero O., Comparative Insights from Colombia, China and Indonesia.
#6: Keith Mackay, Evaluation Capacity Development: A Diagnostic Guide and Action Framework.
#7: Mark Schacter, Sub-Saharan Africa: Lessons from Experience in Supporting Sound Governance.
#8: Arild Hauge, Strengthening Capacity for Monitoring and Evaluation in Uganda: A Results Based Management Perspective.
#9: Marie-Hélène Adrien, Guide to Conducting Reviews of Organizations Supplying M&E Training.
#10: Arild Hauge, The Development of Monitoring and Evaluation Capacities to Improve Government Performance in Uganda.
#11. Keith Mackay, Two Generations of Performance Evaluation and Management System in Australia.
#12. Adikeshavalu Ravindra, An Assessment of the Impact of Bangalore Citizen Report Cards on the Performance of Public Agencies.
Other Papers
OED, Influential Evaluations: Evaluations that Improved Performance and Impacts of Development Programs, 2004.
OED, 2002 Annual Report on Evaluation Capacity Development.
OED, Monitoring and Evaluation: Some Tools, Methods and Approaches, 2002.
Development Bank of Southern Africa, African Development Bank and The World Bank, Developing African Capacity for Monitoring and Evaluation, 2000.
K. Mackay and S. Gariba (eds.), The Role of Civil Society in Assessing Public Sector Performance in Ghana, OED, 2000.
Other relevant publications can be downloaded from OED’s ECD Website: >http://www.worldbank.org/oed/ecd/>


