Embed Size (px)
Citation preview
INFLUENCE OF UNDERSTAFFING OF TEACHERS ON TEACHING AND
LEARNING IN PUBLIC PRIMARY SCHOOLS IN MAKUENI SUB-COUNTY,
MAKUENI COUNTY, KENYA
DAVID MANGENDI
A Thesis Submitted to the Department of Post-graduate Studies
in Partial Fulfillment to the award of Master of Education Degree in Curriculum Studies
and Instruction
THE CATHOLIC UNIVERSITY OF EAST AFRICA
OCTOBER 2018
i
DECLARATION
ii
ABSTRACT
There are no enough teachers in many of the public primary schools in Kenya. This means the
schools are understaffed and this has influenced the process of teaching and learning in the
schools. This study sought to find out how understaffing of teachers had influenced teaching and
learning in public primary schools in Makueni Sub County, Makueni County, in Kenya. The
study was guided by the following research questions: What is the distribution of the teaching
staff in public primary schools in Makueni sub- County? How does teachers‟ work load
influence teaching and learning in public primary schools in Makueni sub-county? What
challenges are caused by understaffing to the teaching-learning process in Makueni sub-county?
What can be done to improve staffing in the public primary schools of Makueni sub- County?
The methodology employed in the study was both quantitative and qualitative research
methodologies mainly through a cross-sectional survey design and narrative research design
respectively. The population of the study involved teachers employed by the Teachers Service
Commission who included head teachers and assistant teachers in public schools in Makueni Sub
County. The study also involved an education officer and the staffing officer in the district. The
Sampling methods in the study were simple random for the teachers and stratified sampling for
the schools. There was purposive sampling for both the head teachers and the heads of
curriculum (HOC) (or subject panel heads) in the schools. The researcher also used purposive
sampling for both the education officer and the staffing officer. The sample size of the study was
20 head teachers, 20 HOCs, 151 teachers, one (1) staffing officer and one (1) education officer.
Data were collected by use of interview guides and questionnaires. The validity of the
instruments was ensured by involving stakeholders in the research department of the university
including supervisors of this study who clarified on the authedicity of the instruments. The
reliability of the quantitative instrument depended on test-retest technique of the pilot
questionnaires whereas the dependability of the qualitative instruments was ensured by having a
respondent checking on the final themes and concepts. The quantitative data were analyzed by
use of frequencies and percentages with special regard to the SPSS version. The qualitative data
were organized and coded according to the themes that emerged from the collected data.
The findings of this study included the following: that there was unfair distribution of teachers
and high pupil-teacher ratio in the sub county and that affected teaching and learning in the
schools; that in understaffed schools where teachers have high teaching workload, effective
teaching and learning are negatively affected; that there were many challenges associated with
curriculum implementation and high pupil-teacher ratio encountered by teachers in understaffed
schools; and that fair distribution of teachers and review of staffing policies were some the
effective measures of improving staffing in the schools. The study recommended regular
recruitment and deployment of teachers within a specified period of time; ensuring fair
distribution of teachers with regard to the staffing need; and provision of enough social services
to the teachers in hardship areas.
iii
DEDICATION
I dedicate this work to my wife, Margaret and children, Patience, Loise and Caleb.
iv
ACKNOWLEDGEMENTS
I acknowledge the almighty God for the strength of mind, will and sufficient health he
gave me to carry out the study. I also acknowledge my wife, Margaret Wambui, for material and
social support throughout the course of the study. She was always prayerful and eager to see a
successful completion of the study. Similarly, I express sincere and heartfelt appreciation to my
senior brothers, Mr. James Mangendi (late) and Stephen Mangendi for their social support and
who had also set the background in my undergraduate degree. My junior brother, Mr. Samuel
Mangendi and family cannot be left out. He was very instrumental in material support and
general welfare.
Special thanks goes to my supervisors, Dr. Jared Anyona and Dr. Shem Mwalw‟a, whose
guidance and advice made this study successful. It is out of their critical evaluation and
suggestions to my written work that this thesis went through. I also thank my lecturers as well:
Dr. Elizabeth Ngumbi, Dr. Rose Mwanza, Professor Genevieve Mwayuli, Dr. Jared Anyona and
Catherine Machyo among others. Their expertise and effective teaching are an effort to count on
in my academic achievement. To my colleagues in study: Mr. Paul Kavivya, Mr. Owiti, Mr.
Yegon and Mr. Washington, I acknowledge their support in discussions and academic
contributions. To my respondents in the study, I express my sincere gratitude to them for their
tireless effort, concern and sense of responsibility that they demonstrated in the data collection
exercise. Lastly, on behalf of the county administration of Makueni and the ministry of education
of Makueni County, I want to thank the county commissioner and the county director of
education respectively for the documented permission they gave me to visit the schools in the
county.
v
TABLE OF CONTENTS
Declaration………………….…………………………………………………………………...... i
Dedication …...................................................................................................................................ii
Acknowledgements………………..……………………………………………………………..iii
Abstract…………………………………………………………………………………………...iv
Table of Contents………………………………………………………………………………….v
List of Tables…...............................................................................................................................x
List of Figures………………………………………………………………………….…..…….xii
Acronyms and Abbreviations………….……………………...…………………………….…..xiii
CHAPTER ONE: INTRODUCTION
1.1 Background of the Study…………………………………………………………………….. 1
1.2 The Trend of Understaffing of Teachers in Kenya……………………………………………2
1.3 Statement of the Problem….......................................................................................................5
1.4 Research Questions…………………………………………………………………………....7
1.5 Significance of the Study….......................................................................................................8
1.6 Scope and Delimitations of the Study………………………………........................................9
1.7 Theoretical Framework………………………………………………………………………10
1.7.1 Strengths of the Theory……………….……………………………………………………11
1.7.2 Weaknesses of the Theory…………………………………………………………………11
1.7.3 Application and Justification of the Theory………………………………………………..12
1.8 Conceptual Framework……………………………………....................................................12
1.9 Definition of Terms…………………………………………………………………………..15
vi
CHAPTER TWO: REVIEW OF RELATED LITERATURE
2.1 Introduction………………………………………..…………………………………………17
2.2 The Government‟s Educational Policies on Staffing of Primary Schools………………...…17
2.3 Review of Empirical Studies According to the Research Questions………………………...19
2.3.1 Influence of Teacher Distribution on Teaching and Learning…..........................................19
2.3.2 Influence of Teacher‟s Work load on Teaching and Learning……………………….…....23
2.3.3 Challenges of Understaffing on Teaching and Learning…..................................................26
2.3.4 Measures of Improving Staffing……………………………………….…………………..34
2.3.5 Summary and Research Gaps...……………………….…...................................................37
CHAPTER THREE: RESEARCH DESIGN AND METHODOLOGY
3.1 Introduction…………………………………………………….………………………….....40
3.2 Locale of the Study………………………………….…………………………………….....40
3.3 Research Design ………………………………...………………….......................................41
3.4 Target Population…………………………………….………………………………………42
3.5 Sample and Sampling Design………………………………………………………………..42
3.5.1 Sampling of the Schools…...................................................................................................43
3.5.2 Sampling of the Head Teachers and the HODs………...………………………………….44
3.5.3 Sampling of the Teachers…..................................................................................................44
3.5.4 Sampling of the Staffing Officer and the DEO…................................................................45
3.6 Instruments for Data Collection…..........................................................................................46
3.6.1 Questionnaires…..................................................................................................................46
3.6.2 Questionnaire for Head Teachers…......................................................................................46
vii
3.6.3 Questionnaire for Teachers…...............................................................................................46
3.6.4 Questionnaire for HOCs (Heads of Curriculum)…..............................................................47
3.7 Interview Guides…..................................................................................................................47
3.7.1 Interview Guide for the Staffing Officer in the Sub County…............................................47
3.7.2 Interview Guide for the DEO in the Sub County…………………………………………..48
3.8 Document Analysis Guide.......................................................................................................48
3.9 Validity and Reliability……………………………….…………………………………...…48
3.9.1 Validity…………………………………………………………………………………….48
3.9.2 Pilot Test……………………………………………………………………………….......49
3.9.3 Reliability…………………………………………………………………………….…….49
3.10 Credibility and Dependability of Qualitative instruments………………………………….50
3.11 Data Collection Procedures…................................................................................................50
3.12 Data Analysis Procedures…………………………………………………………………..51
3.13 Ethical Considerations………………………………………………………………….......52
CHATER FOUR: DATA PRESENTATION, INTERPRETATION AND DISCUSSION OF
FINDINGS
4.1 Introduction………………………………………………………………………..…………53
4.2 Questionnaire Return Rate……………………………………..……….……………………53
4.3 Demographic Information of Respondents…………………………………………………..54
4.3.1 Gender of Respondents ……………………………………………………………………55
4.3.2 Age of the Respondents……………………….…...……………...……………………….56
4.3.3: Academic Qualification of Respondents………………………………………………….57
viii
4.3.4 The Position/Responsibility of Teachers in Schools………………………………………57
4.4 The Geographical Locations of the Schools…………………………………………………58
4.5 Findings on Research Question 1……………………………………………………………59
4.5.1 Distribution of Teachers in Public Primary Schools………………………………………59
4.5.2 Influence of Understaffing of Schools on Teaching and Learning in the Sub County…….63
4.5.3 Influence of High Pupil-Teacher Ratio on Teaching and Learning………………………..65
4.5.4 Average Number of Pupils Per Class Per Teacher in the Schools…………………………67
4.5.5 Influence of the Staffing levels of the Schools on Teacher Utilization……………………68
4.6 Findings According to Research Question 2………………………………………………...69
4.6.1 Influence of Teaching Workload on Teaching and Learning…………………….……….69
4.6.2 Lessons per Week….............................................................................................................70
4.6.3 Influence of Work load on Teachers Instruction Work……………………………………72
4.6.4 Influence of Understaffing, Work load and PTR on Pupils Performance…………………74
4.6.5 Responses as to whether Understaffing Influences Teaching and Learning Activities
Negatively………………………………………………………………………………………..75
4.6.6 Influence of High Work load on Office Work……………………………………………..76
4.6.7 Responses on Influence of Work load on Class Attendance………………………………78
4.6.8 Responses on Influence of Teaching Work load on Syllabus Coverage…………………..79
4.7 Findings According to Research Question 3………………………………………………...81
4.7.1 Responses of Head Teachers on Challenges Experienced by Understaffed Schools in
Teaching and Learning…………………………………………………………………………..81
ix
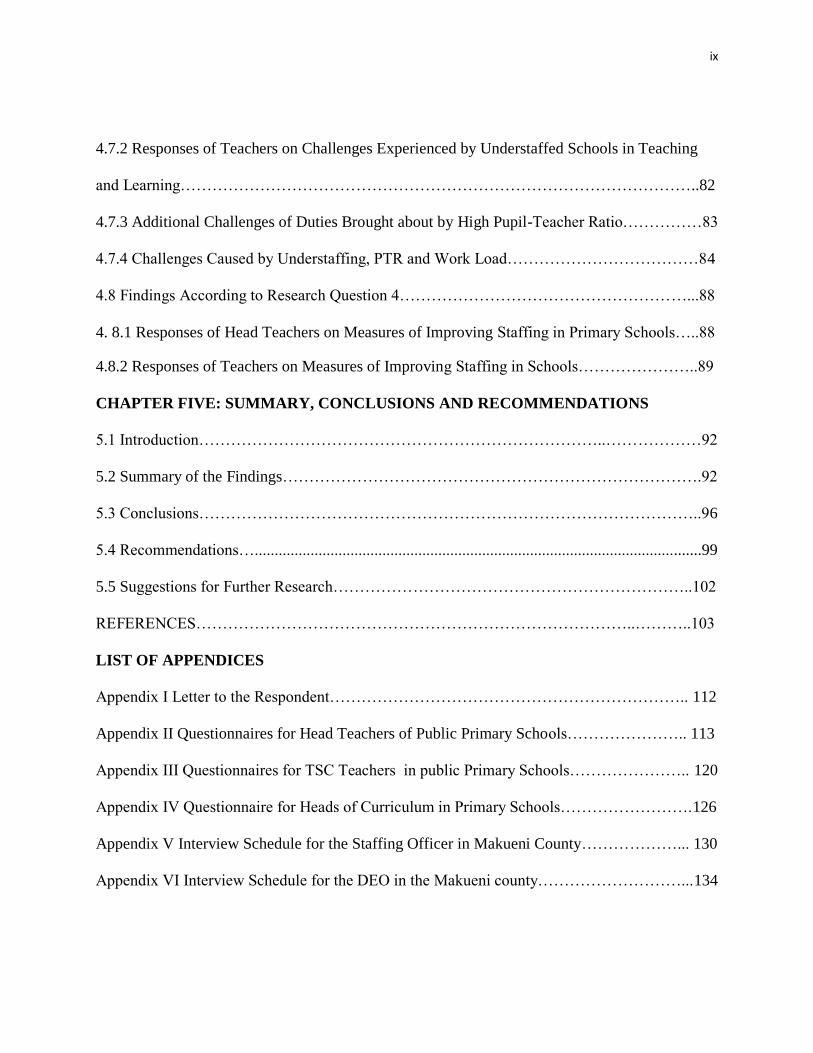
4.7.2 Responses of Teachers on Challenges Experienced by Understaffed Schools in Teaching
and Learning……………………………………………………………………………………..82
4.7.3 Additional Challenges of Duties Brought about by High Pupil-Teacher Ratio……………83
4.7.4 Challenges Caused by Understaffing, PTR and Work Load………………………………84
4.8 Findings According to Research Question 4………………………………………………...88
4. 8.1 Responses of Head Teachers on Measures of Improving Staffing in Primary Schools…..88
4.8.2 Responses of Teachers on Measures of Improving Staffing in Schools…………………..89
CHAPTER FIVE: SUMMARY, CONCLUSIONS AND RECOMMENDATIONS
5.1 Introduction…………………………………………………………………..………………92
5.2 Summary of the Findings…………………………………………………………………….92
5.3 Conclusions…………………………………………………………………………………..96
5.4 Recommendations…................................................................................................................99
5.5 Suggestions for Further Research…………………………………………………………..102
REFERENCES………………………………………………………………………..………..103
LIST OF APPENDICES
Appendix I Letter to the Respondent………………………………………………………….. 112
Appendix II Questionnaires for Head Teachers of Public Primary Schools………………….. 113
Appendix III Questionnaires for TSC Teachers in public Primary Schools………………….. 120
Appendix IV Questionnaire for Heads of Curriculum in Primary Schools…………………….126
Appendix V Interview Schedule for the Staffing Officer in Makueni County………………... 130
Appendix VI Interview Schedule for the DEO in the Makueni county………………………...134
x
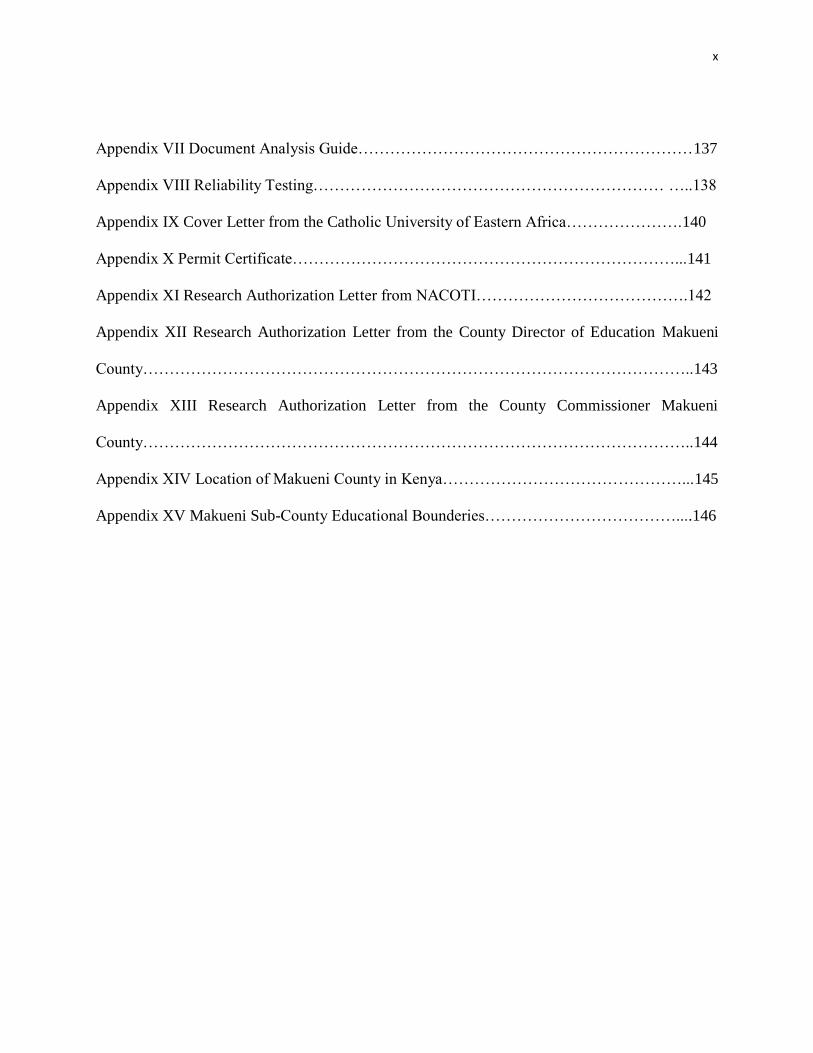
Appendix VII Document Analysis Guide………………………………………………………137
Appendix VIII Reliability Testing………………………………………………………… …..138
Appendix IX Cover Letter from the Catholic University of Eastern Africa………………….140
Appendix X Permit Certificate………………………………………………………………...141
Appendix XI Research Authorization Letter from NACOTI………………………………….142
Appendix XII Research Authorization Letter from the County Director of Education Makueni
County…………………………………………………………………………………………..143
Appendix XIII Research Authorization Letter from the County Commissioner Makueni
County…………………………………………………………………………………………..144
Appendix XIV Location of Makueni County in Kenya………………………………………...145
Appendix XV Makueni Sub-County Educational Bounderies………………………………....146
xi
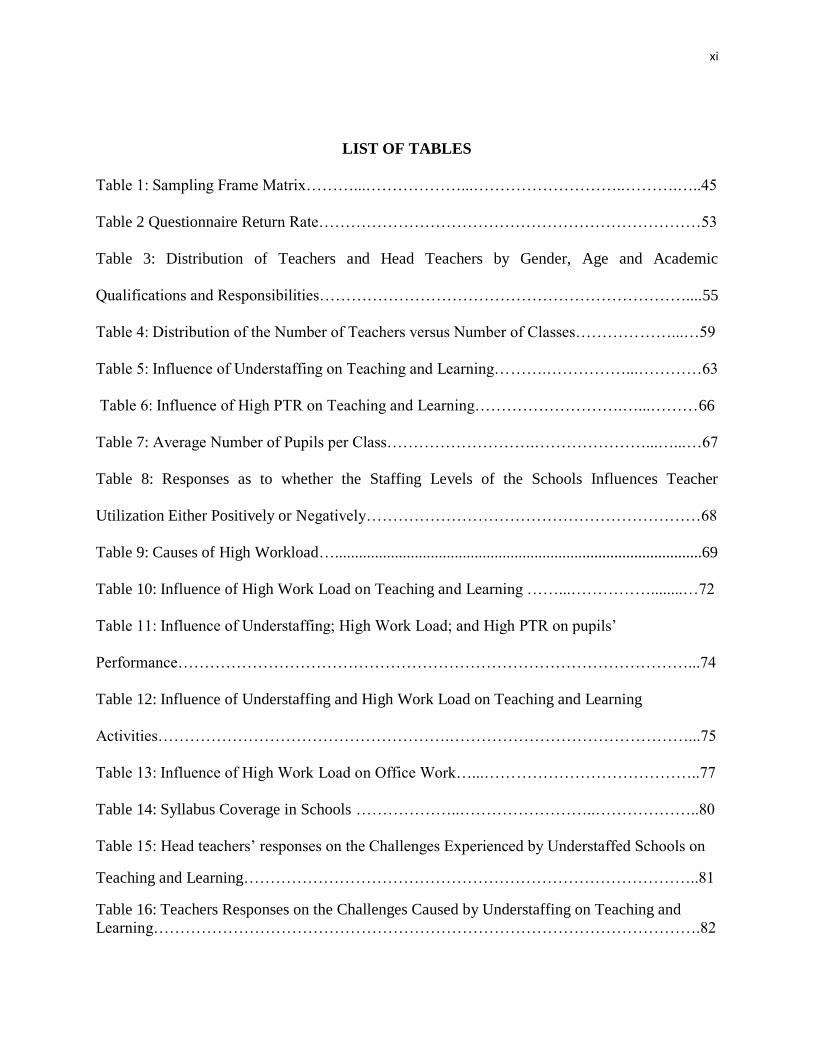
LIST OF TABLES
Table 1: Sampling Frame Matrix………...………………...………………………..……….…..45
Table 2 Questionnaire Return Rate………………………………………………………………53
Table 3: Distribution of Teachers and Head Teachers by Gender, Age and Academic
Qualifications and Responsibilities……………………………………………………………....55
Table 4: Distribution of the Number of Teachers versus Number of Classes………………...…59
Table 5: Influence of Understaffing on Teaching and Learning……….……………...…………63
Table 6: Influence of High PTR on Teaching and Learning……………………….…...………66
Table 7: Average Number of Pupils per Class……………………….…………………...…...…67
Table 8: Responses as to whether the Staffing Levels of the Schools Influences Teacher
Utilization Either Positively or Negatively………………………………………………………68
Table 9: Causes of High Workload…............................................................................................69
Table 10: Influence of High Work Load on Teaching and Learning ……...……………........…72
Table 11: Influence of Understaffing; High Work Load; and High PTR on pupils‟
Performance……………………………………………………………………………………...74
Table 12: Influence of Understaffing and High Work Load on Teaching and Learning
Activities……………………………………………….………………………………………...75
Table 13: Influence of High Work Load on Office Work…...…………………………………..77
Table 14: Syllabus Coverage in Schools ………………..……………………..………………..80
Table 15: Head teachers‟ responses on the Challenges Experienced by Understaffed Schools on
Teaching and Learning…………………………………………………………………………..81
Table 16: Teachers Responses on the Challenges Caused by Understaffing on Teaching and
Learning………………………………………………………………………………………….82
xii
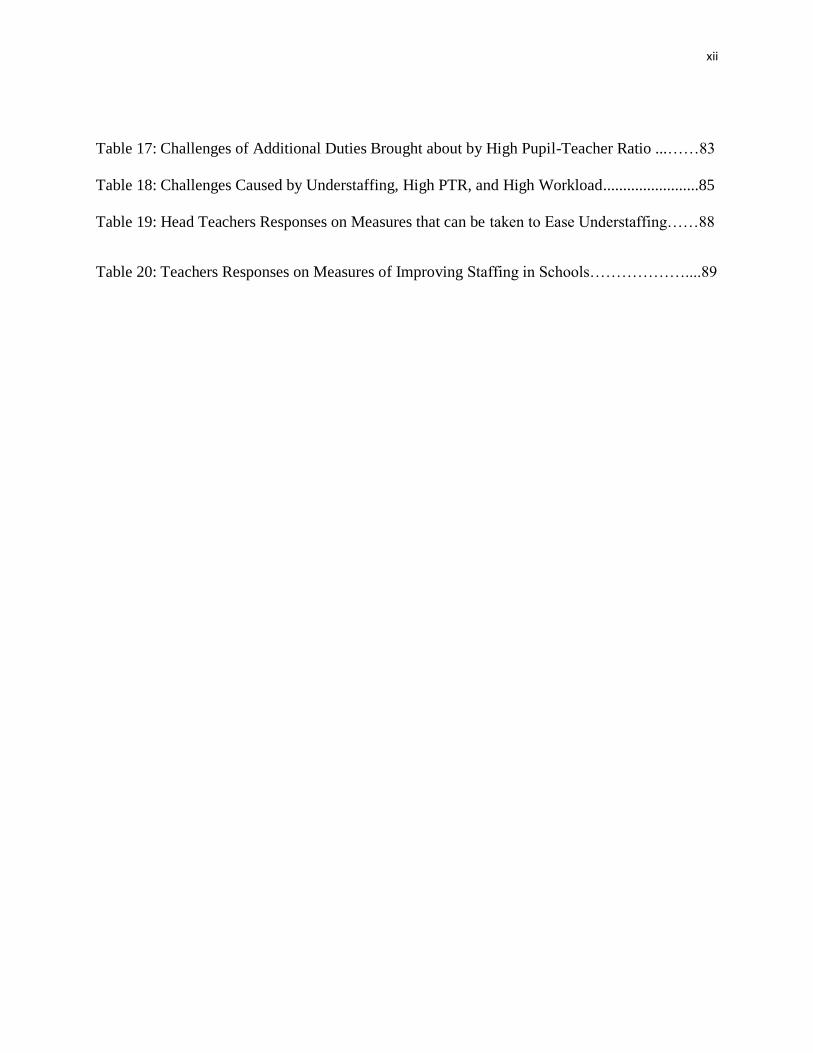
Table 17: Challenges of Additional Duties Brought about by High Pupil-Teacher Ratio ...……83
Table 18: Challenges Caused by Understaffing, High PTR, and High Workload........................85
Table 19: Head Teachers Responses on Measures that can be taken to Ease Understaffing……88
Table 20: Teachers Responses on Measures of Improving Staffing in Schools………………....89
xiii
LIST OF FIGURES
Figure 1: Conceptual Framework……………….………………………….………………….13
Figure 2: Geographical Location of the Schools …..................................................................58
Figure 3: Influence of High Work Load on Class Work ….......................................................78
Figure 4: Influence of High Work Load on Syllabus Coverage….............................................79

xiv
LIST OF ACRONYMS AND ABBREVIATIONS
ASAL Arid and Semi-Arid Locations
ATL Average Teaching Load
CA Creative Arts
FPE Free Primary Education
KCPE Kenya Certificate of Primary Education
KCSE Kenya Certificate of Secondary Education
KNEC Kenya National Examination Council
KNUT Kenya National Union of Teachers
LS Life Skills
MDGs Millennium Development Goals
MOE Ministry Of Education
MOEST Ministry of Education Science and Technology
PE Physical Education
PPI Pastoral Programme Instruction
PTA Parents Teachers Association
PTR Pupil-Teacher Ratio
TSC Teachers Service Commission
UIS UNESCO Institute of Statistics
UNESCO United Nations Environmental Science and Cultural Organization
UPE Universal Primary Education
1
CHAPTER ONE
INTRODUCTION
1.1 Background of the Study
Teaching and learning has undergone certain negative influences due to the fact that
understaffing of teachers has been experienced in public primary schools in Kenya. A number of
researchers have clearly shown that some changes and developments brought on board by
understaffing have already thwarted the effectiveness of teaching and learning. Akunga (2012),
for example, observes heavy teaching workload common in schools brought about by
understaffing. He carried out his study in Masaba South District, Kisii County, Kenya. He also
observed that due to the increase in workload coupled with increased administrative work, many
head teachers do not hold staff meetings to discuss academic standards. This affects the learners
negatively because their academic performance is not evaluated by the staff to point out their
strengths and weaknesses. The increase in workload for the few available teachers, consequently,
leads to the failure to complete the given syllabus and in case it is finished, it would be a crash
work program (shallow teaching). It also dictates the teachers to concentrate mainly on the
examinable subjects of the syllabus hence ignoring the non-examinable subjects which also form
an important part of learning.
Simiyu (2012) carried out his study in Siboti Zone of Bumula District. He claimed that
understaffing is a major challenge to good results in teaching and learning. Duflo, Dupas and
Kremer (2015), observe that, due to teacher shortage, Parents Teachers Association (PTA)
teachers have been hired by school based committees and contract teachers by government to
help in teaching and learning. Zaniewski and Garza (2014), on the other hand, have pointed out
2
that there is a growing number of learners versus the reducing number of teachers. They claim
that understaffing is followed by overcrowded classes especially where enrolment increases and
classes cannot be divided due to the limited number of teachers available in a given school.
Consequently, learning is confronted with difficulties.
Moreover, Kenya National Union of Teachers (2013) has been in the forefront looking at
the influences that have befallen teaching and learning as a result of understaffing. It claims that
the few teachers in rural and marginalized areas are overworked and classrooms overcrowded.
As a result, this becomes a challenge in attaining effective teaching and learning. This study
therefore, sought to find out the influences that understaffing has led to and are thus a threat to
effective teaching and learning in Makueni sub-county, Makueni County, Kenya. Being one of
the hardship areas of the country, with many schools located in Arid and Semi-Arid Locations
(ASAL), where not many teachers would like working, Makueni sub-county requires such a
scientific study to look into the influence of the teaching staff gap on the teaching-learning
process (Nzoka, 2011).
1.2 The Trend of Understaffing of Teachers in Kenya
Lack of enough teachers in primary schools that are run by the government has become a
rampant problem which influences teaching and learning. According to Wamukuru (2011),
Kenyan schools have a high demand for teachers. This shows that those schools are understaffed.
That is, they are not provided with the adequate number of teachers per school, mainly by
government‟s failure to put an effort in meeting those demands and by poor distribution of the
already available teachers. The problem is aggravated by natural attrition (e.g. through death and
retirement) of the already serving teachers.

3
Statistically, the global picture of teaching staff in schools shows that there is a
predicament of understaffing which influences teaching and learning negatively in schools.
Consequently, this becomes a problem in achieving Universal Primary Education (UPE) as one
among the Sustainable Development Goals (UNESCO 2015). World organizations and World
Bank give a picture of acute shortage of primary school teachers. For instance, UNESCO
Institute of Statistics (2011), gave an annual projection of the required number of primary
teachers needed globally in 2009 to achieve UPE by 2015. This report revealed that, 54% of
developing countries had to recruit more teachers in the schools so that the number could match
the big numbers of the pupils.
In Kenya the problem of understaffing started a few years after independence. For
instance in 1973, a presidential decree made education free for the first four years of primary
education throughout the country. The immediate result was increase in pupils‟ enrolments, thus
initiating demand for more teachers (KENPRO, 2010). In 1997 the government stopped
employment of teachers for lack of enough funds to pay the workforce. What has been
happening over the years since that time is mere recruiting of teachers to replace those who left
the profession through natural attrition or resignation (Anwoga, 2012). The replacement exercise,
however, has never filled the gap with consideration to other factors causing teachers‟ shortage.
According to annual report by Teachers Service Commission (2015) the shortage of teachers was
placed at 85000 nationally. This is obviously because of increasing enrolment of pupils in both
primary and secondary schools and registration of new schools.
In the year 2003, the Minister of Education Science and Technology launched Free
Primary Education (FPE). The government catered for much of the cost for teaching and learning
4
materials. This implementation of FPE led to high enrolment of pupils in schools and the pupil-
teacher ratio as well had to rise up. According to Kikechi, Kisebe, Gitahi and Sindabi (2012), it
has also led to inadequate learning facilities and increased work load among teachers due to the
shortage of teaching staff. Otike and Kiruki (2011) concur with this that the greatest challenge of
the FPE and its objectives includes fighting illiteracy and achieving UPE is under-staffing.
In the year 2012, Kenya Institute for Public Policy Research and Analysis (KIPPRA,
2012), in a report from the Kenya Economic Report shows that understaffing in primary schools
has reached alarming levels. The reason is that, required pupil-teacher ratio (50:1, to the
maximum) and the streams per class and teacher ratio are not maintained. The requirement is 1
teacher per class for all the streams, for all classes 1 to 8. In the year 2007, the data by KIPPRA
showed proportional or uneven staffing of teachers with some schools having a maximum PTR
of 56:1 (KIPPRA, 2012). According to the Kenya National Bureau of Statistics (2012), facts and
figures on the trend of pupil-teacher ratios over the years were given as follows:1:50.4 in the
year 2008; 1:51.6 in 2009; 1:54.4 in 2010; and 1:56.6 in 2011 (KNBS, 2012). These figures
clearly indicates that the number of pupils continue to increase while the number of teachers
either remains constant or decreases because the government does not employ or replace teachers
effectively, among other factors which cause understaffing.
The above trend of events affecting staffing of Kenyan schools is a clear indication that
teaching and learning must have been affected or influenced in some way for lack of enough
teachers in schools. Teachers are very instrumental in education (Merfat, 2016). The researcher
in this study was therefore obliged to find out how this problem has influenced the teaching-
learning process in public primary schools, specifically in Makueni sub-county in Kenya.
5
1.3 Statement of the Problem
Understaffing of teachers influences teaching and learning in schools. This study sought
to find out how understaffing influences learning and teaching in government owned primary
schools in Makueni Sub County in Kenya. Over the years, there has been great demand for more
teachers in schools due to the natural attrition of the teachers including death and retirement and
also due to the increase in the enrolment of pupils (Kikechi et al, 2012). Since 1997, when the
government declared stoppage of employment of teachers on the basis of lack of finances, most
schools have remained understaffed to the present date (Anwoga, 2012). The crux of the problem
has been left to schools and to parents in need of professionally trained teachers to serve their
children.
It raises a question of whether the school curriculum is effectively implemented. It is
important to note that in the process of implementing the curriculum the teacher is a key person.
The implementation process here involves among other tasks, all the dimensions of the
curriculum: informal, formal and non-formal. This is the task of the teacher whose work is
beyond the four walls of the classroom. Merfat (2016) observes that the most important person in
the curriculum implementation process is the teacher because he has the knowledge, experiences
and competencies central to any curriculum development effort. All this work is geared towards
transforming the learner in all the possible faculties: skills, knowledge and attitudes. Thus, there
is a teaching staff gap in our schools which needs investigate on what happens in the event of
understaffing.
In a partial response to lack of enough teachers in schools, a numerous studies were
conducted to find out how this has affected and learning and teaching in schools. These studies
6
are basically concerned with the influence felt in academic performance and quality education.
However, there is a knowledge gap as seen in this study. For example, in his research study,
Kaloki (2012) observes that understaffing encourages high pupil-teacher ratio (PTR) (very many
pupils per one teacher) which in turn leads to large class sizes and consequently low academic
achievement. However, more research needs to be done to find out limited number of teachers
compared to the rising number of pupils has affected teaching and learning activities including
the teachers‟ class instruction work and class control. The lapse in the effectiveness of teaching
and learning is definitely caused be the decreased number of teachers as compared to the
elevation of pupils‟ enrolment taking place annually. Due to this fact, the researcher in the
current study was obliged to find out how the teaching-learning process was influenced by
understaffed state of our public primary schools. This means, much as we may be interested in
the performance of the learner in national examinations, it is not the only focus here. The holistic
approach to the learner is basic in the study.
Another study by Munguti (2009) clearly shows that understaffing increases the teachers‟
work load. That is, the teaching load (number of lesson periods per week) and other allied duties
which facilitate learning increase since few teachers are at work. Consequently, this leads to
overutilization of the teacher and failure to complete the syllabus. More research is, however,
needed to establish whether the heavy work load thwarts the teachers‟ efforts in activities like
regular class attendance of all lesson periods for all classes, lesson planning and giving and
marking of all assignments.
Researchers like Maithya and Akalas (2014) study in Masai Mara District found out that
understaffing influences academic performance and quality education. More research is,
7
however, needed to establish whether all aspects of curriculum are implemented to ensure
quality. Besides, the responses of the teachers, who implement the curriculum and are stake
holders in education on the ground, have not been gathered by any study to establish whether
understaffing is a challenge to quality education for effectiveness in teaching and learning.
While these researchers have dealt partially with the influence felt in academic
performance and quality education, this study was geared to finding out the influence brought on
board by the increasing number of pupils versus the reducing number of teachers in teaching and
learning; the influence felt in the teachers‟ class instruction work and management; the influence
felt in the teachers‟ work load; and the challenges that come along in teaching and learning in the
face of understaffing. The study also came up with the measures that can be put in place to
improve staffing of schools for effectiveness in teaching and learning.
1.4 Research Questions
The study was guided by the following research questions:
i. What is the distribution of the teaching staff in public primary schools in Makueni
sub- County?
ii. How does teachers‟ workload influence teaching and learning in public primary
schools in Makueni sub-county?
iii. What challenges are caused by understaffing to the teaching-learning process in
Makueni sub-county?
iv. What can be done to improve staffing in the public primary schools of Makueni sub-
County?
8
1.5 Significance of the Study
This research study sought to highlight and an awareness and the voice of the plight of
learners, the already serving teachers and the parents in any given school community. To the
learners, the influence of understaffing is an explanation of their poor performance and denial of
necessary skills and hence a message to educational authorities in order to staff schools
adequately. To the teachers, the study is enough message to open up the plight of their hectic
work due to the shortage of staff and give an account of their ineffectiveness e.g. uncompleted
syllabus. To the parents, the study aimed at expressing their grievances on the fate of their
children and on the extra burden they had of paying PTA teachers to assist in teaching and
learning.
The study also aimed at providing the way forward in solving the problem of
understaffing. This is significant to the following stakeholders in education: The Teachers
Service Commission (TSC), Ministry of Education (MOE), and KNUT. To the TSC as the
teachers‟ employer, it is enough message that its mission of “quality service for effective
teaching and learning” is flouted and needs action plan to provide adequate staffing. To MOE
officers and policy makers, it is a source of reference (a research work) on the challenges of
understaffing facing quality education and achievement of the national goals of education. This
would sensitize the government on the need for enough teachers for the implementation of the
curriculum for primary schools.
To the KNUT, the study also provides a source of reference in fighting against the plight
of the serving teachers. The union would have obtained the voice of the teacher on the ground
where the bulk of the work with few hands to do is heaped.
9
1.6 Scope and Delimitations
Although under-staffing is a problem in both secondary and primary schools, the study
was delimited to public primary schools in Makueni County. The researcher chose to carry out
the study in public primary schools because that is where basic education begins and whose
background opens the avenues to higher levels of learning. It was also with regard to the first
objective of primary education in Kenya. That is: acquiring communication skills, numeracy,
literacy and creativity (KIE, 2012). The study focused on the state of understaffing of teachers
particularly in Makueni Sub County where most of the educational zones are classified as
hardship areas (Nzoka 2011). This poses a challenge to retain teachers in such areas.
A considerable number of zones in Makueni sub-county within Makueni County were
chosen and from each zone a suitable number of schools were chosen. In order to give meaning
to this study schools were categorized into: ASAL (Arid and Semi-Arid Locations) schools, rural
schools and town schools. Private schools in the sub county were excluded from this study,
whether in town, rural or in arid and semi-arid locations.
Participants included in the study were as follows: TSC teachers, head teachers, heads of
curriculum (HOC) in the primary schools, the staffing officer and the DEO in the sub county.
In as far as the total number of the teachers in a given school was concerned; the state of
understaffing was determined by the number of TSC teachers excluding the PTA teachers. It
should be noted that not all schools were understaffed. In actual fact, a number of urban schools
were overstaffed. Thus the researcher‟s task was to highlight the differences in the staffing of
these schools. The teacher‟s amount of work which was determined by teachers‟ numbers in a
school covered both examinable and non-examinable subjects. It was a regulation from the MOE
10
that even non-examinable subjects are part of the syllabus and must be slotted in the block
timetable.
The study comprised of four research questions. These research questions focused on: the
influence of distribution of teachers on learning and teaching in the schools; influence of high
workload on pedagogy; the challenges of understaffing on teaching and learning; and the
measures that can be taken to improve the situation.
1.7 Theoretical Framework
This research used the staffing theory which was derived from the ideas of Barker and
Gump (1964). The theory holds that in a big school the pupils do not participate satisfactorily in
activities as is the case of small schools which offer more opportunities for participation. Barker
and Gump (1964), were interested in the relationship between school size and the number of
extra curriculum activities done and reported by a graduating class. They did this by examining
the books that had recorded the activities that the graduating class had participated in the four
years of their high school education. They found out that as school size increased, the number of
activities that the students participated in went down (Barker and Gump, 1964). This implies that
in a big school there are many students making it difficult to apply individual attention approach
when attending to the students. This situation arises because the students-teachers ration is
skewed towards the students‟ side. In this case too much work or activities against an individual
(for example in a case of an understaffed school) may result in the individual not accomplishing
much with regard to the requirements (Forsyth, 2010).
11
1.7.1 Strengths of the Theory
The Staffing Theory has been examined by educationists and it has been considered to be
a strong theory because it helps to balance between the various categories involved such as the
number of teachers and the students that the environment provides for (Wicker, 1968). This is
based on the real situation in schools where the number of teachers Vis a Vis that of the students
determines the teaching and learning process. It has been argued that teaching is affected by a
huge number of students because when the number of students outweighs that of the teachers,
teachers are not able to give students individual attention and also marking of students‟
assignment becomes difficult (Munguti, 2009). The teacher is also not able to prepare for the
lessons to teach because more time will be spent by the teacher marking assignment than
preparing to teach in class.
1.7.2 The Weaknesses of the Theory
The theory has got its inherent weaknesses. The theory does not put into consideration
that teachers can teach by use of media where one teacher can reach to more students. For
instance, the use of projectors, televisions or radio (Wamalwa, 2014). Here the teachers can get
more students and the students‟ needs will be addressed more effectively. The theory also
assumes that learning only takes place when a teacher is teaching. This assertion is not
necessarily correct because students can learn on their own through discovery methods where
minimal supervision by the teacher is needed. However, this study takes care of that by showing
how instrumental the teacher is to the learner through interaction for effective teaching and
learning.
12
1.7.3 Application and Justification of the Theory
The theory was relevant to this study in various ways as follows: First, poor teacher
distribution is one of the causes of understaffing and overstaffing in schools. This will cause
under-utilized teachers ( teachers with little work) in the case of overstaffing and other teachers
over-utilized (overworked yet accomplishing little) in the case of understaffing. In this regard,
the theory can be applied in ensuring adequate staffing in our schools. Secondly, the theory puts
it that as school size increases, the student participation in activities goes down. This is possible
in understaffed schools because there are no enough teachers to engage the many pupils
effectively in learning activities. Moreover, the few teachers available in schools against large
class sizes dictates the teachers to limit the number of assignments and other learning activities
to the pupils since it takes a lot of time to mark and supervise such work.
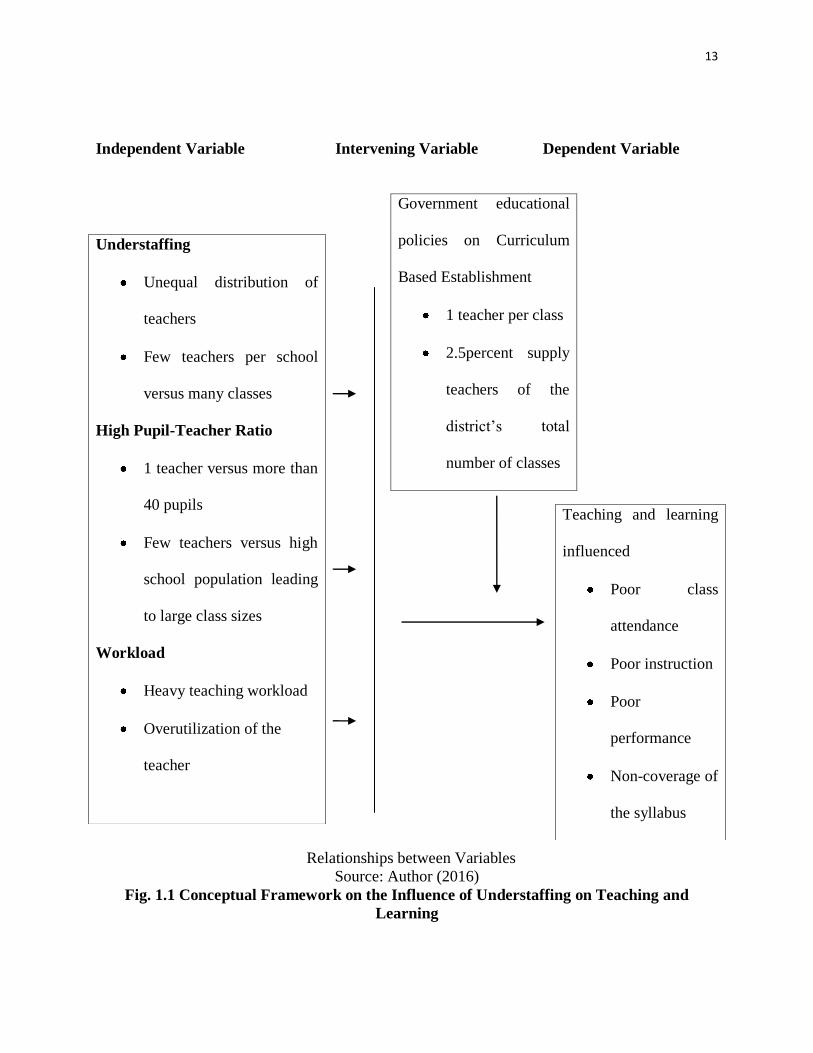
1.8 Conceptual Framework
Orodho (2009) describes conceptual framework a model of presentation whereby the
researcher presents the similarity of the variables in a study. The relationship may be shown
graphically or diagrammatically through independent and dependent variables. Figure 1.1
illustrates this relationship.
13
Independent Variable Intervening Variable Dependent Variable
Relationships between Variables
Source: Author (2016)
Fig. 1.1 Conceptual Framework on the Influence of Understaffing on Teaching and
Learning
Government educational
policies on Curriculum
Based Establishment
1 teacher per class
2.5percent supply
teachers of the
district‟s total
number of classes
Understaffing
Unequal distribution of
teachers
Few teachers per school
versus many classes
High Pupil-Teacher Ratio
1 teacher versus more than
40 pupils
Few teachers versus high
school population leading
to large class sizes
Workload
Heavy teaching workload
Overutilization of the
teacher
Teaching and learning
influenced
Poor class
attendance
Poor instruction
Poor
performance
Non-coverage of
the syllabus
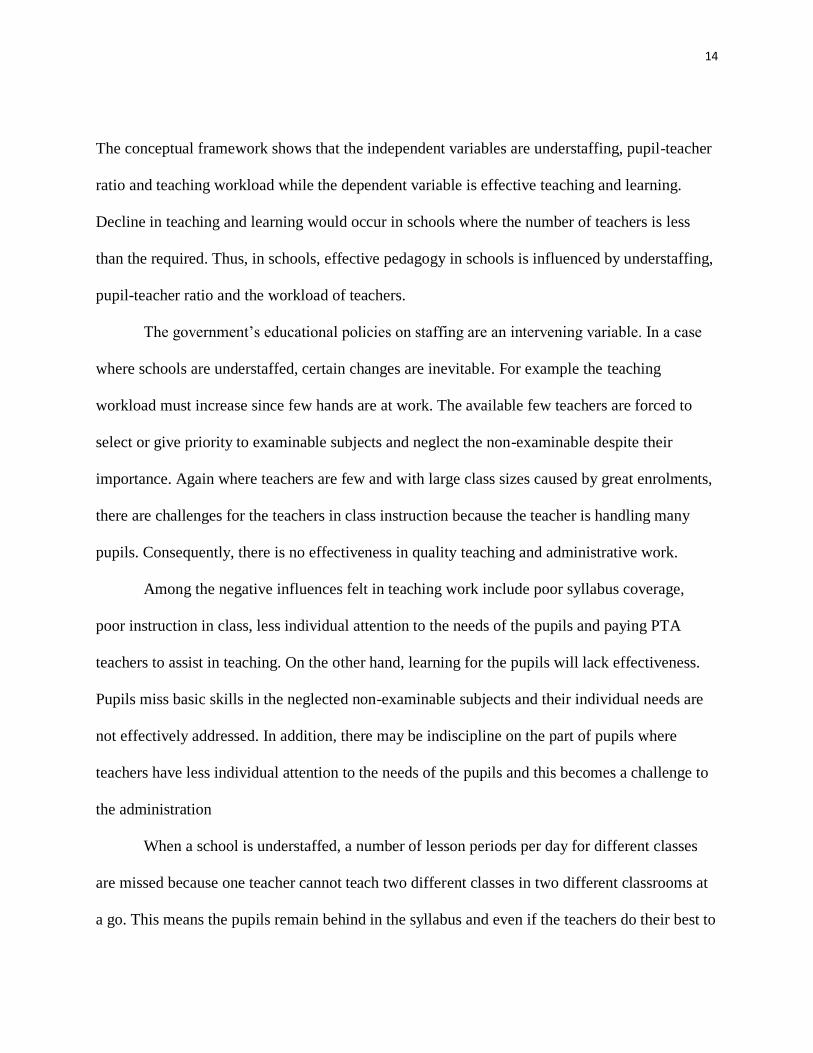
14
The conceptual framework shows that the independent variables are understaffing, pupil-teacher
ratio and teaching workload while the dependent variable is effective teaching and learning.
Decline in teaching and learning would occur in schools where the number of teachers is less
than the required. Thus, in schools, effective pedagogy in schools is influenced by understaffing,
pupil-teacher ratio and the workload of teachers.
The government‟s educational policies on staffing are an intervening variable. In a case
where schools are understaffed, certain changes are inevitable. For example the teaching
workload must increase since few hands are at work. The available few teachers are forced to
select or give priority to examinable subjects and neglect the non-examinable despite their
importance. Again where teachers are few and with large class sizes caused by great enrolments,
there are challenges for the teachers in class instruction because the teacher is handling many
pupils. Consequently, there is no effectiveness in quality teaching and administrative work.
Among the negative influences felt in teaching work include poor syllabus coverage,
poor instruction in class, less individual attention to the needs of the pupils and paying PTA
teachers to assist in teaching. On the other hand, learning for the pupils will lack effectiveness.
Pupils miss basic skills in the neglected non-examinable subjects and their individual needs are
not effectively addressed. In addition, there may be indiscipline on the part of pupils where
teachers have less individual attention to the needs of the pupils and this becomes a challenge to
the administration
When a school is understaffed, a number of lesson periods per day for different classes
are missed because one teacher cannot teach two different classes in two different classrooms at
a go. This means the pupils remain behind in the syllabus and even if the teachers do their best to
15
cover it, they will teach content hurriedly and shallowly. This influences the quality pedagogy
experienced.
In addition to this, when the number of lessons periods per week per teacher increase
more than the recommended, the teacher is overworked and as a result he cannot deliver the
lessons effectively. This pressure of workload influences him to combine some classes, assign
others instead of teaching and delays the marking of assignments. In some cases the instructor
may not even give assignments reason being heavy teaching workload.
Moreover, the number of pupils compared to the number of teachers is a factor to
consider. If the number of pupils in a class is above 40 as determined by the number of pupils
enrolled in the school, instruction in class is affected and class control becomes difficult. In
relation to this, the teacher seldom meets all the individual needs of the pupils as required.
Consequently, this influences learning and teaching..
1.9 Operational Definition of Terms
ASAL Schools- schools in remote areas; locations arid as well as semi-arid; not easily accessible
or with poor means of transport
Attrition- The state of fading away or disappearing of teachers through natural causes hence the
understaffed state of public schools.
Influence- The power or potential (of understaffing of teachers) to bring up some changes in
pedagogy
Over-staffing- It is providing more members of teaching staff than it is necessary. An
overstaffed school has a larger number of teachers than the required ones with regard to the
number of classes and the number of pupils.

16
Public Primary Schools- refers to institutions for basic education administered by the
government of Kenya and in which educational policies and regulations are implemented by
government employees (teachers).
Retention-is the State of being retained. This refers to the ability of TSC to retain teachers in the
respective areas of deployment and staffing despite the challenges involved.
Rural Schools- schools away from towns but which are accessible by good means of transport.
Teaching and Learning- refers to both the activities of the teacher and the learner in promoting
knowledge and understanding in the process of implementing the curriculum.
Teachers- curriculum implementers and in particular TSC teaching staff in public primary
schools
Town Schools- schools in towns or near towns
Under-staffing- Providing insufficient number of teachers in public primary schools. An
understaffed school does not have the required number of teachers with regard to the number of
classes and the number of pupils.
17
CHAPTER TWO
REVIEW OF RELATED LITERATURE
2.1 Introduction
This chapter sought to review related research studies on the influence of understaffing
on teaching and learning. The empirical studies reviewed here, address the four research
questions mentioned as follows: influence of teacher distribution on teaching and learning;
influence of teachers‟ workload on teaching and learning; challenges of understaffing to teaching
and learning; and the measures that can be taken to improve staffing in public primary schools.
The chapter concludes with a summary of the reviewed studies and the gaps that this study
intended to fill. Together with this, it is necessary at this point to highlight the government‟s
educational policies that exist on staffing of primary schools through the TSC before embark 0n
the literature reviewed. This would enable us to evaluate the nature and magnitude of the said
gap of teachers.
2.2 The Government’s Educational Policies on Staffing of Primary Schools
According to TSC (2012), teacher management functions are done by the TSC. It is the
responsibility of the commission to manage the quality of education, the demand and supply of
teachers and advise the Ministry of Education Science and Technology (MOEST) accordingly.
The TSC staffing policies provide that there should be one teacher per class plus 2.5 percent of
the total number of classes in a district. Under the new constitution of 2010, the TSC is mandated
to register and deploy trained teachers. It assigns duties to employed teachers in any institution or
public school; promotes and transfers teachers; and establishes and maintains a teachers Service
adequate to the tertiary institutions in Kenya and the needs of public schools (TSC Act 2012).
18
The TSC, in its mandate and policies, is however, confronted with challenges in the
staffing of schools. For instance, the distribution of teachers in all public schools in the 47
counties of Kenya is not fair enough to the demands and needs of schools. According to MOEST
(2014), The schools recorded 317,477 number of teachers. If these, 76.2% were in public schools
that sums up to 241,917 teachers in public schools. The total number of classrooms in primary
schools that are public was recorded in 2014 was 230,377. While the total figure of teachers was
enough for the number of classes, the findings of the MOEST (2014), however, show that the
distribution of teachers across counties is unfair with regard to the number of classes in some of
the counties.
A similar challenge to the TSC staffing policies arises when it comes to the ratio of
teacher to pupils because if the pupils are large in numbers in a given school, the more the
demands from the teaching staff. In the year 2014 it was recorded at 41.5 for public schools. This
is and was fair compared to the international standards (40). However, according to MOEST
(2014) there exists regional disparities in distribution of teachers with 27 counties lying below
the national average while 20 lie above the national average. For instance the pupil-teacher ratio
at Bugoma county was 57.7; Busia 51.2; Garissa 57.5; Kilifi 49.5; Mandela 79.4; Narok 55.7;
and Turkana 101.3, (MOEST, 2014). Clearly, this shows a big shortfall in the number of
teaching staff and in their distribution in the counties.
In addition to the above, it is eminent to say that, that schools with large population
constitute to large class sizes. In such a case then it is possible to have a class of as many as 60
pupils in large population schools and another with as few as 10 pupils in low population
schools. For instance, while it is a policy to have one teacher per class, some public schools in
19
ASAL areas may have a population of less than 50 pupils distributed among 8 classes. Such a
school would by policy deserve to have not less than 8 teachers the same way a school of not less
than 300 pupils distributed among 8 classes would deserve despite the demands of the densely
populated schools. According to Orodho, Waweru and Nthinguri (2013) the shortage of teachers
and the big number of pupils in class could attribute to the poor quality of education by straining
teacher in teaching and learning processes.
This being the situation and trend over the years, it shows the Pupil-Teacher Ratio (PTR)
is not consistent or maintained and the staffing policy is obliged to improve with regard to the
numbers and the localities. The staffing policy also assumes that all teachers including head
teachers will undertake full teaching load not considering the managerial tasks and
administrative work which takes most of the head teachers' and deputy head teachers' time for
class work. The TSC should therefore repackage itself on staffing towards effective realization of
its motto: Quality service for effective teaching - in our schools.
2.3 Review of Empirical Studies According to the Research Questions
2.3.1 Influence of Teacher Distribution on Teaching and Learning
Evidence from MOEST (2014), shows that the dissemination of teachers across the
various areas in Kenya is characterized of disparities with some schools in the counties having
more than they need or even bigger than what the staffing policies require whereas others have
less as per the policies and needs in those schools. However, even if teachers were to be
transferred from the overstaffed schools to offset the situation in the understaffed schools, the
problem of understaffing would still remain because of high enrolments which translate to high
pupil-teacher ratio (KNBS, 2012).

20
High pupil-teacher ratio is a characteristic of understaffing. Teaching and learning may
be influenced negatively in schools with large numbers of pupils against few teachers. Studies
indicated that pupils‟ performance in academics is affected negatively in schools where there are
no enough teachers and the available teachers are handling large class sizes. For instance, Kaloki
(2012) carried out a study on pupil-teacher ratio (PTR) and its impact on pupils‟ performance in
Machakos County. The study targeted the 78 public primary schools in the Division, in which a
total of 24 schools were sampled for the study. Descriptive survey design was used as the
research design for the study. Questionnaires were used in collecting data for the study. The
questionnaires were administered to all the Head teachers and the teachers of the sampled
schools, the County Staffing Officer, the Examination Officer and the Quality Assurance and
Standards Officer.
The findings of the study revealed that PTR significantly influences performance of
pupils in national examinations. The study recommended to all Education sector stakeholders to
pay adequate attention to PTR since it affects performance of pupils in Primary Schools. It
recommended to the government to employ more teachers to lower PTR and ease teachers‟
work. Kaloki‟s study, however, is only interested in the impact felt in national examinations. It
does not consider the impact high PTR poses to the teachers‟ instruction work in class. For
example the challenge of congestion in classes; giving and marking assignments and lack of
individual attention to slow learners. This was a gap that this study would fill.
There are other studies considered here on the aspect of pupil-teacher ratio in schools.
They include Kanyiri (2009), Munguti (2009) and Kikechi et al (2012). They are concerned with
the effect of high PTR (many pupils versus few teachers) to quality education in our schools.
21
Among the observations they make include the facts that, in a case of high PTR, there is limited
individual attention to pupils, poor quality education, difficulties in management and lack of
effective teaching.
For instance, Kanyiri‟s (2009) study in Kajiado, Kenya, investigated how the number of
pupils in class affected teaching and learning. Survey design was used to collect data from a
wide scope and whereby the data collected assisted in generalization. Class teachers were the
majority of those who participated in the study (93 percent). Only 12 (7 percent) were not. Those
who indicated that they were class teachers were asked to give the number of pupils in their
respective classes to determine the PTR and the results were presented in a histograph, the
number of pupils corresponding to a certain percentage. Majority, 85 (49.7 percent) of teachers
in the study, pointed out that pupils were between 21-40 pupils. This could show that the number
of pupils per class was not very high and was within the recommended teacher-pupil ratio.
However, in some cases the pupils in number was above 60. This could be cases of some schools
where the enrolment was high especially after the FPE was introduced and also implementation
of feeding programme.
Kanyiri observed that some teachers could hold classes of up to 70 pupils, and from the
teachers' responses, this meant less individual attention to pupils. She adds that this is
accompanied by lack of motivation for teachers who are overworked and underpaid. This study
further investigated how high PTR as a characteristic of understaffing influences teaching and
learning in schools. Kikechi et al (2012) have similar observation. From their study they
highlight that a major reason for the poor performance and deteriorating quality of education
which characterize primary education in Africa is high or very low pupil-teacher ratios. Many
22
policy oriented interventions and research studies consider a 40:1 ratio reasonable in developing
countries.
The gap that can be deduced in Kanyiri‟s study is on what happens to pedagogy in a case
in which the number of teachers in a school exceeds the recommended one for a given number of
pupils (that is few teachers versus very many pupils). His study is rather limited to the attention
given to the pupils and seldom considers the impact of the high PTR to the teachers‟ activities. It
was necessary to investigate on what the teacher does not do or fails to do in the face of high
PTR as a characteristic of understaffing. This gap was addressed by this study by enquiring from
the teachers the challenges they faced when the number of pupils they handled was very large
against few teachers either in teaching or extracurricular activities. World Bank Group (2009)
financed primary education projects are usually designed with an average pupil-teacher ratio of
approximately 41:1. The authors also argue that where a teacher has to handle a very large
number of students there could be difficulties in classroom management and effective teaching.
Large class sizes are common in schools where the pupils are very many and the teachers
are quite few because they cannot divide a certain class into two or three streams and the classes
fail to be attended as required. Consequently the large class remains an issue to the teacher on
matters of class control and class instruction. On class sizes, Bascia (2010) was called by
Canadian Education Ministry to conduct a field research and analyze statistical data on how it
influences learning. His target population involved 8 school districts, 24 schools and 84
classrooms. Classroom observations were undertaken at each primary grade level. All teachers
were surveyed in each school. Parent surveys included representation from every school district
in Ontario. According to his findings, nearly more than half of the primary teachers pointed out
23
that the quality of their engagement with students had improved due to the smaller class size and
two-thirds said their students were more engaged in learning than before class size reduction.
Many parents of children enrolled in smaller classes reported that their children were learning
more were more comfortable at school.
The gap that unfolds in Bascia‟s study is that he does not come up with the challenges
that few teachers in a school face in handling large class sizes. This gap was addressed by this
study by looking at the challenges the teacher faces in teaching a large class size as a
characteristic of understaffing and the additional duties (double roles) besides teaching that come
along in handling the excessive needs of the pupils. It also enquired whether it is the number of
teachers who have shared work or the class size that determines effective teaching and learning.
2.3.2 Influence of Teacher’s Workload on Teaching and Learning
In schools where teachers are overwhelmed by heavy workload due to understaffing, the
teaching-learning process is affected. Bukhala (2009) handled the question of teaching load per
week in technical institutions in the then Western Province of Kenya to verify whether there is a
shortage in staffing. He analyzed his findings in a three column table notably: load per week,
frequency and percentage. From his findings, no teacher had a teaching load less than 10 hours
per week. 21.7 of the teachers in percent had 10 to less than 15 hours; 47.8 percent had 15 to less
than 20 hours; and 30.4 of the teachers in percent had more than 20 hours of teaching per week.
The next move in Bukhala's data was to ask the teachers to rate their workload and the data
collected was as follows: 34.8 percent of the teachers felt that their workload was heavy while
62.2 percent of them felt that their workload per week was moderate. Not even one of the
teachers experienced light workload per week, thus shortage in staff meant increase in work load
24
for the available teachers. Consequently, the increase in workload influences effectiveness in
teaching and learning.
The gap that can be deduced from Bukhala‟s study is that he did not come up with the
challenges that are caused by increased teaching load for teachers due to understaffing. This gap
was addressed by this study by enquiring about whether the syllabus was completed in the
schools in the face of understaffing and heavy workload; whether teachers were able to attend all
classes regularly; and whether they could prepare each of their professional records e.g. schemes
of work and lesson plans,
Another study by Wakoli (2016) was done to examine the effects of work load on
teachers‟ performance. She carried out the study in ten primary schools in Kanduyi Division of
Bugoma District. She had a sample of 24 head teachers, deputy head teachers and senior teachers
there were76 teachers and three education officers. Purposive and stratified sampling technique
was applied. Descriptive research method was used and descriptive statistics was applied to
analyse and interpret e data. From her study findings, it was discovered that the primary school
teachers indeed are overloaded as majority of them expressed. They shared many subjects among
few teachers per school with some of them teaching four subjects since there is no specialization.
The teachers also agreed that they teach overcrowded classes and the subsequent excessive
marking of pupils‟ work. Wakoli observes that the effect of this overloaded teacher is poor
performance on the part of the learners because the teacher is over utilized; does not have enough
time for adequate preparation to teach the pupils and individual pupil‟s problems are not catered
for.
25
In addition to the above, Munguti‟s (2009) study shows that where schools are
understaffed, teachers are over-utilized because of heavy workload. On the contrary, where
schools are overstaffed, teachers are under-utilized since the workload is light. To illustrate this,
he gave a distribution of teachers' number of periods taught per week. He was interested in
teacher utilization in secondary school education. He used frequencies and percentages to show
the distribution of a sample of 131 teachers from various schools. He established that teachers
with 28 and above periods per week had the highest percentage (32.1). The teachers with 12 and
below periods per week were the least (2.3 percent). The majority had 19-24 and above periods.
That is 87 percent, while the rest had 16-18 and below; that is only 13 percent of the teachers.
The distribution indicated that some teachers were under-utilized when others were over-utilized.
He recommends that there should not be shortage of teachers when others are under-utilized.
Both Wakoli‟s (2016) and Munguti‟s (2009) studies suggestively shows that great
variations in staffing of schools lead to great variations in teacher utilization with regard to the
teaching workload. The two studies, however, do not show how the over utilization of the
teacher (in the case of understaffing) affects both teaching and learning activities. To address this
gap, this study enquired from the teachers what happened to their instruction work as part of
teaching and learning when they were overwhelmed by heavy workload. For example, whether
they give and mark assignments frequently for all classes without fail and whether they teach
non-examinable subjects as required by the syllabus.
Another point worth noting is that Kanyiri (2009), Munguti (2009) and Kikechi et al
(2012) viewed heavy work load as taxing and demoralizing hence lowering the teachers‟ morale
towards the quality instruction work. Teachers had to develop 8 lessons in a day, meaning they
26
had no free lesson to check the pupils' books during school working time. They also agreed that
they could not give adequate work to the learners because they had no time to check the pupils
work before the subsequent lesson.
2.3.3 Challenges of Understaffing to the Teaching-Learning Process
Teaching and learning activities are confronted by certain challenges caused by shortage
of teachers in a given school. This depends largely on what constitutes the curriculum and how
the work load is shared among the available teachers. The state of understaffed schools in Kenya
subjects teaching and learning to many challenges including poor academic performance;
ineffectiveness in curriculum implementation; encouraging selective teaching of subjects; poor
quality education; less attention to individual pupil needs; poor class instruction; hiring of PTA
teachers; and increase in administrative work.
On academic performance, Munguti (2009) carried out a study to determine whether
there was an outstanding comparison of teachers‟ staffing level in schools and the mean KCSE
scores attained by students. To do so he categorized groups of schools were as follows: -
adequately staffed, overstaffed and understaffed. The standard deviations, mean scores as well as
the standard errors of all groups of schools under study were calculated. He concluded that there
was no sufficient reason to believe that there was an outstanding comparison between secondary
school teachers' staffing level and their students' outcome in KCSE. The teachers' staffing level
did not influence students' performance.
In this regard, one limitation of Munguti‟s (2009) study is that he is concerned with the
end of a four year course examination (KCSE) which is once and for all test. On the contrary, the
results of the learners‟ Continuous Assessment Tests (CATS) and assignments over the years can
27
give a more cumulative and consolidated picture of the learners‟ performance levels. Again his
study uses quantitative analysis of the data obtained. The researcher in this study used qualitative
method to pursue the teachers responses based on learners‟ progressive records.
Another study on the availability and influence of teaching staff on academic
performance is done by Reche, Bundi, Riungu and Mbugua (2012). The study aimed at finding
out factors that attributed to poor academic performance in KCSE examination in public owned
primary schools in Mwimbi Division, Maara District in Kenya. The design used was descriptive
survey design and the sample included 6 head teachers, 51 teachers and 146 standard eight pupils
who took part in the study. It was from the findings of the study that it was indicated that pupils
cannot do well in terms of performance in their primary national examination due to lack of
enough staff. That is, understaffing in the schools is a challenge to quality academic performance
for the learners. This means that schools with enough teachers would probably perform better
than the understaffed schools.
In his contribution to the necessity of enough teachers in schools, Gurro (2010) in his
study that took place in Marsabit Central District to find out if there was a comparison between
the number of teaching staff and pupils' academic performance in their final examinations. His
data included students' and teachers' responses to factors causing poor academic performance. He
used a four point likert scale: SA (strongly agree), A (agree), D (disagree) and SD (strongly
disagree). The study established that teachers strongly agreed that poor performance in academic
is caused by teacher shortage in the school. Thus his study shows that the fact of teacher shortage
in schools was a factor responsible for poor academic performance. This study further
28
complemented Gurro‟s study by picking responses from both understaffed and overstaffed
schools on performance and draw conclusions on the influence of understaffing.
It should be noted from the above studies that understaffing holds some water in
influencing pedagogy in our schools in terms of academic performance. Both Reche et al (2012)
and Gurro (2010) agree that understaffing influences the pupil‟s performance negatively.
Munguti, however, presents a contrasting picture that there is no sufficient reason to believe that
the number of teachers influences pupils‟ performance. It is from this contrast that this study
found out further influences of understaffing on the effectiveness of teaching and learning.
Curriculum implementation in schools is also a challenge in a case where schools are
understaffed. Orodho, Waweru, Ndichu and Nthinguri (2013) carried a study that focused on
techniques used in coping with the inadequacies of preventing effective implementation of
curriculum primary education in Kenya. It was based on constructivist theory and a sample of
205 of both secondary and primary school teachers were selected. The study employed mixed
method in collecting and analyzing data. The key challenges mentioned by majority of teachers
especially in Kenyan geographical regions with shortages of teachers, included: inadequate
teaching methods (25.37%) and high teaching load (23.41%).
The study found out that, areas with shortages of teachers lagged behind in curriculum
implementation leading to poor academic performance. Teachers in such areas lacked motivation
leading to little attention given to the learner. That is, there was hardly room for modern usage of
instructional techniques which require individualized teaching. There was, however, the research
gap on the influence of individualized teaching on academic achievement with consideration to
the teacher numbers in a given school.
29
Selective teaching of subjects is also a threat to effective pedagogy. Selective teaching is
whereby emphasis in teaching is placed on examinable subjects while the non-examinable are
given little attention. With the pressure to complete the workload for examinable subjects, much
of or all the work for non-examinable subjects is left undone especially in understaffed schools.
This becomes a challenge or a drawback to effective teaching and learning. The available
teachers spend much of the allocated time for Physical Education (PE), Creative Arts (CA), Life
Skills (LS) and Pastoral Program Instruction (PPI), either for revision or for a step further in the
completion of the syllabus for examinable subjects only. A study by Boit, Njoki and Chang‟ach
(2012) investigated the influence of examinations on curriculum implementation by collecting
data and analyzing perceptions from teachers and students from various secondary schools in
Bomet District. The Theoretical framework for the study was adopted from Wiggins and McTi
ghe (1999) backward design model which involves identifying the aims and goals of the school
program before decision making. The study revealed that examinations have had a negative
effect on curriculum implementation because teachers were selective in the subject and topic to
teach in preparing for the examinations rather than what the syllabus prescribes. For instance the
researchers found out that the un-examinable subjects like Practical Education (PE) were not
taught. Instead teachers used the lesson periods for such subjects to cover the syllabus or revise
for examinable subjects. Integration of life skills in certain subjects was also ignored. This is
selective teaching where, in a situation of lack of enough teaching staff, the teacher feels he or
she is under pressure of the work load for examinable subjects only. However, this is contrary to
educational goals specified in the school curriculum.
30
Another important aspect to be considered that is related to the state of understaffed
schools is education quality in primary schools that are public. Teaching work load is obviously
heavy where a school is understaffed plus the pressure of handling numerous responsibilities of
overcrowded classrooms. In the event of struggling to ensure children obtain the required skills
in school, teachers will at times overlook some teaching and learning activities and others may
be done shallowly, that is under-teaching. According to a research report by Antoninis (posted
25th
Jan 2014) in Malawi, it was noted that children as old as 9 and 10 were unable to read and
write their names due to shortage of teachers when they should be able to do it clearly. Less than
half of children knew how to read and count and in addition, the youth literacy rate hardly
improved over a decade in the country, rising from 72% in 2000 to 77% in 2010. This picture
sensitizes us on the danger of poor quality education that could be linked to the increasing gap of
teaching staff in schools. The study by Antoninis (2014), however, does not involve responses
from educational stakeholders; for example, teachers and educational officers, on their views on
the quality of education delivered in the face of understaffing. This was a task of this study.
To add on this, teachers‟ activities are part and parcel of what contributes to quality
education. Quality teaching in our public schools is challenged. With the increase of enrolments,
large classes and shortage of teaching staff, teachers do not to give adequate assignments to the
pupils and individual attention to pupils‟ needs is either minimal or lacking (Gachichio &
Gachoka, 2010). Moreover, Kikechi et al (2012) concurs with this challenge that quality
education is compromised and in particular where few tests are administered to the pupils than
the required number. As a result teaching and learning are negatively affected. There is more to
be desired, however, especially from the responses of education officers, e.g. quality assurance
31
officers, who sometimes inspect and assess teachers‟ work in class. The present study involved
them.
Another study on quality education done by Maithya and Akalas (2014) pursued to find
out the effects of teacher recruitment and utilization on quality education. Causal comparative
design was used. The study targeted 180 teachers, 30 head teachers, TSC and KNEC officials.
The authors made use of interview guide, questionnaires and a document analysis guide.
Analysis of data was done using means, standard deviations, frequencies, percentages, analysis
of variance, t-test regression analysis and content analysis. The study revealed that majority of
the schools was understaffed. According to the findings of these authors, there was imbalance in
the staffing levels of the schools resulting to underutilization of some teachers while others were
over utilized. This could not guarantee high quality education.
Related to the above is that the teacher‟s ability to identify individual differences and
needs of pupils in his class is challenged. This is because in understaffed schools, teachers are
overwhelmed by heavy workload and numerous pupils‟ needs. We have pupils with special
needs, for example slow learners who need special attention and concerted efforts to bring them
up to a relative level with the other learners. According to Omondi (2011), teachers are not able
to give individual attention to the pupils especially the slow learners due to the increasing
enrolments and large class sizes. Munguti (2009) also observes that in a case of understaffing
with high PTR the frequency of monitoring individual student progress may reduce. This study
further found out, from teachers‟ responses, whether they meet all requirements of their teaching
load and the needs of the pupils.
32
The preparation of the instructional tools of the teacher is also challenged by
understaffing in the teaching- learning process. Studies have shown that the teachers' tools that
facilitate instruction are not effectively performed, hence a negative influence on effective
teaching and learning. They include: lesson plans, working schemes, progressive records, class
attendance and records of work records covered among others. Reche et al (2012) observes that
the frequency of prior preparation of lesson plans; frequency of head teachers checking the
teachers lesson plans; and also the frequency of checking prepared schemes of work are very
minimal. Lesson preparation, for example, is an issue. While teachers do develop and use lesson
plans to carry out their teaching, many teachers mention that due to high pupil-teacher ratio and
expanding class sizes, it is impractical to prepare lessons daily (Omondi, 2011). Although it is
essential to have these documents ready for effective teaching and learning, they are not
satisfactorily prepared due to heavy teaching workload heaped upon the teacher through lack of
enough teaching staff.
Another challenge is the hiring of PTA teachers in schools. In public schools where there
are no enough teachers as recommended by Curriculum Based Establishment (CBE), contract
teachers are in most cases employed through Parents Teachers Association (PTA). This system is
common among many governments in developing countries particularly those in sub-Saharan
Africa. This has been an attempt to respond to the urgent need for more teachers arising from
increased enrolments (Education For All Global Monitoring Report (EFA), 2015). Even though
this arrangement addresses shortages of teachers, there are challenges associated to it. Such
challenges include the burden for the parents in paying extra money to pay these teachers. This
affects adequate facilitation of learning since not all parents can afford all the necessary materials
33
for learning; for example, uniform, books, and pens, development fees, etc. Thus, Education
quality was affected. According to EFA (2015), where contract teachers are hired, the education
quality is negatively affected because they receive limited professional pre-service training
except where parental or community involvement is strong in monitoring and training.
In addition to the above challenges there is increase in other responsibilities and the
administrative work for the teachers. Other responsibilities may include non-teaching duties like
supervision of extra-curricular activities which become more hectic in the event of high
enrolments. In her study, Wakoli (2016) discovered that all teachers were assigned different
responsibilities apart from the normal class work, extra-curricular activities like sports, clubs etc.
Majority of them to a greater extent co-operated in pupils‟ discipline.
On the part of head teachers as well as their deputy head teachers, administrative or office
work is at times challenging particularly when it collides with class attendance. The TSC does
not have any provision to exempt them from class work especially with the existing situation of
understaffing of teachers. Munguti (2009) observes that in a case where teachers (especially head
teachers) are overwhelmed by workload as a result of understaffing, there may be less attention
to parents, that is, poor teacher-parent relationship. This results in lack of unity in guiding the
pupils and it may consequently lead to indiscipline among the pupils. Kikechi et al (2012)
confirms that with the implementation of FPE, cases of indiscipline among pupils are especially
where overage children and street children go back to complete their primary education. In this
study, the researcher enquired to identify the challenges that come up in teaching and learning as
a result of increased administrative tasks caused by understaffing, especially for head teachers
and deputies, in relation to their class attendance.
34
2.3.4 Measures of Improving Staffing
The challenges of understaffing are a wake-up call especially to top educational
stakeholders (notably, the MOE, the TSC and the KNUT among others) to work towards
improving staffing in our schools. Among the measures that ought to be used to improve staffing
include enough staffing of the schools. For instance, since there is no equity in the recruitment
and deployment of teachers to diverse locations, the TSC should identify the understaffed
schools especially in the ASAL areas and staff them adequately. A study carried out by Reche et
al (2012), in Maara District, Tharaka Nithi County in Kenya, recommended that one of the ways
of doing away with poor performance in public primary schools is employing more teachers to
reduce the heavy workload that the serving teachers already have. On the same note, Linda and
Ducommum (extracted October 10, 2014) observe that in high need fields and locations teacher
supply and quality should be increased. The present study did not major on poor academic
performance as a base for more teachers as is the case above. It got the perspective of the teacher
himself in the field on the need.
The distribution of teachers across counties in Kenya upon the event of recruitment is
also an improvement to consider for adequate staffing of our schools. Aloo, Simatwa and
Nyangori (2011) investigated into the impact of the recruitment policy of school based teachers
on deployment and reservation of teachers in public secondary schools of Nyando district in
Kenya. A descriptive survey design was used. The study also used stratified sampling technique
to choose 26 head teachers from 36 hardship labeled schools as well as five head teachers from
ten non-hard ship schools. Thus a sample of thirty one head teachers was used in the study. In
addition to this, saturated sampling was used to select the then provincial director of education
35
(now county directors). To collect data, questionnaires and document analysis were used. An in-
depth interview was also used to collect information from the provincial director of education. It
was revealed in the study that there was unfairness since there was uneven distribution of
teachers where some of the schools suffered understaffing while others were over staffed
contrary to the policy in place.
A recommendation was given that, that teacher recruitment and distribution be reviewed
time and again; policy makers in the MOE to develop distribution framework which is effective
and efficient; to improve teacher distribution across schools and staff balancing to enhance
equity. Wanjoi (2013) observes that the government of Kenya needs to address air distribution of
teachers in districts (now sub counties). Linda and Ducommum (2014) also suggest that there
should be fair and equal distribution of qualified teachers across districts because of the problem
of understaffing- which they call “maldistribution” of teachers in public schools. This study,
unlike the above, made use of the staffing officer in the local area of study, to enquire on what
policies could be effected to improve staffing.
Teacher retention in certain geographical regions of the country, particularly ASAL
areas, is among the most important factors of improving staffing in schools. In their study, Ariko
and Simatwa (2011), investigated on the factors that influenced teacher transfer requests in Suba
District (now sub-county). It employed a descriptive survey design. The socio-economic and
environment factors linked to transfer requests included accessibility, location of schools, and
availability of opportunities for further studies, electricity and housing.
The findings of the study were significant in that they exposed the problems that hindered
teacher retention in Suba District secondary schools. To retain teachers and thus improve
36
staffing, the study recommended efforts towards the realization of the above socio-economic and
environmental needs. It further recommended for opportunities for teacher promotion with more
professional contact and support; opportunities for teacher recognition; and availability of
induction or mentoring programmes. More research was, however, necessary to establish the
extent of government‟s efforts on retention of teachers in a given county through the MOE.
According to Segun and Olanrewaju (2011), African governments should improve the
teaching conditions of the rural schools e.g. by providing housing and suitable accommodation.
Again, since many teachers are reluctant to teach in rural areas, rural teachers should be recruited
from areas close to where they are to teach. In addition to this, Goertz, Loeb and Wyckoff (2011)
suggest that teachers should be motivated in a number of ways including: enhancing financial
incentives and support e.g. transport allowances for those working in remote areas. Moreover,
Schaffhaser (2014), recommend the following reforms as necessary: transfer reforms; salary
increases; good health insurance; good retirement and pension plans; involving teachers in
decision making; and adequate administrative support. The measures can also involve
manageable class sizes; safe and supportive environment; effective school leadership; and hiring
and effective replacement of teachers (www.learningfirst.org/staffing). The present study, unlike
the above, enquired from the ASAL teachers (understaffed areas) what would make them
comfortable to continue serving in the same regions.
Moreover, the government should strive to come up with other ways of curbing
understaffing. Mwika‟s (2010) study in Tigania West District, Kenya recommended that the
government should allocate more funds to hire teachers to curb understaffing problem. In
37
addition to this, supplementary contract teachers can be part of the solution to Kenya‟s shortage
(Duflo et al, 2015).
2.3.5 Summary and Research Gaps
The key areas discussed in this chapter include: the distribution of the teaching staff in
public primary schools which involves the influence of pupil-teacher ratio on teaching and
learning; influence of the teachers‟ workload on teaching and learning; and challenges of
understaffing on teaching and learning. In this regard, some areas of research have been
highlighted.
The researchers who deal with influence on the learners‟ academic performance, as a
characteristic and product of teaching and learning, include Kaloki (2012), Munguti (2009), and
Gurro (2010). According to Kaloki and Gurro, understaffing by which PTR rises influences
academic performance negatively. On the contrary, Munguti‟s study shows that the number of
teachers in a school does not determine the students‟ performance. These studies are confined to
performance in examinations. Effective teaching and learning is, on the contrary, a combination
of various activities of both the teacher and the learner. The scope of this study included how the
teacher‟s work is affected as a contributing factor to the learner‟s performance. It also includes
how the learner‟s activities in the course of teaching and learning are affected.
Both Bukhala (2009) and Wakoli (2016) found out that understaffing increases the
teachers‟ workload. This study further found out whether the syllabus is completed in the event
of increased work load. This syllabus includes non-examinable subjects. It will also find out how
the challenges of understaffing have been dealt with. Munguti (2009), in his study, finds out that
understaffing makes the available teachers to be over-utilized while others are under-utilized.
38
However, he does not find out from the teachers‟ perspective whether the teacher‟s work in class
is effectively done to ensure learning takes place. This was a task of this research study.
According to Munguti (2009) and Kinyua (2011), understaffing increases the administrative
duties of the teacher besides his teaching work. This in turn may bring about poor parent-teacher
relationship and indiscipline of the pupils especially where the teacher concentrates more on one
area than the other. Wakoli (2016) concurs with the same where she discovered that teachers are
assigned with other responsibilities and administrative duties apart from teaching work. The
studies, however, have not found out whether the increase in administrative work for the few
available teachers may force them not to attend some lessons in class. The current study
observed this fact especially with particular emphasis on the head teacher or the deputy who in
most cases are overwhelmed by both administrative and teaching work.
Kaloki (2012) and Kanyiri (2009) have addressed the subject of high PTR. They
observed that few teachers against very many pupils affect the quality of education. This study
further found out, from the teachers‟ responses, the challenges that may be brought on board in
teaching and learning activities by the failure to maintain the required ratio (PTR) of teachers
versus pupils.
Little has been researched on what has befallen our public primary schools in the entire
exercise of teaching and learning as a result of lack of enough teachers and with regard to how
demanding the comprehensive syllabus of our schools is and all the extra curriculum activities
that contribute to learning. We also realize that the TSC staffing policies are confronted with
striking challenges from the ground level of the schools themselves. This is seen through the
schools' massive enrolments, their environmental locations and imbalances in teacher
39
distribution. The commission is also characterized of disparities in the frequency of recruitment
and deployment with regard to the demand in public primary schools. These lapses, among
others, constitute a gap that gave a leeway to the researcher to explore, through a more
comprehensive study, the real experience of our schools on the fact of understaffing. It has
already been mentioned that teaching and learning is not only class work but also activities and
interactions outside the class. With this in mind, the study had a broader spectrum to observe the
learners' arena of learning.
40
CHAPTER THREE
RESEARCH DESIGN AND METHODOLOGY
3.1 Introduction
This chapter particularly describes how the study was carried out. It presents what was
done and how it was done. In this aspect, the description drew special attention to the statement
of the problem and the established research questions (rose in chapter one) about the said gap.
The chapter involves a description about the selected research design, the targeted population,
sample and sampling procedures, data collection instruments and the validity and reliability of
the research instruments. It also includes data collection techniques and analysis and the
considerations on ethical issues in carrying out the study.
3.2 Locale of the Study
This study took place in Makueni sub-county in Makueni County. Kenya. It forms what
was formerly referred to as Makueni District in the then Eastern Province. It was chosen for this
study because the sub county is one of the hardship areas where teachers are entitled to hardship
allowances due to the remoteness of the geographical locations of the schools. In addition, some
schools are scattered in Arid and Semi-Arid Locations (ASAL) where not many teachers would
be willing to work, hence the understaffed state of the schools (Nzoka, 2011).
However, there are a few schools located in small towns and the adjacent areas. The only
big town in the sub county is Wote (Makueni) town. Thus, the district has a diversity of
environmental locations of the schools. This diversity consequently constitutes diverse state of
staffing.
41
With this in mind the study of understaffing would be observed with reference to the
pupil teacher ratio (PTR) per school as per TSC staffing policies; number of classes in a given
school, shared work load and teacher distribution. Thus, to have a proper representativeness in
sampling, the above factors should be put in place.
3.3 Research Design
Cross-sectional survey design was used in this study for quantitative instruments.
According to Cherry (2015), researchers in a cross-sectional study, record information they
observe in the sample population they are examining. They describe characteristics as they exist
in a population but not to determine cause and effect relationship between different variables.
This design was relevant in the present study since the researcher simply collected data in
regards to its influence on teaching and learning and understaffing by way of observation and
responses from the said population.
The design can be conducted using any mode of data collection including telephone
interviews, questionnaires, electronic mails, etc (Hall, 2013). In cross-sectional studies various
categories of people who vary in the variable of interest but share other characteristics such as
socio-economic status and educational background, are involved (Roundy, 2003). In this regard,
the different groups in the present study include teachers (from both understaffed and overstaffed
schools), head teachers, curriculum heads, education officers and the staffing officer in the sub
county.
For qualitative instruments, interviews and document analysis guide, the researcher used
phenomenology design whose purpose is to describe situations, experiences or phenomenon as
42
they exist. It was aimed at capturing the interpretation of leaders about their environment (Gall et
al 2007).
3.4 Target Population
Makueni Sub County, is where the target population was drawn. It has five educational
zones. The zones comprised of public primary schools were as follows: Kee 23; Mukuyuni 20;
Kilala 19; Wote 22; and Mulaani 15, giving a total of 99 schools.
The target population therefore comprised of 99 public primary schools in Makueni Sub County,
99 head teachers from the schools and 99 heads of curriculum in the schools. There were 753
teachers in those schools besides the heads of curriculum as well as the head teachers. The
population also included the staffing officer and the District Education Officer (DEO) of
Makueni Sub County. The composition of the teachers as mentioned above included ordinary
(assistant) teachers, heads of curriculum in the schools and the head teachers. They further fell
under the category of TSC teachers not PTA teachers. Teachers have a lot of information
concerning what they go through in terms of experiences in pedagogy. They would therefore
offer necessary information, alternatively positive or negative influence of understaffing, to
teaching and learning. `
3.5 Sample and Sampling Procedures
McMillan and Schumacher (2001) suggest that in determining sample size, the researcher
needs to obtain a sufficient number to provide credible results. They suggested that, in
quantitative studies, a sample of 20% from the total population is representative enough. In this
study, the sampling techniques used included simple random sampling for teachers whereas
43
automatic inclusion technique was used for head teachers, heads of curriculum in the schools, the
staffing officer and the DEO in the sub county.
3.5.1 Sampling of the Schools
Based on the above argument the researcher sampled 20 schools which were, at least, the
20% of the 99 schools in the sub county. To select the number of schools to participate from
each educational zone, the researcher used stratified sampling. According to Ogula (2005), that
what is represented in a sample, are various groups of that population through stratification. The
population is categorized in stratas, such as rural and urban schools, where samples are drawn
randomly. In our case, therefore, the researcher divided the sample size (20) with the population
size (99) and multiplied the results by schools in numbers at the particular educational zone. That
is, 20/99 × n where n denotes school count in a given educational zone. From this formula, the
researcher got the selection of the number of schools per zone to participate in the study.
There were five educational zones in the sub county. Kee zone had 23 schools from
which 5 were selected; Mukuyuni zone had 20 schools from which 4 were selected; Kilala zone
had 19 schools from which 4 were selected; Wote zone had 22 schools from which 4 were
selected; and Mulaani zone had 15 schools from which 3 were selected. The entire population of
schools from this list (23, 20, 19, 22, 15) was 99 and the entire population of the selected schools
(5, 4, 4, 4, 3) was 20. Twenty schools was therefore the total sample size of the selected schools
for the study.
This study used simple random sampling was used to arrive to which schools (by name to
give us the size of the sample) out of the number of schools per zone to take part in this study. A
list of schools per zone was made and small papers were folded hence placed in a plate in order
44
to pick the required number of sampled schools per a given zone. In order to create a high chance
of every school to be selected, the papers were picked and opened and the name of the schools
were listed. The papers were folded and returned to the plate and then randomly a paper would
be picked again. This was repeated until all the 20 schools were picked.
3.5.2 Sampling of Heads of Curriculum and Head Teachers
The sampling of heads of curriculum (HOCs) and head teachers was by automatic
inclusion technique of purposive sampling. They have important information for each sampled
school in terms of the influence of the staffing levels to the administration and to the work load
which in turn affects teaching and learning. In this regard, since the sample size for the schools
was 20, it followed that 20 head teachers and 20 teachers in charge of curriculum (HOCs) had to
be selected for this purpose. This indicated that both the head teacher and the HOC for each
sampled school would participate.
3.5.3 Sampling of the Teachers
We have already noted that there were 753 teachers besides the head teachers and the
HOCs. Therefore, to get the total figure of teachers to participate, it was 20% of 753 which is
150.6 (approximately 151). Further, to get the figure of teachers per school to participate, it was
the cumulative total of teachers to participate (151) divided by the number of schools to
participate (20), which is 7.55 (approximately 8). In order to establish the number of teachers to
participate among the teachers in a given school simple random sampling technique was then
used. A list of the teachers per school was made and small papers folded and put in a plate in
order to pick the number of sampled teachers per a given school. The researcher engaged the
teachers in the exercise of picking the papers. In order to create a high chance of every teacher to
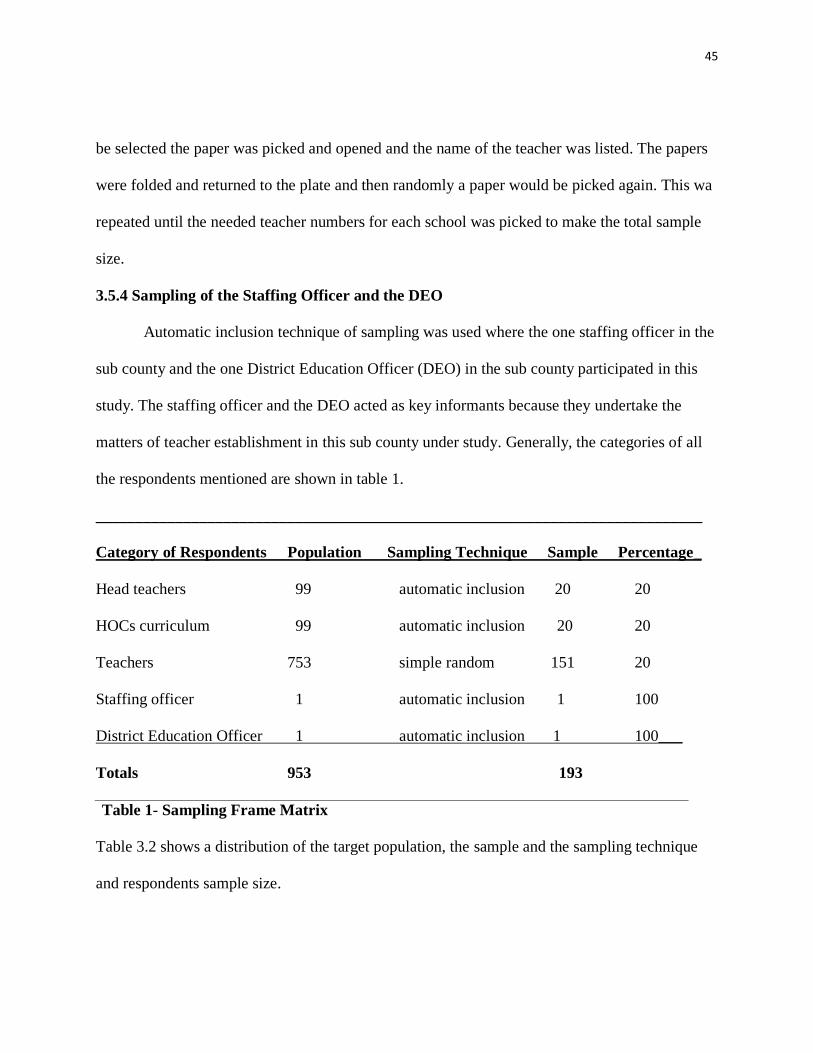
45
be selected the paper was picked and opened and the name of the teacher was listed. The papers
were folded and returned to the plate and then randomly a paper would be picked again. This wa
repeated until the needed teacher numbers for each school was picked to make the total sample
size.
3.5.4 Sampling of the Staffing Officer and the DEO
Automatic inclusion technique of sampling was used where the one staffing officer in the
sub county and the one District Education Officer (DEO) in the sub county participated in this
study. The staffing officer and the DEO acted as key informants because they undertake the
matters of teacher establishment in this sub county under study. Generally, the categories of all
the respondents mentioned are shown in table 1.
____________________________________________________________________________
Category of Respondents Population Sampling Technique Sample Percentage_
Head teachers 99 automatic inclusion 20 20
HOCs curriculum 99 automatic inclusion 20 20
Teachers 753 simple random 151 20
Staffing officer 1 automatic inclusion 1 100
District Education Officer 1 automatic inclusion 1 100___
Totals 953 193
Table 1- Sampling Frame Matrix
Table 3.2 shows a distribution of the target population, the sample and the sampling technique
and respondents sample size.
46
3.6 Description of Research Instruments
This study employed questionnaires, interview guides and document analysis collect data
from the collect data from the field.
3.6.1 Questionnaires
Questionnaires were used in this study because they allowed some uniformity in the
asking of the questions. They also ensured comparison of the data collected (Kothari, 2005). In
this regard, the respondents felt free to answer questions without revealing their identity. The
questionnaires had unstructured and structured questions. As Mugenda and Mugenda (2003),
puts it, structured questions are easy to analyze whereas unstructured questions allow a greater
number of response and can stimulate to think about his feelings or motives and to express what
he or she considers being most important.
3.6.2 Questionnaire for Head Teachers
Head teachers from schools selected were administered with a questionnaire. This
questionnaire was sub divided into five sections or items: section A captured the respondents
demographic information; section B concentrated on the influence of understaffing on the
process of learning and teaching including students‟ performance; section C focused on the
impact of work load on teaching and learning; section D on the challenges of understaffing on
teaching and learning; and section E on the measures of improving staffing in public primary
schools (Ref. Appendix II).
3.6.3 Questionnaire for Teachers
A questionnaire was administered to teachers in selected schools. It included five items or
sections: Section A captured teachers‟ demographic data; section B enquired their responses on
47
how understaffing influences teaching and learning; section C enquired on the extent to which
work load influences teaching and learning in the face of understaffing; and section D was on the
challenges of understaffing in teaching and learning; and section E on the measures of improving
staffing(Ref. Appendix III).
3.6.4 Questionnaire for HOCs (Heads of Curriculum)
This questionnaire had five sections too: section A was on the respondent‟s demographic
data and section B was on how understaffing influences teaching and learning. Section C was on
how the teachers‟ work load influences teaching and learning and section D was on the
challenges of understaffing. The last section in this questionnaire, section E, highlights the means
to upgrade the situation found in those schools (Ref. Appendix IV).
3.7 Interview Guides
Interview guides were used for both the staffing officer and the DEO. These two officers
act as key informants who implement educational policies. Frankel and Wallen (1993) consider
the use of interviews as important in order to probe and elicit more information from the
respondents. According to Fetterman (1989), interviews which include both open-ended and
closed-ended type of questions are helpful in capturing the informants‟ own words. This view is
also supported by Borg and Gall (1989) who recommend structured and unstructured interviews
as the most appropriate for educational studies. In this case the researcher employed the same by
use of an interview guide.
3.7.1 Interview Guide for the Staffing Officer
According to Ogula (2005), an interview guide permits the interviewer and helps the
respondent clarify his or her thinking on a given point. It also enables the investigator to pursue
48
leads in order to gain insights into the problem. In this regard, the interview guide for the staffing
officer had five sections: Section A collected data on the demographic information of the officer.
Section B enquired on the state of understaffing in the sub county and section C enquired on the
influence of understaffing on teaching workload. Section D enquired on the challenges that the
government faces in the staffing of schools and section E on the ways of improving staffing (Ref.
Appendix V).
3.7.2 Interview Guide for the District Education Officer (DEO)
This interview guide had five sections. Section A gathered data on the demographic
information of the officer. Section B enquired on how understaffing influences quality in
teaching and learning in schools and Section C is about influence of understaffing on teaching
workload. Section D enquired on the challenges involved in the staffing of schools and section E
on what policies can be implemented by the government to improve staffing (Ref. Appendix VI).
3.8 Document Analysis Guide
A document analysis guide was relevant in obtaining accurate data compiled by the
respondents themselves. It is important for analytical examination of public or private recorded
data related to the study (Mitchell & Jolly, 2009). The document analysis guide was relevant to
this study in that it gathered data on monthly returns on teaching staff versus pupils‟ enrolments
per classes of the primary schools that are public in the sub county (Ref. Appendix VII).
3.9 Validity and Reliability
3.9.1 Validity
Mugenda and Mugenda (2003) underline that validity is the precision of inferences
whose foundation is based on research results. Validity of the instruments was determined by the
49
following steps. First, the researcher discussed each instrument with the supervisors to verify the
relevance of the questions in relation to the research questions. Secondly, the researcher involved
the research department of the university (CUEA) to clarify and give guidelines on the
authenticity of the instruments to the study. Thirdly, the study also involved other masters‟
students to verify the level of language used to construct the questionnaires. Content validity
ensured that the items and domains of the instrument used were appropriate and comprehensive
with regard to its intended measurement concepts and the population (Higgins & Green 2011).
3.9.2 Pilot Test
The purpose of pilot test is to ensure the quality and credibility of a study. A pilot test
was therefore done to test the instruments‟ efficiency (Lancaster, Dodd & Williamson, 2004).
For the quantitative instruments, five people, in each category (teachers, HOCs and Head
teachers), were administered with questionnaires. This was enabled the researcher to test the
authenticity of the instruments. The researcher enquired for comments from the respondents on:
the accuracy of the questions given; enough space to fill their answers; relevance of the
individual items; and whether important information that would seldom be captured by the given
questions is detected. In determination of the validity and reliability of the research instruments,
the findings were used.
3.9.3 Reliability
An assessment of the consistency of the responses on the pilot questionnaire was done for
the purposes of improving the reliability of the instrument. For quantitative items, test-retest
technique of reliability testing was used whereby; the researcher administered pilot
questionnaires twice to the participants, giving a one week interval, to allow for reliability
50
testing. The interval in the test-retest reliability was meant to assess the stability of the
measurement procedure. Two sets of data were obtained from the respondents and entered into
the computer to calculate the internal consistency of the reliability of the instruments. The scores
were then correlated using Pearson Product-Moment Correlation formula to determine the
reliability coefficient. A reliability test was carried out and the reliability coefficients were as
follows: 0.900 for head teachers; 0.875 for heads of curriculum (HOCs); and 0.926 for the
teachers (Ref. Appendix VIII). The results shown in the output table indicated that the instrument
had a mean reliability coefficient of 0.900; an indication that they were highly reliable.
Mugenda and Mugenda (1999) points out that, a reliability results of 0.70 is acceptable.
3.10 Credibility and Dependability of Qualitative Instruments
The reliability of the qualitative items mainly involved the document analysis guide and
interview guides. The researcher ensured credibility of these instruments through meticulous
record keeping; comparison across accounts where similarities and differences ensured different
perspectives represented; and including rich and verbatim descriptions of participants‟ accounts
to support findings. The researcher also involved the respondents‟ validation by inviting them to
comment on whether the final themes and concepts created adequately reflect the phenomenon
being investigated (Noble, 2015). To ensure dependability of the instruments, the researcher also
involved some members to check on and ascertain the trustworthiness of the tools before use.
3.11 Description of Data Collection Procedures
This study ensured that a letter of transmittal or cover letter accompanied every
questionnaire (Mugenda & Mugenda 1999). The researcher also secured a research permit for the
research study. National Council of Science, Technology and Innovation (NACOSTI, 2015)
points out that, a research permit helps to encourage quality research that will directly benefit
51
Kenya by increasing scientific knowledge and secure the data and research results of the research
work. A permit was therefore obtained from the NACOSTI and a copy of the permit was
presented to the county commissioner and the county director of education in Makueni County;
who then granted the researcher permission to visit schools under his area of jurisdiction. The
researcher then contacted the head teachers of the primary schools through a letter and thereafter
made arrangements for the actual schools visits. A date was set where the researcher would
interview the staffing officer and the DEO. The questionnaires were dropped in schools and later
picked after they had been dully filled.
3.12 Data Analysis Procedures
According Gay, Geoffrey and Peter (2009), data analysis was necessary in order to
summarize the data collected in a dependable and accurate manner. Data were analysed
qualitatively in regard to the objectives of the study. The recorded discussions through interview
guide were transcribed before analysis. The qualitative data were processed by first categorizing
responses by coding and labelling each item according to themes. This also included direct
quotes from the informants. The research findings were given in narratives and raw data excerpts
with conclusions and recommendations.
Descriptive statistics was used to analyse the quantitative data through charts, figures,
and tables with percentages and frequencies. Data from field questionnares were sorted out,
coded and fed into the computer for data to be analysed to give descriptive statistics namely
frequency distributions and percentages. Tables and figures were used to give a summary of the
analysed data. Descriptive statistics were also utilized to analyze demographic data from all the
instruments.
52
3.13 Ethical Considerations
Ethical considerations were considered when carrying out this study. The researcher
avoided asking respondents personal or private information. The researcher asked participants
not to indicate names in the questionnaires or identify themselves during the time for interview
in order to maintain confidentiality and anonymity (Kitchin& Kate, 2000). This was done to
protect their identity and dignity and also to help them respond freely to the items without fear.
The researcher also ensured that there was informed consent of the participants in
conducting the research. Fouka and Mantzorou (2011), point out some value in informed consent
of the respondents because it enables them to participate at liberty and make informed decisions.
In support of this, the researcher sought permission through letters to the heads of the primary
schools that were visited for data collection. Another ethical consideration that was observed was
the obtaining of a research permit obtained from the National Council of Science, Technology
and Innovation. In this regard, the researcher could report and introduce himself to the county
commissioner and the district education officer who then authorized the researcher to visit the
schools within their area of jurisdiction. In the schools, the researcher had a cover letter
accompanying the research permit questionnaires for introduction and for good rapport.
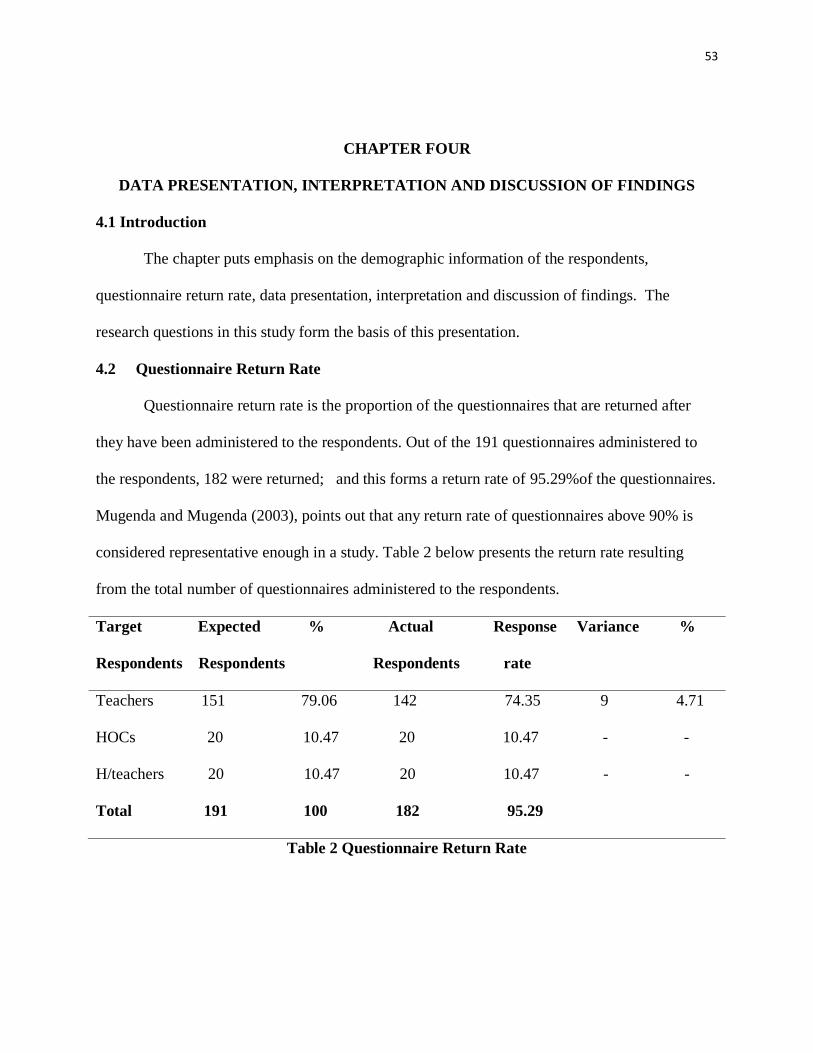
53
CHAPTER FOUR
DATA PRESENTATION, INTERPRETATION AND DISCUSSION OF FINDINGS
4.1 Introduction
The chapter puts emphasis on the demographic information of the respondents,
questionnaire return rate, data presentation, interpretation and discussion of findings. The
research questions in this study form the basis of this presentation.
4.2 Questionnaire Return Rate
Questionnaire return rate is the proportion of the questionnaires that are returned after
they have been administered to the respondents. Out of the 191 questionnaires administered to
the respondents, 182 were returned; and this forms a return rate of 95.29%of the questionnaires.
Mugenda and Mugenda (2003), points out that any return rate of questionnaires above 90% is
considered representative enough in a study. Table 2 below presents the return rate resulting
from the total number of questionnaires administered to the respondents.
Target Expected % Actual Response Variance %
Respondents Respondents Respondents rate
Teachers 151 79.06 142 74.35 9 4.71
HOCs 20 10.47 20 10.47 - -
H/teachers 20 10.47 20 10.47 - -
Total 191 100 182 95.29
Table 2 Questionnaire Return Rate
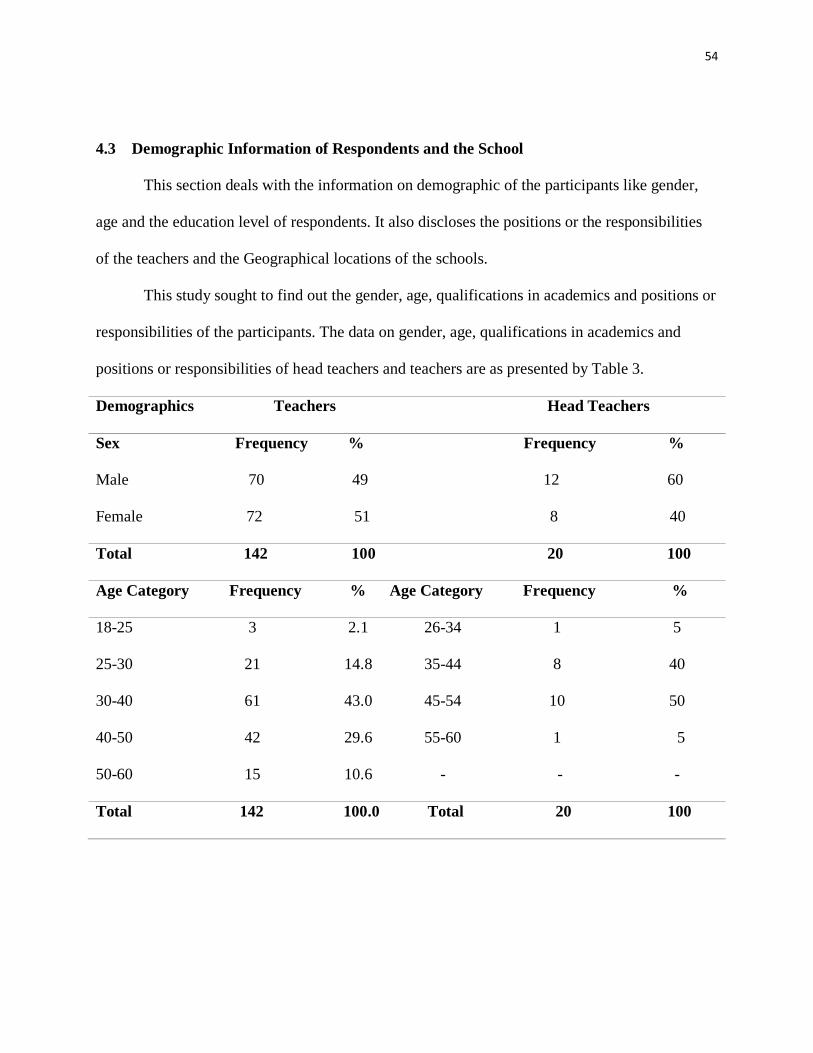
54
4.3 Demographic Information of Respondents and the School
This section deals with the information on demographic of the participants like gender,
age and the education level of respondents. It also discloses the positions or the responsibilities
of the teachers and the Geographical locations of the schools.
This study sought to find out the gender, age, qualifications in academics and positions or
responsibilities of the participants. The data on gender, age, qualifications in academics and
positions or responsibilities of head teachers and teachers are as presented by Table 3.
Demographics Teachers Head Teachers
Sex Frequency % Frequency %
Male 70 49 12 60
Female 72 51 8 40
Total 142 100 20 100
Age Category Frequency % Age Category Frequency %
18-25 3 2.1 26-34 1 5
25-30 21 14.8 35-44 8 40
30-40 61 43.0 45-54 10 50
40-50 42 29.6 55-60 1 5
50-60 15 10.6 - - -
Total 142 100.0 Total 20 100
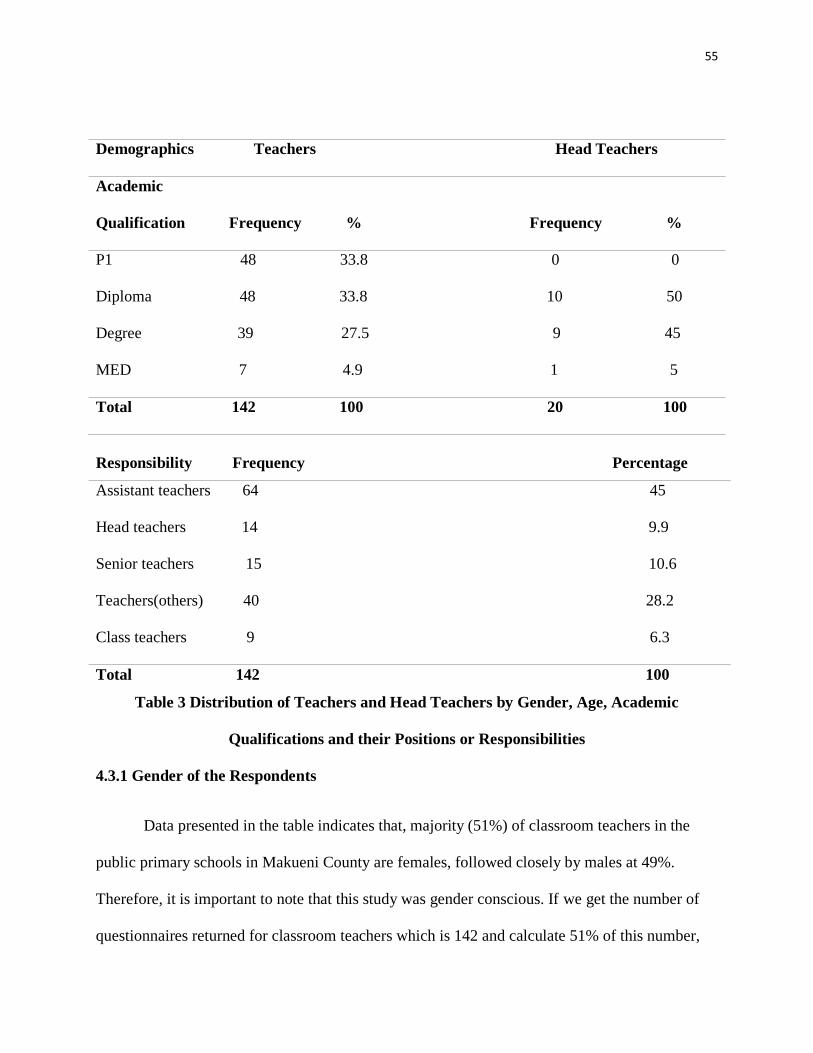
55
Demographics Teachers Head Teachers
Academic
Qualification Frequency % Frequency %
P1 48 33.8 0 0
Diploma 48 33.8 10 50
Degree 39 27.5 9 45
MED 7 4.9 1 5
Total 142 100 20 100
Table 3 Distribution of Teachers and Head Teachers by Gender, Age, Academic
Qualifications and their Positions or Responsibilities
4.3.1 Gender of the Respondents
Data presented in the table indicates that, majority (51%) of classroom teachers in the
public primary schools in Makueni County are females, followed closely by males at 49%.
Therefore, it is important to note that this study was gender conscious. If we get the number of
questionnaires returned for classroom teachers which is 142 and calculate 51% of this number,
Responsibility Frequency Percentage
Assistant teachers 64 45
Head teachers 14 9.9
Senior teachers 15 10.6
Teachers(others) 40 28.2
Class teachers 9 6.3
Total 142 100
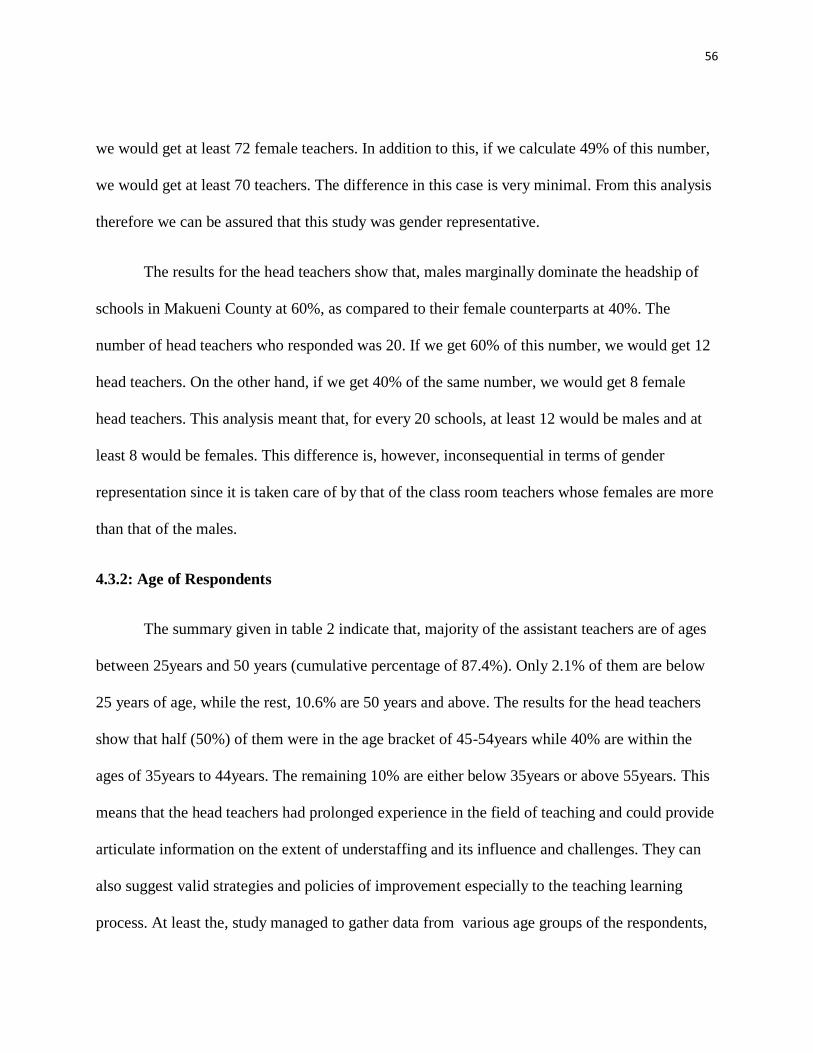
56
we would get at least 72 female teachers. In addition to this, if we calculate 49% of this number,
we would get at least 70 teachers. The difference in this case is very minimal. From this analysis
therefore we can be assured that this study was gender representative.
The results for the head teachers show that, males marginally dominate the headship of
schools in Makueni County at 60%, as compared to their female counterparts at 40%. The
number of head teachers who responded was 20. If we get 60% of this number, we would get 12
head teachers. On the other hand, if we get 40% of the same number, we would get 8 female
head teachers. This analysis meant that, for every 20 schools, at least 12 would be males and at
least 8 would be females. This difference is, however, inconsequential in terms of gender
representation since it is taken care of by that of the class room teachers whose females are more
than that of the males.
4.3.2: Age of Respondents
The summary given in table 2 indicate that, majority of the assistant teachers are of ages
between 25years and 50 years (cumulative percentage of 87.4%). Only 2.1% of them are below
25 years of age, while the rest, 10.6% are 50 years and above. The results for the head teachers
show that half (50%) of them were in the age bracket of 45-54years while 40% are within the
ages of 35years to 44years. The remaining 10% are either below 35years or above 55years. This
means that the head teachers had prolonged experience in the field of teaching and could provide
articulate information on the extent of understaffing and its influence and challenges. They can
also suggest valid strategies and policies of improvement especially to the teaching learning
process. At least the, study managed to gather data from various age groups of the respondents,
57
the young and old with little and long experience respectively. This ensured diverse and well
versed information from the diverse ages.
4.3.3: Academic Qualification of the Respondents
Both the head teachers and the assistant teachers and were requested to put down their
topmost academic achievement. The results obtained are summarized in table 2.
The presented data in the table indicates that, a big number of the primary school teachers in
Makueni County are holders P1 certificate (33.8%) and Diploma (33.8%). Majority of them
(27.5%) also have a university degree, while only a few (4.9%) have master‟s degrees. The
results for teacher head of schools indicate that half of the head teachers are diploma holders
(50%), 45% were holders of bachelor‟s degree and only 5% had attained master‟s degrees. A
general observation of the entire chart shows us that diploma holders for both the head teachers
and the teachers had the biggest number followed closely by degrees. On average, the study got
majority of the responses from this group; a few from the lower side; and a few from the upper
side and so it had a balanced approach.
4.3.4 Position/ Responsibility of Teachers in the Schools
The study pursued to establish other responsibilities which teachers undertook; other than
teaching. In so doing, the researcher asked the teachers to indicate the extra responsibility they
had. This was aimed at comparing the teaching workload visa a vie the demands of the extra
responsibility. In Table 2, it is evident that most teachers hold other responsibilities other than
teaching. These responsibilities together with the high teaching workload denotes that the
teachers were overwhelmed and may not be able to prepare adequately for lessons. This concurs
with Wakoli‟s (2016) research study who found out that teachers are fully involved in other tasks
58
pertaining to administration besides teaching work in the school. For example, supervision of
extracurricular activities e.g. games and clubs and other administrative duties.
4.4 The Geographical Locations of the Schools
In this section, the researcher pursued the establishment of the geographical locations of
the schools in the county. It was aimed at the establishment of whether the physical location of a
given school could influence the distribution of teachers. Figure 1 presents the results obtained.
Fig 2: The Distribution of the schools in the sub county
The results in Figure 1indicated that, majority of schools were concentrated in arid, semi-
arid and rural areas. Considering that Makueni County is generally in an ASAL area, the
analysis reflects that of Nzoka‟s (2011) research study who discovered that most of the schools
are in ASAL areas (sometimes called hardship zones) with low enrolments where not many
teachers would like to work were it not for hardship allowance. The analysis in the chart is also
relevant to this study in that schools in ASAL and rural areas, being the majority (95%), would
compare in their levels of staffing with those in urban areas (being the minority, 5%).
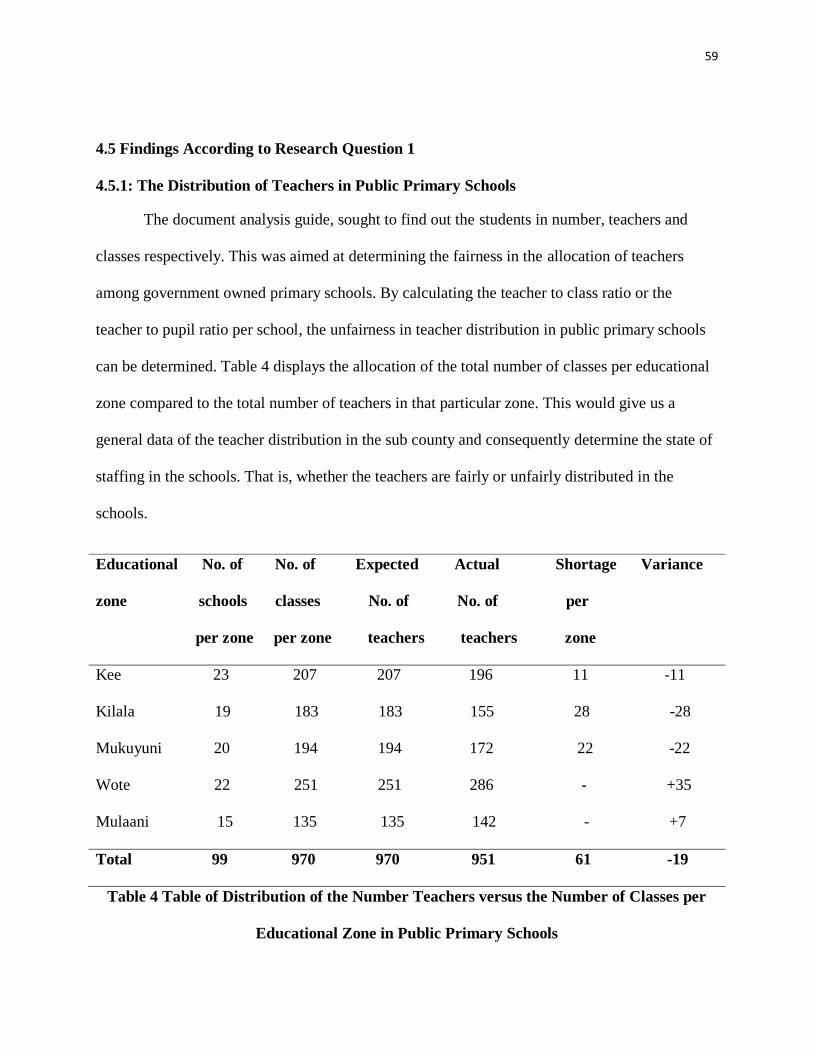
59
4.5 Findings According to Research Question 1
4.5.1: The Distribution of Teachers in Public Primary Schools
The document analysis guide, sought to find out the students in number, teachers and
classes respectively. This was aimed at determining the fairness in the allocation of teachers
among government owned primary schools. By calculating the teacher to class ratio or the
teacher to pupil ratio per school, the unfairness in teacher distribution in public primary schools
can be determined. Table 4 displays the allocation of the total number of classes per educational
zone compared to the total number of teachers in that particular zone. This would give us a
general data of the teacher distribution in the sub county and consequently determine the state of
staffing in the schools. That is, whether the teachers are fairly or unfairly distributed in the
schools.
Educational No. of No. of Expected Actual Shortage Variance
zone schools classes No. of No. of per
per zone per zone teachers teachers zone
Kee 23 207 207 196 11 -11
Kilala 19 183 183 155 28 -28
Mukuyuni 20 194 194 172 22 -22
Wote 22 251 251 286 - +35
Mulaani 15 135 135 142 - +7
Total 99 970 970 951 61 -19
Table 4 Table of Distribution of the Number Teachers versus the Number of Classes per
Educational Zone in Public Primary Schools
60
The distribution in the table shows that, there is unfair or unequal distribution of teachers
among public primary schools. One observation we can make from table 4is that classes in the
sub county in total were 970. Therefore, according to the TSC policy of one teacher per class,
there should be at least 970 teachers in the sub county. We realize, however, that the actual
number of teachers is 951. If we evaluate the state of understaffing by the TSC policy, we would
say that the sub county was understaffed by 19 teachers. That is, the difference between 970 and
951. However, the situation is worse than it seems because of the unfair distribution of the
teachers. The table shows that some zones were understaffed and others overstaffed. Out of the
five educational zones, three were understaffed and two were overstaffed. The understaffed
zones include: Kee with a shortage of 11 teachers; Kilala with a shortage of 28 teachers; and
Mukuyuni with a shortage of 22 teachers. The total number of teachers needed to match the
number of classes in these three zones is 61 which is the sum of the 19 lacking and the 42, (that
is 35+7), distributed unfairly as per the table in the overstaffed zones. It was noted through the
research that the understaffed educational zones mostly fall under the Arid and Semi-Arid
Locations (ASAL). According to the staffing theory, there is no balance between the people
working (teachers) and the number of people (classes/pupils) that the environment provides for
(Wicker, 1968).
Another observation we can make from the table is that there were two overstaffed zones
in the sub county. These include Wote zone, overstaffed by 35 teachers and Mulaani zone,
overstaffed by 7 teachers. The two zones were noted to have both town schools and rural
schools. In addition, the population of the pupils in these schools was by far higher than that of
the schools in the ASAL areas. This confirms the observation earlier made by MOEST (2014)
61
and KNBS (2012) that even if teachers were to be transferred from the overstaffed zones to solve
the problem in the understaffed zones, it would create imbalance because teachers in the
overstaffed schools would be teaching extra large classes. This means the overstaffed zones may
also be understaffed in terms of the recommended pupil-teacher ratio (40:1).
In an interview with the staffing officer of the sub county on the reasons behind the
understaffed state, she made the following remarks:
Some schools are understaffed especially those in remote areas since most teachers start
looking for transfers the moment they are deployed in those areas. There is also high
attrition rate and lack of proper replacement. For instance we have lost five teachers
between last year (2015) and March this year (2016) and only three were replaced (June,
2016).
This indicates clearly part of those factors that cause understaffing in the schools which includes
the government not able to employ or replace teachers effectively.
According to TSC (2012), the TSC staffing policies provide that a teacher per class is the
requirement plus 2.5 percent of the classes in total in a district. The above statistics contradict
these policies because in some schools, there were more classes than teachers or vice versa.
Furthermore, there were no reserve teachers of 2.5% as recommended by the staffing policies.
Head teachers of various selected schools were asked to indicate whether they experienced
shortage of teachers in their schools, and half (50%) of them said „Yes‟, while the remaining half
felt that there were adequate teachers in their schools. If, therefore half (50%) of the head
teachers said they had teacher shortage in the schools, it follows that half of the selected 20
schools were understaffed.
62
For the sake of triangulation, and in an attempt to further bring into perspective the extent
of understaffing in public primary schools, the county staffing officer and the DEO were
interviewed. When asked to give the overall assessment of the state of staffing in the county the
staffing officer said that some schools were overstaffed while others were understaffed for
reasons which could be attributed to the geographical locations of the schools and lack of proper
policies on staffing.
On the same note, the DEO said,
The data we obtain from the schools does not show fair distribution of teachers. There are
understaffed and overstaffed cases depending on the location of the schools
themselves, faulty records and poor updating of the teacher distribution in the county
(June, 2016).
The responses of these two officers showed concurrence to the effect that, the schools in the
county were indeed understaffed. Their observation was backed up by information in the
monthly staff returns from the schools to their offices which indicated pronounced shortage of
teachers. According to the returns, understaffing mostly affected schools in ASAL areas,
followed by rural schools; as those schools in urban locations were either adequately staffed or
overstaffed. Both the staffing officer and the DEO also observed that, there was unfair
distribution of teachers even in schools within the same geographical location. This they
attributed to the lack of proper policies on staffing, poor updating of records on teacher
distribution and the failure by the government to replace those teachers who retire and those who
exit the service due to natural attrition.
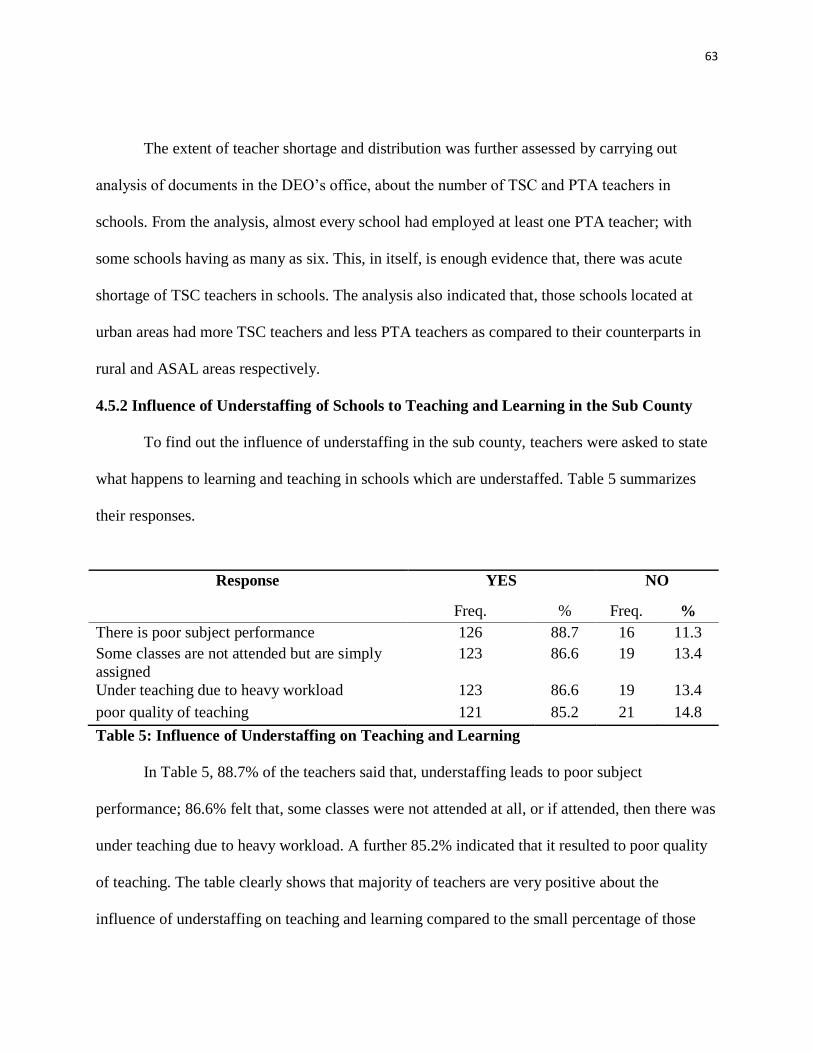
63
The extent of teacher shortage and distribution was further assessed by carrying out
analysis of documents in the DEO‟s office, about the number of TSC and PTA teachers in
schools. From the analysis, almost every school had employed at least one PTA teacher; with
some schools having as many as six. This, in itself, is enough evidence that, there was acute
shortage of TSC teachers in schools. The analysis also indicated that, those schools located at
urban areas had more TSC teachers and less PTA teachers as compared to their counterparts in
rural and ASAL areas respectively.
4.5.2 Influence of Understaffing of Schools to Teaching and Learning in the Sub County
To find out the influence of understaffing in the sub county, teachers were asked to state
what happens to learning and teaching in schools which are understaffed. Table 5 summarizes
their responses.
Response YES NO
Freq. % Freq. %
There is poor subject performance 126 88.7 16 11.3
Some classes are not attended but are simply
assigned
123 86.6 19 13.4
Under teaching due to heavy workload 123 86.6 19 13.4
poor quality of teaching 121 85.2 21 14.8
Table 5: Influence of Understaffing on Teaching and Learning
In Table 5, 88.7% of the teachers said that, understaffing leads to poor subject
performance; 86.6% felt that, some classes were not attended at all, or if attended, then there was
under teaching due to heavy workload. A further 85.2% indicated that it resulted to poor quality
of teaching. The table clearly shows that majority of teachers are very positive about the
influence of understaffing on teaching and learning compared to the small percentage of those
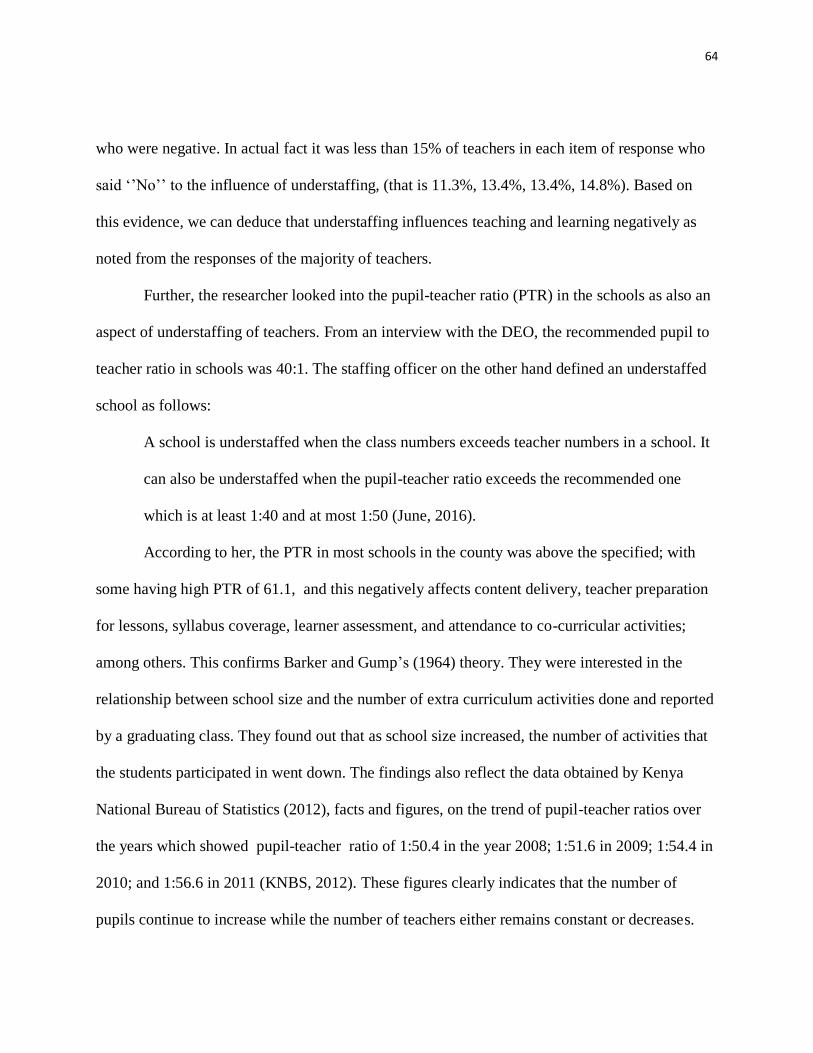
64
who were negative. In actual fact it was less than 15% of teachers in each item of response who
said „‟No‟‟ to the influence of understaffing, (that is 11.3%, 13.4%, 13.4%, 14.8%). Based on
this evidence, we can deduce that understaffing influences teaching and learning negatively as
noted from the responses of the majority of teachers.
Further, the researcher looked into the pupil-teacher ratio (PTR) in the schools as also an
aspect of understaffing of teachers. From an interview with the DEO, the recommended pupil to
teacher ratio in schools was 40:1. The staffing officer on the other hand defined an understaffed
school as follows:
A school is understaffed when the class numbers exceeds teacher numbers in a school. It
can also be understaffed when the pupil-teacher ratio exceeds the recommended one
which is at least 1:40 and at most 1:50 (June, 2016).
According to her, the PTR in most schools in the county was above the specified; with
some having high PTR of 61.1, and this negatively affects content delivery, teacher preparation
for lessons, syllabus coverage, learner assessment, and attendance to co-curricular activities;
among others. This confirms Barker and Gump‟s (1964) theory. They were interested in the
relationship between school size and the number of extra curriculum activities done and reported
by a graduating class. They found out that as school size increased, the number of activities that
the students participated in went down. The findings also reflect the data obtained by Kenya
National Bureau of Statistics (2012), facts and figures, on the trend of pupil-teacher ratios over
the years which showed pupil-teacher ratio of 1:50.4 in the year 2008; 1:51.6 in 2009; 1:54.4 in
2010; and 1:56.6 in 2011 (KNBS, 2012). These figures clearly indicates that the number of
pupils continue to increase while the number of teachers either remains constant or decreases.
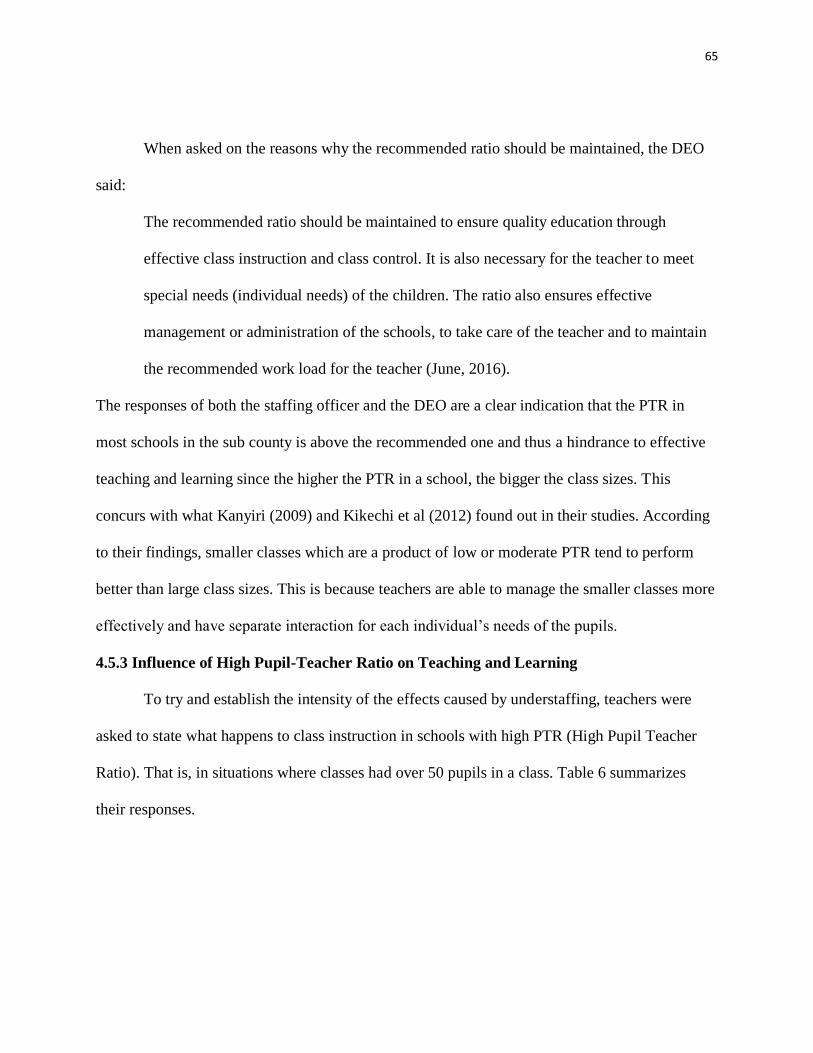
65
When asked on the reasons why the recommended ratio should be maintained, the DEO
said:
The recommended ratio should be maintained to ensure quality education through
effective class instruction and class control. It is also necessary for the teacher to meet
special needs (individual needs) of the children. The ratio also ensures effective
management or administration of the schools, to take care of the teacher and to maintain
the recommended work load for the teacher (June, 2016).
The responses of both the staffing officer and the DEO are a clear indication that the PTR in
most schools in the sub county is above the recommended one and thus a hindrance to effective
teaching and learning since the higher the PTR in a school, the bigger the class sizes. This
concurs with what Kanyiri (2009) and Kikechi et al (2012) found out in their studies. According
to their findings, smaller classes which are a product of low or moderate PTR tend to perform
better than large class sizes. This is because teachers are able to manage the smaller classes more
effectively and have separate interaction for each individual‟s needs of the pupils.
4.5.3 Influence of High Pupil-Teacher Ratio on Teaching and Learning
To try and establish the intensity of the effects caused by understaffing, teachers were
asked to state what happens to class instruction in schools with high PTR (High Pupil Teacher
Ratio). That is, in situations where classes had over 50 pupils in a class. Table 6 summarizes
their responses.
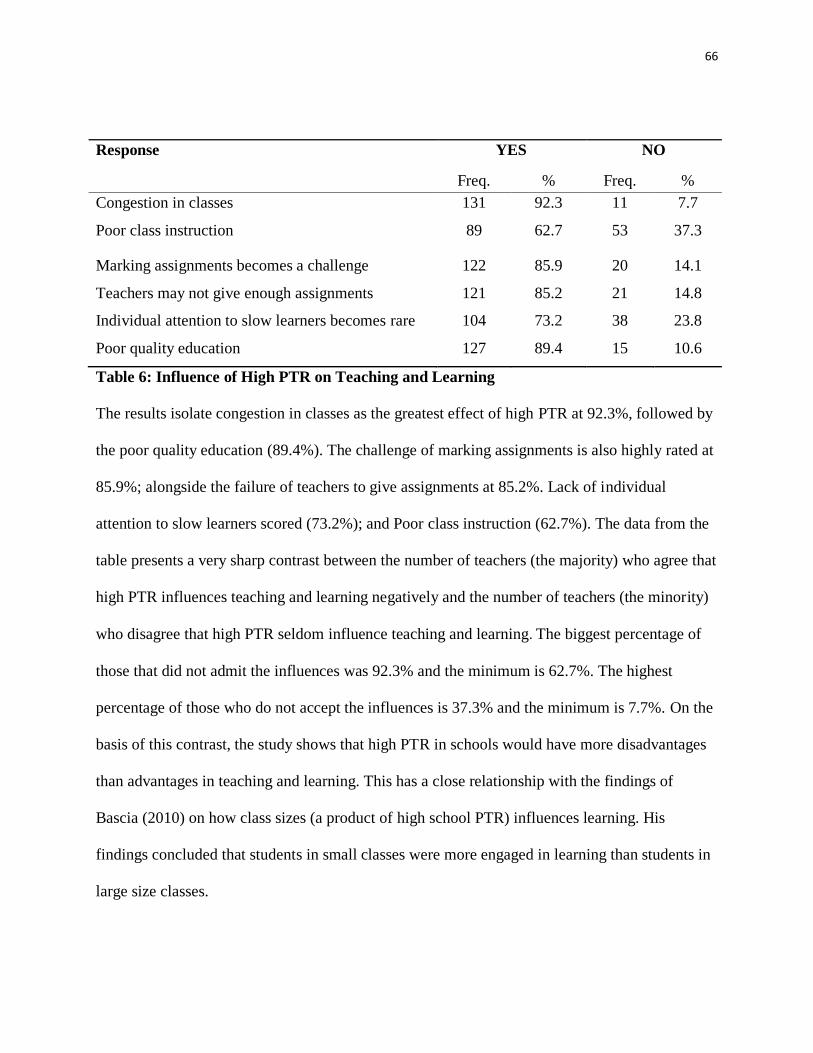
66
Response YES NO
Freq. % Freq. %
Congestion in classes 131 92.3 11 7.7
Poor class instruction 89 62.7 53 37.3
Marking assignments becomes a challenge 122 85.9 20 14.1
Teachers may not give enough assignments 121 85.2 21 14.8
Individual attention to slow learners becomes rare 104 73.2 38 23.8
Poor quality education 127 89.4 15 10.6
Table 6: Influence of High PTR on Teaching and Learning
The results isolate congestion in classes as the greatest effect of high PTR at 92.3%, followed by
the poor quality education (89.4%). The challenge of marking assignments is also highly rated at
85.9%; alongside the failure of teachers to give assignments at 85.2%. Lack of individual
attention to slow learners scored (73.2%); and Poor class instruction (62.7%). The data from the
table presents a very sharp contrast between the number of teachers (the majority) who agree that
high PTR influences teaching and learning negatively and the number of teachers (the minority)
who disagree that high PTR seldom influence teaching and learning. The biggest percentage of
those that did not admit the influences was 92.3% and the minimum is 62.7%. The highest
percentage of those who do not accept the influences is 37.3% and the minimum is 7.7%. On the
basis of this contrast, the study shows that high PTR in schools would have more disadvantages
than advantages in teaching and learning. This has a close relationship with the findings of
Bascia (2010) on how class sizes (a product of high school PTR) influences learning. His
findings concluded that students in small classes were more engaged in learning than students in
large size classes.
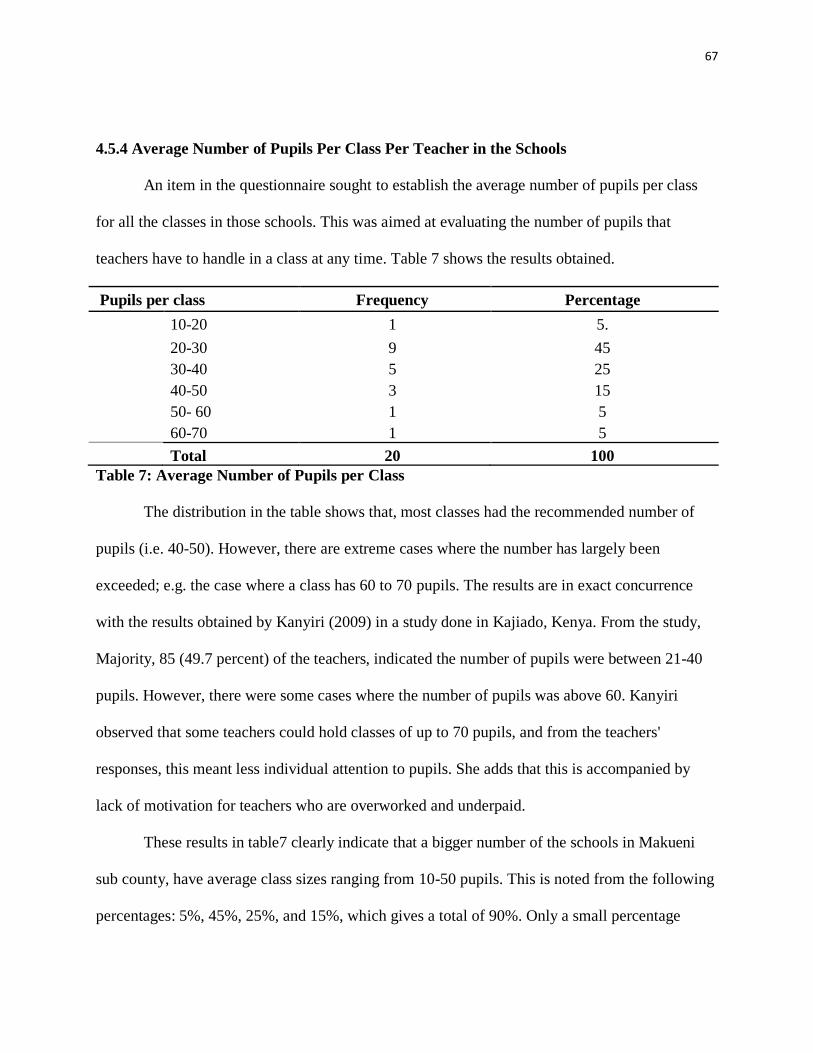
67
4.5.4 Average Number of Pupils Per Class Per Teacher in the Schools
An item in the questionnaire sought to establish the average number of pupils per class
for all the classes in those schools. This was aimed at evaluating the number of pupils that
teachers have to handle in a class at any time. Table 7 shows the results obtained.
Pupils per class Frequency Percentage
10-20 1 5.
20-30 9 45
30-40 5 25
40-50 3 15
50- 60 1 5
60-70 1 5
Total 20 100
Table 7: Average Number of Pupils per Class
The distribution in the table shows that, most classes had the recommended number of
pupils (i.e. 40-50). However, there are extreme cases where the number has largely been
exceeded; e.g. the case where a class has 60 to 70 pupils. The results are in exact concurrence
with the results obtained by Kanyiri (2009) in a study done in Kajiado, Kenya. From the study,
Majority, 85 (49.7 percent) of the teachers, indicated the number of pupils were between 21-40
pupils. However, there were some cases where the number of pupils was above 60. Kanyiri
observed that some teachers could hold classes of up to 70 pupils, and from the teachers'
responses, this meant less individual attention to pupils. She adds that this is accompanied by
lack of motivation for teachers who are overworked and underpaid.
These results in table7 clearly indicate that a bigger number of the schools in Makueni
sub county, have average class sizes ranging from 10-50 pupils. This is noted from the following
percentages: 5%, 45%, 25%, and 15%, which gives a total of 90%. Only a small percentage
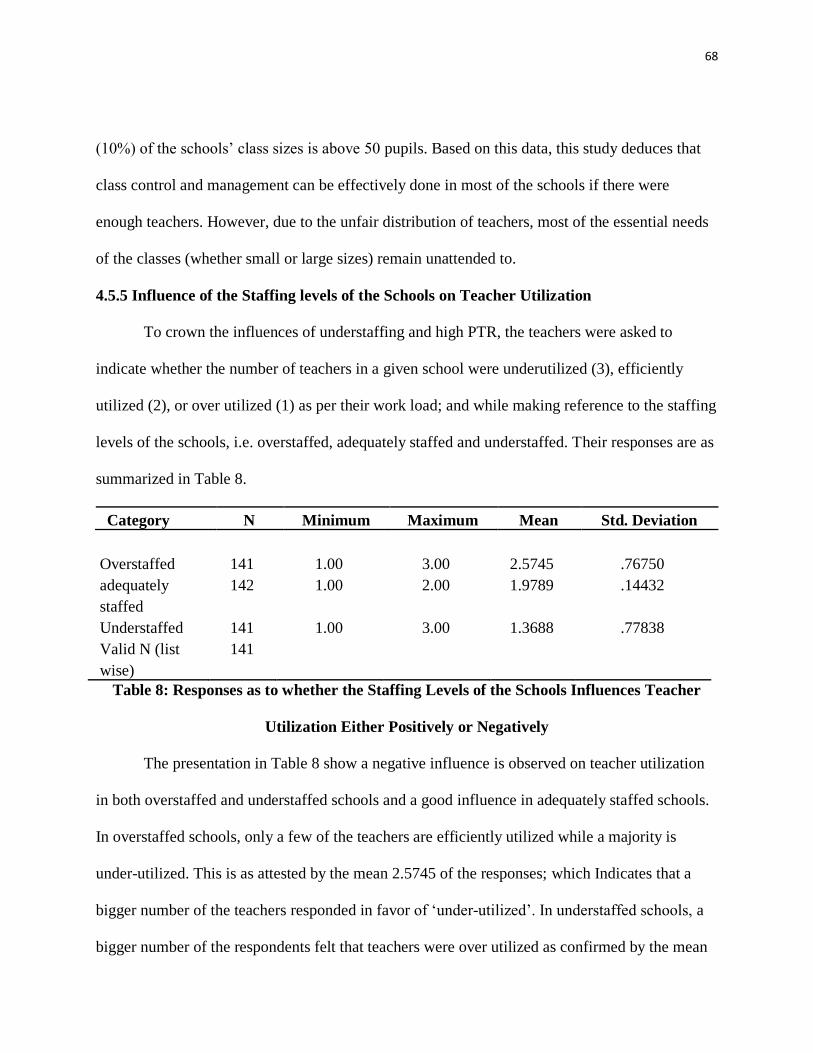
68
(10%) of the schools‟ class sizes is above 50 pupils. Based on this data, this study deduces that
class control and management can be effectively done in most of the schools if there were
enough teachers. However, due to the unfair distribution of teachers, most of the essential needs
of the classes (whether small or large sizes) remain unattended to.
4.5.5 Influence of the Staffing levels of the Schools on Teacher Utilization
To crown the influences of understaffing and high PTR, the teachers were asked to
indicate whether the number of teachers in a given school were underutilized (3), efficiently
utilized (2), or over utilized (1) as per their work load; and while making reference to the staffing
levels of the schools, i.e. overstaffed, adequately staffed and understaffed. Their responses are as
summarized in Table 8.
Category N Minimum Maximum Mean Std. Deviation
Overstaffed 141 1.00 3.00 2.5745 .76750
adequately
staffed
142 1.00 2.00 1.9789 .14432
Understaffed 141 1.00 3.00 1.3688 .77838
Valid N (list
wise)
141
Table 8: Responses as to whether the Staffing Levels of the Schools Influences Teacher
Utilization Either Positively or Negatively
The presentation in Table 8 show a negative influence is observed on teacher utilization
in both overstaffed and understaffed schools and a good influence in adequately staffed schools.
In overstaffed schools, only a few of the teachers are efficiently utilized while a majority is
under-utilized. This is as attested by the mean 2.5745 of the responses; which Indicates that a
bigger number of the teachers responded in favor of „under-utilized‟. In understaffed schools, a
bigger number of the respondents felt that teachers were over utilized as confirmed by the mean
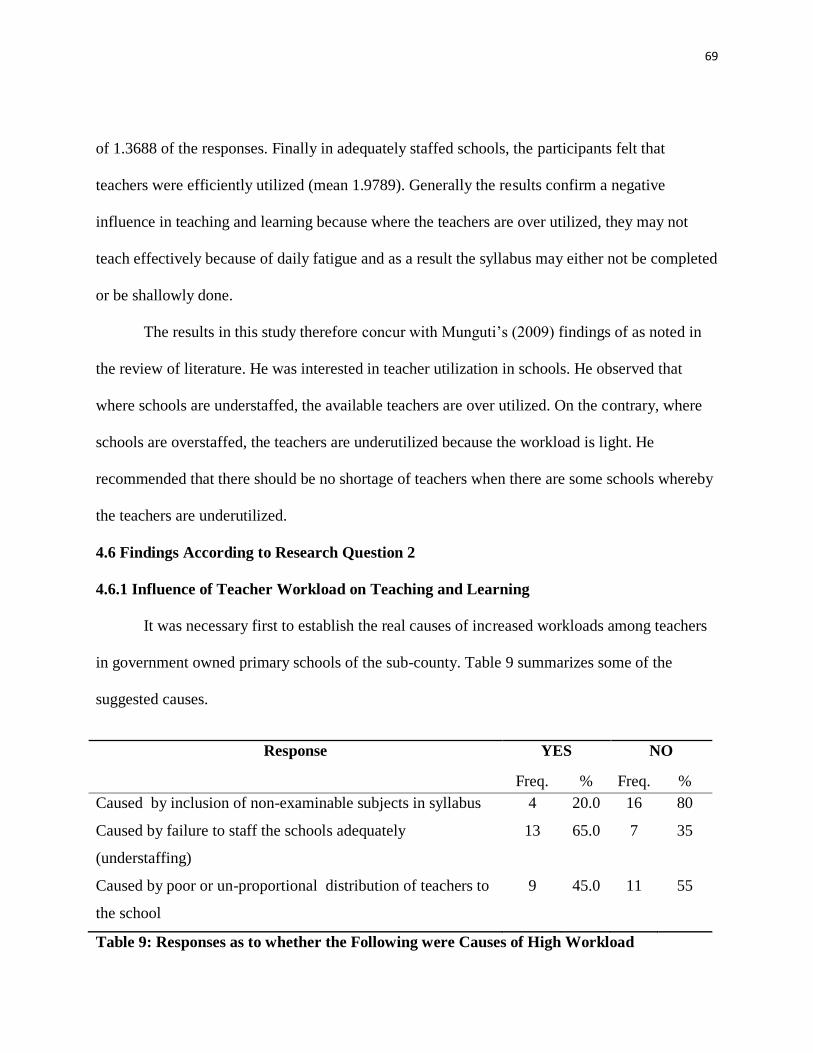
69
of 1.3688 of the responses. Finally in adequately staffed schools, the participants felt that
teachers were efficiently utilized (mean 1.9789). Generally the results confirm a negative
influence in teaching and learning because where the teachers are over utilized, they may not
teach effectively because of daily fatigue and as a result the syllabus may either not be completed
or be shallowly done.
The results in this study therefore concur with Munguti‟s (2009) findings of as noted in
the review of literature. He was interested in teacher utilization in schools. He observed that
where schools are understaffed, the available teachers are over utilized. On the contrary, where
schools are overstaffed, the teachers are underutilized because the workload is light. He
recommended that there should be no shortage of teachers when there are some schools whereby
the teachers are underutilized.
4.6 Findings According to Research Question 2
4.6.1 Influence of Teacher Workload on Teaching and Learning
It was necessary first to establish the real causes of increased workloads among teachers
in government owned primary schools of the sub-county. Table 9 summarizes some of the
suggested causes.
Response YES NO
Freq. % Freq. %
Caused by inclusion of non-examinable subjects in syllabus 4 20.0 16 80
Caused by failure to staff the schools adequately
(understaffing)
13 65.0 7 35
Caused by poor or un-proportional distribution of teachers to
the school
9 45.0 11 55
Table 9: Responses as to whether the Following were Causes of High Workload
70
From the table, understaffing was identified as the most determining cause of high or
increased workloads among teachers (65%). The others were poor or un-proportional distribution
of teachers to the school (45%), and inclusion of non-examinable subjects in syllabus (20%).
This analysis concurred with the findings of both Bukhala‟s (2009) and Munguti‟s (2009) studies
as was indicated in the literature review. Bukhala verified that high teaching load per week was
determined by shortage of teachers while Munguti showed that where schools were understaffed,
the teachers were over utilized.
4.6.2 Lessons of Teachers per Week
In an attempt to find out teacher‟s influence on workload on teaching and learning, the
teachers were requested to put down the total lessons taught per week. The results showed that
out of 142 teachers, the minimum number of lessons (teaching work load) taught by a small
number of teachers was 10. On the other hand, those who indicated the maximum had 40. The
average number of lessons per teacher per week was 32. These results revealed a high disparity
in the number of lessons per teacher per week; where one teacher has as low as 10 while another
struggles with 40. This could be caused by unequal allocation of teachers in schools. The average
of 32 lessons per teacher per week suggests that teachers have relatively high teaching
workloads, and this affects the effectiveness and efficiency of the teachers negatively.
The implication of some the teachers having the least number of lessons per week (10) is
that the schools in which such teachers work are overstaffed. On the other hand, schools in which
teachers with 40 lessons per week work are understaffed. The effect of this difference is the
quality of work (teaching and learning) they produce in each of the respective schools. In
understaffed schools where the workload is overwhelming, little is achieved including failure to
71
complete the syllabus and under teaching in an attempt to quicken the finishing of the syllabus.
Quality teaching and learning is also not guaranteed in overstaffed schools where the workload is
light since some teachers may relax expecting their colleagues to stand in their place to tackle
exhaustively certain topics of the syllabus.
Similar statistics are replicated for head teachers. Out of the 19 who responded to this
item, the minimum number of lessons (teaching work load) per head teacher per week for some
of them was 10 and the maximum was 40. That gave an average of 29 lessons in a week.
Generally, these findings replicate those of Munguti (2009) and Wakoli‟s (2016) studies which
observed that variations were noted in those teaching loads. The variations could be due to the
fact that a school is understaffed or overstaffed and it meant some teachers were over utilized
and others were underutilized. The information captured by documents in the DEO‟s office
showed that, on average, a teacher had between 30 and 40 lessons per week. This is in resonance
with the information from the teachers and head teachers.
Other than lesson preparation, high workload also affects the preparation of professional
documents e.g. records of work. This was as attested by the responses from the HOD‟s when
asked to state the time interval teachers present their records of work to them. From their
responses, 55% of the respondents indicated that the documents were submitted on quarterly
basis; 40% indicated that these were submitted after every one month, and 5% said that they
were submitted yearly.
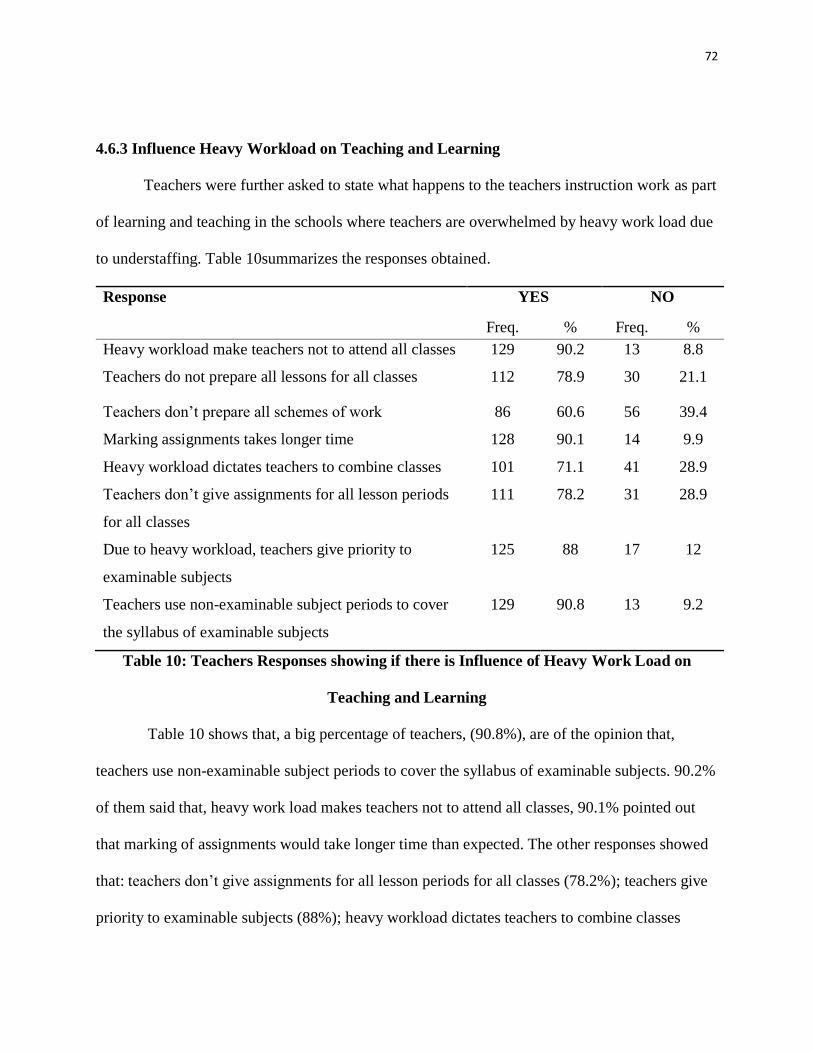
72
4.6.3 Influence Heavy Workload on Teaching and Learning
Teachers were further asked to state what happens to the teachers instruction work as part
of learning and teaching in the schools where teachers are overwhelmed by heavy work load due
to understaffing. Table 10summarizes the responses obtained.
Response YES NO
Freq. % Freq. %
Heavy workload make teachers not to attend all classes 129 90.2 13 8.8
Teachers do not prepare all lessons for all classes 112 78.9 30 21.1
Teachers don‟t prepare all schemes of work 86 60.6 56 39.4
Marking assignments takes longer time 128 90.1 14 9.9
Heavy workload dictates teachers to combine classes 101 71.1 41 28.9
Teachers don‟t give assignments for all lesson periods
for all classes
111 78.2 31 28.9
Due to heavy workload, teachers give priority to
examinable subjects
125 88 17 12
Teachers use non-examinable subject periods to cover
the syllabus of examinable subjects
129 90.8 13 9.2
Table 10: Teachers Responses showing if there is Influence of Heavy Work Load on
Teaching and Learning
Table 10 shows that, a big percentage of teachers, (90.8%), are of the opinion that,
teachers use non-examinable subject periods to cover the syllabus of examinable subjects. 90.2%
of them said that, heavy work load makes teachers not to attend all classes, 90.1% pointed out
that marking of assignments would take longer time than expected. The other responses showed
that: teachers don‟t give assignments for all lesson periods for all classes (78.2%); teachers give
priority to examinable subjects (88%); heavy workload dictates teachers to combine classes
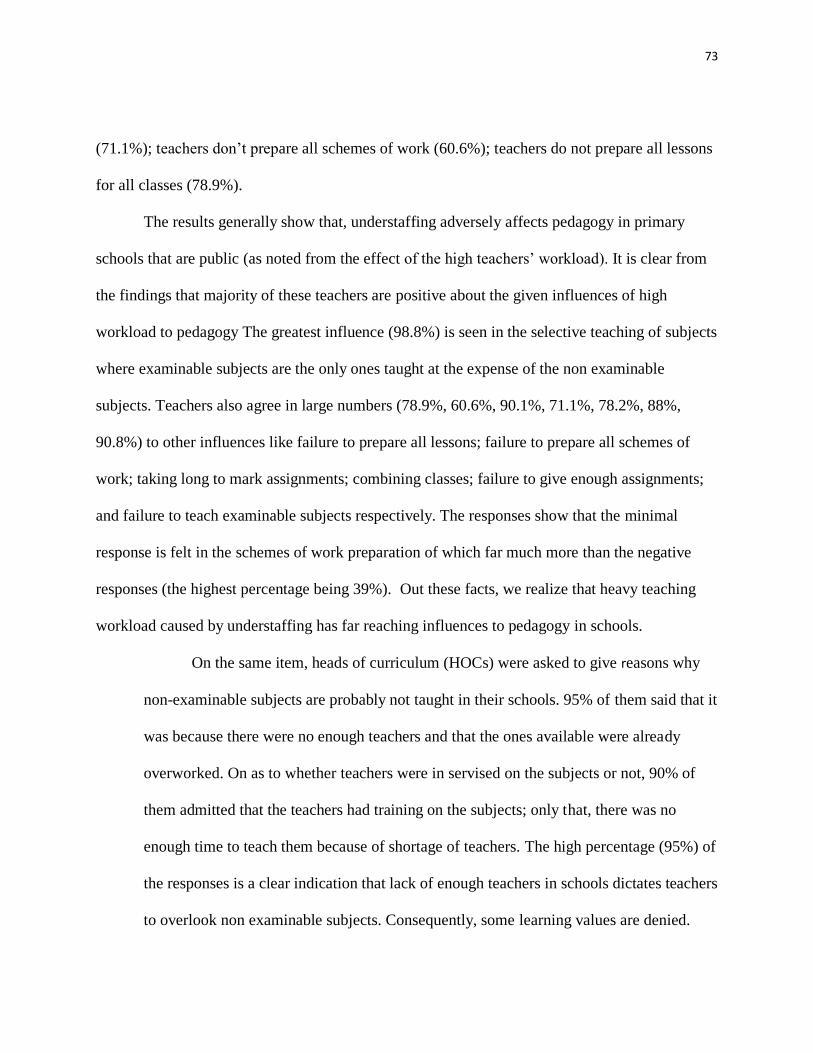
73
(71.1%); teachers don‟t prepare all schemes of work (60.6%); teachers do not prepare all lessons
for all classes (78.9%).
The results generally show that, understaffing adversely affects pedagogy in primary
schools that are public (as noted from the effect of the high teachers‟ workload). It is clear from
the findings that majority of these teachers are positive about the given influences of high
workload to pedagogy The greatest influence (98.8%) is seen in the selective teaching of subjects
where examinable subjects are the only ones taught at the expense of the non examinable
subjects. Teachers also agree in large numbers (78.9%, 60.6%, 90.1%, 71.1%, 78.2%, 88%,
90.8%) to other influences like failure to prepare all lessons; failure to prepare all schemes of
work; taking long to mark assignments; combining classes; failure to give enough assignments;
and failure to teach examinable subjects respectively. The responses show that the minimal
response is felt in the schemes of work preparation of which far much more than the negative
responses (the highest percentage being 39%). Out these facts, we realize that heavy teaching
workload caused by understaffing has far reaching influences to pedagogy in schools.
On the same item, heads of curriculum (HOCs) were asked to give reasons why
non-examinable subjects are probably not taught in their schools. 95% of them said that it
was because there were no enough teachers and that the ones available were already
overworked. On as to whether teachers were in servised on the subjects or not, 90% of
them admitted that the teachers had training on the subjects; only that, there was no
enough time to teach them because of shortage of teachers. The high percentage (95%) of
the responses is a clear indication that lack of enough teachers in schools dictates teachers
to overlook non examinable subjects. Consequently, some learning values are denied.
74
4.6.4 Influence of Understaffing, Heavy Teaching Work load and High PTR on Pupils’
Performance
Further, the teachers were required to give their overall assessment of how much they
thought that understaffing; heavy teaching work load; and high PTR influence pupils‟
performance negatively. This was on a 5-point scale of Very Much (5), Much (4), No Opinion
(3), partially (2), No Influence (1). The responses were then analyzed using descriptive statistics
as shown in Table 11.
Category N Minimum Maximum Mean Std.
Deviation
Understaffing 136 2.00 5.00 4.6765 .63108
Heavy teaching
workload
138 1.00 5.00 4.5435 .80255
High PTR 136 1.00 5.00 4.2647 1.05574
Table 11: Responses as to whether Understaffing; Heavy Teaching Work Load; and High
PTR Influences Pupils’ Performance Negatively
The analysis shows that most of the responses revolved around „Very Much‟ and „Much‟. This is
as attested by the overall means of between 4 and 5. This denotes that a big number of the
responses agree with this idea that, understaffing; heavy teaching work load; and high PTR
generally influence pupils‟ performance negatively.
The analysis complements that of another study carried out in Marsabit Central District
by Gurro (2010), to establish if there was a major relationship between pupils' performance and
the number of teachers. From the study, teachers vehemently agreed that poor academic
performance was caused by shortage of teachers in the school. Thus his study showed that the
fact of inadequate teachers in schools was a factor responsible for low academic achievement.
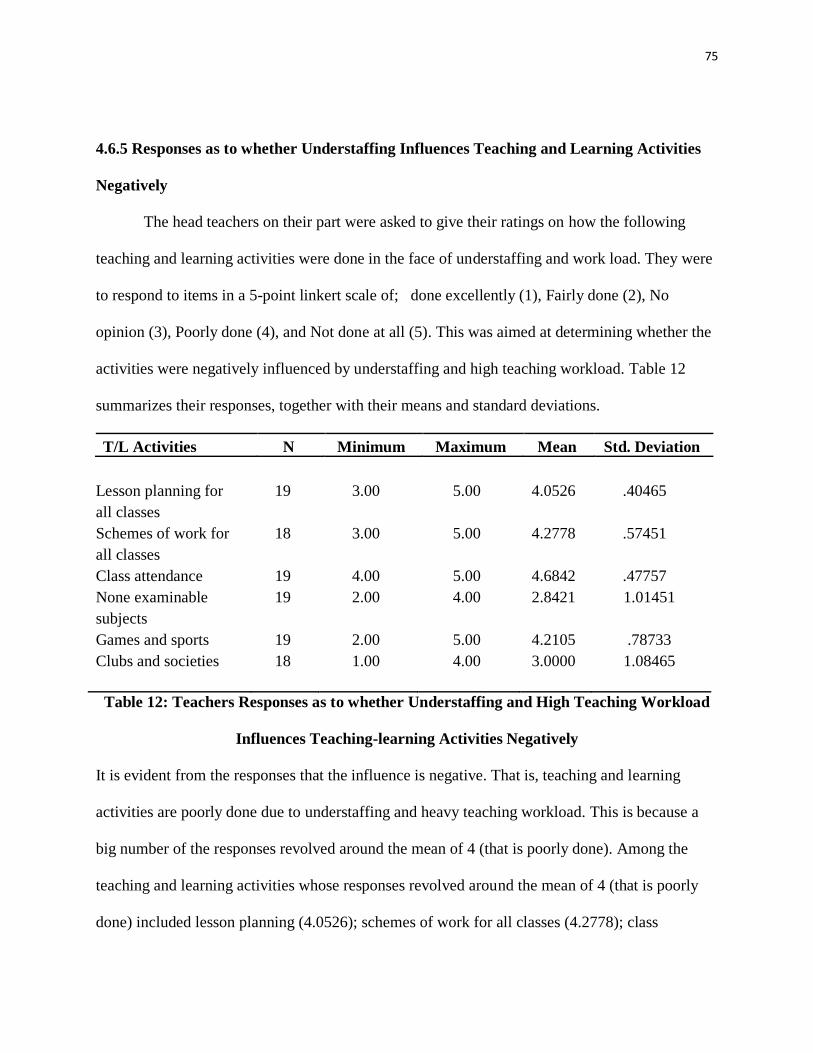
75
4.6.5 Responses as to whether Understaffing Influences Teaching and Learning Activities
Negatively
The head teachers on their part were asked to give their ratings on how the following
teaching and learning activities were done in the face of understaffing and work load. They were
to respond to items in a 5-point linkert scale of; done excellently (1), Fairly done (2), No
opinion (3), Poorly done (4), and Not done at all (5). This was aimed at determining whether the
activities were negatively influenced by understaffing and high teaching workload. Table 12
summarizes their responses, together with their means and standard deviations.
T/L Activities N Minimum Maximum Mean Std. Deviation
Lesson planning for
all classes
19 3.00 5.00 4.0526 .40465
Schemes of work for
all classes
18 3.00 5.00 4.2778 .57451
Class attendance 19 4.00 5.00 4.6842 .47757
None examinable
subjects
19 2.00 4.00 2.8421 1.01451
Games and sports 19 2.00 5.00 4.2105 .78733
Clubs and societies 18 1.00 4.00 3.0000 1.08465
Table 12: Teachers Responses as to whether Understaffing and High Teaching Workload
Influences Teaching-learning Activities Negatively
It is evident from the responses that the influence is negative. That is, teaching and learning
activities are poorly done due to understaffing and heavy teaching workload. This is because a
big number of the responses revolved around the mean of 4 (that is poorly done). Among the
teaching and learning activities whose responses revolved around the mean of 4 (that is poorly
done) included lesson planning (4.0526); schemes of work for all classes (4.2778); class
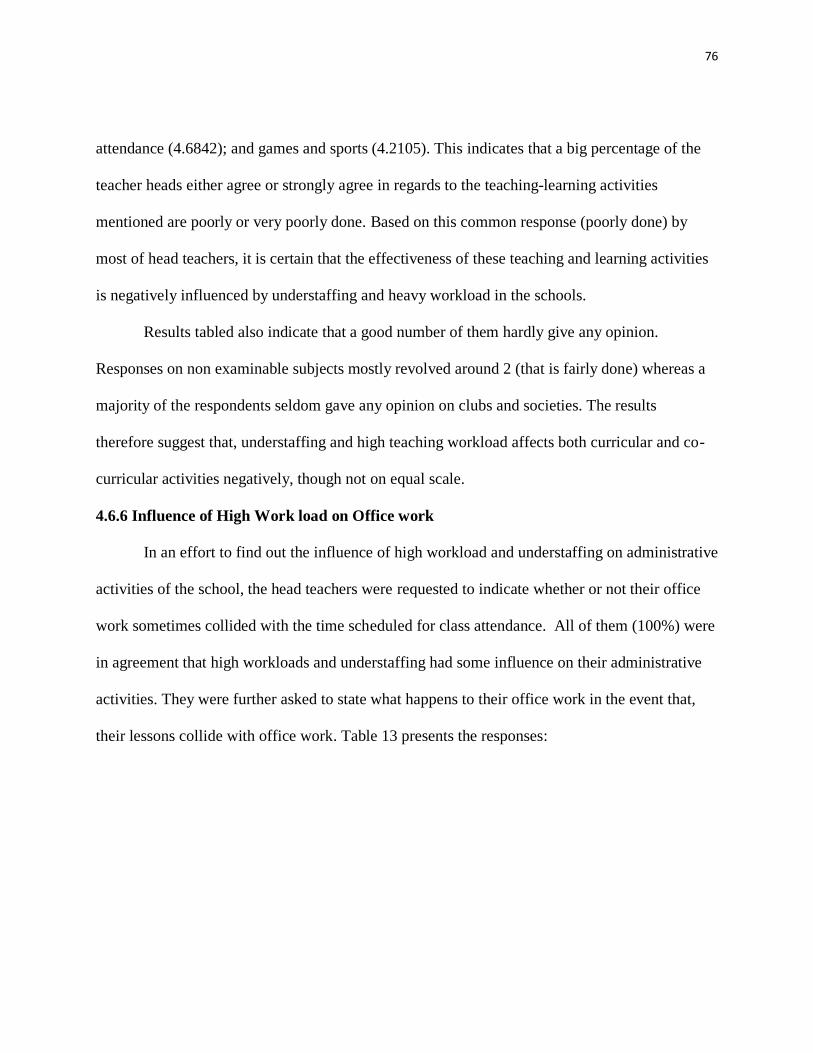
76
attendance (4.6842); and games and sports (4.2105). This indicates that a big percentage of the
teacher heads either agree or strongly agree in regards to the teaching-learning activities
mentioned are poorly or very poorly done. Based on this common response (poorly done) by
most of head teachers, it is certain that the effectiveness of these teaching and learning activities
is negatively influenced by understaffing and heavy workload in the schools.
Results tabled also indicate that a good number of them hardly give any opinion.
Responses on non examinable subjects mostly revolved around 2 (that is fairly done) whereas a
majority of the respondents seldom gave any opinion on clubs and societies. The results
therefore suggest that, understaffing and high teaching workload affects both curricular and co-
curricular activities negatively, though not on equal scale.
4.6.6 Influence of High Work load on Office work
In an effort to find out the influence of high workload and understaffing on administrative
activities of the school, the head teachers were requested to indicate whether or not their office
work sometimes collided with the time scheduled for class attendance. All of them (100%) were
in agreement that high workloads and understaffing had some influence on their administrative
activities. They were further asked to state what happens to their office work in the event that,
their lessons collide with office work. Table 13 presents the responses:
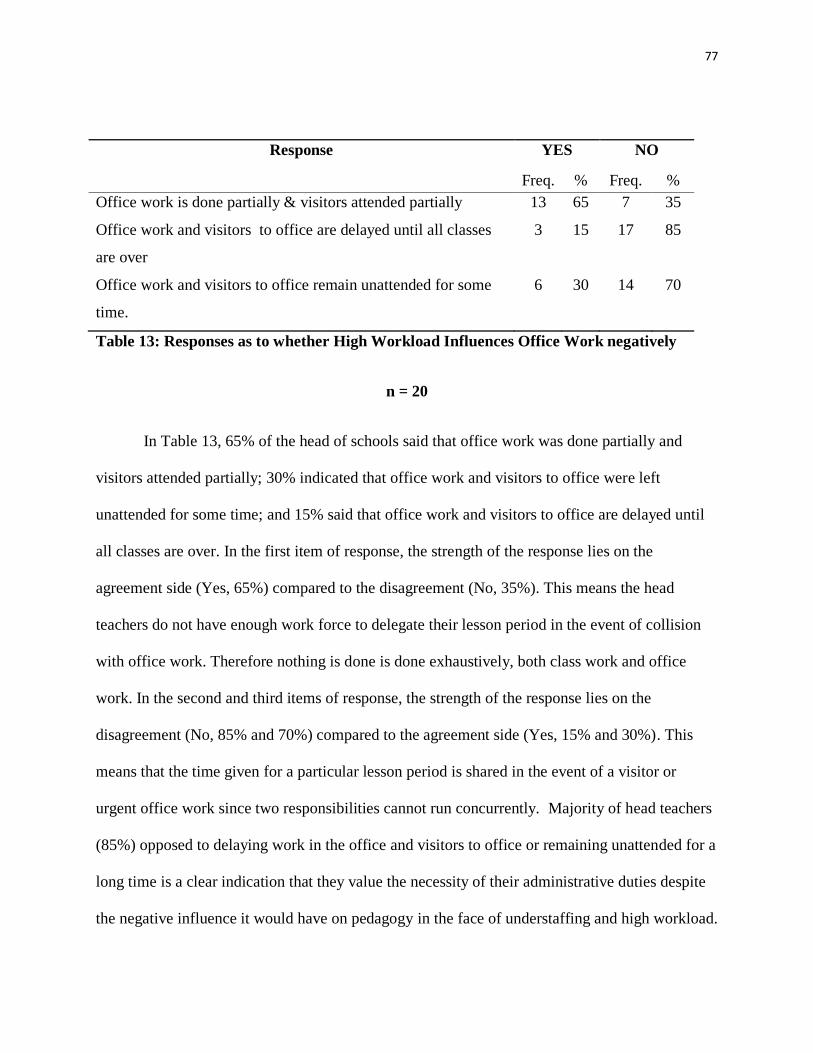
77
Response YES NO
Freq. % Freq. %
Office work is done partially & visitors attended partially 13 65 7 35
Office work and visitors to office are delayed until all classes
are over
3 15 17 85
Office work and visitors to office remain unattended for some
time.
6 30 14 70
Table 13: Responses as to whether High Workload Influences Office Work negatively
n = 20
In Table 13, 65% of the head of schools said that office work was done partially and
visitors attended partially; 30% indicated that office work and visitors to office were left
unattended for some time; and 15% said that office work and visitors to office are delayed until
all classes are over. In the first item of response, the strength of the response lies on the
agreement side (Yes, 65%) compared to the disagreement (No, 35%). This means the head
teachers do not have enough work force to delegate their lesson period in the event of collision
with office work. Therefore nothing is done is done exhaustively, both class work and office
work. In the second and third items of response, the strength of the response lies on the
disagreement (No, 85% and 70%) compared to the agreement side (Yes, 15% and 30%). This
means that the time given for a particular lesson period is shared in the event of a visitor or
urgent office work since two responsibilities cannot run concurrently. Majority of head teachers
(85%) opposed to delaying work in the office and visitors to office or remaining unattended for a
long time is a clear indication that they value the necessity of their administrative duties despite
the negative influence it would have on pedagogy in the face of understaffing and high workload.
78
The responses therefore give a suggestion that, in the event of a collision between class
work and office work, class work is mostly forgone in the peocedure of attending to some office
duties. If there were enough teachers in all the schools, the collision between class work and
office work for head teachers would probably not affect class work since the available teachers
would cater for what the head of schools are engaged in at the moment in terms of pedagogy. On
the contrary, however, teaching and learning are influenced negatively since the head teachers
are forced to share the burden of class work with the few available teachers.
4.6.7 Responses on Influence of Teaching Work load versus Office Work on Class
Attendance
The head teachers were further asked to mention what they did with class work in cases
where they were faced with too much and urgent office work. Fig 2 summarizes the responses
obtained.
Head teachers‟ responses on workload
Fig 3: Influence of High Workload on Class Work
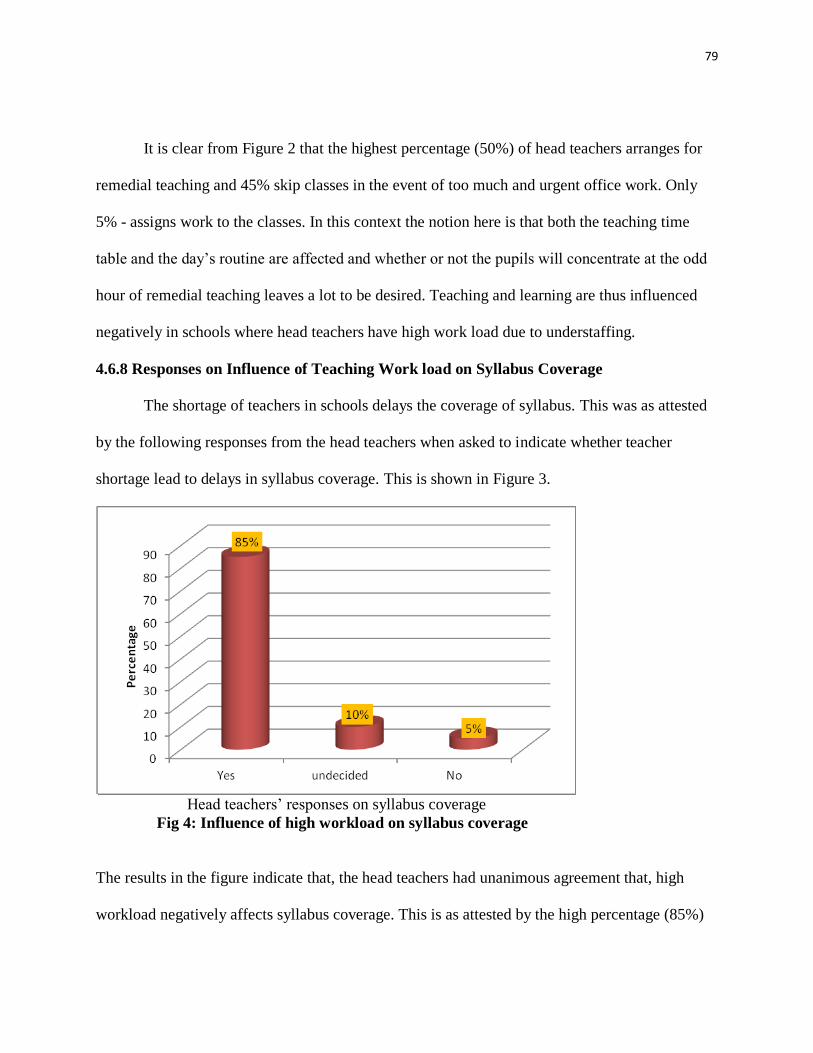
79
It is clear from Figure 2 that the highest percentage (50%) of head teachers arranges for
remedial teaching and 45% skip classes in the event of too much and urgent office work. Only
5% - assigns work to the classes. In this context the notion here is that both the teaching time
table and the day‟s routine are affected and whether or not the pupils will concentrate at the odd
hour of remedial teaching leaves a lot to be desired. Teaching and learning are thus influenced
negatively in schools where head teachers have high work load due to understaffing.
4.6.8 Responses on Influence of Teaching Work load on Syllabus Coverage
The shortage of teachers in schools delays the coverage of syllabus. This was as attested
by the following responses from the head teachers when asked to indicate whether teacher
shortage lead to delays in syllabus coverage. This is shown in Figure 3.
Head teachers‟ responses on syllabus coverage
Fig 4: Influence of high workload on syllabus coverage
The results in the figure indicate that, the head teachers had unanimous agreement that, high
workload negatively affects syllabus coverage. This is as attested by the high percentage (85%)
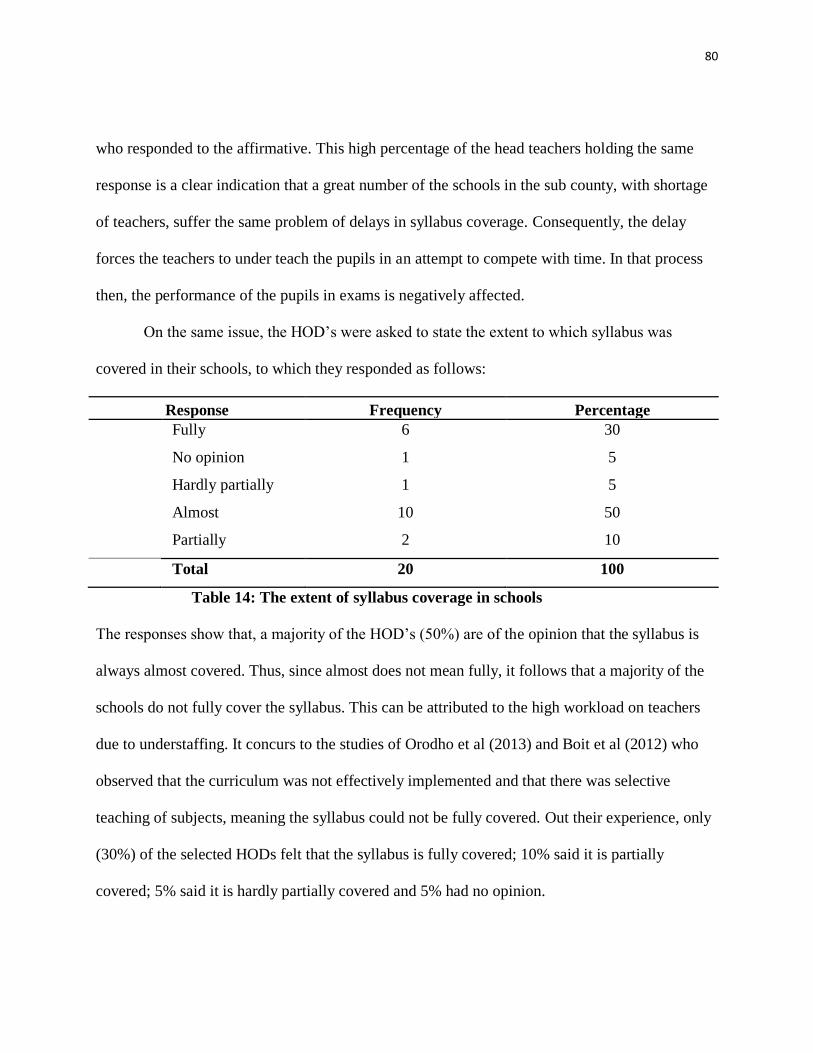
80
who responded to the affirmative. This high percentage of the head teachers holding the same
response is a clear indication that a great number of the schools in the sub county, with shortage
of teachers, suffer the same problem of delays in syllabus coverage. Consequently, the delay
forces the teachers to under teach the pupils in an attempt to compete with time. In that process
then, the performance of the pupils in exams is negatively affected.
On the same issue, the HOD‟s were asked to state the extent to which syllabus was
covered in their schools, to which they responded as follows:
Response Frequency Percentage
Fully 6 30
No opinion 1 5
Hardly partially 1 5
Almost 10 50
Partially 2 10
Total 20 100
Table 14: The extent of syllabus coverage in schools
The responses show that, a majority of the HOD‟s (50%) are of the opinion that the syllabus is
always almost covered. Thus, since almost does not mean fully, it follows that a majority of the
schools do not fully cover the syllabus. This can be attributed to the high workload on teachers
due to understaffing. It concurs to the studies of Orodho et al (2013) and Boit et al (2012) who
observed that the curriculum was not effectively implemented and that there was selective
teaching of subjects, meaning the syllabus could not be fully covered. Out their experience, only
(30%) of the selected HODs felt that the syllabus is fully covered; 10% said it is partially
covered; 5% said it is hardly partially covered and 5% had no opinion.
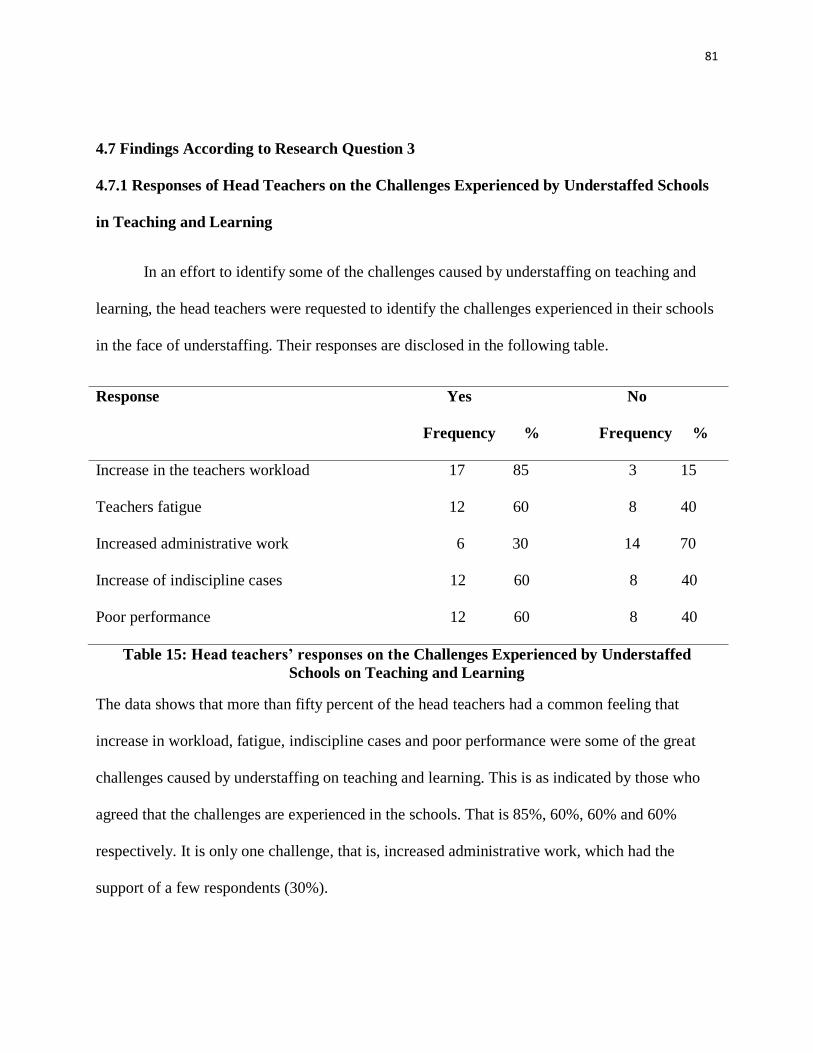
81
4.7 Findings According to Research Question 3
4.7.1 Responses of Head Teachers on the Challenges Experienced by Understaffed Schools
in Teaching and Learning
In an effort to identify some of the challenges caused by understaffing on teaching and
learning, the head teachers were requested to identify the challenges experienced in their schools
in the face of understaffing. Their responses are disclosed in the following table.
Response Yes No
Frequency % Frequency %
Increase in the teachers workload 17 85 3 15
Teachers fatigue 12 60 8 40
Increased administrative work 6 30 14 70
Increase of indiscipline cases 12 60 8 40
Poor performance 12 60 8 40
Table 15: Head teachers’ responses on the Challenges Experienced by Understaffed
Schools on Teaching and Learning
The data shows that more than fifty percent of the head teachers had a common feeling that
increase in workload, fatigue, indiscipline cases and poor performance were some of the great
challenges caused by understaffing on teaching and learning. This is as indicated by those who
agreed that the challenges are experienced in the schools. That is 85%, 60%, 60% and 60%
respectively. It is only one challenge, that is, increased administrative work, which had the
support of a few respondents (30%).
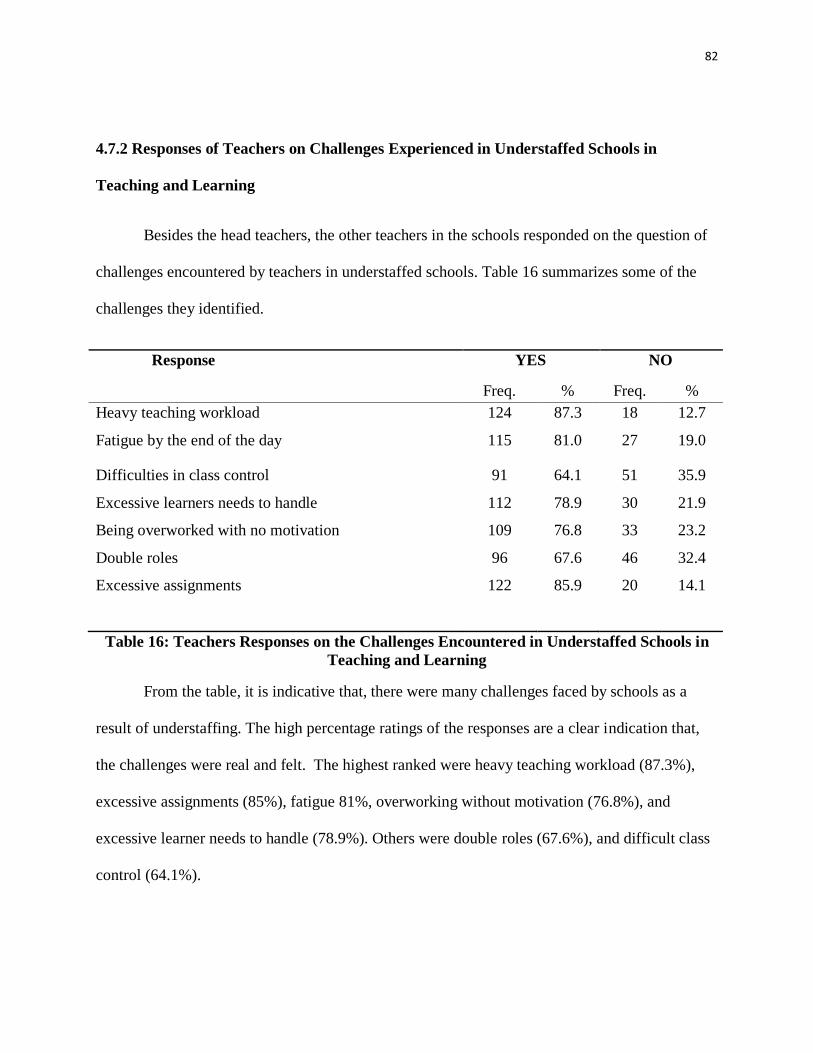
82
4.7.2 Responses of Teachers on Challenges Experienced in Understaffed Schools in
Teaching and Learning
Besides the head teachers, the other teachers in the schools responded on the question of
challenges encountered by teachers in understaffed schools. Table 16 summarizes some of the
challenges they identified.
Response YES NO
Freq. % Freq. %
Heavy teaching workload 124 87.3 18 12.7
Fatigue by the end of the day 115 81.0 27 19.0
Difficulties in class control 91 64.1 51 35.9
Excessive learners needs to handle 112 78.9 30 21.9
Being overworked with no motivation 109 76.8 33 23.2
Double roles 96 67.6 46 32.4
Excessive assignments 122 85.9 20 14.1
Table 16: Teachers Responses on the Challenges Encountered in Understaffed Schools in
Teaching and Learning
From the table, it is indicative that, there were many challenges faced by schools as a
result of understaffing. The high percentage ratings of the responses are a clear indication that,
the challenges were real and felt. The highest ranked were heavy teaching workload (87.3%),
excessive assignments (85%), fatigue 81%, overworking without motivation (76.8%), and
excessive learner needs to handle (78.9%). Others were double roles (67.6%), and difficult class
control (64.1%).
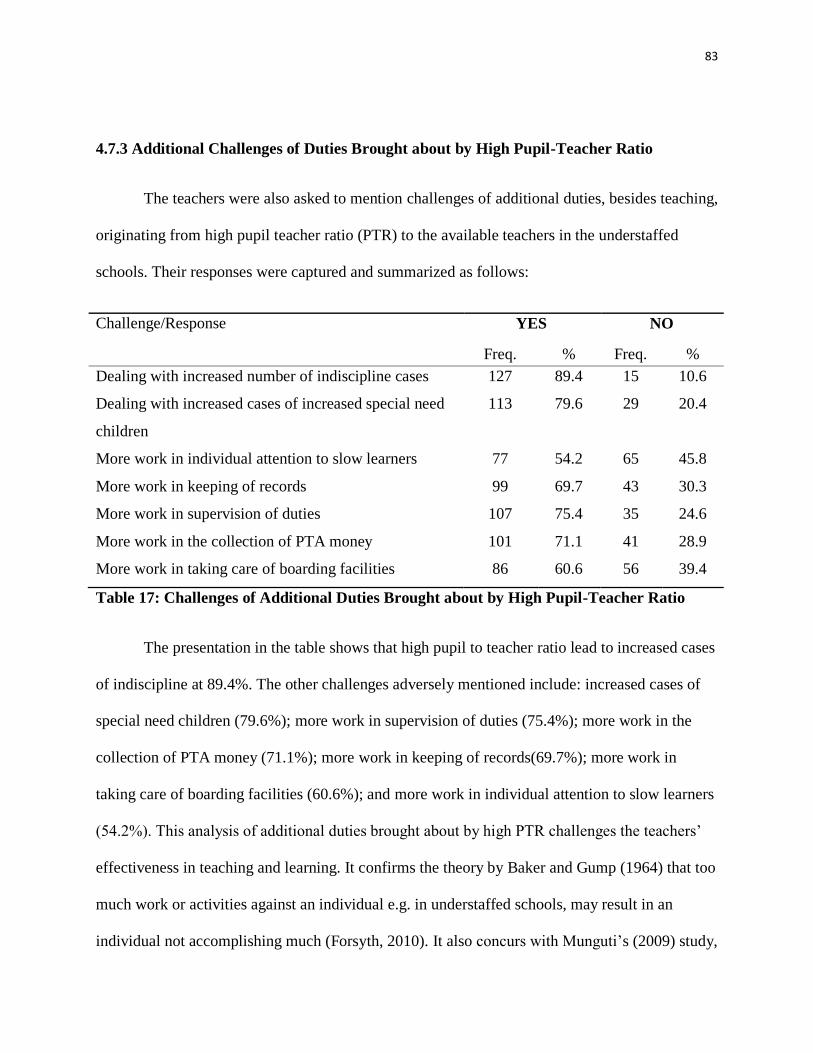
83
4.7.3 Additional Challenges of Duties Brought about by High Pupil-Teacher Ratio
The teachers were also asked to mention challenges of additional duties, besides teaching,
originating from high pupil teacher ratio (PTR) to the available teachers in the understaffed
schools. Their responses were captured and summarized as follows:
Challenge/Response YES NO
Freq. % Freq. %
Dealing with increased number of indiscipline cases 127 89.4 15 10.6
Dealing with increased cases of increased special need
children
113 79.6 29 20.4
More work in individual attention to slow learners 77 54.2 65 45.8
More work in keeping of records 99 69.7 43 30.3
More work in supervision of duties 107 75.4 35 24.6
More work in the collection of PTA money 101 71.1 41 28.9
More work in taking care of boarding facilities 86 60.6 56 39.4
Table 17: Challenges of Additional Duties Brought about by High Pupil-Teacher Ratio
The presentation in the table shows that high pupil to teacher ratio lead to increased cases
of indiscipline at 89.4%. The other challenges adversely mentioned include: increased cases of
special need children (79.6%); more work in supervision of duties (75.4%); more work in the
collection of PTA money (71.1%); more work in keeping of records(69.7%); more work in
taking care of boarding facilities (60.6%); and more work in individual attention to slow learners
(54.2%). This analysis of additional duties brought about by high PTR challenges the teachers‟
effectiveness in teaching and learning. It confirms the theory by Baker and Gump (1964) that too
much work or activities against an individual e.g. in understaffed schools, may result in an
individual not accomplishing much (Forsyth, 2010). It also concurs with Munguti‟s (2009) study,
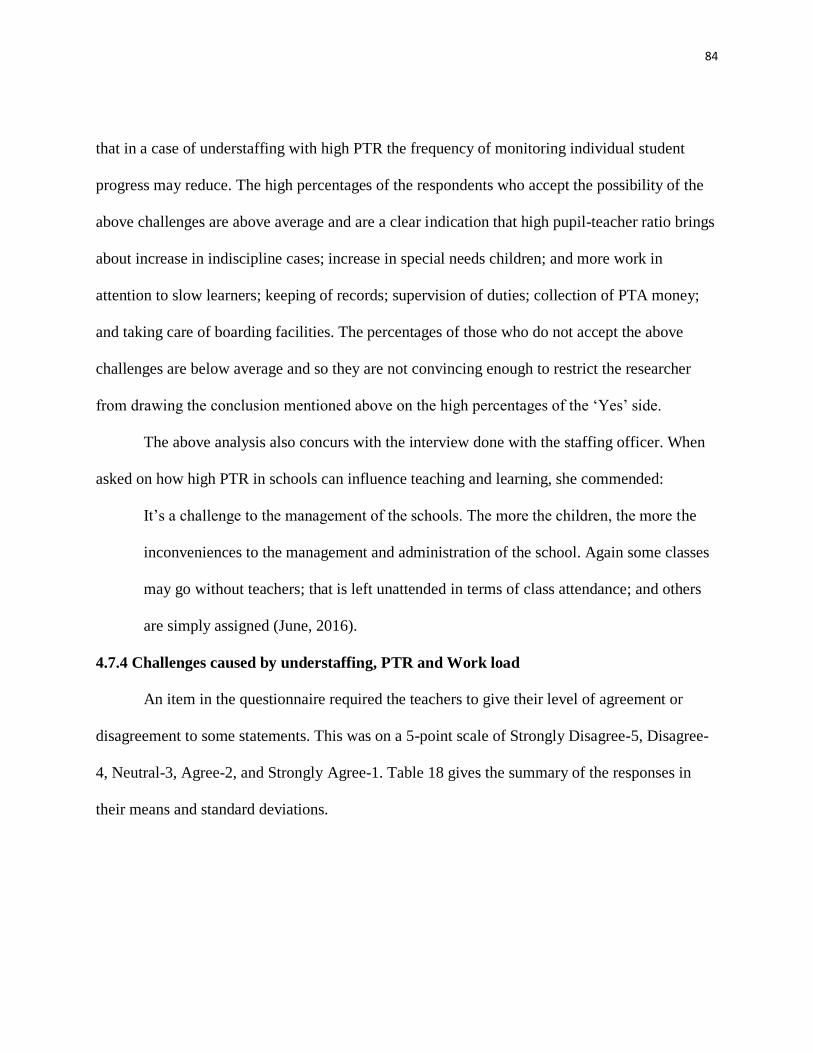
84
that in a case of understaffing with high PTR the frequency of monitoring individual student
progress may reduce. The high percentages of the respondents who accept the possibility of the
above challenges are above average and are a clear indication that high pupil-teacher ratio brings
about increase in indiscipline cases; increase in special needs children; and more work in
attention to slow learners; keeping of records; supervision of duties; collection of PTA money;
and taking care of boarding facilities. The percentages of those who do not accept the above
challenges are below average and so they are not convincing enough to restrict the researcher
from drawing the conclusion mentioned above on the high percentages of the „Yes‟ side.
The above analysis also concurs with the interview done with the staffing officer. When
asked on how high PTR in schools can influence teaching and learning, she commended:
It‟s a challenge to the management of the schools. The more the children, the more the
inconveniences to the management and administration of the school. Again some classes
may go without teachers; that is left unattended in terms of class attendance; and others
are simply assigned (June, 2016).
4.7.4 Challenges caused by understaffing, PTR and Work load
An item in the questionnaire required the teachers to give their level of agreement or
disagreement to some statements. This was on a 5-point scale of Strongly Disagree-5, Disagree-
4, Neutral-3, Agree-2, and Strongly Agree-1. Table 18 gives the summary of the responses in
their means and standard deviations.
85
Statement N Minimum
Maximum Mean Std. deviation
High PTR leads to large class size
and poor instruction
140 1.00 5.00 1.6357 .89129
It is easier to teach a large class
size than a small class size
134 1.00 5.00 4.5821 .93631
It is the approach not the no. of
teachers that determines effective
learning
134 1.00 5.00 3.6567 1.31563
It is the number of teachers who
have shared work not the class size
that determine learning
134 1.00 5.00 3.2463 1.27696
Table 18: Challenges Caused by Understaffing, High PTR, and High Workload
From the means of the responses, teachers disagreed with the statement that “it is easier
to teach a large class size than a small class size”. They also either disagreed or were neutral in
the statements that; “it is the approach not the number of teachers that determines effective
learning (mean=3.6567)”, and “it is the number of teachers who have shared work not the class
size that determine learning (mean=3.2463). In these two figures, the results a middle ground
between the two facts compared. It also shows that the number of teachers matters in
determining effective teaching and learning. However, the respondents were in strong agreement
with the statement that high PTR leads to large class size and poor instruction (mean=1.6357).
Generally the results confirm that understaffing, high PTR and high workload influences
teaching and learning negatively.
On class sizes, the concentration of the responses revolved around (i.e. disagreed to
teaching a large class size for it leads to poor instruction). This means that majority of teachers
would prefer teaching small class sizes in a school where the recommended pupil-teacher ratio is
86
maintained. This can be achieved by staffing the school adequately. About the number of
teachers in a school versus the approach in teaching and the class sizes, most of the responses
revolved around 4 and 3 (disagreed and neutral respectively). In this regard, two points are worth
noting. It means the number of teachers in a school is a key factor on effective teaching and
learning. However, the approach in teaching and the class sizes cannot be ignored. They have a
place to contribute as well on teaching and learning. The overall data given on the table therefore
shows understaffing, high PTR and high workload have a part to play on teaching and learning.
If one goes beyond the recommended, it becomes a challenge to the process of teaching and
learning.
Generally, the discussions on the challenges resulting from high workload, understaffing
and high PTR, are in agreement with the literature on the same. For example, according to the
studies of Gachichio & Gachoka, (2010) and Kikechi et al (2012) teachers were not able to
adequate assignments to pupils and administering of tests were minimal. This is because they
cannot cope with the marking and teaching workload caused by teacher shortage. As a result
there is poor instruction which negatively affects teaching and learning. In situations where the
number of students does not correspond to the number of teachers as recommended by
Curriculum Based Establishment (CBE), EFA (2015) has highlighted that the quality of
education is affected in the event where PTA teachers are hired since they may be less qualified
and they receive little or no professional training.
According to TSC (2012), it was noted that the current staffing norm for schools ignores
the time that teachers need to spend on administrative tasks. Teachers are overwhelmed with
increased work besides teaching depending on the circumstances within the school particularly
87
the ever increasing enrolments in schools. This includes head teachers and deputy head teachers
who are overwhelmed by office work besides class teaching. In such a case where teachers
(especially head teachers) are overwhelmed by workload as a result of understaffing and
increased enrolments, there may be less attention to parents, that is, poor teacher-parent
relationship, Munguti (2009). This results in lack of unity in guiding the pupils. On the same
note, where the head teacher and the deputy are overwhelmed by high teaching workload, cases
of indiscipline are on the rise.
Through the interview schedules, the county staffing officer and the DEO identified
increased teacher workloads, poor syllabus coverage, low academic achievements and poor
attendance to other school activities, as some of the challenges of understaffing in schools.
They however observed that, in as much as the schools faced numerous challenges due to
understaffing, the ministry of education (MOE), and the government, by extension, also got a fair
share of the challenges in trying to solve the problem. Some of the challenges they identified
include; lack of adequate finances for paying teachers‟ salaries; lack of correct and updated
records on teacher shortage; and distribution, and the exponential rise of pupil population in
schools. They noted that over the years the government has never been able to recruit and
employ enough teachers to meet the staffing needs of the schools. In this regard, the staffing
officer, commented: “this has led to increase in the teaching load to the already available
teachers.‟‟ This is therefore a challenge because a teacher who is overwhelmed by heavy
workload does very little both to the individual learner for he has many learners to attend to and
to the class for he/she has many classes to attend to. The fact of increased workload according
the educational offices, consequently lead to other negative influences to teaching and learning in
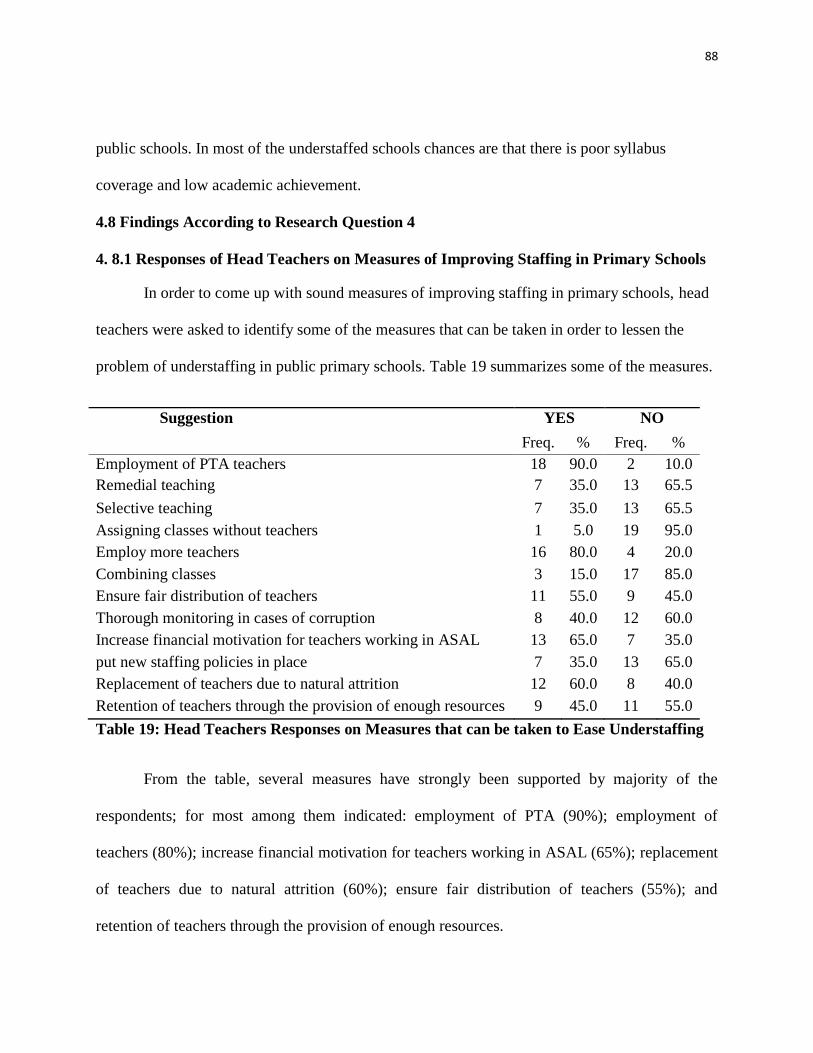
88
public schools. In most of the understaffed schools chances are that there is poor syllabus
coverage and low academic achievement.
4.8 Findings According to Research Question 4
4. 8.1 Responses of Head Teachers on Measures of Improving Staffing in Primary Schools
In order to come up with sound measures of improving staffing in primary schools, head
teachers were asked to identify some of the measures that can be taken in order to lessen the
problem of understaffing in public primary schools. Table 19 summarizes some of the measures.
Suggestion YES NO
Freq. % Freq. %
Employment of PTA teachers 18 90.0 2 10.0
Remedial teaching 7 35.0 13 65.5
Selective teaching 7 35.0 13 65.5
Assigning classes without teachers 1 5.0 19 95.0
Employ more teachers 16 80.0 4 20.0
Combining classes 3 15.0 17 85.0
Ensure fair distribution of teachers 11 55.0 9 45.0
Thorough monitoring in cases of corruption 8 40.0 12 60.0
Increase financial motivation for teachers working in ASAL 13 65.0 7 35.0
put new staffing policies in place 7 35.0 13 65.0
Replacement of teachers due to natural attrition 12 60.0 8 40.0
Retention of teachers through the provision of enough resources 9 45.0 11 55.0
Table 19: Head Teachers Responses on Measures that can be taken to Ease Understaffing
From the table, several measures have strongly been supported by majority of the
respondents; for most among them indicated: employment of PTA (90%); employment of
teachers (80%); increase financial motivation for teachers working in ASAL (65%); replacement
of teachers due to natural attrition (60%); ensure fair distribution of teachers (55%); and
retention of teachers through the provision of enough resources.
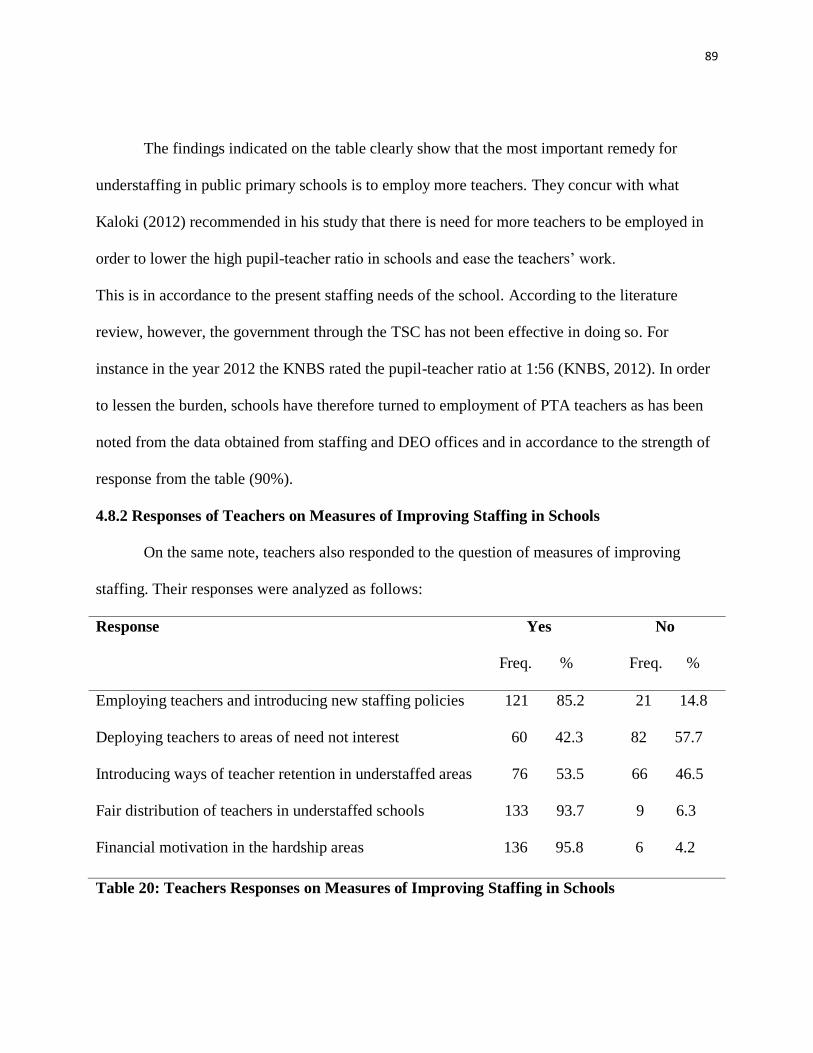
89
The findings indicated on the table clearly show that the most important remedy for
understaffing in public primary schools is to employ more teachers. They concur with what
Kaloki (2012) recommended in his study that there is need for more teachers to be employed in
order to lower the high pupil-teacher ratio in schools and ease the teachers‟ work.
This is in accordance to the present staffing needs of the school. According to the literature
review, however, the government through the TSC has not been effective in doing so. For
instance in the year 2012 the KNBS rated the pupil-teacher ratio at 1:56 (KNBS, 2012). In order
to lessen the burden, schools have therefore turned to employment of PTA teachers as has been
noted from the data obtained from staffing and DEO offices and in accordance to the strength of
response from the table (90%).
4.8.2 Responses of Teachers on Measures of Improving Staffing in Schools
On the same note, teachers also responded to the question of measures of improving
staffing. Their responses were analyzed as follows:
Response Yes No
Freq. % Freq. %
Employing teachers and introducing new staffing policies 121 85.2 21 14.8
Deploying teachers to areas of need not interest 60 42.3 82 57.7
Introducing ways of teacher retention in understaffed areas 76 53.5 66 46.5
Fair distribution of teachers in understaffed schools 133 93.7 9 6.3
Financial motivation in the hardship areas 136 95.8 6 4.2
Table 20: Teachers Responses on Measures of Improving Staffing in Schools
90
The data for teachers given in the table helps us to conclude that among the most effective
measures of improving staffing in schools include financial motivation for teachers in hardship
areas (95.8%) which could be a way to retain them in such areas. In addition to this, teachers also
felt strongly on the measure of fair distribution of teachers to the schools with regard to the needs
on the ground (93.7%) and also employment of more teachers (85.2%) to alleviate the shortage.
These findings concur with the study of Aloo et al (2011) who found out that there was disparity
in the distribution of teachers across counties and recommended improvement on teacher
distribution and retention across schools and staff balancing to enhance equity.
The obligation, however, goes back to the government to consider regular supply of
teachers to the schools. In doing so, this can be accompanied by other supporting measures like
motivating the teachers working in ASAL areas financially and providing them with enough
social amenities. This is because such areas have numerous hardships and teachers avoid them
by way of applying for transfers some of which are corrupted. In addition to this, replacing
teachers who have exited through natural attrition (e.g. retirement and death) is necessary in
order not to leave vacuums in the schools. Moreover, distributing the teachers fairly to the
schools is of vital importance with regard to the staffing needs of the schools themselves. This
obligation goes to the office of the staffing officer in the sub county during recruitment and
deployment of teachers and also monitoring staff balancing per year or per term.
The DEO and the county staffing officer, through the interviews, converge at the
following strategies or measures of minimizing understaffing: ensuring fair distribution of
teachers in schools; manageable class sizes; creation of safe and supportive environment; hiring
and effective replacement of teachers; maintenance of updated records on teacher recruitment;
91
and exit from service, and the allocation of more funds to the education sector for hiring of
teachers.
The suggestions from the teachers, DEO and county staffing officer, are in consonance
with suggestions from different research reports as captured by the reviewed literature. Linda and
Ducommum (2014) suggested that there should be fair and equal distribution of qualified
teachers across districts because of the problem of understaffing- which they call “mal-
distribution” of teachers in the schools. In their study, Ariko and Simatwa (2011), pointed out
that, teacher retention in certain geographical regions of the country, particularly ASAL areas, is
among the most important factors of improving staffing in schools. According to Segun and
Olanrewaju (2011), African governments should improve the teaching conditions of the rural
schools e.g. by providing housing and suitable accommodation. Again, since many teachers are
reluctant to teach in rural areas, rural teachers should be recruited from areas close to where they
are to teach. In addition to this, Goertz, Loeb and Wyckoff (2011) suggest that teachers should
be motivated in a number of ways including: enhancing financial incentives and support e.g.
transport allowances for those working in remote areas.
Moreover, Schaffhaser (2014), recommended the following: transfer reforms; salary
increases; good health insurance; good retirement and pension plans; involving teachers in
decision making; and adequate administrative support.
92
CHAPTER FIVE
SUMMARY, CONCLUSIONS AND RECOMMENDATIONS
5.1 Introduction
The purpose of this study was to investigate the influence of understaffing of teachers on
teaching and learning in public primary schools in Makueni sub-county, Makueni County,
Kenya. This chapter summarizes the findings of the study and presents conclusions,
recommendations and suggestions for further research.
5.2 Summary of the Findings
The research was guided by the following research questions: What is the distribution of
the teaching staff in public primary schools in Makueni sub- County? How does teachers‟ work
load influence teaching and learning in public primary schools in Makueni sub-county? What
challenges are caused by understaffing to the teaching-learning process in Makueni sub-county?
What can be done to improve staffing in the public primary schools of Makueni sub- County?
The methodology employed in the study included both quantitative and qualitative
research methodologies mainly through a cross-sectional survey design. The population of the
study included all teachers employed by the Teachers Service Commission (head teachers and
assistant teachers in public schools in Makueni District). The study also involved an education
officer and the staffing officer in the district. The study adopted the use of simple random
sampling for both the schools and the assistant teachers. Automatic inclusion was used for both
the head teachers and the heads of department (HODs) in the schools, whereas purposive
sampling was used for both the education officer and the staffing officer. The sample size of the
93
study was 20 head teachers, 20 HODs, 151 teachers, 1 staffing officer and 1 education officer.
Data was collected by use of interview guides, questionnaires and document analysis.
Questionnaires were used because they were easier to administer to a large group of
people and get information at the same time. The questionnaires used in this study had both open
ended and closed ended questions. The interview guides were used to gather qualitative data
from sub- County District Education Officer and the staffing officer. The interview guides were
chosen because they allow further probing of respondents for more information; alongside
supplying information which can easily be triangulated with that in the questionnaire. A
document analysis guide was also important for critical examination of public or private
recorded information related to the study. The data was collected and analyzed by use of
Statistical Package for the Social Sciences (SPSS) computer package.
The findings were presented through descriptive statistics by use of percentages, charts,
tables and frequencies. These findings were based on the four major research questions. The first
research question sought to find out how teachers were distributed in public primary schools in
Makueni Sub County. Through data analysis, the study established that, there was unfair or
unequal distribution of teachers among public primary schools; where, three educational zones
had a big shortage of teachers and two had a big number of extra teachers in as far as teacher to
class ratio was concerned. This means that some schools were highly overstaffed while others
suffered acute understaffing. In addition to this the number of classes did not match the number
of teachers in the sub county. There were more classes than teachers and these consequently
dictated high teaching workloads among teachers.
94
The study further revealed that, congestion in classes was the greatest effect of high PTR,
followed by the poor quality education. The challenge of marking assignments was also
identified as a key factor. Other influences of high PTR, as identified by the study were; failure
of teachers to give assignments; lack of individual attention to slow learners; and Poor class
instruction. The analysis of data also found out that, high pupil to teacher ratio led to increased
cases of indiscipline; increased cases of special need children; more work in supervision of
duties; more work in the collection of PTA money; more work in keeping of records; more work
in taking care of boarding facilities; and more individual attention to slow learners.
The second research question sought to find out the level of the teachers‟ work load and
how it influences the process of teaching and learning in the schools. The study found out that,
there was high disparity in the number of lessons per teacher per week; where one teacher has as
low as 10 lessons when his/her colleague elsewhere struggles with 40. This can be attributed to
the unequal distribution of teachers in schools. The average of 32 lessons per teacher per week
suggests that teachers have relatively high teaching workloads, and this compromises the
efficiency and effectiveness of the teachers.
The study further found out that, a high percentage of the teachers use non-examinable
subject periods to cover the syllabus of examinable subjects. A big number of them said that
heavy work load make teachers not to attend classes at all. Others pointed out that marking of
assignments would take longer time than usual. Still on the same issue, the study revealed that,
some teachers didn‟t give assignments for all lesson periods for all classes; some gave priority to
examinable subjects; some would combine classes; some didn‟t prepare all schemes of work; and
others didn‟t prepare all lessons for all classes.
95
For the head teachers, the study established that, a big percentage of them divided their
attention between office work and attention to visitors; a few indicated that office work and
visitors to office were left unattended for some time, as they attend their lessons; and a small
percentage said that office work and visitors to office were delayed until all classes were over.
This meant that, in the event of a collision between class work and office work, class work was
mostly forgone in an attempt to meet the requirements of office work.
The third research question sought to find out the challenges brought about by
understaffing in the teaching learning process in the schools. The study revealed that, majority of
the teachers agreed that understaffing leads to poor subject performance and makes teachers to
miss out on some classes, hence under- teaching due to heavy workloads. They also pointed out
that understaffing resulted to poor quality of teaching.
The study also revealed that, there were many challenges faced by schools as a result of
understaffing. Some of the challenges identified include: heavy teaching workload; excessive
assignments; fatigue; overworking without motivation; excessive learner needs to handle; double
roles and difficult class control. From the study, understaffing was identified as the most
determining cause of high workloads among teachers, followed by poor or un-proportional
distribution of teachers to the schools.
The fourth research question investigated on the measures that can be taken to ease the
problem of understaffing in the schools. From the study it was noted that most schools adopted
employment of PTA teachers. The respondents, however, pointed out that there was need for the
government through the ministry of education to employ more teachers; motivate teachers in
96
ASAL areas financially so as not to look for transfers; and distribute teachers fairly in the
schools with regard to the need.
5.3 Conclusions
Generally, from the foregoing discussions and the evidences provided by the findings, the
following conclusions were made:
With reference to the first research question on distribution of teachers, the findings
revealed that there was indeed understaffing of teachers in public primary schools in Makueni
Sub County. The response got from the sample of head teachers from the schools was reliable in
that half of them agreed that there was understaffing. This was confirmed by data got from the
document analysis guide from the educational offices about staff returns, enrolment of pupils and
number of classes compared to the number of teachers.
In addition to this the data got from the offices of the staffing officer and the DEO of the
sub county confirmed that there is understaffing in the schools. The staffing officer admitted that
both understaffing and overstaffing were evident in the schools with regard to the geographical
locations of the schools. At the same time she claimed that the supply of teachers by the
government, whether by employment or for replacement was not sufficient enough to fill the
gaps existing in the schools. The DEO on his part quoted poor distribution of the teachers in the
schools which could be attributed to the genuine reasons of the teachers‟ transfers or corrupted
cases.
The findings also revealed that there was high pupil-teacher ratio in public primary
schools in Makueni County. The high ratio could be attributed to unfair distribution of teachers
to schools in urban and ASAL areas. The unfair distribution therefore resulted to high workloads
97
among teachers, and this adversely affected teaching and learning; as well as the performance of
administrative duties.
There was a high disparity between the number of pupils in a given school compared to
the number of teachers in that particular school. According to the staffing officer of the county,
most schools had high pupil-teacher ratios, with some having as high 61:1.
The study therefore concludes that understaffing in public primary schools in Makueni
Sub County was basically attributed to insufficient supply of teachers to the schools; poor
distribution of the already available teachers; and high pupil-teacher ratios. This has
consequently affected teaching and learning as well as administrative duties.
According to the second research question on the influence of work load on teaching and
learning, the findings revealed that there was on average high teaching workload among the
teachers in the schools. It was noted that the minimum number of lessons for some teachers in
some schools was 10 and the maximum for others was 40. This was according to the level of
staffing in the schools. The range between 10 and 40 is too large and it shows great variations in
the teaching workloads for teachers in the schools. The implication of these variations is that
some teachers are over utilized while others are underutilized and as a result teaching and
learning are influenced adversely in the schools. The average number of lessons per teacher per
week was considerably high (32). Besides teachers had extra curriculum duties, administrative
duties to perform and professional records to prepare.
When the teachers were asked on how heavy workload affects teaching and learning, the
results were quite adverse. For instance, a great percentage of the teachers said heavy workload
made them not to attend all classes; not to prepare for all lessons and it would also force them to
98
combine classes. This gives a very negative implication to instruction work or delivery in class,
pupils‟ performance and the quality of education given. The findings therefore showed that due
heavy workload teachers were unable to effectively prepare for lessons, deliver knowledge to
learners, and adequately assess them. Co-curricular activities have been affected as well because
teachers are very much occupied, and by the end of the day, they are thoroughly fatigued.
With reference to the third research question, the study concluded that there were
numerous challenges that came along with understaffing on teaching and learning. For instance,
the teachers‟ responses showed that there was ineffectiveness in curriculum implementation due
understaffing. They mentioned heavy workload in understaffed schools which had become a
threat to teaching and learning activities. Since the teachers claimed to be overworked, their
delivery in class was negatively affected. They also taught examinable subjects only. It was also
concluded that there was poor quality education in the face of understaffing. Both assistant
teachers and head teachers admitted that there was poor class attendance due additional duties
brought about by high pupil-teachers ratio besides their heavy workload. According to their
responses, high PTR brought other underlying challenges like more work in administrative
duties; increased discipline cases to deal with and increased special needs of children. The study
also concluded that due to understaffing and high PTR, there were challenges of large class sizes.
The teachers admitted that it was more difficult to teach large class sizes than small class sizes.
They said large class sizes encourages difficulties in class control and poor class instruction.
Generally, the study found out that teaching and learning in public schools was and is influenced
negatively, particularly where the schools are understaffed. In this regard, the most affected is
the teacher and the learner as has been shown in the findings.

99
According to the fourth research question, the study concluded that there was need to
improve or provide a remedy to the state of understaffing in public primary schools. In their
suggestions, teachers and head teachers gave priority to the supply of more teachers through
employment to the schools; ensuring fair distribution of the teachers; and replacement of the
teachers who have already exited through natural attrition. The study also concluded that the
office of the staffing officer should be conducting staff balancing exercise annually with regard
to the staffing needs of the schools and also to keep under check in case of any corrupt deals
which may have taken place in the course of the year. To do this, it is the government‟s
obligation through the Minister of Education (MOE) to give direction and guidelines towards
regulating and balancing of high pupil-teacher ratio and reduction of understaffing so as to
reduce inefficiency in the teaching and learning process. However, the task of responding to the
teacher can also be a collective responsibility by involving the concerned parties, including the
TSC, the KNUT and also teachers themselves in policy formulation. KNUT itself cautions the
MOE that the needs of teachers are currently not well provided for. This lack of the provision has
affected the quality of education in many ways such as; the current teachers have heavy
workload; they are ineffective which leads to poor delivery of service; and the syllabus in most
subjects is not covered, among other effects (KNUT, 2015). EFA (2015) also advises that
teachers should be deployed to the areas of need and derive strategies to retain them.
5.4 Recommendations
In the view of the research findings, the study recommends the following:
The government should employ more teachers to alleviate the situation by reducing the
workload of the existing teachers and improve the quality of teaching and learning. This can be
100
done through regular recruitment and deployment within a specified period of time to arrest the
staff gap in the schools. It was noted from the literature review that even the existing staffing
policies have not been adhered to per se and have not proven effective of solving the problem.
The study therefore, strongly recommends review and regulation of the staffing policies besides
the recruitment and deployment of teachers.
However, in cases where the government fails in its obligation of providing adequate number
of teachers to schools, the parents, sponsors and well-wishers should chip in and employ PTA
teachers. The boards of management in schools in cooperation with parents should also take the
initiative to ensure that teaching and learning take place by employing the needed teachers to
close the gap as they wait the TSC to respond to the need.
The study also recommends that the TSC through staffing officers in the counties should
ensure fair distribution of teachers to all schools in all the regions of the country. From the
findings, 55% of the teachers suggested that teachers should be distributed to schools fairly and
with regard to the staffing need. In order to avoid cases of both understaffed and overstaffed
schools, it is necessary for the government to ensure fair and equal distribution of teachers to
public primary schools. By doing so, the MOE would be avoiding cases of some teachers being
over utilized and others being underutilized. It was revealed from the findings of this study that
teachers in understaffed schools are over utilized while those in overstaffed schools are
underutilized. In addition to this, fair distribution and staff balancing would contribute to fairness
in the provision of quality education for all children in all the schools.
The study also recommends that there should be increase financial motivation for teachers
working in Arid and Semi-Arid Locations (ASAL). This can be done through joint efforts. First
101
by the teachers‟ employer (TSC) and secondly by the boards of management in the schools. It
was revealed from the findings of this study that more than fifty percent of the selected teachers
agreed to this as measure of improving staffing in ASAL. This is because teachers in these areas
undergo a lot of hardships, unlike their colleagues in urban areas. Among the financial
allowances that should be increased include hardship allowances e.g. because of extreme weather
conditions, medical allowance, travelling and house allowances. By doing so, most teachers
would desire to work in such areas to enjoy such privileges. However, this can be done if the
government allocates more funds to the MOE in the budget.
Related to this is the provision of enough social services to the hardship areas. According to
Ariko and Simatwa (2011), providing social services in ASAL is one of the most effective ways
for retention of teachers in such areas as was seen in the literature review Among these
government services include better housing, hospitals, water, electricity and roads. By doing so,
teachers would not look for unnecessary transfers to the urban areas. It would also reduce
corruption cases and the rate of attrition through death.
In addition to this, the study recommends timely replacement of teachers who have exited
the teaching profession for various reasons. It was revealed in the findings of this study that sixty
percentage of the selected respondents agreed to this item. There are those who have exited the
profession through death and retirement. There are others who join other professions; others may
opt to do business and others may be employed in private schools for better pay. All these
teachers leave a gap in the teaching and learning activities of the school. The more that gap stays
and widens, the more the consequences in the provision of quality education to the learners.
102
Therefore, there should be proper communication network and immediate response when such
cases happen in the schools.
5.5 Suggestions for Further Research
Based on the findings of the study the researcher makes the following suggestions for further
research:
i) A research on the factors influencing unfair distribution of teachers in public primary
schools in Kenya.
ii) A research on how high Pupil-Teacher Ratio affects the social interaction between the
teacher and the learners
103
REFERENCES
Abagi, O. &odipo G. (1997). Efficiency of Primary Education in Kenya: Situational
Analysis and Implications for Education Reform Discussion Paper No. DP 004/97.
Nairobi: Institute of Policy Analysis and Research.
Akunga, J. O. (2012). Influence of School Based Factors on Student Performance in KCSE in
Public Secondary Schools in Masaba South District, Kisii County, Kenya. University of
Nairobi: Jomo Kenyatta Memorial Library.
Antoninis, M. (2014).A Shortage of Teachers is Putting Children’s Learning at Risk. World
Education Blog.EFA Global Monitoring Report. Retrieved on 12th
June 2014 from
http://efareport.worldpress.com/2014/02/25/...
Anwoga, Y. (August, 2012). Let’s Close the Teachers’ Gap Once and for All.
Retrieved 5th
April 2013 from http://allafrica.com/../201208060994.html
Baker, R. & Gump, P. (1964).Big School Small School. Stanford: Stanford University Press.
Retrieved on 14th
July 2013 from http://en.wikipedia.org/wiki/staffing_theory
Bascia, N. (2010). Reducing Class Size. What Do We Know? Ontario Institute for Studies in
Education.
Boit.M; Njoki Sr.A.; and Chang‟ach J. K. (2012). The Influence of Examinations on the Stated
Curriculum Goals. American International Journal of Contemporary Research Vol. 2 (2),
179-182. Moi University Eldoret Kenya.
Borg, W. R. & Gall, M. D. (1989).Educational Research.5th
edition. New York:
Longman.Inc.
Bukhala, J. B. (2009). Factors Affecting Student Performance in National Technical
104
Examination in Selected Technical Institutions in Western Province of
Kenya.Unpublished Thesis, Catholic University of Eastern Africa.
Cherry, K. (2015).What is Cross-sectional Research Study? The Advantages and Challenges of
Cross-sectional Studies. Retrieved January 2015 from Psychology.about.com>
About.com > About Education > Psychology > Psychology Research Methods > Types
of Research Studies
Duflo, E., Pascaline, D.& Michael, K. (2015). School Governance, Teacher Incentives and Pupil-
Teacher Ratios: Experimental Evidence from Kenyan Primary Schools. Journal of Public
Economics 123(2015) 92-110.
Education for All Global Monitoring Report (2015) Policy Paper 19 The challenge of teacher
shortage and quality: Have we succeeded in getting enough quality teachers into
classrooms? UNESCO Education Sector, ILO/UNESCO Committee of Experts. Paris.
Fetterman, D. (1989). Ethnography: Step by Step. Newsbury Park, California: Sage
Publications, file://G:/staffingtheory-wikipedia, (extracted August 13, 2014).
Forsyth, D. (2010). Group Dynamics. (5th
ed.). Belmont, CA: Wadsworth, Cengage Learning
Fouka, G.&Mantzorou, M. (2011).What are Major Ethical Issues in Conducting Research? Is
There a Conflict Between the Research Ethics and the Nature of Nursing? Health Science
Journal, 5(1), 3-14. Retrieved on 7th
September 2015 from
htt://www.researchgate.net/publication/23.
Fraenkel, J. R. &Wallen, N. E. (1993). Educational Research. A Guide to the
Process.New York: Macgraw-Hill.
Gachichio, E. and Gachoka, E. (2010). Instructional Technologies for Education and Training: A
105
Case Study of the KIE. (Paper presented at the 1st KIE Symposium, Nairobi, Kenya.
Gall, M.D., Gall, J.P. and Borg, W.R. (2007) Educational research: an introduction. (8th
edition). Needham Height MA: Allyn and bacon.
Gay, L. R., Geoffrey, E. M. & Peter, A. (2009). Educational Research: Competencies for
Analysis and Applications. Pearson: Pearson Prentice Hall. Retrieved on 7th
. September
2015 from www.prenhall.com/gay/
Goertz, M. Loeb, S. & Wyckoff, J. (2011). Recruiting, Evaluating and Retaining Teachers: The
Children First Strategy to Improve New York City‟s Teachers. Centre for Education
Policy Analysis. Education Reform in New York City, Cambridge MA: Harvard
Education Press.
Gurro, Y.I. (2010). An Investigation into Factors Causing Poor Academic Performance
in KCSE Examination in Marsabit Central District Kenya. Unpublished Thesis: Catholic
University of Eastern Africa
Hall, J. (2013). Cross-sectional Survey Design. SAGE Journals: Encyclopedia of Survey
Research Methods. Retrieved on 14th
December 2013 from
http://srmo.sagepub.com/../n120.xml
Images for Makueni County Map Showing Educational
http://www.kenyampya.com/index.php?county=makueni
Images for www.makueni.county map Source: http://softkenya.com/county/makueni-county/
Kaloki J. W (2012). Pupil-Teacher Ratio and its impact on academic performance in public
primary schools in central division, machakos county. Unpublished Thesis. kenyatta
university.
Kanyiri, J. W. (2009). Determinants of Supply and Demand of Primary School Teachers
106
In Kajiado District. Unpublished Thesis. Catholic University of Eastern Africa.
KENPRO (2010).Challenges Facing the Implementation of FPE in Kenya. Online Papers
Portal.www.kenpro.org/papers.
Kenya National Bureau of Statistics (2012). Enrolment in Primary Schools 2012 Ratios.
Kenya Facts and figures.
Kenya National Union of Teachers (2013). Kenya- Stop Teacher Shortage Now. Retrieved on
19th
April 2013 from https://www.ei-ie.org/en/...
Kenya National Union of Teachers (2015) Trends of the Needs of Teachers in Public
Schools in Kenya
KIE (2012). Primary Education Syllabus. Republic of Kenya. Ministry of Education
Kikechi, R.W.; Kisebe, C.S.M; Gitahi, K.; and Sindabi. O (2012). The Influence of Free
Primary Education on Kenya Certificate of Primary Education Performance in Kenya.
Problems of education in the 21st century Vol. 39, 71-81.
Kinyua, E. W. (2011). A study about Critical Success Factors that Influence Students Academic
Performance in Public Secondary Schools in Gatundu District. Unpublished Thesis.
Catholic University of Eastern Africa.
Kitchin, R. & Kate, N. J. (2001).Conducting Research in Human Geography:Theory,
Methodology and Practice. London: Prentice Hall.
KNUT, (May, 2012). Kenya: Pay and Teacher Shortages at Top of Union Agenda. Education
International. Retrieved on 12th
August 2013 from www.ei-ie.org/../2171
Kothari, C.R. (2005). Research Methodology. Methods and Techniques (2nd
ed.). New Dheli:
New age International.
Lancaster, G., Dodd, S., & Williamson, P. (2004). Design and Analysis of Pilot Studies:
107
Recommendations for Good Practice. Journal of Evaluation in clinical Practice 10(2),
307-12.
Linda, D.H. &Ducommum (2014). Recruiting and Retaining Teachers: What Matters Most
and What can Government Do? The Forum- for Education and Democracy: Starnford
University. Retrieved on 10th
February 2014 from
www.help.senate.gov/imo/media/doc/D...
Maithya P. M and Akalas W. J. (2014). Effects of Teacher Recruitment and Utilization Policy on
Quality of Secondary School Education in Kenya. IOSR Journal of Research & Method
in Education (IOSR-JRME) e-ISSN: 2320–7388,p-ISSN: 2320–737X Volume 4, Issue 1
Ver. III (Jan. 2014), PP 10-17.
Mcmillan J.H., & Schumacher S. (2001). Research in Education: A Conceptual Introduction, 5th
Eddition. Longman, New York.
Merfat A. A. (2016). Curriculum Development: Teacher Involvement in Curriculum
Development. Journal of Education and Practice www.iiste.org. ISSN 2222-1735 (Paper)
ISSN 2222-288X (Online) Vol.7, No.9, 2016. Western Michigan University, 1903 W
Michigan Ave, Kalamazoo, MI 49008
Mitchel, M. &Jolley, J. (2009).Research Design Explained. Belmont: Cengage Learning.
Ministry of Education Science and Technology. (2014). Basic Education
Statistical Booklet. Retrieved from MOEST 2014 basic education statistical
booklet.pdf - Ministry of Education on August 2016.
Mugenda, O. M. &Mugenda, A.G (2003). Research Methods. Nairobi-Kenya: ACTS
Press.
108
Munguti, P.M. (2009). Effects of Teacher Recruitment and Utilization Policy on the quality of
Secondary School Education in Kenya. Unpublished dissertation.Catholic University of
Eastern Africa.
Mwika, B. (2010). Assessment of Stakeholders Influence on Academic Performance in Public
Primary Schools: A Case of Akithii Division of Tigania West District. Unpublished
Thesis. Jomo Kenyatta Memorial Library: University of Nairobi.
NACOSTI. (2015). Guidelines for Online Application of Research Permit. Retrieved on 7th
September 2015 fromhttp://oris.nacosti.go.ke/guidelines.php
Noble, H. (2015). Issues of Validity and Reliability in Qualitative Research. School of Nursing
and Midwifery. Queens‟s University Belfast. Medical Biology Centre, 97. Lisburn Rd,
Belfast BT 9 7BL, UK. Retrieved on 19th
November 2015 from eb.bmj.cm/../-2015-
102054
Nzoka, J.M. (2011). Teachers’ Perceptions on Hardship Allowance in Kaiti and Kalama
Divisions in Makueni and Machakos Counties, Kenya. Unpublished Thesis. Catholic
University of Eastern Africa Library: Nairobi, Kenya.
Ogula, P.A. (2005). Research Methods. Department of Education. Catholic University of
Eastern Africa. Nairobi-Kenya: CUEA Publications.
Omondi P. J. N. (2011). The Influence of Workload on Performance of Teachers in Public
Primary Schools in Kombewa Division, Kisumu West District, Kenya Unpublished
Thesis Submitted in Partial Fulfillment of the Requirement for the Degree of Master of
Business Administration School of Business, University of Nairobi,
Orodho,J.O.; Waweru, P.N.; Ndichu, M.; and Nthinguri, R. (2013). Basic Education in Kenya:
109
Focus on Strategies Applied to Cope with School-based Challenges Inhibiting Effective
Implementation of Curriculum. International Journal of Education and Research Vol. 1
(11), 1-20.
Otike, F. W. &Kiruki B. (2011). Free Primary Education in Kenya and its
Challenges in Fighting Illiteracy. Journal of Education and Practice, 2(3), 146-155.
Disadvantages. https://quizlet.com/
Reche, G., Bundi, T., Riungu, J., &Mbugua, Z. (2012). Factors Contributing to Poor
Performance in KCPE in Public Day Primary Schools in Mwibi Division, Maara
District, Kenya. International Journal of Humanities and Social Sciences, 2(5), 127-133.
Retrieved on 6th
October 2014 from http://www.ijhssnet.com/journals/Vol-2-5-March-
2012/14.pdf
Republic of Kenya (2002). MOE Syllabus.
Richardson, S. (retrieved Dec. 6, 2016). What is the Limitation of Administrative Management
Theory. http://employment.blurtit.com/838224/what-is the-limitation-of-administrative-
management-theory
Riechi, A. R. (2006). Towards Improving Kenya’s Primary Education. Discussion Paper
No. 087/2006: Institute of Policy Analysis and Research
Roundy, L. (2003).Cross-sectional Research. Retrieved on 22nd
December 2013 from
study.com/academy/lesson/cross-sect…
Schaffauser, D. (2014).The Problem isn‟t Recruiting, It‟s Retention: Transforming Education
Through Technology. The Journal Staff. Retrieved on October 10, 2014

110
Segun, O. &Olanre, O. (2011). Improving the Conditions of Teachers and Teaching in Rural
Schools Across African Countries. UNESCO, Addis Ababa: International Institute for
Capacity Building in Africa. Retrieved on 17th
February2014 from
http://unesdoc.unesco.org/../216062e.pdf
Simiyu, P. (2012). Understaffing over Environment, a Challenge to Good Results in Siboti Zone
Of Bumula. westfm.co.ke/index-page-news-bid-58).
Teachers Service Commission. (2015). Annual Report 2014/2015. Nairobi:
TSC.
Teachers Service Commission. (2012). Issues and Challenges on Recruitment and Management
of Teachers.
Teachers Service Commission. (2014). TSC Act 2012 Revised Edition. Nairobi: National
Council of Law Reporting.
UNESCO Institute of Statistics (2011).The Global Demand for Primary Teachers. Retrieved on
23rd
August 2013 on www..uis.unesco.org/education/document…
Information No. 6: UIS/IS/2011/6.
UNESCO (2015). Retrieved on 10th
September 2016.from en.unesco.org/sdgs;
Wakoli C. (2016). Effects of Workload on the Teachers‟ Performance
in Kanduyi Division, Bungoma District. International Journal of Science and Research
Vol. 5(10), 1215-1219. Retrieved from
https://www.ijsr.net/archive/v5i10/SUB154454.pdf in November 2016.
Wamalwa, E.W. (2014). Towards the Utilization of Instructional Media for Effective Teaching
111
and Learning of English in Kenya. Journal of Education and Practice, 5(31), 140-148.
Retrieved on August 2015 from http:// www.academia.edu/9097051/towards.
Wamukuru, D.K. (2011). Selected Factors Determining Secondary Teacher Demand in Kenya:
Trends, Effects and Projections. Unpublished Thesis. Egerton University.
Wanjoi, A. (2013). Challenges Facing Kenya in Achieving Education for All: Kenya Projects
Organization (KENPRO). Retrieved on 18th
February 2014 from
www.kenpro.org/challenges_facing-ke...
Wicker, A. (1968). Staffing Undermanning, Perfomances and Students‟ Subjective Experiences
in Behavior Settings of Large and Small Schools. Journal of Personality and Social
Psychology, 10(3), 255-261. Retrieved on August 2015 from
http://en.wikipedia.org/wiki/staffing-theory, April 2015.
World Bank Group (2009). Pupil-Teacher Ratio Primary.
Zaniewski, A. & Garza, R. (2014).DPPS Teacher Shortage Lead to overcrowded Classes.
California: Detroit Free Press Education Writer. Retrieved 10th
October 2014
fromwww.freep.com/../16298217/
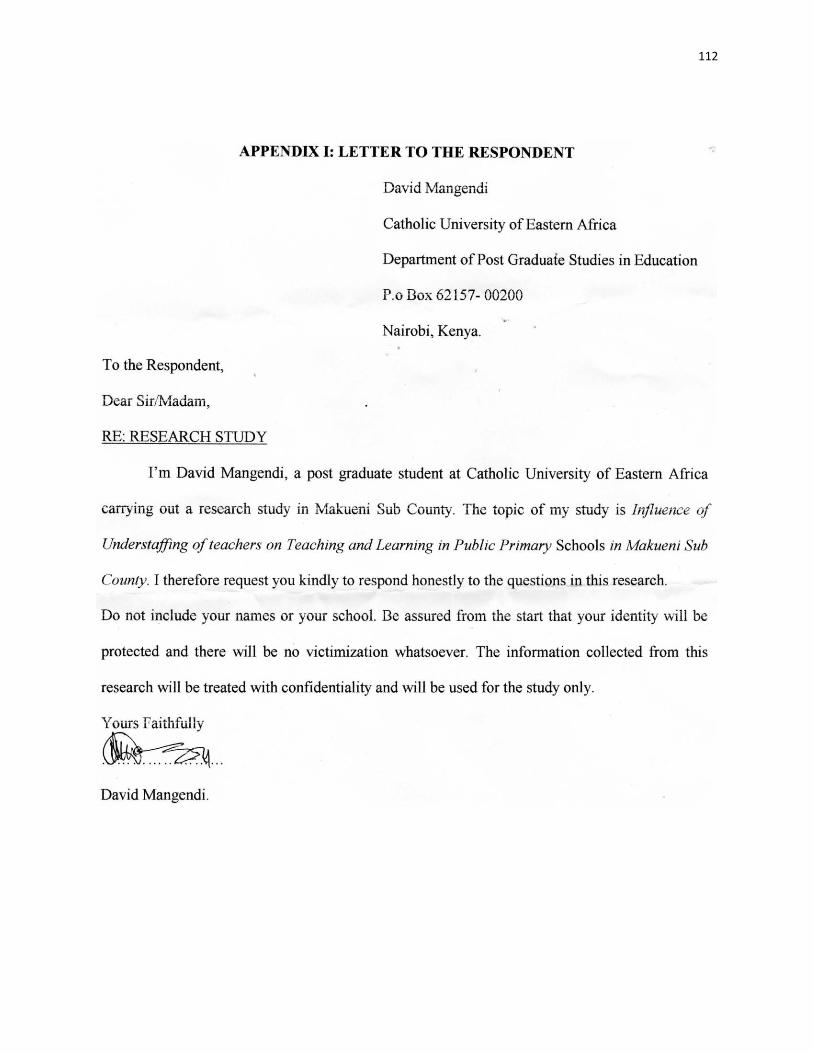
112
113
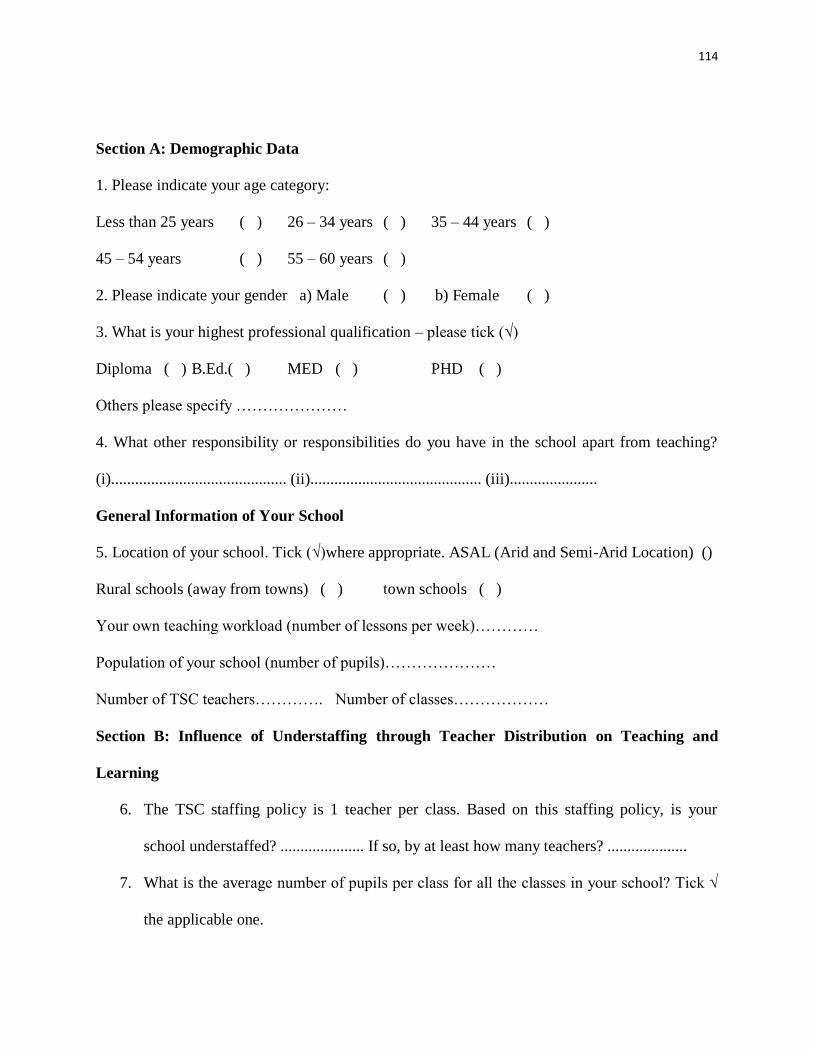
114
Section A: Demographic Data
1. Please indicate your age category:
Less than 25 years ( ) 26 – 34 years ( ) 35 – 44 years ( )
45 – 54 years ( ) 55 – 60 years ( )
2. Please indicate your gender a) Male ( ) b) Female ( )
3. What is your highest professional qualification – please tick (√)
Diploma ( ) B.Ed.( ) MED ( ) PHD ( )
Others please specify …………………
4. What other responsibility or responsibilities do you have in the school apart from teaching?
(i)............................................ (ii)........................................... (iii)......................
General Information of Your School
5. Location of your school. Tick (√)where appropriate. ASAL (Arid and Semi-Arid Location) ()
Rural schools (away from towns) ( ) town schools ( )
Your own teaching workload (number of lessons per week)…………
Population of your school (number of pupils)…………………
Number of TSC teachers…………. Number of classes………………
Section B: Influence of Understaffing through Teacher Distribution on Teaching and
Learning
6. The TSC staffing policy is 1 teacher per class. Based on this staffing policy, is your
school understaffed? ..................... If so, by at least how many teachers? ....................
7. What is the average number of pupils per class for all the classes in your school? Tick √
the applicable one.
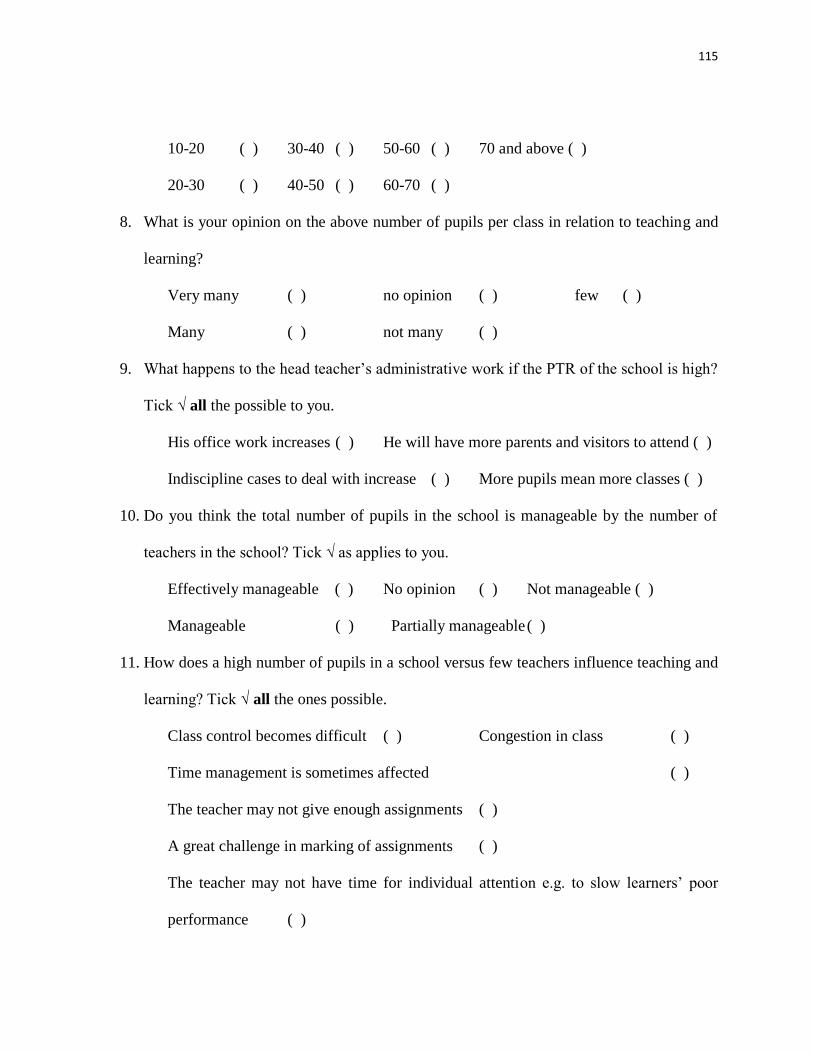
115
10-20 ( ) 30-40 ( ) 50-60 ( ) 70 and above ( )
20-30 ( ) 40-50 ( ) 60-70 ( )
8. What is your opinion on the above number of pupils per class in relation to teaching and
learning?
Very many ( ) no opinion ( ) few ( )
Many ( ) not many ( )
9. What happens to the head teacher‟s administrative work if the PTR of the school is high?
Tick √ all the possible to you.
His office work increases ( ) He will have more parents and visitors to attend ( )
Indiscipline cases to deal with increase ( ) More pupils mean more classes ( )
10. Do you think the total number of pupils in the school is manageable by the number of
teachers in the school? Tick √ as applies to you.
Effectively manageable ( ) No opinion ( ) Not manageable ( )
Manageable ( ) Partially manageable ( )
11. How does a high number of pupils in a school versus few teachers influence teaching and
learning? Tick √ all the ones possible.
Class control becomes difficult ( ) Congestion in class ( )
Time management is sometimes affected ( )
The teacher may not give enough assignments ( )
A great challenge in marking of assignments ( )
The teacher may not have time for individual attention e.g. to slow learners‟ poor
performance ( )
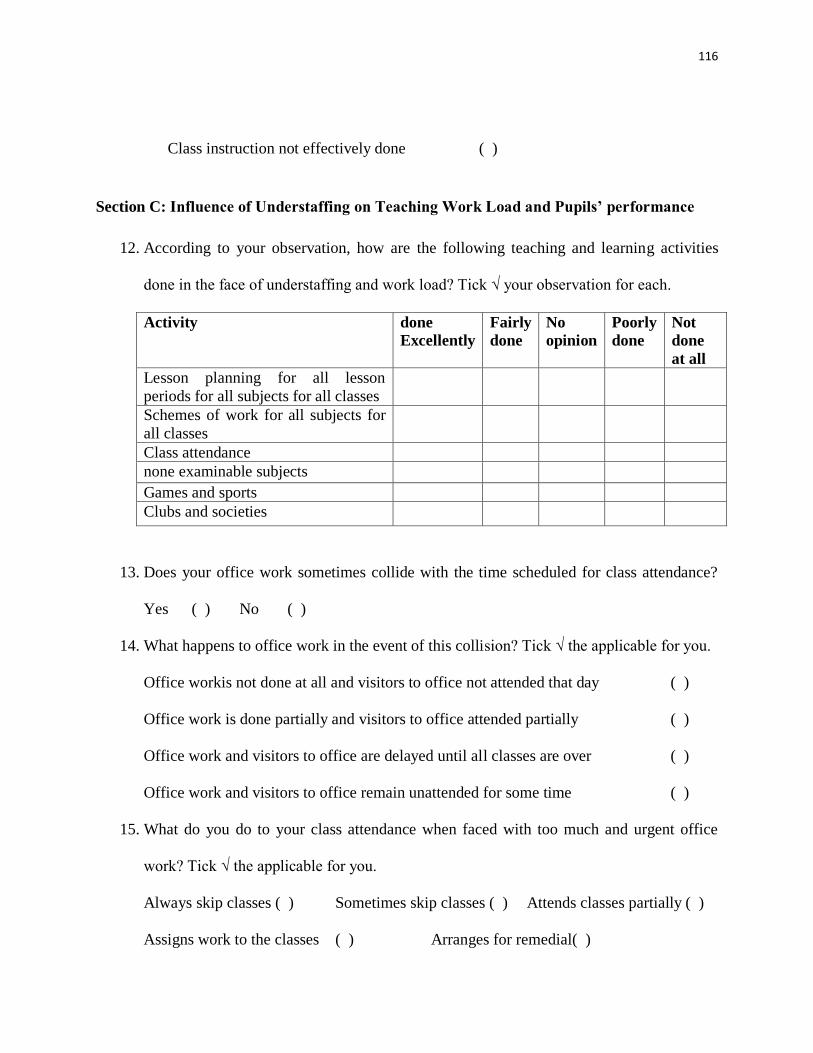
116
Class instruction not effectively done ( )
Section C: Influence of Understaffing on Teaching Work Load and Pupils’ performance
12. According to your observation, how are the following teaching and learning activities
done in the face of understaffing and work load? Tick √ your observation for each.
Activity done
Excellently
Fairly
done
No
opinion
Poorly
done
Not
done
at all
Lesson planning for all lesson
periods for all subjects for all classes
Schemes of work for all subjects for
all classes
Class attendance
none examinable subjects
Games and sports
Clubs and societies
13. Does your office work sometimes collide with the time scheduled for class attendance?
Yes ( ) No ( )
14. What happens to office work in the event of this collision? Tick √ the applicable for you.
Office workis not done at all and visitors to office not attended that day ( )
Office work is done partially and visitors to office attended partially ( )
Office work and visitors to office are delayed until all classes are over ( )
Office work and visitors to office remain unattended for some time ( )
15. What do you do to your class attendance when faced with too much and urgent office
work? Tick √ the applicable for you.
Always skip classes ( ) Sometimes skip classes ( ) Attends classes partially ( )
Assigns work to the classes ( ) Arranges for remedial( )
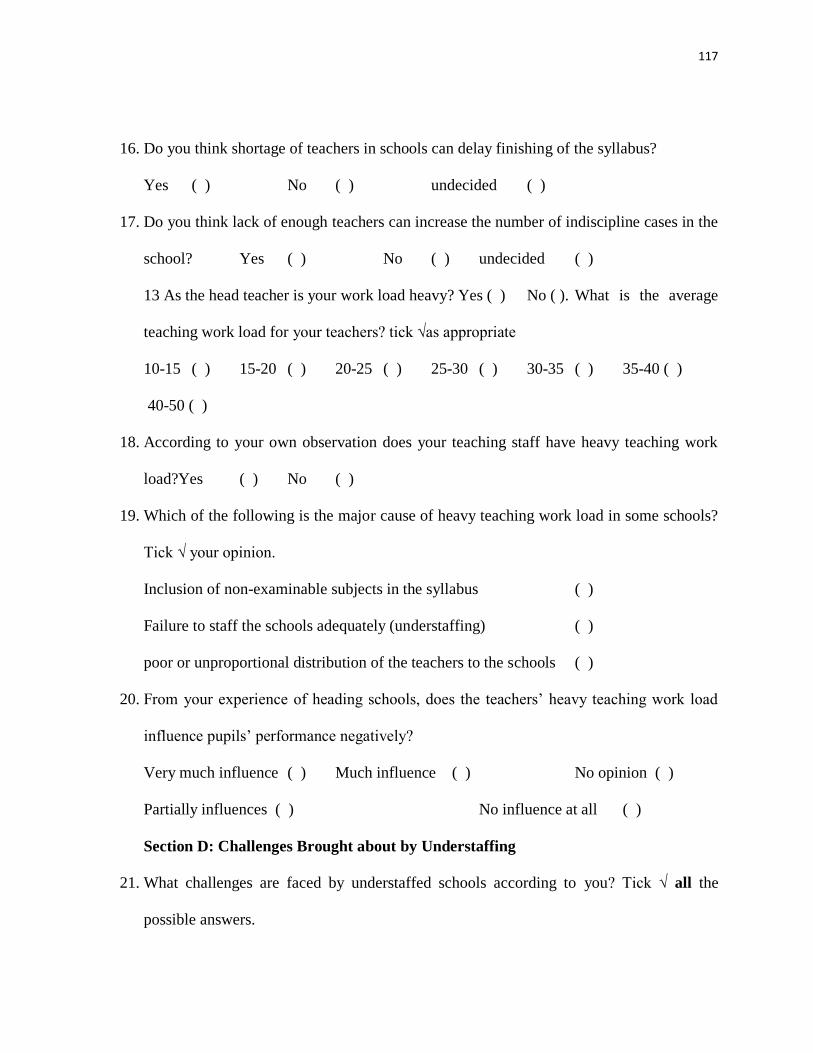
117
16. Do you think shortage of teachers in schools can delay finishing of the syllabus?
Yes ( ) No ( ) undecided ( )
17. Do you think lack of enough teachers can increase the number of indiscipline cases in the
school? Yes ( ) No ( ) undecided ( )
13 As the head teacher is your work load heavy? Yes ( ) No ( ). What is the average
teaching work load for your teachers? tick √as appropriate
10-15 ( ) 15-20 ( ) 20-25 ( ) 25-30 ( ) 30-35 ( ) 35-40 ( )
40-50 ( )
18. According to your own observation does your teaching staff have heavy teaching work
load?Yes ( ) No ( )
19. Which of the following is the major cause of heavy teaching work load in some schools?
Tick √ your opinion.
Inclusion of non-examinable subjects in the syllabus ( )
Failure to staff the schools adequately (understaffing) ( )
poor or unproportional distribution of the teachers to the schools ( )
20. From your experience of heading schools, does the teachers‟ heavy teaching work load
influence pupils‟ performance negatively?
Very much influence ( ) Much influence ( ) No opinion ( )
Partially influences ( ) No influence at all ( )
Section D: Challenges Brought about by Understaffing
21. What challenges are faced by understaffed schools according to you? Tick √ all the
possible answers.

118
Increase in the teachers work load ( ) Increase of indiscipline cases ( )
Teachers‟ fatigue ( ) Poor performance ( )
Increased administrative work ( )
Lesson periods going without teachers ( )
None- examinable subjects not taught where priority is given to examinable ( )
Poor class instruction where classes are combined ( )
Office work collides with class attendance because of understaffing ( )
Syllabus not covered because of understaffing ( )
More work in keeping of records in case of high PTR ( )
SECTION E: Measures of Improving Staffing in Public Primary Schools
22. What measures have you taken to deal with shortages of teachers in your school?
Tick √ the ones that applies to your school.
Employment of PTA teachers ( ) Assigning classes without teachers
( )
Remedial teaching ( ) Combining classes ( )
Selective teaching/giving priority to examinable subjects ( )
23. What is your advice to the government on ways of improving staffing in our schools?
Tick √all possible answers according to you.
Employ more teachers ( ) Distribute teachers fairly ( )
Thorough monitoring of transfers in case of corruption ( )
Increase financial motivation to teachers to work in ASAL areas ( )
Put new staffing policies in place ( )
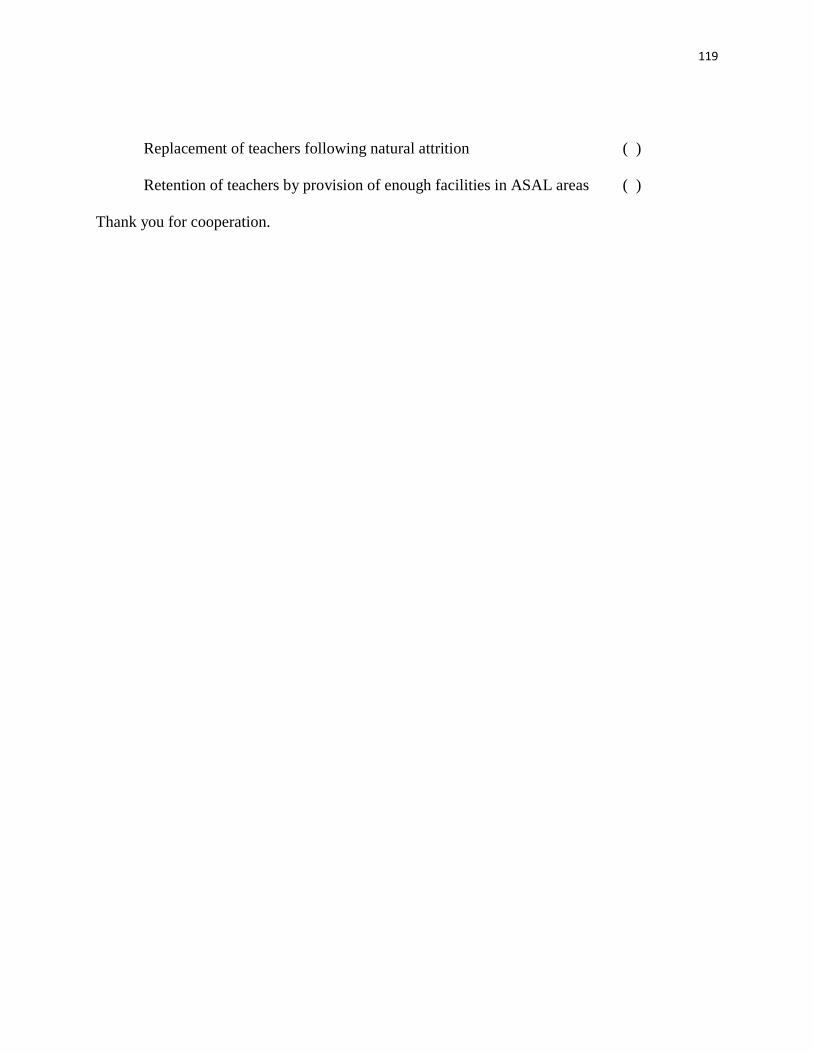
119
Replacement of teachers following natural attrition ( )
Retention of teachers by provision of enough facilities in ASAL areas ( )
Thank you for cooperation.
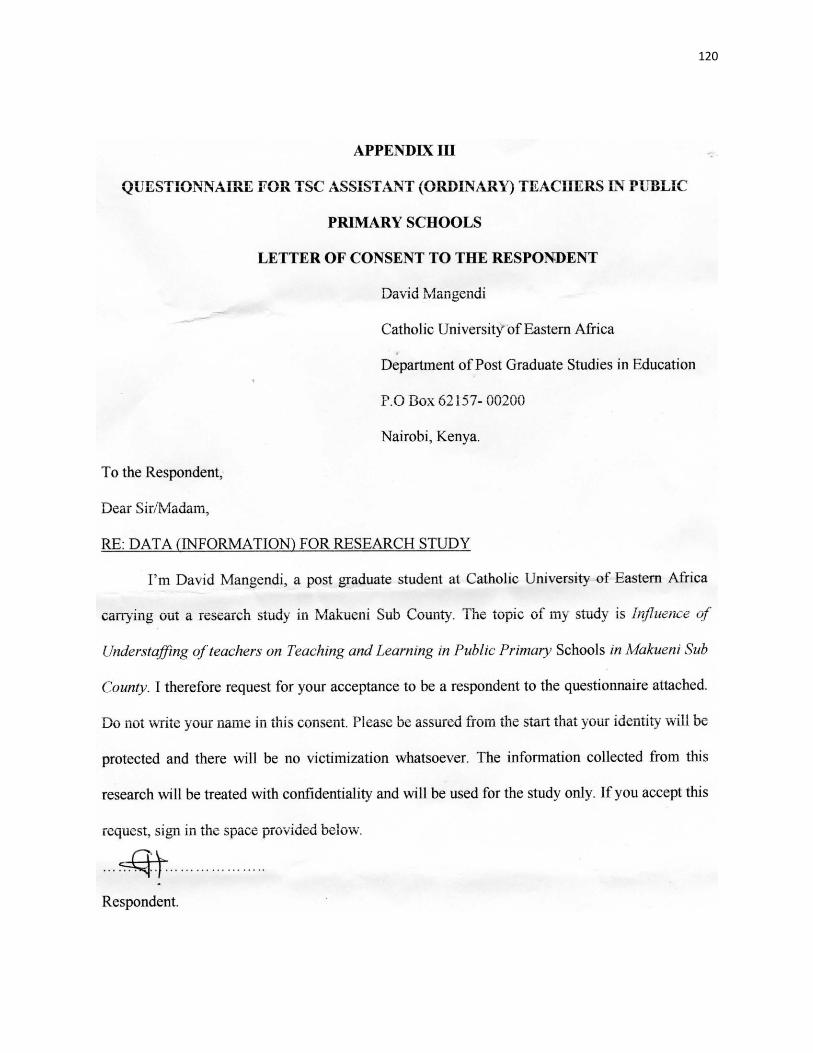
120
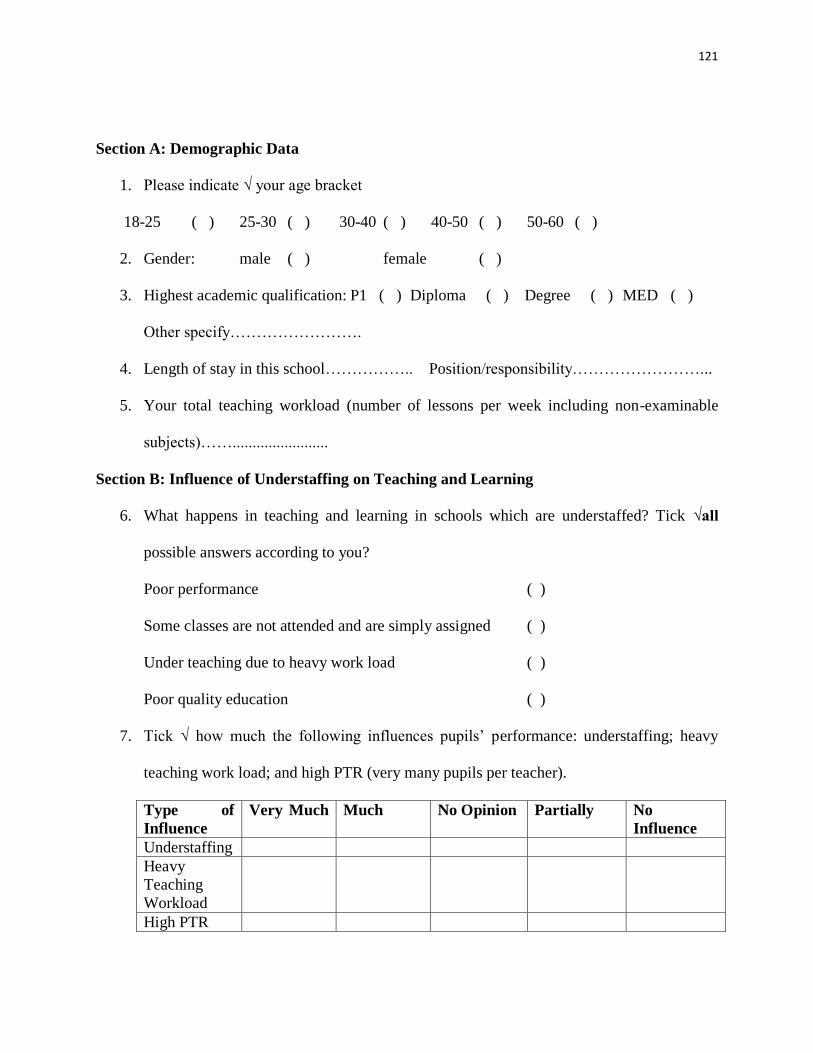
121
Section A: Demographic Data
1. Please indicate √ your age bracket
18-25 ( ) 25-30 ( ) 30-40 ( ) 40-50 ( ) 50-60 ( )
2. Gender: male ( ) female ( )
3. Highest academic qualification: P1 ( ) Diploma ( ) Degree ( ) MED ( )
Other specify…………………….
4. Length of stay in this school…………….. Position/responsibility……………………...
5. Your total teaching workload (number of lessons per week including non-examinable
subjects)……........................
Section B: Influence of Understaffing on Teaching and Learning
6. What happens in teaching and learning in schools which are understaffed? Tick √all
possible answers according to you?
Poor performance ( )
Some classes are not attended and are simply assigned ( )
Under teaching due to heavy work load ( )
Poor quality education ( )
7. Tick √ how much the following influences pupils‟ performance: understaffing; heavy
teaching work load; and high PTR (very many pupils per teacher).
Type of
Influence
Very Much
Much No Opinion Partially No
Influence
Understaffing
Heavy
Teaching
Workload
High PTR
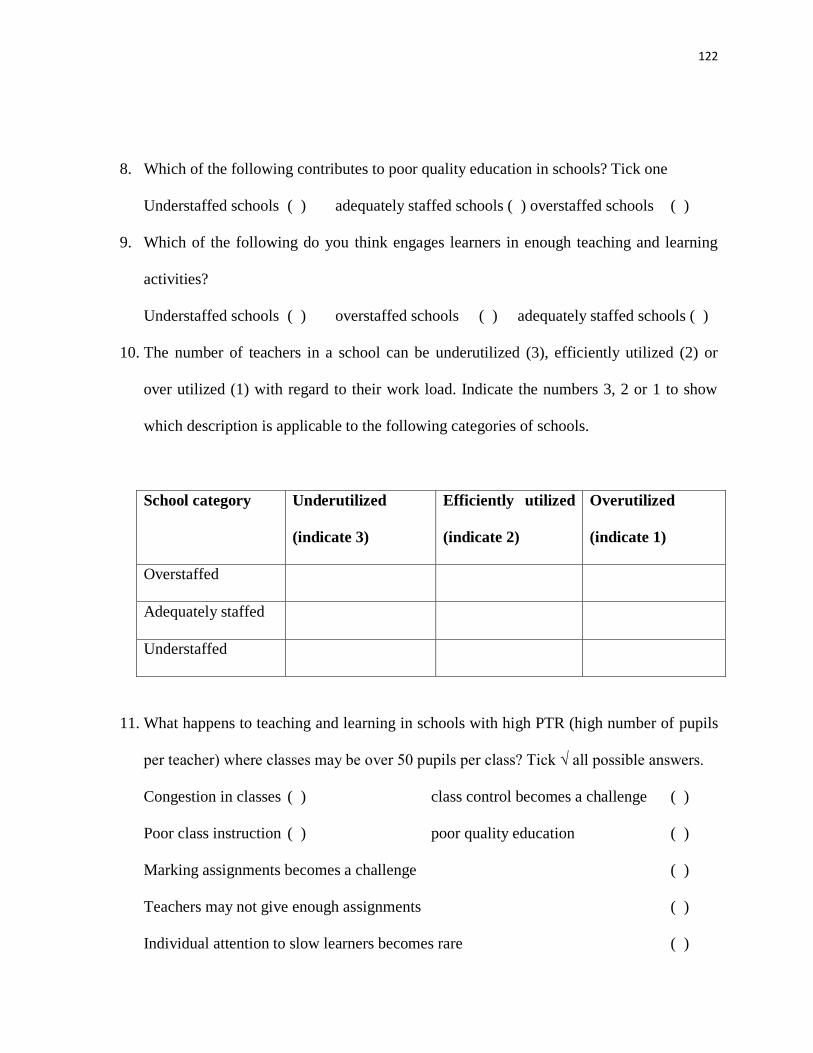
122
8. Which of the following contributes to poor quality education in schools? Tick one
Understaffed schools ( ) adequately staffed schools ( ) overstaffed schools ( )
9. Which of the following do you think engages learners in enough teaching and learning
activities?
Understaffed schools ( ) overstaffed schools ( ) adequately staffed schools ( )
10. The number of teachers in a school can be underutilized (3), efficiently utilized (2) or
over utilized (1) with regard to their work load. Indicate the numbers 3, 2 or 1 to show
which description is applicable to the following categories of schools.
School category Underutilized
(indicate 3)
Efficiently utilized
(indicate 2)
Overutilized
(indicate 1)
Overstaffed
Adequately staffed
Understaffed
11. What happens to teaching and learning in schools with high PTR (high number of pupils
per teacher) where classes may be over 50 pupils per class? Tick √ all possible answers.
Congestion in classes ( ) class control becomes a challenge ( )
Poor class instruction ( ) poor quality education ( )
Marking assignments becomes a challenge ( )
Teachers may not give enough assignments ( )
Individual attention to slow learners becomes rare ( )
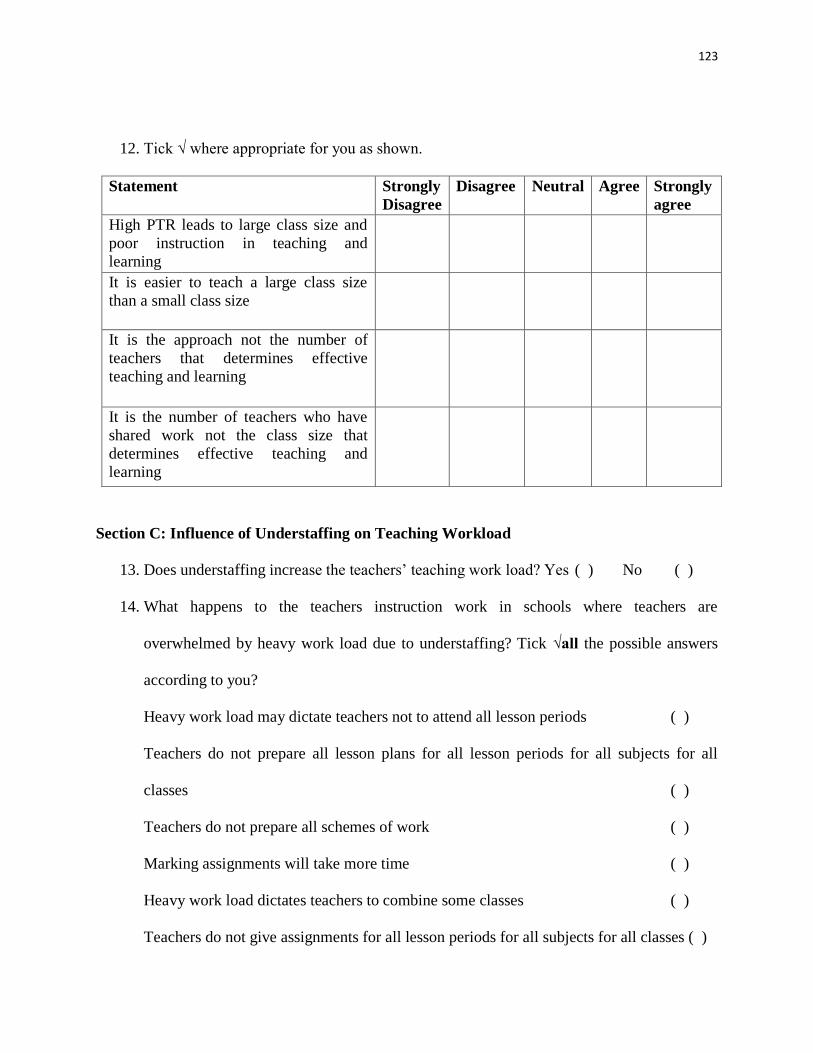
123
12. Tick √ where appropriate for you as shown.
Statement Strongly
Disagree
Disagree Neutral Agree Strongly
agree
High PTR leads to large class size and
poor instruction in teaching and
learning
It is easier to teach a large class size
than a small class size
It is the approach not the number of
teachers that determines effective
teaching and learning
It is the number of teachers who have
shared work not the class size that
determines effective teaching and
learning
Section C: Influence of Understaffing on Teaching Workload
13. Does understaffing increase the teachers‟ teaching work load? Yes ( ) No ( )
14. What happens to the teachers instruction work in schools where teachers are
overwhelmed by heavy work load due to understaffing? Tick √all the possible answers
according to you?
Heavy work load may dictate teachers not to attend all lesson periods ( )
Teachers do not prepare all lesson plans for all lesson periods for all subjects for all
classes ( )
Teachers do not prepare all schemes of work ( )
Marking assignments will take more time ( )
Heavy work load dictates teachers to combine some classes ( )
Teachers do not give assignments for all lesson periods for all subjects for all classes ( )
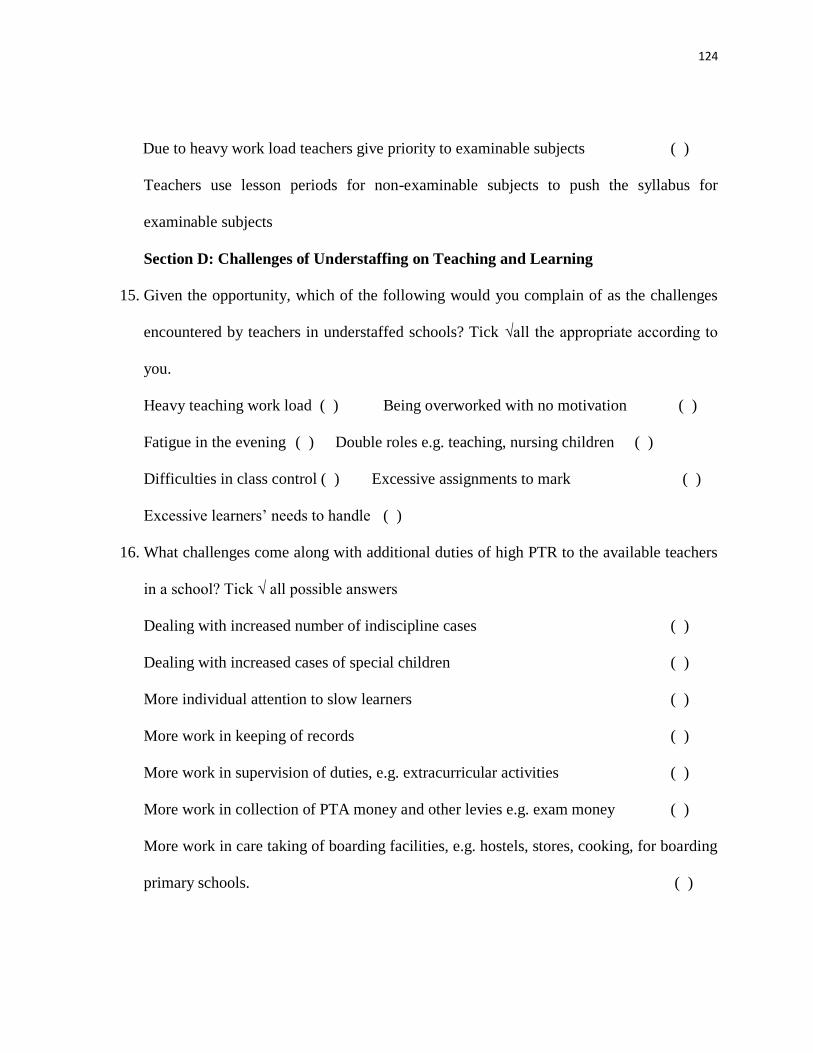
124
Due to heavy work load teachers give priority to examinable subjects ( )
Teachers use lesson periods for non-examinable subjects to push the syllabus for
examinable subjects
Section D: Challenges of Understaffing on Teaching and Learning
15. Given the opportunity, which of the following would you complain of as the challenges
encountered by teachers in understaffed schools? Tick √all the appropriate according to
you.
Heavy teaching work load ( ) Being overworked with no motivation ( )
Fatigue in the evening ( ) Double roles e.g. teaching, nursing children ( )
Difficulties in class control ( ) Excessive assignments to mark ( )
Excessive learners‟ needs to handle ( )
16. What challenges come along with additional duties of high PTR to the available teachers
in a school? Tick √ all possible answers
Dealing with increased number of indiscipline cases ( )
Dealing with increased cases of special children ( )
More individual attention to slow learners ( )
More work in keeping of records ( )
More work in supervision of duties, e.g. extracurricular activities ( )
More work in collection of PTA money and other levies e.g. exam money ( )
More work in care taking of boarding facilities, e.g. hostels, stores, cooking, for boarding
primary schools. ( )
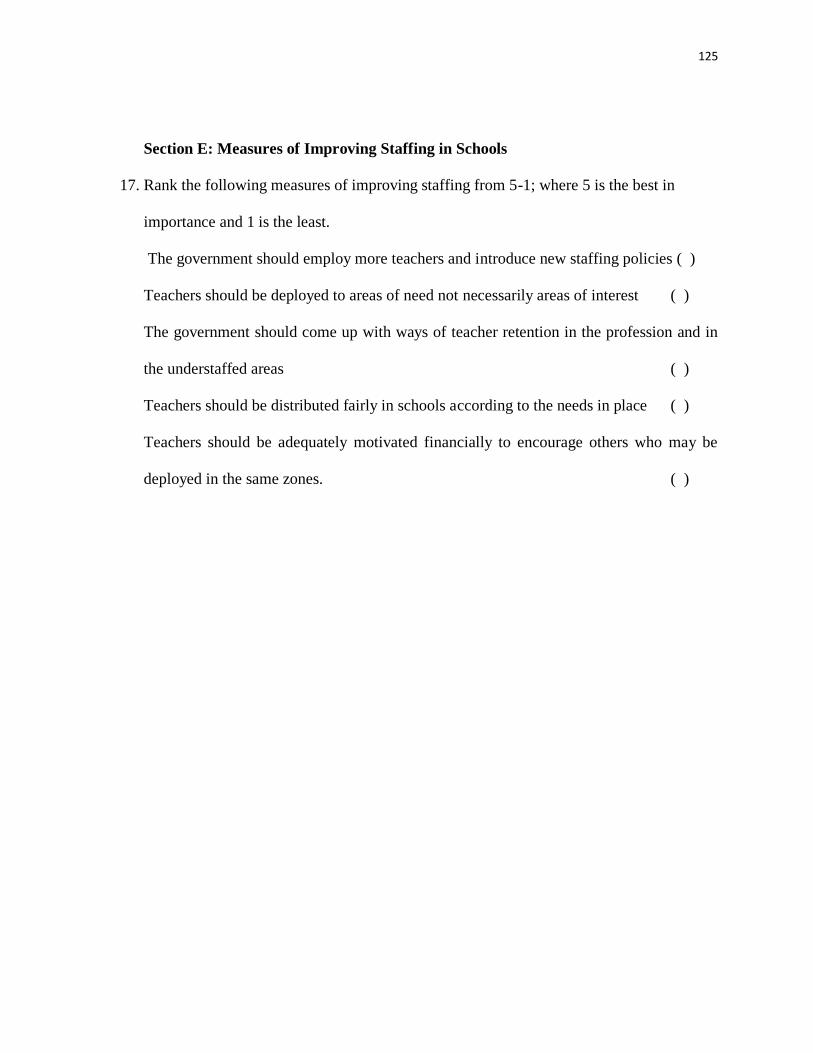
125
Section E: Measures of Improving Staffing in Schools
17. Rank the following measures of improving staffing from 5-1; where 5 is the best in
importance and 1 is the least.
The government should employ more teachers and introduce new staffing policies ( )
Teachers should be deployed to areas of need not necessarily areas of interest ( )
The government should come up with ways of teacher retention in the profession and in
the understaffed areas ( )
Teachers should be distributed fairly in schools according to the needs in place ( )
Teachers should be adequately motivated financially to encourage others who may be
deployed in the same zones. ( )
126
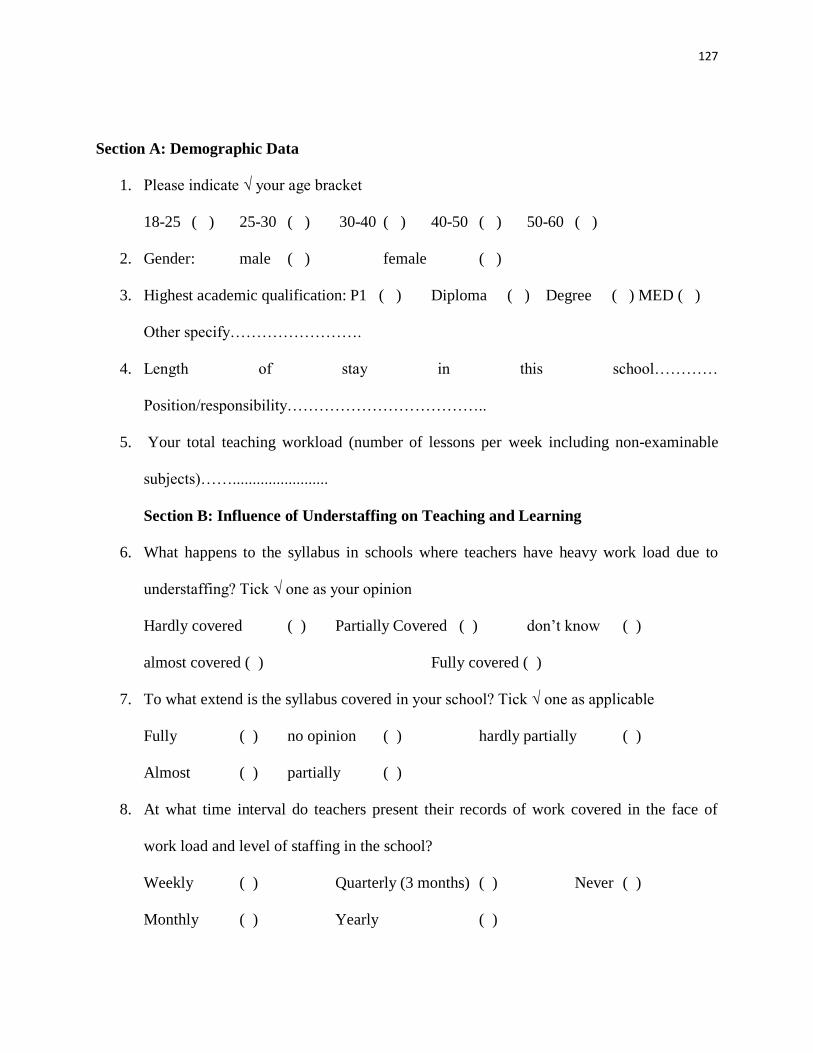
127
Section A: Demographic Data
1. Please indicate √ your age bracket
18-25 ( ) 25-30 ( ) 30-40 ( ) 40-50 ( ) 50-60 ( )
2. Gender: male ( ) female ( )
3. Highest academic qualification: P1 ( ) Diploma ( ) Degree ( ) MED ( )
Other specify…………………….
4. Length of stay in this school…………
Position/responsibility………………………………..
5. Your total teaching workload (number of lessons per week including non-examinable
subjects)……........................
Section B: Influence of Understaffing on Teaching and Learning
6. What happens to the syllabus in schools where teachers have heavy work load due to
understaffing? Tick √ one as your opinion
Hardly covered ( ) Partially Covered ( ) don‟t know ( )
almost covered ( ) Fully covered ( )
7. To what extend is the syllabus covered in your school? Tick √ one as applicable
Fully ( ) no opinion ( ) hardly partially ( )
Almost ( ) partially ( )
8. At what time interval do teachers present their records of work covered in the face of
work load and level of staffing in the school?
Weekly ( ) Quarterly (3 months) ( ) Never ( )
Monthly ( ) Yearly ( )
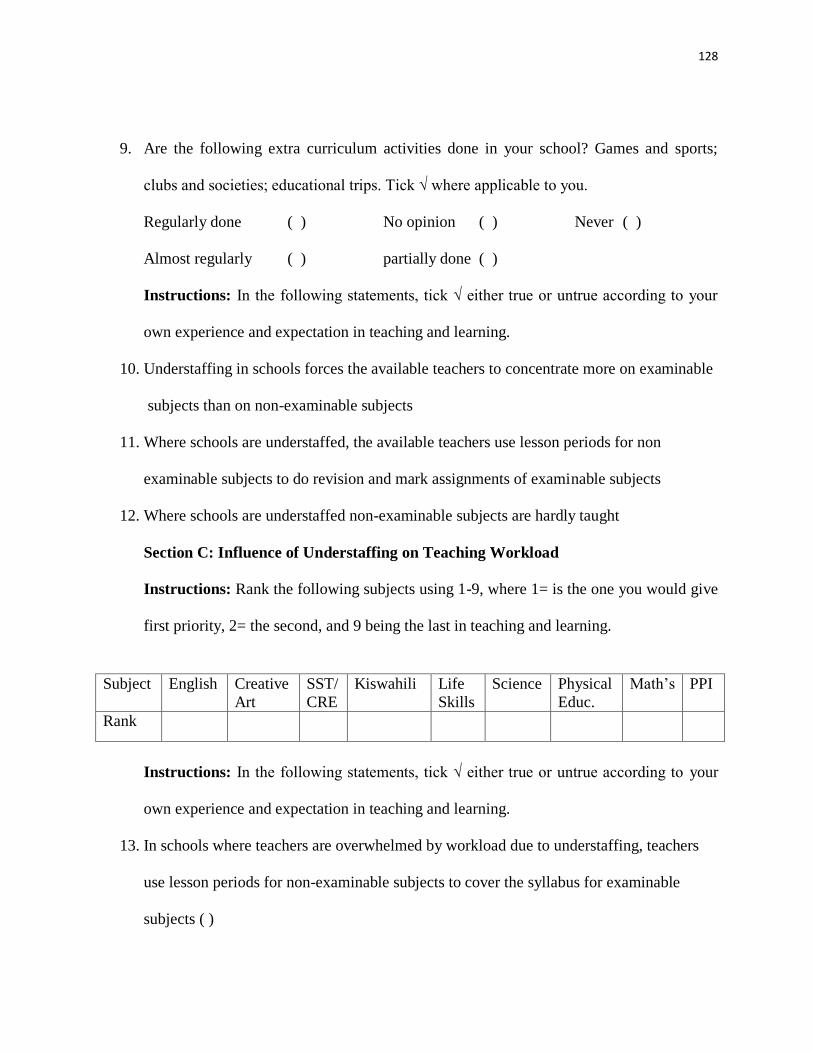
128
9. Are the following extra curriculum activities done in your school? Games and sports;
clubs and societies; educational trips. Tick √ where applicable to you.
Regularly done ( ) No opinion ( ) Never ( )
Almost regularly ( ) partially done ( )
Instructions: In the following statements, tick √ either true or untrue according to your
own experience and expectation in teaching and learning.
10. Understaffing in schools forces the available teachers to concentrate more on examinable
subjects than on non-examinable subjects
11. Where schools are understaffed, the available teachers use lesson periods for non
examinable subjects to do revision and mark assignments of examinable subjects
12. Where schools are understaffed non-examinable subjects are hardly taught
Section C: Influence of Understaffing on Teaching Workload
Instructions: Rank the following subjects using 1-9, where 1= is the one you would give
first priority, 2= the second, and 9 being the last in teaching and learning.
Subject English Creative
Art
SST/
CRE
Kiswahili Life
Skills
Science Physical
Educ.
Math‟s PPI
Rank
Instructions: In the following statements, tick √ either true or untrue according to your
own experience and expectation in teaching and learning.
13. In schools where teachers are overwhelmed by workload due to understaffing, teachers
use lesson periods for non-examinable subjects to cover the syllabus for examinable
subjects ( )
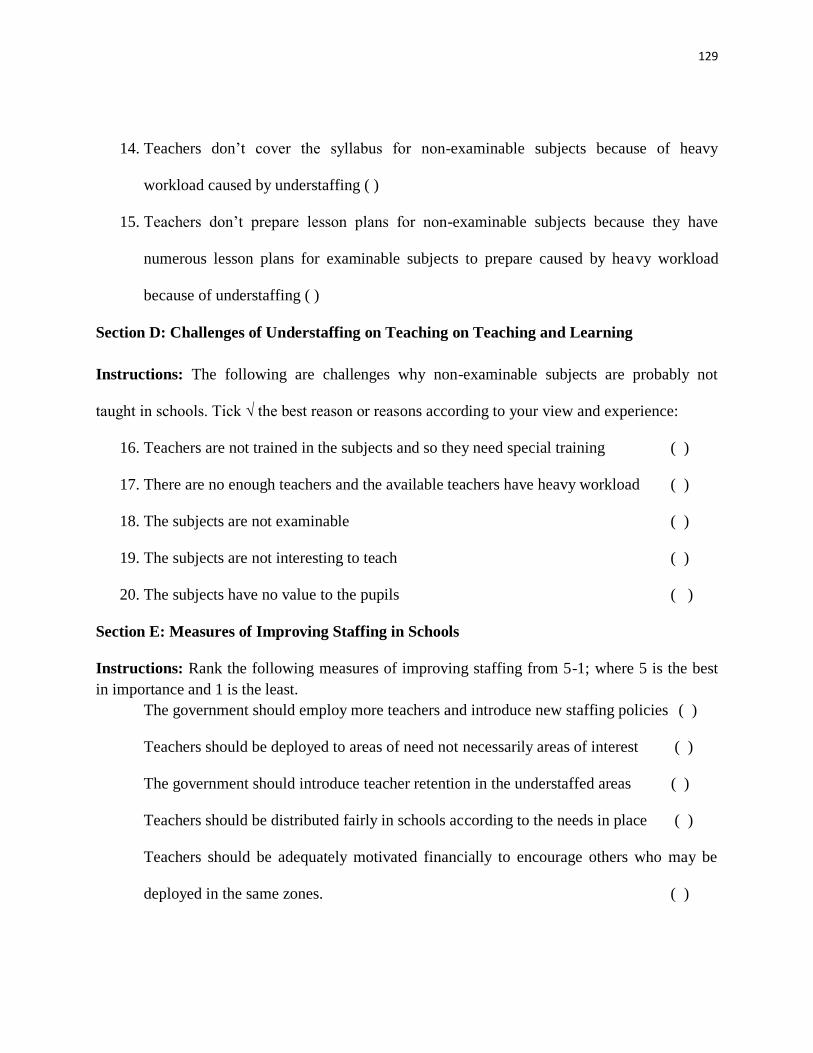
129
14. Teachers don‟t cover the syllabus for non-examinable subjects because of heavy
workload caused by understaffing ( )
15. Teachers don‟t prepare lesson plans for non-examinable subjects because they have
numerous lesson plans for examinable subjects to prepare caused by heavy workload
because of understaffing ( )
Section D: Challenges of Understaffing on Teaching on Teaching and Learning
Instructions: The following are challenges why non-examinable subjects are probably not
taught in schools. Tick √ the best reason or reasons according to your view and experience:
16. Teachers are not trained in the subjects and so they need special training ( )
17. There are no enough teachers and the available teachers have heavy workload ( )
18. The subjects are not examinable ( )
19. The subjects are not interesting to teach ( )
20. The subjects have no value to the pupils ( )
Section E: Measures of Improving Staffing in Schools
Instructions: Rank the following measures of improving staffing from 5-1; where 5 is the best
in importance and 1 is the least.
The government should employ more teachers and introduce new staffing policies ( )
Teachers should be deployed to areas of need not necessarily areas of interest ( )
The government should introduce teacher retention in the understaffed areas ( )
Teachers should be distributed fairly in schools according to the needs in place ( )
Teachers should be adequately motivated financially to encourage others who may be
deployed in the same zones. ( )
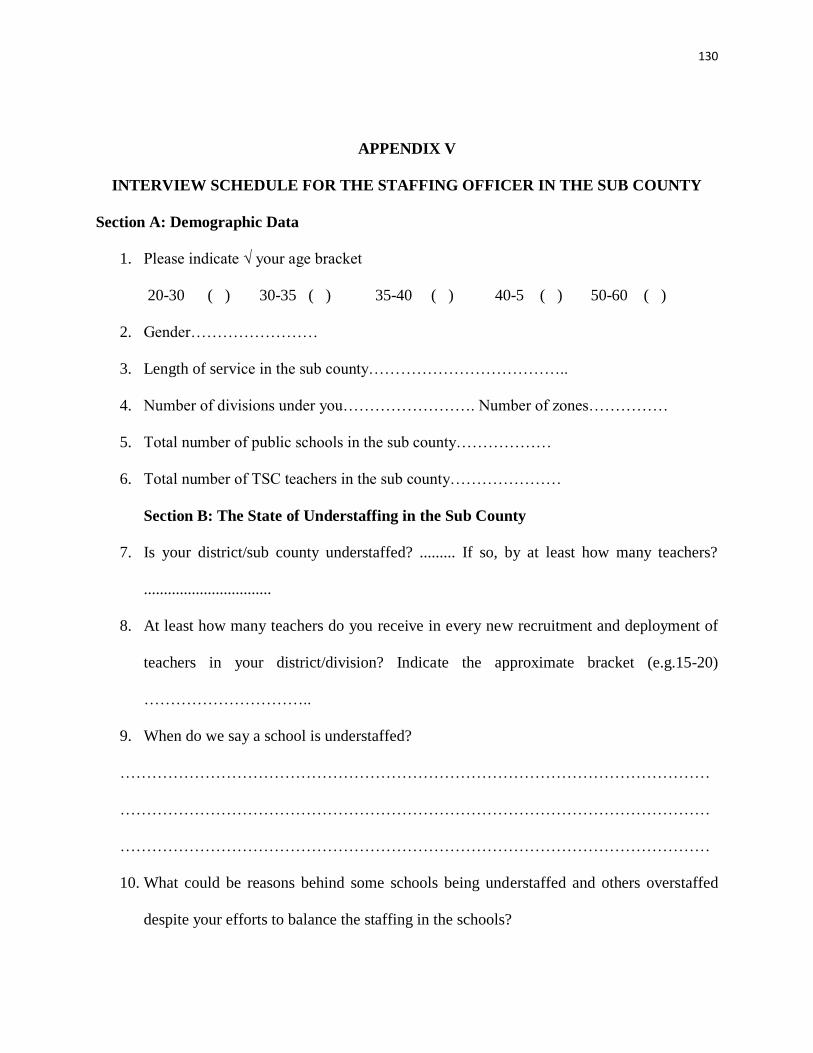
130
APPENDIX V
INTERVIEW SCHEDULE FOR THE STAFFING OFFICER IN THE SUB COUNTY
Section A: Demographic Data
1. Please indicate √ your age bracket
20-30 ( ) 30-35 ( ) 35-40 ( ) 40-5 ( ) 50-60 ( )
2. Gender……………………
3. Length of service in the sub county………………………………..
4. Number of divisions under you……………………. Number of zones……………
5. Total number of public schools in the sub county………………
6. Total number of TSC teachers in the sub county…………………
Section B: The State of Understaffing in the Sub County
7. Is your district/sub county understaffed? ......... If so, by at least how many teachers?
................................
8. At least how many teachers do you receive in every new recruitment and deployment of
teachers in your district/division? Indicate the approximate bracket (e.g.15-20)
…………………………..
9. When do we say a school is understaffed?
…………………………………………………………………………………………………
…………………………………………………………………………………………………
…………………………………………………………………………………………………
10. What could be reasons behind some schools being understaffed and others overstaffed
despite your efforts to balance the staffing in the schools?
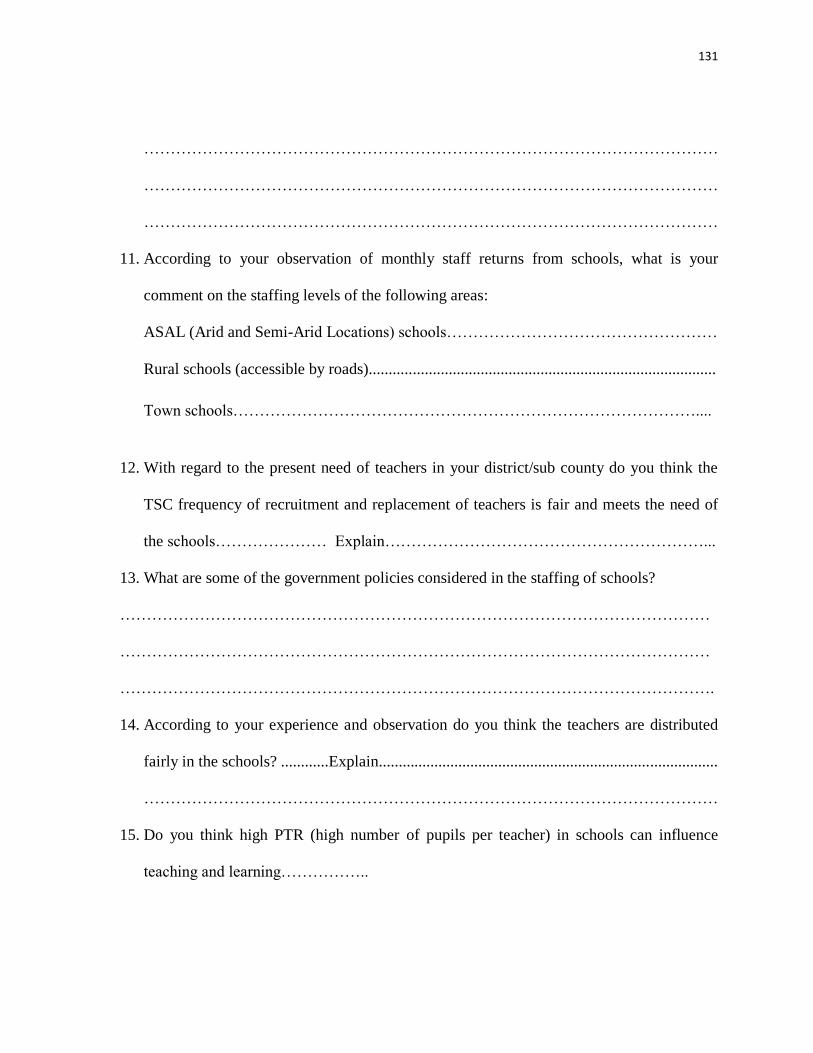
131
………………………………………………………………………………………………
………………………………………………………………………………………………
………………………………………………………………………………………………
11. According to your observation of monthly staff returns from schools, what is your
comment on the staffing levels of the following areas:
ASAL (Arid and Semi-Arid Locations) schools……………………………………………
Rural schools (accessible by roads).......................................................................................
Town schools……………………………………………………………………………....
12. With regard to the present need of teachers in your district/sub county do you think the
TSC frequency of recruitment and replacement of teachers is fair and meets the need of
the schools………………… Explain……………………………………………………...
13. What are some of the government policies considered in the staffing of schools?
…………………………………………………………………………………………………
…………………………………………………………………………………………………
………………………………………………………………………………………………….
14. According to your experience and observation do you think the teachers are distributed
fairly in the schools? ............Explain.....................................................................................
………………………………………………………………………………………………
15. Do you think high PTR (high number of pupils per teacher) in schools can influence
teaching and learning……………..
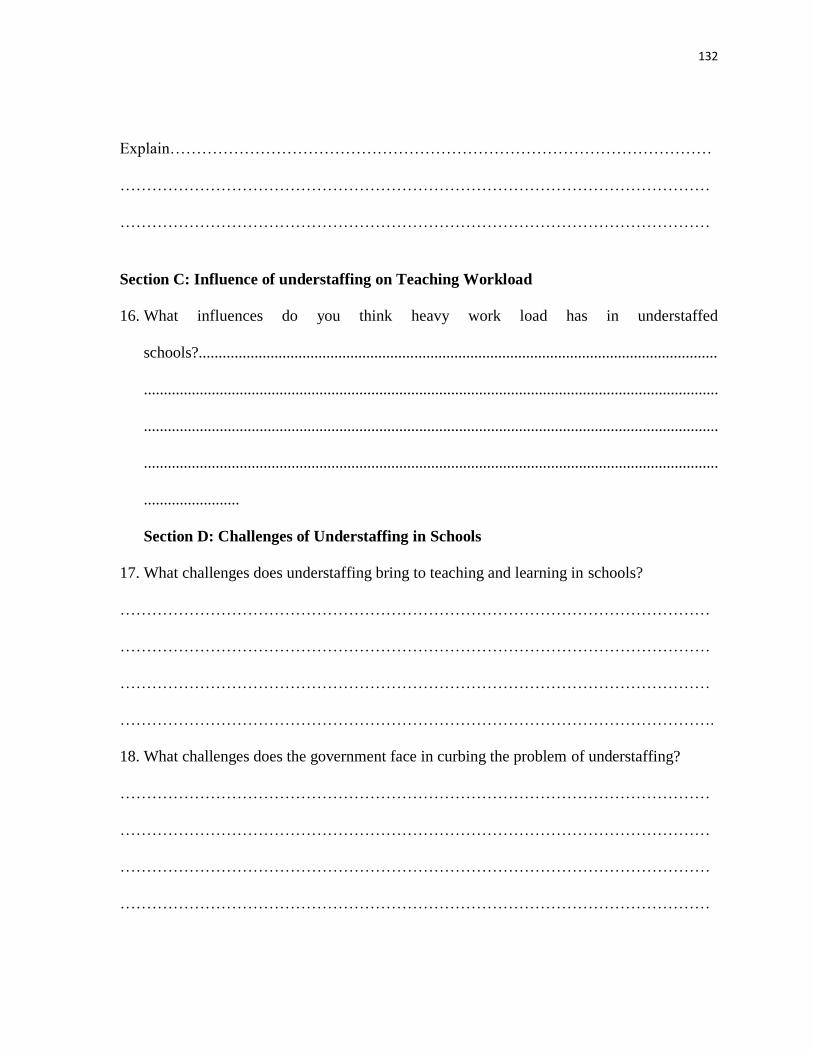
132
Explain…………………………………………………………………………………………
…………………………………………………………………………………………………
…………………………………………………………………………………………………
Section C: Influence of understaffing on Teaching Workload
16. What influences do you think heavy work load has in understaffed
schools?..................................................................................................................................
................................................................................................................................................
................................................................................................................................................
................................................................................................................................................
........................
Section D: Challenges of Understaffing in Schools
17. What challenges does understaffing bring to teaching and learning in schools?
…………………………………………………………………………………………………
…………………………………………………………………………………………………
…………………………………………………………………………………………………
………………………………………………………………………………………………….
18. What challenges does the government face in curbing the problem of understaffing?
…………………………………………………………………………………………………
…………………………………………………………………………………………………
…………………………………………………………………………………………………
…………………………………………………………………………………………………
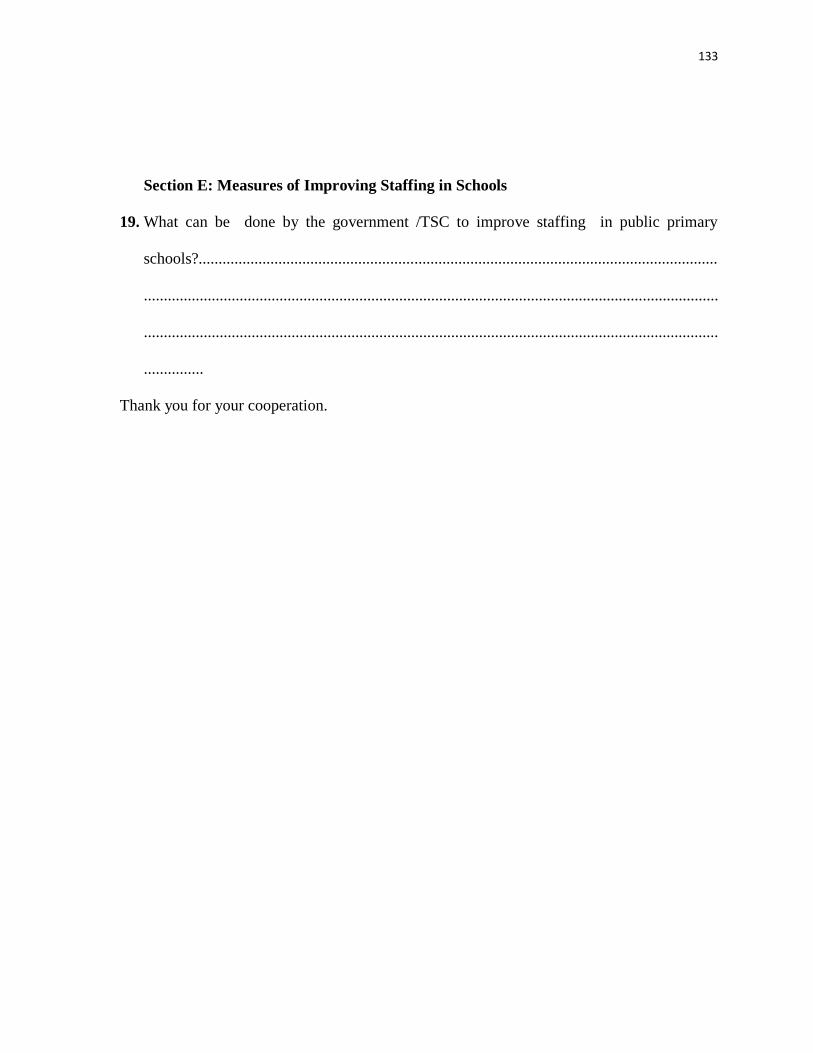
133
Section E: Measures of Improving Staffing in Schools
19. What can be done by the government /TSC to improve staffing in public primary
schools?..................................................................................................................................
................................................................................................................................................
................................................................................................................................................
...............
Thank you for your cooperation.
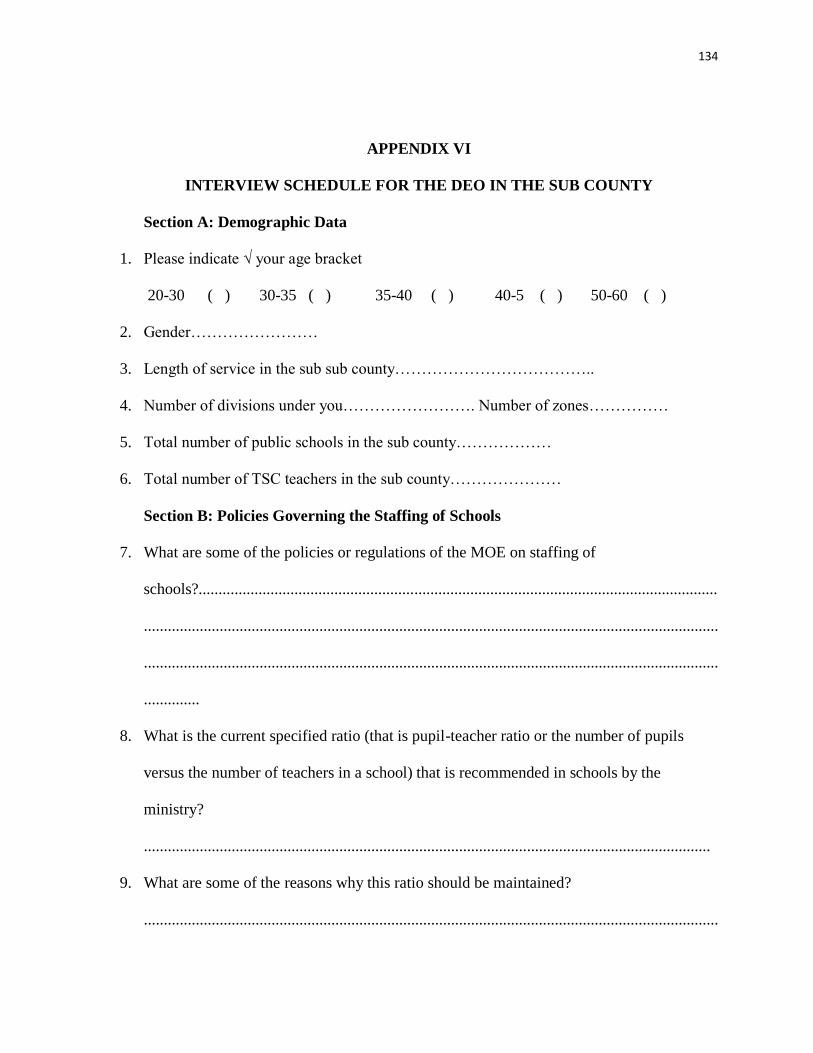
134
APPENDIX VI
INTERVIEW SCHEDULE FOR THE DEO IN THE SUB COUNTY
Section A: Demographic Data
1. Please indicate √ your age bracket
20-30 ( ) 30-35 ( ) 35-40 ( ) 40-5 ( ) 50-60 ( )
2. Gender……………………
3. Length of service in the sub sub county………………………………..
4. Number of divisions under you……………………. Number of zones……………
5. Total number of public schools in the sub county………………
6. Total number of TSC teachers in the sub county…………………
Section B: Policies Governing the Staffing of Schools
7. What are some of the policies or regulations of the MOE on staffing of
schools?..................................................................................................................................
................................................................................................................................................
................................................................................................................................................
..............
8. What is the current specified ratio (that is pupil-teacher ratio or the number of pupils
versus the number of teachers in a school) that is recommended in schools by the
ministry?
..............................................................................................................................................
9. What are some of the reasons why this ratio should be maintained?
................................................................................................................................................
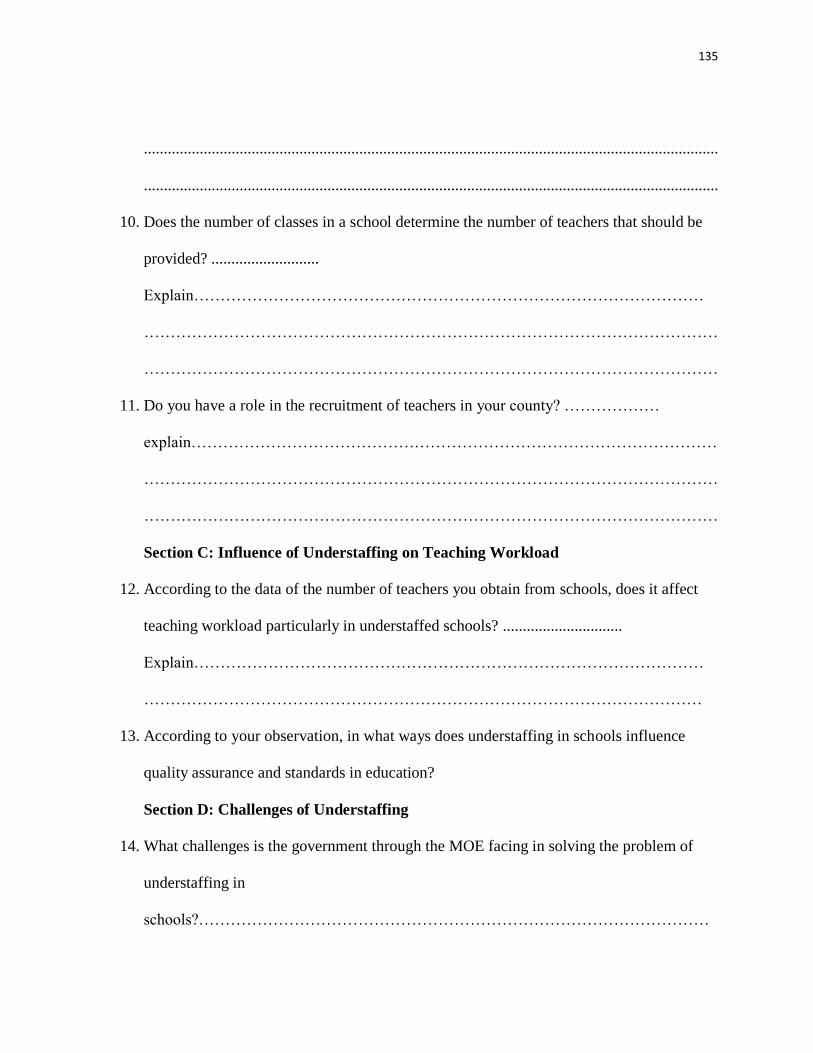
135
................................................................................................................................................
................................................................................................................................................
10. Does the number of classes in a school determine the number of teachers that should be
provided? ...........................
Explain……………………………………………………………………………………
………………………………………………………………………………………………
………………………………………………………………………………………………
11. Do you have a role in the recruitment of teachers in your county? ………………
explain………………………………………………………………………………………
………………………………………………………………………………………………
………………………………………………………………………………………………
Section C: Influence of Understaffing on Teaching Workload
12. According to the data of the number of teachers you obtain from schools, does it affect
teaching workload particularly in understaffed schools? ..............................
Explain……………………………………………………………………………………
……………………………………………………………………………………………
13. According to your observation, in what ways does understaffing in schools influence
quality assurance and standards in education?
Section D: Challenges of Understaffing
14. What challenges is the government through the MOE facing in solving the problem of
understaffing in
schools?……………………………………………………………………………………
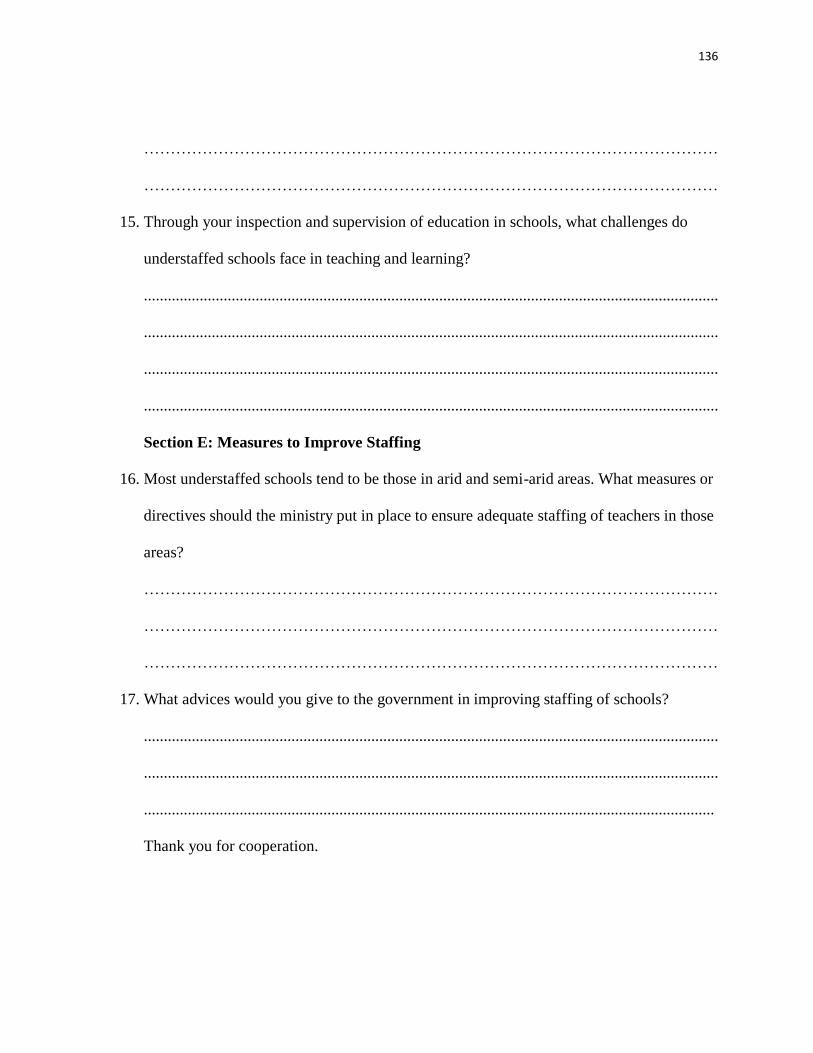
136
………………………………………………………………………………………………
………………………………………………………………………………………………
15. Through your inspection and supervision of education in schools, what challenges do
understaffed schools face in teaching and learning?
................................................................................................................................................
................................................................................................................................................
................................................................................................................................................
................................................................................................................................................
Section E: Measures to Improve Staffing
16. Most understaffed schools tend to be those in arid and semi-arid areas. What measures or
directives should the ministry put in place to ensure adequate staffing of teachers in those
areas?
………………………………………………………………………………………………
………………………………………………………………………………………………
………………………………………………………………………………………………
17. What advices would you give to the government in improving staffing of schools?
................................................................................................................................................
................................................................................................................................................
...............................................................................................................................................
Thank you for cooperation.
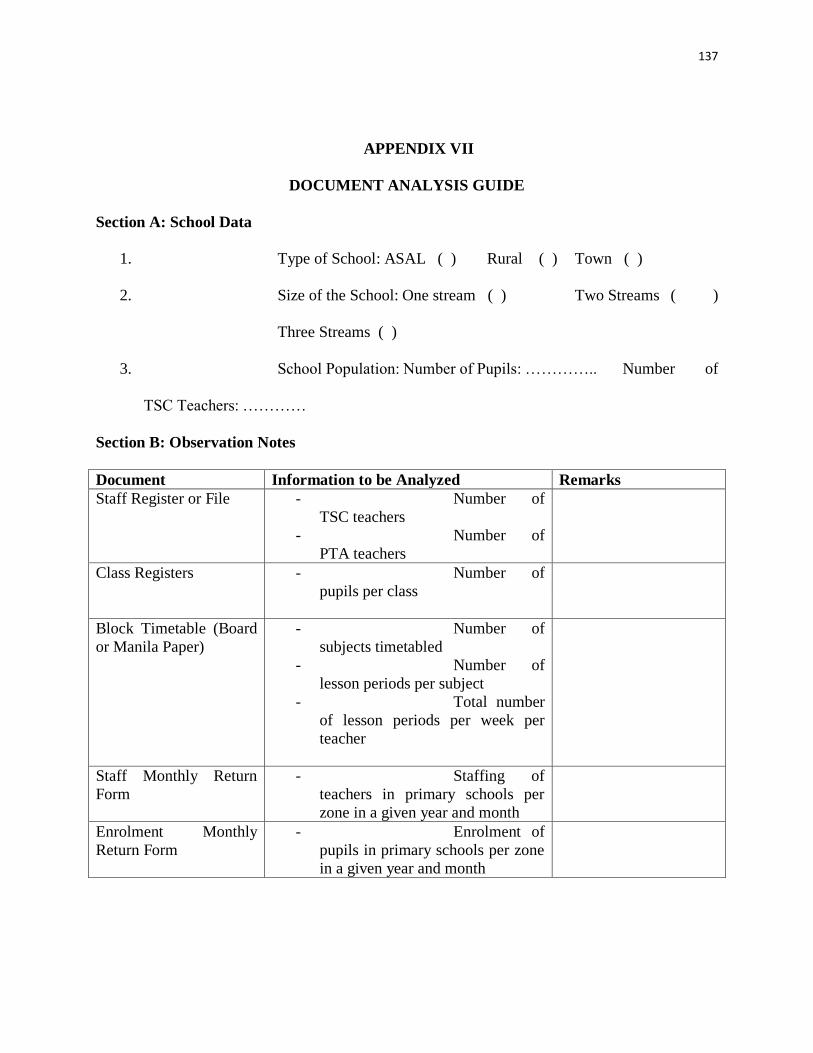
137
APPENDIX VII
DOCUMENT ANALYSIS GUIDE
Section A: School Data
1. Type of School: ASAL ( ) Rural ( ) Town ( )
2. Size of the School: One stream ( ) Two Streams ( )
Three Streams ( )
3. School Population: Number of Pupils: ………….. Number of
TSC Teachers: …………
Section B: Observation Notes
Document Information to be Analyzed Remarks
Staff Register or File - Number of
TSC teachers
- Number of
PTA teachers
Class Registers - Number of
pupils per class
Block Timetable (Board
or Manila Paper)
- Number of
subjects timetabled
- Number of
lesson periods per subject
- Total number
of lesson periods per week per
teacher
Staff Monthly Return
Form
- Staffing of
teachers in primary schools per
zone in a given year and month
Enrolment Monthly
Return Form
- Enrolment of
pupils in primary schools per zone
in a given year and month
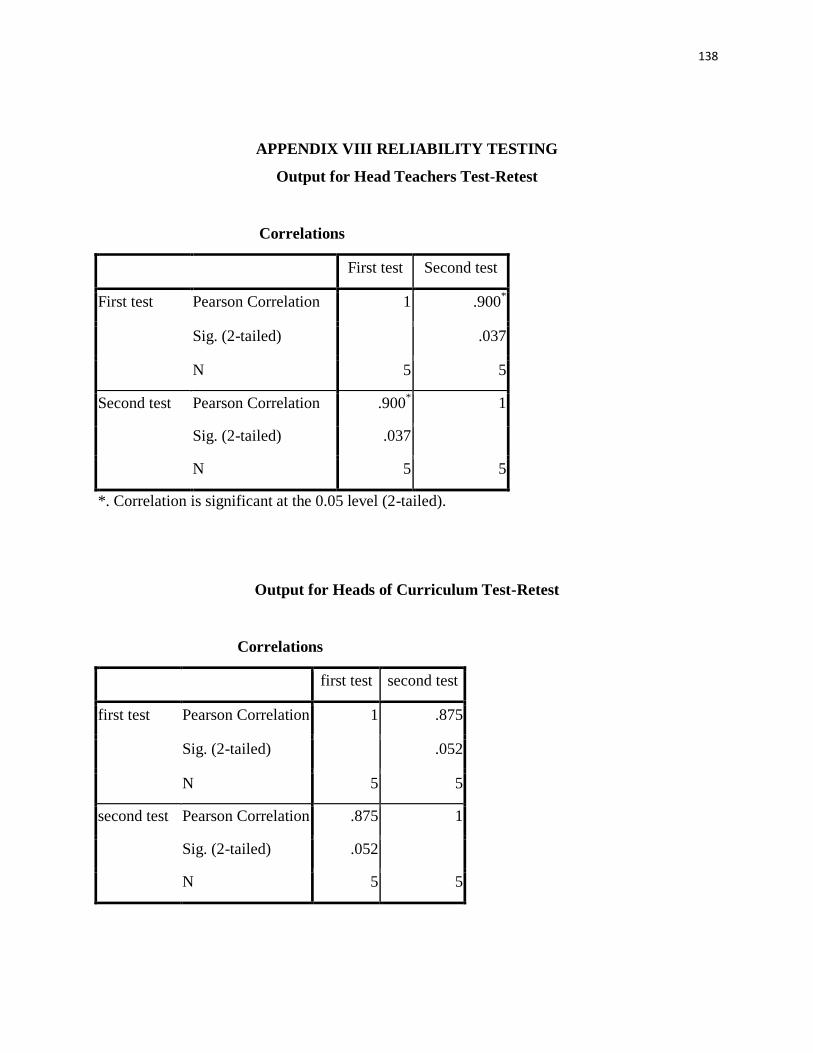
138
APPENDIX VIII RELIABILITY TESTING
Output for Head Teachers Test-Retest
Correlations
First test Second test
First test Pearson Correlation 1 .900*
Sig. (2-tailed) .037
N 5 5
Second test Pearson Correlation .900* 1
Sig. (2-tailed) .037
N 5 5
*. Correlation is significant at the 0.05 level (2-tailed).
Output for Heads of Curriculum Test-Retest
Correlations
first test second test
first test Pearson Correlation 1 .875
Sig. (2-tailed) .052
N 5 5
second test Pearson Correlation .875 1
Sig. (2-tailed) .052
N 5 5
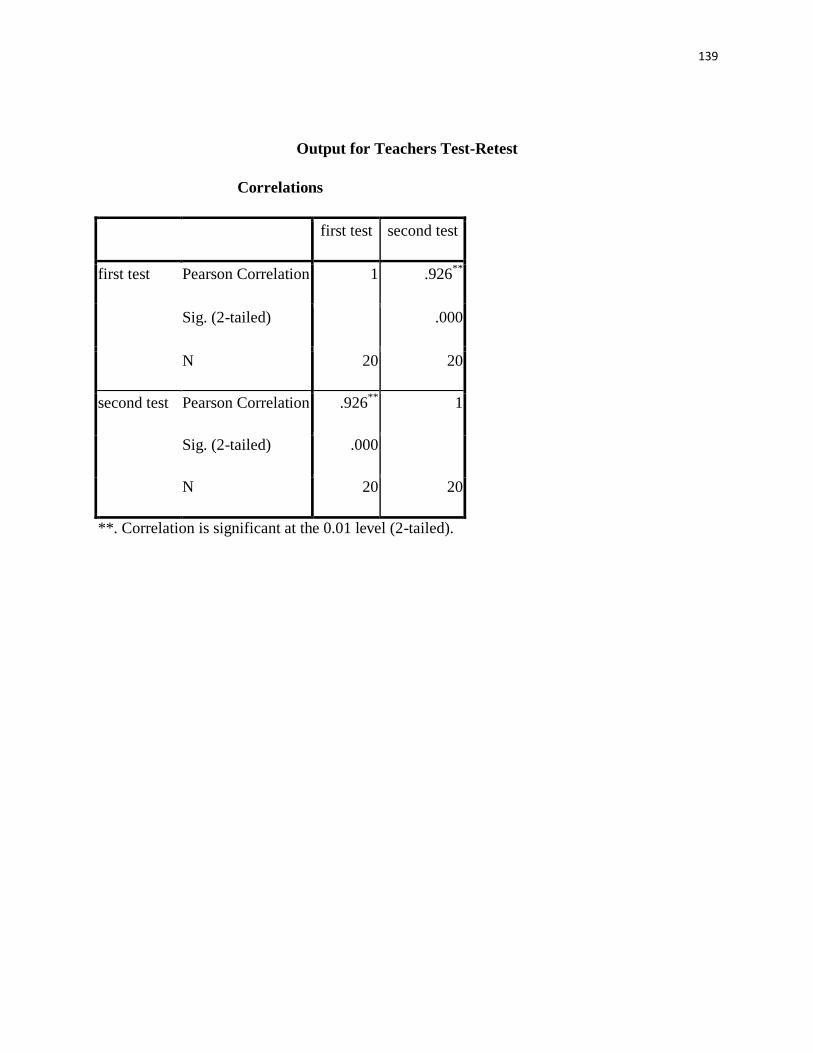
139
Output for Teachers Test-Retest
Correlations
first test second test
first test Pearson Correlation 1 .926**
Sig. (2-tailed) .000
N 20 20
second test Pearson Correlation .926**
1
Sig. (2-tailed) .000
N 20 20
**. Correlation is significant at the 0.01 level (2-tailed).
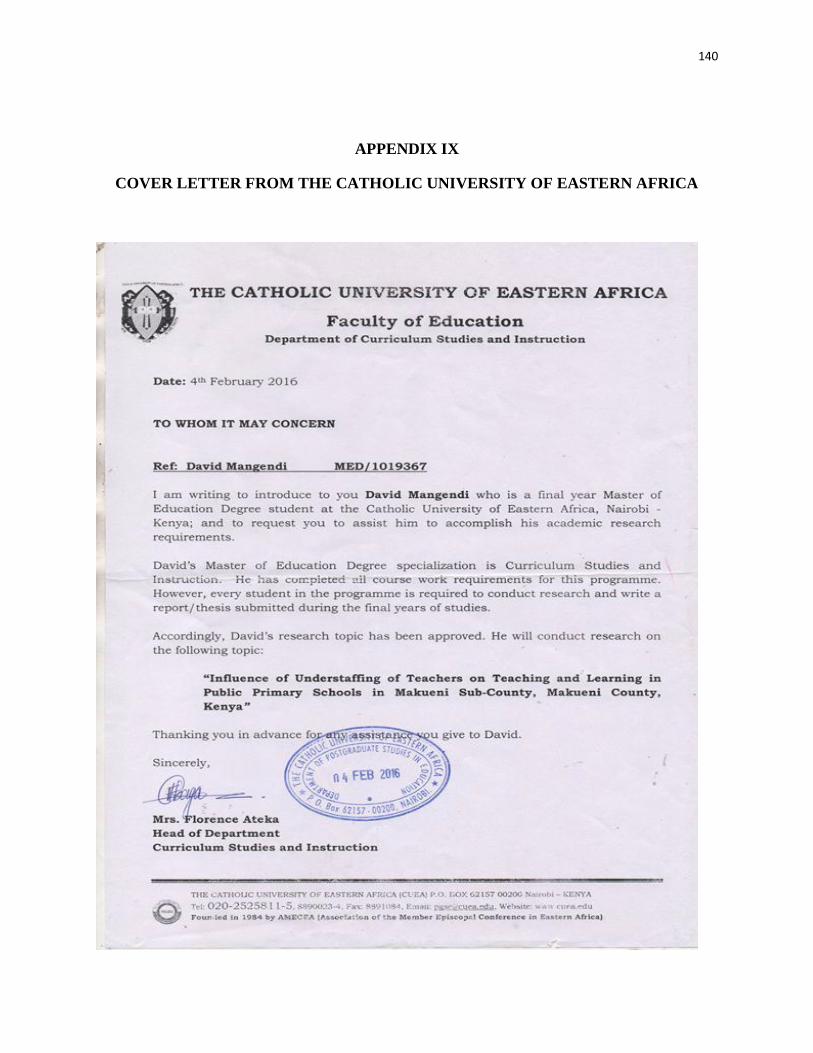
140
APPENDIX IX
COVER LETTER FROM THE CATHOLIC UNIVERSITY OF EASTERN AFRICA
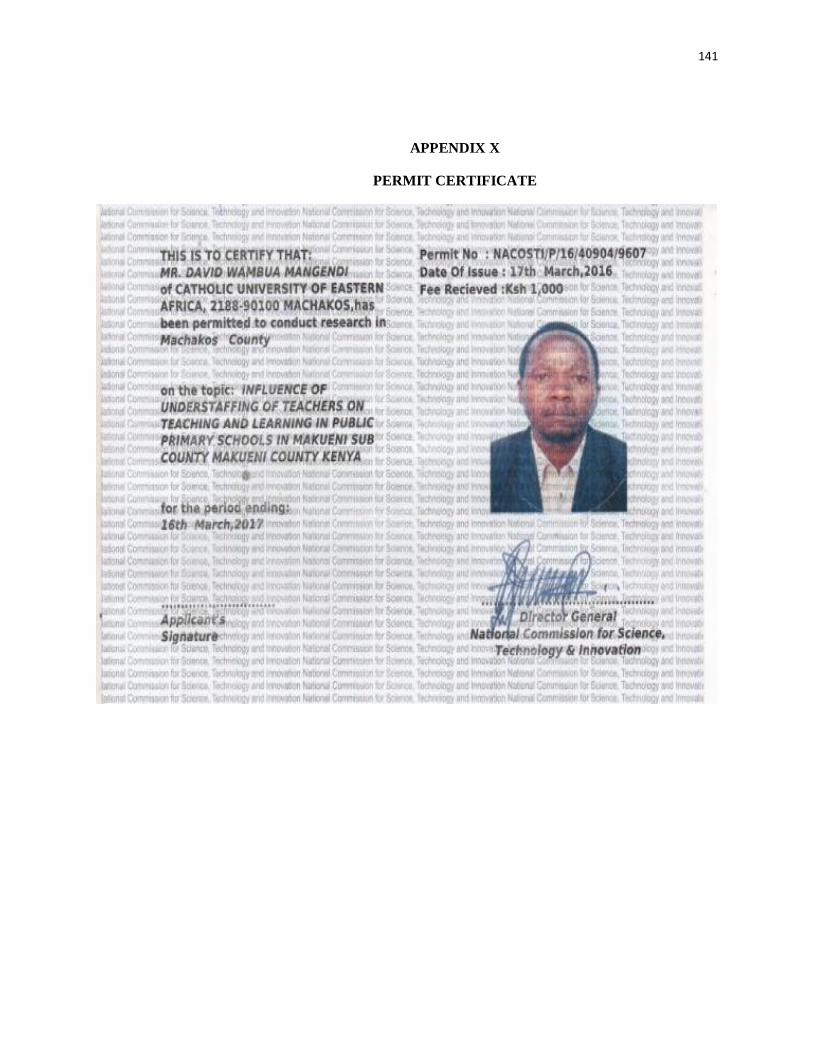
141
APPENDIX X
PERMIT CERTIFICATE
142
APPENDIX XI
RESEARCH AUTHORIZATION LETTER FROM NACOSTI
143
APPENDIX XII
RESEARCH AUTHORIZATION LETTER FROM THE COUNTY DIRECTOR OF
EDUCATION MAKUENI
144
APPENDIX XIII
RESEARCH AUTHORIZATION LETTER FROM THE COUNTY COMMISSIONER
MAKUENI
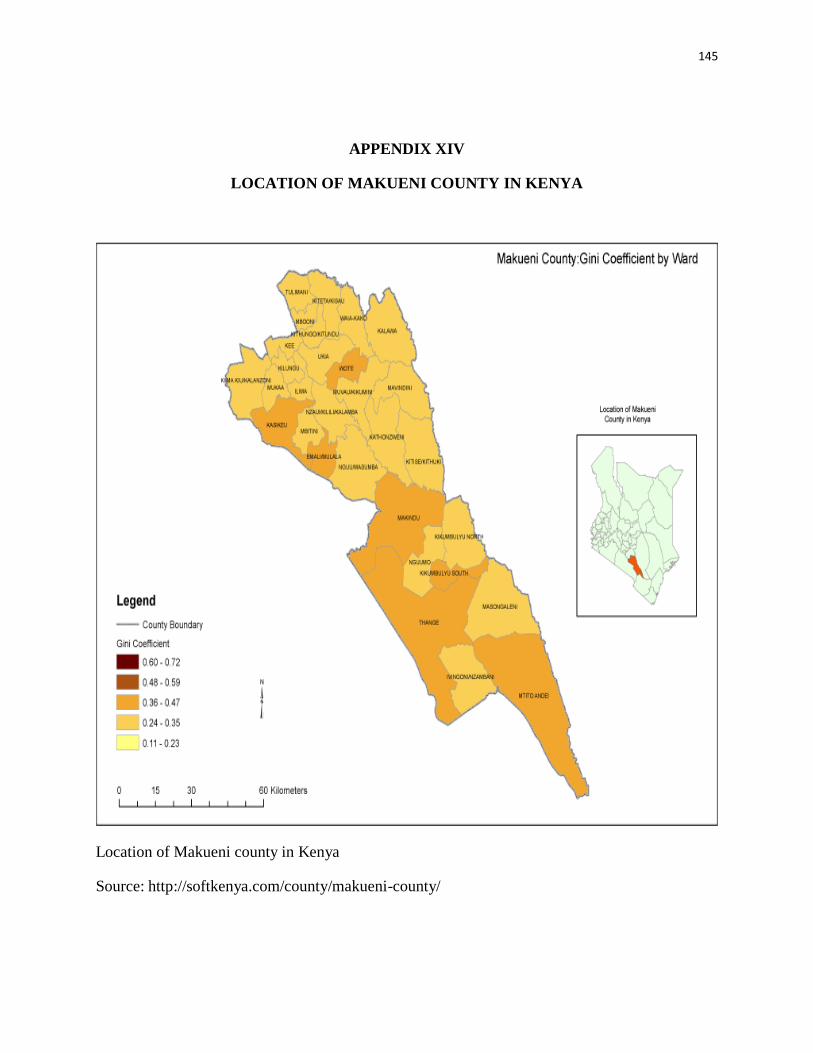
145
APPENDIX XIV
LOCATION OF MAKUENI COUNTY IN KENYA
Location of Makueni county in Kenya
Source: http://softkenya.com/county/makueni-county/
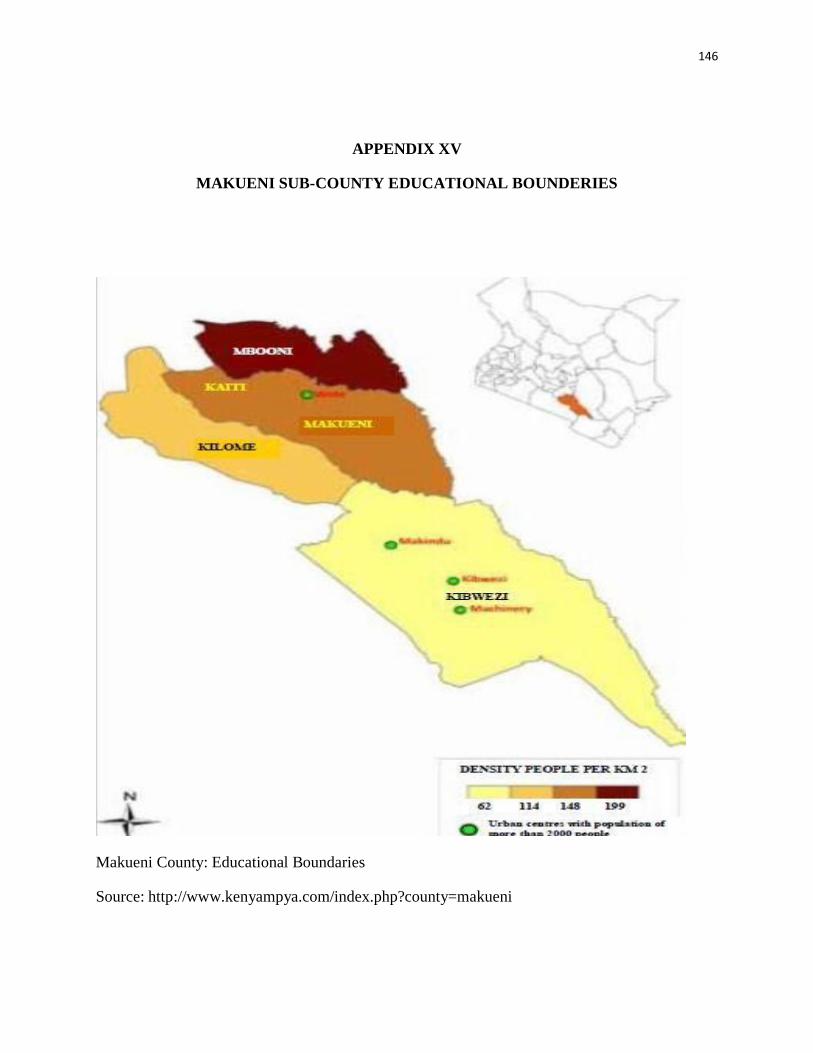
146
APPENDIX XV
MAKUENI SUB-COUNTY EDUCATIONAL BOUNDERIES
Makueni County: Educational Boundaries
Source: http://www.kenyampya.com/index.php?county=makueni