Embed Size (px)
Citation preview
Report No. SH-08-0201-B1-V1.01
- Final Report -
INFLUENCE OF TURBOCHARGER FOULING ON FUEL CONSUMPTION
Customer: Innospec Ltd. Thiesstr. 61 D-44649 Herne Germany Contractor: MET Motoren- und Energietechnik GmbH Erich-Schlesinger-Straße 50 D-18059 Rostock Germany Editors: Prof. Dr.-Ing. habil. S. Bludszuweit Dr.-Ing. H. Stückrad Dipl.-Ing. C. Escher Date: 01.07.2008
SH-08-0201-B1-V1.01 INFLUENCE OF TURBOCHARGER FOULING ON FUEL CONSUMPTION
MET Motoren- und Energietechnik GmbH Rostock
1
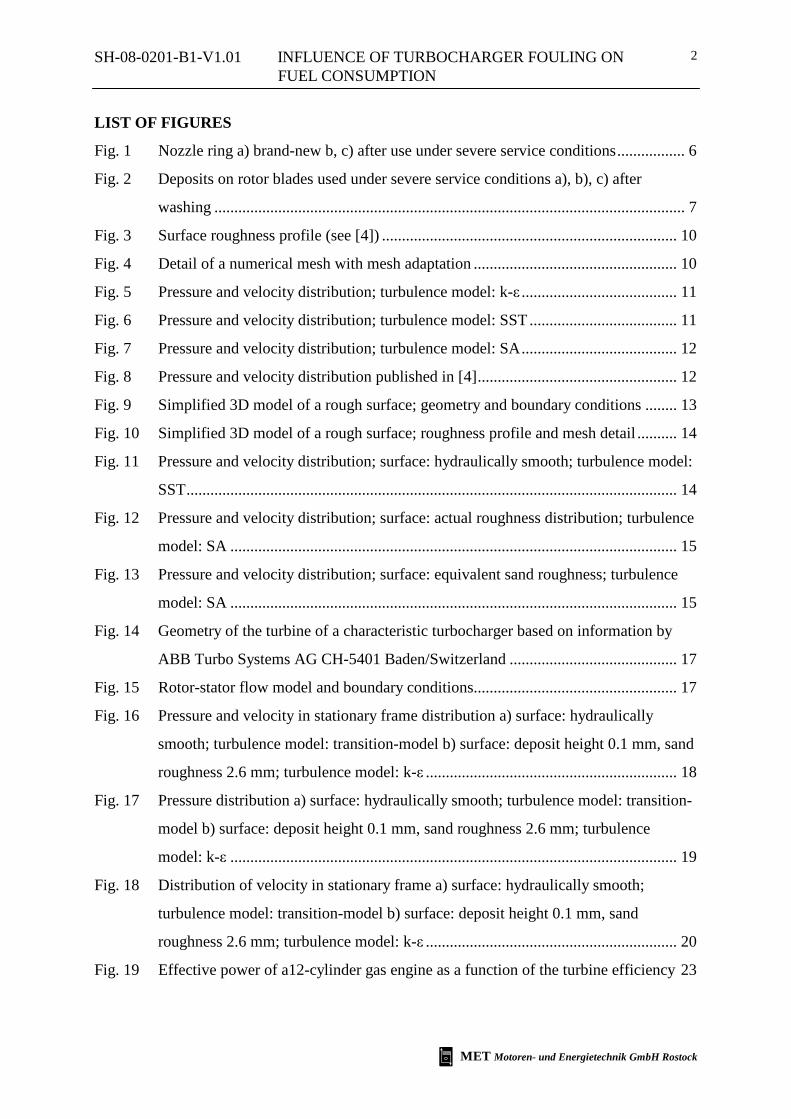
CONTENT
1 INTRODUCTION.............................................................................................................. 4
1.1 Initial Situation - Motivation for the Project.............................................................. 5
1.2 Terms of Reference.................................................................................................... 8
2 SOLUTION STRATEGY – STEPS OF THE INVESTIGATION.................................... 8
3 RESULTS ........................................................................................................................ 10
3.1 Strongly Simplified 2D Model of a Rough Surface................................................. 10
3.2 Simplified 3D Model of a Rough Surface ............................................................... 13
3.3 Fully 3D Model of the Turbine of a Turbocharger .................................................. 17
4 SUMMARY / CONCLUSIONS...................................................................................... 22
SH-08-0201-B1-V1.01 INFLUENCE OF TURBOCHARGER FOULING ON FUEL CONSUMPTION
MET Motoren- und Energietechnik GmbH Rostock
2
LIST OF FIGURES
Fig. 1 Nozzle ring a) brand-new b, c) after use under severe service conditions................. 6
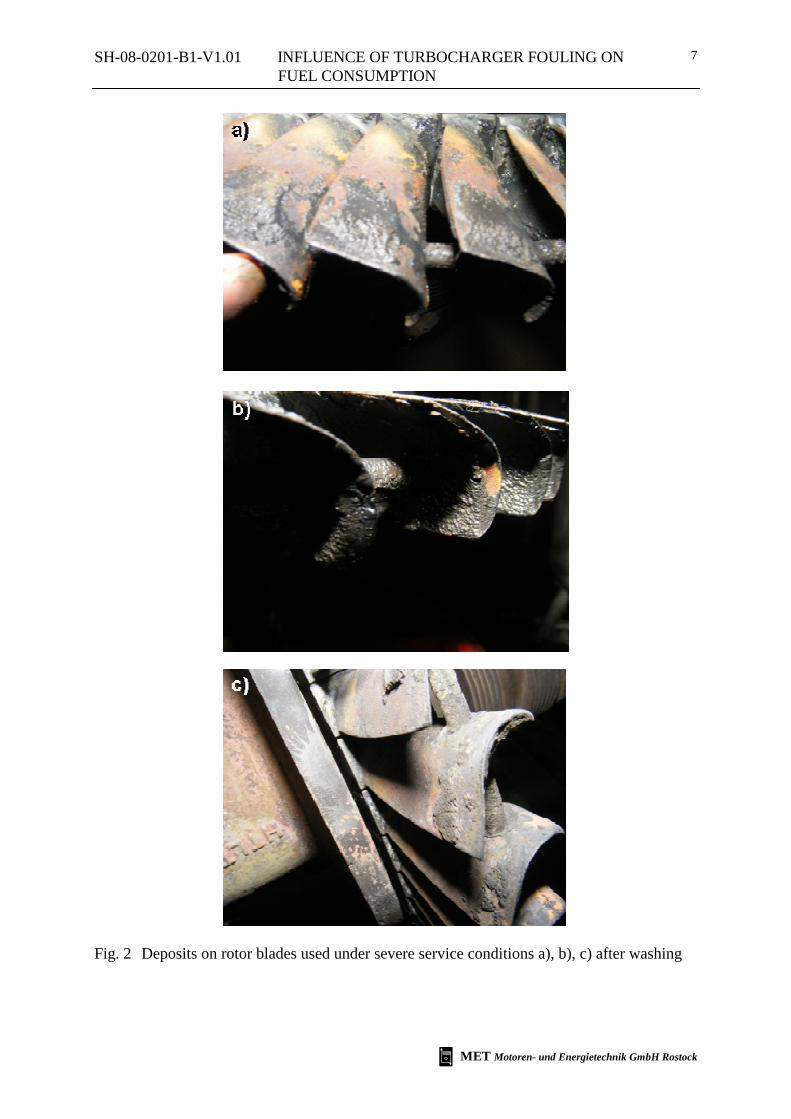
Fig. 2 Deposits on rotor blades used under severe service conditions a), b), c) after
washing ...................................................................................................................... 7
Fig. 3 Surface roughness profile (see [4]) .......................................................................... 10
Fig. 4 Detail of a numerical mesh with mesh adaptation ................................................... 10
Fig. 5 Pressure and velocity distribution; turbulence model: k-ε ....................................... 11
Fig. 6 Pressure and velocity distribution; turbulence model: SST ..................................... 11
Fig. 7 Pressure and velocity distribution; turbulence model: SA....................................... 12
Fig. 8 Pressure and velocity distribution published in [4].................................................. 12
Fig. 9 Simplified 3D model of a rough surface; geometry and boundary conditions ........ 13
Fig. 10 Simplified 3D model of a rough surface; roughness profile and mesh detail .......... 14
Fig. 11 Pressure and velocity distribution; surface: hydraulically smooth; turbulence model:
SST........................................................................................................................... 14
Fig. 12 Pressure and velocity distribution; surface: actual roughness distribution; turbulence
model: SA ................................................................................................................ 15
Fig. 13 Pressure and velocity distribution; surface: equivalent sand roughness; turbulence
model: SA ................................................................................................................ 15
Fig. 14 Geometry of the turbine of a characteristic turbocharger based on information by
ABB Turbo Systems AG CH-5401 Baden/Switzerland .......................................... 17
Fig. 15 Rotor-stator flow model and boundary conditions................................................... 17
Fig. 16 Pressure and velocity in stationary frame distribution a) surface: hydraulically
smooth; turbulence model: transition-model b) surface: deposit height 0.1 mm, sand
roughness 2.6 mm; turbulence model: k-ε ............................................................... 18
Fig. 17 Pressure distribution a) surface: hydraulically smooth; turbulence model: transition-
model b) surface: deposit height 0.1 mm, sand roughness 2.6 mm; turbulence
model: k-ε ................................................................................................................ 19
Fig. 18 Distribution of velocity in stationary frame a) surface: hydraulically smooth;
turbulence model: transition-model b) surface: deposit height 0.1 mm, sand
roughness 2.6 mm; turbulence model: k-ε ............................................................... 20
Fig. 19 Effective power of a12-cylinder gas engine as a function of the turbine efficiency 23
SH-08-0201-B1-V1.01 INFLUENCE OF TURBOCHARGER FOULING ON FUEL CONSUMPTION
MET Motoren- und Energietechnik GmbH Rostock
3
Fig. 20 Specific fuel consumption of a12-cylinder gas engine as a function of the turbine
efficiency.................................................................................................................. 24
Fig. 21 Fuel consumption changes due to changes in turbine efficiency ............................. 24
Fig. 22 Influence of turbocharger efficiency on fuel consumption [5]................................. 25
LIST OF TABLES
Tab. 1 Pressure loss and isentropic efficiency of the turbine part of a turbo charger for
different boundary conditions .................................................................................. 22
Tab. 2 12-Technical data of a 12-cylinder gas engine......................................................... 23
SH-08-0201-B1-V1.01 INFLUENCE OF TURBOCHARGER FOULING ON FUEL CONSUMPTION
MET Motoren- und Energietechnik GmbH Rostock
4
1 INTRODUCTION
A turbocharger is a piece of equipment installed in diesel engines to increase the power output
of the engine by increasing the mass of air entering the engine. Basically, the turbocharger
consists of a gas turbine driven by the waste energy of the engine exhaust gas, which is di-
rectly coupled to a centrifugal blower (gas compressor). It is known that modern turbochargers
with their high efficiency can take from the exhaust gas stream a sufficient amount of energy
to make available the required air flow for the combustion as well as the scavenging air of the
cylinder. The blower compresses the intake air above atmospheric pressure, greatly increasing
the volumetric efficiency beyond that of naturally aspirated engines. Compressor and turbine
have the same shaft. A key advantage of turbochargers is that they offer a considerable im-
provement in engine efficiency and an increase in engine power with only a slight increase in
weight.
The compressor increases the pressure of the air entering the engine, so a greater "charge"
(fuel/air mixture) enters the engine in the same time interval (the increase in fuel is required to
keep the same mixture ratio). This greatly improves the volumetric efficiency of the engine.
The increase in pressure is called "boost". The energy from the extra fuel leads to more overall
engine power. A disadvantage of high boost pressures for internal combustion engines is that
compressing the inlet air increases its temperature. The higher temperature is a volumetric
efficiency downgrade which can be alleviated by cooling the inlet air before it is fed into the
cylinders, using an intercooler or a charge air cooler (a heat-exchange device).
However, there are some parasitic losses due to heat and exhaust backpressure from the tur-
bine, so turbochargers are generally only about 80% efficient because it takes some work for
the engine to push those gases through the turbocharger turbine (which is acting as a resis-
tance in the exhaust stream). Recently intensive analysis has been carried out as one can addi-
tionally increase the efficiency of the turbochargers to reduce engine exhaust emissions.
This can be achieved by compressing the fresh air before the cylinder to a very high pressure
before expanding the highly compressed air into the cylinder. As a result, heat is extracted, as
is well known, from the cylinder contents and peak temperatures are lowered during the com-
bustion process leading to reduced NOx formation.
SH-08-0201-B1-V1.01 INFLUENCE OF TURBOCHARGER FOULING ON FUEL CONSUMPTION
MET Motoren- und Energietechnik GmbH Rostock
5
1.1 Initial Situation - Motivation for the Project
The previously described positive effects of the turbocharger on the engine process can only
occur during the engine operation if the efficiency of the turbocharger is not reduced under
real conditions by fouling. The components of the turbines of turbochargers operate in a par-
ticularly harsh environment. All surfaces that come in contact with the exhaust gases invaria-
bly become rough with service. Normally the main cause of the fouling is the incomplete
combustion of heavy fuel oil. The danger of fouling is greater, the more large diesel engines
are operated in the lower partial-load operational range without the use of combustion improv-
ing fuel additives. The degree and the nature of roughness due to mechanisms such as erosion,
fuel deposition, pitting, and spallation of thermal-barrier coatings depend on the fuel (HFO)
burnt, the operating conditions, and service time. This material degradation in the form of
surface roughness is known to increase surface skin friction and heat transfer in a significant
way. For a given cooling management, increase in surface heat transfer increases material
temperature, which hastens further material degradation.
It is well known that keeping the foils of a turbine free-flowing helps to maintain pumping
efficiency and subsequently helps to keep thermal efficiency and output capacity of the engine
high. Otherwise if a turbocharger is used with very rough nozzle ring and turbine blades the
fuel consumption and the exhaust temperature will increase significantly, which in turn can
possibly lead to engine and turbocharger break-down.
The turbine nozzles are the components that will have the most effect on efficiency where
surface finish (roughness) is concerned. Although both nozzles and turbine blades have the
highest ratio of surface area to the cross-sectional area of the exhaust gas path, the turbine
blades have a lower differential velocity between the gas and surface, making them less af-
fected by roughness than are the nozzles. Also, the higher the pressure of the gas, the more
important roughness becomes.
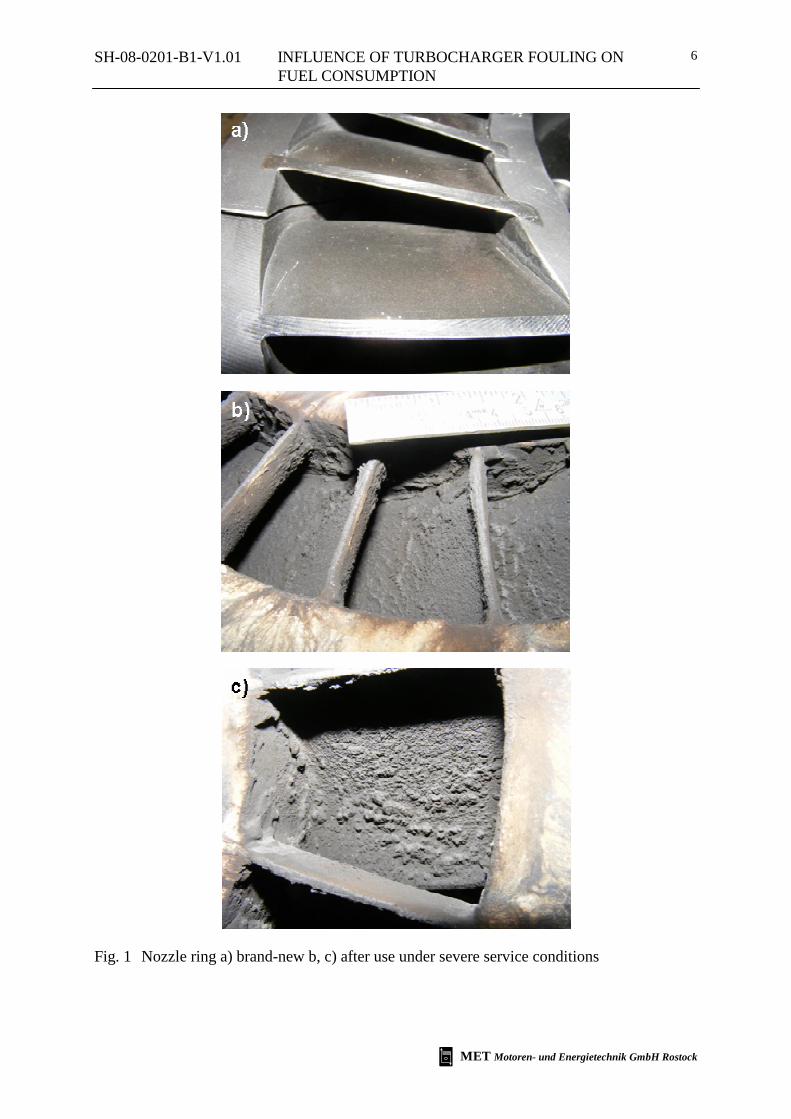
Fig. 1 shows clearly the surface state of a nozzle ring in service in comparison to a factory-
new component. Clearly deposits and roughness on a millimetre scale can be recognised.
In Fig. 2 the deposits on the rotor blades of a used turbine are shown after washing. Also here
the thickness of the deposits partially lies in the scale of millimetres.
SH-08-0201-B1-V1.01 INFLUENCE OF TURBOCHARGER FOULING ON FUEL CONSUMPTION
MET Motoren- und Energietechnik GmbH Rostock
6
Fig. 1 Nozzle ring a) brand-new b, c) after use under severe service conditions
SH-08-0201-B1-V1.01 INFLUENCE OF TURBOCHARGER FOULING ON FUEL CONSUMPTION
MET Motoren- und Energietechnik GmbH Rostock
7
Fig. 2 Deposits on rotor blades used under severe service conditions a), b), c) after washing
SH-08-0201-B1-V1.01 INFLUENCE OF TURBOCHARGER FOULING ON FUEL CONSUMPTION
MET Motoren- und Energietechnik GmbH Rostock
8
1.2 Terms of Reference
In order to estimate the efficiency losses of turbo chargers during a service cycle, it is neces-
sary to estimate the skin friction and heat transfer augmentation generated by various types of
surface roughness. So the aim of the current project was to demonstrate the influence of the
typical changes of surface roughness under service conditions to the pressure drop inside the
turbine of a turbocharger using state of the art numerical (CFD) simulation and analysis tech-
niques on
a) strongly simplified geometries taking into consideration the real roughness of a surface.
b) the real complex geometry of a turbocharger turbine using simplified roughness models.
2 SOLUTION STRATEGY – STEPS OF THE INVESTIGATION
The solution of the problem is planned in 3 steps:
Step 1:
The first step of the investigations is the preliminary analysis of a 2D geometrical model. The
geometrical model is based on real roughness conditions similar to experimentally determined
roughness data. Primarily, the model is used for the comparison of different mesh generation
strategies and the evaluation of the influence of different turbulence models. The results of the
simulation runs will be compared to results taken from well known reference sources (see
[4]). For the comparison cases nearly identical geometrical proportions and boundary condi-
tions were used. The main objectives of the investigations are
• the optimization of the necessary refinement of the numerical mesh and
• the choice of the turbulence model for further investigations.
Step 2:
The second step of investigation work is characterized by the creation of a three-dimensional
geometrical model of a real surface topography based on measured data. The three-
dimensional surface topography is formed by a texture consisting of repetitive or random de-
viations from the nominal surface, whereas surface roughness consists of the finer irregulari-
ties which are present. The coarser elements of the surface texture are waviness, lay and flaws.

SH-08-0201-B1-V1.01 INFLUENCE OF TURBOCHARGER FOULING ON FUEL CONSUMPTION
MET Motoren- und Energietechnik GmbH Rostock
9
The universally and internationally recognized parameter of roughness is Ra and is defined as
the arithmetic average deviation of the surface from a mean line or centreline.
The above three-dimensional geometrical model of the real surface roughness will be mapped
on a numerical mesh and using boundary conditions accordingly a 3D CFD model will be
created. Using the CFD model the pressure loss along the actual rough test surface will be
determined and compared to results which were obtained with the application of
• a hydraulically smooth surface
• a surface with an equivalent sand roughness varying the grain size
As a result of the investigations an equivalent sand grain roughness size can be derived en-
tirely from roughness geometry for further use with complex geometries.
Step 3:
In step 3 a three-dimensional geometrical model representing the complex geometry of the
stator (nozzle ring), rotor (turbine blades) and housing of a real turbine stage of a turbocharger
is mapped on a numerical mesh and simulated under real boundary conditions by using state
of the art CFD tools. The calculation effort of the model as a result of the necessary resolution
of the geometry does not permit taking into consideration the actual roughness of the surface,
so it is necessary to fall back on the model of equivalent sand grain roughness. While doing so
the values of sand grain size determined in step 2 will be used for the CFD model. For com-
parison purposes a simulation case with a hydraulically smooth surface will be calculated as
well. As result of the calculations the influences of surface roughness of the nozzle ring, tur-
bine blades and the housing on the pressure drop over the turbine and with it the turbine effi-
ciency may be evaluated. By means of the last findings an approximation of the changes in
fuel consumption caused by a changed turbine efficiency of the turbocharger can be calcu-
lated.
SH-08-0201-B1-V1.01 INFLUENCE OF TURBOCHARGER FOULING ON FUEL CONSUMPTION
MET Motoren- und Energietechnik GmbH Rostock
10
3 RESULTS
3.1 Strongly Simplified 2D Model of a Rough Surface
270 mm270 mm
Roughness Profile
0.00.0 0.2
3.6
8.8
10.7
13.3
9.6
8.3
6.7
5.4
14.8
18.4
0.0
5.0
10.0
15.0
20.0
below -2.5mm -2.5mm to -2.0mm -2.0mm to -1.5mm -1.5mm to -1.0mm -1.0mm to -0.5mm -0.5mm to 0.0mm 0.00mm to 0.5mm 0.5mm to 1.0mm 1.0mm to 1.5mm 1.5mm to 2.0mm 2.0mm to 2.5mm 2.5mm to 3.0mm above 3.0mm
Roughness Magnitude [mm]
Freq
uenc
y [%
]
Avarage Value of Roughness Magnitude: 0.424 mm
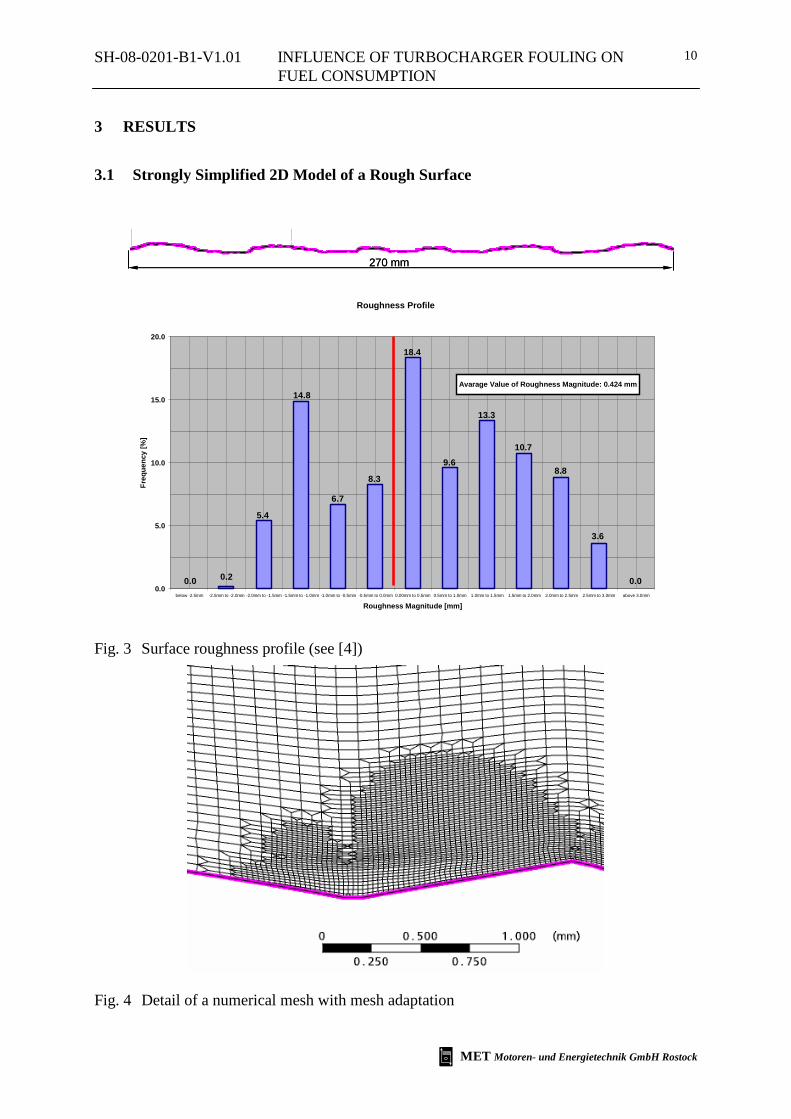
Fig. 3 Surface roughness profile (see [4])
Fig. 4 Detail of a numerical mesh with mesh adaptation
SH-08-0201-B1-V1.01 INFLUENCE OF TURBOCHARGER FOULING ON FUEL CONSUMPTION
MET Motoren- und Energietechnik GmbH Rostock
11
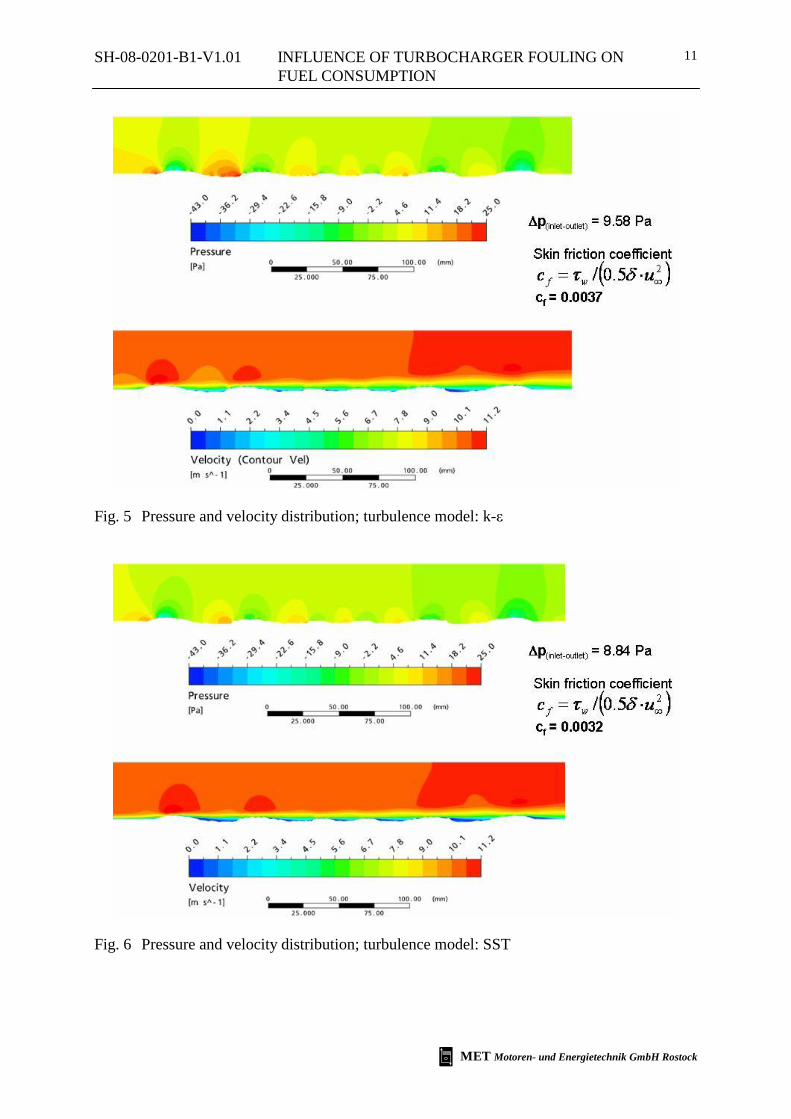
Fig. 5 Pressure and velocity distribution; turbulence model: k-ε
Fig. 6 Pressure and velocity distribution; turbulence model: SST
SH-08-0201-B1-V1.01 INFLUENCE OF TURBOCHARGER FOULING ON FUEL CONSUMPTION
MET Motoren- und Energietechnik GmbH Rostock
12
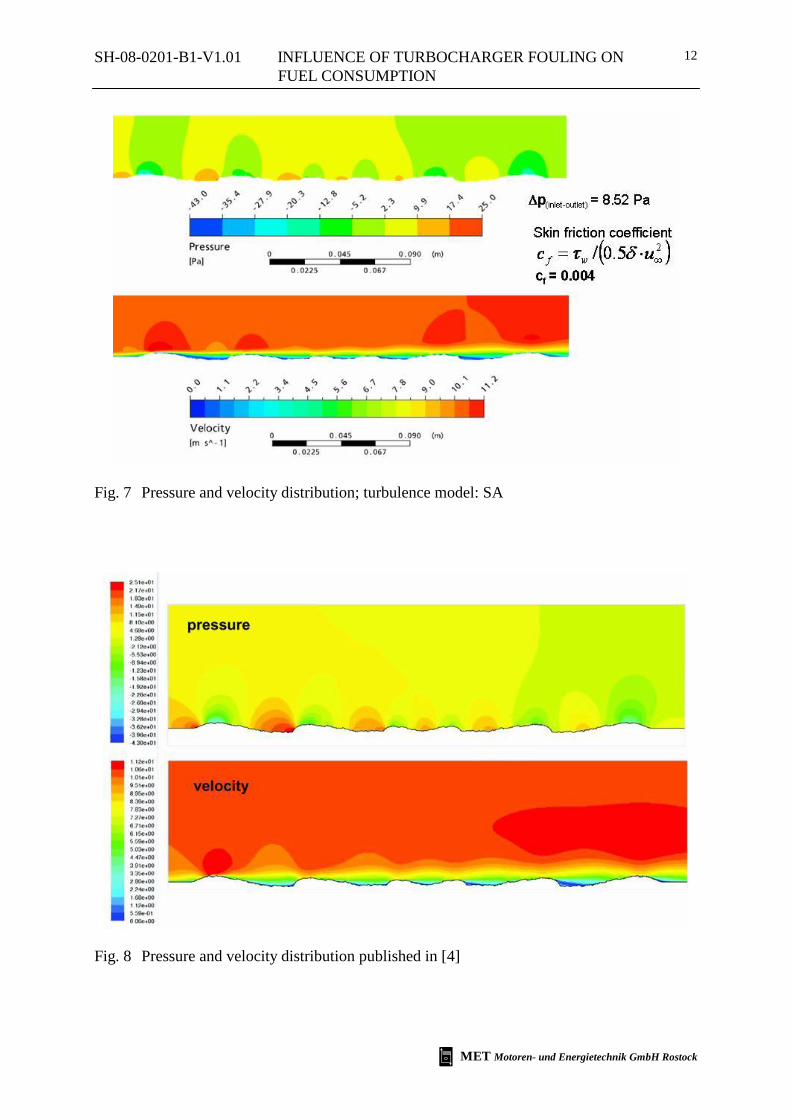
Fig. 7 Pressure and velocity distribution; turbulence model: SA
Fig. 8 Pressure and velocity distribution published in [4]
SH-08-0201-B1-V1.01 INFLUENCE OF TURBOCHARGER FOULING ON FUEL CONSUMPTION
MET Motoren- und Energietechnik GmbH Rostock
13
The principal possibilities of the entire mapping of a rough surface on a numerical mesh and a
simulation with modern CFD solvers were examined in a two-dimensional model. Fig. 3
shows the enlargement of a representative sectional view of a rough surface and the statistical
distribution of the roughness. A detail of the numerical mesh is drawn in Fig. 4. With the help
of the scale the refinement (high resolution) of the grid used can be read. Simulation calcula-
tions with different turbulence models were carried out. Fig. 5 to 7 show the velocity and
pressure distributions in the vicinity of the test case for the following turbulence models:
• k-ε Fig. 5,
• SST Fig. 6,
• S-A Fig. 7.
After analysis of the calculations carried out and comparison of the skin friction coefficients
to results which were taken from available literature (see Fig. 8), the Spallart-Allmaras (S-A)
turbulence model proved to be suitable for use with further investigations of rough surfaces.
3.2 Simplified 3D Model of a Rough Surface
Boundary Conditions:Inlet - velocity: 10 m/sOutlet - pressure: 0 PaBottom - wall: smooth / rough surfaceAll other sidesof the fluid domain: symmetry b. c.
Inlet
Outlet
Wall (hydraulically smooth)Rough Surface
Wall (hydraulically smooth)
Inlet
Outlet
Wall (hydraulically smooth)Rough Surface
Wall (hydraulically smooth)
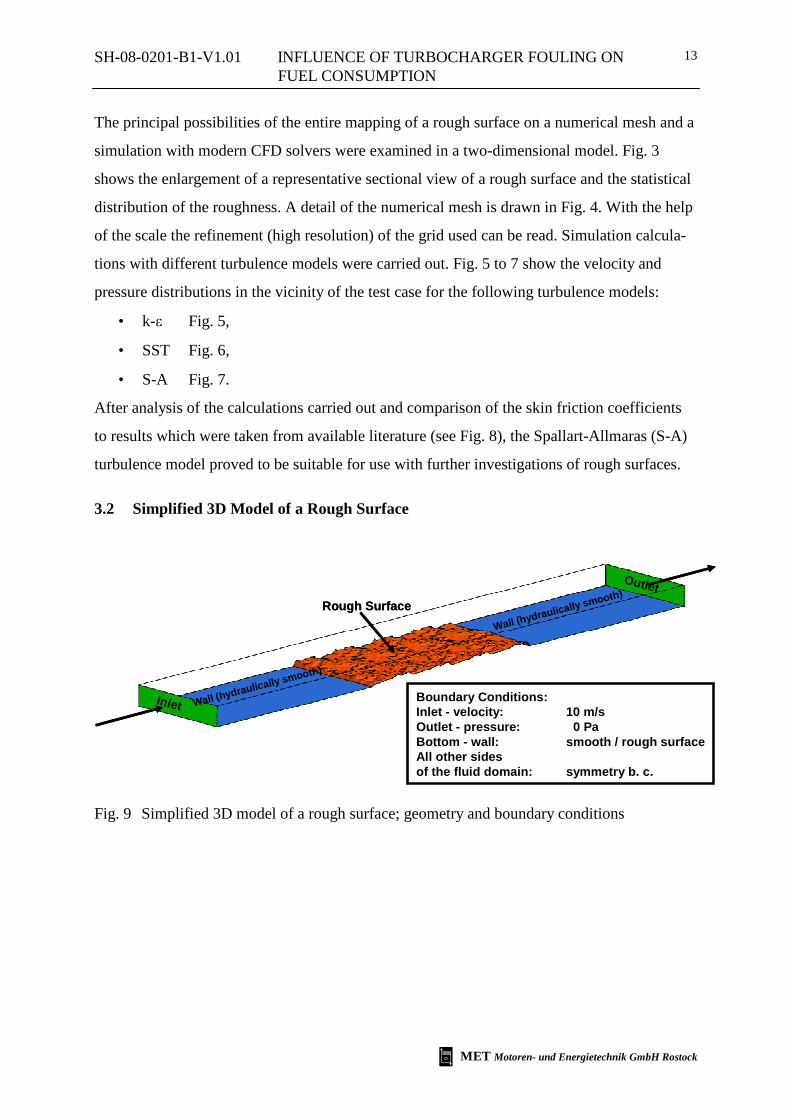
Fig. 9 Simplified 3D model of a rough surface; geometry and boundary conditions
SH-08-0201-B1-V1.01 INFLUENCE OF TURBOCHARGER FOULING ON FUEL CONSUMPTION
MET Motoren- und Energietechnik GmbH Rostock
14
Numerical mesh (detail)Roughness profile Height max = 2.8 mmHeight min = 0.0 mmHeight average = 1.4 mm
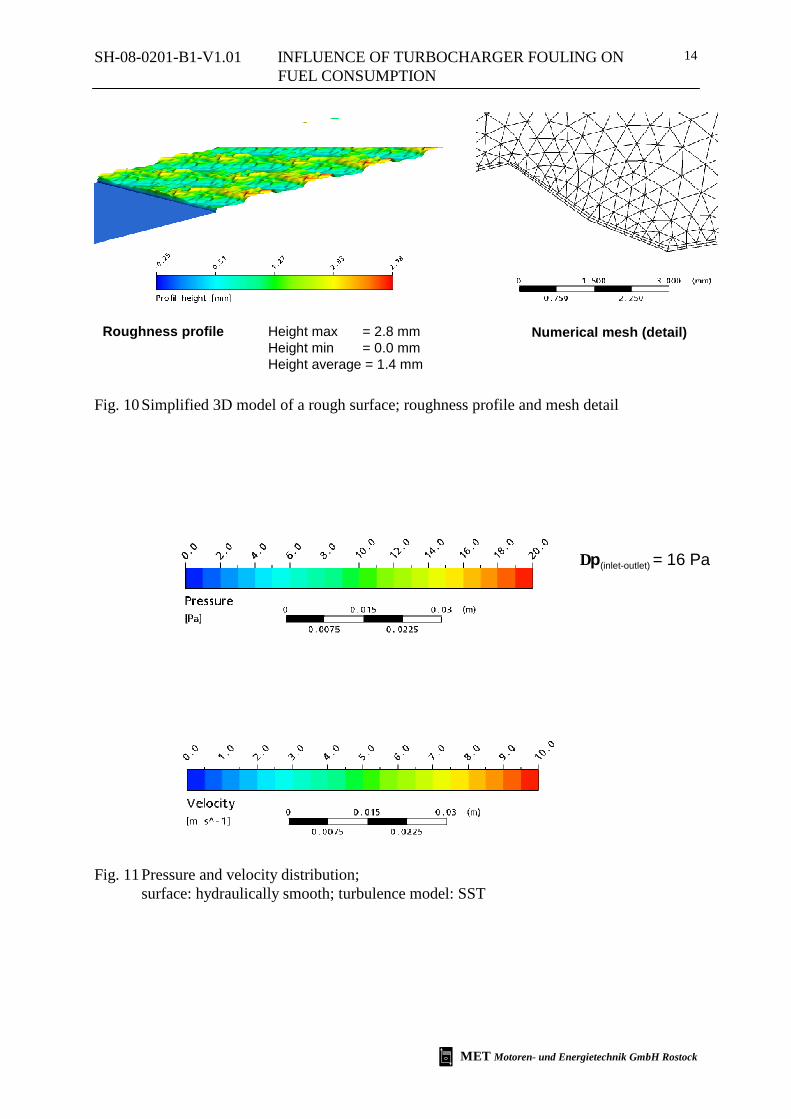
Fig. 10 Simplified 3D model of a rough surface; roughness profile and mesh detail
∆p(inlet-outlet) = 16 Pa
Fig. 11 Pressure and velocity distribution; surface: hydraulically smooth; turbulence model: SST
SH-08-0201-B1-V1.01 INFLUENCE OF TURBOCHARGER FOULING ON FUEL CONSUMPTION
MET Motoren- und Energietechnik GmbH Rostock
15
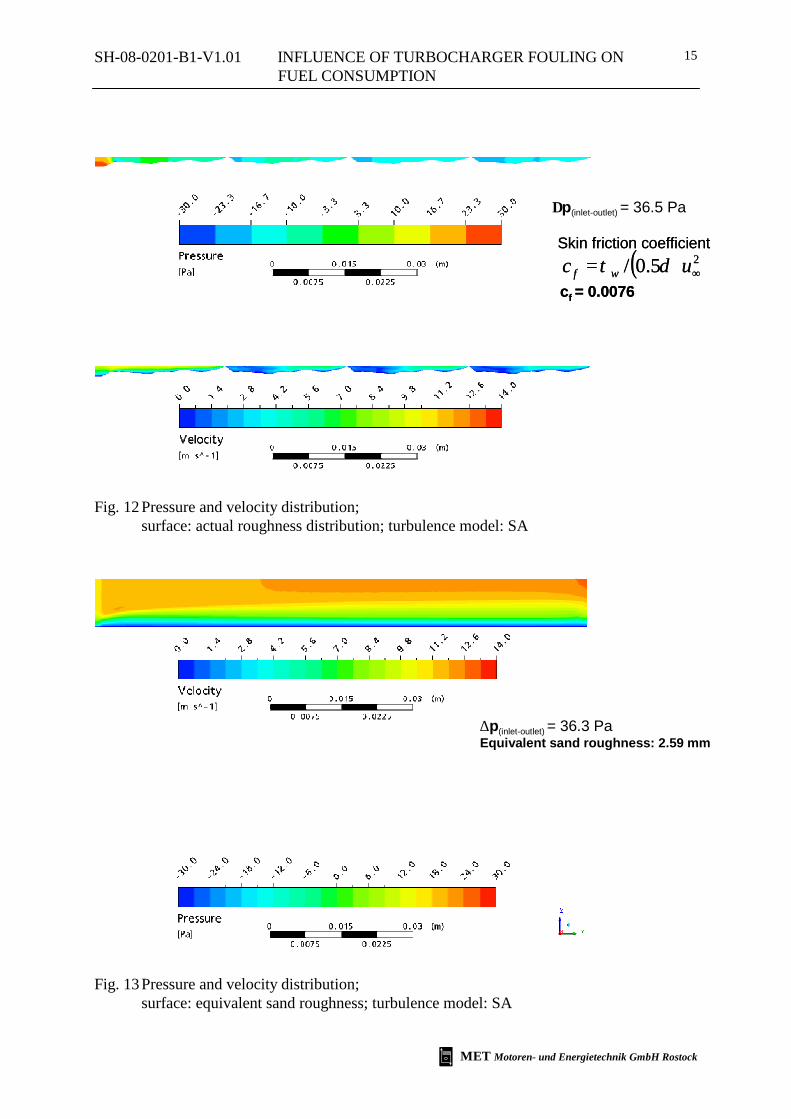
∆p(inlet-outlet) = 36.5 Pa
Skin friction coefficient( )25.0/ ∞⋅= uc wf δτ
cf = 0.0076
Skin friction coefficient( )25.0/ ∞⋅= uc wf δτ
cf = 0.0076
Fig. 12 Pressure and velocity distribution; surface: actual roughness distribution; turbulence model: SA
∆p(inlet-outlet) = 36.3 PaEquivalent sand roughness: 2.59 mm
Fig. 13 Pressure and velocity distribution; surface: equivalent sand roughness; turbulence model: SA

SH-08-0201-B1-V1.01 INFLUENCE OF TURBOCHARGER FOULING ON FUEL CONSUMPTION
MET Motoren- und Energietechnik GmbH Rostock
16
In the second step the flow conditions were investigated with the help of a 3D CFD model
taking in consideration a real rough surface as well as a hydraulically smooth surface. Fur-
thermore CFD simulations with equivalent sand roughness on the test surface were carried
out. The geometry of the test bed and the boundary conditions used for the calculations are
shown in Fig. 9. Fig. 10 gives a view of the roughness profile and a detail of the numerical
mesh.
The following test conditions were simulated:
a) simulation of the hydraulically smooth surface
b) simulation of the real rough surface
c) simulation of the test surface with equivalent sand roughness
Fig. 11 to 13 illustrate the pressure and velocity distribution for the above mentioned test
cases and give information about the pressure loss and skin friction coefficient.
For case a) a pressure loss of Δpsmooth = 16.0 Pa was calculated and for case b) a loss of Δprough
= 36.5 Pa.
For case c) the parameter “equivalent sand roughness” was estimated in such a way that the
pressure loss between inlet and outlet is equal to the pressure loss in case b). So an equivalent
sand roughness of 2.6 mm was chosen for the simulation run to get an approximately identical
pressure loss of 36.3 Pa.
With these results it seems to be feasible to simulate the complex geometry of the turbo-
charger turbine with a CFD solver taking into consideration the influence of the surface
roughness by using the equivalent sand roughness approach. The exact resolution of the sur-
face roughness in combination with the complex geometry of a turbocharger turbine would
result in a size of numerical mesh which could not be handled with reasonable effort in engi-
neering calculations at present.
SH-08-0201-B1-V1.01 INFLUENCE OF TURBOCHARGER FOULING ON FUEL CONSUMPTION
MET Motoren- und Energietechnik GmbH Rostock
17
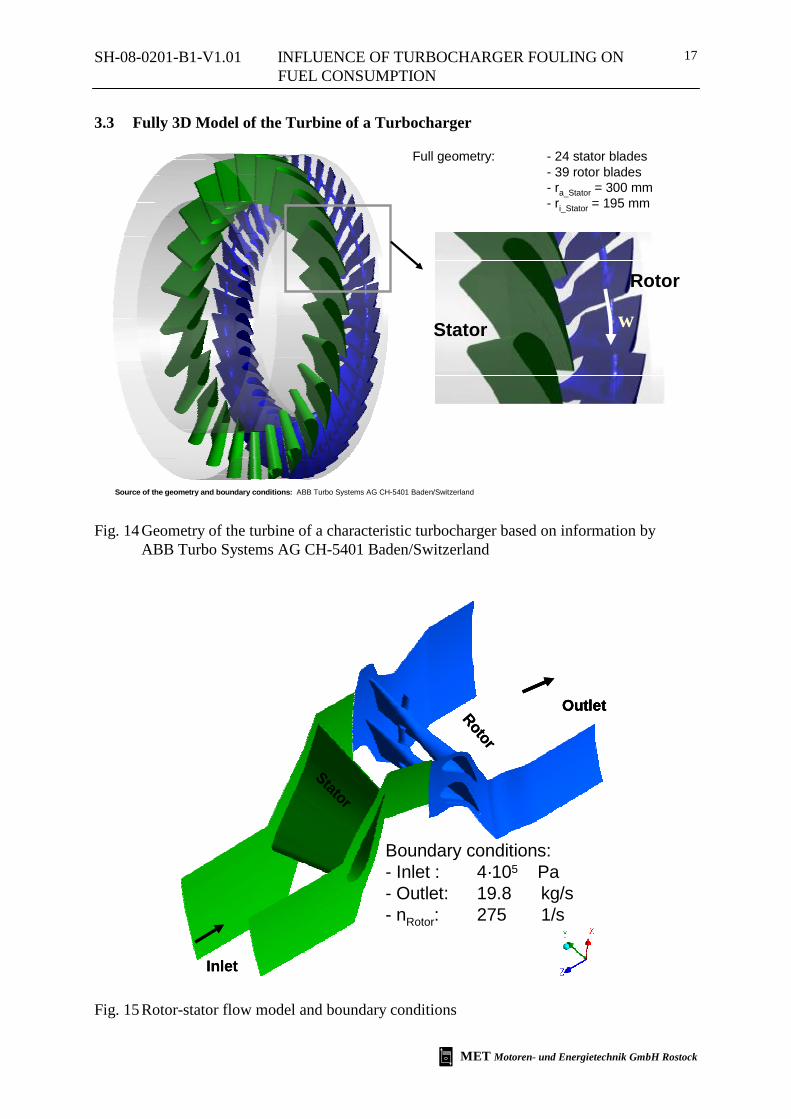
3.3 Fully 3D Model of the Turbine of a Turbocharger
Stator
Rotor
Full geometry: - 24 stator blades- 39 rotor blades- ra_Stator = 300 mm- ri_Stator = 195 mm
ω
Source of the geometry and boundary conditions: ABB Turbo Systems AG CH-5401 Baden/Switzerland
Fig. 14 Geometry of the turbine of a characteristic turbocharger based on information by ABB Turbo Systems AG CH-5401 Baden/Switzerland
Inlet
OutletRotor
Stator
Inlet
OutletOutletRotor
Stator
Boundary conditions: - Inlet : 4·105 Pa - Outlet: 19.8 kg/s- nRotor: 275 1/s
Fig. 15 Rotor-stator flow model and boundary conditions
SH-08-0201-B1-V1.01 INFLUENCE OF TURBOCHARGER FOULING ON FUEL CONSUMPTION
MET Motoren- und Energietechnik GmbH Rostock
18
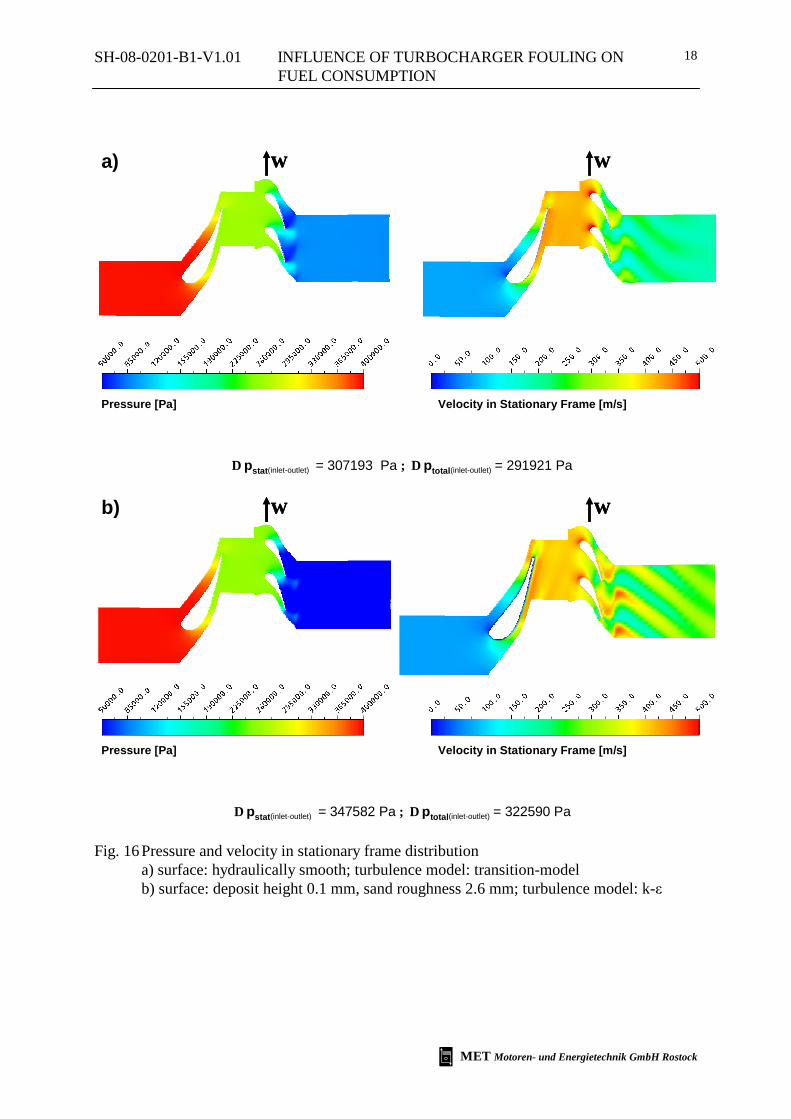
∆ pstat(inlet-outlet) = 307193 Pa ; ∆ ptotal(inlet-outlet) = 291921 Pa
Pressure [Pa] Velocity in Stationary Frame [m/s]
ωω ωωa)
∆ pstat(inlet-outlet) = 347582 Pa ; ∆ ptotal(inlet-outlet) = 322590 Pa
Pressure [Pa] Velocity in Stationary Frame [m/s]
ωω ωωb)
Fig. 16 Pressure and velocity in stationary frame distribution a) surface: hydraulically smooth; turbulence model: transition-model b) surface: deposit height 0.1 mm, sand roughness 2.6 mm; turbulence model: k-ε
SH-08-0201-B1-V1.01 INFLUENCE OF TURBOCHARGER FOULING ON FUEL CONSUMPTION
MET Motoren- und Energietechnik GmbH Rostock
19
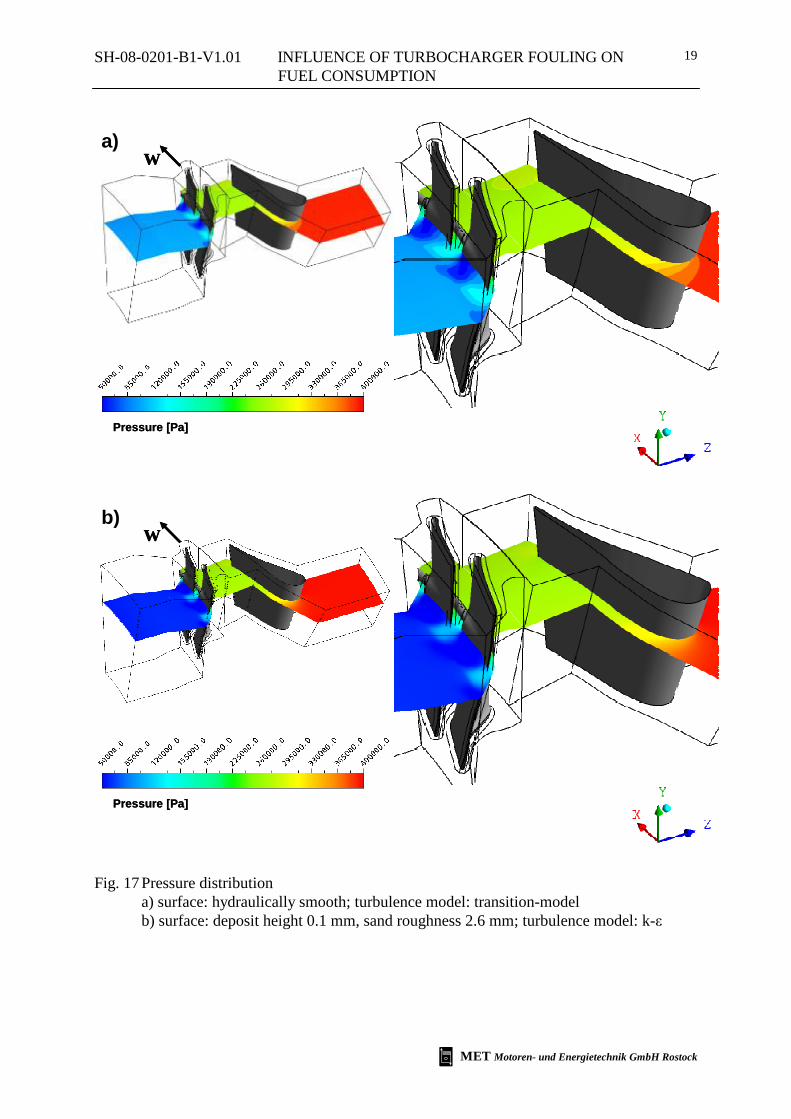
Pressure [Pa]Pressure [Pa]
ωωa)
Pressure [Pa]Pressure [Pa]
ωωb)
Fig. 17 Pressure distribution a) surface: hydraulically smooth; turbulence model: transition-model b) surface: deposit height 0.1 mm, sand roughness 2.6 mm; turbulence model: k-ε
SH-08-0201-B1-V1.01 INFLUENCE OF TURBOCHARGER FOULING ON FUEL CONSUMPTION
MET Motoren- und Energietechnik GmbH Rostock
20
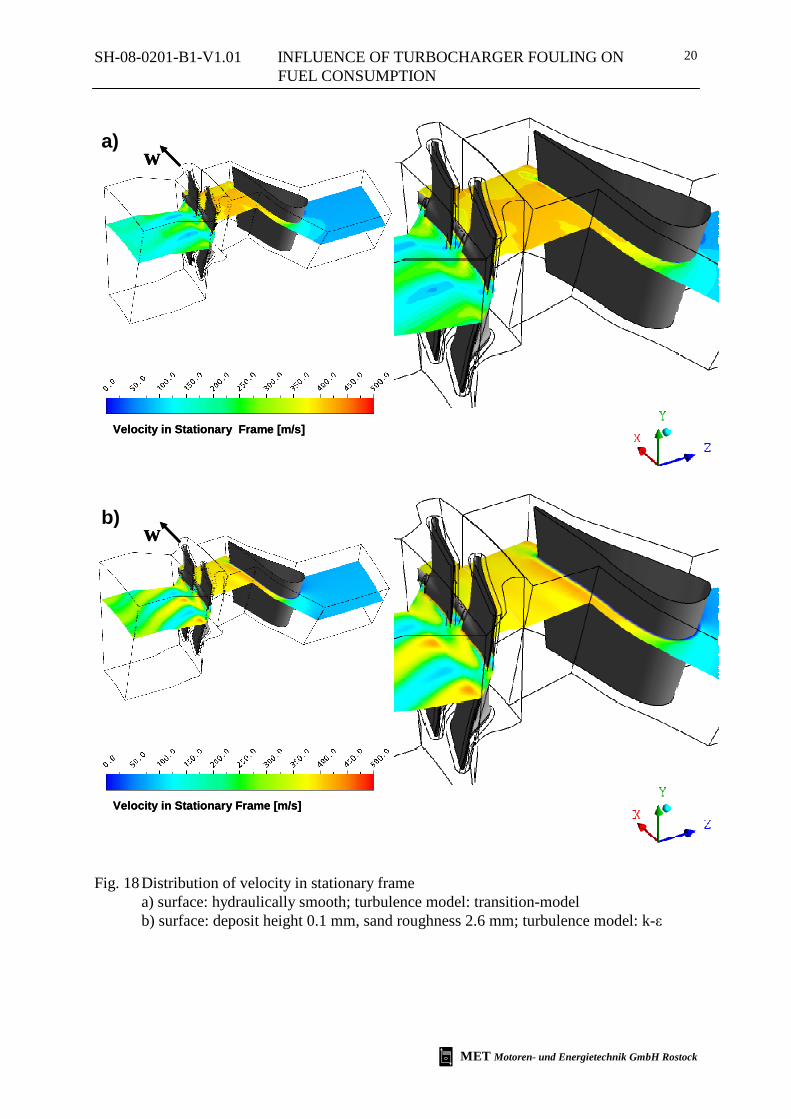
Velocity in Stationary Frame [m/s]Velocity in Stationary Frame [m/s]
ωωa)
Velocity in Stationary Frame [m/s]Velocity in Stationary Frame [m/s]
ωωb)
Fig. 18 Distribution of velocity in stationary frame a) surface: hydraulically smooth; turbulence model: transition-model b) surface: deposit height 0.1 mm, sand roughness 2.6 mm; turbulence model: k-ε
SH-08-0201-B1-V1.01 INFLUENCE OF TURBOCHARGER FOULING ON FUEL CONSUMPTION
MET Motoren- und Energietechnik GmbH Rostock
21
In the third investigation step the flow conditions inside a characteristic axial rotor stator tur-
bine were simulated. The CAD data of the turbocharger turbine geometry were placed at
MET’s disposal by ABB Turbo Systems AG. Normal forces (pressure) and shear stresses act
on the turbine blades depending on the geometrical conditions of the turbine housing, Rey-
nolds number and the surface roughness. The simulation geometry consists of a single stator
blade passage and two rotor blade passages. The rotor is modelled as rotating domain; the
stator is stationary attached in space and time. Periodic boundaries are used to allow only a
small section of full geometry to be modelled. Hydraulically smooth as well as rough surfaces
were simulated, whereas the surface roughness was modelled by using the equivalent sand
grain roughness approach.
First of all a numerical mesh of the fluid domain without deposits on the turbine blade sur-
faces was generated and the following 2 different surface roughness conditions were investi-
gated:
case 1: hydraulically smooth surface
case 2: equivalent sand roughness 2.6 mm
In the following the numerical mesh was modified taking into consideration deposits on the
turbine blade surfaces. The following combinations of surface roughness and deposits were
calculated:
case 3: deposit (0.1 mm) + hydraulically smooth surface
case 4: deposit (0.1 mm) + equivalent sand roughness 2.6 mm)
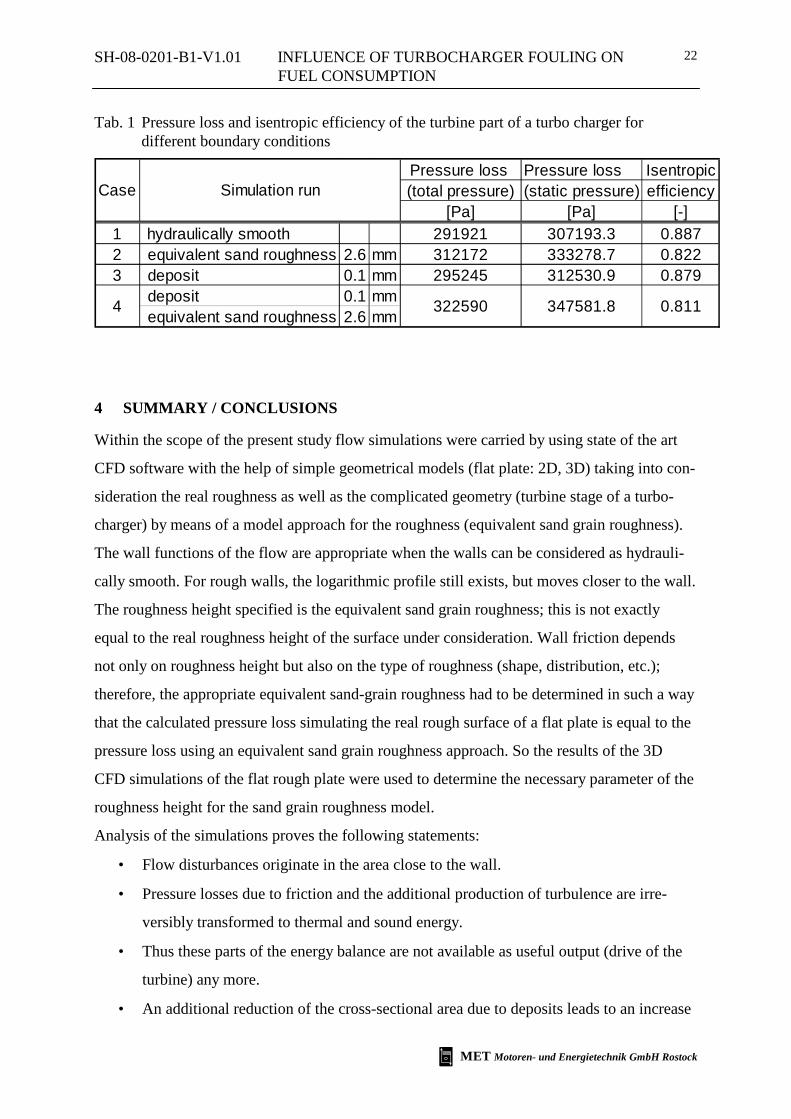
By assuming constant boundary conditions such as constant revolutions per minute and con-
stant mass flow, it can be shown that with growing surface roughness on the turbine blades the
pressure loss between inlet and outlet increases (see Tab. 1).
At the same time with increasing roughness of the blades the isentropic efficiency of the tur-
bine part of the turbo charger decreases. In the range of examination the efficiency loss of the
turbine can be as high as 7.6 %.
SH-08-0201-B1-V1.01 INFLUENCE OF TURBOCHARGER FOULING ON FUEL CONSUMPTION
MET Motoren- und Energietechnik GmbH Rostock
22
Tab. 1 Pressure loss and isentropic efficiency of the turbine part of a turbo charger for different boundary conditions
Pressure loss Pressure loss Isentropic(total pressure) (static pressure) efficiency
[Pa] [Pa] [-]1 hydraulically smooth 291921 307193.3 0.8872 equivalent sand roughness 2.6 mm 312172 333278.7 0.8223 deposit 0.1 mm 295245 312530.9 0.879
deposit 0.1 mmequivalent sand roughness 2.6 mm
Case Simulation run
0.8114 322590 347581.8
4 SUMMARY / CONCLUSIONS
Within the scope of the present study flow simulations were carried by using state of the art
CFD software with the help of simple geometrical models (flat plate: 2D, 3D) taking into con-
sideration the real roughness as well as the complicated geometry (turbine stage of a turbo-
charger) by means of a model approach for the roughness (equivalent sand grain roughness).
The wall functions of the flow are appropriate when the walls can be considered as hydrauli-
cally smooth. For rough walls, the logarithmic profile still exists, but moves closer to the wall.
The roughness height specified is the equivalent sand grain roughness; this is not exactly
equal to the real roughness height of the surface under consideration. Wall friction depends
not only on roughness height but also on the type of roughness (shape, distribution, etc.);
therefore, the appropriate equivalent sand-grain roughness had to be determined in such a way
that the calculated pressure loss simulating the real rough surface of a flat plate is equal to the
pressure loss using an equivalent sand grain roughness approach. So the results of the 3D
CFD simulations of the flat rough plate were used to determine the necessary parameter of the
roughness height for the sand grain roughness model.
Analysis of the simulations proves the following statements:
• Flow disturbances originate in the area close to the wall.
• Pressure losses due to friction and the additional production of turbulence are irre-
versibly transformed to thermal and sound energy.
• Thus these parts of the energy balance are not available as useful output (drive of the
turbine) any more.
• An additional reduction of the cross-sectional area due to deposits leads to an increase
SH-08-0201-B1-V1.01 INFLUENCE OF TURBOCHARGER FOULING ON FUEL CONSUMPTION
MET Motoren- und Energietechnik GmbH Rostock
23
in the flow speed in these areas. The losses to be overcome thereby increase as well.
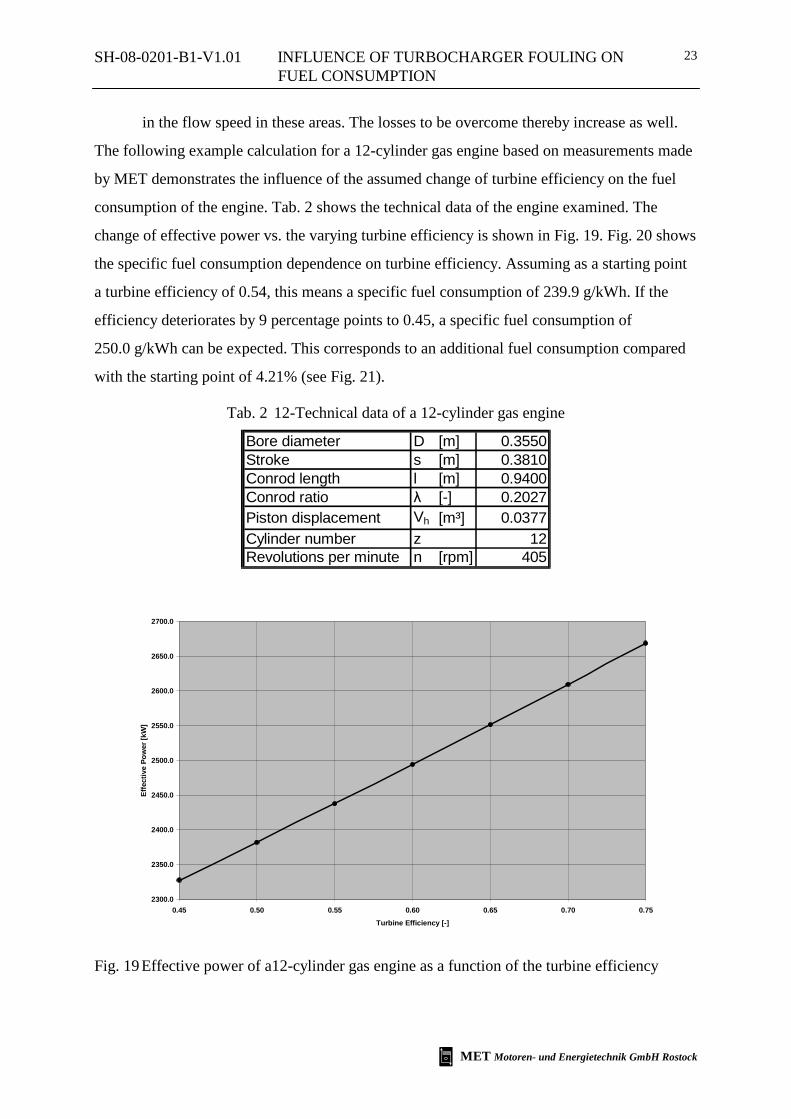
The following example calculation for a 12-cylinder gas engine based on measurements made
by MET demonstrates the influence of the assumed change of turbine efficiency on the fuel
consumption of the engine. Tab. 2 shows the technical data of the engine examined. The
change of effective power vs. the varying turbine efficiency is shown in Fig. 19. Fig. 20 shows
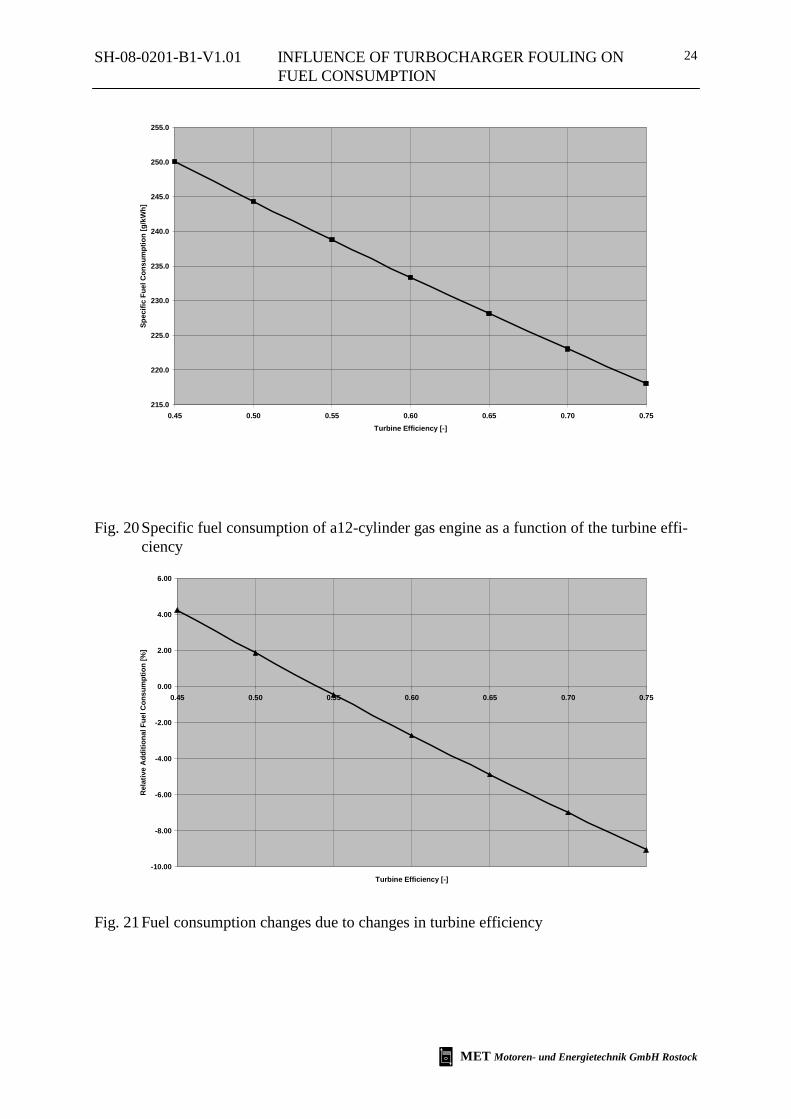
the specific fuel consumption dependence on turbine efficiency. Assuming as a starting point
a turbine efficiency of 0.54, this means a specific fuel consumption of 239.9 g/kWh. If the
efficiency deteriorates by 9 percentage points to 0.45, a specific fuel consumption of
250.0 g/kWh can be expected. This corresponds to an additional fuel consumption compared
with the starting point of 4.21% (see Fig. 21).
Tab. 2 12-Technical data of a 12-cylinder gas engine
Bore diameter D [m] 0.3550Stroke s [m] 0.3810Conrod length l [m] 0.9400Conrod ratio λ [-] 0.2027Piston displacement Vh [m³] 0.0377Cylinder number z 12Revolutions per minute n [rpm] 405
2300.0
2350.0
2400.0
2450.0
2500.0
2550.0
2600.0
2650.0
2700.0
0.45 0.50 0.55 0.60 0.65 0.70 0.75
Turbine Efficiency [-]
Effe
ctiv
e Po
wer
[kW
]
Fig. 19 Effective power of a12-cylinder gas engine as a function of the turbine efficiency
SH-08-0201-B1-V1.01 INFLUENCE OF TURBOCHARGER FOULING ON FUEL CONSUMPTION
MET Motoren- und Energietechnik GmbH Rostock
24
215.0
220.0
225.0
230.0
235.0
240.0
245.0
250.0
255.0
0.45 0.50 0.55 0.60 0.65 0.70 0.75Turbine Efficiency [-]
Spec
ific
Fuel
Con
sum
ptio
n [g
/kW
h]
Fig. 20 Specific fuel consumption of a12-cylinder gas engine as a function of the turbine effi-ciency
-10.00
-8.00
-6.00
-4.00
-2.00
0.00
2.00
4.00
6.00
0.45 0.50 0.55 0.60 0.65 0.70 0.75
Turbine Efficiency [-]
Rel
ativ
e A
dditi
onal
Fue
l Con
sum
ptio
n [%
]
Fig. 21 Fuel consumption changes due to changes in turbine efficiency
SH-08-0201-B1-V1.01 INFLUENCE OF TURBOCHARGER FOULING ON FUEL CONSUMPTION
MET Motoren- und Energietechnik GmbH Rostock
25
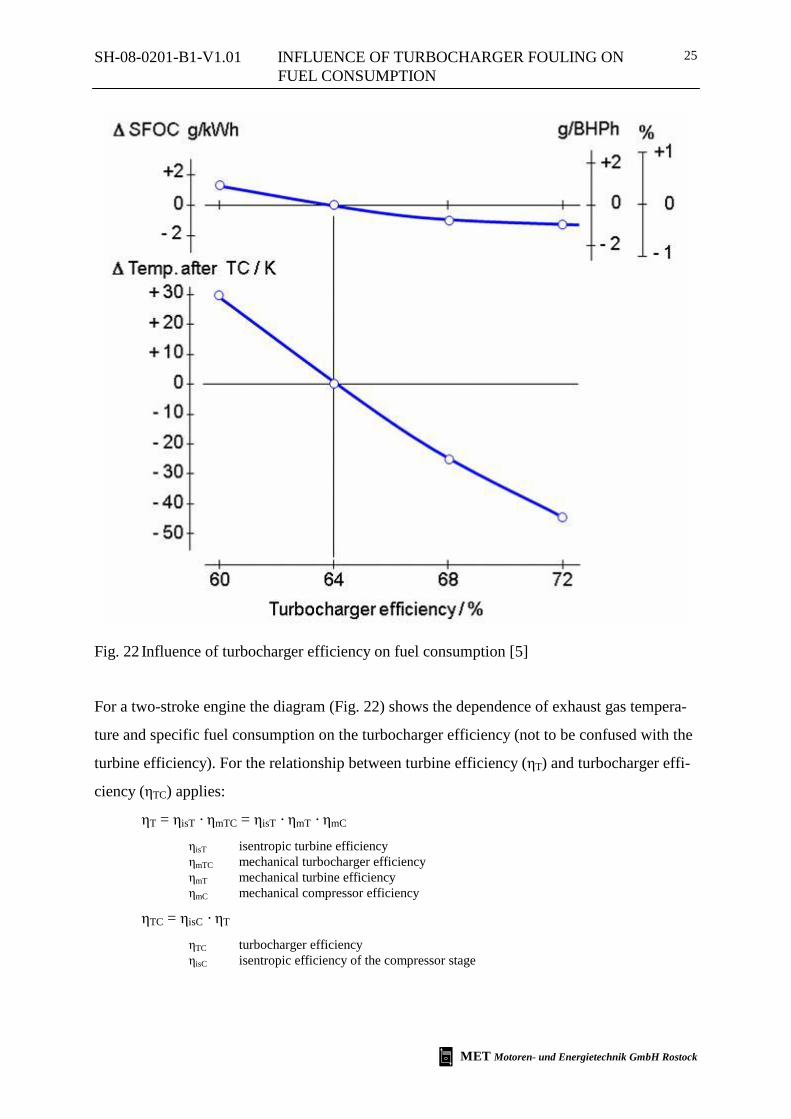
Fig. 22 Influence of turbocharger efficiency on fuel consumption [5]
For a two-stroke engine the diagram (Fig. 22) shows the dependence of exhaust gas tempera-
ture and specific fuel consumption on the turbocharger efficiency (not to be confused with the
turbine efficiency). For the relationship between turbine efficiency (ηT) and turbocharger effi-
ciency (ηTC) applies:
ηT = ηisT · ηmTC = ηisT · ηmT · ηmC ηisT isentropic turbine efficiency ηmTC mechanical turbocharger efficiency ηmT mechanical turbine efficiency ηmC mechanical compressor efficiency
ηTC = ηisC · ηT ηTC turbocharger efficiency ηisC isentropic efficiency of the compressor stage
SH-08-0201-B1-V1.01 INFLUENCE OF TURBOCHARGER FOULING ON FUEL CONSUMPTION
MET Motoren- und Energietechnik GmbH Rostock
26
Starting at the design point (64%) a turbocharger efficiency improvement of 8 percentage
points and a deterioration of 4 percentage points is assumed. It can be stated that with the two-
stroke engine lower turbocharger efficiency leads to an increase in the fuel consumption of the
engine. According to [5] the following approximation is valid in the vicinity of the design
point: 3% change of turbocharger efficiency corresponds to a fuel consumption change of
1 g/kWh and with it a change in the thermal efficiency of the engine of 0.5%. It is notable that
the curve for the specific fuel consumption (SFOC) shows a stronger increase with deteriora-
tion in the turbine efficiency, than the decrease of the curve corresponding to increased turbo-
charger efficiency. This allows the conclusion that a deterioration in turbine efficiency and
with it of turbocharger efficiency leads to a more rapid increase in fuel consumption than the
potential fuel saving resulting from an improvement in turbocharger efficiency.
Taking into consideration the physical relations accordingly an alteration of the efficiency of
the complete exhaust gas turbocharger of about 3% corresponds potentially to a change in
turbine efficiency of about 2.5%. This means that by CFD simulation calculated deterioration
of the turbine efficiency of about 7.6% in a typical turbine (see Tab. 1) entails a potential dete-
rioration of the specific fuel consumption of about 3 g/kWh.
Using as an example a RTA96 engine with mean specific fuel consumption of 172 g/kWh this
signifies an additional fuel consumption of 1.75%.
It should be noted in assessing this statement that as a basis for the calculations only very
small deposits (0.1 mm) were assumed. However, practical observations show that the depos-
its are clearly actually thicker than 0.1 mm (see Fig. 1, Fig. 2).
Real deposits change the geometry of the flow space considerably and high levels of rough-
ness lead to significantly higher losses, which in turn result in additional fuel consumption
clearly higher than calculated in the rough estimation stated above.
SH-08-0201-B1-V1.01 INFLUENCE OF TURBOCHARGER FOULING ON FUEL CONSUMPTION
MET Motoren- und Energietechnik GmbH Rostock
27
REFERENCES
[1] Wang,Z.J., Chi,X.K., Shih,T., Bons,J.: Direct Simulation of Surface Roughness Effects
with RANS and DES Approaches on Viscous Adaptive Grids. AIAA Paper No. 2004-
2420. American Institute of Aeronautics and Astronautics, 2004.
[2] Jensen, J.W, Bons, J.P., Fletcher, T.H, & Squire, S.W.: Simulated Land Based Turbine
Deposits Generated in an Accelerated Deposition Facility. ASME Turbo EXPO 2004 June
14-17, 2004 Vienna, Austria.
[3] Bons, J.P et. al.: Turbine Surface Degradation with Service and Its Effects on Perform-
ance. Final Report. Department of Mechanical Engineering, Brigham Young University,
2005.
[4] James E. Wammack: Evolution of Turbine Blade Deposits in an Accelerated Deposition
Facility: Roughness and Thermal Analysis. Master Thesis. Department of Mechanical En-
gineering, Brigham Young University, 2005.
[5] Bucher, H.: Technische Ausführungen von Turbocompoundsystemen. 7. Aufladetechni-
sche Konferenz. Dresden, 2000,