Embed Size (px)
Citation preview

Influence of Transaction costs on Market Participation
by smallholder poultry farmers in Nigeria:
A mixed methods Study
Essien Akpan Antia-Obong
BAgric. (Hons) Agricultural Economics & Extension, MSc (Econ) Economics & Business
Thesis submitted for the Degree of DOCTOR OF PHILOSOPHY
School of Natural and Environmental Sciences
Faculty of Science, Agriculture & Engineering
Newcastle University, Newcastle upon Tyne, NE1 7RU
United Kingdom
October 2018


i
Declaration
This thesis is my original research work and have not been presented elsewhere for any
award. I confirm that the word length is within the prescribed limit as advised by my
school. There is no collaborative or jointly owned work in this thesis, whether published
or not. Any form of support received for this study and all cited work have been duly
acknowledged.
The following paper has been published from this thesis.
Antia-Obong, E.A., C Hubbard and G Garrod (2016), ‘My lived experience should also
explain my market choice: Mixing methods to examine the influence of transaction cost on
live chicken sales in Nigeria’, A paper presented at the 90th
Annual Conference of the
Agricultural Economics Society (AES), 4-6 April, Warwick University, Coventry.

ii
Abstract
Background: Market participation provides an opportunity for smallholder farmers to
raise their income levels and hence improve their livelihoods. However, their decision to
participate is hindered by individual, socio-economic and transaction costs (institutional)
factors. Investigations into these factors have traditionally applied quantitative analysis
even though transaction costs incorporate both tangible and intangible costs.
Consequently, important motivations and barriers (intangible costs) perceived to influence
smallholder market participation decisions have been left unobserved or unaccounted for.
Setting: This study is set among smallholder poultry farmers in Nigeria. The Nigerian
poultry sub-sector is under an import ban regime aimed at encouraging domestic
participation in poultry markets. However, imposing a ban without a deliberate effort at
instituting policies to ensure that its benefits trickle down to those mostly in need (i.e.
small-scale farmers) is likely to be counter-productive.
Aim: The aim of the study was to investigate the influence of transaction costs on market
participation by smallholder poultry farmers in Nigeria. The objectives of the study were
to first, determine the transaction costs factors influencing probability of participating in
poultry markets, extent of market participation and choice of where to sell live poultry,
and second, to explore perceived influences of transaction costs underlying smallholder
market participation decisions.
Methods: An explanatory sequential mixed methods design comprising an initial
quantitative phase and a subsequent qualitative phase was employed. For the quantitative
phase, primary data from a 2015 smallholder market participation survey was analysed to
test for significant factors influencing smallholder market participation. For the qualitative
phase, a subset of the significant factors were explored using semi-structured interviews
with 20 socio-economically diverse smallholder poultry farmers recruited from
participants involved in the initial quantitative survey.
iii
Findings: First, the quantitative analysis showed that literate female farmers with a large
household and flock size, who have access to veterinary services, alternative sources of
income besides poultry, and who are located further from market centres yet close to
tarred roads are the type of farmers that are more likely to participate in poultry markets.
Second, literate married farmers presumably female with a large flock size, who rely on
the use of motorbike and mobile phone, who are native to an area and mainly rely on other
farmers as the main source of market information and have lower earnings from non-farm
work are the type of farmers that would intensively participate in poultry markets. Third,
the market choice of poultry farmers who are remotely located with large flock sizes, who
attract regular or repeat customers, who anticipate selling at a lower price per live weight
of poultry whilst maintaining a strong bargaining or negotiating position would be through
the farm-gate market channel. The qualitative analysis further revealed more importantly
that being self-employed with a mid-level education also enhanced market participation.
Conclusion: The findings from the study indicate the need for continuous rural
infrastructure development in the areas of roads and telecommunications. Furthermore, in
order to ease access to market information, institutionalised market information services
need to be prioritised. In addition, improved access to veterinary services through
technical support for farmers needs to be strengthened. In addition, land access and title
deeds need to be formalised to enable long-term land use and expansion. More
importantly, rural finance programmes instituted to address the credit needs of farmers
should account for farmers’ educational levels and employment status to further ease
market participation. The findings therefore demonstrate the importance of relying on both
quantitative and qualitative evidence in smallholder market participation research.

iv
Acknowledgements
I am forever grateful to my supervisors (Guy Garrod and Carmen Hubbard) they have
shown me immense support and patience throughout my study. Special thanks go to Prof.
David Harvey whose quick response initiated my PhD application. I am equally grateful to
my examiners, Prof. Wyn Morgan (Sheffield University) and Dr Elizabeth Oughton
(Newcastle University) for offering useful corrections.
I am forever indebted to Prof. Sunday W. Petters, Vice-chancellor of Akwa Ibom State
University (AKSU) at the time of my PhD application who graciously approved and
facilitated my scholarship awards through the Tertiary Education Trust Fund (TETfund) as
well as Prof U.J Ibok (Director of Academic Planning, AKSU) who strongly supported my
PhD application.
Special thanks goes to my parents, Prof. and Mrs Obot Essien Antia-Obong and my
parents in-law, Prof. and Dr (Mrs) Efiong Etuk for their constant encouragement and
support throughout my study. I appreciate my siblings and in-laws for constantly checking
on me, while not forgetting the friends and colleagues I have made along the way in the
course of my study.
Special gratitude goes to my darling wife, Seno and children (Louisa and Amami). Seno
has kept faith with me and took up the fatherly role in my absence.
Above all, I give thanks to God Almighty the giver of life and health for giving me sound
health throughout my study. May your name alone be praised. Amen.
Essien Akpan Antia-Obong


v
Acronyms
IFC International Finance Corporation
ICT Information and Communication Technology
M-PESA (swahili) Mobile Money
TCE Transaction costs Economics
DOCs Day Old Chicks
PSU Primary Sampling Unit
IMF international Monetary Fund
SDGs Sustainable Development Goals
WTO World Trade Organisation
CET Common External Tariff
SAP Structural Adjustment Programme
DHM Double Hurdle Model
TSM Two Stage Model
DRC Democratic Republic of Congo

vi
Table of Contents
Declaration .......................................................................................................................................... i
Abstract ..............................................................................................................................................ii
Acknowledgements ........................................................................................................................... iv
Acronyms ........................................................................................................................................... v
List of Tables ................................................................................................................................. xiii
List of Figures ................................................................................................................................. xiv
Chapter 1. Introduction ...................................................................................................................... 1
1.0 Introduction .................................................................................................................................. 1
1.1 Rationale ...................................................................................................................................... 1
1.1.1 Transaction Costs Economics ........................................................................................ 6
1.1.2 Transaction costs in perspective .................................................................................... 8
1.2 An overview of Nigeria’s agricultural sector and poultry sub-sector .......................................... 9
1.2.1 Constraints to agricultural growth and development in Nigeria ................................. 12
1.2.2 Current measures to transform the agricultural sector ............................................... 13
1.3 Nigeria’s poultry sub-sector ....................................................................................................... 15
1.3.1 Historical development ................................................................................................ 15
1.3.1.1 Pre-SAP: 1960-1982 ............................................................................................ 15
1.3.1.2 SAP ERA 1983-1998 ............................................................................................... 17
1.3.1.3 Post- SAP Era - 1999 onwards ............................................................................... 17
1.4 Structure of the Nigerian poultry sector ..................................................................................... 21
1.4.1 Poultry production systems in Nigeria ......................................................................... 21
1.4.2 Commercial poultry in Nigeria .................................................................................... 22
1.4.3 Structure of the smallholder live poultry market in Nigeria ........................................ 25
1.4.4 The Live Poultry Market .............................................................................................. 25
1.4.5 Role of gender in transaction costs analysis ................................................................ 26
1.4.6 Spatial attributes in transaction costs analysis ............................................................ 28
1.5 Research Aim and Objectives .................................................................................................... 29
1.6 Thesis structure .......................................................................................................................... 30
Chapter 2. Systematic Review ......................................................................................................... 31
2.0 Systematic Review of the Smallholder Market Participation Literature .................................... 31
2.1 Introduction ................................................................................................................................ 31
2.1.1 Objectives of the Systematic Review ............................................................................ 32
2.1.2 Methodology ................................................................................................................ 32
2.2 The review protocol ................................................................................................................... 32
2.2.1 The search strategy ...................................................................................................... 32

vii
2.2.1.1 Scoping exercise ..................................................................................................... 32
2.2.1.2 Literature searches ................................................................................................. 33
2.2.2 The study selection process .......................................................................................... 34
2.2.2.2 Study selection criteria ........................................................................................... 34
2.2.2.3 The study inclusion and exclusion criteria ............................................................. 35
2.2.2.4 Data Extraction....................................................................................................... 37
2.2.3 Study selection ............................................................................................................. 37
2.2.3.1 Studies included in the review ................................................................................ 39
2.2.3.2 Studies excluded from the review ............................................................................ 39
2.2.3.3 Critical appraisal of quantitative studies ............................................................... 39
2.2.3.4 Quality assessment ............................................................................................... 40
2.3 Overview of studies included in the review ............................................................................... 40
2.3.1 Study characteristics .................................................................................................... 40
2.3.2 Quality assessment of studies included in the review ................................................. 54
2.3.2.1 Results of the critical appraisal .............................................................................. 54
2.4 Findings from smallholder choice of marketing channels ......................................................... 56
2.4.1 Socio-economic factors influencing choice of marketing channel .............................. 58
2.4.2 Transaction costs factors influencing on choice of marketing channel ...................... 60
2.4.2.1 Information and search cost factors ....................................................................... 60
2.4.2.2 Negotiations and bargaining costs ......................................................................... 61
2.4.2.3 Monitoring and enforcement costs ......................................................................... 62
2.5 Findings from probability and extent of smallholder market participation decisions ............... 63
2.5.1 Socio-economics factors influencing probability of market participation ................... 66
2.5.2 Transaction costs factors influencing probability of market participation ................. 68
2.6 Findings from extent of smallholder market participation ........................................................ 69
2.6.1 Socio-economic factors influencing extent of market participation ............................ 69
2.6.2 Transaction costs factors influencing the extent of market participation .................... 71
2.7 Discussion .................................................................................................................................. 73
2.7.1 Principal findings and research gaps .......................................................................... 73
2.7.2 Review Conclusion ....................................................................................................... 76
Chapter 3. Research Methodologies ................................................................................................ 82
3.0 Research Methodologies ............................................................................................................ 82
3.1 Introduction................................................................................................................................ 82
3.2 Research aim and objectives ...................................................................................................... 82
3.3 Rationale for mixed methods research ....................................................................................... 83
3.4 Explanatory sequential mixed methods design .......................................................................... 84
3.5 Quantitative phase ..................................................................................................................... 88
viii
3.5.1 Quantitative design ...................................................................................................... 88
3.5.2 Smallholder Market Participation survey .................................................................... 88
3.5.3 The Study Area ........................................................................................................................ 90
3.5.4 Sampling techniques ............................................................................................................... 96
3.5.5 Data collection methods ....................................................................................................... 101
3.5.6 Model Specification .............................................................................................................. 104
3.5.6.1 Measurement ......................................................................................................... 104
3.5.6.2 Variables ............................................................................................................... 108
3.6 Qualitative phase ...................................................................................................................... 112
3.6.1 Methods ................................................................................................................................. 112
3.6.1.1 Setting ................................................................................................................ 112
3.6.2 Sampling methods ................................................................................................................ 113
3.6.3 Data collection ........................................................................................................... 115
3.6.3.1 Interview process .................................................................................................. 115
3.6.3.2 Ethical considerations ........................................................................................... 116
3.6.3.3 Language, safety and cultural considerations ...................................................... 118
3.6.3.4 Pilot interviews ..................................................................................................... 120
3.7 Chapter summary ..................................................................................................................... 121
Chapter 4. Results .......................................................................................................................... 122
4.0 Results: How transaction costs factors influence smallholder market participation decisions
....................................................................................................................................................... 122
4.1 Introduction .............................................................................................................................. 122
4.2 Sample characteristics .............................................................................................................. 123
4.3 Smallholders decisions to participate in poultry markets and the extent of their participation
....................................................................................................................................................... 127
4.3.1 Individual characteristics .......................................................................................... 127
4.3.2 Household socio-economic characteristics ................................................................ 130
4.3.3 Transaction Costs characteristics .............................................................................. 131
4.3.3.1 Probability of market participation ...................................................................... 132
4.3.3.2 Extent of Market participation .............................................................................. 134
4.4 Influence of transaction costs on choice of selling through the farm-gate ............................... 136
4.5 Reflections on Model limitations ............................................................................................. 140
4.6 Chapter summary ..................................................................................................................... 141
Chapter 5. Connecting the Quantitative and Qualitative Phases .................................................... 142
5.0 Connecting the Quantitative and Qualitative Phases ............................................................... 142
5.1 Introduction .............................................................................................................................. 142
5.2 Research Question 1 ................................................................................................................ 143
5.3Research question 2 .................................................................................................................. 144

ix
5.4 Research Question 3 ................................................................................................................ 146
5.5 Developing the qualitative protocol ......................................................................................... 147
5.6 Analysis of Interview data ...................................................................................................... 147
5.6.1 Familiarisation ......................................................................................................... 148
5.6.2 Identifying a thematic framework ............................................................................. 149
5.6.3 Indexing .................................................................................................................... 149
5.6.4 Charting .................................................................................................................... 150
5.6.5 Mapping and Interpretation ...................................................................................... 150
5.7 Methodological quality ............................................................................................................ 151
5.8 Chapter Summary .................................................................................................................... 154
Chapter 6. Qualitative Interview analysis ...................................................................................... 158
6.0 Phase II: Qualitative Interview analysis .................................................................................. 158
6.1 Introduction.............................................................................................................................. 158
6.2 Findings ................................................................................................................................... 158
6.2.1 Probability of participating in poultry markets ........................................................ 159
6.2.1.1 Ease of access to veterinary services .................................................................... 159
6.2.1.2 Ease of accessing financial services ..................................................................... 161
6.2.1.3 Importance of cash flow ........................................................................................ 162
6.2.1.4 Selling in bulk ....................................................................................................... 164
6.2.1.5 Proximity to market .............................................................................................. 165
6.2.1.6 Availability of infrastructure ................................................................................ 165
6.2.2 Extent of participation in poultry markets by smallholder farmers .......................... 167
6.2.2.1 Time allocation to on-farm work .......................................................................... 167
6.2.2.2 Availability of a means of transport...................................................................... 168
6.2.2.3 Importance of social contacts and interaction ...................................................... 169
6.2.2.4 Access to means of communication....................................................................... 172
6.2.2.5 Importance of social capital ................................................................................. 173
6.2.2.6 Professional exposure ........................................................................................... 176
6.2.2.7 The importance of literacy .................................................................................... 177
6.2.3 Smallholder farmers‟ decisions to sell at the farm-gate ........................................... 180
6.2.3.1 Convenience of selling at the farm-gate ............................................................... 180
6.2.3.2 Negotiating from a position of strength ................................................................ 181
6.3 Chapter summary ..................................................................................................................... 184
Chapter 7. Discussion .................................................................................................................... 185
7.0 Discussion ................................................................................................................................ 185
7.1 Principal findings ..................................................................................................................... 185
7.1.1 Decision to participate in poultry markets: Probit model ..................................... 185

x
7.1.2 Extent of smallholder participation in poultry markets: Truncated model ................ 188
7.1.3 Decision to sell at the farm-gate: Tobit model ........................................................... 191
7.2 Summary of Principal Findings ............................................................................................... 193
7.2.1 Probability of market participation .......................................................................... 193
7.2.2 Extent of market participation .................................................................................. 193
7.2.3 Choice of where to sell .............................................................................................. 194
7.3 Influence of transaction costs on market participation ............................................................ 195
Chapter 8. Contributions and Conclusions .................................................................................... 197
8.0 Contributions, limitations, future research and conclusions .................................................... 197
8.1 Methodological contribution to the smallholder market participation literature .................... 198
8.2 Strengths and Limitations of the Mixed Methods Study ......................................................... 199
8.2.1 Quantitative Phase ..................................................................................................... 199
8.2.2 Qualitative Phase ....................................................................................................... 200
8.2.3 Mixed methods design ................................................................................................ 201
8.3 Recommendations .................................................................................................................... 202
8.3.1 Future Research ......................................................................................................... 202
8.3.2 The future of smallholder poultry farmers in Nigeria ................................................ 203
8.3.3 Policy and Practice .................................................................................................... 205
8.4 Conclusion ............................................................................................................................... 207
References ...................................................................................................................................... 208
Appendix A: Quantitative phase methods ..................................................................................... 229
A.1 Survey questionnaire one .................................................................................................... 229
A.2 Survey questionnaire two ............................................................................................... 239
A. 3 Probit results .................................................................................................................. 244
A.4 Marginal effects of probit results ........................................................................................ 245
A.5 Truncated normal regression results ................................................................................... 246
A.6 Marginal effects of truncated normal regression ........................................................... 247
A.7 Tobit model results ........................................................................................................ 248
A.8 Marginal effect of Tobit model results .......................................................................... 249
A.9 Pair-wise spearman’s rho correlation coefficient for predictor variables ...................... 250
Appendix B: Qualitative phase ...................................................................................................... 251
B.1 Introduction for a qualitative Follow-up Interview ........................................................ 251
B.2 Informed Consent Form for qualitative Follow-up Interview ........................................ 252
B3. Qualitative questions ...................................................................................................... 254
B.4 Final thematic framework .............................................................................................. 258
B.5 Extract from thematic chart for probability of participation and extent of participation
259

xi
Appendix C: Systematic review methods ...................................................................................... 263
C.1 Bibliographic databases ................................................................................................. 263
C.2 Grey Literature databases .............................................................................................. 263
C.3 Search strategy for AgEcon search ................................................................................... 264
C.4 Search strategy for JSTOR ................................................................................................ 265
C.5 Search strategy for ideas.repec search............................................................................... 266
C.6 Search strategy for ProQuest database .............................................................................. 267
C.7 Search strategy for Science direct ..................................................................................... 268
C.8 Search strategy for Google scholar ................................................................................... 269
C.9 Search strategy for directory of open access journal (DOAJ) ........................................... 270
C.10 Critical appraisal checklist of studies included in the review .................................... 271
C.11 Critical Appraisal supporting notes for the studies reviewed ....................................... 272
C.12 Quality Assessment results of studies included in the review ....................................... 274

xii
xiii
List of Tables
Table 1: Agricultural transformation agenda's key plans (ATA) ........................................ 14
Table 2: Poultry transformation agenda overview: key programmes and project .............. 20
Table 3: Overview of the Nigerian poultry sector .............................................................. 24
Table 4: Key concepts and popular key search terms ......................................................... 33
Table 5: Sequence of questions considered for either inclusion or exclusion in the review
............................................................................................................................................. 35
Table 6: Study characteristics included in the review ......................................................... 44
Table 7: Quality assessment results of studies included in the review ............................... 55
Table 8: Characteristics of studies on smallholder choice of marketing channel ............... 57
Table 9: Socio-economic factors influencing the choice of marketing channel ................. 58
Table 10: Information and search cost factors influencing choice of marketing channel .. 61
Table 11: Negotiation and bargaining cost factors influencing choice of marketing channel
............................................................................................................................................. 62
Table 12: Monitoring and enforcement cost factors influencing choice of marketing
channel ................................................................................................................................ 63
Table 13: Characteristics of studies on probability and extent of smallholder market
participation decisions ......................................................................................................... 64
Table 14: Socio-economic factors influencing probability of market participation ........... 67
Table 15: Transaction cost factors influencing probability of market participation ........... 68
Table 16: Socio-economic factors influencing extent of market participation ................... 70
Table 17: Transaction cost factors influencing extent of market participation ................... 71
Table 18: List of studies included in the review ................................................................. 78
Table 19: Villages included in the qualitative phase ........................................................ 112
Table 20: Characteristics of participants included in the qualitative phase ...................... 114
Table 21: Sample characteristics from the survey ............................................................ 124
Table 22: Cragg's double hurdle model ............................................................................ 128
Table 23: Two-limit Tobit model ...................................................................................... 136
Table 24: Summary of findings selected for further qualitative analysis ......................... 154

xiv
List of Figures
Figure 1: Map of Nigeria .................................................................................................... 10
Figure 2: Population of Nigeria up to 2050 ........................................................................ 10
Figure 3: Economically active population in Nigerian Agriculture.................................... 11
Figure 4: Poultry sector trends in Nigeria ........................................................................... 16
Figure 5: Rural/Urban Population in Nigeria up to 2050 ................................................... 18
Figure 6: Poultry marketing chain ...................................................................................... 22
Figure 7: Flow chart of studies included in the selection process ...................................... 38
Figure 8: Diagram of exploratory sequential design employed for this study .................... 87
Figure 9: Map of Nigeria showing Akwa Ibom State ......................................................... 91
Figure 10: Map of Uyo ....................................................................................................... 93
Figure 11: Map of Abak ...................................................................................................... 94
Figure 12: Map of Etim Ekpo ............................................................................................. 95
Figure 13: The Multi-stage cluster sampling approach applied in the study ...................... 99
Figure 14: The multi-stage cluster sampling strategy applied in the fieldwork ............... 100
Figure 15: A Predictive model of the probability of smallholder poultry market
participation ...................................................................................................................... 143
Figure 16: A predictive model of extent of smallholder participation in poultry markets 145
Figure 17: A predictive model of factors influencing farmer's preference for farm-gate
sales ................................................................................................................................... 146
Figure 18: Visual model of themes perceived to influence the probability of market
participation ...................................................................................................................... 166
Figure 19: Visual model of themes perceived to influence extent of market participation
........................................................................................................................................... 179
Figure 20: Visual model of themes perceived to influence the decision to sell at the farm-
gate .................................................................................................................................... 183

1
Chapter 1. Introduction
“Development Economics will certainly die if they (Ph.D.) students come to think, rightly
or wrongly that work on economic institutions will not count for distinction in Ph.D.
exams” Lewis (1984) p.8
1.0 Introduction
1.1 Rationale
This study focuses on transaction costs factors that influence market participation
decisions of smallholder poultry farmers. Market participation is defined as the decision to
exchange live poultry for money irrespective of the location of sale. The study is interested
on the probability and extent of market participation, which are defined as follows:
Probability of participation refers to the likelihood of selling live poultry irrespective of
location or quantity sold and extent of participation considers the quantities of live poultry
sold for the period covered by the study.
In this study, smallholders are defined as households with a flock size of 100 birds or less
at any given production cycle and these households need not only be engaged in selling
poultry, but could be involved in other farm and non-farm enterprises.
In this study, poultry refers to live chickens (exotic species) reared for meat (broilers).
Transaction costs are the costs associated with institutions that enable the exchange of
poultry for money, broadly reflected in the costs incurred searching for buyers; negotiating
price and quantity; agreeing where and when the exchange will occur and generally
coordinating the exchange of poultry before, during and after a transaction is undertaken.
In essence, transaction costs are the costs incurred from participating in the poultry market
and are influenced by the institutions that oversee the process of market exchanges.
Poultry meat consumption on the African continent is on the rise. According to The
Poultry Site (2013), this rise is greatly influenced by population growth and Nigeria being
the most populated country in Africa is at the fore front of driving this increased

2
consumption. The importance of poultry meat also lies in its high nutritional value and
general acceptability, particularly across religious lines (Farrell, 2013).
Recognizing the market opportunities in the Nigerian poultry sub-sector, the Nigerian
government imposed an import ban on poultry meat in 2002 to encourage participation in
domestic poultry markets. Prior to the ban, cheap imports from abroad made it difficult for
domestic producers, particularly smallholder farmers, to compete.
A healthy poultry sector raises employment opportunities in rural areas through associated
activities including processing, storage and transportation and generates valuable income
for smallholder farmers (Tarekegan and Yosefe, 2017). This suggests that any policy
measure encouraging domestic poultry production cannot overlook smallholder farmers.
These farmers are responsible for roughly 70% of the available poultry stock but account
for just over 11% of sales (Alabi and Aruna, 2005; Adene and Oguntade, 2006; Heise et
al., 2015). This suggests that imposing an import ban without the corresponding
institutional measures to support domestic production risks missing opportunities to boost
participation. Previous research has suggested that a farmer’s ability to take advantage of
current market opportunities is dependent on a combination of institutional and household
factors (Achandi and Mujawamariya, 2016). For example, in terms of household factors,
the more dependents in a household the higher the consumption levels, often resulting in a
lower marketable surplus (Jagwe et al., 2010).
Institutional factors include a range of transaction costs that bother on the ease or
difficulties that arise as a result of the institutional arrangements encountered in the
process of monitoring, negotiating and gathering information on a transaction (Hubbard,
1997). Furthermore, (Matthews, 1986, p. 906) suggest that:
“transaction costs consist of the cost of arranging a contract ex ante and monitoring and
enforcing it ex post, as opposed to production costs, which are the costs of executing a
contract”
Accordingly, transaction costs economics (TCE) is based on the proposition that costs are
incurred when undertaking market exchanges (Hobbs, 1997; Hubbard, 1997). However,
compared to physical production costs that are tangible and easy to measure, transaction
costs are not easily identifiable and are therefore not easily separable from other
managerial costs (Bruyn et al., 2001).
3
According to Delgado (1999) transaction costs are an important issue in the marketplace
because the true costs of goods and services are not captured in market prices which
makes market participation difficult for smallholder farmers. These important insights
were first expressed in the works of Coase (1937) and Williamson (1986) who noted that
market agents are transaction costs minimisers, in the sense that they carry out transactions
in a manner aimed at reducing their costs of participation in any given market.
This point is also expressed by Osebeyo and Aye (2014) who argue that when the costs of
transacting in a market channel are higher than the value derived from the transaction,
farmers are less likely to trade. It can therefore be deduced that high levels of transaction
costs may contribute to the relatively low volume of sales contributed by smallholder
poultry farmers. This reflects the experiences of a large number of smallholder1
households in sub-Saharan Africa who continue to engage in subsistence and semi-
subsistence agriculture due to the difficulties involved in participating in markets
(Shiferaw and Muricho, 2009). The reasons for this are mostly structural, ranging from
poor infrastructure (Poulton et al., 2005; Hazell et al., 2007) to weak institutions (Poulton
and Lyne, 2009) which are often associated with high transaction costs because they fail to
promote mutually beneficial transactions due to constraints related to information,
exclusion and unavailability of public goods (Shiferaw and Muricho, 2009).
Many of the poorest people in the world are smallholder farmers who depend on
agriculture for their livelihoods (Alabi and Aruna, 2005). According to Wamalwa (2015),
smallholder farmers in sub-Saharan Africa with land holdings of two acres or less produce
about 70% of the entire food consumed in the region it is therefore confounding that these
group of farmers are often the ones with the least. Despite their importance as food
producers many smallholder farmers face barriers to market entry Overcoming these
barriers requires a comprehensive understanding of the factors that influence farmers’
decisions to sell their surpluses in the market, the amount they sell and where they choose
to sell.
This study focuses on the barriers to effective market participation by smallholder farmers,
looking specifically at the factors that influence access to poultry2 markets in a Nigerian
1 Smallholder, households and farmers are used interchangeably
2 For this study poultry refers to chicken reared for primarily for meat.

4
state. Participation in markets can go a long way to improving livelihood outcomes,
making it important to place smallholders at the forefront of development goals.
According to Makhura (2001) and Pingali et al. (2005) one way of encouraging
smallholders to participate in markets is to reduce the transactions costs they face.
TCE is an aspect of the New institutional Economics literature (Hubbard, 1997; Kherallah
and Kirsten, 2002) and acknowledges that market transactions are not without friction (e.g.
uncertainties surrounding delays in delivery or supplies of goods and services; bargaining;
and establishing trust) and this adds to the costs of undertaking transactions. Scholars have
defined transaction costs in various ways. According to Coase (1937) transaction costs are
the costs associated with accessing information and coordinating, negotiating, monitoring
and enforcing contract terms with a trade or trading partners. Information costs involve
searching for trading partners and occur before the actual transaction takes place,
coordination costs arise when scrutinizing the transaction process, negotiation costs
concern the modalities of carrying out the physical transaction and monitoring costs
ensures that transaction terms are followed through.
Definitions of transaction costs in the literature (Holloway et al., 2000; Key et al., 2000;
Makhura, 2001; Jagwe et al., 2010; Ouma et al., 2010) tend to classify transaction costs
into observable and non-observable costs, or tangible and intangible costs (Jagwe and
Machethe, 2011; Shiimi et al., 2012). Observable costs are mostly the measurable
(quantitative) costs associated with market exchange such as access to information sources
e.g. radio/ television/internet, or access to a means of transport, e.g. car, bicycle or
motorbike. On the other hand, non-observable costs tend to be subjective and are not
directly measurable: for instance, how farmers perceive potential trade partners may be a
factor that could influence their decision to participate in certain markets or not but since
this is based on perceptions is it difficult to quantify. Also, empirical analysis of
transaction costs have generally relied on proxy variables (Dougherty, 2012) which
although empirically useful may not directly capture the transaction costs variable of
interest, thus further demonstrating that transaction costs are difficult to measure.
Furthermore, various authors (Hobbs, 1997; Kirsten et al., 2009; Jagwe et al., 2010;
Royer, 2011) note that transaction costs occur subtly in the process of carrying out market
exchanges and are therefore difficult to measure directly.

5
Drawing on the perceptions of farmers may be one way of accounting for non-observable
transaction costs. To fully understand the impact of transaction costs will require the
application of both quantitative and qualitative methods, as quantitative findings alone will
not provide in-depth contextual explanations of the barriers to market access faced by
smallholder farmers. On the other hand, because qualitative research findings are often
difficult to generalise across a population, they too cannot provide rigorous explanations
of factors restricting market access for smallholder farmers. However, using a mixed
methods approach combining both quantitative and qualitative research methods can draw
on the strengths of both approaches and offer a more comprehensive solution to the
research question. In this study, an explanatory sequential mixed method design was
applied to address the issue of smallholder farmers’ participation in poultry markets and in
particular the role played by transaction costs in this. To the knowledge of the researcher,
this method of investigation has not previously been attempted in the smallholder market
participation literature.
Therefore, for this study a mixed methods design is employed. Mixed methods research
involves integrating quantitative and qualitative data within a single investigation, the
rationale being that the two methods complement each other and provide a better
understanding of the phenomena under study (Eaves and Walton, 2013). Surprisingly,
mixed methods does not seem to have been used in the context of smallholder market
selection research. The use of mixed methods in this study is therefore original and an
attempt to provide a clearer picture of the transaction costs factors influencing smallholder
market participation in Nigeria. It should be noted that many quantitative studies use the
term ‘qualitative data’ when discussing categorical variables, such as those derived from
Likert-scale questions; however, in this study ‘qualitative data’ refers to the experiences
and opinions of farmers, elicited to provide a better understanding of the motives and
barriers that influence market participation decisions. More importantly, although this
study focuses on transaction costs, it does not negate the importance of other studies
(Alabi and Isah, 2002; Ojo, 2003; Alabi and Aruna, 2005; Yusuf and Malomo, 2007;
Kperegbeyi et al., 2009) where production costs have been found to influence poultry
sales.

6
1.1.1 Transaction Costs Economics
The ease of doing business lies at the heart of transaction costs economics (TCE) and
seeks to address the ease with which economic agents interact or exchange goods and
services (den Butter, 2012). The ease of doing business in the poultry sector in Nigeria is
central to this study which seeks to identify factors that make it easier for smallholder
farmers to participate in poultry markets. Nigeria is ranked 169th
out of 190 countries in
the World Bank Ease of Doing Business Rankings (World Bank, 2017), just 15 and 17
points above Democratic Republic of Congo and South Sudan respectively, two countries
that suffer from internal conflicts and unrest. This gives an indication of the difficulties of
doing business in Nigeria.
For this study, barriers to farmers’ participation in poultry markets in participation were in
terms of the associated levels of transaction costs). In other words, the likelihood of
farmers participating in poultry markets is influenced by the problems encountered in
starting and operating a poultry business. Likewise, the extent of participation is
influenced by how easy or difficult it is to sell poultry. Similarly, the choice of where to
sell is influenced by the ease or difficulty of getting poultry to market.
Nobody wants to operate in a difficult business environment and the adverse impacts of
operating in such conditions are likely to be felt more by the less well-off individuals such
as smallholder farmers (Stoop and Hart, 2005). In order to encourage economic growth, it
can be argued that such individuals would benefit from the introduction of institutional
measures that would facilitate their ease of doing business.
The importance of institutions is emphasized by (North, 1992a, p. 5)
“Institutions are the rules of the game in a society … they are the humanly devised
constraints that shape human interaction … they structure incentives in exchange whether
political, social or economic”
Transaction costs are costs (barriers) associated with the exchange of goods and services:
e.g. barriers to accessing information required to make informed market decisions;
infrastructural barriers associated with accessing roads, bridges, electricity and potable
water supply; barriers to accessing credit and professional services (e.g. veterinary
services); and barriers to communication (e.g. poor mobile phone signals).

7
For example, Oguonu and Ezeibe (2014) and Agbo et al. (2015) identified that the
majority of smallholder farmers in Nigeria were in need of credit but were unable to
access formal credit sources due to a lack of information and collateral. In a review of
smallholder farmer access to agricultural credit in Nigeria, Badiru (2010) identified that
informal credit institutions (e.g. family, friends) are relatively easier to access than formal
or semi-formal credit institutions despite the higher volumes of credit available through
formal routes and suggested that informal credits tend to offer more affordable and
flexible interest rates.
Ease of doing business is also associated with proximity to tarred roads, so selling poultry
is easier in locations with good road access. In the case of poor road access, farmers would
find it difficult to transport live poultry to market or to attract buyers to the farm.
Empirical literature on TCE overwhelmingly supports this finding. For example, a study
conducted in Kenya identified that access to good road infrastructure not only enhanced
market participation but also reduced costs (Kiprono and Matsumoto, 2014).
Ease of doing business was also associated with accessing information from informal
sources. An important tenet of TCE is that access to information is costly, an observation
that was missed by neoclassical economists where accessing information in the process of
market exchanges were taken for granted (Nolan and Trew, 2011).
(North, 1992b, p. 7) notes as follows:
“The fact that information is costly and that individuals possess different amounts of
useful information about what is being exchanged is the starting point in understanding
how individuals can benefit at the expense of others in exchange”
The cost of accessing information might explain why poultry farmers choose informal
information sources in preference to formal information sources. However, while informal
information sources are easier to access, this does not necessarily mean the information
obtained is reliable. The challenge for farmers therefore is to find inexpensive sources of
reliable information.

8
Regular transactions can reduce costs for both buyers and sellers. As (North, 1992b, p. 9)
argues:
“the cost of measuring the valuable attributes of the goods and services or the
performance of agents in exchange is the fundamental key to the costs of transacting”
Repeat sales lower the costs of searching for new buyers, particularly where there is an
urgency to sell as is the case with live poultry. Businesses rely largely on returning
customers (Foscht et al., 2013), particularly small-scale businesses that may not have the
funds for advertising. The value of repeat sales therefore relies on the lower costs involved
in carrying out market exchanges.
Transaction costs are key to this study because institutions matter in market exchanges
(Bardhan, 2005). According to Drzeniek-Hanouz (2015) the prosperity of a country is
directly linked to its institutions which underpin how societies function to create an
enabling environment. Therefore, within the study, the prosperity of smallholder poultry
farmers is directly linked to the institutions that provide the enabling environment for
smallholder households to participate in the market.
1.1.2 Transaction costs in perspective
Transaction costs relates to the actual costs of getting business done (Hubbard, 1997).
However, these costs differ by region, type of business enterprise and even by gender. For
example, Jagwe et al. (2010) suggests that perishable farm produce, such as bananas, face
higher transaction costs than non-perishable goods such as rice or beans, due to the
urgency involved in carrying out market exchanges.
Accordingly, TCE focuses on the costs for ease involved in doing business and more
importantly, the institutions that can influence these costs for ease. The latter is the
particular focus of the so-called New Institutional Economics (Coase, 1937; Williamson,
1979; Matthews, 1986; Nabli and Nugent, 1989; North, 1990; Hubbard, 1997). Therefore,
the empirical analysis of transaction costs aims to identify institutional factors that make
exchanging goods and services easier or more difficult. As noted earlier, institutions can
take the form of informal constraints such as traditions, norms, customs and beliefs.

9
The way in which an institution influences economic agents, even in similar settings, may
vary significantly. Recognising the differences that exist between institutions and their
effects on doing business, the empirical analysis of transaction costs tends to be contextual
which explains why no consensus exists on the nature of transaction costs in empirical
research (Acemoglu, 2004). Nevertheless, in accessing information, monitoring,
enforcement, bargaining and negotiating, some institutional factors are common across
empirical studies. In this study a systematic review of the literature was undertaken in
order to address very specific questions around the factors that influence the costs for
smallholder farmers participating in the poultry market in Nigeria. In particular, the use of
an explanatory sequential mixed methods approach in this study requires an in-depth
understanding of the factors that are associated with making market participation
decisions. Conducting a systematic review is an effective means of ensuring that all of the
most influential factors are included in the analysis (Tashakkori and Teddlie, 2010).
1.2 An overview of Nigeria’s agricultural sector and poultry sub-sector
Nigeria is a country on the West coast of Africa, with a population of 140,431,790 million
(Nigeria census, 2006), although current estimates put the population at 184 million
(Nigeria -National population commision, 2017) Nigeria has a total area of 923,770km2,
with a land area of 910,770km2 and a coastline of 853km (Nigeria High Commission
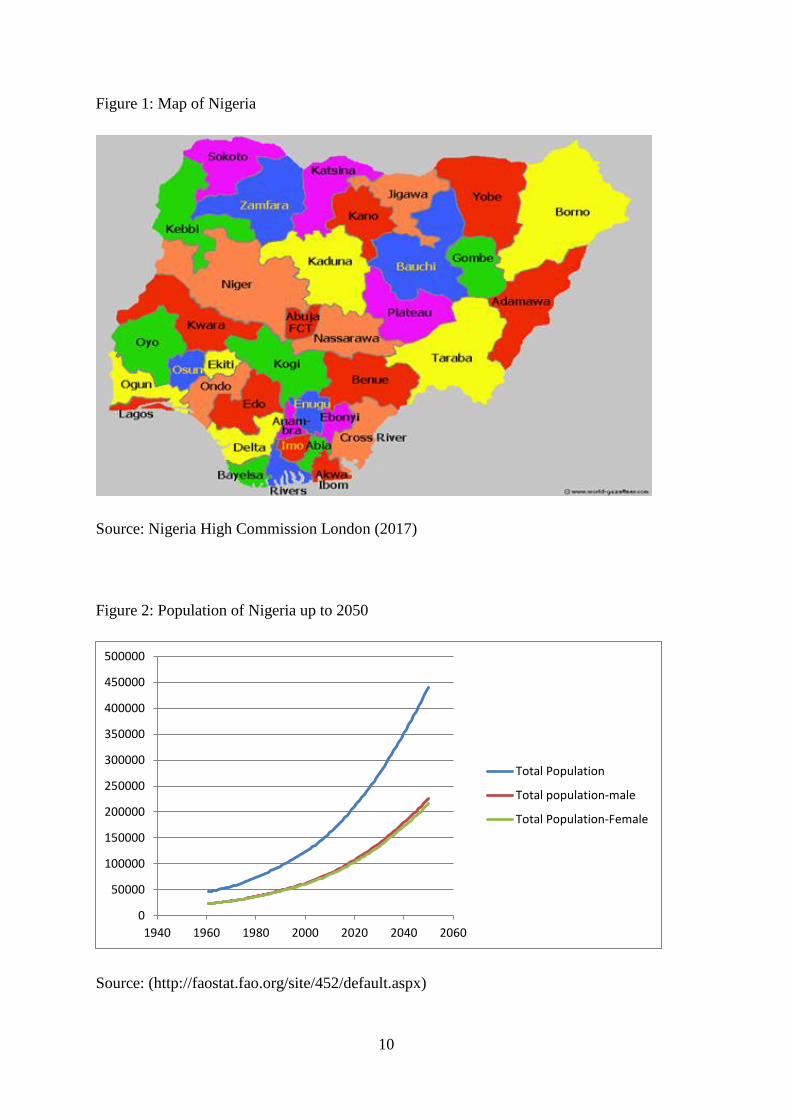
London, 2017). Figure 1 provides a pictorial representation of the 36 states in Nigeria
including Abuja, which is the federal capital territory and seat of the Federal Government.
A look at the FAOSTAT estimates (Figure 2) gives a projection up to 2050 of the
population of Nigeria, which will continue to rise. The implication of this is that Nigeria
needs to bring in policies that will ensure the rapid development of the agricultural sector
in order to reduce the likelihood and extent of extreme hunger and poverty, which is in
line with the first and second UN Sustainable Development Goals (SDGs)
10
Figure 1: Map of Nigeria
Source: Nigeria High Commission London (2017)
Figure 2: Population of Nigeria up to 2050
Source: (http://faostat.fao.org/site/452/default.aspx)
0
50000
100000
150000
200000
250000
300000
350000
400000
450000
500000
1940 1960 1980 2000 2020 2040 2060
Total Population
Total population-male
Total Population-Female

11
Agriculture is an important sector in Nigeria, employing over 60% of the population, with
both male and female farmers economically active in the sector. Figure 3 shows the total
economically active population in agriculture, divided into males and females. The rise in
the economically active population is due to an increase in the number of women
economically active in agriculture and a decrease in economically active males.
Figure 3: Economically active population in Nigerian Agriculture
Source: (http://faostat.fao.org/site/452/default.aspx)
In the early 1960s, agriculture was the mainstay of the Nigerian economy, with the
country being self–sufficient in food production and a net exporter. However, in the early
1980s the sector began to be eclipsed by the increasing importance of crude oil production.
The sudden influx of ‘black gold’ and its impact on the economy, led to a reduction in
large-scale commercial investment in agriculture.
0
2000
4000
6000
8000
10000
12000
14000
19
61
19
64
19
67
19
70
19
73
19
76
19
79
19
82
19
85
19
88
19
91
19
94
19
97
20
00
20
03
20
06
20
09
20
12
20
15
20
18
20
21
20
24
20
27
20
30
20
33
20
36
20
39
20
42
20
45
20
48
Total economically active population in Agriculture (1000)
Male economically active population in Agriculture
Female economically active population in Agriculture

12
Today, Nigeria can no longer produce food in sufficient quantity to meet the needs of a
rapidly growing population. According to Olaoye (2012) Nigeria is ranked 11th
in the
world in terms of area of arable land but ranked in terms of production only 116th
out of
138 nations included in the ranking and this is due largely to its overdependence on crude
oil receipts. As a result, Nigeria has become a net food importer. For example, in 2011
about 20% of sub-Saharan Africa’s total rice imports went to Nigeria, which is now
ranked second among the world’s rice importing nations.
1.2.1 Constraints to agricultural growth and development in Nigeria
In July 2003, the African Union heads of state meeting in Maputo, Mozambique drafted
the so called “Maputo declaration on agriculture and food security in Africa.” African
heads of state were concerned that 30% of Africans were chronically and severely
undernourished, resulting in the continent becoming the largest recipient of food aid in the
world as well as a net importer of food. This led to them making a policy commitment to
allocate at least 10% of their national budgets to agriculture and rural development within
five years. (Assembly of the African union, 2003)
Unfortunately, to date Nigeria has not fulfilled this commitment, e.g. contributing 3% and
1.66% of its budgetary allocation in 2011 and 2012 respectively (Olaoye, 2012) to a sector
that contributes about 40% to Nigerian GDP and employs over 60% of the population.
Access to inputs is also a serious constraint facing the development of agriculture in
Nigeria; for example, access to improved seed varieties is only available to 5% of Nigerian
farmers, while on average Nigeria applies only 13kg of fertilizer per hectare, compared to
the global average of 100kg per hectare or the 400kg per hectare used in China (China
green agriculture inc, 2007). In terms of agricultural credit, only about 1% of bank loans
are to agricultural enterprises, with the result that agricultural growth is slow.
This therefore shows that poor funding is a challenge in Nigerian agriculture, other
challenges facing the sector includes: lack of competitiveness, which increases
inefficiency; inefficient production techniques; low value added; weak institutional and
regulatory environment; poor quality of agricultural produce and environmental issues
(Halkias et al., 2011; Olukunle, 2013; Abutu, 2014; Igbokwuwe et al., 2015; Oladokun et
al., 2015).
13
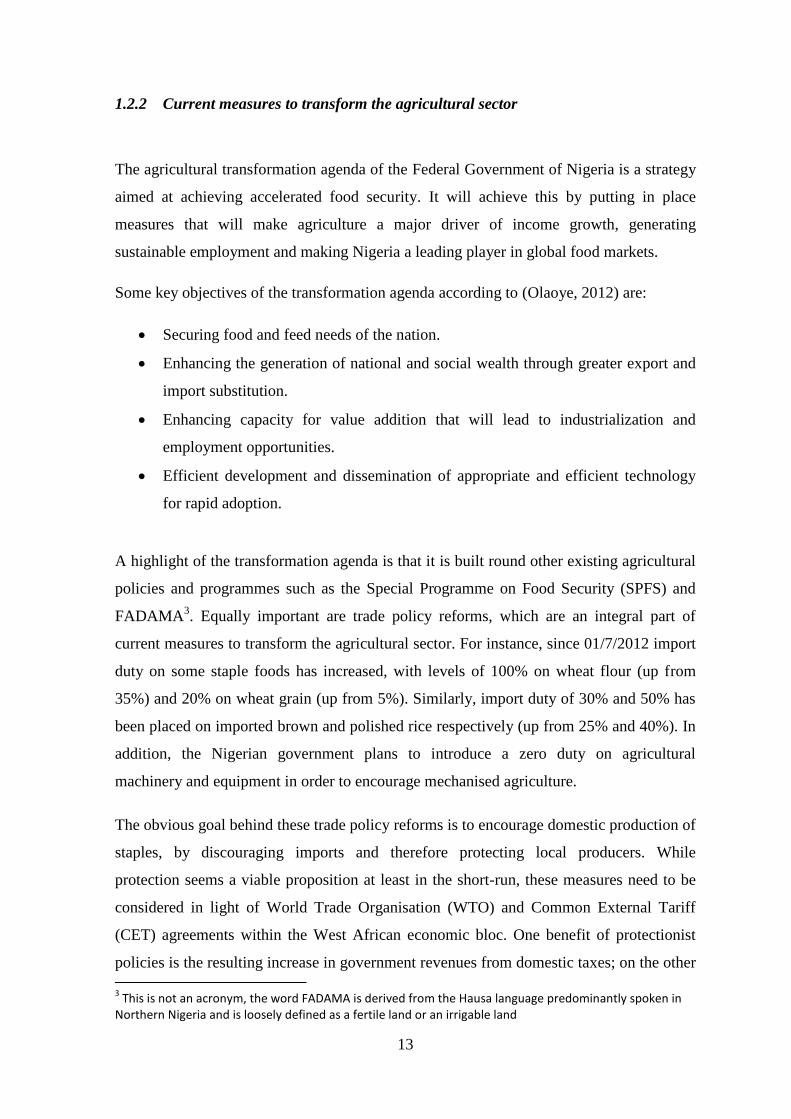
1.2.2 Current measures to transform the agricultural sector
The agricultural transformation agenda of the Federal Government of Nigeria is a strategy
aimed at achieving accelerated food security. It will achieve this by putting in place
measures that will make agriculture a major driver of income growth, generating
sustainable employment and making Nigeria a leading player in global food markets.
Some key objectives of the transformation agenda according to (Olaoye, 2012) are:
Securing food and feed needs of the nation.
Enhancing the generation of national and social wealth through greater export and
import substitution.
Enhancing capacity for value addition that will lead to industrialization and
employment opportunities.
Efficient development and dissemination of appropriate and efficient technology
for rapid adoption.
A highlight of the transformation agenda is that it is built round other existing agricultural
policies and programmes such as the Special Programme on Food Security (SPFS) and
FADAMA3. Equally important are trade policy reforms, which are an integral part of
current measures to transform the agricultural sector. For instance, since 01/7/2012 import
duty on some staple foods has increased, with levels of 100% on wheat flour (up from
35%) and 20% on wheat grain (up from 5%). Similarly, import duty of 30% and 50% has
been placed on imported brown and polished rice respectively (up from 25% and 40%). In
addition, the Nigerian government plans to introduce a zero duty on agricultural
machinery and equipment in order to encourage mechanised agriculture.
The obvious goal behind these trade policy reforms is to encourage domestic production of
staples, by discouraging imports and therefore protecting local producers. While
protection seems a viable proposition at least in the short-run, these measures need to be
considered in light of World Trade Organisation (WTO) and Common External Tariff
(CET) agreements within the West African economic bloc. One benefit of protectionist
policies is the resulting increase in government revenues from domestic taxes; on the other
3 This is not an acronym, the word FADAMA is derived from the Hausa language predominantly spoken in
Northern Nigeria and is loosely defined as a fertile land or an irrigable land

14
hand, the policy runs the risk of increasing smuggling as individuals seek to avoid paying
import duty.
A summary of Nigeria’s agricultural sector transformation agenda is presented in Table 1
below.
Table 1: Agricultural transformation agenda's key plans (ATA)
Source: (FMARD, 2011)

15
1.3 Nigeria’s poultry sub-sector
1.3.1 Historical development
The poultry sub-sector in Nigeria has evolved through various policies over time. In the
early 1960s to late 1970s, a period referred to as the pre-SAP era, a policy of import
prohibition made it possible for the sector to experience increased production and growth.
The early 1980s to late 1990s saw a period of structural adjustment in the economy and
the policy of trade liberalisation opened up the sector to cheap subsidised imports,
bringing the poultry sector to its knees as production plummeted.
Since 2002 the sector has experienced expanding production and consumption that is
mainly attributable to the Government ban on poultry imports. The ban has encouraged
local production from the commercial sector down to the backyard producers.
A brief historical account of the sector from the pre-SAP4, SAP and post-SAP era is
discussed below.
1.3.1.1 Pre-SAP: 1960-1982
The period in the 1960s following independence from Great Britain is referred to as the
pre-SAP era, where the Government was directly involved in the business of agriculture as
opposed to the industry being private-sector led. Policy during this period focused on the
establishment of Government marketing boards where all exportable agricultural products
were purchased from farmers by the government at prices below world prices: this was
also the period of the oil boom that led to rapid economic growth and industrial
expansions in the 1970s. More importantly, the pre-SAP era saw a deliberate attempt to
limit food imports, while incentives were provided to farmers to adopt improved
technologies and increase production (Oyejide, 1986).
According to the Poultry Association of Nigeria (2017) during the pre-SAP era, poultry
numbers grew from a modest population of around 0.7 million in 1963, to about 40
million in 1983 - an increase illustrated in Figure 8 below. During the same period, the
4 Structural Adjustment Programme (SAP)

16
number of poultry farms grew from 350 to about 5000 and the number and capacity of
feed mills increased to meet the growing demand for feed. Figure 4 shows a steady rise in
chicken (meat) and egg production from 1960 to the mid-1980s, after which production
levels fluctuated. Policies that contributed to the drop in poultry production from 1983 to
1998 are discussed below.
Figure 4: Poultry sector trends in Nigeria
Source: http://faostat.fao.org/site/573/default.aspx#ancor
Dark lines in graph are used to separate the pre-SAP (1960-1982), SAP (1983-1998) and
post-SAP (1999 to 2010)
0
100000
200000
300000
400000
500000
600000
700000
1950 1960 1970 1980 1990 2000 2010 2020
year
NIGERIA POULTRY SECTOR TRENDS
laying (1000 head)
Eggs, hen in shell production(tonnes)
Meat indigenous, chickenproduction (tonnes)
Meat, chicken production(tonnes)
Slaughtered chicken meat(1000 Head)

17
1.3.1.2 SAP ERA 1983-1998
As earlier mentioned, the Nigerian economy is heavily dependent on crude oil exports. In
the early 1980s Nigeria was hit by the effects of an oil glut that had begun in 1978. This
resulted from a combination of a global surplus of crude oil production and falling world
demand, and resulted in oil prices dropping significantly. Nigeria’s revenue from oil
dropped so much that the country needed to borrow from international lenders to meet its
domestic obligations.
In order to access the loans, the International Monetary Fund (IMF) and World Bank
required Nigeria to implement structural adjustment programmes in the economy. Chief
amongst the conditions was trade liberalization , with the Government forced to abolish
marketing boards and remove bureaucratic controls to trade, with the consequence that the
number of import prohibited products was reduced significantly (Oyejide, 1986). The
consequence of trade liberalization in the poultry sector was that domestic production
plummeted because local farmers could not compete with cheap poultry imports, often
heavily subsidised from abroad.
Figure 4 shows the drop in both egg and poultry meat production from the early 1980s to
1998. According to the Poultry Association of Nigeria, an umbrella body of industrial
commercial poultry producers, the result of trade liberalization was that between 1983 and
1988 alone, the total installed capacity of feed mills was reduced from 90% to 26%.
Commercial poultry production also fell by about 75% and by 1999 there were less than
1000 poultry farms left and an even fewer number of smallholder farmers .
1.3.1.3 Post- SAP Era - 1999 onwards
The entrenchment of democracy in Nigeria from 1999 gave a new lease of life to the
poultry industry, as the president at the time, Chief Olusegun Obasanjo, reintroduced the
pre-SAP policy of import prohibition to the poultry sector. The growth in this sector can
be attributed to this import ban policy, which turned the fortunes of the sector around.
Further evidence of growth is illustrated by the resuscitation of the Poultry Association of
Nigeria, which had become moribund during the SAP era, but has since been revived to
take advantage of the increasing import ban opportunities the sector offers.

18
As the population grows, alongside increasing urbanisation (see Figure 5), the demand for
poultry is likely to expand as well. It should also be noted that, while the ban has opened
up opportunities to farmers, the poultry sector is still plagued with high production costs,
biosecurity concerns due to poor sanitary controls, and technical and institutional
constraints affecting processing and marketing.
Figure 5: Rural/Urban Population in Nigeria up to 2050
Source: http://faostat.fao.org/site/550/default.aspx#ancor
According to Killebrew et al. (2010) production costs are high due to Nigeria’s lack of an
integrated and automated industrial poultry sector, with farmers lacking reliable access to
inputs, such as chicks and feed, and faced with high costs for veterinary services. In
addition, the poultry market is also limited by global concerns about product safety. In
recognition of these challenges, the Poultry Transformation Plan was introduced in 2011
to help develop the sector. The goal of the poultry transformation agenda is to support the
sustained growth of the poultry industry to achieve expanded capacity and improved
regional competitiveness, with the aim of contributing more to animal protein supply, jobs
and wealth creation.
Table 2 below provides a breakdown of the poultry transformation agenda focusing on
objectives, expected outcomes, driving forces and constraints.

19
It can be observed, therefore, that the growth in the poultry industry is closely tied to the
economic fortunes and policies of the country. Import prohibition policies that ban cheap
poultry imports have increased production, so that the poultry sector in Nigeria now
occupies a prime position as a major source of animal protein for consumption.
Despite increasing production, the poultry sector still faces many challenges. Chief among
these are high production costs and the weak institutional environment in which farmers
operate. This study will therefore seeks to identify institutional factors that influence
farmers’ decisions to participate in poultry markets and by so doing, help to inform future
policies that will ensure that smallholder poultry farmers are less vulnerable to market
changes in the event of the import ban being lifted.

20
Table 2: Poultry transformation agenda overview: key programmes and project
Source: (FMARD, 2011)

21
1.4 Structure of the Nigerian poultry sector
1.4.1 Poultry production systems in Nigeria
Broadly speaking, poultry production in Nigeria can be classified into three groups based
on scale of production and management practice adopted. These are: intensive; semi-
intensive; and extensive systems. The intensive system can be described as commercial-
scale production and the extensive system as backyard poultry production. Semi-intensive
systems are a mix of the other two.
In Nigeria, smallholder poultry farmers can be categorised based on two broad criteria:
number of birds reared; and production system. Sonaiya and Swan (2004) further classify
producers by their production focus:
1. Production for consumption.
2. Home consumption and cultural reasons.
3. Income and home consumption
4. Income.
Pagani et al. (2008) classify poultry farming around scale of production as:
1. Commercial or industrial commercial farms (>10,000 birds);
2. Medium-scale commercial or large commercial farms (2500-10,000 birds);
3a. Small-Scale commercial or small commercial farms (500-2500 birds)
3b. Backyard (up to 1500 birds)
4. Rural (up to 200 birds, occasionally more)
The classification above is based around scale of production, even though management
practices do overlap and location specific environmental conditions influence management
practices. For example, in northern Nigeria, where conditions are drier and temperature
fluctuations are rife, all flocks are more sheltered than in the south of Nigeria. The
implication is that different criteria can be employed to better understand smallholder

22
poultry farmers and the poultry sector in general; and these criteria range from the type of
breed reared, management practices adopted, marketing, aim and nature of production.
1.4.2 Commercial poultry in Nigeria
It is worth noting that the Nigerian commercial poultry industry is primarily made up of
chicken and egg production. The poultry market in Nigeria comprises the traditional
sector, the commercial sector and the industrial sector. While the former rears mostly
indigenous breeds, the commercial sector is largely engaged in producing eggs or selling
day old chicks (DOC) to rural, backyard and small to medium scale farmers (see Figure 6).
The industrial sector consists mainly of large integrated operations, often funded by
foreign investors, and is located largely in South-western Nigeria.
Figure 6: Poultry marketing chain
(Pagani et al., 2008)

23
For commercial poultry production, egg production is the dominant activity. Pagani et al.
(2008) suggests that 70-80% of exotic improved breeds in Nigeria are layers, while
broilers (meat) make up the rest. The poultry meat market is therefore made up of broilers,
spent layers (see Table 3), and the demand for poultry meat increases significantly during
major festive periods (i.e. Christmas, New Year, Easter and Muslim festivals).

24
Table 3: Overview of the Nigerian poultry sector
Breeders Smallholder
Poultry
farmers
Support
services
Commercial
sector
Informal sector
(poultry sellers)
Informal sector
(egg sellers)
Pedigree
pure
lines
Poultry Feed Mills Parent stock Producers Producers
Great
grand
parents
Turkey Feed
transport
Hatchery Producers/retailers Producers/retailers
Grand
parents
Duck Transport
day old
chicks
Rearing Wholesalers/retailers Wholesalers/retailers
Parents Geese Firms
transporting,
processing
eggs
Broiler
Production
Wholesalers/retailers Wholesalers/retailers
Layers Quail Egg packing
plant
Pigeon Meat
processing
plant
Song birds Abattoirs
Wild birds
killed for
meat
Poultry
vaccine
producers
Other Specialised
poultry vets
Source: (Sonaiya and Swan, 2004; Pagani et al., 2008)

25
1.4.3 Structure of the smallholder live poultry market in Nigeria
This section deals with live bird markets (LBMs) because these are the primary markets
that smallholder farmers in Nigeria engage with. LBMs are located in open markets5 and
at the farm-gate, scattered across rural, semi-urban and urban spaces in Nigeria. Open
markets often operate weekly in rural areas and daily in urban areas. In the weekly
markets, two types of actor other than primary producers play active roles, namely:
middlemen - traders who buy directly from small farmers at the farm gate or open markets
and collectors – traders who buy from middlemen and to a lesser extent from farmers. In
this context the functions of a market (whether an open market or farm gate sales) are to
act as:
1. a place where smallholder poultry farmers can sell their products;
2. a conduit from where poultry products are supplied to other markets; and
3. a source of poultry for the final consumers.
Daily markets, as the name suggests, operate on a daily basis and are more structured than
weekly markets. The market operates not only for poultry products but are the normal day-
to-day markets where goods and services are traded. Also, because poultry are generally
sold as live birds, inter-state movement of poultry is limited due to the costs and
difficulties involved in moving live birds (e.g. lack of tarred roads or a suitable means of
transport) and the high mortality costs associated with transporting them long distances.
1.4.4 The Live Poultry Market
In Nigeria, live birds dominate the poultry market, both at the farm-gate or in the open
market. Live birds are unprocessed and sold at live-weight prices and as such are generally
cheaper than processed birds. In other words, the value chain in the live poultry market is
short. Beyond the farm-gate, middlemen (wholesalers) continue the chain, meaning that
retail sales rarely occur at the farm-gate. Furthermore, the market for live poultry involves
transporting birds in bulk along poorly maintained or undeveloped rural roads often
associated with transport difficulties, since transporters need to take extra care to ensure
the survival of the birds. Unsurprisingly transporting live birds is associated with high
mortality and shrinkage costs (loss in weight due to transport stress). This therefore makes
5 Open market and spot market are used interchangeably throughout this thesis

26
that farm-gate an attractive market outlet for smallholder farmers since any difficulties
associated with handling live birds are passed on to the middlemen.
Due to the difficulties in transportation, farmers rarely use the open market to sell live
birds. However, when such sales occur they tend to be small compared to farm-gate sales
where middlemen dominate. Another important aspect of the market for live birds, is that
the movement of birds is restricted to a state or region, since they cannot be transported
over long distances. This suggests that farmers and buyers need to build strong
relationships, since movement restrictions reduce the available options for transactions to
those within a limited geographic radius. This restriction in movement also means that unit
prices tend to be similar within a particular area.
Beyond the farm-gate, middlemen sell to poultry traders (retailers) or become retailers
themselves by selling live-processed or frozen birds directly to consumers. Live-processed
is by far the dominant form by which poultry is sold to final consumers in Nigeria. This
means that a buyer selects a live bird and the seller slaughters and prepares the bird on the
spot. The market for frozen poultry is mostly based around hotels, supermarkets, fast food
outlets and restaurants in major cities, and has similarities with the Indian market (Landes
et al., 2004).
The poultry market also embodies spatial and gendered considerations, which play a role
in how transaction costs influence market participation. The following sections discuss
these roles in greater depth.
1.4.5 Role of gender in transaction costs analysis
Gender plays an important role in the transaction costs associated with many businesses,
particularly around access to the resources that facilitate or enable market exchanges. This
discussion is placed in the broader context of rural Nigeria where gendered roles tend to be
more pronounced and where males generally have easier access to institutional support
and the resources associated with it (Koyenikan and Ikharea, 2014). For example, control
of land in Nigeria is male dominated, and women who need additional land will have to
negotiate with family members or community leaders (who are often male dominated)
over the use of land that may be readily available to their male counterparts. This is a good
example of how men and women in Nigeria do not have equal access to or control over the
27
resources required to do business (Walters, 2005; Charles, 2010). Women tend to face
higher transaction costs in other areas, such as the search costs associated with obtaining
information on sources of credit.
The increased transaction costs incurred by women who want to participate in the market
is reflected in their reduced price incentive. According to Walters (2005), price incentive
is based around the relationship between the market price for farm produce and the
associated costs of production, including transaction costs.
Increased transaction costs reduce the price incentive, as they narrow the gap between the
market price and the costs of production. In Nigeria, married women whose husbands
restrict their involvement with male traders are likely to face higher transaction costs if
they participate in the market. Similarly, women with child-care responsibilities may find
it more difficult to participate in the market than a male farmer. In both cases, the higher
transaction costs reduce the incentive for women to participate in markets, particularly for
products that require value addition before sales.
Since transaction costs are different across genders, market prices will not reflect the real
incentives to participate in a market for men and women. Nevertheless, the theory of New
Institutional Economics suggests that transaction costs are mediated through or by
institutions as such institutions, whether formal or informal, influence the level of
transaction costs (Walters, 2005; Caballero and Soto-onate, 2016). Informal norms tend to
prescribe gender roles on activities and therefore many jobs and even public spaces are
gendered (Alubo, 2011). These norms invariably influence the formal institutional
structures imposed by society, which in turn imposes different transaction costs on market
participants. In many countries, formal or informal women farmers’ groups have been set
up to mediate the barriers faced by women in agriculture. Such groups seek to reduce the
barriers faced by women in agriculture by sharing market information and knowledge,
organising training activities, improving access to capital or by negotiating collective
contracts for inputs or services (Boschma, 2005; Capaldo and Petruzzelli, 2014; Sebatta et
al., 2014).
Other institutional measures that women employ to reduce transaction costs include
engaging in agricultural enterprises that require little or no value addition. This is because
transaction costs increase along the value chain and concentrating on primary production,
such as live birds, rather than on processing, storage and delivery minimises these costs.

28
This strategy is also reported by Sebatta et al. (2014) in their study of potato markets in
Uganda, where women were found to engage in the least value chain as a measure to
reduce their costs of doing business.
Accordingly, where TCs are gendered, policies need to take account of this differential,
particularly where it means that women face higher costs than men. However, for this
study, a more general TC perspective around market participation was undertaken. This
was because no previous study has been undertaken to understand the influence of TCs on
smallholder poultry farmers, which makes the more general analysis of TC in the present
study necessary.
1.4.6 Spatial attributes in transaction costs analysis
Location and proximity are critical in understanding how TCs influence market
participation. This can be seen in the context of carrying out market exchanges at a
suitable location that permits better access to buyers and suppliers. Institutional factors
that can reduce or mediate TCs include better transport infrastructure (e.g. tarred roads)
and improved communications (e.g. mobile phone access).
A key element of market exchange involves direct interaction between participants and
proximity allows economic agents (smallholder farmers in this case) to make physical
transactions more easily. Boschma (2005) also argues that where there is proximity to
market, transfer of knowledge and information is easier, reducing uncertainty between
farmers and buyers and therefore facilitating market exchanges.
In other words, TCs are lower in cases where trust exists based on close interactions. This
can be supported by cultural proximity, which exists where an organisation is rooted in a
specific cultural or social context. For example, where a value system rooted in trust
reflects a common cultural value, the transfer of information or knowledge is easier than it
would be in the absence of such a strong trust-based culture.
The advantage of proximity be it spatial, cultural or organisational is that it can reduce the
barriers for market exchanges and is therefore an enabling factor with the overarching
theme being that where interactions are shortened either by distance, cultural affiliations or
through organisations, TCs tend to be lower.

29
1.5 Research Aim and Objectives
The aim of this study is to investigate the influence of transaction costs on market
participation of smallholder poultry farmers in Nigeria. The study has four main objectives
as follows:
a. To determine the influence of transaction costs on the probability of market
participation by smallholder poultry farmers.
b. To determine the influence of transaction costs on the extent of market
participation by smallholder poultry farmers.
c. To determine the influence of transaction costs on the decision to sell live poultry
at the farm-gate rather than at the spot (open) market.
d. To explore the perceived influences of transaction costs on the market participation
decisions of smallholder poultry farmers.
The objectives of this study require a mixed methods approach. As such, objectives (a) to
(c) are achieved by a combination of quantitative and qualitative analysis and objective (d)
is achieved only through the qualitative analysis. In the first phase, quantitative methods
are used to identify factors that have a significant influence in explaining the market
participation decisions of smallholder poultry farmers. In the second phase, qualitative
methods are used to explore why and how transaction costs might influence the decisions
of smallholder farmers to participate in poultry markets. The main aim of the study is
therefore to improve understanding of the measurable and unmeasurable factors
influencing smallholder market participation decisions.

30
1.6 Thesis structure
This thesis is structured into seven chapters, the rationale for the study, the research aims
and objectives and definition of key terms used in the thesis are laid out in chapter one.
Findings from the systematic review of the smallholder market participation literature are
presented in chapter two. The rationale for the mixed method methodology applied in the
study is discussed in chapter three. Results of the quantitative phase of the study, focusing
on factors influencing on probability of participation, extent of participation and choice of
where to sell, are presented in chapter four. In line with the mixed methods strategy
employed in the study, chapter five connects the quantitative and qualitative phases by
providing a rationale for selecting a subset of statistically significant factors for further
exploration in the qualitative phase of the study. Chapter six presents findings from the
qualitative phase of the study obtained from the analysis of semi-structured interviews
with 20 socio-economically diverse poultry farmers. The thesis is concluded in chapter
seven and discusses the principal findings from both phases of the study, alongside
findings from the smallholder market participation literature. The strengths and limitations
of the study are highlighted and recommendations for policy and practice and areas for
further research are considered.

31
Chapter 2. Systematic Review
2.0 Systematic Review of the Smallholder Market Participation Literature
2.1 Introduction
Smallholder market participation research has gained considerable attention in the recent
literature particularly on the African continent (Barrett, 2008; Poole and Frece, 2010;
Lambrechts and Montgomery, 2013; Wiggins and Keats, 2013). Transaction costs
Economics (TCE) is often applied within the smallholder market participation literature,
and is often used as the conceptual framework in investigating smallholder market
participation decisions (Key et al., 2000; Lapar et al., 2003; Fafchamps and Hill, 2005).
However, transaction costs by their very nature are difficult to measure (Lv et al., 2012),
since it is difficult to separate them from production costs (Allen, 1999). Accordingly,
Matthews (1986), provides the following explanation:
“The fundamental idea of transaction costs is that they consist of the cost of arranging a
contract ex ante and monitoring and enforcing it ex post, as opposed to production costs,
which are the costs of executing a contract” (Matthews, 1986, p. 906)
For example, in a poultry enterprise, a smallholder may have to buy poultry feed from a
feed seller, the costs of the feed and transport are regarded as part of the associated
production costs. However, issues around accessing the feed seller, in terms of
uncertainties about road conditions, seller availability, feed availability and price can all
influence how the farmer experiences the transaction and demonstrates that such
transactions do not occur in a frictionless economic environment (Hobbs, 1997).
A systematic review has been conducted to identify the state of art of the published
literature on smallholder market participation research and to explore the potential for
exploring the influence of transaction costs on the market participation decisions of
smallholder poultry farmers.

32
2.1.1 Objectives of the Systematic Review
The objective of this systematic review was to examine empirical evidence from published
literature on smallholder market participation that specifically addresses market-
participation decisions, including the level of participation and the choice of marketing
channel.
2.1.2 Methodology
The review protocol adopted in this study was adapted from the University of York’s
guidance for undertaking systematic reviews in health care (CRD, 2008). Specific details
of the review protocol are outlined in section 2.2 below.
2.2 The review protocol
2.2.1 The search strategy
The search strategy involved incorporating several search methods and began with a
scoping exercise. Detailed descriptions of each search method employed in the review are
provided below.
2.2.1.1 Scoping exercise
The scoping process involved identifying common search terms in the literature related to
key concepts in the study which are then used to search through bibliographic databases as
outlined in Table 4. The importance of the scoping process is that it enhances search
sensitivity and specificity (Tranfield et al., 2003).

33
Table 4: Key concepts and popular key search terms
Key Concepts Popular key search terms
Transaction costs Transaction costs
Smallholder farmers [farm households], [farmers], smallhold*
Market participation Market participation, market participat*
Marketing channel Market outlet, market selection, point of
sale
Notes: *wildcard to allow for alternative word endings
2.2.1.2 Literature searches
An exhaustive search of the smallholder market participation literature was performed
using bibliographic databases and the grey literature. The literature search was performed
between February and June 2015 and was subsequently updated using the same
bibliographic databases between January and May 2017 (adding three studies to the list).
a. Bibliographic databases
The following bibliographic databases were searched for published literature relevant to
the study: AGECONSEARCH, PROQUEST, JSTOR, SCIENCEDIRECT and
IDEAS.REPEC. A basic initial search was performed and where this retrieved a large
number of sources, an advanced search with search limiters was used to narrow down the
retrieved information. The key search terms outlined in the scoping exercise were inputted
in the search box using keywords and titles in each of the databases. The search strategies
and details of the databases are provided in Appendix C.
b. Grey literature
The grey literature considered included: the Directory of Open Access Journals (DOAJ)
and Google Scholar searches. This search was specifically designed to capture relevant
studies that might have been missed from the earlier bibliographic database search,
possibly due to inconsistencies with the indexing used in those databases. This took into
account the increasing use of open access journals by African researchers to disseminate
their findings (Tempest, 2013). As the built-in search engines incorporated in grey

34
literature sources tend not to be as sophisticated as the traditional bibliographic databases
(Coad et al., 2006) broader combinations of key search terms were employed. Details of
the search strategies are outlined from Appendices C.3-C.9. In addition, reference lists
from the retrieved studies were also checked for relevant studies.
2.2.2 The study selection process
A set of inclusion criteria (see Table 5) was used to identify articles to be included in the
review and the retrieved references were meticulously checked to see if they met the
inclusion criteria. References to be included in the review were exported into Endnote to
enable efficient reference management.
2.2.2.2 Study selection criteria
The initial inclusion criteria was that all studies to be considered had to be in English.
They then had to meet each of the criteria described below.
a. Data sources
Eligible sources of data had to be smallholder farms or households sampled from the
general population. In other words, firm-level data was excluded in order to avoid any
potential confounding issues (Simunovic et al., 2009).
b. Predictor variables
Transaction costs were the main predictor or exposure variables of interest in the review.
Studies selected had to measure at least one identifiable transaction costs variable.
c. Study objectives
Eligible studies were required to address at least one of the following: the decision to
participate in a market; the level of market participation; and the choice of market outlet.
d. Model type
Where studies modelled the decision to participate in a market they were required to apply
either a binary probit or logit model. Where a study focused on the extent of participation,
a model that took account of the truncated nature of the data was required. In addition, for
studies that focused on the choice of where to sell, eligible models were the probit, logit,

35
Tobit, Cragg’s double hurdle and Heckman’s two-stage model. In studies where the
decision and extent of market participation were considered jointly, studies that applied
the Cragg’s double hurdle model and Heckman’s two-stage model were selected.
e. Study Design
Studies selected for review were required to have used cross-sectional data and to have at
least one of the objectives outlined in (c) above.
2.2.2.3 The study inclusion and exclusion criteria
The above criteria were used to generate the sequence of questions outlined in Table 5
below.
Table 5: Sequence of questions considered for either inclusion or exclusion in the review
a. Is the data source drawn from smallholder or households?
Yes – include and move to next question
No – exclude from review
b. Is the sample drawn from the general population?
Yes – include and move to next question
No – exclude from review
c. Does the study objectives address the discrete decision to participate in a market
for a single commodity?
Yes – include and move to next question
No – exclude from review
d. Does the study apply a probit or logit model in addressing question (c). above?
Yes – include and move to next question
No – exclude from review
e. Does the study objective address the intensity, extent or level of market
participation for a single commodity?
Yes – include and move to next question
No – exclude from review
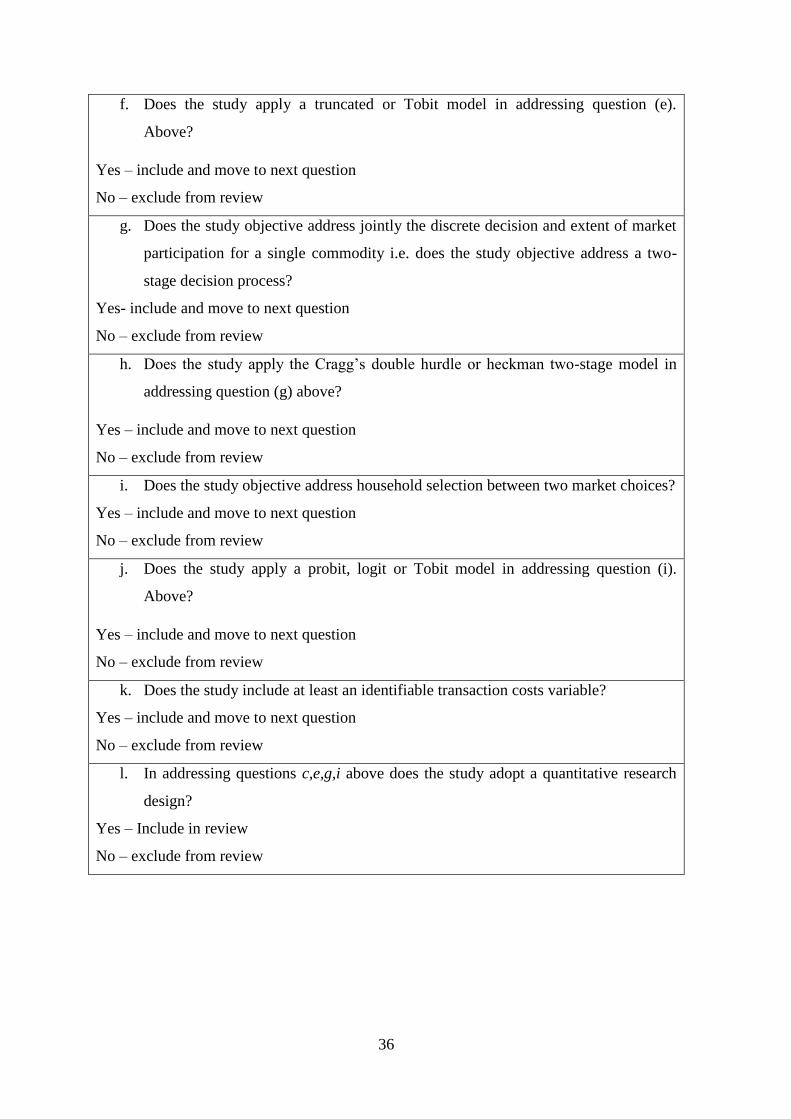
36
f. Does the study apply a truncated or Tobit model in addressing question (e).
Above?
Yes – include and move to next question
No – exclude from review
g. Does the study objective address jointly the discrete decision and extent of market
participation for a single commodity i.e. does the study objective address a two-
stage decision process?
Yes- include and move to next question
No – exclude from review
h. Does the study apply the Cragg’s double hurdle or heckman two-stage model in
addressing question (g) above?
Yes – include and move to next question
No – exclude from review
i. Does the study objective address household selection between two market choices?
Yes – include and move to next question
No – exclude from review
j. Does the study apply a probit, logit or Tobit model in addressing question (i).
Above?
Yes – include and move to next question
No – exclude from review
k. Does the study include at least an identifiable transaction costs variable?
Yes – include and move to next question
No – exclude from review
l. In addressing questions c,e,g,i above does the study adopt a quantitative research
design?
Yes – Include in review
No – exclude from review

37
2.2.2.4 Data Extraction
The studies that satisfied the inclusion criteria were carefully examined and the relevant
information meeting the review objectives were extracted and inputted into Microsoft
Excel, to allow for easy data collation. The data extracted were categorised under the
following headings: 1. study; 2. design and setting; 3. factors; 4. dependent variable; 5.
measurement; 6. economic activity; 7. significance (direction of influence); and 8.
sampling method and sample size.
The characteristics for each study are presented in Table 6.
2.2.3 Study selection
A total of 2318 references were identified from the literature search, out of which 25
studies were eventually selected and included in the review. The study selection process is
diagrammatically outlined in Figure 7 below. Of the 2318 references, 1009 references
were identified to be duplicates and were subsequently excluded. Accordingly, the
remaining 1309 references were checked against the sequential inclusion and exclusion
criteria set out in Table 5 above.

38
Figure 7: Flow chart of studies included in the selection process

39
2.2.3.1 Studies included in the review
The search and selection criteria described above identified 25 studies for further review.
Specifically, 11 studies came from bibliographic database searches, eight studies came
from the grey literature and the six remaining studies came from the researcher’s manual
search from the reference lists of studies included in the review.
Table 18 presents the 25 studies included in the review, the studies were published
between 1997 and 2017. The review consisted of only quantitative studies, as no mixed
methods study satisfying the inclusion criteria was identified. The studies listed in Table
18 are arranged from the oldest to the most recent; for example, Hobbs (1997) is the oldest
study and is listed as [1] and the most recent study Honja et al. (2017) is listed as [25]. In
describing the key characteristics of studies included in the review, the study frequencies
are reported in words (e.g. five studies) and by so doing help to eliminate any possible mix
up that might arise in using only numbers in the description.
2.2.3.2 Studies excluded from the review
1,269 studies did not meet the inclusion criteria outlined in Figure 7 out of which 85%
(n=1079) were excluded because the studies did not apply binary dependent variable
models (i.e. studies applying ordered probit or logit, multinomial probit or logit, etc. were
excluded). 49 studies were excluded for using panel data and 141 studies were excluded
because they did not address the study objectives relevant to the review.
2.2.3.3 Critical appraisal of quantitative studies
To appraise the quantitative studies for internal and external validity (Malterud, 2001;
Khorsan and Crawford, 2014), a 16 item checklist was prepared adapted from the
systematic review checklist in CASP (2017). The CASP (2017) checklist covers broad
issues that should be considered when appraising a systematic review. In order to conduct
a systematic review for cross-sectional studies, the review adapted generic items on the
broad systematic review checklists to suit the current review topic.

40
2.2.3.4 Quality assessment
The items on the critical appraisal checklist were checked as ‘yes’, ‘no’ or ‘can’t tell’
(CASP, 2017). A score of 1 was given to a ‘yes’ and 0 to a ‘no’ or ‘can’t tell’.
Afterwards, the total scores for ‘yes’ that were generated for each study were converted
into percentages and each item on the checklist was backed up with supporting notes (see
Appendices C.10-C.12) to ensure consistency and allow for more coherent decision
making.
Similar quality assessment processes are often used to screen for methodological quality
(Terwee et al., 2012) and enable the exclusion of studies with poor methodological
quality. Quality assessment was also used to observe variability across the studies that met
the inclusion criteria and to identify areas that could be improved upon in future research.
2.3 Overview of studies included in the review
2.3.1 Study characteristics
The key characteristics of the studies included in the review are summarised in Table 6
and are sub-divided and described below under five categories namely: (a) study type (b)
design and settings; (c) sampling and sample size; (d) agricultural activity; and (e) variable
measurement.
a. Study type
The studies were published between 1997 and 2017; however only studies published in the
years 1997, 2006, 2010, 2011, 2012, 2013, 2014, 2015, 2016 and 2017 featured in the
twenty one year period. The year 2014 witnessed the highest number of studies (nine) [12-
20], 2012 contributed three studies [6,7,8] as did 2013 [9,10,11] and 2016 [22,23,24]. The
year 2011 added two studies [4, 5]. The five remaining studies [1, 2, 3, 21, 25] were
published in 1997, 2006, 2010, 2015 and 2017 respectively.
The review focused on studies addressing the three objectives relevant to the study: i.e.
probability of market participation, extent of market participation and choice of marketing
channels. Eleven studies focused on studies addressing choice of marketing channels

41
[1,2,4,5,6,12,13,17,18,19,22], four out of the eleven studies applied the Tobit model [1, 2,
4,13], two studies applied Cragg’s double hurdle model [6,18], one study applied
Heckman’s two-stage model [22], two studies each applied the probit model [5,17] and
the logit model [12,19].
Five studies solely addressed the probability of market participation [7, 8, 11, 15, 20], out
of which three of the studies applied the probit model [7, 11, 15], with the remaining two
applying the logit model [8, 20].
Seven studies addressed both the probability of market participation and the extent of
participation [3, 9, 10, 14, 16, 23, 24]. Of these, two studies applied Cragg’s double hurdle
model [14, 24] and five the Heckman two-stage model [3, 9, 10, 16, 23]. The last two
studies applied the Tobit model to address the extent of market participation [21, 25].
In all, six studies applied the Tobit model [1, 2, 4, 13, 21, 25] and six studies applied the
Heckman two-stage model [3, 9, 10, 16, 22, 23]. Five studies applied the probit model
[5,7,11,15,17], while four studies applied Cragg’s double hurdle model [6, 14, 18, 24] or
the logit model [8,12,19,20].
(b) Design and settings
All studies in the review were quantitative and employed cross-sectional data.
Specifically, twenty three studies made use of primary data [1, 2, 4, 6, 7-17, 19, 20-25],
while the three remaining studies made use of secondary data [3, 5, 18]. Of these three
studies, two made use of the same data set but addressed different study objectives [3, 5].
The majority of the studies (i.e. twenty) were set in Africa [3-12, 14, 15, 16, 18, 20-25].
Five studies were from Nigeria [8,11,12,15,20], followed by four studies set in Ethiopia
[4,10,23,25] and two each in Kenya [7,22], Ghana [14,21] and Burundi, DR Congo and
Rwanda [3,5]. The remaining studies were set in Namibia [6], Tanzania [24], Zambia [9],
Swaziland [18] and Uganda [16]. The five remaining studies were set in China [2, 13],
Indonesia [17], the United Kingdom [1] and Afghanistan [19].

42
(c) Sampling and sample size
The sample size varied across the studies, most of which employed probability sampling
techniques which involves some form of random selection. Specifically, thirteen studies
applied multi-stage random sampling [4, 8, 12-17, 19, 21, 22, 24, 25], six studies applied
simple random sampling [2, 6, 7, 10, 11, 20], one study employed quota sampling [9], and
another study employed systematic random sampling [13]. Four studies did not provide
adequate information on the sampling method employed [1, 3, 5, 18], possibly because
three [3, 5, 18] of them made use of secondary data.
The sample size for the studies reviewed ranged from 68 to 2666 participants. Four studies
had sample sizes of up to 100 participants [1, 7, 15, 18] and eleven had sample sizes
between 101 and 200 participants [2, 6, 8, 11, 12, 14, 16, 20, 21, 22, 25]. Three studies
had sample sizes ranging between 201 and 300 participants [4, 9, 19]. Three studies had
samples size between 301 and 600 participants [10, 13, 21] and two had sample sizes
between 601 and 700 [17, 24]. Two studies used the same large data set with sample size
of 2666 participants [3, 5].
(d) Agricultural activity
Agricultural activities captured in the review were varied. A total of seventeen agricultural
activities were covered in the review. Studies focusing on cattle were most common,
specifically [1, 2, 6, 10]6, three studies focused on bananas [3, 4, 5], two each on fish [8,
12], maize [9, 14], rice [11, 24] and mangos [17, 25]. Each of the ten remaining studies
focused on a single sector indigenous poultry [7], apples [13], cucumbers [15], potatoes
[16], mushrooms [18], goat [19], tomatoes [20], groundnuts [21], tea [22] and kocho [23].
In summary, seven studies focused on animals, one study focused on cows’ milk and
seventeen studies focused on crops.
(e) Variables and measurement
The variables considered in the review were all statistically significant explanatory
variables identified in the 25 studies. The transaction costs variables identified in the
review were mainly proxy qualitative independent variables, usually based on binary
dummy and categorical measurements. The empirical studies therefore highlight the
difficulties involved in measuring transaction costs directly. This difficulty in
6 While [1, 2, 6] focused on cattle for beef, [10] focused on milk from cow.

43
measurement makes it difficult to compare individual factors across studies. For example,
the variable ‘grade uncertainty’ is measured both as a categorical variable [1] and a binary
dummy [2]. In addition, the context of the study and the agricultural activity investigated
means that factors have intrinsic meanings specific to each study further making
comparison difficult. Therefore, to give meaning to the variables, the frequency and type
of measurement applied in each model are described.
A total of two hundred and twenty seven statistically significant variables were identified
in the review, out of which one hundred and eight are continuous independent variables,
eighty-seven are measured as binary dummy independent variables and thirty two are
categorical independent variables. The Heckman models recorded the highest number of
variables, with seventy statistically significant variables, out of which thirty-eight are
continuous independent variables, thirty are binary dummy variables and two are
categorical independent variables, of which one is measured on a scale of 1-5 and the
other measured on a scale of 1-3. The Cragg’s double hurdle models recorded the second
largest number with fifty eight variables, made up of twenty seven continuous variables,
seventeen binary dummy variables and fourteen categorical variables, which comprised
nine variables measured on a scale of 1-5 and five variables measured on a scale of 1-3.
The Tobit model recorded the third largest number with fifty two variables. Of these
nineteen were continuous independent variables, twenty two binary dummy variables and
eleven categorical independent variables (comprising six variables which were measured
on a scale of 1-5, two variables measured on a scale of 1-6, two variables measured on a
scale of 1-3, and one measured on a four item scale). The probit model recorded twenty-
six independent variables, out of which fifteen were continuous independent variables,
nine binary dummy variables and two categorical independent variables (one measured on
a 22-item scale and the other on a scale of 1-7).
The logit model contributed the fewest variables, with a total of twenty one statistically
significant independent variables, out of which nine were continuous variables and a
further nine binary dummy variables, with the last three categorical independent variables
(are measured on a scale of 1-4 and the one on a scale of 1-5).

44
Table 6: Study characteristics included in the review
Study
Design &
setting
Economic
activity
sampling &
sample size
study focus
Model
Dependent Variable
Factor &
Measurement
Binary probit or Binary
logit model
Model
Dependent Variable
Factor &
Measurement
truncated model
Model
Dependent Variable
Factor &
Measurement
Tobit model
[1] Hobbs, J.E
(1997), Primary
data, United
Kingdom,
Cattle, 100.
Choice of live-
ring auctions
vis-à-vis direct
to packer.
DV= proportion of bananas
sold through live-weight
ring auctions
Risk of non-sale
(categorical)
time spent at the auction
(hours)
effectiveness of packing
plant buyers (categorical)
grade uncertainty
(categorical)
lot size
producing bulls (dummy,
1=yes)
membership of farm
assured scotch livestock
scheme (categorical)
[2] Gong, Wen. et
al (2006),
primary data,
China, cattle,
random
sampling, 153,
Choice of spot
market vis-à-vis
forward
contracting
channels.
DV= proportion of cattle
sold through the spot market
channel
Payment delay (dummy,
1=yes)
Bargaining power
(categorical)
Farm specialisation
(percentage of household
income from cattle),
(Categorical)
Grade uncertainty
(dummy, 1=yes)

45
Ownership structure
(dummy, 1=collective,
2=household)
Extent of investment
(categorical)
Age (categorical)
EDU (years)
Experience (categorical)
[3] Jagwe, J. et al
(2010),
secondary data,
Great lakes
region of central
Africa (Burundi,
DRC, Rwanda),
banana, 2666,
Market
participation &
extent of
participation,
Heckman two-
stage model.
Probit model/ DV= dummy
Land size (ha)
Member of a farmer
group (dummy, 1=yes)
Ownership of bicycle
(dummy, 1=yes)
HH without access to
price information
(dummy, 1=yes)
neighbours are the main
source of price
information (dummy,
1=yes)
HH located in Gitega
province (Burundi)
HH located in Kirundo
province (Burundi)
HH located in North
Kivu province (DRC)
HH located in South
Kivu province (DRC)
HH located in Bas-Congo
province (DRC)
HH located in East
province (Rwanda)
HH located in West
province (Rwanda)
DV= quantity sold
Cooking banana price
($/bunch)
HH members aged (6-17
years)
Ownership of bicycle
(dummy, 1=yes)
HH located in West province
(Rwanda)
[4] Woldie, G.A &
Nuppenau, E.A.
(2011), Primary
data, Ethiopia,
Banana, Multi-
DV= proportion of banana
sold through wholesale
traders

46
stage random
sampling, 203.
Choice of
wholesale vis-à-
vis
cooperatives.
Time spent searching for
price information (hours)
Price knowledge
(dummy, 1=yes)
difficulty of accessing
price information
(categorical )
signed an agreement with
cooperatives (1=yes)
time spent during
transaction (hour)
trustworthiness of traders
(dummy, 1=high)
access to credit (dummy,
yes=1)
farm size (ha)
[5] Jagwe, J.N &
Machethe, C.
(2011),
secondary data,
Great lakes
region of central
Africa (Burundi,
DRC, Rwanda),
2666, banana,
Choice of
selling at the
market vis-à-vis
farm-gate.
Probit model/ DV= dummy
HH size
Age(years)
goHH (dummy, 1=male)
distance to nearest
hospital (km)
HH without access to
price information
(dummy, 1=yes)
neighbours are the main
source of price
information (dummy,
1=yes)
traders are the main
source of price
information (dummy,
1=yes)
off-farm revenue (USD
per year)
[6] Shiimi, T. et al
(2012), primary
data, Namibia,
random
sampling
Probit model/ DV= dummy
Age (years)
Experience (years)
Access to cattle
DV= proportion of cattle sold
through formal markets
Age
Experience (years)
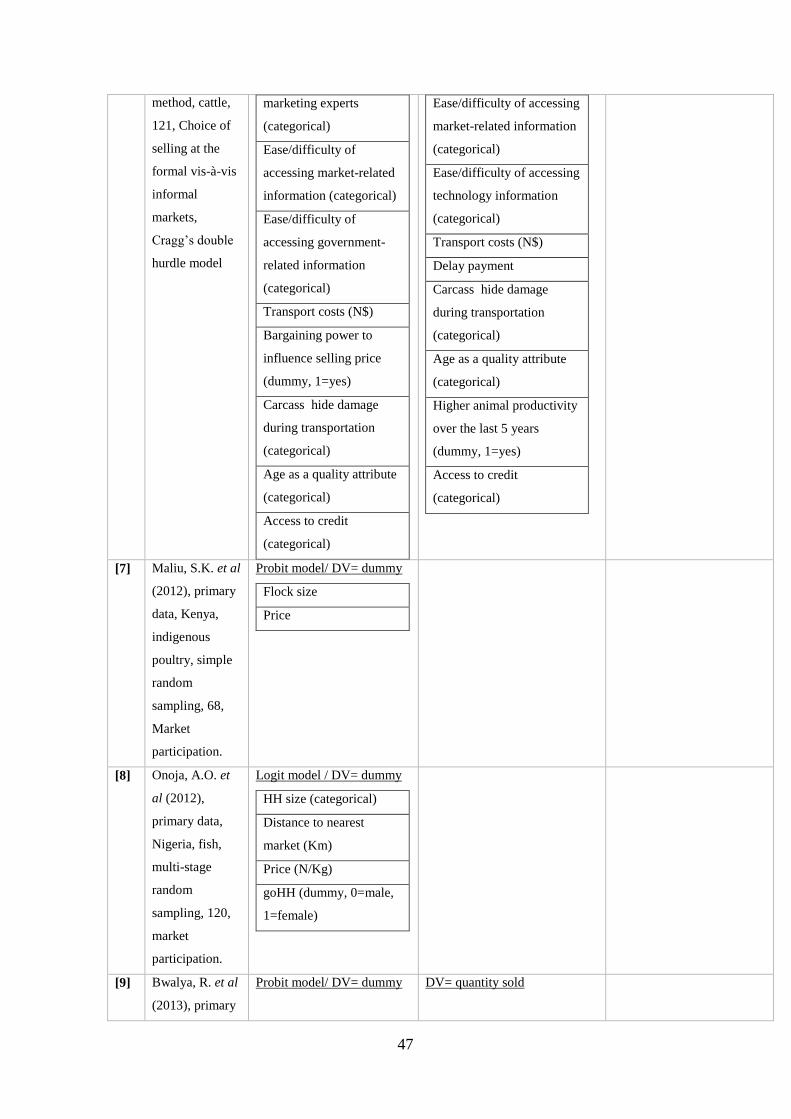
47
method, cattle,
121, Choice of
selling at the
formal vis-à-vis
informal
markets,
Cragg’s double
hurdle model
marketing experts
(categorical)
Ease/difficulty of
accessing market-related
information (categorical)
Ease/difficulty of
accessing government-
related information
(categorical)
Transport costs (N$)
Bargaining power to
influence selling price
(dummy, 1=yes)
Carcass hide damage
during transportation
(categorical)
Age as a quality attribute
(categorical)
Access to credit
(categorical)
Ease/difficulty of accessing
market-related information
(categorical)
Ease/difficulty of accessing
technology information
(categorical)
Transport costs (N$)
Delay payment
Carcass hide damage
during transportation
(categorical)
Age as a quality attribute
(categorical)
Higher animal productivity
over the last 5 years
(dummy, 1=yes)
Access to credit
(categorical)
[7] Maliu, S.K. et al
(2012), primary
data, Kenya,
indigenous
poultry, simple
random
sampling, 68,
Market
participation.
Probit model/ DV= dummy
Flock size
Price
[8] Onoja, A.O. et
al (2012),
primary data,
Nigeria, fish,
multi-stage
random
sampling, 120,
market
participation.
Logit model / DV= dummy
HH size (categorical)
Distance to nearest
market (Km)
Price (N/Kg)
goHH (dummy, 0=male,
1=female)
[9] Bwalya, R. et al
(2013), primary
Probit model/ DV= dummy DV= quantity sold
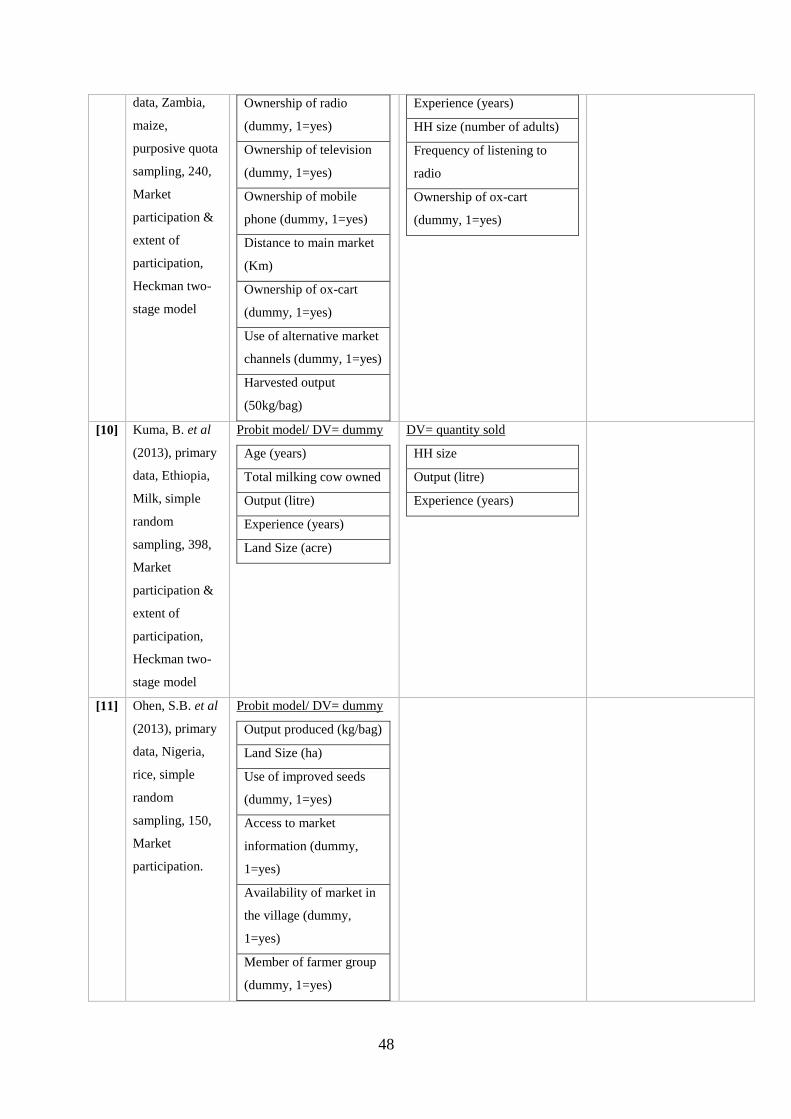
48
data, Zambia,
maize,
purposive quota
sampling, 240,
Market
participation &
extent of
participation,
Heckman two-
stage model
Ownership of radio
(dummy, 1=yes)
Ownership of television
(dummy, 1=yes)
Ownership of mobile
phone (dummy, 1=yes)
Distance to main market
(Km)
Ownership of ox-cart
(dummy, 1=yes)
Use of alternative market
channels (dummy, 1=yes)
Harvested output
(50kg/bag)
Experience (years)
HH size (number of adults)
Frequency of listening to
radio
Ownership of ox-cart
(dummy, 1=yes)
[10] Kuma, B. et al
(2013), primary
data, Ethiopia,
Milk, simple
random
sampling, 398,
Market
participation &
extent of
participation,
Heckman two-
stage model
Probit model/ DV= dummy
Age (years)
Total milking cow owned
Output (litre)
Experience (years)
Land Size (acre)
DV= quantity sold
HH size
Output (litre)
Experience (years)
[11] Ohen, S.B. et al
(2013), primary
data, Nigeria,
rice, simple
random
sampling, 150,
Market
participation.
Probit model/ DV= dummy
Output produced (kg/bag)
Land Size (ha)
Use of improved seeds
(dummy, 1=yes)
Access to market
information (dummy,
1=yes)
Availability of market in
the village (dummy,
1=yes)
Member of farmer group
(dummy, 1=yes)

49
[12] Edoge, E.D.
(2014), primary
data, Nigeria,
fish, multi-stage
random
sampling, 117,
Choice of direct
marketing
channel vis-à-
vis indirect
market
channels.
Logit model/ DV= dummy
Age (years)
EDU (categorical)
Farm size (ha)
Access to information
(dummy i.e. ownership of
cell phone, radio, TV)
Distance to market (Km)
Price
[13] Lijia, W. &
Xuexi, Huo.
(2014), primary
data, China,
apple,
systematic
sampling, 434,
Choice of
cooperative
channels vis-à-
vis non-
cooperative
channels.
DV= proportion of apples
sold through cooperative
channel
Off-farm experience
(dummy, 1= have off-
farm experience)
Trust degree in
cooperatives (categorical)
Apple farm area
Time spent to obtain price
information (hours)
Time spent searching for
buyers (hours)
Cost of attending
agricultural
fairs/exhibitions (yuan)
Speed of grading apples
(hour)
Cost of treating buyers
(yuan)
Delay in payment (days)

50
[14] Abu, B. M. et al
(2014), Primary
data, Ghana,
maize, multi-
stage random
sampling, 200,
Market
participation/
extent of
participation,
Cragg’s double
hurdle model
Probit model/ DV= dummy
Age (years)
EDU (years)
HH size
Member of farmer based
organisation (dummy,
1=yes)
Farm size (ha)
HH income (cedi)
Off-farm income (ratio)
Output (50kg/bag)
Access to credit (dummy,
1=yes)
Access to market
information (dummy,
1=yes)
DV= percentage of total output
sold (H.C.I)
Age (years)
goHH (dummy, 1=male)
HH size
HH income (cedi)
Off-farm income (ratio)
Output (50kg/bag)
Access to credit (dummy,
1=yes)
Price (50kg/bag)
Access to market
information (dummy, 1=yes)
Point of sale (dummy,
1=market, 0= farm-gate)
[15] Ohen, S.B. et al
(2014), primary
data, Nigeria,
cucumber,
multi-stage
sampling, 72,
market
participation.
Probit model/ DV= dummy
Access to market
information (dummy,
1=yes)
Distance to market (km)
Output (kg/bag)
[16] Sebatta, C. et al
(2014), primary
data, Uganda,
potato, multi-
stage sampling,
200, Market
participation &
extent of
participation,
Heckman two-
stage model
Probit model/ DV= dummy
Age (years)
Price (Ugandan shillings)
Distance to nearest
market (km)
goHH (dummy, 1=male)
Number of annual
extension visits
Access to other food
sources besides potato
(dummy, 1=yes)
EDU (years)
Monthly non-farm
DV= quantity sold
goHH (dummy, 1=male)
Monthly non-farm income
(Ugandan shillings)
Membership of a cooperative
(dummy, 1=yes)

51
income (Ugandan
shillings)
Availability of village
market (dummy, 1=yes)
[17] Natawidjaja,
R.S. et al
(2014), Primary
data, Indonesia,
mango, multi-
stage cluster
random
sampling, 636,
Choice of
modern
channels vis-à-
vis traditional
channels.
Probit model/ DV= dummy
Price of mango in west
Java (IDR/Kg)
Cost of marketing (IDR)
Cost of procurement in
west Java (IDR)
Farm size
Irrigation system
(categorical)
Farm equipment
(categorical)
Public infrastructure -
Distance to nearest
asphalt road (hours)
[18] Mabuza, M.L. et
al (2014),
secondary data,
Swaziland,
mushroom, 91,
Choice of retail
market vis-à-vis
farm-gate.
Probit model / DV= dummy
Labour endowment (age
of HH members)
Farm size (number of
spawn-impregnated bags)
Ownership of refrigerator
(dummy, 1=yes)
Farmer has knowledge of
prices in alternative
markets (dummy, 1=yes)
Difficulty in accessing
price information
(categorical)
Bargaining power
(dummy, 1=producer sets
price, 0=buyer sets price)
Farmer is member of
mushroom producing
group (dummy, 1=yes)
DV= proportion of mushrooms
sold through the retail market
Difficulty in accessing
transport (categorical)
Quality Uncertainty
(dummy, 1=yes)
[19] Tavva, S. et al
(2014), primary
data,
Logit model / DV= dummy
Price (Kg/live weight)

52
Afghanistan,
goat, multi-
stage sampling,
280, Choice of
district market
vis-à-vis village
markets.
Production system
(dummy, 1=irrigated,
0=rain fed)
Watani (breed)
Gujry (breed)
Selling on Saturdays
Selling goat less than 1
year old
[20] Osebeyo, S.O.
& Aye, G.C.
(2014), primary
data, Nigeria,
tomato, simple
random
sampling, 165,
Market
participation.
Logit model / DV= dummy
Transport cost (Naira)
Access to market
information (dummy,
1=yes)
Access to tertiary
education (dummy,
1=yes)
Dependency (number of
people in HH)
Distance to market (Km)
[21] Abu, B.M.
(2015), Primary
data, Ghana,
groundnut,
multi-stage
random
sampling, 200,
intensity of
market
participation.
DV= percentage of total
output sold (H.C.I)
Age (years)
goHH (dummy, yes =
male)
MoHH (dummy, yes =
married)
Experience (years)
HH income
Output (50kg/bag)
Ownership of mobile
phone (dummy, yes=1)
Access to credit (dummy,
yes= 1)
Access to market
information (dummy,
yes=1)
Point of sale (dummy,
1=market, 0= farm-gate)
Form of sale (dummy,

53
1=unshelled)
[22] Harrizon, K. et
al (2016),
primary data,
Kenya, tea,
multi-stage
random
sampling, 155,
Choice of
formal market
channel vis-à-
vis informal
market channel,
Heckman two-
stage model.
Probit model/ DV= dummy
Age (years)
goHH (dummy, 1=yes)
EDU (categorical)
experience (years)
Bonus (second dividend
payment)
DV= proportion of tea leaf sold
through formal markets
Age (years)
Experience (years)
Quantity produced
Bonus (second dividend
payment)
[23] Lefebo, N. et al
(2016), primary
data, Ethiopia,
Kocho, multi-
stage random
sampling, 398,
Market
participation &
extent of
participation,
Heckman two-
stage model
Probit model/ DV= dummy
Age (years)
GoHH (dummy, 1=yes)
Total livestock owned
(TLU)
Output produced
(quintals)
Perception of price (Birr)
Availability of labour
(dummy, 1=yes)
Non-farm income (Birr)
Access to market
information (dummy,
1=yes)
DV= quantity sold
Age (years)
GoHH (dummy, 1=yes)
Total livestock owned (TLU)
Output produced
(quintals)
Perception of price (Birr)
Availability of labour
(dummy, 1=yes)
[24] Achandi, E.L &
Mujawamariy,
G. (2016),
primary data,
Tanzania, Rice,
Multi-stage
random
sampling, 676.
Market
participation/
Probit model/ DV= dummy
cropped area (ha)
variety grown (dummy, 1=
improved)
yield (tonne/ha)
distance to nearest market
(Km)
DV= quantity sold
cropped area (ha)
variety grown (dummy, 1=
improved)
yield (tonne/ha)
distance to nearest market
(Km)
existence of market within

54
extent of
participation,
Cragg’s double
hurdle model
the village (dummy,
1=markets exists),
[25] Honja, W. et al
(2017), primary
data, Ethiopia,
Mango, multi-
stage random
sampling, 138,
extent of
participation.
DV= quantity sold
HH size
GoHH (dummy, 1=male)
EDU (dummy, 1=literate)
Output (quintal)
Ownership of means of
transport (dummy, 1=yes)
Access to market
information (dummy,
1=yes)
Post-harvest loss (quintal)
Access to non-farm
income (dummy, 1=yes)
2.3.2 Quality assessment of studies included in the review
Drawing from the critical appraisal checklist described in sections 2.2.3.3 and 2.2.3.4, the
results obtained from the 16-item checklist used in assessing the quality of studies
included in the review are summarized in sub-section 2.3.2.1 below. Details of individual
results are presented in Appendix C.12.
2.3.2.1 Results of the critical appraisal
In general, the quality of the studies varied somewhat as shown in Table 7 below. Based
on the ‘yes’ ratings, the overall quality of studies ranged from 62.5 percent to 87.5 percent.
Nine out of the sixteen quality criteria had 100 percent ‘yes’ ratings for all the studies and
the specific quality criteria show that all of the studies addressed an appropriate and
clearly focused question or objective. In other words, the studies clearly addressed
questions or objectives focusing on either the probability of market participation and/or
the extent of market participation, or the choice of marketing channels. In addition, all
studies used an appropriate design to meet the study questions or objectives, i.e.
quantitative research design and sample size were reported for all studies included in the

55
review. The study sample in all studies in the review were representative of the target
populations and results from all of the studies could be generalised to the target
population.
Table 7: Quality assessment results of studies included in the review
Study ‘yes’ ratings Overall study quality (%)
[1] Hobbs, J.E (1997) 10/16 62.5%
[3] Jagwe, J. et al (2010) 11/16 68.75%
[6] Shiimi, T. et al (2012) 11/16 68.75%
[14] Abu, B. M. et al (2014) 11/16 68.75%
[2] Gong, Wen et al (2006) 12/16 75%
[4] Woldie, G.A & Nuppenau, E.A. (2011) 12/16 75%
[5] Jagwe, J.N & Machethe, C. (2011) 12/16 75%
[12] Edoge, E.D. (2014) 12/16 75%
[15] Ohen, S.B. et al (2014) 12/16 75%
[16] Sebatta, C. et al (2014) 12/16 75%
[17] Natawidjaja, R.S. et al (2014) 12/16 75%
[20] Osebeyo, S.O. & Aye, G.C. (2014) 12/16 75%
[21] Abu, B.M. (2015) 12/16 75%
[24] Achandi, E.L & Mujawamariy, G. (2016) 12/16 75%
[7] Maliu, S.K. et al (2012) 13/16 81.25%
[8] Onoja, A.O. et al (2012) 13/16 81.25%
[9] Bwalya, R. et al (2013) 13/16 81.25%
[19] Tavva, S. et al (2014) 13/16 81.25%
[23] Lefebo, N. et al (2016) 13/16 81.25%
[11] Ohen, S.B. et al (2013) 13/16 81.25%
[10] Kuma, B. et al (2013) 14/16 87.5%
[13] Lijia, W. & Xuexi, Huo. (2014) 14/16 87.5%
[18] Mabuza, M.L. et al (2014) 14/16 87.5%
[22] Harrizon, K. et al (2016) 14/16 87.5%
[25] Honja, W. et al (2017) 14/16 87.5%

56
Transaction costs variables were clearly stated in all of the studies and measurements of
transaction costs in all the studies reviewed were also clearly defined. All studies clearly
identified the dependent variable(s) used in each analysis and all studies provided a clear
rationale for using a particular model.
The definition of ‘smallholders’ was a serious quality issue and only one study [3] clearly
defined what being a smallholder meant. However, the worst performing quality criterion
was that no study reported response rates. More positively, twenty two studies employed a
random or probability sampling technique [2,4,6,7-25] and twenty two studies reported
standard errors of the results [2-11,13-25]. The differences between market participants
and non-participants were reported in ten studies [5, 9, 10, 13, 16, 18, 22-25].
Furthermore, fifteen studies reported the P-values of the results [2, 7, 8, 10-13, 15, 17-20,
22-25]. The final quality criterion showed that sixteen studies reported marginal effects of
the results [1, 4, 5, 7-13, 18, 19, 21-23, 25].
2.4 Findings from smallholder choice of marketing channels
Table 8 presents characteristics of studies on smallholder choice of marketing channel.
Four studies employed Tobit models to investigate smallholders’ choice of marketing
channels [1, 2, 4, 13]. Two studies employed Cragg’s model to investigate smallholder
choice of marketing channel [6, 18]. Only one study used the Heckman two-stage model
to investigate smallholder choice of marketing channel [22]. Two studies in the review
employed a probit model to investigate smallholder choice of marketing channel [5, 17],
while two more used a logit model for the same purpose[12, 19]
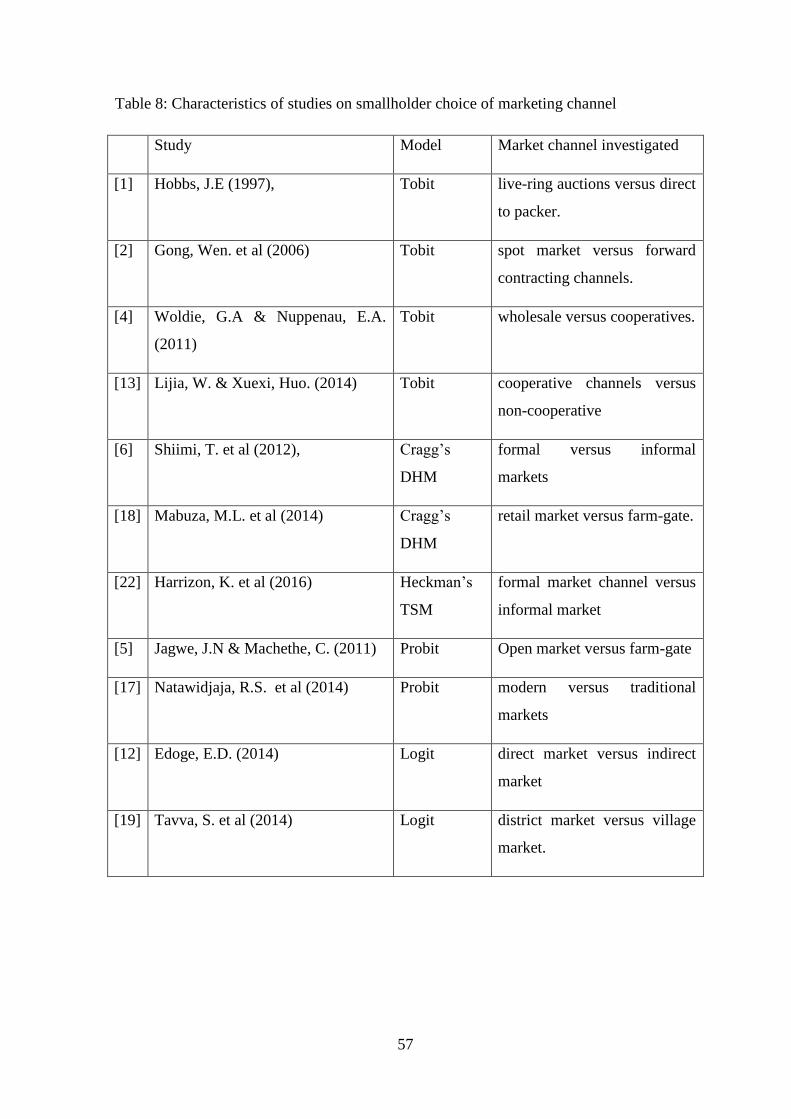
57
Table 8: Characteristics of studies on smallholder choice of marketing channel
Study Model Market channel investigated
[1] Hobbs, J.E (1997), Tobit live-ring auctions versus direct
to packer.
[2] Gong, Wen. et al (2006) Tobit spot market versus forward
contracting channels.
[4] Woldie, G.A & Nuppenau, E.A.
(2011)
Tobit wholesale versus cooperatives.
[13] Lijia, W. & Xuexi, Huo. (2014) Tobit cooperative channels versus
non-cooperative
[6] Shiimi, T. et al (2012), Cragg’s
DHM
formal versus informal
markets
[18] Mabuza, M.L. et al (2014) Cragg’s
DHM
retail market versus farm-gate.
[22] Harrizon, K. et al (2016) Heckman’s
TSM
formal market channel versus
informal market
[5] Jagwe, J.N & Machethe, C. (2011) Probit Open market versus farm-gate
[17] Natawidjaja, R.S. et al (2014) Probit modern versus traditional
markets
[12] Edoge, E.D. (2014) Logit direct market versus indirect
market
[19] Tavva, S. et al (2014) Logit district market versus village
market.

58
The following sub-sections present evidence of the socio-economic and transaction costs
factors influencing the choice of marketing channels in the studies under review. Section
2.4.1 presents findings on the socio-economic factors, while 2.4.2 presents findings on
transaction costs factors.
2.4.1 Socio-economic factors influencing choice of marketing channel
The findings on the association of socio-economic factors with choice of where to sell are
provided in Table 9. The findings highlight the strong influence of age in a farmer’s
decision about where to sell, with six studies reporting that age is positively associated
with making market choice decisions [2, 5, 6, 12, 18, 22]. Explanations as to why age
might be important in influencing farmers’ choices of where to sell, draw on the marketing
experience of older farmers and their ability to judge the performance of trading partners
and determine the most lucrative market channel [12]. Other findings argue that older
farmers are better negotiators [5], explaining why older farmers might opt for formal
market channels where negotiations are easier, faster and more transparent [6].
Table 9: Socio-economic factors influencing the choice of marketing channel
Factor Sign Study
1 Age Sig+ [2, 5, 6, 12, 18, 22]
2 Farm size Sig+ [12, 13, 17, 18]
3 Educational status Sig+ [2,12, 22]
4 Price Sig+ [12, 17, 19]
5 Farm experience Sig+
Sig-
[6]
[2, 22]
6 Access to credit Sig+
Sig-
[6]
[4, 6]
Four studies reported that farm size has a positive association with marketplace decisions
[12, 13, 17, 18]. Consistent with explanations across the studies, information on farm size
suggests the crucial importance that increasing farm size has on the production process,
where higher output levels influence the type of market where produce is sold. The
findings further highlight the educational level of farmers as being associated with

59
farmers’ decisions on where to sell, with three studies reporting that educational levels
influence marketplace decisions [2,12, 22]. In addition, a positive influence of price on
making marketplace decisions was found in three studies [12, 17, 19].
Furthermore, findings highlight that experience is associated with their marketplace
decisions. Two studies [2, 22] found evidence that farm experience does not influence
selling at the spot market as such farmers were drawn towards forward contracting
because over time farmers prefer the certainty of advance bookings that the forward
contracting route affords [2]. In addition, experienced tea farmers were drawn to informal
markets against the formal market channel, this was because farmers with more years in
tea farming have developed marketing skills and built customer base so do not need to
approach the formal markets anymore since thry are already well established to go it on
their own [22]. In another study, experienced cattle farmers in Namibia were drawn to
formal markets against the informal market. Within the context of the study; formal
markets provided free transport services since the government was the main source of
formal market and experienced farmers stocked larger number of cattle as such would
prefer the formal route since transport fee is absorbed by government [6]. Likewise, two
studies found access to credit to influence on marketplace decisions [4,6]. In one study,
banana farmers who accessed credit decided to sell direct to cooperatives, rather than
selling to wholesalers. The reason for this was that cooperatives enter into interlocked
agreements with farmers, whereby cooperatives provide credit and farmers agree to sell a
large proportion to them in return [4]. In the second study, accessing credit led a cattle
farmer to sell at the formal market because buyers there offered credit to farmers in
exchange for securing sole rights to their cattle[6].

60
2.4.2 Transaction costs factors influencing on choice of marketing channel
As earlier noted, transaction costs consist of arranging a contract (transaction) ex ante by
gathering information, which generates information, and search costs. After which,
monitoring and enforcement is carried out ex post which also generates negotiation and
bargaining costs as well as monitoring and enforcement costs.
Accordingly, findings on the association between transaction costs factors and a farmer’s
decision on where to sell are grouped into three categories, namely:
a. information and search costs incurred before the transaction
b. negotiation and bargaining costs incurred during the transaction
c. monitoring and enforcement costs incurred after the transaction
2.4.2.1 Information and search cost factors
The findings on the association of information and search costs with farmers’ decisions on
where to sell are provided in Table 10. Evidence highlighted price uncertainty as having a
strong association with influencing a farmer’s decision on where to sell. Three studies
provided evidence that price uncertainty influence farmers’ marketplace decisions [1, 5,
18]. In a study on cattle markets in the UK, price uncertainty influenced selling direct to
packer (deadweight) against live-ring auctions because flow of price information through
packers were more reliable as against live-auctions where prices tend to fluctuate [1]. The
study on banana markets in the Great Lakes region, found that price uncertainty influenced
farmers’ decisions to sell at the farm-gate rather than in the open market. In the former
case, farmers and buyers have generally agreed on a price, ahead of the buyer travelling to
make the purchase, making pricing transparent. In the latter case, price has not been
agreed beforehand so prices can fluctuate, leading to uncertainty [5]. Uncertainty around
prices often results in farmers being price takers, as they tend to accept the prices set by
buyers (Mutayoba and Ngaruko, 2015). Also, many smallholder farmers are located in
remote areas where access to price information is limited, meaning that they may not able
to access more lucrative markets (Olwande et al., 2015).

61
Table 10: Information and search cost factors influencing choice of marketing channel
Factor Sign Study
1 Price uncertainty Sig-
Sig+
[1, 5, 18]
[13]
2 Access to marketing experts Sig + [6]
3 Access to government-related information Sig+ [6]
4 Access to market-related information Sig- [6]
5 Access to information technology Sig- [6]
6 Access to means of information Sig+ [12, 17]
One study found evidence of positive association with accessing marketing experts and
accessing government-related information to influence cattle farmers’ decisions on where
to sell. The same study found evidence of a negative association with accessing market-
related information and accessing information technology to influence cattle farmer’s
decision on where to sell [6]. Two other studies found evidence that accessing information
influenced farmers’ choices of where to sell [12, 17].
2.4.2.2 Negotiations and bargaining costs
Table 11 presents the factors related to negotiations and bargaining costs, according to
Osebeyo and Aye (2014), in some marketplaces buyers pay as soon as a transaction is
concluded, while in others payment is scheduled for a later date – this is known as
payment delay. Two studies indicated that payment delay influenced a farmer’s decision
on where to sell, with one of the studies indicating a positive influence [2], and the second
a negative influence [6]. However, one study placed payment delay under monitoring and
enforcement costs where it was found to have a positive association with the decision on
where to sell [13]. The nature of payment arrangements should influence the choice of
market outlet because of the costs involved in chasing payments and enforcing contracts,
as such market outlets that offer less difficulty in obtaining payments should be preferred.

62
Table 11: Negotiation and bargaining cost factors influencing choice of marketing channel
Factor Sign Study
1 Payment delay Sig+
Sig-
[2, 13]
[6]
2 Bargaining power Sig-
Sig+
[2, 18]
[6]
The strong influence of bargaining power was found in three studies, with two studies
reporting that it had a negative influence on farmers’ decisions of where to sell [2, 18] and
one study reporting a positive influence [6]. Where price information is not transparent,
sellers find it difficult to get leverage on prices (Kassa et al., 2017), such a situation can
result in buyers dictating prices to the detriment of sellers, thereby suggesting that the
seller has weak bargaining power (Rutten et al., 2017). Sellers may therefore opt to trade
in a marketplace where price information is transparent or where it is possible to get
leverage on quantity sold to arrive at a more favourable price.
2.4.2.3 Monitoring and enforcement costs
Table 12 presents the factors related to monitoring and enforcement costs, three studies
found that uncertainty in grading had a positive influence on the decision of where to sell
[1, 2, 13]. Expectations on the grades or standards set at a marketplace also influence
decisions, particularly where grading is not clear or fluctuates due to client requirements
(Salviano and Wander, 2015).

63
Table 12: Monitoring and enforcement cost factors influencing choice of marketing
channel
Factor Sign Study
1 Grading Uncertainty Sig+ [1,2,13]
2 Access to means of transport Sig- [6,18]
Two other studies found a negative influence with accessing transport on farmers’
decisions about where to sell [6, 18]. Where longer distances are involved, farmers will
opt to sell closer to the farm or at the farm-gate where buyers travel to buy. Chigusiwa et
al. (2013) suggests that the type of product to be sold coupled with distance influences the
choice of where to sell. In other words, farm products that are lighter and require less
space can be transported cheaply as opposed to bulkier items like cattle. Also, most
farmers rely on public transport to move goods to market; however, such transport
services are often unreliable and farmers may opt to sell at markets that carry lower
transport costs.
2.5 Findings from probability and extent of smallholder market participation
decisions
Table 13 presents the study characteristics of probability and extent of smallholder market
participation. Three studies employed a probit model to investigate smallholder market
participation decisions [7, 11, and 15]. Two studies employed the logit model to
investigate smallholder market participation decisions [8, 20]. Two studies employed
Cragg’s double hurdle model in investigating smallholder market participation and the
extent of participation decisions [14, 24]. Five studies employed the Heckman model in
investigating smallholder market participation and extent of participation decision [3, 9,
10, 16, 23]. Two studies employed the Tobit model in investigating the extent of market
participation decisions of smallholder farmers [21, 25].

64
Table 13: Characteristics of studies on probability and extent of smallholder market
participation decisions
Study Model Probability of market
participation
Extent of Market
Participation
[7] Maliu, S.K. et al
(2012)
probit Participation in Indigenous
poultry markets in Kenya
[11] Ohen, S.B., Etuk,
E.A., & Onoja, J.A.,
(2013)
probit Participation in rice markets
in Nigeria
[15] Ohen, S.B., Umeze,
G.E., & Cobham,
M.E., (2014)
probit Participation in Cucumber
markets in Nigeria
[8] Onoja, A.O. et al.,
(2012)
logit Participation in Fish markets
in Nigeria
[20] Oseboye, S.O., & Aye,
G.C., (2014)
logit Participation in Tomato
markets in Nigeria
[14] Abu, B.M., Osei-
Asare, Y.B., & Wayo,
S., (2014)
Cragg’s DHM Participation in maize
markets in Ghana
Extent of Participation
in maize markets in
Ghana
[24] Achandi, E.L., &
Mujawamariya, G.,
(2016)
Cragg’s DHM Participation in rice markets
in Tanzania
Extent of Participation
in rice markets in
Tanzania
[3] Jagwe, J., Machete,
C., & Ouma, E.,
(2010)
Heckman’s
TSM
Participation in Banana
markets in Great lakes Region
(Burundi, Rwanda, DRC)
Extent of Participation
in Great lakes Region
(Burundi, Rwanda,
DRC)
[9] Bwalya, R., Mugisha,
J., & Hyuha, T.,
(2013)
Heckman’s
TSM
Participation in maize
markets in Zambia
Extent of Participation
in maize markets in
Zambia
[10] Kuma, B. et al.,
(2013)
Heckman’s
TSM
Participation in Milk markets
in Ethiopia
Extent of Participation
in milk markets in
Ethiopia
[16] Sebatta, C. et al.,
(2014)
Heckman’s
TSM
Participation in Potato
markets in Uganda
Extent of Participation
in Potato markets in
Uganda
[23] Lefebo, N. et al.,
(2016)
Heckman’s
TSM
Participation in Kocho
markets in Ethiopia
Extent of Participation
in Kocho markets in
Ethiopia

65
[21] Abu, B.M., (2015) Tobit Extent of Participation
in Groundnut markets
in Ghana
[25] Honja, T., Geta, E., &
Mitiku, A., (2017)
Tobit Extent of Participation
in mango markets in
Ethiopia

66
2.5.1 Socio-economics factors influencing probability of market participation
The findings on the association of socio-economic factors with the decision to participate
in a given market are provided in Table 14. The findings highlight a strong association
between quantity produced and the decision to participate in a given market, with six
studies [9, 10, 11, 14, 15, 23] reporting a positive influence. The findings support the
notion that farmers who produce a marketable surplus are more market oriented (Selowa et
al., 2015).
Farm size also has a strong association with the decision to participate in a given market,
with four studies [3, 11, 14, 24] reporting a positive influence and one study [10] a
negative influence. Explanations for the positive influence highlighted the important role
of a large area of land on the decision to commercialize, particularly for staple crops that
often require large areas for cultivation. The study with the negative influence focused on
dairy cattle, which do not require a large land area since they are often reared intensively
indoors. This suggests that the type and purpose of the agricultural activities influences the
effect of farm size (Barrett, 2008).
Four studies reported a positive influence of price on the market participation decision, the
prospect of higher prices is a motivating factor in deciding to participate in a given market
(Omiti et al., 2009). The law of supply can explain this finding where, as price increases,
quantity supplied also increases. Three studies [7, 10, 23], reported a positive influence of
flock size on the discrete decision to participate in a given market, implying that the higher
the flock size, the more market oriented farmers are likely to be. The findings on age
influencing farmers’ decision to participate in a market were mixed. Two studies, [10, 16]
reported a positive influence, and two other studies reported a negative influence [14, 23].
The positive influence means that probability of engaging in commercial agriculture is
more likely as farmers increase in age while the negative influence means that younger
farmers were more market oriented.
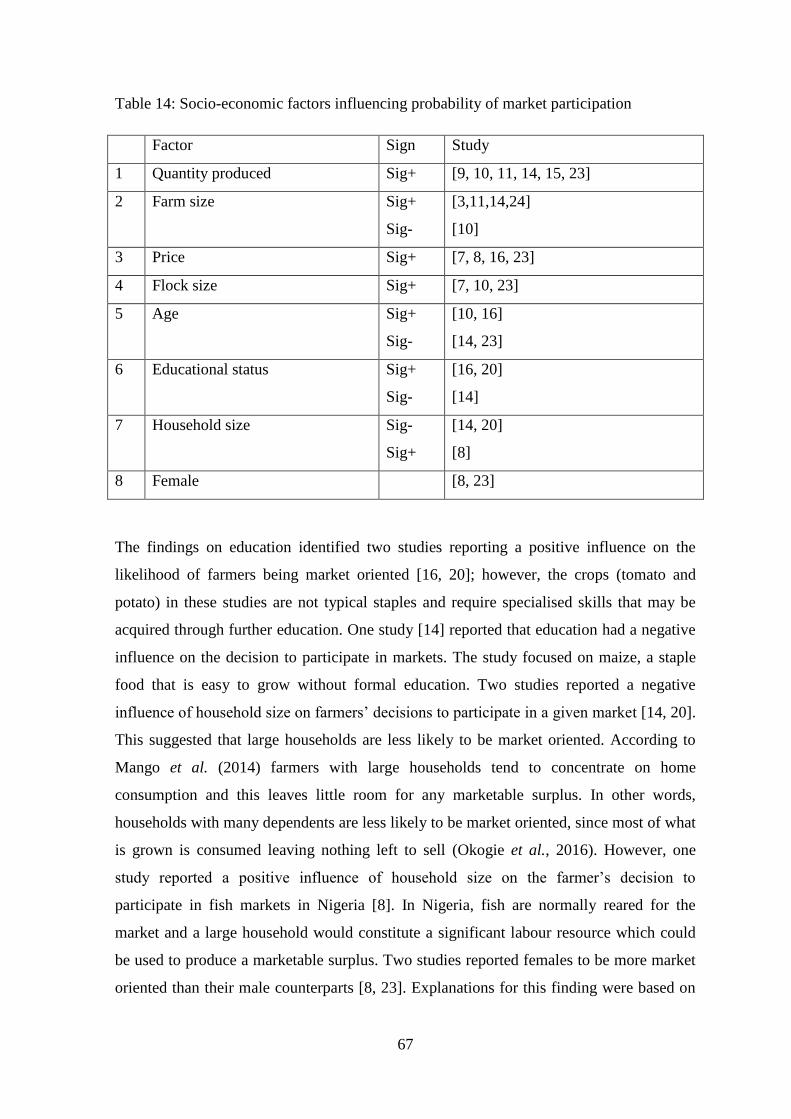
67
Table 14: Socio-economic factors influencing probability of market participation
Factor Sign Study
1 Quantity produced Sig+ [9, 10, 11, 14, 15, 23]
2 Farm size Sig+
Sig-
[3,11,14,24]
[10]
3 Price Sig+ [7, 8, 16, 23]
4 Flock size Sig+ [7, 10, 23]
5 Age Sig+
Sig-
[10, 16]
[14, 23]
6 Educational status Sig+
Sig-
[16, 20]
[14]
7 Household size Sig-
Sig+
[14, 20]
[8]
8 Female [8, 23]
The findings on education identified two studies reporting a positive influence on the
likelihood of farmers being market oriented [16, 20]; however, the crops (tomato and
potato) in these studies are not typical staples and require specialised skills that may be
acquired through further education. One study [14] reported that education had a negative
influence on the decision to participate in markets. The study focused on maize, a staple
food that is easy to grow without formal education. Two studies reported a negative
influence of household size on farmers’ decisions to participate in a given market [14, 20].
This suggested that large households are less likely to be market oriented. According to
Mango et al. (2014) farmers with large households tend to concentrate on home
consumption and this leaves little room for any marketable surplus. In other words,
households with many dependents are less likely to be market oriented, since most of what
is grown is consumed leaving nothing left to sell (Okogie et al., 2016). However, one
study reported a positive influence of household size on the farmer’s decision to
participate in fish markets in Nigeria [8]. In Nigeria, fish are normally reared for the
market and a large household would constitute a significant labour resource which could
be used to produce a marketable surplus. Two studies reported females to be more market
oriented than their male counterparts [8, 23]. Explanations for this finding were based on

68
the gendered roles of carrying out certain agricultural activities within the context of the
study.
2.5.2 Transaction costs factors influencing probability of market participation
The findings on the links between transaction costs and the decision to participate in a
given market are provided in Table 15. These findings highlight a strong association
between access to market information and distance to market, with six studies finding that
this influences participation. Five studies reported a positive influence of access to market
information [3, 11, 14, 20, 23] and one study reported a negative influence [15], in other
words, households having access to market information such as on prices, are more likely
to participate in a given market. Similar findings have been observed by Lwesya and
Kibambila (2017) where in information from extension agents enhanced farmers’
decisions to participate in a market. Also, Omiti et al. (2009) identified informal
information sources, particularly in rural communities to positively influence market
participation decisions.
Table 15: Transaction cost factors influencing probability of market participation
Factor Sig Study
1 Access to market information Sig+
Sig-
[3, 11, 14, 20, 23]
[15]
2 Distance to Market Sig-
Sig+
[8, 9, 15, 20, 24]
[16]
3 Member of a farmer group Sig+ [3, 11, 14]
4 Access to non-farm income Sig- [16, 23]
5 Existence of market in the village Sig+ [11, 16]
In addition, five studies reported the negative influence of distance to market [8, 9, 15, 20,
24], and one study reported a positive influence [16]. The negative influence implied that
farmers closer to market are more market oriented. Close proximity to a market reduces
transport costs and improves information flow thereby creating an enabling environment
for the exchange of goods and services. Three studies reported the positive influence of
being a member of a farmer group [3, 11, 14]. According to Megyesi et al. (2010)

69
collective action enhances social capital and cooperation, enabling farmers to join forces
and generate a marketable surplus that may not have been possible as individuals.
Two studies [16, 23] reported the negative influence of non-farm income on the decision
to participate. Explanations in these papers suggest that farmers who earn less from non-
farm income are more market oriented as this frees up time for them to engage in farming
and since they earn less from non-farm work, they spend more time to produce a
marketable surplus. Therefore, farmers who earn less non-farm income tend to earn more
farm income. Two studies [11, 16], reported that having a market existing in the village
positively influenced farmers market participation decisions. This finding aligns with the
findings on distance to market, where farmers closer to a market were found to be more
market oriented.
2.6 Findings from extent of smallholder market participation
2.6.1 Socio-economic factors influencing extent of market participation
The findings on the association between various socio-economic factors and extent of
market participation are provided in Table 16. Quantity produced (output) has a strong
association with a farmer’s decision about their extent of participation, with five studies
reporting a positive influence [10, 14, 21, 23, 25]. This suggests that production volume
links to quantity sold, as the extent of market participation is measured by the quantity
sold in a defined period (Apind et al., 2015; Lefebo et al., 2016a). Household size was
found to be strongly associated with the extent of participation in three studies [3, 9, 14].
Takane (2008) suggests that when household members are mostly adults, then the adults
serve as a veritable source of labour. In another vein, where household members are young
or fully dependent, the need to satisfy household needs is a motivation to increase
production and marketing activities. Two studies [10, 25] reported a negative influence of
household size on the extent of market participation and explanations for the findings
highlight high levels of domestic consumption that reduce the quantity available for the
market (Olayemi, 2012).
Two studies [9, 21] reported that experience has a positive influence on the extent of
market participation. This means that the longer a farmer spends focusing on a farm

70
enterprise, the more he or she is likely to produce. Ainembabazi and Mugisha (2013)
argue that farmers have developed important skills over a long period which makes them
better able to take advantage of market opportunities and produce a marketable surplus.
However, one study [10] reported a negative influence of experience on the extent of
market participation. Explanations for this finding suggested that experienced farmers tend
to be older which limits their ability to deliver higher levels of production.
Three studies [14, 21, 23] reported a negative influence of age on the extent of market
participation. This suggests that younger farmers are more likely to produce and sell more.
This may be because younger farmers are more energetic and more willing to take risks
and explore markets further afield. In addition, three studies [14, 21, 23] also reported that
females are more market oriented: in other words, women produced and sold more than
their male counterparts. The study findings highlight the role of women in the production
and marketing of agricultural products. According to Ogunlela and Mukhtar (2009)
cultural considerations make certain type of agricultural activities gender specific.
Table 16: Socio-economic factors influencing extent of market participation
Factor Sign Study
1 Quantity produced Sig+ [10, 14, 21, 23, 25]
2 Household Size Sig+
Sig-
[3, 9, 14]
[10, 25]
3 Experience Sig+
Sig-
[9, 21]
[10]
4 Age Sig- [14, 21, 23]
5 female [14, 21, 23]
6 price Sig+ [3, 14, 23]
7 Household income Sig+ [14, 21]
8 Male [16, 25]
Three studies [3, 14, 23] reported a positive influence of price on the extent of market
participation. As price increases, farmers tend to increase production and therefore sales.
Two studies [14, 21] reported a positive influence of household income on the extent to
which farmers participate in a market. As household income rises, there is a tendency to
increase production and therefore sales, possibly due to the additional income available for
investment in the farm enterprise. Male farmers were found to influence the extent of
market participation in two studies [16, 25]. In explaining this finding, the context of the
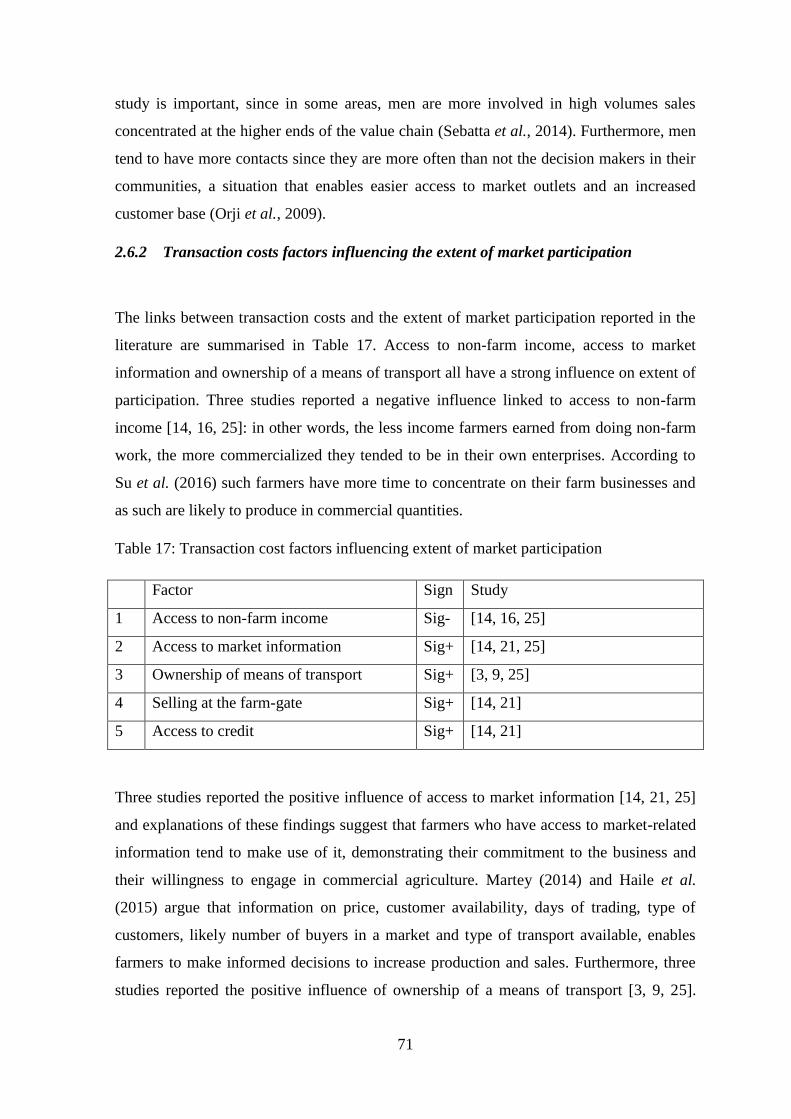
71
study is important, since in some areas, men are more involved in high volumes sales
concentrated at the higher ends of the value chain (Sebatta et al., 2014). Furthermore, men
tend to have more contacts since they are more often than not the decision makers in their
communities, a situation that enables easier access to market outlets and an increased
customer base (Orji et al., 2009).
2.6.2 Transaction costs factors influencing the extent of market participation
The links between transaction costs and the extent of market participation reported in the
literature are summarised in Table 17. Access to non-farm income, access to market
information and ownership of a means of transport all have a strong influence on extent of
participation. Three studies reported a negative influence linked to access to non-farm
income [14, 16, 25]: in other words, the less income farmers earned from doing non-farm
work, the more commercialized they tended to be in their own enterprises. According to
Su et al. (2016) such farmers have more time to concentrate on their farm businesses and
as such are likely to produce in commercial quantities.
Table 17: Transaction cost factors influencing extent of market participation
Factor Sign Study
1 Access to non-farm income Sig- [14, 16, 25]
2 Access to market information Sig+ [14, 21, 25]
3 Ownership of means of transport Sig+ [3, 9, 25]
4 Selling at the farm-gate Sig+ [14, 21]
5 Access to credit Sig+ [14, 21]
Three studies reported the positive influence of access to market information [14, 21, 25]
and explanations of these findings suggest that farmers who have access to market-related
information tend to make use of it, demonstrating their commitment to the business and
their willingness to engage in commercial agriculture. Martey (2014) and Haile et al.
(2015) argue that information on price, customer availability, days of trading, type of
customers, likely number of buyers in a market and type of transport available, enables
farmers to make informed decisions to increase production and sales. Furthermore, three
studies reported the positive influence of ownership of a means of transport [3, 9, 25].
72
Having transport enables a farmer to move large quantities to the market more quickly,
thereby saving valuable time and promoting higher sales volumes
Two studies found that selling at the farm-gate positively influenced the extent to which
farmers participate in a given market [14, 21]. Selling at the farm-gate is often associated
with a strong bargaining and negotiating position for sellers, since buyers travel to make a
purchase and are therefore more willing to close a deal (Rutten et al., 2017). In addition,
farmers are likely to sell at a reduced price but in larger quantities at the farm-gate, a
factor that seems to favour both buyers and sellers. Furthermore, two studies reported that
access to credit positively influences the extent of market participation [14, 21]. Kiplimo
et al. (2015) and Motsoari et al. (2015) suggest that credit enables farmers to increase their
stocks and expand rapidly, thereby reducing the costs involved in dealing with small
volume transactions.

73
2.7 Discussion
A systematic review was conducted to examine the factors influencing smallholder market
participation decisions focusing on probability of market participation, extent of
participation and choice of market channel. The review identified 25 studies that satisfied
the inclusion criteria, the studies varied in terms of measurement, model specification,
population, farm activity and settings and, as such, any conclusions drawn from the review
should be interpreted in context.
2.7.1 Principal findings and research gaps
The evidence drawn from the review shows that a variety of individual, socio-economic
and transaction costs factors play an important role in influencing smallholder market
participation decisions. The findings show that the choice of a farmer selling through a
particular market channel can be examined using a variety of models. In employing the
Tobit model, factors influencing the decision to sell through a particular market channel
and the extent of sale are assumed to be the same. On the other hand, two-stage models
assume that the factors influencing the decision to sell through a particular market channel
and the extent of sale vary: in other words, the decision to sell through a market channel
and the extent of sale through that same channel might be influenced by different factors.
The findings from the review corroborate this assumption across the three studies [6, 18,
22] that address choice of marketing channel using two-stage models. The probit and logit
models only address factors influencing the decision to sell through a particular market
channel and ignore extent of sales through that market channel.
The transaction costs factors that were found to influence the choice of marketing channel
for the eleven studies covered in the review, were grouped under three categories as
follows: (1) information and search costs incurred before a transaction is made; (2)
negotiation or bargaining costs incurred during a transaction; and (3) monitoring and
enforcement costs incurred after a transaction is made. The review found out that farmers
incurred transaction costs before, during and after carrying out a transaction and these
costs, alongside individual and socio-economic factors, influenced a farmer’ decision to
sell through that market channel as opposed to alternative market channels.

74
The review also identified an important gap in the current literature on smallholder choice
of marketing channel with regard to selling through the farm-gate: no study addressed this
choice of market channel. That is to say, no study used the proportion sold through the
farm-gate as a dependent variable, nor did studies that employed two-stage models apply a
binary dummy dependent variable in the first-hurdle decision, where selling through the
farm-gate took the value of 1, neither was quantity sold through the farm-gate the
dependent variable in the second hurdle decision. Accordingly, an investigation of
transaction costs factors influencing choice of selling through the farm-gate has not been
addressed in the current literature. In addition, poultry as a farm activity has not been
addressed in the smallholder market choice literature.
Another gap in the current smallholder market participation literature is the clear lack of
qualitative evidence in the studies reviewed. This suggests that quantitative evidence is
considered sufficient in addressing, identifying or explaining transaction costs factors
influencing market participation. However, this may not be the case considering the
hidden nature of transaction costs and the difficulties involved in measuring or separating
transaction costs from other marketing or production costs and so quantitative evidence
may not be sufficient to reveal subtle factors that might also contribute to smallholder
market participation decisions.
Furthermore, findings from the 25 studies reviewed clearly show that there is evidence of
individual, socio-economic and transaction costs factors that influence market
participation decisions and choice of market channel. However, an in-depth understanding
of how and why the factors that might influence market participation decision making is
missing in the literature, as clarifications on attitudes, beliefs and preferences that
underpin market participation decisions are not captured by the current evidence.
In addition, since individual, socio-economic and transaction costs factors influence
market participation decisions, then quantitative evidence alone may not be sufficient to
provide valuable insights to inform policy and practice. A mixed methods research
strategy where quantitative and qualitative evidence are collected, analysed and integrated
may provide a more holistic and in-depth understanding of factors that could influence
smallholder market participation decisions.
Finally, only one study in the review looked at poultry; however, its focus was on
indigenous poultry breeds in Kenya and no study addressed exotic poultry breeds which

75
have a stronger commercial appeal than indigenous or traditional breeds. It is therefore
expected that farmers dealing in exotic breeds will be more market oriented and may
require different policy measures to support their enterprises, a gap that this study will
address.

76
2.7.2 Review Conclusion
The results of this systematic review highlight relevant factors that influence smallholder
market participation. While the studies reviewed have contextual bases, some key factors
cut across the studies and show the relevance of these factors in explaining smallholder
market-participation decisions. The lack of a clear definition of who is considered a
‘smallholder’ farmer in the studies is a limitation, since the type of farmer is likely to
influence how TCs influence market participation, i.e. larger farms tend to face lower TCs
than small-scale farmers but the definition of what a ‘large farm’ is varies across studies.
This clearly suggests that the lack of a consistent definition of ‘smallholder’ may limit the
corroboration of findings across studies.
Nevertheless, the systematic review provides evidence of the frequency of ‘price
uncertainty’, as information and search costs influence farmers’ decisions on where to sell.
Since farmers are concerned about prices, a market location where price information exists
lowers price uncertainty, which makes it easier for smooth transactions to occur. The
evidence in the literature suggests that ‘access to means of information’, either through
marketing experts, government channels or mass media, influences farmers’ market
choices. In this regard, factors such as ‘farmer to farmer information access’ and
‘ownership of a mobile phone’ are relevant to this study.
In addition, evidence of negotiating and bargaining costs influencing a farmer’s choice of
where to sell was expressed through ‘payment delay’ and ‘bargaining power’. In other
words, farmers tend to avoid markets without a cash and carry operation, as such markets
allow payment at a future date which is often inconvenient for a small scale business. In
this study, the factor capturing bargaining power is ‘price expectation’ i.e. whether or not
farmers considered their price to be the best price they could sell for. The evidence
suggests that institutions that make pricing information transparent lower TCs. The
systematic review also highlights evidence of monitoring and enforcement costs. In
particular, the factor ‘grading uncertainty’ was emphasised in markets where client
requirements often change at short notice. This makes it difficult for farmers to keep up
with consumer tastes and preferences. Live poultry clearly fits into this category, whereby
besides weight, other parameters such as plumage colour and comb type are used for
grading.

77
Findings on choice of where to sell emphasise the importance of timely and relevant
market information in order to reduce the uncertainties that arise due to the weak
institutional arrangements governing exchange of information. In this study, ‘repeat sales’
are used as a factor to capture monitoring and enforcement costs, since repeat sales over
time reduce uncertainty in transactions.
Equally, across the studies reviewed, the decision to participate in a market was found to
be strongly influenced by the following factors: ‘access to market information’; ‘distance
to market’; and ‘membership of a farmers’ group. Accordingly, drawing from the review,
in the present study, the factor ‘access to veterinary services’ is used to capture market
information related to health access, while ‘time taken to reach the nearest market’
and’tarred road’ were employed to capture proximity. Importantly, the review found that
the time constraint was of great importance in deciding on the extent of market
participation. The factor used to capture ‘time constraint’ was ‘access to non-farm
income’. In other words, farmers who could access non-farm income had less time to earn
farm-related income and, as such, were less engaged in the farm business and more
engaged in some form of non-farm economic activities. This study also employed the
factor ‘access to non-farm income’ with similar results identified in the review.
2.7.3 Review strengths and limitations
This systematic review was effective in extracting information particularly on the design
and implementation of studies included in the review. However, the search was time
consuming because of the extra care that was required to read and understand studies with
different methodologies and results. In addition, a large number of otherwise potentially
interesting papers had to be discarded because of the exclusion criteria, though this
ensured that the scope of the review was feasible in the time available. Often, findings
were rather broad or overly technical, making it hard to draw meaningful policy
conclusions.

78
Table 18: List of studies included in the review
Study
Identification
Studies included in the systematic review
[1] Hobbs J.E., 1997. Measuring the Importance of Transaction Costs in
Cattle Marketing. American Journal of Agricultural Economics, 79,
p.1083-1095
[2] Gong Wen. et al., 2006. Transaction costs and cattle farmer’s choice of
marketing channels in China. Management Research News, 30 (1), p.47-
56.
[3] Jagwe, J., Machete, C., & Ouma, E., 2010. Transaction costs and
smallholder farmer’s participation in banana markets in the Great lakes
Region of Burundi, Rwanda and the Democratic Republic of Congo.
African Journal of Agricultural and Resource Economics, 6 (1), p.302-
317.
[4] Woldie, G.A. & Nuppenau, E.A., 2011. A Contribution to Transaction
Costs: Evidence from Banana Markets in Ethiopia. Agribusiness, 27 (4),
p.493-508.
[5] Jagwe, J.N. & Machete, C., 2011. Effects of Transaction Costs on Choice
of Selling Point: A Case of Smallholder Banana Growers in the Great
Lakes Region of Central Africa. Agrekon: Agricultural Economics
Research, Policy and Practice in Southern Africa, 50 (3), p.109-123.
[6] Shiimi, T., Taljaard, P.R., & Jordaan, H., 2012. Transaction costs and
cattle farmers’ choice of marketing channel in North-Central Namibia.
Agrekon: Agricultural Economics Research, Policy and Practice in
Southern Africa, 51 (1), p.42-58.
79
[7] Mailu, S.K. et al., 2012. Influence of prices on market participation
decisions of Indigenous poultry farmers in four districts of Eastern
Province, Kenya. Journal of Agriculture and Social Research, 12 (1), p.1-
10.
[8] Onoja, A.O. et al., 2012. Determinants of Market Participation in Nigeria
Small-Scale Fishery Sector: Evidence from Niger Delta Region.
Consilience: The Journal of Sustainable Development, 9 (1), p.69-84.
[9] Bwalya, R., Mugisha, J., & Hyuha, T., 2013. Transaction costs and
smallholder household access to maize markets in Zambia. Journal of
Development and Agricultural Economics, 8 (9), p.328-336.
[10] Kuma, B. et al., 2013. Factors affecting milk market participation and
Volume of Supply in Ethiopia. Asian Journal of Rural Development, p.1-
15.
[11] Ohen, S.B., Etuk, E.A., & Onoja, J.A., 2013. Analysis of market
participation by rice farmers in Southern Nigeria. Journal of Economics
and Sustainable Development, 4 (7), p.6-11.
[12] Edoge, E.D., 2014. Determinants of choice of distribution channels by
fish farmers in Ughelli North local government area of Delta state,
Nigeria. Asian Journal of Agriculture and Food Sciences, 2 (5), p.409-
419.
[13] Lijia, W., & Xuexi, H., 2014. Grower’s Selling Behaviour: Transaction
Cost Comparison Analysis. Agricultural Economics Review, 15 (2), p.5-
28.
[14] Abu, B.M., Osei-Asare, Y.B., & Wayo, S., 2014. Market participation of
smallholder maize farmers in the upper west region of Ghana. African
Journal of Agricultural Research, 9 (31), p.2427-2435.
80
[15] Ohen, S.B., Umeze, G.E., & Cobham, M.E., 2014. Determinants of
market participation by cucumber farmers in Odukpani local government
area, Cross River state, Nigeria. Journal of Economics and Sustainable
Development, 5 (2), p.188-196.
[16] Sebatta, C. et al., 2014. Smallholder farmers’ decision and level of
participation in the potato market in Uganda. Modern Economy, 5, p.895-
906.
[17] Natawidjaja, R.S. et al., 2014. Improving the participation of smallholder
mango farmers in modern retail channels in Indonesia. The International
Review of Retail, Distribution and Consumer Research, 24 (5), p.564-
580.
[18] Mabuza, M.L., Ortmann, G., & Wale, E., 2014. Effects of transaction
costs on mushroom producers’ choice of marketing channels:
Implications for access to agricultural markets in Swaziland. South
African Journal of Economic and management sciences, 17 (2), p.207-
219.
[19] Tavva, S. et al., 2014. Factors affecting the goat producers’ choice of
market place and marketing efficiency in Afghanistan. The Indian
Journal of animal sciences, 84 (12), p.1309-1314.
[20] Oseboye, S.O., & Aye, G.C., 2014. Transaction costs and marketing
decision: a case study of smallholder tomato farmers in Makurdi, Nigeria.
Urban, Planning and Transport Research: An Open Access Journal, 2
(1), p.333-340.
[21] Abu, B.M., 2015. Groundnut Market participation in the Upper West
Region of Ghana. Ghana Journal of Development Studies, 12 (1), p.106-
124.
81
[22] Harrizon, K. et al., 2016. Determinants of tea marketing channel choice
and sales Intensity among smallholder farmers in Kericho District,
Kenya. Journal of Economics and Sustainable Development, 7 (7), p.105-
114.
[23] Lefebo, N. et al., 2016. Determinants of market participation among
Kocho producers in Hadiya Zone, Southern Region, Ethiopia. Journal of
Marketing and Consumer Research, 21, p.41-49.
[24] Achandi, E.L., & Mujawamariya, G., 2016. Market participation by
smallholder rice farmers in Tanzania: double hurdle analysis. Studies in
Agricultural Economics, 118, p.112-115.
[25] Honja, T., Geta, E., & Mitiku, A., 2017. Determinants of Intensity of
Market participation of smallholder mango producers: The case of Boloso
Bombe Woreda, Wolaita zone, Southern Ethiopia. Journal of Marketing
and Consumer Research, 32, p.56-63.

82
Chapter 3. Research Methodologies
“I only wish that the first really worthwhile discovery of [social] science would be that it
recognized that the unmeasurable is really what they‟re really fighting to understand, and
that the measurable is only a servant of the unmeasurable; that everything that man
[decides] must be fundamentally unmeasurable” Louis Kahn
3.0 Research Methodologies
3.1 Introduction
This chapter provides a description of the explanatory sequential mixed methods design
applied in the present study. The quantitative phase is based on data from a survey of
smallholder poultry farmers and the qualitative phase is based on data from 20 semi-
structured interviews, which add richness to the findings in the quantitative phase and are
significant predictors of market participation.
The remainder of this chapter is organised into six sections; research and objectives are
outlined in section 3.2, the rationale for the mixed methods study are explained in section
3.3, the explanatory sequential mixed methods design are described in section 3.4, while
the quantitative phase design is described in section 3.5. The qualitative phase begins in
section 3.6 and a summary of the chapter is provided in section 3.7.
3.2 Research aim and objectives
As outlined in chapter one, the aim of this study was to investigate transaction costs
factors influencing market participation decisions of smallholder poultry farmers in
Nigeria.
Accordingly, this chapter addresses the following specific objectives, namely:

83
Quantitative Phase
1. To determine the influence of transaction costs on the probability of market
participation by smallholder poultry farmers.
2. To determine the influence of transaction costs on the extent of market participation
by smallholder poultry farmers.
3. To determine the influence of transaction costs on the decision to sell live poultry at
the farm-gate.
Qualitative phase
4. To explore the perceived influences of transaction costs on the decision to participate
in poultry markets.
3.3 Rationale for mixed methods research
In order to achieve the study objectives, a mixed methods research strategy is adopted
(Lieberman, 2005; Teddlie and Yu, 2007). Mixed methods are defined as a research
approach in which quantitative and qualitative data are collected, analysed and integrated
or mixed together within a single investigation (Johnson and Onwuegbuzie, 2004; Johnson
et al., 2007).
A key point to note is the emphasis on ‘mixing’; merely incorporating quantitative and
qualitative components is not a mixed method research. This clearly distinguishes mixed
methods from multi-methods research that may incorporate only quantitative or qualitative
components or incorporate both quantitative and qualitative components without the
element of mixing (Bryman, 2007a). By adopting a mixed method approach in this study
the researcher is driven by the need to fully explore the determinants of smallholder
poultry market participation; this forms the rationale for the use of both quantitative and
qualitative methods. By combining quantitative and qualitative methods a deeper and
clearer understanding of the research topic is made possible as opposed to relying on a
single research method.
Furthermore, taking into account information drawn from both circumstantial and
experiential evidence, the objectives of this study are achievable from two perspectives.
First, quantitative methods are used to identify the factors that impact on the decision and

84
level of poultry market participation; and second, qualitative methods are used to further
explore ‘why’ and ‘how’ these factors might impact on the decision and level of market
participation. By combining both quantitative and qualitative methods, a more thorough
understanding of the research topic can be achieved, compared to that which would be
possible using a single method. In addition, Onwuegbuzie and Johnson (2006) and Fakis
et al. (2014) argue that integrating quantitative and qualitative methods illustrates how the
contextual and in-depth nature of qualitative findings can be used to complement
quantitative findings drawn from a more representative and generalised sample.
3.4 Explanatory sequential mixed methods design
Although the literature on mixed methods research identifies various ways of combining
quantitative and qualitative methods (Cronholm and Hjalmarsson, 2011; Heyvaert et al.,
2013), the mixed method that best satisfies the objectives of this study is the explanatory
sequential mixed method design (Subedi, 2016). This design is also known as the
qualitative follow-up design or sequential mixed methods design (Morgan, 1998). The
goal of the explanatory sequential design is to apply qualitative data to further elucidate
the findings of the quantitative analysis.
The explanatory sequential design comprises two phases of data collection and analysis;
with the first phase being quantitative, followed by a qualitative phase (Cameron, 2009;
Creswell, 2013). The quantitative phase, as the name suggests, involves quantitative data
collection and analysis to obtain inferential results on the research problem. The second
phase involves collecting qualitative data to explain in greater depth the inferential results
obtained from the initial quantitative phase (Hanson et al., 2005). Both phases are
connected, or mixed, at an intermediate stage (Tashakkori A and Teddlie, 2003) where the
‘mixing’ occurs, i.e. in-between the quantitative and qualitative phases where significant
findings from quantitative phase are identified and selected for further qualitative analysis.
The quantitative findings therefore form the basis for the design of the qualitative phase.
At the completion of the qualitative phase, findings from both phases are further mixed
and synthesised to give a comprehensive picture of the research problem.
As noted in the review of literature (Chapter 2) no studies have been found that apply
mixed methods or adopt the explanatory sequential mixed methods design to explore
market participation. However, some empirical studies in health (Hartnell, 2011),

85
sociology (Stewart, 2011) and education (Kellner, 2012) have employed the explanatory
sequential mixed methods approach to demonstrate its benefits. For example; Stewart
(2011) used an exploratory sequential mixed methods design to conduct a study on the
determinants of recycling among households in Scotland using data from the Scottish
household survey, and demonstrated that households with more than two people were
more likely to recycle. To explain why this pattern might exist, diary interviews were
conducted with households and the resulting data suggested that domestic recycling is
performed within a social context (ibid. 166) implying that attitudes towards recycling
tend to be influenced by household members. Thus, by applying both quantitative and
qualitative methods, the study demonstrated how qualitative data can help to explain why
households with more than two people were more likely to recycle (ibid. 167).
Hartnell (2011) conducted a health study employing explanatory sequential mixed
methods to explore the impact of social inequalities on the health status of women using
data from a 2004 health survey in England. The study identified that significant health
inequalities existed between Pakistani and white English women with Pakistani women
experiencing the greatest disadvantage in health (ibid.189). To explore further why this
might be so, 20 semi-structured in-depth interviews were conducted among Pakistani and
white English women (ibid.190.) Based on the interview findings, possible reasons
accounting for the poor health status of Pakistani women relative to white English women
were identified to be rooted in overlapping systems of discrimination (ibid, 191).
These studies show the potential importance of the use of explanatory sequential mixed
methods in empirical research projects dealing with the lived experience of individuals. By
mixing quantitative and qualitative methods contextual explanations of quantitative
findings are made possible. It is also worth noting that the qualitative findings from both
studies are not easily quantifiable and may not have been observed without the use of a
sequential mixed methods design (Cronholm and Hjalmarsson, 2011).
In this study the explanatory sequential mixed methods design is employed to identify and
explain the role of transaction costs factors influencing smallholder poultry market
participation. The initial phase of the study is quantitative and based on primary data
collected from 361 smallholder poultry farmers and analysed to identify transaction costs
factors influencing smallholder poultry sales. Afterwards, statistically significant factors
are selected for further exploration using qualitative methods.

86
Thus, the explanatory sequential design utilises quantitative findings for further
exploration within the context of the study. The exploration is based on semi-structured
interviews where 20 smallholder poultry farmers are purposively selected using criteria
described in section 3.12 below.
Findings from both the quantitative and qualitative phases are then combined to provide a
contextually comprehensive understanding of the transaction costs factors influencing
smallholder market participation decisions.
A diagrammatic model of the explanatory sequential mixed method research is presented
in Figure 8 and gives an illustrated sequence of the phases and stages where ‘mixing’
occurs (Tashakkori A and Teddlie, 2003; Ivankova et al., 2006; Cameron, 2009).
Also, to offer a clearer understanding of the combination of mixed methods designs Morse
(1991) developed a mixed methods notation system by using uppercase and lower case
alphabets to denote the possible mixed methods combinations identified as
QUAN+QUAL; QUAN→ qual and QUAL→ quan. These notations refer to the weight or
dominant status attached to each phase in the mixed method design, for example, the
uppercase; QUAN+QUAL mean that equal weight is assigned to both phases. Generally,
the research objectives determines the mixed method design and researchers may choose
to prioritise the qualitative phase (Pritchett, 2012) or assign equal weights to both phases
(Eaves and Walton, 2013).
With respect to the explanatory sequential design denoted by QUAN→ qual, the
quantitative phase is dominant as represented by the uppercase QUAN and is prioritised
over the qualitative phase which is denoted in lowercase letters (qual).
Finally, the explanatory sequential design is adopted for the study because it is consistent
with the research aims and objectives. According to Ivankova et al. (2006) and Cronholm
and Hjalmarsson (2011) an explanatory sequential design is appropriate when the
parameters to be investigated are already available, i.e. can be inferred from the literature
as is the case in this study. The use of explanatory sequential mixed methods designs is
therefore an important contribution of this study.

87
Figure 8: Diagram of exploratory sequential design employed for this study
Phases Procedure Product
Quantitative Data Collection
Cross-sectional
questionnaire based
survey (n=361)
Numeric data
Quantitative Data Analysis
Data entry and cleaning
Sample selection models
Cragg’s Model
Two-limit tobit model
Ms Excel and STATA 13.1
software
Descriptive Statistics
Coefficient estimates
Integration of
the Quantitative
and Qualitative
results
Identification of significant
coefficients.
Purposive sampling of poultry
farmers
Developing interview
questions.
Cases (n=20)
Interview protocol
Qualitative Data collection Individual in-depth interviews
with 20 poultry farmers.
Text data
Interview transcripts
QUALITATIVE Data Analysis
Use of pseudonyms
Transcription of data
Description of data
Use of quotations.
Contextual and
supporting findings.
Connecting the
Quantitative and
Qualitative
Phases
Interpretation and
explanation of the
quantitative and
qualitative findings.
Discussion
Implications
Future research

88
3.5 Quantitative phase
3.5.1 Quantitative design
In order to examine how transaction costs influence smallholder market participation
decisions, the study required a data set that captures those variables of interest drawn from
a representative sample, large enough to enable the analysis of categorical, truncated and
limited dependent variables. However, given the lack of longitudinal data sets capturing
transaction costs variables, it was necessary to carry out cross-sectional primary data
collection. Accordingly, the design of data collection for this study implies that the
analyses test the variables of interest for statistical associations and not for cause and
effect (Mann, 2012). This further justifies the use of mixed methods in the study, where
qualitative evidence is used to explain how (cause) and why (effect) statistically
significant associations might exist by describing the relevant context (lived experience)
for participants. The implications of conducting cross-sectional data analysis in this study
are further discussed in section 7.4.1.
3.5.2 Smallholder Market Participation survey
The researcher developed a smallholder market participation survey questionnaire. The
questionnaire was broken into two parts. The first part aimed to collect data that would
address the first and second objectives of the quantitative phase and was designed to be
completed by all poultry farmers irrespective of whether or not they were engaged in
poultry sales.
The questionnaire collected information on socio-economic data, included a set of core
questions focussing on indicators of the ease of doing business, and was supplemented by
more specific questions related to poultry markets (see Appendix A.1).
The second part of the questionnaire (see Appendix A.2) was designed to only include
farmers who were engaged in the sale of poultry and aimed to collect data associated with
the ease of either selling live birds through the open market or at the farm-gate. Questions
aimed to capture data on the differences in transaction costs occurring in both market
channels.
89
The questionnaire was prepared by identifying transaction costs indicators generally
observed in smallholder market participation research. More specific information
pertaining to poultry markets was obtained from a review of poultry market conditions in
Nigeria and in the study area in particular. This was supplemented by the personal
experiences of the researcher who had spent over seven years living and working in the
study area.
The quality of the draft survey questionnaire was reviewed by Professor Christopher
Ritson, a professor of Agricultural Marketing (not part of the research team), the review
focussed on providing expert opinion on the likely level of difficulty of completing the
questionnaire by checking for areas of ambiguity, structure, style and general ease of
completing the survey. This process served as a quality control measure and resulted in
some corrections and improvements being made to the questionnaire.
Prior to going into the field, full ethical approval to carry out the study was obtained from
the Ethics Committee of the Faculty of Science, Agriculture and Engineering (SAgE),
Newcastle University, UK on 14th
May 2015 (REF: 15-ANT-50). The ethical approval
highlighted the need for informed consent to be sought prior to undertaking the survey and
explanations on the purpose of the research to be provided. To achieve this, the objective
of the study was outlined on the front page of the survey instrument after which
permission to participate in the study was requested with a yes or no option provided
(Appendix A.1). Furthermore, strict confidentiality was emphasised and was clearly stated
on the front cover of the survey instrument. In addition, questions directly related to
income e.g. ‘how much do you earn?’ were not included in the survey as it was viewed to
be too intrusive, instead a more general question; ‘do you earn non-farm income?’ was
used. Also, age was not asked directly instead a range was provided. The major concern
raised by ethics committee focused on language of communication during the survey.
Considering that, the survey instrument was written in English. To address this concern,
the researcher noted that he is fluent in reading, writing and translating English into local
language ‘Ibibio’ as such is able to communicate the message in the survey instrument
from English to Ibibio or Pidgin English without losing its meaning. In addition,
enumerators to be used for the survey had to be fluent in English, Pidgin English and
Ibibio. Further ethical consideration is provided in section 3.6.3.2 below.

90
3.5.3 The Study Area
The study was carried out in Akwa Ibom State, a state within the geo-political zone known
as South-South Nigeria. The State lies on the equator at 5000’N, 7050’E with a land area
of approximately 6,189 Km2
and is the third most densely populated state in Nigeria. The
state is bounded in the East by Rivers state, on the west by Cross River state, on the North
by Abia State and on the South by the Atlantic Ocean (Figure 3.2), the coastline of the
State is approximately 128.64Km, constituting 13.4 percent of the total coastline in
Nigeria. The state is made up of 31 local authorities containing a total of 2664 villages.
Based on 2012 population estimates, the state has nearly 5 million inhabitants with an
urban population of about 1 million and a rural population of 4 million.

91
Figure 9: Map of Nigeria showing Akwa Ibom State
Source: http://www.akwaibomnewsonline.com/popups/akwa-ibom-state-map.php
Source: http://akwaibominvest.ng
Note: A, B C represent Uyo, Abak and Etim Ekpo local authorities
Akwa Ibom State is located within the tropical rain forest belt of Nigeria, having an
average rainfall per annum of 247mm3. In common with other parts of Nigeria, the state
has two distinct seasons (i.e. dry and wet seasons) with an average temperature ranging
between 230c and 31.7
0c.
Agriculture in the state is generally at the subsistence level and the majority of farmers are
smallholders. These farmers face many market barriers, ranging from high costs of inputs,
lack of capital for investment, poor market information, distance from market, lack of
adequate transport, poor transport infrastructure, lack of access to veterinarians, water
scarcity, poor access to modern technology, lack of government support, and poor
availability of land for expansion. As such the ease or difficulty by which farmers are able
to participate in markets considering the market barriers they face is the main thrust of this
study.
92
According to the (NASS, 2010/2011) NASS survey, there are 137,161 smallholder poultry
farmers in the state, with chicken farmers being the most common at 117,329.
Smallholders in Akwa Ibom State rear about 2 million chickens annually (NASS,
2010/2011), giving an annual average of 17 chickens per smallholder in the state.
Three local authorities (Uyo, Abak and Etim Ekpo) were selected for the survey based on
expert advice from extension agents working for the state agricultural development
programme (AKADEP); the arm of the Ministry of Agriculture responsible for extension
services. Selection of these areas took into account the large population and high level of
commercial activities in Uyo, the state capital, while Abak and Etim Ekpo were also
selected for their large populations and high density of poultry production. Crucially, both
local authorities enjoy close proximity to the two important commercial states of Abia and
Rivers.
Akwa Ibom State is administratively divided into six agricultural zones; namely: Uyo,
Abak, Ikot Ekpene, Eket, Ikot Abasi and Etinan. Each zone is made up of three to seven
local authorities; and each local authority is made up of one to three blocks: blocks are a
collection of cells and a cell is a collection of villages, which are the primary sampling
units (PSU) in this study. The study sites are highlighted below:
Uyo zone is made up of five local authorities, namely: Uyo, Ibesikpo Asutan, Uruan,
Ibiono Ibom and Itu), Uyo was purposively selected for the study and is made up of one
block known as Use Ikot Ebio, which is also a village. Within that block there are nine
cells, namely; Mbak Ikot Ebo, USE OFFOT, Ikot Nsung, Ikot Mbon Ikono, NUNG UYO
IDORO, UYO URBAN, Ikot Oku, IKOT OKU UBO and IFA ATAI: from these five cells
were randomly selected and are indicated in capital letters. Between them the five cells
contain 36 villages and during the survey18 of these were randomly selected. A map of
Uyo local authority is presented in Figure 10 below:

93
Figure 10: Map of Uyo
Source: (Daniel, 2015c)
Abak and Etim Ekpo local authorities were purposively selected for the study and both fall
under the Abak Zone. Abak is made up of two blocks; namely: Ikot Ekang and Ikot Ekon.
Ikot Ekang Block is made up of seven cells; namely: Nkor-Otoro, IKOT OBONG UTU,
Ikot Okubara, IBONG IKOT AKPAN ABASI, Ikot Udo Usung Ukpom, IKOT EKANG
and ABAK TOWN. Ikot Ekon block is also made up of seven cells namely: NKWOT
IKONO, Ikot Essiet, EBEBIT, IKOT EKON, Ikpe Atai, Ikwek and IKOT OBIO AMA.
Four cells (indicated in capital letters) were randomly selected from each block, giving a
total of eight cells, containing 72 villages between them. During the survey, 35 villages
were randomly selected. A map of Abak local authority is presented in Figure 11 below:

94
Figure 11: Map of Abak
Source: (Daniel, 2015a)
Etim Ekpo consist of a single block: Utu Etim Ekpo, the block is made up of seven cells
namely: Ikot Udom, UTU ETIM EKPO, OBONG NTAK, Ikot Esop, Nto Unang, URUK
ATA II and IKOT UDO OBONG. From these, four cells were randomly selected and are
indicated in capital letters. The four cells have 31 villages between them from which 15
villages were randomly selected to be included in the sample. A map of Etim Ekpo local
authority is presented in Figure 12 below:
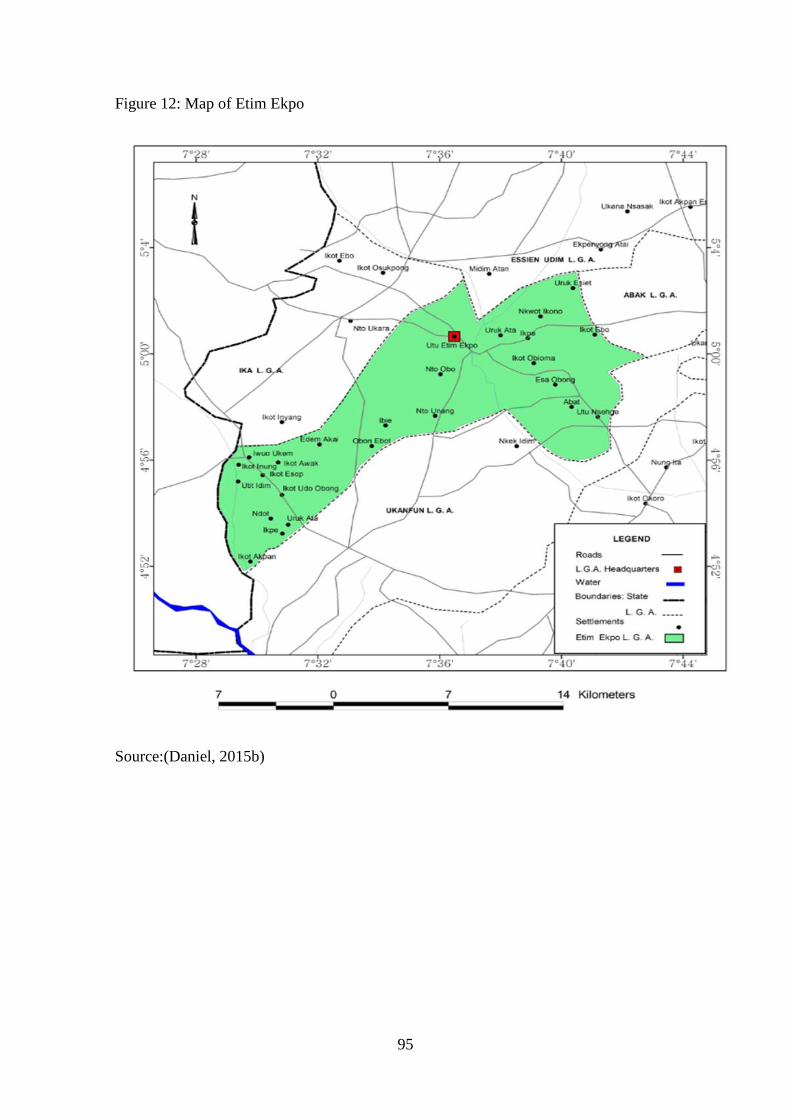
95
Figure 12: Map of Etim Ekpo
Source:(Daniel, 2015b)

96
3.5.4 Sampling techniques
As noted in the section 1.1, smallholder poultry farmers are broadly defined as households
that rely to a large extent on non-salaried labour, usually stocking 100 birds or less
(Sonaiya and Swan, 2004). This definition was set as the threshold for farmers to be
included in the survey; however, during consultations carried out with key informants (i.e.
extension agents), to garner general insights on the distribution of poultry farmers in the
study area, the threshold number was increased to up to 200 birds (i.e. poultry farmers
stocking 200 birds or less at any given time).
Establishing a threshold number was a direct attempt to ensure judicious use of time and
energy considering the large study sites. Having defined the target population, a
representative sample is required to help to ensure the accuracy and general reliability of
the sample estimates for predicting population parameters.
In considering the population sample, an important aspect is the sampling frame, which
contains all of the elements or units in the target population from which information can
be drawn. In many cases, a sampling frame may not be available due to lack of reliable
information about the population. In this case the informal nature of smallholder
operations, where such businesses often operate unregistered, means that establishing a
formal sampling frame would not be feasible. Even so, with or without a sampling frame,
it is important to select a sample in such a way as to minimize issues of sampling error
and sample selection bias (Floyd J. Fowler, 2014; Nardi, 2016).
Sampling error occurs where there are wide variations among the different subsets in the
population of interest and can be overcome by selecting from a subset that exhibits the
average characteristics of the population of interest. On the other hand, sample selection
bias arises when key groups are omitted from the sample or where they refuse to
participate in the survey (Nardi, 2016).
Sampling can use either probability or non-probability approaches. Probability sampling
approaches are anchored on statistical considerations, while non-probability approaches
are based on purposive selection of samples, relying on the subjective views of the
researcher in making judgements on the inclusion or exclusion of certain elements of the
target population. Another aspect of non-probability sampling is that sampling may be
97
done at the convenience of the researcher so that the sample is drawn only from sites he or
she can conveniently reach. Quota restrictions are also often used in non-probability
sampling, whereby restrictions are made on a subset of the target population: for example,
sample of 200 women or 200 individuals between the ages of 25-45 years.
The key difference therefore between probability and non-probability approaches is that in
the former, the approach is based on statistical considerations, while the latter is more
concerned with achieving particular objectives, such as ensuring that only individuals with
relevant experiences in a field are sampled. This study adopted a probability sampling
approach. Common probability sampling approaches include: simple random sampling;
cluster sampling; systematic sampling; stratified sampling; and multi-stage sampling.
In simple random sampling, each unit has an equal chance of being selected from the
sampling frame. Systematic sampling involves selecting each unit uniformly at intervals
from an ordered schedule; for example; every third household. In the case of stratified and
cluster sampling, the sampling frame is categorised into strata or clusters (depending on
the type of sampling approach) with the difference being that in stratified sampling, a
random sample is drawn from each strata, while in cluster sampling, random samples are
drawn from randomly selected clusters. Multi-stage sampling is the situation where more
than one approach is used to arrive at the final sample, or where a series of successive
stages are employed.
For the present study, a multi-stage (cluster) sampling approach was employed (see Figure
13). The appropriateness of this approach is anchored on the following three points: first,
the approach is suitable where a sampling frame is not available (i.e. where a
comprehensive list of smallholder poultry farmers does not exist). Second, the approach is
applicable where the target population is spread over an extensive geographical area as is
the case in Nigeria. Third, the approach is preferred because of its relative ease of
application when compared to alternative sampling approaches.
Figures 13 and 14 describe the multi-stage (cluster) sampling strategy adopted in this
study. The four blocks in the study area are made up of 30 cells out of which 17 cells were
randomly selected (indicated by red coloured boxes). The RANDBETWEEN function
which is a random function in MS Excel (Remenyi et al., 2013) was used to randomly
select cells. The function selects a number from a range representing minimum and
maximum values. For example, the Utu Etim Ekpo block has seven cells, numbered 1 to 7
98
and the RANDBETWEEN function was applied as follows: =RANDBETWEEN (1,2),
(3,4), (5,6), (6,7). Accordingly the function randomly selected 1,4,6 and 7, i.e. the cells
Utu Etim Ekpo, Obong Ntak, Uruk Ata II and Ikot Udo Obong respectively. This was the
first stage of the sampling process. Each cell is made up of a collection of villages, three of
the cells selected have eight villages each; while one cell has seven villages. Using the
same random sampling strategy applied in selecting the cells, four villages were randomly
selected from the three cells with eight villages, while three villages were randomly
selected from the Ikot Udo Obong cell. This constituted the second stage of sampling with
the villages as the primary sampling units (PSU).
In all, sixty-eight villages were included in the survey and respondents used for the study
were selected from each village using a systematic sampling approach. This served as the
third and final sampling strategy to be applied in the study.
The systematic sampling approach used to select respondents, data collection techniques;
sample size and response rates are all discussed in the next section.
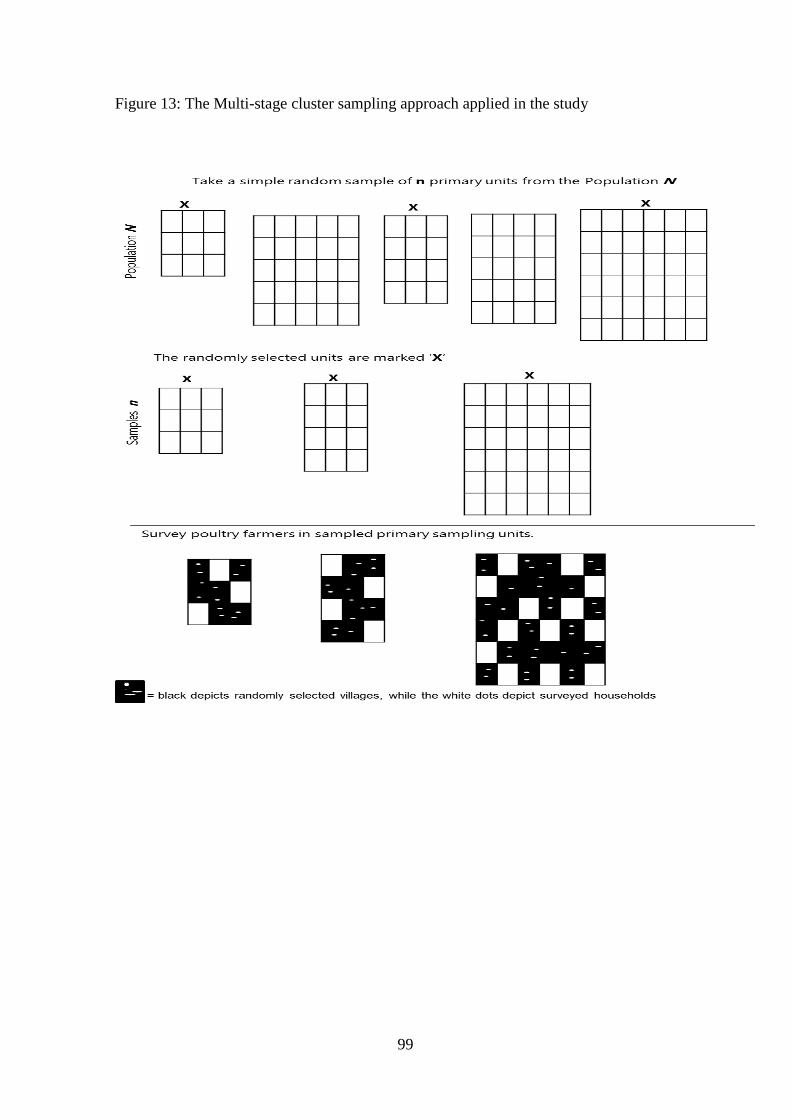
99
Figure 13: The Multi-stage cluster sampling approach applied in the study
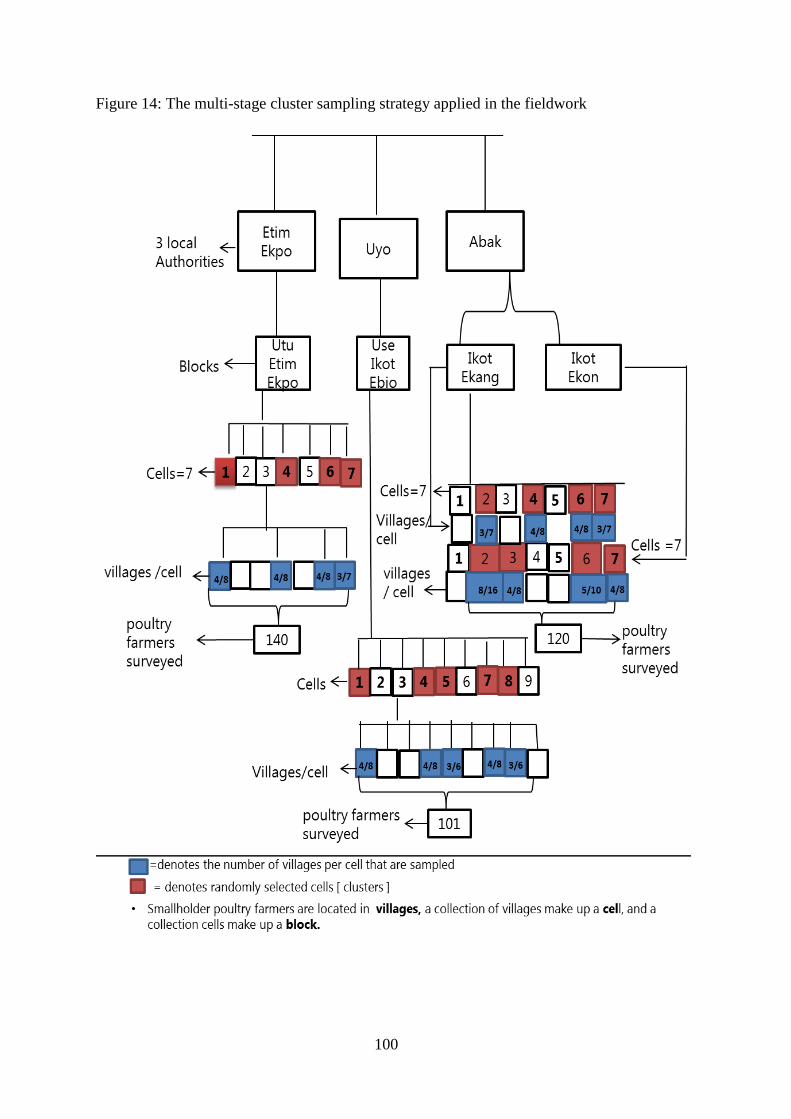
100
Figure 14: The multi-stage cluster sampling strategy applied in the fieldwork

101
3.5.5 Data collection methods
The survey involved face-to-face interviews, however where this was not possible, the
purpose of the survey was explained to respondents and a copy of the questionnaire was
handed to them to fill at their convenience. In such cases, the phone number of the
respondent was obtained to enable easy contact (the researcher’s phone number was
displayed on the front page of the questionnaire to enable respondents to contact the
researcher about any question they needed to clarify).
Face-to-face interviews were the most productive approach because it was possible to
spend more time with the respondents to discuss any questions raised in greater depth. Out
of the 500 questionnaires that were issued, 300 were completed face-to-face, while
respondents at home completed 61, giving 361 completed questionnaires with a response
rate of 72.2%. However, no difference was envisaged between those that completed the
survey face-to face and those that completed at home since phone communication
provided the same information that would have been provided face-to-face.
Nevertheless, Dommeyer et al. (2004) reported a 75% response rate in administering face
to face surveys with only a 43% response rate achieved through online surveys in a study
on teaching evaluations. The high response rate for interviews conducted face-to-face
underscores the importance of face to face interviews in carrying out surveys as noted by
(Lavrakas, 2008, p. 259) as follows:
“face to face interviews … [have] continued to be the best form of data collection when
one wants to minimize non-response and maximize the quality of data collected … by far,
the main advantage of the face to face interview is the presence of the interviewer which
makes it easier for the respondent to either clarify answers or ask for clarifications for
some of the items on the questionnaire”
Ten local interviewers were recruited and used for the survey, these interviewers also
served largely as gatekeepers since their role also involved easing access to respondents.
The interviewers were recruited through announcements at local churches and by reaching
out to youth community leaders in the randomly selected villages. Those who were
interested were asked to call or text the researcher and the criteria for selecting
interviewers were three fold: first, interviewers had to be local; second, they had be able to

102
speak and write in English and third, be willing to work and walk for long hours with few
breaks. Interviewers had to complete an intensive one-day training course and villages
were assigned to each interviewer based on their location and field experience.
Prior to the actual survey, a pre-survey was carried out with an experienced extension
officer (more than 20 years’ experience) and afterwards with five poultry farmers. The aim
of the pre-survey was to check for ambiguities in the questionnaire. Each question was
read out individually to the farmers in English and explanations were delivered using a
mix of Ibibio, English and Pidgin English (see section 3.6.3.3 below for more details) as
would be expected in typical every day local parlance, giving time for farmers to absorb
each question and provide answers. The pre-survey resulted in the modification of one
question while two questions were removed.
To ensure consistent quality, the researcher accompanied each interviewer on alternate
days. Interviewers adopted a systematic random sampling approach in their assigned
villages: this was achieved by applying a random route strategy (Blair et al., 2014; Rea
and Parker, 2014), for example first left and then right and so on. Thus, every second or
fourth farmer was selected. This was not, however, strictly applied in all cases; since
villages differ in their structures and set up; e.g. where poultry farmers were densely
populated the selection interval was widened to encompass every fifth or tenth poultry
farmer. Only farmers who had kept poultry for at least a year were eligible to be
interviewed: this was important to ensure that respondents had had the opportunity to
engage in the Christmas or Easter sales, which are the peak periods for poultry sales in
Nigeria, making them better placed to respond to the questionnaire. Furthermore,
respondents had to be a decision making adult member of the household (i.e. household
head or in the case of a married farmer, either husband or wife, provided one of them was
directly involved in the day to day poultry operations). By so doing, it was reasonable to
conclude that the information collected was of high quality and therefore could be used to
address the questions under investigation.
For each household that was visited, the potential respondent was briefed on the objectives
of the study after which respondents were assessed for their eligibility to participate in the
survey by going through a series of informal questions relating to household poultry
keeping history, the number of years spent keeping poultry, their level of involvement in
day to day poultry operations, etc. These informal questions helped determine if a

103
potential respondent was a suitable candidate for interview. Afterwards, informed consent
was obtained from each participant; in particular, respondents were assured of
confidentiality and were told about the likely duration of the interview, which was not to
be greater than an hour.

104
3.5.6 Model Specification
3.5.6.1 Measurement
The analysis applied in this study is discussed in this section, particular attention is given
to how the variables used in modelling market participation decisions were measured.
Typically, in making market participation decisions, households follow a two-stage
decision making process (Jagwe et al., 2010; Ouma et al., 2010). Firstly, they make a
decision on whether or not to participate in a given market and then they will decide on the
extent of their participation.
In the systematic review described in the previous chapter, it has been noted that studies of
this nature often apply double-hurdle models. This study applied the Cragg’s double
hurdle model which is a flexible and improved alternative to Heckman’s two-stage model
(Burke, 2009). The model allows for separate estimation of a probit model at the first stage
(i.e. probability of participating in poultry markets), followed by a truncated normal
regression at the second stage (i.e. the decision about how much to sell) (Burke, 2009).
Although Heckman’s and Cragg’s models are similar, Wodjao (2008) (p.15) note that:
“both models are similar in identifying the rules governing the discrete (zero or positive)
outcomes. Both models recognize that outcomes are determined by the selection and level
of participation decisions. They also permit the possibility of estimating the first and
second stage equations using different sets of explanatory variables.”
However, the main difference between the models is that the Heckman model assumes
that there will be no zero observations in the second stage once the first-stage selection is
passed (Wodjao, 2008). In other words, the Heckman model implies incidental truncation,
since the model assumes that zero values are either missing or unobserved.
On the other hand, Cragg’s model considers the possibility of zero observations in the
second hurdle as a result of individuals’ deliberate choices rather than merely indicating
missing or unobserved values, i.e. Cragg’s model assumes that zero observations can be
reported at both decision stages (Wodjao, 2008).

105
To illustrate the difference, using an example from this study; in the Heckman model, all
farmers who keep poultry are assumed to want to sell. Since all farmers are assumed to
want to sell, it is equally assumed that the quantity sold will be non-zero.
The Cragg’s model on the other hand assumes that a farmer can keep poultry but decide
not to sell in a given time period, in other words, the assumption that all farmers want to
sell is relaxed, as such zero observations reported in the first stage are due to non-
participation in the market because of individual’s deliberate choices.
In the second stage, zero observations are possible since some poultry farmers may decide
not to sell,. or there may be no sales. This could reflect deliberate choices, such as
deciding to consume any birds produced themselves or random circumstances such as
illness or disease.
The assumptions in the Cragg’s model best fit the situation observed in this study,
suggesting that this model is more appropriate than Heckman’s model. Accordingly, a
probit model, where the dependent variable takes a binary form, (0-1), was used in this
study to denote the whether or not farmers keep poultry. Transaction costs factors (such as
access to veterinary services, access to market information, access to inputs, distance from
farm to market, and access to credit) and socio-economic factors (such as marital status,
gender, family size, educational status, etc.) are used as regressors in the model which is
defined as:
Prob(Yi = 1) = βiXi + µ --------------------------------------------------------- (1)
Where, Yi is the latent variable reflecting the decision to participate in poultry markets and
Xi is the vector of explanatory variables representing factors affecting the decision to
participate in poultry markets. Being a binary variable, the discrete decision to participate
in poultry markets is observed by:
Yi = 1 if Yi > 0 and otherwise if Yi = 0. ------------------------------------- (2)
Prob(Yi = 1) = prob (βiXi + εi1 > β0Xi + εi0) -------------------------------------- (3)
Prob(Yi = 1) = prob (εi0 - εi1 < βiXi - β0Xi) ---------------------------------------- (4)
= prob (εi < βXi) ---------------------------------------------------- (5)
Prob(Yi = 1) = ø(βXi) ---------------------------------------------------------------- (6)
106
Where ø is the cumulative distribution function of the standard normal distribution ε and is
the probability that X will take a value less than or equal to X.
In the truncated regression, the quantity of poultry sold over the last twelve months is the
dependent variable. Since the aim of the model is to measure the extent of market
participation, this is regressed against various independent variables. In other words, this
measure of the extent of market participation is reflected in the volume of poultry sold.
The truncated regression model is represented as follows:
Yi * = βiXi + µi --------------------------------------------------------------------------------------------------------------- (7)
Where, Yi *
is the proportion of live birds sold by the ith
household, βi is the vector of
parameters of the ith
household to be estimated, Xi are explanatory variables included in
the model and µi the error term.
A truncated regression model, as the name suggests, fits a model of a dependent variable
that is truncated at a certain value (in this case zero). For this study, only farmers who
participated in poultry sales (market participants) were included (i.e. 259 households), the
remaining 102 households who did not sell poultry (non-market participants) were
excluded.
In the probit model, both market and non-market participants are included in the model;
since the decision on whether to participate in poultry markets is made by all farmers. By
contrast, in the truncated regression model only households that have already make the
decision to participate are included; so the interest lies in the extent of their involvement in
the market.
A two-limit Tobit model (Hobbs, 1997; Gong et al., 2006; Woldie and Nuppenau, 2011)
was the most appropriate model to test farmers decisions about point of sale (i.e. either
farm-gate or spot market) based on the field data. In either the sample 70% of farmers sell
all or none of their birds at the farm-gate, in other words, the observations are censored at
an upper and lower limit. Accordingly, 70% of farmers sold all of their birds at the farm
gate and the dependent variable is the proportion of birds they sold at the farm-gate. The
aim of the Tobit model is therefore to identify the transaction costs factors that influence
the choice of farm-gate sales over the spot market; a two-limit Tobit model is specified as
follows:

107
--------------------------------------------------------------------------------------- (8)
And
if ----------------- (9)
if -----------------------(10)
if --------------(11)
Where is the latent variable i.e. the potential proportion of live chickens sold), is
vector of unknown parameters, represents a vector of independent transaction costs and
socio-economic variables; = 0, the lower limit i.e. the proportion of farm-gate sales
equals zero; = 1, the upper limit, i.e. the proportion of farm-gate sales equals one i.e.
100%.
The expression of the likelihood function for this model is:
( | ) = ∏ (
) ∏
(
) ----------------------- (12)
∏ * (
)+ --------------------------------- (13)
Where, represents the first product over the lower limit (no farm-gate sales)
observations, , is the second product over the non-limit observation (mixture of
farm-gate and spot market sales) and is the third product over the upper limit
(all farm-gate sales).
The statistical software package Stata 13.1 was used in carrying out the analysis. Robust
standard errors were applied in the analysis to correct for heteroscedasticity which is often
a problem in cross-sectional data (Abu et al., 2014). Considering the large study area and
the heterogeneous nature of smallholder farmers, the variability among households tends
to be high, often resulting in heteroscedasticity, which causes biased standard errors, since
variance is higher in observations with large variability, using robust standard errors in the
analysis reduces biases in standard errors (Williams, 2015).

108
3.5.6.2 Variables
The main transaction costs variables utilised in this study are: access to a motorcycle
[MOTCYC] (dummy (0,1)) which is a proxy for means of transport and was used as a
proxy for ease of transporting bulk inputs such as poultry feed (25kg/bag) from the point
of sale to the farm as well as transporting birds to market (particularly in areas with poor
road networks which is the prevailing situation in most parts of the study area). It is
assumed that farmers with access to motorcycle find it easier to participate in poultry
markets since they can meet their own transport needs. This is particularly important in
more remote communities, where high transaction costs can be incurred due to the
unreliability and unsuitability of transport services, from walking long distances to buy
feed and other inputs, an exhausting and tedious exercise that may discourage farmers
from participating in poultry markets.
Access to veterinary services [VET] was measured as a dummy variable and took the
value of 1 if respondent had used veterinary services in the last twelve months and 0
otherwise. Having access to a qualified veterinarian tends to ease market participation
since poultry businesses rely on veterinary services for vaccination and other important
health–related support. Farmers who find it easy to access veterinarians incur lower
transaction costs (e.g. Information and search costs) which can therefore facilitate market
participation. Rural areas in Nigeria lack regular veterinary services, more often than not,
to access to this service require farmers having to contend with an unreliable transport
service to travel to meet a vet in the city or town and most often having to explain the
symptoms without an actual physical examination of the birds. In addition, no prior
appointment is booked and queues are often long so farmers spend long hours at the vet
office. This is a stressful exercise on farmers, so much so that most rural farmers do not
have the quality and quantity of vet services they need to enhance the production of a
marketable surplus as such, farmers’ loose interest in poultry business since a major
service they require is often too cumbersome to access.
Educational status of farmers [EDUSTAT] identified those respondents with at least some
formal education compared to those without taking values of 1 or 0 respectively).
Educational status was used as an indicator of the literacy and comprehension level of
farmers. Poultry is a high value product that requires more specialised management
109
compared to growing traditional staples, and farmers with poor literacy levels are likely to
face greater difficulties in participating in poultry business (i.e. higher transaction costs).
Aspects of poultry require attention to detail particularly with drug administration, it is
hypothesized that with formal education, the complexities associated with administering
these drugs is better handled.
Cash flow (access to cash) was measured using three proxy (dummy) variables namely:
Non-farm income [NONFAINC], non-poultry farm income [NONPOINC] and access to
credit [CRED]. The respective variables took the value of 1 if farmers earned non-farm
income, earned non-poultry farm income or accessed credit and took the value 0
otherwise. The importance of ready cash in the poultry business cannot be over-
emphasised: poultry farming is heavily cash flow dependent; for example: poultry feed is
an expensive daily input. The ease of accessing sources of ready cash to meet the day-to-
days costs of the poultry business is likely to encourage market participation as well as the
level of participation. Access to information on sources of credit and conditions attached
to these credits e.g. repayment time and rate of interest is likely to exclude some farmers
from accessing the cash they desperately need, in this study, exclusion indicates high
transaction costs to participation.
Accessing information from extension agents [EXTSERV] and other experienced farmers
[FMTINFO] provides individual farmers with useful business-relevant information and
can be an important factor in determining whether or not farmers participate in poultry
markets. This is particularly important for novice farmers who can access information
from more experienced individuals making it easier for them to participate in poultry
markets. Such easy access to advice reduces the cost of information for farmers and
continued access to such information sources may encourage participation in poultry
markets. Both access to extension services and access to information from other farmers
are defined as dummy variables; taking the values of 1 or 0, depending on whether or not
farmers have access.
Distance from the farm to the nearest market [TIME2MKT], distance from the farm to the
nearest tarred road [TIME2RD] and remoteness of location [TIME2HECN] are all
indicators of costs that are likely to influence a farmer’s decision to participate in poultry
markets. To capture these variables, time in hours spent travelling from the farm by

110
motorcycle to the nearest market, nearest tarred road and nearest health centre were used
as proxies for the respective variables.
In order to capture security of land tenure, the proxy dummy variable ‘native to the
village’ [NATIVE] was used and took the value of 1 if farmer is native to the village and 0
otherwise. It is assumed that the ease of accessing land makes it more likely for farmers to
participate in poultry markets. Being a native tends to lower information and search costs
associated with accessing land, since a native is already aware of available land and
possibly negotiating for land is easier since it is owned by family or close relative.
Communication technology is of great importance in lowering transaction costs, since the
ability to communicate over time and space helps to curb distance barriers, improves time
management and enhances business operations, all of which eases the process of doing
business. Information costs associated in arranging a transaction that would have involved
physical travel to arrange a transaction is shortened through mobile telephony as such, the
inconvenience and uncertainty of communicating over long distances is slim. To test the
influence of communications technology on the ease of doing poultry business, the
dummy variable ‘ownership of mobile phone’ [MOBFONE] was used as a proxy, taking
the value of 1 if a farmer owns a mobile phone and 0 otherwise.
Having regular or repeat buyers [REPCUST] was included in the Tobit model to indicate
the likelihood of guaranteed business. Being able to rely on regular customers reduces
farmers’ search and negotiation costs because the time spent searching for buyers is
reduced. In the absence of regular buyers, farmers are less likely to risk entering or
remaining in the market. A dummy variable was used to measure the variable and took the
value of 1 if farmers have regular or repeat buyers and 0, otherwise.
Another cost that farmers face relates to farmers’ expectations regarding price
[NEGOPOW]. The existence of such expectations can be used as a proxy for the
negotiating or bargaining position that farmers have at the market outlet where they
choose to sell. It is assumed that a stronger negotiating position lowers the costs of doing
business and that farmers are more likely to choose to participate in the market if they are
in a stronger negotiating position.
Costs incurred in accessing price information often depends on the ease of readily
available price information Hobbs (1997) and Hubbard (1997) and sources of price

111
information are less developed in Nigeria as such expectations on price are less obvious,
this is therefore an information cost that farmers face. To overcome this cost, farmers
select market outlets that offer best returns or market outlets with which they can negotiate
more strongly.
To test for price expectations, the following question was asked: ‘Do you consider the
price you sell to be the best you can offer?’ The possible answers were never the best price
=1, sometimes the best price =2 and always the best price = 3.

112
3.6 Qualitative phase
3.6.1 Methods
3.6.1.1 Setting
This phase of the study was set within the same villages used for the quantitative data
collection and participants were farmers who had agreed to be contacted for a follow up
interview by ticking ‘yes’ from the Yes/No option (see appendix A.1.) provided on the first
page of the questionnaire used in the survey (potential participants were then asked to
supply their mobile phone numbers).
A more detailed study setting has already been discussed in section 3.6 above. However,
since not all of the villages in the quantitative phase were used in this phase of the study, it
is necessary to provide a list of villages in each local authority area that were used to
provide qualitative data (see Table 19 below).
Table 19: Villages included in the qualitative phase
Uyo local authority Etim Ekpo local authority Abak local authority
Obio Etoi Utu Etim Ekpo Oku Abak
Uyo Urban Ikot Mboho Manta
Anua Obio Nkwot Ikot Ebo Ikot Ekang
Ifa Atai Obong Ntak Ikot ikpa
Ikot Ese Nkwot Ikono
Nto Enyen Ikot Nduese
Ikpe annang Ntak Inyang
Ikot Umo ebat Atan midim
Ndot Obong Esa Obong
Ikot Awak
Edem Akai

113
3.6.2 Sampling methods
The interview participants were recruited using a maximum variation strategy: a sampling
technique that involves selecting samples from the population of interest that exhibit wide
variations in the characteristics of interest (Patton, 2005; Lavrakas, 2008). This was done
by compiling lists of respondents who had supplied their phone numbers on the
questionnaire and stratifying them based on the three local authority areas employed in the
study. The initial list comprised 53 potential respondents but after calling farmers to
confirm that they were still interested in being interviewed 12 phone numbers did not
connect and were removed, six farmers decided not to participate any further and 10
farmers could not provide a suitable time7 to meet and so were excluded.
Eventually, 25 remaining respondents opted to participate in the interview phase, out of
which five took part in pilot interviews and so were not included in the main analysis. The
questionnaires that had been completed by the 25 informants were retrieved and the
characteristics of each informant was extracted; the following key characteristics were
selected to show the variation among participants: gender, marital status, educational
status, locality and market access (see Table 20). From these characteristics, it was
possible to identify variations in these key characteristics across potential interviwees.
In all, 13 male and seven female informants were used in the main analysis, out of which
13 were married and seven were single. While two informants had no qualifications, 23
had some formal education, ranging from elementary and secondary school up to degree
level. With respect to locality, 20 informants were native to the area and five were not.
With respect to market access, 16 informants were identified as having good market
access (as described previously) with six suffering from a poor road access. A more
detailed sampling schedule is provide in Table 20 below.
7 Due to risk assessment issues, all interviews were to be concluded before 5pm at any
given day due to safety concerns with regards to working in the dark, since farmers could
not provide a time before 5pm they were dropped.

114
Table 20: Characteristics of participants included in the qualitative phase
Characteristics
of participants
Description Uyo
[5]
Etim
Ekpo
[11]
Abak
[9]
Total
per
criteria
Total
number
per
criteria
in the
pilots
Total
respondents
per criteria
included in
the final
interview
Gender Male 3 7 (2) 6 (1) 16 3 13
Female 2 (1) 4 (1) 3 9 2 7
Marital Status Single 2 4 (1) 3 (1) 9 2 7
Married 3 (1) 7 (2) 6 16 3 13
Educational
status
Formal
education
4 (1) 10 (2) 9 (1) 23 4 19
No
qualifications
1 1 (1) 0 2 1 1
locality Native 3 9 (3) 8 (1) 20 4 16
Non-Native 2 (1) 2 1 5 1 4
Market access Good market
access
3 (1) 7 (1) 6 16 2 14
Bad market
access
2 4 (2) 3 (1) 9 3 6
[ ] = total number of participants per local authority area
( ) = number used in pilot interviews
115
3.6.3 Data collection
Data were collected using semi-structured interviews which were conducted by the author
during August and September 2015. The interview schedule consisted of probing
questions, which assisted in eliciting information from informants to help to explain how
transaction costs might influence their decisions to participate in poultry markets.
(Appendix B.3). These questions were tested and refined through a series of pilot
interviews before the main data were collected. The interview process and the specific
techniques are detailed below
3.6.3.1 Interview process
Before taking part in the interviews, informed consent was sought and obtained from each
informant as described in section 3.13.2 below. The interview began by acquainting each
participant on the research topic and outlining the questions to be addressed. A bottle of
water was provided to each informant to quench their thirst during the interview. The
interviews were carried out in either the living rooms or verandas of informants according
to their preferences. By allowing the researcher into their homes, respondents showed that
the researcher was well received and that they were comfortable and relaxed in their own
environments (Boyce and Neale, 2006; Kuehne, 2016).
Informants were then asked to elaborate on some background questions related to their
socio-economic status as provided during the survey. For instance, in elaborating on their
educational status, some informants revealed that they attended all of their schooling in
their native villages. While others, although born in their village, were schooled outside
their villages but later returned The former having spent more time in the village were
more likely to understand how things worked in the village and have better social
networks. These background questions helped to break the ice and set the scene for the
interview.
For the main interview, informants were asked to reflect on how they felt the identified
transaction costs factors might explain their participation in poultry markets. In general,

116
questions concentrated on understanding the underlying associations between deciding to
participate in poultry markets and the factors that might contribute to those decisions.
Questions were carefully designed to elicit informants’ experiences and understanding
(Agee, 2009; Turner, 2010). This made it possible for informants to explain how the
identified factors might influence their market participation decisions as part of a broader
discussion. For example, in order to explore why farmers who participated in poultry
markets were more likely to access market information from other farmers, the researcher
asked the more general question: what do you think farmers need to know about the
market before they start up a poultry business? This was accompanied by a follow-up
probing question: how can they get this information? Through this process informants
could reveal the reasons why farmer-to-farmer information exchange was a more preferred
form of accessing market information by explaining, for example that other farmers were
more easily accessible; thus, indicating that the costs of accessing information from other
farmers are low.
3.6.3.2 Ethical considerations
Ethical approval to conduct a follow-up interview for the qualitative phase of the study
was granted by the Newcastle University, Faculty of Science, Agriculture and Engineering
Ethics Committee (REF: 15-ANT-50). Accordingly, a number of measures were put in
place to guide the ethical conduct of this phase of the study based on terms approved by
the Faculty Ethics Committee. Firstly, prior to being interviewed informants were asked to
give informed consent in order to be interviewed. Prior to this, the researcher briefed
potential informants using a follow-up sheet that detailed: the reasons for conducting a
follow-up interview and the importance of the interview to the study; how the interview
would be conducted; and how informants would be addressed during the interview (see
Appendix B.1, B.2). After, the potential informants were briefed an informed consent
confirmation sheet was provided for informants to confirm whether or not they consented
to be interviewed. The informed consent confirmation sheet also further provided details
about the study, showing the researcher’s institution of study and his contact details, i.e.
mobile phone number and e-mail address. The researcher also signed the informed consent
confirmation sheet and a copy was given to each informant before the interview
commenced.

117
In addition, strict confidentiality of informants was ensured by removing any information
that could lead to them being identified to people not in the research team. Any documents
containing informants’ personal details have been securely locked in an office cabinet in
the School of Environmental and Natural Sciences, Newcastle University. Also, in order
not to irritate informants, questions of a delicate nature particularly on income, were not
asked directly. Instead informants were indirectly asked to clarify from a more general
discussion on how income might influence their decision to participate in poultry markets.
The entire interview was digitally recorded using either a a smart phone or a voice
recorder, the smart phone was particularly useful because the buttons are easier to
manoeuvre (Paulus et al., 2013; Smith and Bhattacharya, 2014). Each interview lasted for
about an hour on average and was drawn to a close by giving respondents the opportunity
to ask questions or give further comments. At the end of each interview, informants were
briefed on what the potential policy impact of the research could be and were asked if they
wanted a copy of the digital recordings, which one informant requested and a copy was
transferred via Bluetooth8 technology to the informant’s phone. Each informant was given
between £10, £15 and £20 equivalent in Naira to compensate them for the duration of time
spent in conducting the interviews (Stevenson, 2012). However, concerns over such cash
payments have been highlighted in the work of various authors e.g. (McKeganey, 2001;
Slomka et al., 2007; Head, 2009) noting that by offering cash, informants may feel
inclined to tell the researcher what they want to know; instead of giving a true account of
their experiences. To overcome these concerns, the researcher did not reveal to informants
that there would be compensated until the end of each interview, this approach is also
echoed by Allmark et al. (2009).
8 Bluetooth is a technology used in transferring data over a short distance through a mobile
phone.

118
3.6.3.3 Language, safety and cultural considerations
Three languages were used while conducting the interviews: i.e. English, Ibibio and Pidgin
English. Ibibio is the native language spoken in the study area and also of the researcher. It
was important to use the native language to ensure that informants could communicate
unhindered in a language they are familiar with, enabling them to express their opinions
without difficulty. Pidgin English was used interchangeably with English during the
interviews. Pidgin English is used in everyday informal communication in Nigeria
(Olatunji, 2001; Ibukun, 2010; Balogun, 2013) and it is most suitable for people who are
not too fluent in English. Although the majority of interviews were conducted in Ibibio,
these interviews often included brief exchanges in Pidgin English and English.
With respect to safety considerations, all interviews were conducted between 9am and
5pm. This timing was important to ensure that interviews were conducted in daylight,
when it was safer to locate unfamiliar interview locations. This measure was also in line
with the risk assessment form the researcher submitted to the University Safety Officer
prior to the field work. Also, the researcher was always accompanied by a gatekeeper who
assisted during the quantitative survey phase. This was an additional safety measure, since
the gatekeepers were known in the locality. Besides, details of each interview location was
always communicated to the researcher’s immediate family as an additional security
measure.
Cultural considerations centred on firstly obtaining consent from the husband of female
informants before an interview was conducted. Spousal consent was sought because
married female informants, specifically requested that their husbands’ permission to be
sought before they could consent to be interviewed. This was done in two ways, firstly the
researcher requested the phone numbers of their husbands and when this was provided
their husbands were called to seek permission to interview their wives. Secondly, a female
informant was kindly requested to inform her husband because she could not provide her
husband’s phone number and on two occasions, husbands opted to be present during the
interview sessions.

119
Another important cultural consideration related to hospitality, in visiting a stranger’s
home it is considered rude and offensive to reject refreshments offered (Nwauzor, 2014;
Tasie, 2014; Olasunkanmi, 2015). Offering light refreshment to a guest shows acceptance
by your host. During the interview sessions, some informants offered light refreshments
like oranges or bananas.

120
3.6.3.4 Pilot interviews
As mentioned in section 3.6.3, before the main data collection was conducted, five pilot
interviews were performed: this was done to evaluate and ultimately improve the
interview guide. The pilot interviews were administered by the researcher in August 2015
and comprised three male and two female informants, all of whom had participated in the
quantitative phase. These individuals were therefore known to the researcher and had
knowledge of the research being undertaken. The pilot interviews followed the same
process detailed in section 3.6.3.1. However, informants were asked to make suggestions
on ways to improve the interview, particularly if they found any questions unclear or had
comments about specific questions. Drawing from the suggestions, the researcher made
adjustments which centred on identifying suitable ‘Ibibio’ words that could enable
informants understand the English context in which the interview guide was written.
The researcher also submitted the interview guide via email to the supervisory team for
comments. The feedback from the supervisory team further identified leading questions to
which the researcher made adjustments. Accordingly, of the 25 interviews carried out, the
five pilot interviews could not be incorporated into the main qualitative data analysis
because of the extensive adjustments that were made following consultations with the
supervisory team.

121
3.7 Chapter summary
This chapter provides the rationale for the mixed methods design applied in this study. The
main aim of the study was to determine the transaction costs factors that influence
smallholder farmer’s decisions to participate in poultry markets. The study objectives
relate to the probability and extent of market participation and the choice of market outlet
in the first phase and subsequently require an exploration of the perceived influences of
transaction costs on market participation decisions of smallholder poultry farmers.
The study adopted an explanatory sequential mixed methods design whereby findings
from the quantitative phase are further explored in the qualitative phase. The quantitative
phase collected primary data from 361 smallholder farmers which could be used to
determine the transaction costs factors influencing smallholder market participation
decisions. The qualitative phase was based around a series of semi-structured interviews
and informants were selected using a maximum variation strategy. The next chapter
presents the findings of the first phase (quantitative phase) of this mixed methods study.

122
Chapter 4. Results
4.0 Results: How transaction costs factors influence smallholder market
participation decisions
4.1 Introduction
This chapter reports on the findings obtained from the quantitative phase of the mixed
methods study, which sought to identify how transaction costs and other factors influence
smallholders’ market participation decisions.
To achieve this objective, data from a smallholder poultry market survey carried out in
2015 was modelled using Cragg’s double hurdle model and a two-limit Tobit model to test
for significant transaction costs factors.
Accordingly, the findings presented in this chapter address the following specific
objectives:
1. To determine the influence of transaction costs on the probability of market
participation by smallholder poultry farmers.
2. To determine the influence of transaction costs on the extent of market participation
by smallholder poultry farmers.
3. To determine the influence of transaction costs on the decision to sell live poultry
through the farm-gate as opposed to the spot market.
The chapter begins with a description of the sample characteristics drawn from the survey in
section 4.2; the transaction costs and other factors influencing market participation decisions
and the extent of participation are presented in section 4.3; the transaction costs influencing
the choice of either trader pick up (farm-gate) or market delivery (travel to market) in
selling live poultry are presented in section 4.4; the shortcomings of the model and possible
remedy are presented in section 4.5; and the chapter concludes in section 4.6 with a
summary of the major findings.

123
4.2 Sample characteristics
The sample characteristics are presented in Table 21, which provides a descriptive summary
of the variables included in the quantitative analysis. The first column lists the variable
names, while the second column provides a description of the variables. The next two
columns report the mean and standard deviation, while the last column gives information on
dummy variables by reporting the percentage of non-zero responses related to the dummy
variable measurement.
On average, 782 broiler birds per household were stocked during the twelve-month period
under investigation and the average selling price per live bird was N1011 Naira9. Almost
three-quarters (73.4%) of households surveyed had a male head of household. Also, 60% of
respondents were aged 40 years or under and 62% were married. Furthermore, 70% of
farmers in the sample were native to the area.
9 Exchange at the time of survey was £1= ₦307.16

124
Table 21: Sample characteristics from the survey
Variables Variable description mean Standard
deviation
Percentage
for yes =1
DFGATE2 chickens sold at the farm-gate in the reference period (DV) 810.77 1014.36
DQSOLD Quantity of chickens sold in the reference period (DV) per
selling household.
994.04 1030.24
DSOLDCHK Whether or not farmer sold chickens in the reference period
(DV) (1-0)a
71%
FARM_GATE Farmer only sells at the farm gate (1-0)a 70%
AGE Age range: 1= ≤40; 0 = >40 59.83%
FLOCK SIZE Average quantity of chickens kept in reference period per
household
782.26 1029.80
SEX Whether farmer is male =1 or female =0 (1-0)a 73.40%
MARX Whether farmer is single=0 or married =1 (1-0)a 62.32%
PRIXCHK Average price per chicken (Naira/chicken) 1011.6
8
128.33
NATIVE Whether farmer is native to the village (1-0)a 68.97%
HDSIZE Household size 5.54 2.56
FAMLAB Number of household members actively involved in poultry
management
2.47 1.93
EDUSTAT Whether or not farmer has any form of formal education (1-0)a 95.29%
NONFAINC Whether or not farmer earns income from non-farm work
(1-0)a
58.72%
CRED Whether or not farmers access credit in the reference period
(1-0)a
11.91%
NONPOINC Whether or not farmers earn income from other farm activities
besides poultry (1-0)a
50.69%
POULTRN Whether or not farmers have formal poultry training (1-0)a 43.49%
FMTINFO Whether or not farmer seeks market information from other
poultry farmers (1-0)a
96.12%
MTNEINFO Whether or not farmer seeks market information from
neighbours (1-0)a
91.68%
EXTSERV Whether or not farmer accesses extension services (1-0)a 30.74%
MOBFONE Whether or not farmer owns a mobile phone (1-0)a 93.90%
BACCT Whether or not farmer has access to formal banking services?
(1-0)a
85.59%
SAVE Whether or not farmer is a member of a thrift/savings society
(1-0)a
48.19%

125
COOP Whether or not farmer is a member of a cooperative society
(1-0)a
11.35%
SELLDURAT Duration to sales (weeks) 2.85 1.01
REPCUST Whether or not farmer have access to regular/repeat customers
(1-0)a
93.05%
NEGOPOW Whether or not farmer considers their selling price as the best
they can offer (1-3)c
2.02 0.74
MOTCYC Whether or not farmer owns a motorcycle (1-0)a 60.94%
BICYC Whether or not farmer owns a bicycle (1-0)a 22.99%
TIME2MKT Distance from farm to nearest market (hours) 0.61 0.49
TIME2RD Distance from farm to tarred road (hours) 0.27 0.25
TIME2HEA Distance from farm to nearest health centre (hours) 0.56 0.45
TIME2BANK Distance from farm to nearest bank(hours) 0.64 0.48
RDCOND Extent of road conditions as a problem to farmers (1-5)b 2.63 1.26
MOBIMPT importance of mobile phone to farmers (1-5)d 4.20 0.81
VET Whether or not farmer has access to qualified veterinary
services (1-0)a
48.75%
a = possible responses were yes=1, No =0
b = possible answers were 1= not a problem, 2=minor problem, 3=problem, 4=relatively serious problem, 5=
serious problem
c = possible answers were 1= Never the best price, 2= sometimes the best price, 3= Always the best price
d = possible answers were 1= not important at all, 2=not important, 3=moderate, 4=important, 5= most
important
e = possible answers were 1= very easy, 2=easy, 3=moderate, 4=difficult, 5= very difficult, DV = Dependent
variable
Table 21 shows that 95% of farmers had some form of formal education. Also around 60%
of the surveyed households earn income from outside the farm, suggesting that those
households who keep poultry either do so to generate an additional income stream or for
their own consumption. Just over half of the sample, (51%) earns additional income from
other farm enterprises besides poultry, which is another indication that many farmers have
several sources of income alongside anything they earn from their poultry. Most poultry
farmers in the study area cultivate vegetables using poultry manure as a fertiliser thereby
reducing input costs (Frank et al., 2016) and the income they derive from the sale of
vegetables can be used to meet the operational costs of running a poultry business.
Over 40% of the sample claimed to have formal training in poultry keeping which is an
important asset for smallholder poultry farmers and may help to facilitate market
126
participation (e.g. by improving likelihood of access to up to date poultry marketing and
production information, (Farayola et al., 2013).
Respondents have a preference for accessing poultry market and production information
from informal sources. Specifically, 96% of respondents sought market information from
other poultry farmers. Importantly over 90% of farmers have access to regular or repeat
customers, providing them with a secure source of demand for their produce. Almost half of
the sample had access to qualified veterinary services; however, considering the importance
of veterinary services, this percentage is rather low. In terms of ownership of transportation
and communication assets, 61% of the sample own motorcycle and 94% own mobile
phones. The use of mobile phone to communicate and share information can bridge the
divide between farmers and buyers. Understandably, usage of mobile phone is ranked as
‘important’, having an average score of 4.20 on a scale of 1 to 5.
The average times that farmers spend using a motorcycle to travel from the farm to the
nearest market and nearest tarred road are 36.6 and 16.2 minutes respectively. Also the
mean times taken to travel by motorbike from the farm to the nearest health centre or bank
(used as proxy for remoteness) were 33.6 and 0. 38.4 minutes respectively.
The results of the analysis of farmers’ decisions to participate in poultry markets are
presented in section 4.3 below.

127
4.3 Smallholders decisions to participate in poultry markets and the extent of
their participation
Results of the Cragg’s double hurdle model on households’ decisions to participate in
poultry markets, i.e. probit model (all observations), and the extent or intensity of
participation, i.e. truncated regression model (non-zero observations), are presented in Table
22 below.
Maximum likelihood parameters for the double hurdle model are estimated independently
without loss of information (Wodjao, 2008; Yami et al., 2013), accordingly, the probit and
truncreg functions in Stata 13.1 were used to obtain the model estimates. In the first hurdle
(probit), the coefficients indicate a given variable influence on the likelihood or probability
of selling poultry regardless of the market channel used. Coefficients in the second hurdle
(truncreg) indicate how a given variable influences how much poultry is sold given that a
decision to sell poultry has been made.
The significant factors influencing the probability of market participation and extent of
participation are discussed below and are grouped under the following headings: individual,
household/economic, and transaction costs characteristics.
4.3.1 Individual characteristics
Three factors, i.e. gender (SEX), being local to the area (NATIVE) and access to formal
education, (EDUSTAT), are found to influence both the extent of participation and the
probability of participation.
Access to formal education (EDUSTAT) significantly (p<0.01) increases the probability of
a household participating in poultry markets and the marginal effects indicate that having
formal education is associated with a 4% higher probability of participation.

128
Table 22: Cragg's double hurdle model
Choice decision Quantity decision
Probit
(1st hurdle)
Truncated
regression
(2nd
hurdle)
Dependent
variable
Dummy = 1, if sold chicken;
0, if otherwise.
quantity of chicken sold
(non-zero observations)
Variables Coefficient Marginal
effect
z-value P-
value
Coefficient Marginal
effect
z-value P-
value
Constant -6.18
(1.19)
-5.21 0.00 -746.21
(164.76)
-4.53 0.00
SEX -1.41***
(0.41)
-0.07
-3.46 0.00
MARX 0.33
(0.43)
0.01
0.78 0.45 31.34*
(13.18)
0.00 1.83 0.07
FLOCK SIZE 0.03***
(0.01)
0.00
5.75 0.00 0.95***
(0.00)
0.00 97.59 0.00
HDSIZE 0.32***
(0.10)
0.01 3.28 0.00
VET 0.84**
(0.39)
0.04 2.16 0.03
EDUSTAT 1.10***
(0.54)
0.04 2.04 0.04 153.58**
(68.69)
0.06 2.24 0.03
NONPOINC 1.35***
(0.41)
0.06 3.27 0.00 16.22
(14.15)
0.00 1.15 0.25
CRED 0.63
(0.67)
0.03 0.95 0.34
FMTINFO
372.16***
(142.80)
0.20 2.61 0.00
TIME2MKT 1.91***
(0.57)
0.08 3.38 0.00
TIME2RD -4.48***
(1.32)
-0.20 -3.39 0.00
SAVE 0.11
(0.40)
0.00 0.28 0.78
COOP 0.57
(0.58)
0.03 0.99 0.32
NATIVE 0.32
(0.40)
0.01 0.79 0.43 46.90***
(17.14)
0.02 2.91 0.00

129
MOTCYC 30.66**
(15.43)
0.00 1.99 0.05
MOBFONE 0.27
(0.50)
0.55 0.59 112.86*
(63.59)
0.04 1.77 0.08
NONFAINC -33.51**
(15.61)
-0.01 -2.15 0.03
POULTRN 21.48
(15.53)
0.00 1.38 0.17
BACCT 1.87
(15.56)
0.00 0.12 0.90
Model
Summary
Wald Chi2 43.02 13989.34
Prob>chi2 0.00 0.00
Log-pseudo
likelihood
-28.77 -1532.37
***, ** and * represent P<0.01, P<0.05 and P<0.10 significance levels respectively and
numbers in parentheses are robust standard errors.
Also, given that a decision is made to participate in poultry markets, having formal
education significantly (p<0.05) increases by 6% the extent to which farmers’ participate.
The importance of formal education is most likely linked to the high value nature of rearing
poultry, which requires attention to detail, accompanied by rigorous operational
requirements such as the timing of drug administration, measuring the exact amount of feed,
regulating temperature, providing clean water, maintaining strict biosecurity measures and
understanding the effect of drugs, vitamins and other management practices on the health of
birds. These processes all require some degree of literacy, so it is unsurprising that having
some level of formal education makes farmers more likely to participate in poultry markets
and to sell more birds if they do so (Bolla et al., 2003).
Being native (NATIVE) to an area significantly (p<0.01) increases by 2% the extent to
which farmers participate in poultry markets. The explanation for this is most likely linked
to the land tenure system prevalent in Nigeria (Idoma and Isma'il, 2014) which makes
access to land easier for a local compared to a non-local. Therefore, the ease of accessing
land by locals enhances the probability of engaging in commercial poultry activity. Also,
being local eases the process of acquiring additional land or expanding an existing holding

130
(Ajibade, 2015) a situation that tends to increase the amount of birds that farmers may
decide to stock and enhance the extent to which they participate in poultry markets.
By contrast, being a male (SEX) significantly (p<0.01) lowers the probability of
participating in poultry markets. With men, having a 7% lower probability of participating
in poultry markets compared to women. The results suggest that female-headed households
in the sample are more market oriented and as such have a higher tendency to participate in
poultry markets.
It should be noted that while results show that women farmers are more likely to participate
in live poultry markets than their male counterparts, most respondents were males. This
reflects the dominance of male-headed households, even though women tend to be the main
poultry farmers and their direct10
input in the survey would have been more reflective of the
actual situation on ground.
A possible explanation may be that males tend to seek out better paying non-farm work,
which then leaves women with the opportunity to engage in commercial poultry husbandry.
Similar results were obtained in studies carried out by Lefebo et al. (2016b) in kocho11
markets and Honja et al. (2017) in mango markets where the studies suggested that women
tend to be concentrated at the lower level of the supply chain (i.e. unprocessed or raw farm
produce).
4.3.2 Household socio-economic characteristics
Three household-specific characteristics: quantity of birds (FLOCK SIZE), household size
(HDSIZE) and marital status (MARX) influence both the probability of participation and
extent of participation. Of the three variables, quantity of birds12
(FLOCK SIZE)
significantly (p<0.01) increases both the probability of poultry market participation and
extent of participation and the marginal effect implies that an extra bird added to the farm
results in a zero percent change in the probability of participation and extent of participation
respectively. The results underscores the importance of volume in poultry market
10
Although men filled the survey, they mostly relied on female input, so largely
information provided also had female input and was not totally male dominated. 11
Kocho is a traditional flatbread made from fermented starch from the enset plant Oulton,
R. (2010) Kocho. Available at: http://www.cooksinfo.com/kocho (Accessed: 03/12/2017). 12
Large flock size would be from 100 and above for any stocking period: Sonaiya, E.B.
and Swan, S.E.J. (2004) 'Small-Scale Poultry Production', FAO Animal Production and
Health, pp. 1-57.

131
participation since a unit increase brings no change on the probability and extent of
participation. It therefore means that a farmer will require a large number of birds to lower
the costs of transaction in order to enhance market participation. Similar results have
previously been observed by Woldie and Nuppenau (2011).
In like manner, household size13
(HDSIZE) significantly (p<0.01) increases the probability
of a farmer participating in poultry markets and the marginal effect implies that with an
additional household member, there is a 1% higher probability of market participation. This
means that an extra person in a household, positively influences the probability of a farmer
participating in poultry markets and suggests that increase in household size is associated
with a higher probability of engaging in commercial poultry enterprises, possibly as a
means of supporting their growing families (Gebremedhin et al., 2015).
On the contrary, being married (MARX) significantly (p<0.10) increases the extent to
which a farmer participates in poultry markets. The possible explanation for the positive
influence would be that it may be easier for a married farmer to access various factors of
production needed to participate in poultry markets, this ease being rooted in the socio-
economic status of marriage in the Nigerian context (Maliki, 2011). Being married is seen
as a respectable and responsible decision (Mokomane, 2012) that comes with both family
and societal responsibilities and one who is married is viewed as being capable of handling
such responsibilities and is seen as a serious minded individual who can be entrusted with
land, a strong consideration in deciding to participate in poultry markets.
4.3.3 Transaction Costs characteristics
Four transaction costs variables influence the probability of participation and extent of
participation. In particular, access to veterinary services (VET), supplementary farm income
(NONPOINC), distance from farm to nearest market (TIME2MKT) and distance from
farm to nearest tarred road (TIME2RD) significantly influence the probability of a farmer
participating in poultry markets. On the other hand, farmer to farmer information exchange
(FMTINFO), ownership of a motorcycle (MOTCYC), ownership of a mobile phone
(MOBFONE) and having a non-zero non-farm income (NONFAINC) each significantly
influence the extent of participation.
13
Large household size would be from 6 and above: National population commision
Nigeria (NPC) and International, I. (2014) 'Nigeria Demographic and Health Survey 2013',
Abuja, Nigeria, and Rockville, Maryland, USA: NPC and ICF International.
132
4.3.3.1 Probability of market participation
In effect, time taken to reach the nearest market proxy for distance from farm to nearest
market (TIME2MKT) significantly (p<0.01) increases the probability of a farmer
participating in poultry markets and the marginal effect implies that travelling an additional
hour using motorbike from the farm to the nearest market is associated with an 8% higher
probability of participating in poultry markets. This means that distance to market
significantly increases the probability of a farmer participating in poultry markets by as
much as eight percent and suggests that commercial poultry farmers tend to be located
further from live poultry markets.
The finding is rather surprising, although Sebatta et al. (2014) obtained a similar result for
smallholder decision to participate in Ugandan potato markets. Normally, one would expect
that distance to market would lower the probability of market participation, hence a negative
sign might have been expected. A possible explanation may be that farmers living further
away from markets may opt to participate in the market by selling at the farm-gate. In such
cases buyers bear the transport costs of travelling to the farm. Also, the greater availability
of land in more remote areas (Oyekale, 2007), may mean that farmers have the space to
keep more birds, therefore increasing the probability of market participation.
Conversely, time taken to reach nearest tarred road proxy for distance from the farm to the
nearest tarred road (TIME2RD) significantly (p<0.01) reduces the probability of a farmer
participating in poultry markets and the marginal effects imply that travelling an additional
hour using motorbike from the farm to the nearest tarred road is associated with a 20 percent
lower probability of participating in poultry markets. The implication is that farmers located
in areas further from tarred roads i.e. rural settings, with possibly poor road infrastructure
are much less likely to participate in poultry markets, which therefore means that farmers
closer to tarred roads are more likely to participate in poultry markets. There are two
possible explanations for this. First, participating in poultry markets requires farmers to
travel to purchase feed, and access veterinary and other services. As such, the further away a
farm is from a tarred road, the less likely it is that a farmer will want to engage in
commercial poultry due to the difficulty of navigating untarred and poor road networks.
Secondly, because of the poor road infrastructure buyers may decide not to travel to the
farm, so farmers are faced with incurring high transport costs if they wish to participate in

133
poultry markets. The results highlight the need for good road networks in remote areas in
order to facilitate economic activities such as live poultry sales.
In addition, access to supplementary farm income other than that which is obtained from
selling poultry (NONPOINC) significantly (p<0.01) increases the probability of a farmer
participating in poultry markets and the marginal effect implies that supplementary farm
income is associated with a 6% higher probability of participating in poultry markets. This
suggests that many poultry farmers also engage in other farm enterprises (Akintunde, 2015).
In particular, farmers in the study area are known to engage in crop and vegetable farming
(Enete and Okon, 2010). This is an indication that most poultry farmers are traditionally
staple crop farmers who use poultry as an opportunity to increase their income. The
supplementary income derived from the other farming enterprises serves as a source of
ready cash to invest or re-invest in the poultry business. This is important as poultry is a
cash intensive enterprise and resource poor farmers need readily available capital to keep up
with the demands of business.
Furthermore, access to veterinary services (VET) significantly (p<0.05) increases the
probability of poultry market participation and the marginal effects imply that a farmer with
access to veterinary services has a 4% higher probability of participating in poultry markets.
The possible explanation for the result is that in the study area, day old chicks (DOC) the
main input in starting a poultry business are usually bought from veterinary outlets, which
enables farmers to come into contact with veterinary practitioners (Ochieng et al., 2013).
This indicates the vital role that veterinary services play in the poultry sector considering
that a single bird can spread diseases that could prove fatal to a poultry business. With this
in mind, the use veterinary services cannot be avoided which makes farmers who have
ready access to veterinary services more likely to participate in poultry markets.

134
4.3.3.2 Extent of Market participation
A closer inspection of the results shows that accessing information from other farmers
(FMTINFO) significantly (p<0.01) increases the extent to which a farmer participates in
poultry markets. The results suggest that once a decision is made to participate in poultry
markets, seeking out information from other poultry farmers, increases the extent to which a
farmer participates by as much as 20%. It is therefore assumed that most farmers tend to
contact other farmers if they are thinking of expanding their operations. This result may be
explained by the fact that poultry farmers, particularly the more experienced ones, act as
informal advisers, trainers, motivators and role models to other poultry farmers who intend
to increase their level of participation (Brhane et al., 2017).
In addition, ownership of motorcycle (MOTCYC) significantly (p<0.05) increases the
extent to which a farmer participates in poultry markets but the marginal effects in terms of
the percentage increase is negligible. This suggests that perhaps the use of a larger vehicle
might bring about a more tangible increase in participation.
The use of motorcycle may be explained by the fact that in the rural settings where farmers
are mostly based, road networks are often difficult to access (Ibok and Daniel, 2013), using
a motorcycle eases the process of running a poultry business; also, a motorcycle has low
maintenance costs and can cope with narrow and untarred roads; making it an easy and
convenient means of transport (Ayanwuyi, 2013) that can be used to carry out demanding
every day poultry operations, such as fetching water from the local river or stream, moving
away poultry manure and transporting feed bags (25kg/bag) from feed shops located in
urban areas to the farm. Since most farmers will prefer to buy feed in bulk, motorcycles
lessen the costs associated with this exercise (Kassali et al., 2012).Therefore, in carrying out
poultry operations, the use of a motorcycle particularly in rural areas is of immense
importance (Riverson and Carapetis, 1991; Usman, 2014). However, in terms of actual sales
volumes motorcycle use makes little difference. In many cases, sales occurs at the farm-gate
and birds do not need to be transported to the market.
On the contrary, access to non-farm income (NONFAINC) significantly (p≤0.05) lowers by
1% the extent to which a farmer participates in poultry markets and means that once a
decision is made to participate in poultry markets, non-farm work significantly lowers the
extent to which a farmer is able to participate in poultry markets. A similar result was
obtained by Sebatta et al. (2014) and a possible explanation might be that earning a regular
135
non-farm income may mean that a farmer is already able to meet daily household
obligations, therefore the motivation to increase the level of participation in poultry markets
is reduced. The result may also be due to the lack of time available to spend on the poultry
enterprise if earning the non-farm income requires a regular and extensive time
commitment. It could therefore be argued that having sources of off-farm income may make
it likely for a farmer to be less involved in poultry (Agbonlahor et al., 2015). This suggests
that extent of market participation is enhanced in situations where farmers earn little from
non-farm work and so have the time to engage more fully in their poultry businesses.
Ownership of a mobile phone (MOBFONE) significantly (p≤0.10) increases by 4% the
extent to which a farmer participates in poultry markets. The implication of this finding is
that owning mobile phone eases the selling process and enhances participation (Masuki et
al., 2010; Qiang et al., 2011). There are several possible explanations for this result. Firstly,
by easing the means of communicating with customers, suppliers and potential buyers,
mobile phone usage facilitates business transactions (Duncombe, 2015). Secondly,
ownership of a mobile phone improves time management and helps speed up regular
transactions such as ordering new stock all of which can lead to an improved sales turn
around (De Silva and Ratnadiwakara, 2010).
The next section presents a discussion of how of transaction costs factors can influence the
choice of farm-gate sales versus the spot market.

136
4.4 Influence of transaction costs on choice of selling through the farm-gate
To determine the factors influencing a farmer’s selection of farm-gate over selling birds at
the market, a two-limit Tobit analysis (Hobbs, 1997; Gong et al., 2006; Woldie and
Nuppenau, 2011) was applied and the results are presented in Table 23 below.
Table 23: Two-limit Tobit model
Two-limit Tobit model
Dependent variable Proportion of live chickens sold at the farm-gate
Variable Coefficient Marginal
effect
t-value p-value
Constant -504.14
(514.75)
-0.98 0.33
FLOCK SIZE
(Bargaining or
Negotiating costs)
0.83***
(0.06)
0.00 13.41 0.00
PRIXCHK
(Information & search
costs)
-0.46*
(0.29)
-0.00 -1.60 0.11
TIME2MKT
(Information and
search costs)
57.12
(46.07)
0.02 1.24 0.22
TIME2HEA
(Information and
search costs)
150.72*
(82.43)
0.06 1.87 0.06
MTNEINFO
(Information and
search costs)
71.60
(155.07)
0.03 0.46 0.65
NEGOPOW
(Bargaining or
Negotiating costs)
108.14**
(46.85)
0.04 2.31 0.02
REPCUST
(Monitoring &
enforcement costs)
489.79*
(260.78)
0.20 1.88 0.06
MOBIMPT 0.72 0.00 0.02 0.99

137
(Information and
search costs)
(40.49)
Number of
observations
259
Log pseudo likelihood -1839.598
F(8,251) 51.40
Prob>F 0.0000
***, ** and * represent P<0.01, P<0.05 and P<0.10 significance level respectively and numbers in
parentheses are robust standard errors.
A closer inspection of the results in Table 23 shows that the proportion of live broilers sold
through the farm-gate as opposed to the spot market is influenced by the quantity of broilers
stocked (FLOCK SIZE) in the reference year, the live-weight price (PRIXCHK) and three
transaction costs factors: price expectation (NEGOPOW) which is related to negotiation
and bargaining costs incurred during the transaction (Hobbs, 1997; Woldie and Nuppenau,
2011); distance to nearest health centre (TIME2HEA); and existence of repeat or regular
customers (REPCUST) (Gong et al., 2006; Jagwe and Machethe, 2011).
Specifically, the findings show that the quantity of broilers a farmer stocks (FLOCK SIZE)
significantly (p<0.01) increases the proportion of live broilers sold through the farm-gate. In
other words, the more birds a farmer stocks the more likely it is that she will opt to sell at
the farm-gate. It can be suggested that households with fewer birds may opt to sell at the
spot market, since it is less likely that buyers will travel to their farms to choose from their
small selection of birds. Travelling to and participating in spot markets is however, fraught
with inconvenience in terms of the reliability and suitability of transport services as well as
the type of transport service as such farmers tend to face higher transaction costs when
selling at the spot market than selling at the farm gate.
This result further suggests that bulk sales are more likely to occur at the farm-gate as
opposed to the spot market where most customers buy small numbers of birds for household
consumption (Wiggins and Compton, 2016).
Also, distance from farm to the nearest health centre (TIME2HEA) significantly (p<0.10)
increases the proportion of live broilers sold through the farm-gate and indicates that the
time required to travel to the nearest spot market (using travel time to the nearest health
centre as a proxy) increases the proportion of birds sold at the farm-gate (e.g. by 6% for an

138
additional one hour journey by motorcycle). In other words, the more remote a farm is, the
more birds sold at the farm-gate. Therefore, the decision to sell at the farm-gate is at least
partly determined by a farmer’s location. It therefore seems that a farmer need not
necessarily be located near townships or urban areas in order for sales to occur, which
implies that remoteness of farms is not necessarily a disadvantage as long as customers live
nearer to your farm than to the nearest spot market.
It has already been noted that farmers in remote rural areas, where land is relatively
available and affordable, may have the space to stock more birds than they would be able to
nearer to town (Abebe et al., 2016) and that stocking in such large numbers enables farmers
to sell in bulk, which opens up the opportunity to sell to middlemen who have the means
and resources to buy large numbers of birds. In the study area, it is not uncommon to see
mini-trucks and pick-up vans driving through villages buying large quantities of birds from
farmers (Pagani et al., 2008).
It should be noted that most rural markets are held in open-air locations which has some
disadvantages for those selling live birds: for example, if it rains, birds will need to be
protected which may involve renting a covered space and the attendant charges that come
with that. Also, there is a possible problem of theft if birds are kept at the market overnight
as many open-air markets do not have adequate security measures. In addition, rural
markets do not operate on a daily basis (Oguoma et al., 2010) and are often small markets
that do not attract many buyers.
Furthermore, the main means of transport for rural farmers is the motorcycle, which while
very useful, has a limited capacity. Often transport costs are fixed, and if a farmer only has a
small number of birds to sell this may not be large enough to justify the costs of hiring a
larger vehicle, leaving the farmer no option but to sell at the farm-gate. Where farmers with
larger stock attempt to sell them at the farm gate, they may find that sales to local people are
not sufficient to clear their stocks. In such cases middlemen, who may be willing to buy
more birds but at a lower unit price, come into the picture since they can purchase large
enough quantities to fill their trucks and justify their own transport costs. Middlemen also
prefer to buy at the farm-gate since they can inspect (sort and grade) the poultry on offer
and make choices based on the needs of their own customers (Sandika, 2011; Chigusiwa et
al., 2013).
139
In a similar fashion, having repeat or regular customers (REPCUST) significantly (p<0.10)
increases the proportion of live broilers sold through the farm-gate. Having regular
customers reduces a farmer’s search and negotiation costs (Woldie and Nuppenau, 2011),
since over time farmers build trusting relationships with these customers meaning that the
time spent searching for new buyers or advertising14
is reduced. There are also savings
around negotiating prices and arranging payments since these factors are usually well
established.
As noted previously, when birds are market ready, farmers aim to sell in large numbers as
quickly as possible so as not to incur the costs of additional inputs such as feed.
Accordingly, having regular customers can means that future sales have already been
agreed, so that when birds are market ready, they can be sold quickly and in bulk, though
perhaps at a reduced unit price. Selling at the farm-gate can sometimes take the form of
quasi-contract arrangement (Sriboonchitta and Wiboonpoongse, 2008).
Results also indicate that a farmer’s expectations regarding price (NEGOPOW)
significantly (p<0.05) increases the proportion of live broilers sold at the farm-gate. In other
words, farmers can fix prices ahead of farm-gate transactions allowing them a better
negotiating position with buyers who are faced with the alternative of taking the price
offered or finding another supplier According to the model, price fixers can expect to
increase the proportion of live broilers sold at the farm-gate by 4% when compared to
selling at the spot market, where little or no relationship is developed between the buyers
and sellers and the quantities sold are small (Arias et al., 2013).
Also at the spot market farmers have to compete for buyers with other traders, thereby
weakening their negotiating position. It is therefore not surprising that farmers will opt to
sell at the farm-gate where they can have a stronger negotiating position (Maina et al.,
2015).
Farm-gate sales can be compared to wholesale markets, Goossens et al. (1994) argue that
wholesale markets reduce operating costs and lower product losses by reducing the time
needed to complete transactions, affords greater price transparency (possibly due to
established farmer-customer relationships) and reduces marketing risks all of which
contribute to lowering transaction costs at the farm-gate.
14
Advertising in this context refers to the time spent creating awareness by word-of-
mouth.

140
The findings also show that live-weight prices (PRIXCHK) are significantly (p<0.10)
lower at the farm-gate compared to the spot market but that a one unit increase in price
brings about no tangible change in the proportion sold at the farm-gate. In other words, a
one naira increase in live-weight price does not change the proportion sold through the
farm-gate. This finding further supports the strong negotiating position of farmers selling at
the farm-gate, where they can increase prices slightly with little or no difference on the
number of birds sold. On the other hand, the most likely explanation may be that live birds
offer the least added-value and by eliminating transport costs, prices are lower.
In the study area, middlemen buy live birds in large amounts in a single purchase (Ozor et
al., 2015), the birds are processed, refrigerated and supplied to fast food outlets, hotels,
shops, restaurants and supermarkets. Prices usually double between live birds and frozen
birds. For instance, in the study area, the average price of a kilogram of frozen chicken
ranges between ₦2000-₦2300 (£6.5-£7.49)15
while the farm-gate price for a live chicken is
₦1000 (£3.26). Perhaps a reasonable conclusion is that products offering little or no added-
value attract lower prices (Amani, 2014) and it is realistic to conclude that farmers opt for
higher revenues based on increased sales rather than higher prices (Mutayoba and Ngaruko,
2015).
4.5 Reflections on Model limitations
The major limitation of Cragg’s model is that the amounts equation (truncated model) is
modelled only on farmers where positive sales is reported. By so doing, sample size is
smaller for the amounts equation, a situation that does not arise in the case where a Tobit or
Heckman model is used (Hicks et al., 2010). For the study, 259 samples where included in
the amounts equation, instead of the 361 samples in the study used for the first stage
decision equation. Consequently, the magnitude of coefficients in the amounts equation
always tend to be over-exaggerated. In order to overcome this, marginal effects are
calculated instead and this reflects a more realistic magnitude of coefficients, which are then
used to interpret results. The results are therefore interpreted throughout the study using
marginal effects as an attempt to address the shortcomings of the Cragg’s model employed
in the study.
15
Exchange at the time of survey was £1= ₦307.16
141
4.6 Chapter summary
This chapter has presented the findings obtained from the quantitative phase of this mixed
methods study. This phase of the study determined transaction costs and other individual
and household socio-economic factors predicted to influence the market participation
decisions of smallholder poultry farmers in Nigeria. This objective was met through
analysis of primary data from a 2015 survey. The analysis involved independently applying
the Cragg’s double hurdle model and a Tobit model using maximum likelihood parameter
estimates. The Cragg’s double hurdle model comprised of a probit model in the first hurdle
used to determine the factors that influence probability of market participation. The model
found that: gender, stock size, household size, access to veterinary services, educational
status, access to supplementary farm income, distance to market, and distance from a
metalled road, are all statistically significantly factors that influence the probability of
market participation by smallholder poultry farmers.
The extent of market participation involved applying a truncated model in the second
hurdle. The model found that: marital status, stock size, educational status, farmer to farmer
information exchanges, being native to the area, ownership of a motorcycle, ownership of
a mobile phone and access to non-farm income are all statistically significantly factors
influencing the extent of market participation. In addition, the Tobit model was used to
determine the choice of selling at the farm-gate compared to the spot market and findings
showed that: stock size, live-weight price, farm location, price expectation and having
repeat or regular customers were all statistically significantly factors influencing the
decision to sell at the farm-gate.
This phase of the study was therefore successful in identifying key transaction costs factors
that influence the market participation decisions of a sample of smallholder poultry farmers.
In the next chapter, a subset of the statistically significant findings are identified for further
exploration in the qualitative phase of the study, which aimed to explore the perceived
influences of transaction costs on the market participation decisions of smallholder poultry
farmers.

142
Chapter 5. Connecting the Quantitative and Qualitative Phases
5.0 Connecting the Quantitative and Qualitative Phases
5.1 Introduction
This chapter connects the quantitative and qualitative phases of the explanatory sequential
mixed method design employed in this study. This is the intermediate stage of the mixed
methods design, where key findings from the quantitative phase of the study are selected
and explored in greater depth in the qualitative phase.
In the study, smallholders are defined as non-salaried households stocking 100 birds and
below. Market participation is defined as the decision to sell live broiler birds and extent
of participation is defined as the number of birds that a farmer decides to sell. Choice of
location of sale is also considered, particularly the decision to sell at the farm-gate or at the
spot market, under the assumption that farmers, will opt to sell at the outlet where they can
maximise their returns after costs (including transaction costs) are taken into account
(Cuevas, 2014).
The following sections briefly outline the significant findings derived from the
quantitative phase and are grouped into individual, household/socioeconomic and
transaction costs factors for easy signposting (McAteer, 2013). These findings were drawn
from the statistically significant factors obtained from the models presented in the
preceding chapter, and are discussed in relation to the relevant literature, after which the
approach employed for the qualitative data analysis is discussed.
In connecting the quantitative and qualitative phases, this study was guided by the
following research questions:
1. Which factors are found to significantly influence the probability of farmers
participating in poultry markets?
2. Which factors are found to significantly influence the extent of farmers’ participation in
poultry markets?
3. Which factors are found to significantly influence farmers’ decisions to sell at the farm-
gate rather than the spot market?
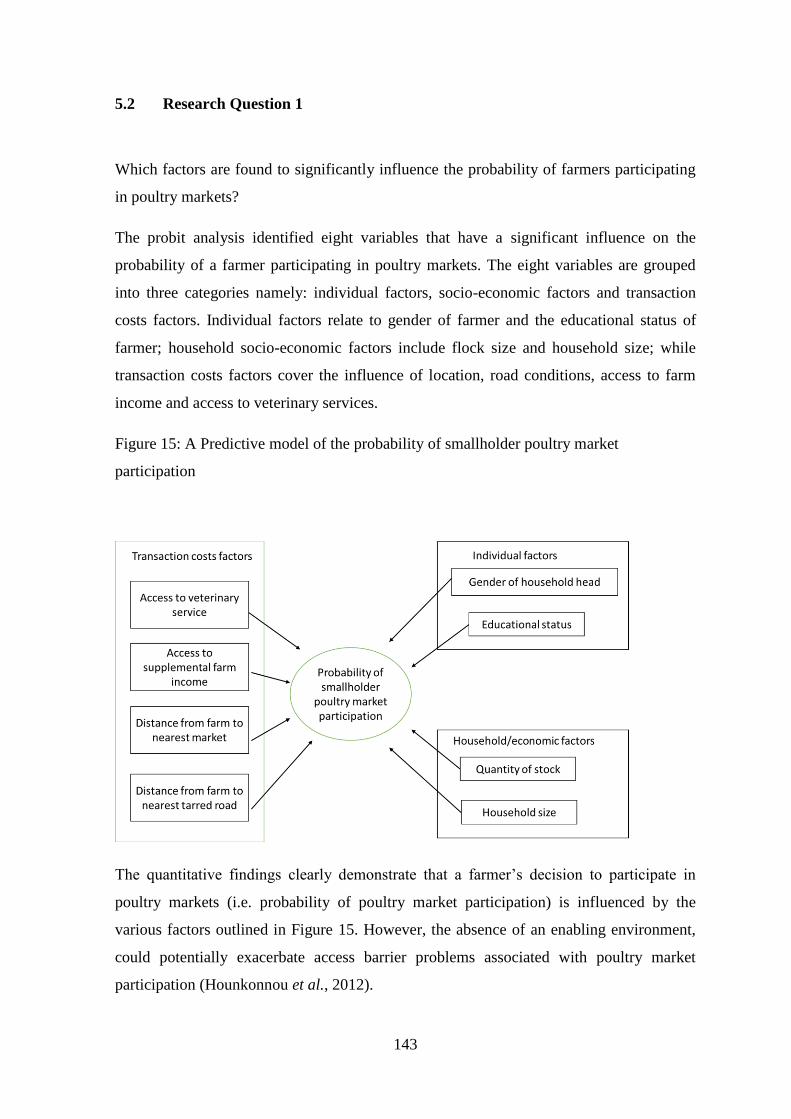
143
5.2 Research Question 1
Which factors are found to significantly influence the probability of farmers participating
in poultry markets?
The probit analysis identified eight variables that have a significant influence on the
probability of a farmer participating in poultry markets. The eight variables are grouped
into three categories namely: individual factors, socio-economic factors and transaction
costs factors. Individual factors relate to gender of farmer and the educational status of
farmer; household socio-economic factors include flock size and household size; while
transaction costs factors cover the influence of location, road conditions, access to farm
income and access to veterinary services.
Figure 15: A Predictive model of the probability of smallholder poultry market
participation
The quantitative findings clearly demonstrate that a farmer’s decision to participate in
poultry markets (i.e. probability of poultry market participation) is influenced by the
various factors outlined in Figure 15. However, the absence of an enabling environment,
could potentially exacerbate access barrier problems associated with poultry market
participation (Hounkonnou et al., 2012).
144
For example, a lack of institutional support is likely to prevent smallholder poultry market
participation (Mapiye et al., 2008), whereas accessing institutional support by way of
veterinary services turned out to be a significant factor in enhancing a farmer’s decision to
participate in poultry markets, since veterinary services provide front-line vaccination for
day old chicks (DOCs) alongside the prevention and control of diseases crucial for poultry
survival (Kolawole et al., 2007). Veterinary support is therefore a motivation for farmers
to participate in poultry markets and enhances the prospects for increased participation.
However, farmers’ perception on the enabling environment governing access to this
service is unclear at least within the context of the study, hence the qualitative data should
provide a window to better understand how this service is provided and the ease to which
they are accessed.
The statistically significant finding also demonstrated that being located further from a
tarred road was a reason for non-participation which means that farmers located closer to
tarred roads or towards urban and peri-urban areas are more likely to participate in poultry
markets, thereby dis-enfranchising farmers that are located further off tarred roads (see
section 4.3.3.1). The results are consistent with that of Ouma et al. (2010) wherein the
further the distance to the nearest urban area significantly (p<0.05) lowered farmers
decision to participate in the banana markets of Rwanda and Burundi. However, within the
context of this study, the ease on how farmers located further off tarred roads access
poultry markets is unclear, hence, qualitative interviews should provide further insights.
5.3 Research question 2
Which factors are found to significantly influence the extent of farmers’ participation in
poultry markets?
The truncated regression model identified eight variables that have a significant influence
on the extent of farmers’ participation in poultry markets. The individual factors relate to
being formally educated and farmers indigenous status; household/economic factors
include flock size and the marital status of farmers; while transaction costs factors include
means of transport, use of informal information sources, use of communication
infrastructure and non-farm employment.

145
Figure 16: A predictive model of extent of smallholder participation in poultry markets
The findings demonstrate that extent of poultry market participation is influenced by the
factors outlined in Figure 16. For example, being formally educated improves the chances
of obtaining off-farm employment (Idowu et al., 2011) and at the same time enhances the
extent to which farmers’ participate in poultry markets (Sebatta et al., 2014). Poultry is a
high value specialized product (Hellin et al., 2015) and investment whether physical or
intangible has little or no alternative use outside of poultry husbandry (Dana et al., 2006).
In other words, if the business fails poultry-related skills are often non-transferable to
other farm enterprises (Salviano and Wander, 2015). Accordingly, while formal education
enhances off-farm work prospects, it is also needed to underpin the management and
conduct of a poultry business. Therefore, while in some cases, having some, measure of
formal education may lead farmers to be less engaged in poultry production and at the
same time, education is an advantage for farmers involved in poultry husbandry.
Therefore, the perception of farmers as to how education influences market participation
decisions in the context of the study require further exploration hence a series of probing
questions were raised for further exploration in the qualitative phase.
Furthermore, the quantitative phase suggested that accessing market information from
other poultry farmers was a significant factor in enhancing the extent of farmers’
participation in poultry markets. It is important therefore to explore through qualitative

146
data the ease to how farmers navigate through informal information sources within the
context of the study.
5.4 Research Question 3
Which factors are found to significantly influence farmers’ decisions to sell at the farm-
gate rather than the spot market?
The Tobit analysis identified five variables that have a statistically significant effect on
explaining farmers’ preferences for selling live birds at the farm-gate rather than at the
spot market. The five variables are again grouped into household/economic factors and
transaction costs factors. The former comprised flock size and price, while the latter
included farm location, negotiating position and repeat transactions.
Figure 17: A predictive model of factors influencing farmer's preference for farm-gate
sales
The quantitative findings clearly demonstrate that opting to sell at the farm-gate is
influenced by the various factors outlined in Figure 17. For example, remoteness of
location was found to enhance farmers’ preferences for farm-gate sales as opposed to
selling on the spot market. To better under why and how the finding might explain this
preference, require an understanding of how both markets are being perceived by farmers.
Similarly, increased farm gate sales was associated with having repeat or regular
customers as such exploring how these repeated interactions are established and sustained
over time e.g. building trust with buyers over time (Muthini et al., 2017) may be an
important contributory factor. Considering that some buyers travel long distances to buy
147
from farmers, often bypassing other farms along the way (Adeoti et al., 2014), it would be
useful to explore these findings in greater depth.
The next section discusses the development of the qualitative protocol.
5.5 Developing the qualitative protocol
In order to better understand how and why these statistically significant factors might
influence smallholder poultry market participation and to explore their lived experiences, a
series of questions (see Appendix B.3) was developed with the aim of facilitating in-depth
understanding of the effects of transaction costs factors that might have been difficult to
observe or explain in the quantitative phase.
The framework approach used to analyse the qualitative data is presented in section 5.6
and the criteria for trustworthiness used to gauge the methodological quality of the
qualitative analysis are described in section 5.7
5.6 Analysis of Interview data
The researcher from the original audio recordings transcribed the interviews verbatim. In
line with ethical considerations, anonymity of informants was protected during
transcription. This was done by using a pseudonym16
instead of the informant’s name.
Framework analysis (Furber, 2010; Smith and Firth, 2011) was used to analyse the
interview data: framework analysis is a qualitative methodology used for applied policy
research, particularly in health sciences research (Ritchie and Spencer, 1994; Gale et al.,
2013; Parkinson et al., 2016). The framework approach17
is also suited to research designs
which address specific questions having a priori objectives and a limited time frame to
complete as is the case in this study (Srivastava and Thomson, 2009).
One of the merits of framework analysis is that it can be used to manage and analyse
qualitative data transparently, allowing data to be sifted, charted and sorted in a systematic
way. By so doing, ambiguity in the analysis process is reduced, since it is possible for
researchers to establish links between the original data and the thematic findings. This
16
Common ‘IBIBIO’ names were used as pseudonyms 17
The terms framework approach and framework analysis are used interchangeably and
mean the same thing.
148
makes framework analysis particularly suited for novice qualitative researchers, since the
approach provides a clear route to the processes involved in generating and identifying the
themes in a qualitative analysis (Smith and Firth, 2011; Ward et al., 2013). Framework
analysis is chiefly concerned with describing and interpreting what is occurring in a
particular setting. Within the approach, the systematic analysis of qualitative data is
guided by five steps (Ritchie et al., 2003; Spencer et al., 2003) as described below:
Familiarisation
Identifying a thematic framework
Indexing
Charting
Mapping and Interpretation
5.6.1 Familiarisation
This is the first stage in the framework analysis and, as the name suggests, it involves
immersing oneself in the raw data (Ritchie et al., 2003). Also, due to the large volume of
data involved in qualitative analysis, researchers often find it impracticable to review the
entire transcript (Srivastava and Thomson, 2009), so this stage affords the researcher the
opportunity to weed out unnecessary information (Smith and Firth, 2011). Initial
familiarisation with the data was achieved during the interview process. This was
enhanced by listening to the audio recordings and transcribing the data, while studying the
field notes gathered during the interviews. By repeatedly listening to the audio recordings,
the researcher was able to extract relevant ideas by reflecting on possible reoccurring
themes (Furber, 2010).
A particular familiarisation activity of a somewhat similar nature suggested by Ritchie et
al. (2003) was performed by the researcher and involved reviewing three of the audio-
taped interviews, one drawn from each local authority and consisting of two males and one
female. The audiotapes were carefully listened to, to check for the quality and composition
of the recordings. This process enabled the researcher to become more familiar with the
data and at the same time identified possible recurrent themes from the native language
149
that was used in the interviews. The findings drawn from this stage were used to build on
to the thematic framework, which is the second stage in the framework analysis.
5.6.2 Identifying a thematic framework
According to Pope et al. (2000), this stage involves identifying and organising relevant
ideas and themes into a framework that makes it possible for the data to be indexed.
Recognising the iterative nature of qualitative research, the approach adopted was to
develop the final thematic framework by continuously refining the earlier framework in a
course of action that was modified as new themes emerged.
The ‘Introductory’ thematic framework was drawn from the relevant ideas that were
derived in the familiarization stage. These ideas were broken down into main themes and
sub-topics. Afterwards, the ‘earlier framework’ was replaced by an ‘interim framework’
midway through the indexing stage (section 5.6.3 below) and was later replaced by the
final framework after all interviews were indexed. This refinement process ensured that
new themes and sub-topics that emerged were included in the analysis (Totman et al.,
2015). The final thematic framework is detailed in Appendix B.4.
5.6.3 Indexing
The indexing process involves a systematic application of the thematic framework to the
textual data (Srivastava and Thomson, 2009). This means that the researcher identifies
sections or pieces of the data corresponding to a specific theme. In practice, indexing was
performed by examining the interview transcripts and judgements were made by going
through each passage of the textual data corresponding to the themes or sub-topics derived
from the thematic framework.
In the case where new themes or sub-topics emerged, a new category was included in the
framework. To ease the management of the data, NVIVO®
was used in the indexing
process, this involved using ‘nodes’ to identify the themes and sub-topics. Therefore by
simply clicking on the button representing a node, it was possible to retrieve the data
indexed under a particular theme.
150
5.6.4 Charting
This is the fourth stage in the framework analysis, it is in this stage that the indexed data
are lifted and placed in charts corresponding to the themes. The charts consist of major
themes to emerge from the textual data. An important feature of the charting process is
that it is possible to identify the case where the lifted data came from. This process was
implemented by summarising, organising and presenting the data in form of a chart so that
the researcher could compare, contrast and explore the expressions on a theme in more
depth across individual cases (Furber, 2010; Totman et al., 2015).
Charts were constructed in the form of a spreadsheet with rows assigned to an informant
and columns assigned to a topic or heading and sub-topic or sub-heading. The initial
column contained information on the characteristics of informants and the remaining
columns contained possible follow up information that the researcher needed. An example
of a thematic chart is provided in Appendix B.5.
5.6.5 Mapping and Interpretation
This is the stage where the major features laid out in the charts are analysed by providing
explanations for the a priori issues laid out in the research objectives. Accordingly, this
stage describes informants’ accounts by relying on the thematic charts as a mapping tool
to aid in identifying the forms of association reflective of informants’ experiences that
exist within the themes (Srivastava and Thomson, 2009; Furber, 2010; Smith and Firth,
2011).
At this stage, a schematic picture of the phenomena to be analysed is presented which
guides the researcher in interpreting the data. For this study, insights and explanations of
the themes were supported by a variety of quotes selected to illustrate particular aspects of
the transaction costs identified as influencing market participation or to highlight
interesting comparisons and disparities in the informants’ accounts.
In order to preserve the originality of the data, the quotes used are English translations of
the original words from the informants’ transcripts, and any additional words that were
inserted for clarification are placed in square brackets.
151
Within the text, informants’ pseudonyms and characteristics were also included to show
how they differed by gender, marital status, education, location and locality: this was done
to enhance comparisons between informants.
5.7 Methodological quality
The methodological quality of this phase of the study followed the criteria of
trustworthiness outlined in Guba and Lincoln (1994) which are: credibility, transferability,
dependability and confirmability. These are discussed below.
Credibility refers to the harmonisation of an informant’s testimony against the account
provided by the researcher. Credibility seeks to confirm that a true account of the
phenomenon under investigation is presented and describes the accuracy to which an
informant’s depiction of their lived experiences is portrayed by the researcher; that is, it
seeks to ensure that the information provided by an informant is properly conveyed to
reflect its true account and by so doing, establishes confidence in the qualitative findings
(Shenton, 2004) .
Credibility was established in the present study through an iterative technique of the type
described in sections 5.6.2 and 5.6.3 above, and involved continuously comparing,
refining and developing the thematic framework by incorporating new themes and sub-
topics as they emerged. By so doing, the researcher was able to check for discrepancies in
the data.
Another technique employed involved a series of strategies to ensure that informants were
honest in their accounts. Firstly, participation in the interview was voluntary: as such
informants were at liberty to refuse to participate and by so doing, informants were able to
freely divulge information because only those who were interested in participating the
study were interviewed. Also, informants were reminded that there were no wrong or right
answers to the questions asked, which further encouraged them to give honest answers
(Shenton, 2004; Anney, 2015).
The researcher made it clear that the research was independent the at the start of the
interview by stating that neither the researcher nor the research was directly linked to any
government agency and that strict anonymity for respondents was guaranteed. This meant
that, informants were able to express their view without fear of repercussions. The

152
researcher also made it clear that informants had the right to withdraw at any point during
the interview, and this motivated informants to be open, knowing that if they felt
uncomfortable with any question they could decide to either withdraw or refuse to answer.
The researcher also performed an ‘informants check’ (Sinkovics et al., 2008) which is
regarded by Guba and Lincoln (1994) as crucial in bolstering a study’s credibility. To do
this, the researcher carried out an on the spot evaluation of the audio-recordings by
requesting that the informants’ listen to their own recordings, with the aim of enabling
informants to confirm whether their words actually matched what they intended to express
(Shenton, 2004).
Transferability addresses the extent to which findings in a qualitative study are applicable
to other situations beyond the study in which they were generated, so that a reader can
assess how the findings in one study fit or relate to another. To aid this assessment, ‘thick
descriptions’ (Morrow, 2005) referring to the detailed description of the study settings
alongside the samples and methods described in section 3.11 were reported. By so doing, a
reader in a similar contextual situation to that described in the study would be able to
relate the findings to their own situation.
Dependability in a qualitative study addresses the notion of the consistency and
replicability of qualitative findings (Shenton, 2004; Morrow, 2005) In other words,
dependability defines the level to which other researchers agree over how the data is
interpreted (Sinkovics et al., 2008). In this study, dependability of the findings was
enhanced by the researcher holding series of brainstorming meetings and consultations
with the supervisory team (Guy Garrod and Carmen Hubbard) to agree and harmonise on
the coding and interpretation of the thematic analysis applied to the interview data.
Confirmability is concerned with the extent to which the qualitative findings are informed
by the data, signifying that findings are shaped by the informants and not influenced by
researcher interests, motives or bias (Anney, 2015). To address the confirmability
criterion, the researcher ensured that the qualitative findings were the results of the lived
experience of informants as presented by them, by carefully making reflexive annotations
throughout the data analysis process, particularly during the transcription of data where
words spoken in ‘Ibibio’ had to be translated into English, therefore making it possible to
misconstrue informants’ accounts. To overcome this situation, the researcher continually
reflected on ways in which the qualitative findings might be influenced by researcher bias

153
by ensuring that the translations were not influenced by any prior assumptions or
experiences held by the researcher but on English words corresponding to the ‘Ibibio’
language informants mostly used.
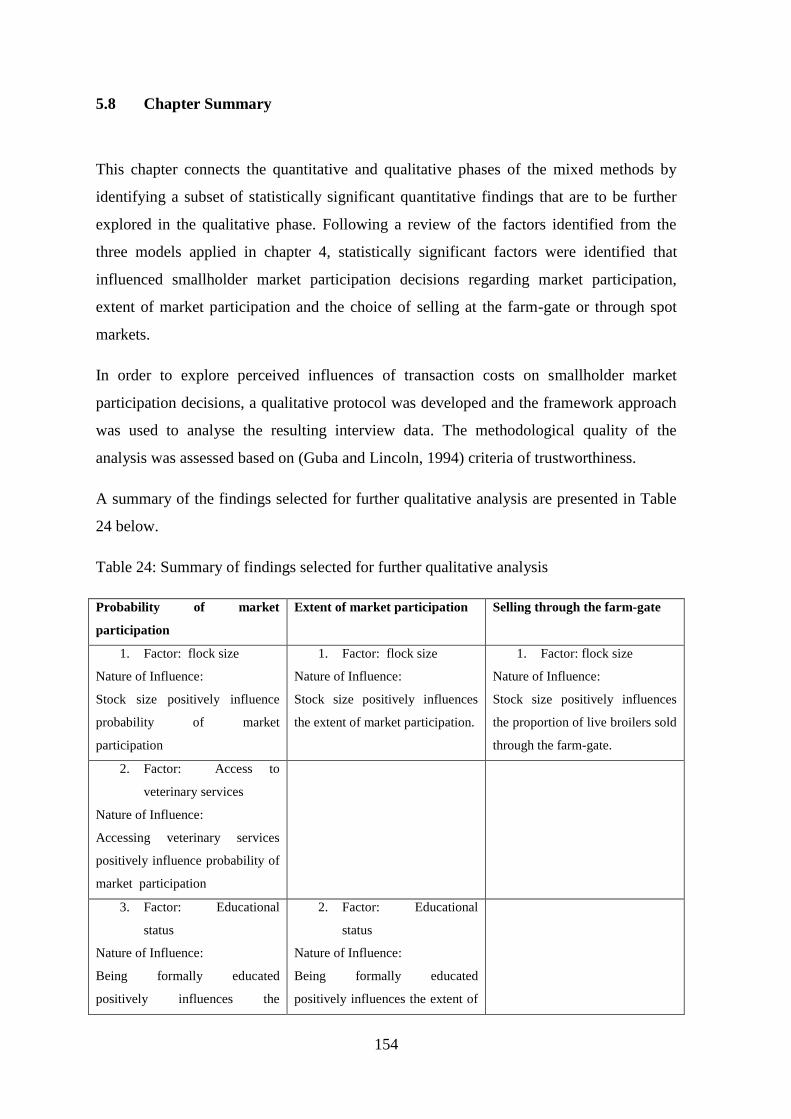
154
5.8 Chapter Summary
This chapter connects the quantitative and qualitative phases of the mixed methods by
identifying a subset of statistically significant quantitative findings that are to be further
explored in the qualitative phase. Following a review of the factors identified from the
three models applied in chapter 4, statistically significant factors were identified that
influenced smallholder market participation decisions regarding market participation,
extent of market participation and the choice of selling at the farm-gate or through spot
markets.
In order to explore perceived influences of transaction costs on smallholder market
participation decisions, a qualitative protocol was developed and the framework approach
was used to analyse the resulting interview data. The methodological quality of the
analysis was assessed based on (Guba and Lincoln, 1994) criteria of trustworthiness.
A summary of the findings selected for further qualitative analysis are presented in Table
24 below.
Table 24: Summary of findings selected for further qualitative analysis
Probability of market
participation
Extent of market participation Selling through the farm-gate
1. Factor: flock size
Nature of Influence:
Stock size positively influence
probability of market
participation
1. Factor: flock size
Nature of Influence:
Stock size positively influences
the extent of market participation.
1. Factor: flock size
Nature of Influence:
Stock size positively influences
the proportion of live broilers sold
through the farm-gate.
2. Factor: Access to
veterinary services
Nature of Influence:
Accessing veterinary services
positively influence probability of
market participation
3. Factor: Educational
status
Nature of Influence:
Being formally educated
positively influences the
2. Factor: Educational
status
Nature of Influence:
Being formally educated
positively influences the extent of

155
probability of market
participation
market participation.
4. Factor: access to
supplemental farm
income
Nature of Influence:
Earning farm income from
sources other than poultry,
positively influences the
probability of market
participation
5. Factor: Access to credit
Nature of Influence:
Accessing formal credit positively
influences the probability of
market participation.
. 3. Factor: farmer to farmer
information exchange
Nature of Influence:
Exchanging information with
other farmers positively
influences the extent of market
participation.
6. Factor: distance to
nearest market
Nature of Influence:
Time taken to reach the nearest
market positively influences the
probability of market
participation.
7. Factor: distance to
nearest tarred road
Nature of Influence:
Time taken to reach the nearest
tarmac road negatively influences
the probability of market
participation.
4. Factor: native
Nature of Influence:

156
Being local positively influences
the extent of market participation.
5. Factor: Ownership of
motor cycle
Nature of Influence:
Motorcycle ownership positively
influences the extent of market
participation.
6. Factor: Ownership of
mobile phone
Nature of Influence:
Mobile phone ownership
positively influences the extent of
market participation.
7. Factor: Access to non-
farm income
Nature of Influence:
Access to non-farm income
negatively influences the extent of
market participation.
8. Factor: Access to formal
poultry training
Nature of Influence:
Accessing formal training in
poultry keeping positively
influences the extent of market
participation.
2. Factor: remoteness of
location
Nature of Influence:
Remoteness of location positively
influences the proportion of live
broilers sold at the farm-gate.
3. Factor: access to repeat
or regular buyers.
Nature of Influence:
Repeat or regular buyers
positively influences the
proportion of live broilers sold at
the farm-gate.

157
4. Factor: price expectation
Nature of Influence:
Farmers are better positioned to
influence or take advantage of
pricing at the farm-gate.
The next chapter presents the findings obtained from the qualitative phase of this mixed
methods study.

158
Chapter 6. Qualitative Interview analysis
“If you talk to a man in a language he understands, that goes to his head. If you talk to
him in his language that goes to his heart” (Nelson Mandela)
6.0 Phase II: Qualitative Interview analysis
6.1 Introduction
This chapter describes the findings obtained from the qualitative phase of the study, which
aimed to explore why and how a subset of the statistically significant factors identified in
the quantitative phase might influence farmers’ decision to participate in poultry markets.
In other words, qualitative findings are used to explain why significant findings in the
quantitative phase might be significant predictors of market participation. Accordingly, the
main objective of this phase of the study was to find out how smallholders’ perspectives
inform or support a subset of selected factors identified to influence the market
participation decisions drawn from the findings summarised in Table 24 in the preceding
chapter. This chapter begins by describing the findings obtained from the qualitative phase
in section 6.1 after which the chapter is summarised in section 6.2.
6.2 Findings
The explanations given as to why and how the identified factors might inform or support
farmers decision to participate in poultry markets and the extent of participation as well as
the transaction costs influencing the choice of market outlets are drawn from a series of
overlapping key themes. For example, the theme ‘Importance of literacy’ cuts across both
the decision and extent of participation.
Accordingly, Informants’ explanations on why and how the quantitative findings selected
for further exploration might influence the probability of market participation, extent of
participation and choice of market outlets focussed on the ease of doing business and drew
on the following fifteen key themes namely: 1. ease of accessing veterinary services 2.
Ease of accessing financial services 3. Importance of cash flow 4. Time allocation in on-
farm work 5. Selling in bulk quantities 6. Proximity to market 7. Availability of
159
infrastructure 8. Availability of a means of transport 9. Convenience of selling at the farm-
gate 10. Negotiating from a position of strength 11. Importance of social contacts 12.
Access to means of communication 13. Importance of social capital 14. Professional
exposure 15. Importance of literacy.
6.2.1 Probability of participating in poultry markets
6.2.1.1 Ease of access to veterinary services
All informants interviewed noted that the ease of access to veterinary service was an
important enabling factor when deciding to participate in poultry markets. Informants
were asked how they care for their birds. Iquo a female farmer pointed to the important
role that veterinary services play in a poultry business, stating that:
“… I think farmers like myself who are into poultry to make money cannot do without
veterinary services … because I have to take extra care so I do not lose my birds, but
farmers who are not into poultry to make money are not likely to make use of veterinary
services they do not take the business seriously and so stock few “…
[Iquo, female, 52, 7 years in poultry]
The informant’s explanation illustrated that being a serious poultry farmer means going
into the poultry business to earn money, which is supported by access to veterinary
services. It also indicates that market-orientated poultry farmers have more stock
suggesting that they may also have the financial means to access veterinary services.
These explanations support the findings obtained in the quantitative phase, which
indicated that accessing veterinary services increases the likelihood of farmers
participating in poultry markets. On the other hand, the explanations also suggests that
being able to pay for veterinary services is not the only requirement for commercial
poultry farmers as further explained by Eme as follows:
“If you are into poultry to make money… you will invest in proper medication and hygiene
and you will not have high mortality, this will lead to increased volume”
[Eme, female, 60, 10 years in poultry]

160
When asked which services were important to her as a poultry farmer, Eme, a female
farmer noted that having access to veterinary services could make the difference between
having a viable business or not:
“I think veterinary services, because of the high mortality rate in poultry … when I started
the business I did not have a veterinary doctor, but later my birds started falling ill and I
lost a good number. I had to consult a veterinary doctor and I have had one since then , so
imagine if I could not access a vet, I would have long left the business or just kept one or
two, that is why those farmers that cannot access veterinary services stock very few birds,
because of the fear of diseases or mortality”
[Eme, female, 60, 10 years in poultry]
In some cases lack of access to veterinary service may be due to the absence of a vet rather
than financial constraints and respondents, such as Okon, argue that self-medication is no
substitute for a qualified vet.
“Without veterinary services I do not see any poultry farm surviving, even if you attempt
self-medication, from my experience veterinary doctors know more than you do and you
know it only takes one disease to set in that can result in high mortality”
[Okon, male, 48, 5 years in poultry]
Therefore there are important questions around the availability of veterinary services in
some areas that could act as a constraint to the development of new poultry enterprises.
Where vets are not available, other forms of support may be utilised, as noted by Edem;
“I always get information on the medications I need from the poultry shop where I go to
buy my day old chicks (DOC) and feed, because I do not have access to trained veterinary
doctors”
[Edem, 32 years, 3 years in poultry]
This in itself is a form of help and support but these shop keepers generally lack training
and using their advice may result in negative outcomes and perpetuate ‘self-medication.’
Discussions with farmers therefore make it clear that, without access to veterinary
services, participation in poultry markets would be problematic and that the proximity of
161
these important support services can be an important factor in farmers’ decisions to farm
poultry commercially.
6.2.1.2 Ease of accessing financial services
When farmers were asked what they considered to be important for running a poultry
business, most pointed out the dominant position that finance plays in enabling farmers to
participate in poultry markets and expand their enterprises. As one farmer noted:
“…although I have not been able to access any loan, I think that having access to a loan
will ensure that farmers take the business seriously so as to repay back the money, by
taking poultry seriously, I mean they can expand and increase their flock size in order to
attract more customers”
[Okon, male, 48, 5 years in poultry]
Most farmers’ responses regarding finance focussed on having the wherewithal to
participate in poultry markets. This is consistent with the quantitative findings; however,
here the emphasis was on the difficulties encountered in gaining access to finance..
One farmer who was able to get a loan for her business provided some key insights into
the practical difficulties farmers face even if they obtain financial support:
“ … I got a loan from a microfinance bank, the extension officer brought the loan form for
me to fill and guided me all the way in filling the form but I needed a guarantor to
counter-sign for me, although it was not easy because I had to be going to the bank on a
daily basis; the only advantage I have is that I live about 10 minutes to the bank …, so if I
lived far from the bank I am very sure I would have given up … with the loan I was able to
double my stock … and because I needed to repay the money I had to manage the farm
better”
[Arit, female, 30, 6 years in poultry]
This shows the intricacies involved in accessing credit, pointing to the role that extension
agents play and the need for guarantors, which is often a barrier. Accordingly, accessing
loans is not straightforward. A farmer must first be aware of the of the availability of
such loans, a stage in which extension agents may play a vital role, and then must also be
able to meet other loan requirements, particularly securing a guarantor who must also

162
meet certain criteria. Ease of access to extension services and the availability of potential
guarantors reduces transaction costs, thereby increasing the likelihood of farmers
participating in poultry markets.
While accessing a loan is of immense benefit, its importance lies in enabling rapid farm
expansion, Asuquo, offered the following explanation:
“Access to a loan means that I can expand my farm faster, instead of relying on my
savings or money from my other farms, I could easily increase the size of my land and
buy more birds so that I can have more customers come to buy from me”
[Asuquo, male, 71, 6 years in poultry business]
However, while accessing finance is generally seen as being good for business, another
important point that could impact on farmers’ ability to access finance is the conditions
attached to the loans, particularly the repayment period and the rate of interest as
explained by Ukeme as follows:
“Having access to a loan will be very good for my business, provided the interest rate is
not too high and also the time limit given to return the loan. If it is a short-term loan then I
would not like to enter into it, but if it is a long-term loan then I will, provided the interest
rate is not too high”
[Ukeme, male, 32, 7 years in poultry]
6.2.1.3 Importance of cash flow
The difficulty in accessing credit has resulted in farmers developing strategies to ensure
that they have a better cash flow. One of the most challenging situations farmers encounter
in the poultry business is maintaining cash flow (Kingori et al., 2010). Ready cash flow is
needed to purchase feed, which is the most expensive daily input farmers need. The easier
it is for farmers to access the cash required to run the day-to-day business, the more likely
it is that they will be willing to participate in poultry markets.
Two other strategies to supplement income and increase cash flow were identified by
farmers. The first is to obtain supplementary income from other farm activities besides
poultry, while the second is to earn money from off-farm employment. For example, most
farmers in the study area are civil servants, pensioners or are self-employed, running petty

163
trading businesses. In most cases, income from this source is easily accessible and can be
spent in a variety of ways including in support of the poultry business. Such sources of
ready cash are very important to ensure that the farmer can meet the day-to-day running
costs of a poultry business, ensuring that the stock is well fed and healthy and able to
command good prices when sold.
One farmer shared his experiences around improving cash flow:
“ I have a thriving vegetable farm … I decided to go into vegetable cultivation in order to
utilize their droppings as manure and vegetable cultivation is very lucrative and it is very
easy to cultivate, it just keeps multiplying and demand is high … when I started my poultry
business, I found it very difficult to feed the birds but since I started the vegetable business
I now have enough money to use as running costs to feed the birds or cover other
immediate cash requirements in the poultry business”
[Edidiong, 37, male, 3 years in poultry business]
Edidiong’s explanation also illustrates how poultry waste is used to fertilise the crops
farmers grow, reducing the costs of cultivating cash crops that generate income that can be
used to cover the running costs of a poultry enterprise.
The quantitative findings suggested that farmers with non-farm income are likely to keep
fewer birds, implying that those with off-farm income sources are less likely to expand
their businesses. Imoh, who runs a sewing business, offers the following insights:
“… my major business is selling sewing materials, the business has been very helpful and
has made it easier to run my poultry business because it provides steady flow of cash to
run the business and poultry have high running costs … just imagine your birds staying a
day without food.”
[Imoh, male, 21, 3 years in poultry business]
The availability of cash to run a poultry business has been shown to be a strong driver for
participation in poultry markets. It is therefore not surprising that poultry farmers are
engaged in some form of additional work either by cultivating other crops, perhaps
utilising poultry manure as fertilizer, and/or engaging in some form of non-farm work
which, while providing an invaluable source of ready cash, may limit their ability to
expand their enterprises. Therefore, having access to direct cash reduces the search and
164
negotiation costs involved in accessing external finance, thereby facilitating market
participation.
6.2.1.4 Selling in bulk
An interesting finding in the quantitative phase was that distance to market or remoteness
of location did not deter market participation. This finding did not match a priori
expectations, since it would be expected that the further away a farmer is located from
market towns the less likely they are to start a commercial poultry enterprise.
Informants were asked to explain this finding, and one farmer offered the following
explanation:
“Distance to my farm was an issue when I first started because I started with a few birds
about 20 birds or so, but I used to find it difficult to sell and I struggled to sell my birds
even to my neighbours in the village … also the only place I could sell my birds was in the
market because of the quantity I had which was very difficult considering the transport
and stress involved in moving birds to and from the market … at one point I even stopped
for a year, then when I saved up enough to increase my stock, I started again and now I
hardly sell at the market because I have the volume to attract buyers irrespective of my
location or distance to market”
[Asuquo, 71, male farmer, 5 years in poultry]
This illustrates the importance of volume in the poultry business, and reflects the
observation that the smaller the quantity sold the higher the unit transaction costs that
farmers incur. In the study area, farm-gate sales, which require buyers to travel to farms, is
the dominant market channel and many buyers require greater volume and choice to
justify their travel costs. In other words, volume brings in buyers, and raising more birds is
often feasible given that the majority of farmers are located in remote areas, where there is
scope for expansion due to availability of land. This confirms the finding that distance
from market need not be a barrier to a successful poultry enterprise, a point that was
clearly expressed by one farmer:
“I don‟t think distance is a barrier at all, just have the birds in a good enough number and
see customers queue to buy” [Arit, female, 6 years in poultry]

165
6.2.1.5 Proximity to market
However, a counter narrative occurs with farmers based in urban areas, this is mostly due
to the how urban markets are organised. While rural farmers thrive on selling in volume,
often to middlemen, in urban settings live chickens are mostly sold at the spot market.
These farmers have to take their birds to market and therefore incur higher transaction
costs in order to participate. Also, in urban areas farmers tend to stock relatively small
amounts due to space constraints and do not attract bulk buyers. When they do sell at the
farm-gate, they tend to attract small volume purchases for home consumption from local
consumers who tend to buy from the closest farmer. So urban farmers sell mostly at the
spot market and additional distance from the spot market may discourage poultry market
participation. Buyers who sell live birds at market have an incentive to sell all of their
birds, even at reduced prices, since if they don’t they will incur additional costs as they
need to keep feeding the market-ready birds. One self-employed farmer offered the
following explanation:
“I think distance to market or remoteness of location can affect sales, because in the town,
people [buyers] do not have the patience to travel long distances when they can get birds
at a shorter distance because in town buyers are mostly households who may buy one or
two for their own consumption”
[Otu, 32, male with 8 years in poultry]
6.2.1.6 Availability of infrastructure
Within the broader narrative, a particular barrier that informants identified was weather
related, in particular the rainy season. However, the main barrier was not rain per se but
the roads in rural areas which are usually not tarred and therefore prone to damage when it
rains, thereby limiting buyers’ access to the farm, for example:
“I do not experience any difficulty in terms of selling, provided I have birds, customers
will find you … the only problem is that during the rainy season, it poses a bit of a
difficulty because the area is prone to flood coupled with the bad roads … If government
can repair and provide tarred roads, it would be very helpful and make life easy for us …
I tell you, the roads get so bad at times that customers cannot drive in … during the rainy

166
season, I stock fewer birds because I do not have the same level of patronage due to the
bad roads”
[Kufre, 37, male, 2 years in poultry]
The importance of good infrastructure for rural businesses like poultry enterprises, in
particular metalled roads with proper drainage, is clear. Accordingly, the costs of doing
business increases in areas with poor infrastructure, as in these circumstances it will be
harder to attract buyers to the farm and more costly to transport birds long distances to
market.
Figure 18: Visual model of themes perceived to influence the probability of market
participation

167
6.2.2 Extent of participation in poultry markets by smallholder farmers
6.2.2.1 Time allocation to on-farm work
In any business venture, the prospects of future expansion can be a strong driver to
participate in a market. In other words, businesses seek out growth or expansion
opportunities. One important expansion strategy identified by informants was the use of
income that they earned from non-farm work, even though the quantitative findings
suggested that earning non-farm income tended to reduce the extent of participation. To
help understand why this might be one farmer made the following observation:
“I do have a shop where I sell building materials particularly cement and I use the money
I make from the shop to support my poultry business … I can stock large numbers and
also have money for daily running costs … so having any source of income can go a long
way in expanding your poultry business”
[Udo, 40, male, 9 years in poultry]
Cash flow in a poultry business determines the level of expansion and having non-farm
income can increase the level of farm expansion; Consider how one smallholder planned
to expand:
“I plan to expand my farm next year, because I will be retiring so I will use my gratuity to
expand and will also have time to focus on the business”
[Mfon, 59, male, 8 years in poultry business]
For, Mfon, expansion is made possible by accessing a lump sum gratuity following
retirement. However, an interesting point expressed by Mfon, was that being a civil
servant did not allow him sufficient time to concentrate in the poultry business, so that
even though he earned non-farm income, he could not afford to expand the business until
he retired.
“While I could have expanded before now (i.e. retirement from paid employment), I could
not because I would not have the time to focus squarely on the business, so I just stocked
about 50 birds at any point in time which was what I could handle”

168
Another useful insight to further emphasise the importance of non-farm income, was
provided by this poultry farmer:
“My strategy is to use the income I earn from my current job, because getting loans with
the current high interest rate is not for me”
[Akan, 32, male, 9 years in poultry]
Because of the high interest rate in Nigeria, using non-farm income remains a viable
expansion strategy for smallholder farmers because, as discussed earlier, it is often easier
to obtain non-farm income than to access credit.
Farmers’ experiences of non-farm income were mixed, however one important finding
was the importance of the time constraint: in other words, non-farm incomes earned from
self-employment tend to increase the extent of participation, since these individuals are
better able to manage their time. However, where non-farm income is drawn from paid
employment, farmers have limited time which tends to reduce the extent to which they can
participate.
6.2.2.2 Availability of a means of transport
Informants were asked to elaborate on what means of transport they considered important
in their poultry businesses. Informants’ explanations were focused within the context of
farming operations and not necessarily on the marketing of poultry per se, since the
majority of poultry sales in the study area occur at the farm-gate.
The importance of transport is context specific as suggested by one farmer:
“There is no means of transport that is not important in the poultry business, it depends
on the scale or level of production”
[Ime, 36, male farmer with 10 years in poultry]
The findings from the quantitative phase suggested that owning a motorcycle tended to
enhance extent of participation in poultry markets. The qualitative research supported this
finding and the following quote offers a good summary of the importance of motorcycles:

169
“Motorcycles can be used for carrying out poultry operations like buying feed, saw dust
and day old chicks. It is also a faster means of transport and can satisfy larger farm
operations, while a bicycle is far slower”
[Ekaette, 70, female, 8 years in poultry]
Although, the variable ‘ownership of car’ was not significant in the quantitative models,
many informants suggested that it was a very important means of transport. Less than a
quarter of farmers interviewed owned vehicles, so many had little direct experience of
using a car in their poultry enterprises but as one farmer pointed out:
“In this area, we make use of motorcycles and to a lesser extent bicycles. But they are not
a very good means of transporting day old chicks (DOCs), feed, saw dust and droppings
because rain water can easily slip in. for example, one of my farmer friends lost all his
DOCs because when he was carrying them on his motorcycle to his farm, it rained and all
the DOCs died. So a means of transport with a covering is most ideal, but it is way above
our reach”
[Udo, 40, male with 9 years in poultry]
A clear barrier to accessing a vehicle is the cost of owning one. Therefore, since it is
cheaper to procure a motorcycle, farmers have to make do with what they can afford but
even when it is possible to own vehicle, the bad road network prevalent in remote
locations is a further deterrent.
6.2.2.3 Importance of social contacts and interaction
One of the first steps in participating in a poultry business is to ensure that one has access
to relevant information. To guarantee quality, the source of information is important since
wrong or misleading information can cause errors that ultimately lead to a loss of business
and in the case of poultry farming can lead to a combination of high mortality and
increased input (feed) costs due to delay in sales. In addition, considering the search costs
incurred in accessing appropriate information, economic agents, in this case smallholder
farmers, seek information in such a way that reduces the costs of doing business. Based on
this farmers were asked where they normally seek out market-related information and why
they considered such a source important. The results from the quantitative phase showed

170
that accessing market information from other farmers enhances the extent of market
participation. One farmer reflected on this phenomenon as follows:
“I ask questions to other farmers who have started before me … by getting information
from other farmers, I can improve on the quality (health status) of my birds and this can
help me sell more birds … but not all farmers are willing to share information, it often
depends on how close you are to the farmer”
[Eme, 60, female farmer with 10 years in poultry business]
While, informants acknowledge the importance of relying on other farmers as information
sources, it is clear that prior to accessing information, it is useful for farmers to have an
established relationship with a more experienced farmer. This raises the question of how
such relationships can be established to assist novice poultry farmers in interacting with
other more experienced farmers. Building relationships establishes trust, making it
possible to ask other farmers for advice at any time as in such cases the information
provided is not seen as a business exchange but rather as a form of assistance. Access to
such information is likely to be reliable, though the quality of the information may vary.
The importance of building relationships with established farmers is emphasised by Iquo
thus:
“I get information from my friend who is also a poultry farmer, I saw her do the business
and I picked up interest and asked her how to go about doing the business … she even
introduced me to some of her customers, but I now have my own regular customers too”
[Iquo, 52, female, 7 years in poultry]
Another important dimension noted by informants was the type of farmers to approach for
advice. While friends are an important source of information, interviewees also
acknowledged another criterion for approaching farmers: that is how successful their
farms are. Such individuals may be seen as model farmers and a common perception is
that such farmers are better sources of experience for novice farmers, and access to advice
from such model farmers is important in enhancing the extent of participation (Ssemakula
and Mutimba, 2011). In most cases, the mere presence of a successful farm in the area is a
reason for neighbouring farmers to consider starting a similar enterprise. But what is a
successful poultry enterprise? Okon offered the following criteria for identifying a
successful farmer to approach for advice:
171
“… also you see how their farm is performing that is if the birds are healthy, if the birds
sell out fast, if there is always demand for the farmer‟s birds, so those are the kind of
farmers that can show you how the business works, but I must add that you have to know
the farmer on a personal level before they can open up to you”
[Okon, 48, male farmer with 5 years in the poultry business]
Kufre suggested that while information is available from other farmers, search costs for
particular information could be lowered through collective action:
“I think when cooperatives used to function, a lot of information on poultry could be got
from there because the cooperatives used to bring in veterinary doctors, lecturers and
Ministry of Agriculture staff to teach their members … But now I get a lot of information
from other farmers, particularly from my friend who has been in the poultry business far
longer than me, so I call him to my farm or go to visit his farm and we share ideas and he
has guided me a lot”
[Kufre, 37, male farmer with 2 years in the poultry business]
Lowering search costs involves distributing information across a large number of farmers
in the shortest possible time and some form of organised body can help in that regard. It is
therefore important to note that collective action can help transfer information more
efficiently to potential market participants thereby increasing the level of market
participation.
Useful information can also be obtained from service providers who are directly involved
in poultry business. In particular, poultry dealers involved in the sale of poultry
equipment, drugs and feed are a good source of information about their own products and
often about the market in general. Also, it can be argued that government, through its
various agencies, has a duty to ensure that such information is accessible to anyone
interested.
Another useful source of information were reading materials, particularly for farmers in
urban areas where they were most likely to be publicly accessible. One farmer made the
point that the value of such ‘book learning’ could usefully be combined with practical
experience:

172
“… when I wanted to start with poultry, I bought a book on poultry and read it from cover
to cover. Secondly, I sought advice from other experienced farmers already in the
business; while some farmers were willing to share their knowledge, others were not so
forthcoming. But by far, asking experienced farmers already in the business is the easiest
way of getting information and combine that knowledge with poultry books and you are
good to go”
[Edidiong, 37, male with 3 years in the poultry business]
Access to information on both the technical and practical aspects of the poultry business is
therefore important in encouraging farmers to sell their poultry in the first place and those
with a better understanding of the intricacies of the business, may then have the
confidence to expand their enterprises.
6.2.2.4 Access to means of communication
Informants showed the most agreement when asked what they could not do without in
their poultry business. Without exception, all of those interviewed highlighted the
importance to their businesses of having a mobile phone. This agreement was based on the
various uses that mobile phones are put to and how such uses meet the needs of farmers.
Informants’ explanations centred on how mobile phones enable them to plan ahead,
reducing uncertainty and ensuring that their time is used more efficiently. For example,
use of a phone ensures that farmers know whether or not to expect a buyer at a particular
time, as well as establishing the customer’s likely needs. In a business where quick sales
are prioritised and where there may be significant opportunity costs around time, such
information improves buyers’ time management and reduces search costs around locating
potential buyers.
The importance of mobile communications is highlighted in the following:
“Mobile phones are the best thing to happen to us farmers, just one call away and you can
supply or arrange sales, it helps get me organised”
[Adiaha, 45, female with 16 years in the poultry business]
“It just makes my life a lot easier, I use it to communicate with other farmers, buyers and
feed dealers without mobile phones selling my birds would be extremely difficult”

173
[Ekaette, 70, female with 8 years in the poultry business]
“mobile phones mean a lot, there is no way you will be able to contact your suppliers,
your buyers and other people without using a phone”
[Ime, 36, male with 10 years in poultry]
“very important means of communication … I can better plan my time, which makes life
easy for me because it reduces uncertainty”
[Mfon, 59, male with 9 years in poultry]
“Without a phone it will be difficult to reach buyers and sales may not happen or may not
happen at the right time leading to delay in selling my birds, it also saves me transport
costs since I can call my feed dealer to supply feed to my farm, so phone is very central to
my business”
[Asuquo, 71, male with 5 years in poultry]
6.2.2.5 Importance of social capital
The quantitative study suggested that farmers who have strong roots in the local
community, i.e. who are ‘natives’ to the area, were more likely not only to participate but
intensively participate in poultry markets. It was suggested that this demonstrated the
importance of farmers having ‘social capital’ in their community. For this study, a ‘native’
was defined as a farmer who was born and bred in the community or village where they
ply their poultry business. Such farmers tend to develop strong ties in the community and
as such are more likely to build trust and social acceptance, as well as having easier access
to land at little or no monetary costs (since a ‘native’ has access to inherited or family
land). Accordingly, access to land, a key barrier to expansion, is removed thereby making
it easier for farmers to grow their businesses.
Without access to land, participating in poultry markets is difficult if not impossible;
therefore, ease of access to land may encourage market participation. Although such a
finding is intuitive, what is less clear is how being ‘native’ might help some farmers to

174
overcome some of the transaction costs that they face when participating in poultry
markets.
To explain how being embedded in a community enhances the extent of market
participation, informants were asked about their major concerns when starting their
poultry businesses and how they were able to overcome them. Adiaha offered the
following explanation:
“…I think a native is more likely to engage in poultry business because the farmer can
make use of their family land at no cost, but a non-native would have to rent land or buy it
outright which gives a native advantage over non-native. It is also very likely that a native
will find it easy to sell their birds, because „he‟ knows more people, you can walk into
houses easily to advertise the availability of your birds. But a non-native may likely
struggle to find customers to trade with or it may take time”
[Adiaha, 45, female farmer with 16 years in the poultry business]
This illustrates that a native farmer already has a head start in the poultry business making
it more likely for them to participate. To appreciate how trust and acceptance influences
market participation requires an understanding of a typical rural setting in this part of
Nigeria, where everyone tends to know everybody else and people often carry out daily
tasks together such as fetching firewood or water. It is during such regular activities that
friendship and information are shared, so that a ‘native’ poultry farmer is already well
known and trusted. This means that villagers may direct potential buyers to farmers they
know. Therefore, while a non-native may struggle to build trust in a village, a native
already has first mover advantage. This emphasises the importance of social capital in
lowering the costs of doing business.
Another interesting point raised by informants raised was the longer term outlook of
‘native’ farmers who, because of their ease of access to land, were felt to be more likely to
build a more permanent structure to house poultry, a venture which requires considerable
capital outlay and is evidence of a commitment to remaining in the village.
Non-native farmers are likely to lease or rent land and as such may not commit to building
a long lasting structure for fear of eviction; resulting in loss of investment. Also, land
owners may not want a permanent structure to be built on the land and a non-native may
struggle to buy land as it is often seen as an inheritance that should be kept in the family.

175
Another problem for non-natives is that, even if they can afford to buy land in the first
place, expansion may be a problem since it will be difficult to buy additional land adjacent
to their plot. Such barriers make it difficult for non-natives to expand their poultry
businesses.
These issues are summarised well by Ekaette:
“I think a native is more likely [to participate] simply because they have the land where
they can build a more solid structure - unless a non-native has been able to acquire land
which is not easy. But on the whole a native is more likely because it is easier for them to
access land. Even if a non-native like me acquires land, it may not be big enough… even if
I want to expand, I cannot because I do not have the space; but If I was in my village, I
would have had surplus land to expand so that is a major difference”
[Ekaette, 70, female with 8 years in the poultry business]
Another subtlety which would have been difficult to observe without qualitative data
centred on the preferential treatment that natives may receive in terms of access to
government support. This may occur when a government programme targets support on
those native to an area at the expense of incomers. This may again offer a native a head
start in the poultry business as noted by Bassey:
“… if at any time the government wants to support farmers through loans or training, they
will have to consider a native first, so in that regard, a native has more advantage and
therefore finds it easier to go into the poultry business … beyond the village level, even at
the state level; indigenes are more favoured in terms of government assistance than non-
indigenes”
[Bassey, 70, male with 3 years in the poultry business]
However, despite their easier access to land, higher social acceptance and ease of access to
government assistance, most natives are still not able to participate in poultry markets. A
major reason is that most natives are poor and cannot afford to enter into the poultry
business: it is therefore not surprising that many natives, despite their advantages, are still
not able to participate intensively in poultry markets. This point was addressed by Udo,:

176
“I think a native is more likely, but the thing is that most natives do not have access to
money, even though they have access to land‟‟
[Udo, 40, male with 9 years in the poultry business]
6.2.2.6 Professional exposure
When asked what ways a farmer can garner knowledge on the poultry business,
informants emphasised the positive influence of having formal training, explaining that
knowledge gained in this way can help in providing practical skills that, when applied, can
enhance the extent of market participation. In other words, formal training can lower the
costs of participating in the poultry business by providing the knowledge that farmers need
in order to avoid costly mistakes. Eme aptly explains these avoidable mistakes and the
importance of formal poultry training as follows:
“I think there is a need for poultry training, because a person who is trained in poultry
practice knows how to take care of the birds with less incidence of disease, proper feeding
regimes, good housekeeping and proper medication”
[Eme, 60, 10 years in the poultry business]
This suggests that in order to increase farmers’ levels of market participation, there is need
to enhance their knowledge and by so doing strengthen their business operations.
Informants also pointed to the importance of formal training in making farmers more
serious about their work:
“What you pay to learn you will be serious about it”
[Okon, 48, male with 5 years in the poultry business]
Such farmers who use their hard earned money to pay for training, already show
commitment in participating in poultry markets and are serious about acquiring the skills
needed to ease the process of doing business.
Another important explanation relates to building networks with other farmers during
training sessions which can enhance information exchange, facilitating peer to peer
knowledge transfer between farmers. By establishing networks and sharing information,

177
farmers can reduce the search costs for the information required to run a successful
business, a point again noted by Okon:
“A farmer that is trained has more knowledge and contacts from other trained farmers at
the workshop and can help him better manage a farm”
While informants acknowledged the importance of acquiring training in running a poultry
business, it was also important to note that knowledge of training opportunities can often
be a barrier, as Affiong confirms:
“Training is very important, but how to go about knowing training opportunities is very
difficult”
[Affiong, 45, female, 7 years in the poultry business]
The reasons for this are twofold. First, poultry training opportunities are rare and then,
where training is available, farmers may not be aware of them. The challenge is therefore
not only to ensure that relevant training in available but to provide reliable channels
through which those farmers who could benefit are informed.
6.2.2.7 The importance of literacy
A generally accepted view among informants was the importance of formal education. The
ability of poultry farmers to read, write and understand the consequences of their actions
are all important when running a poultry business. Compared with many staple foods
grown in the area (e.g. cassava, root tubers and other vegetables), commercial poultry
production requires a relatively high degree of technical competence. To be a successful
poultry producer the farmer must adhere to strict feeding regimes and vaccination
requirements, while also understanding the impact of temperature and housing conditions
on the wellbeing of their stock. This requires the accumulation of knowledge and attention
to detail, skills that tend to be associated with some level of formal education. Okon and
Bassey support this argument as follows:
“… a farmer who cannot read and write cannot go into the poultry business because the
business requires the ability to read and write … that is why farmers that do not keep
birds for sale are mostly not educated, that is why they keep very few for their own
consumption” [Okon, 48, male with 5 years in poultry business]
178
“I think farmers with some formal education are more likely to take up the poultry
business because poultry is very technical and so requires ability to read and write and
attention to detail; for example, the names of poultry drugs are not straight forward and a
poultry farmer cannot do without administering drugs in the business. So if a farmer finds
it difficult to know the drugs and the function they have on the birds, such a farmer is less
likely to decide to participate in the poultry business; that is why you find out that most
farmers in the village go into staple food production because it is pretty straightforward”
[Bassey, 50, male with 3 years in poultry]
However, Kufre voiced a slightly different opinion:
“… On the contrary, the more educated farmers are the less likely they want to participate
in the poultry business, since they can seek for white collar jobs that is less stressful”
[Kufre, 37, male with 2 years in poultry]
The additional opportunities offered by education may indeed lead individuals to choose a
less labour intensive or more remunerative occupation than poultry farming but, even so, it
is hard to argue that education is not an advantage to those who do choose this pathway.
Indeed, if better-educated individuals could be attracted into poultry production this could
lead to an increase in productivity and an increasing level of professionalism in the
Nigerian poultry industry. To achieve this, appropriate incentives would need to exist to
encourage well-educated individuals to enter the business and if this proved successful it
could lead to a restructuring of the poultry industry in the medium to long-term, as a new
generation of ambitious producers sought to expand both their sales and profits,
potentially squeezing out the traditional smallholder producers.

179
Figure 19: Visual model of themes perceived to influence extent of market participation
180
6.2.3 Smallholder farmers’ decisions to sell at the farm-gate
6.2.3.1 Convenience of selling at the farm-gate
Informants were asked where they usually sell their birds and why they choose that option.
Most informants sell at the farm-gate and the main reason for this was the relative ease
and convenience of selling poultry in this way rather than transporting live birds to sell at
market. As mentioned previously, this generally requires a farmer to have regular
customers in order to reduce the risks of being left with unsold birds. Such farmers have to
keep a high enough level of stock to attract buyers.
This situation is explained succinctly by Affiong as follows:
“I prefer to sell at the farm-gate because I have a lot of customers who can buy up to 40-
50 birds at once. Also, I cannot afford to take the birds to market because it is too
cumbersome carrying live birds and finding a suitable means of transport. That aside, my
customers buy in large enough numbers so there is no need to travel to market”
[Affiong, 45, female, 7 years in poultry]
Another important explanation as to why farm-gate sales is an attractive choice for farmers
focused on payment arrangements. Farm-gate transactions tend to be in cash while other
market channels such as supermarkets, hotels, restaurants and fast food outlets often
require birds to be slaughtered and dressed before being supplied and payment is rarely in
cash. Such payment arrangements tend not to suit smallholders as explained by Udo:
“If you decide to take birds to town to supply hotels, restaurants or fast food outlets you
are not paid on the spot, you have to wait to receive your money on a particular date,
which varies according to the outlet and many small farmers are not used to this because
they need cash to keep the business going … not being paid on the spot is an additional
difficulty a small farmer does not need … so I think the best option is to find consistent
buyers that will come to buy in bulk at your farm and pay cash”
[Udo, 40, male, 9 years in the poultry business]

181
6.2.3.2 Negotiating from a position of strength
Another attribute that three of the informants suggested might explain the selection of
farm-gate over the spot market was the opportunity it gave to negotiate from a position of
strength.
To appreciate why this might be so, requires an understanding of how poultry sales
operate. If farmers take live birds to market they face having to transport any unsold birds
back to the farm to be kept there until sold, a process that involves additional transport and
feed costs. In addition the stress of transport and exposure to potential diseases may make
the remaining birds more vulnerable. These factors combine to provide farmers with an
incentive to sell off any remaining birds at the market at a reduced price, a situation that
weakens their negotiating position. Such a situation is avoided at the farm-gate where the
farmer can hold out for a better price. Ukeme noted this:
“Selling at the market will add more costs, because on getting to the market you will still
sell at the same price if not lower”
[Ukeme, 31, male with 7 years in poultry]
It is also pertinent to note that even if birds are slaughtered farmers still face similar
problems because the urgency to sell dead birds is even higher since proper means of
refrigeration are often unavailable to smallholders. Therefore selling slaughtered birds
requires a quick turnaround time from farm to market in order to avoid spoilage, which
creates additional pressure to sell the birds at thereby further weakening farmers’
negotiating positions.
Another strong negotiating approach that allows for a ‘take it or leave it’ price strategy is
the assurance of readily available customers, i.e. having regular or repeat customers to
guarantee sales. Therefore, if a customer offers an unsatisfactory price, a farmer can afford
not to sell knowing that there will be other willing buyers. Consider the strategy used by
Ime:
“I am satisfied with the price I sell at, since I have many customers, if the price a
customer is offering is not satisfactory, I will definitely find another buyer who will offer
an acceptable price, so once the birds are up to market weight, my strategy is to call as

182
many customers as possible, that way I do not limit myself and that also ensures that I
have customers who will buy off the birds faster”
[Ime, 36, male with 10 years in poultry]
One informant, Udo who mainly sells at the farm-gate during the festive periods
(Christmas and Easter) stocks higher volumes during these periods due to high demand at
these times. However, at other times, Udo travels to sell at the open market because his
stocks are too low to attract buyers to his farm. Having experience in both markets, Udo
offered the following:
“On the whole, I think I am more satisfied with farm-gate prices because you are not
under any pressure to close any deal as it is in the spot market”
[Udo, 40, male, 9 years in the poultry business]
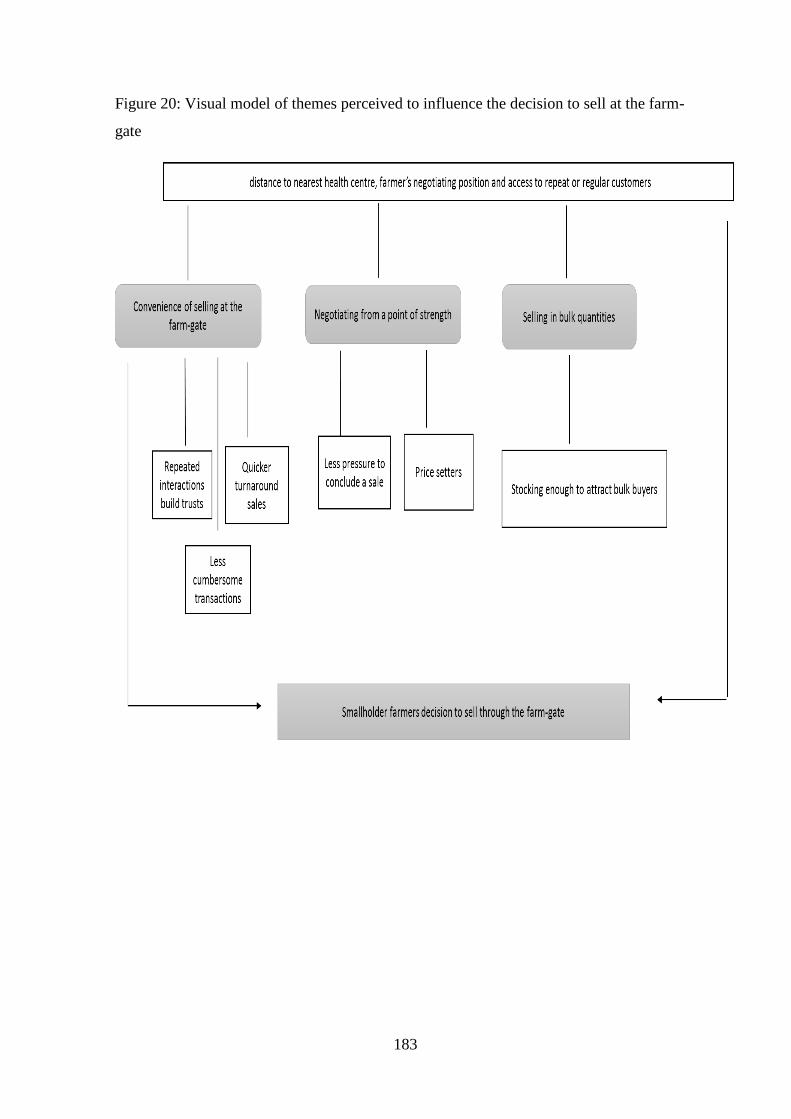
183
Figure 20: Visual model of themes perceived to influence the decision to sell at the farm-
gate
184
6.3 Chapter summary
This chapter has presented the qualitative findings obtained from the qualitative phase of
the mixed methods study during which statistically significant findings obtained in the
quantitative phase were explored in greater depth. This was achieved by carrying out
semi-structured interviews with 20 informants. The findings from the qualitative phase
identified fifteen key themes perceived to inform or support the significant factors
predicted to influence the market participation decisions of smallholder poultry farmers as
summarised in Figures 18, 19 and 20. In chapter 7 of this thesis, the key findings obtained
from this mixed methods study.

185
Chapter 7. Discussion
7.0 Discussion
This chapter integrates the principal findings obtained from the quantitative and qualitative
phases of the study. The quantitative and qualitative factors influencing the decision to
participate in poultry markets, extent of market participation, decision to sell at the farm-
gate are discussed in section 7.1. The principal findings are summarised in section 7.2 and
influence of transaction costs the focus of this study is discussed in section 7.3.
7.1 Principal findings
7.1.1 Decision to participate in poultry markets: Probit model
The results of the first hurdle participation decision sought to identify significant factors
influencing the likelihood of smallholder farmers participating in poultry markets. Eight
statistically significant factors (Gender, flock size, household size, access to veterinary
services, access to formal education, access to alternative sources of farm income besides
poultry, time taken to reach nearest market and time taken to reach nearest tarred road)
derived from the probit model were identified. The systematic review in chapter 2
revealed individual, socio-economic and transaction costs factors to influence the
likelihood of a farmer participating in a given market (Jagwe et al., 2010; Mailu et al.,
2012; Onoja et al., 2012; Bwalya et al., 2013; Ohen et al., 2013; Abu et al., 2014; kuma et
al., 2014; Ohen et al., 2014; Osebeyo and Aye, 2014; Sebatta et al., 2014; Achandi and
Mujawamariya, 2016; Lefebo et al., 2016b). This study reveals similar relationships. For
example, the results show that literate female farmers with a large household and flock
size, who have access to veterinary services, have other sources of farm income besides
poultry and who are located further from market centres yet closer to tarred roads, are
most likely to participate in poultry markets and could be inferred that such farmers face
lower transaction costs when participating in poultry markets.
The factor ‘access to veterinary services’ seems to be a new addition to the smallholder
market participation literature since no previous study has specifically applied this factor.

186
Here farmers who have access to veterinary services are shown to be more likely to
participate in poultry markets. The qualitative analysis stresses the importance of ease of
access to veterinary services and richer farmers who tend to keep a greater number of birds
can afford to access veterinary services. This suggests that any initiative to widen
participation in the poultry market should look at measures to improve the availability and
affordability of veterinary services.
This study also found that farmers who have access to a range of farm income sources are
more likely to participate in poultry markets. This tendency is probably due to farmers
using these other income sources to support their poultry business and generate a
marketable surplus. This emphasises the importance of cash flow and the availability of
income for investment in the farm business. Smallholder farmers do not purchase inputs in
bulk and tend to buy inputs, particularly feed, only when required so there is need to have
ready cash to use for this purpose.
Results also revealed that poultry farmers further from markets tend to be more market
oriented. This runs counter to the results of many market participation studies where
proximity to market increases the likelihood of participation (Onoja et al., 2012; Bwalya et
al., 2013; Ohen et al., 2014; Osebeyo and Aye, 2014; Achandi and Mujawamariya, 2016).
The systematic review, however, identified one study by Sebatta et al. (2014) with similar
findings, where potato farmers in Uganda that were located further from markets were
found to be more market oriented explaining that land was more affordable and larger in
size further from market centre that are often situated in towns. Qualitative data from the
farmer interviews demonstrated the importance of volume in the poultry where large
numbers of birds attracts buyers who have a better opportunity to choose the type of birds
they most prefer from the large selection available without having to travel to the markets.
Therefore, farmers (both male and female) located further from markets tend to have large
flock sizes, which attract buyers to the farm hence avoiding the costs associated with
transporting birds to market.
Poultry farmers located closer to tarred roads were also found to be more market oriented.
This finding was expected considering that the closer a farm is located to a tarred road the
easier it is to move goods and services, hence, lowering the costs of doing business. This
highlights the importance of good transport infrastructure, whereby the costs of doing
business increase for farmers located further from tarred roads. One additional insight

187
from the interview data was that where infrastructure such are road networks are weak,
farm-gate sales are low because customers find it difficult to access farm –gate locations
which often leads farmers to stock fewer birds thereby incurring higher transaction costs
associated with accessing transport should they decide to sell at the market.
Previous studies have demonstrated that a range of other factors can be highly influential
in determining the likelihood of market participation. For example, female fish farmers in
Nigeria and female kocho farmers in Ethiopia were found to be more market oriented than
their male counterparts (Onoja et al., 2012; Lefebo et al., 2016b) mostly due to gender
specificity in relation to culture prevalent in the study area and the degree of value added
required in processing the produce. Evidence from the systematic review also show that
farmers with large farms or who produce in large volumes tend to be more market oriented
(Jagwe et al., 2010; Mailu et al., 2012; Ohen et al., 2013; Abu et al., 2014; kuma et al.,
2014; Ohen et al., 2014; Achandi and Mujawamariya, 2016; Lefebo et al., 2016b).
Evidence of the influence of household size on market participation from the systematic
review is mixed in the sense that a priori expectations are unclear and tend to reflect the
level of dependency of household members. Onoja et al. (2012) have similar findings to
this research and show that farmers with larger households tend to be more market
oriented, possibly because of the abundance of adult labour in the household or the need to
provide for a young growing family. Other studies have found that farmers with smaller
households tend to be more market oriented (Abu et al., 2014; Sebatta et al., 2014). In
these cases, smaller households consume less of the available produce meaning that there
is a greater surplus available to sell.

188
7.1.2 Extent of smallholder participation in poultry markets: Truncated model
The findings from the second hurdle participation decision sought to measure significant
factors influencing on extent to which smallholder farmer participate in poultry markets.
The findings revealed that eight statistically significant factors (Marital status, flock size,
access to formal education, access to farmer to farmer information sources, being a
native, ownership of motorcycle, ownership of mobile phone, access to non-farm income)
derived from the truncated model influence extent of smallholder participation in poultry
markets. Both the systematic review and the empirical study reveal that a variety of factors
work together to influence the extent to which smallholder farmers participate in a given
market (Jagwe et al., 2010; Bwalya et al., 2013; Abu et al., 2014; kuma et al., 2014;
Sebatta et al., 2014; Abu, 2015; Achandi and Mujawamariya, 2016; Lefebo et al., 2016b;
Honja et al., 2017).
The results show that literate married farmers with a large flock size, who rely on the use
of a motorbike and mobile phone, who are native to an area, who mainly rely on other
farmers as the main source of market information and earn little non-farm income are the
type of farmers most likely to intensively participate in poultry markets.
Farmers who use other poultry farmers as the main source of market information tended to
exhibit higher levels of market participation. This finding suggests that higher volume
poultry producers prefer to rely on informal information sources rather than more formal
sources, such as extension services or agricultural pamphlets. Findings from the qualitative
study suggested that information received from other farmers is viewed to be more
genuine, practical and trustworthy. In addition, peer-to-peer information exchange is
cheaper and easier than accessing more formal information sources. The challenge
therefore is to find ways to improve access to such informal information sources.
Interviewees highlighted the potential importance of cooperatives (currently less popular
with Nigerian farmers) where information can spread more easily across farmers and the
systematic review also suggested that accessing information from cooperatives improved
market participation (Sebatta et al., 2014).
The systematic review also revealed that accessing market information from other
farmers’ was not often used to model the extent of market participation; however, more

189
generally ‘access to market information’ was shown to enhance market participation (Abu
et al., 2014; Abu, 2015; Honja et al., 2017).
This study also suggests that being native to an area enhanced the extent of market
participation. The systematic review revealed that this factor had not been used to model
the extent of market participation in other studies. The importance of being locally born
and bred is explained in the qualitative study through its influence on a farmer’s ability to
access land at low cost, which gives locally-born farmers a significant advantage over
incomers. Also, natives tend to have greater social capital and are likely to be more trusted
by buyers due to the strong ties that they have in the local community. It was also
suggested that local farmers may enjoy preferential treatment from government
programmes such as loan schemes and input subsidies and so have a better opportunity to
participate more intensively in poultry markets.
Ownership of a motorcycle was also found to increase the extent of market participation.
The qualitative study explained the importance of relatively inexpensive forms of transport
in enabling farmers to transport goods to and from their farm quickly and easily, thus
making it easier to maintain higher numbers of birds at lower costs. The systematic review
also supports this finding, where ownership of bicycle was found to enhance the extent of
smallholder participation in banana markets (Jagwe et al., 2010) and the ownership of ox-
cart enhanced participation in maize markets (Bwalya et al., 2013).
The findings for non-farm income showed that farmers who earned more from non-farm
work were less likely to sell their poultry. This result has been observed in other studies.
For example, maize farmers in Ghana where found to be more likely to participate in the
market, the less they earned from off-farm sources (Abu et al., 2014), as were potato
farmers in Uganda (Sebatta et al., 2014) and mango farmers in southern Ethiopia (Honja et
al., 2017). In this study, further clarifications from the qualitative study focused on time
constraint faced by two categories of farmers. The first category are farmers who are self-
employed and while earning non-farm income still have spare time and sufficient
flexibility to use that time to engage intensively in their poultry businesses. The second
category of farmers who earn non-farm income from other employment but do not have
the time to intensively engage in their poultry businesses. In other words, a self-employed
farmer earning non-farm income tends to be better placed to actively participate in poultry
markets. This point was not observed in the quantitative study and has implications for

190
policy in Nigeria where access to credit is easier for salary earners because repayments
can be deducted from their monthly salaries. However, the reality is that such farmers
often lack the time to intensively participate in poultry markets.
The evidence from the current study shows that literate poultry farmers tend to be more
market oriented and more likely to participate more actively in poultry markets. This
finding is not always replicated in the literature. For example, non-literate or less well-
educated maize farmers in Ghana tend to be more market oriented perhaps because they
have fewer alternative options for earning their incomes (Abu et al., 2014). On the other
hand, literate or higher educated potato farmers in Uganda were found to be more market
oriented (Sebatta et al., 2014). Findings from the qualitative study on one hand suggested
that formal education opens up opportunities for poultry farmers to participate more
actively in poultry markets due to the technical nature of rearing birds. On the other hand,
better education may open the door to other more remunerative non-farm employment and
may discourage some smallholders from engaging with the market. Future policy could be
designed to encourage better-educated farmers’ to remain in the poultry sub-sector where
their skills could be exploited to encourage technological and other efficiency
improvements in the sector thereby making it more competitive. However, in the short-
term mid-level educated farmers who tend to have the time to engage in poultry should
also be supported.

191
7.1.3 Decision to sell at the farm-gate: Tobit model
This study also sought to measure significant factors influencing the decision whether to
sell live poultry at the farm-gate or through the spot market. Five statistically significant
factors (flock size, price, time taken to reach the nearest hospital, price expectation and
access to repeat or regular customers) in the Tobit model were found to influence
smallholder poultry farmers’ decisions to sell at the farm-gate rather than at the spot
market. The systematic review suggests that a range of individual, socio-economic and
transaction costs factors play an important role in influencing smallholder poultry farmers’
decisions to sell at the farm-gate (Hobbs, 1997; Gong et al., 2006; Woldie and Nuppenau,
2011; Lijia and Xuexi, 2014). The results from this study provide similar insights.
Overall, the study reveals that poultry farmers who are remotely located, have a large
flock size, attract regular or repeat customers and who are prepared to sell their produce at
a lower price while continuing to maintain a strong bargaining position are most likely to
sell at the farm-gate.
The findings demonstrate that poultry farmers selling at the farm-gate prioritise quantity
sold over unit price. The interview data also suggests that having a large flock allows
farmers both to attract buyers and offer competitive prices that generate high sales
volumes and revenues. More importantly, interview data buttressed the point that the
higher prices available at the spot market do not fully compensate the farmer for the
transport and other costs associated with trading live poultry at the market, which in some
cases may be located at a considerable distance from the farm. So lower prices at the farm-
gate are traded off for a reduction in the transaction costs associated with selling through
the spot market.
Dealing with repeat or regular customers at the farm-gate is another way in which farmers
can reduce some of the transaction costs associated with market participation. Regular
transactions builds mutual trusts and understanding between buyers and farmers and tends
to lower search and information costs of doing business by reducing time spent
exchanging information for example on quality of grades buyers require (Dapiran and
Hogarth-Scott, 2003; Sculze et al., 2006). Respondents in the qualitative study emphasised
the convenience of buying and selling at the farm-gate, part of which is rooted in the
importance of volume where customers are drawn to farms where they can access large

192
enough volumes of poultry to justify their transport costs. In addition, many farmers prefer
to sell at the farm-gate where as well as lowering transport costs, are spared the anxiety of
having to search for customers. Similarly, selling at the farm-gate rather than on the spot
market also means that farmers do not feel the pressure to sell their remaining birds at far
reduced prices in order to avoid the costs associated with having to transport them back to
the farm.

193
7.2 Summary of Principal Findings
7.2.1 Probability of market participation
Female poultry farmers located further from main market centres but closer to
tarred roads were found to be more market oriented. This finding emphasises the
importance of road infrastructure in supporting rural business activities particularly
for farms with a large flock size which are often situated further away from urban
areas where land is cheaper. Location close to tarred roads offers the dual
advantages of being more easily accessible to buyers and of having better access to
spot markets.
Poultry farmers who have access to veterinary services were also found to be more
market oriented. This finding suggests that access to veterinary services gives
farmers the confidence to maintain large flocks.
A healthy cash flow was also found to be important for farmers who were more
market oriented. This requires farmers to have a means of generating the income
required to support the development of their poultry enterprises. Rather than taking
out a loan many prefer to use income derived from other on or off-farm activities.
For example, farmers situated further from urban centres may have more land
available to engage in enterprises, such as vegetable growing, which can provide
the additional income they require to support their poultry businesses.
7.2.2 Extent of market participation
Relying on other poultry farmers as the main source of market information
enhances the extent to which smallholder farmers participate in poultry markets.
Peer-to-peer information exchange may be perceived as more trustworthy and
relevant and may be the most readily available source of obtaining up-to-date
information on poultry markets and as such will involve lower transaction costs
than more formal channels.
Farmers native to an area were found to be more likely to participate in poultry
markets than non-locals. The underlying perception among respondents was that

194
such individuals enjoy preferential government assistance such as free training
opportunities, interest -free loans and input subsidies.
Access to transport and a mobile phone enhanced smallholders participation in
poultry markets by making daily operational activities like transporting feed or
making appointments easier.
Smallholders who were more market orientated tended to have less income from
non-farm sources than other farmers. Similarly, self-employed farmers who have
more flexibility around their time are also found to be more likely to intensively
participate in poultry markets compared to salaried employees.
Being literate enhances the capacity of farmers to undertake the challenges of
running poultry enterprises and increases the likelihood of market participation.
However, individuals with higher levels of education are likely to seek
employment away from farming.
7.2.3 Choice of where to sell
In selling at the farm-gate, poultry farmers prioritise quantity over price. In other
words, farmers are willing to accept a reduced unit price for large volume sales.
The decision to sell at the farm-gate can also be explained by location. In general,
the further away a farm is from an urban area, the more likely farmers opt to sell at
the farm-gate. Such farmers often have space to stock large numbers of birds,
which increases their reliability as a supplier and leads to increased numbers of
repeat customers and the existence of a reliable market for farm-gate sales relieves
farmers of the transport and other costs associated with having to participate in
spot markets.
195
7.3 Influence of transaction costs on market participation
The results of the study identified that institutions that matter in the context of poultry
markets were associated with veterinary services, road and transport infrastructure,
informal credit institutions, informal information sources, telecommunications
infrastructure, trusts built through repeated interactions and negotiation with customers
from a position of strength. These set transaction costs factors identified in the study
different from individual and socio-economic factors due to the institutional slant
associated with transaction costs factors. In other words, it would be near impossible for
participation to occur in the absence of a supporting environment enabled by institutions
designed to support market exchange.
Specifically, although the study found factors such as gender, household size, flock size,
marital status and educational status to influence market participation, these factors tend to
rely on transaction costs factors to provide the institutional support necessary to create an
enabling business environment that eases doing poultry business. In other words, factors
that create an enabling environment are more relevant (hence focus on transaction costs)
than individual and socio-economic factors. Since institutional factors provide a necessary
condition for market participation and are therefore more inclusive of farmers regardless
of socio-economic or demographic status (UNIDO, 2008).
Transaction costs factors therefore provide a level playing field for doing business and
maybe considered as a public good (Cheng and Zhang, 2011). For example, the presence
of tarred roads enables easy movement of goods and services to the generality of farmers.
However, where a tarred road is not available (i.e. difficult to access) only richer farmers
with trucks might be able to participate in the market because they have a suitable vehicle
to transport goods in the area. This lack of road infrastructure tends to exclude poorer
farmers. Whereas in the presence of good road infrastructure both rich and poor farmers
are able to utilize the road to their individual advantage thereby easing market
participation to all categories of farmers.
More importantly, the findings from the quantitative phase showed that for each additional
hour it took to reach tarred roads, farmers had as much as a 20 percent lower probability of
participation as such being further from good roads deter market participation implying
that closeness to tarred roads enhances market participation.

196
The findings therefore, show the importance of good road infrastructure as an institutional
measure in easing doing business because good road infrastructure lowers ex ante
transaction costs associated with search costs of accessing inputs as well as bargaining
costs of associated with moving goods to an area with good road access compared to an
area with poor road access and ex post monitoring costs of policing or ensuring contract
terms are adhered to.
In addition, accessing information from informal sources increased extent of market
participation by as high as 20 percent. It therefore highlights the importance of
information in market exchange because informal sources lower search costs of accessing
market information because of the ease of approaching other farmers for information as
opposed to accessing information from newspaper or television.
Furthermore, the choice of selling at the farm-gate was 20 percent higher where a farmer
has returning customers. This is possibly so because search costs of looking for potential
buyers is lower at the farm-gate. In addition, bargaining costs of negotiating prices for
every transaction with new buyers is also reduced together with costs of enforcing the
transaction in terms of credit purchases and trusts associated with repayment or ensuring
that buyers pay as agreed is lower.
The findings of the study therefore highlight the importance of transaction costs
(institutional factors) in influencing market participation. Particularly, in areas associated
with access to tarred roads, access to information and repeat interactions.

197
Chapter 8. Contributions and Conclusions
8.0 Contributions, limitations, future research and conclusions
Studies into how transaction costs influence smallholder market participation decisions
have traditionally applied quantitative methods. Consequently, attitudes, beliefs and
preferences in explaining how transaction costs influence farmers’ market participation
remain largely unaccounted for. This leads to gaps in our understanding of some of the
intangible costs associated with market participation which may have serious implications
for any policies designed to encourage participation through lowering the transaction costs
of smallholder farmers. In a bid to address this gap in the existing literature, this study
applied a mixed methods strategy. The systematic review presented in Chapter 2 reveals
that in addition to a lack of qualitative evidence in the smallholder market participation
literature, there is also little information on the influence transaction costs have on
smallholders decisions to sell poultry at the farm-gate rather than through other market
channels.
Chapters 4 and 6 present the findings of this mixed methods study designed to investigate
the influence of transaction costs on smallholder market participation decisions in Nigeria.
The main objectives of this study were first to determine how transaction costs influence
both the probability of smallholder farmers participating in poultry markets and the extent
of their participation; and second to explore how transaction costs influence their decision
to sell live poultry at the farm-gate. In order to address these objectives, the study
employed an explanatory sequential mixed methods design wherein two phases of data
analysis were conducted starting with a quantitative phase and moving onto a qualitative
phase. In the quantitative phase, primary data analysis based on a survey of smallholder
poultry farmers was undertaken to estimate the various factors that influence smallholder
farmers’ decisions to participate in poultry markets. To connect the two phases, a subset of
the statistically significant transaction costs factors obtained from the quantitative analysis
formed the basis for further exploration using qualitative methods. The second phase of
the study therefore extended the quantitative analysis by permitting a deeper exploration
of how and why the identified transaction costs were perceived to influence the market
participation decisions of smallholder poultry farmers. In order to achieve this objective,
198
semi-structured interviews were conducted across a sample of smallholder farmers and the
results from both phases are integrated and discussed in Chapter 7.
This chapter outlines the contributions that this study makes to the existing body of
literature presented in section 8.1. The limitations and strengths of both quantitative and
qualitative approaches are presented in section 8.2 and recommendations relevant to the
study are made in section 8.3 after which the main conclusions of the study are presented
in section 8.4.
8.1 Methodological contribution to the smallholder market participation
literature
The use of mixed methods strategy is the main methodological contribution made by this
research to the smallholder market participation literature. The dearth of mixed methods
research in the literature is somewhat curious considering the preponderance of the use of
qualitative variables to assign numbers for the purpose of data analysis. While no
published examples of the use of mixed methods approaches in smallholder market
participation research could be identified, studies in the fields of architecture, accounting
and healthcare have commonly applied this approach to address research questions around
factors which are hard to measure using quantitative approaches (e.g. (Chen, 2012;
Cowman and McCarthy, 2012; Gylling, 2014). It is therefore reasonable to employ mixed
methods to smallholder market participation research, where motives for participation may
not always be easy to identify through quantitative approaches. Qualitative data on one
hand, relies on human experience and can therefore reveal in greater depth and detail the
complexities and subtleties (i.e. richness of information) involved in making market
participation decisions. On the other hand, while quantitative data may lack the richness
and detail of qualitative data, it is useful in providing a rigorous means of testing the
significance or otherwise of various hypothesized associations. By adopting a mixed
methods strategy in this study, the strengths of the quantitative and qualitative methods are
both exploited to enable a more comprehensive understanding of the tangible and
intangible factors influencing market participation by smallholder poultry farmers in
Nigeria.

199
8.2 Strengths and Limitations of the Mixed Methods Study
8.2.1 Quantitative Phase
The primary dataset was a key strength for this phase of the study. The use of primary data
is common in smallholder market participation studies and 23 out of the 25 studies
reviewed made use of primary data in their analyses. In addition, the quality assessment
performed in the systematic review showed that all of the study samples examined were
representative of the target population.
In two-step decision-making studies, either Cragg’s double hurdle model or Heckman’s
two-step model tends to be used to analyse the data. The use of Cragg’s model is another
key strength of the quantitative phase of the study. In deciding which of the models to
apply in a two-step analysis, the presence of zero observations in the dataset guides this
decision (Wodjao, 2008; Eakins, 2014). For the Heckman model, zero values in the dataset
for the extent of participation are treated as missing or unobserved variables which
indicates incidental truncation (Abu et al., 2014). However, for Cragg’s model such, zero
values indicate a purposeful choice not to sell rather than a missing or unobserved value.
In this study, it would have been incorrect to treat such zero values as missing data, which
indicated the use of Cragg’s model.
A possible limitation in the study was the cross-sectionality of the 2015 dataset, according
to Mann (2012) the implication of using cross-sectional data is that the analyses in the
study will examine associations occurring between variables rather than causality which
would normally require longitudinal data, particularly for variables that are likely to
change over-time. In this study, variables such as non-farm income and distance to tarred
road, fit the type of variables that are likely to change over-time, since farmers
circumstances can change (e.g. farmers can earn non-farm income one year but not in
another). This means that findings from the quantitative phase of this study only capture a
snapshot of the factors influencing market participation.

200
8.2.2 Qualitative Phase
The use of a mobile phone to recruit interview participants was a noteworthy strength of
the qualitative phase. During the survey, participants were asked to leave their phone
numbers if they were happy to be contacted at a later date. Those who did were
subsequently contacted to arrange an interview. This meant it was easy to recruit interview
participants from a large and varied selection. However, the down side to this approach
was that any poorer farmer without a mobile phone was excluded from the interviews.
Another important strength of the study was that most participants in the qualitative phase
were already familiar with the aims of the research and with the researcher. This enabled
informant to express their views more freely. Furthermore, the use of „ibibio‟ the local
language of both the researcher and informants helped to establish trust and enabled
respondents to answer in their own language.
Ironically, language, which was one of the main strengths in the qualitative phase as stated
above, was also an indirect limitation. This reflects the fact that during transcription of the
interview data, the researcher had to translate and transcribe simultaneously. This process
was time consuming and some information may have been lost in translation. Another
limitation in the qualitative phase was that only market participants were interviewed so
the perspective of non-market participants were not accounted for. This was a deliberate
choice and reflected the need to explore factors that enhance market participation. Even
so, non-participants might have offered an alternative and interesting perspective, which
was not considered in the current study.

201
8.2.3 Mixed methods design
The use of mixed methods to investigate transaction costs influencing smallholder market
participation is a notable strength of this study. The rationale for the use of mixed methods
has already been discussed in section 3.3 and reiterated in section 8.1. In summary,
integrating both quantitative and qualitative methods allowed for a more comprehensive
understanding of factors influencing market participation than would have been possible if
only one method had been used. Accordingly, the explanatory sequential mixed methods
design was employed to address the study objectives. In the first instance, the quantitative
phase was successful in providing evidence of significant factors influencing market
participation. Afterwards, a subset of the statistically significant results were selected for
further exploration in the second qualitative phase which provided detailed insights into
the importance and action of those factors identified as influencing smallholder market
participation decisions.
The benefits of the mixed methods design are based on moving from a more generalised
result drawn from a large representative sample, to a more in-depth contextual
examination of farmers’ lived experiences, thus providing a comprehensive understanding
of factors influencing market participation.
Another strength of the mixed methods design was that both phases were conducted in a
short time period ensuring that any insights peculiar to that period were captured.
A potential limitation of the mixed methods design was the time required to undertake
both phases. Travelling from the UK to conduct fieldwork in Nigeria within the limited
time available in a PhD study only permitted a certain amount of field data to be collected.
In addition, it is possible that an alternative exploratory sequential design could have been
adopted in which in-depth interviews are conducted in an initial qualitative phase and
findings which in turn informs the quantitative phase of the study. However, this design
may have been more time consuming. Another possible design would have been to collect
data from both phases at the same time, however the complexity of the design would
likely have been overwhelming (Bryman, 2007b) and would not have permitted the
insights from the first phase to inform and direct the conduct of the second phase.

202
8.3 Recommendations
8.3.1 Future Research
To achieve an in-depth understanding of factors influencing market participation only
farmers were considered whereas those traders (intermediaries) who act as bulk buyers
were not studied. This suggests that further research on how and why traders engage in
poultry markets is required, in order to explore the impact that working with these
individuals has on farmers’ transaction costs.
Another area for future research is in the research design. The current study employed the
explanatory sequential mixed methods design, and it is possible that an alternative
sequential design, where the qualitative phase is the dominant phase, may reveal
information that can then be used to inform the quantitative phase. For example, in the
current study, the interview data revealed that farmers who also engage in off-farm self-
employed work were more market oriented than those who held salaried positions off-
farm. This new information however, could not be explored in the quantitative study.
Urban and rural dimensions of market participation were not explicitly considered in the
current study. The interview data revealed that farmers experience different marketing
outcomes based on whether a farm is located in a rural or urban area. Further research
exploring the importance of this issue on participation could be valuable.

203
8.3.2 The future of smallholder poultry farmers in Nigeria
The justification for focussing on poultry farmers was because of the import ban policy
currently in force, which aims to encourage domestic participation in poultry markets.
However, such import bans are seldom permanent, which suggests that the future of
smallholder poultry farmers, in the face of potential trade liberalisation, should be given
serious consideration. Currently, poultry prices in Nigeria are not influenced by import
prices, which may be lower than domestic prices. If imports were permitted, smallholder
farmers would be likely to struggle to compete with their foreign counterparts with respect
to price.
One way of making them more competitive is by lowering costs of production particularly
costs of poultry feed and by making the poultry value chain more efficient. In addition,
lowering the costs of feed would mean increasing supply of feed by boosting domestic
feed production through tax reliefs so that companies can have additional funds to increase
production. Another approach would be to reduce tariff on imported poultry feed to lower
costs of feed. However, this strategy is likely to hurt domestic feed industry as such
initiatives to attract domestic investments in poultry feed industry seems a more
acceptable strategy.
Furthermore, the poultry industry is closely linked with poultry feed industry thus,
removing the import ban is likely to also adversely influence the feed industry. This in
turn may have implications for jobs losses, as such incentives to support feed industry and
increase supply is likely to lower costs of poultry feed thus making costs of poultry
production comparatively low. Another area of interest is in the processing of poultry,
imported poultry is often shipped in boxes already processed, as it is easier to transport
lorry loads of processed meat from ports to market thus saving costs involved in handling
live birds. Accordingly, processing mechanisms should be prioritised; such measures will
also create employment opportunities, as it is inevitable that a liberalised poultry market
will leave some farmers out of business. Such farmers can find jobs in the processing
sector whilst remaining local. By so doing, rural to urban migration can be reduced, since
cottage-processing factories will ensure rural employment and facilitate urban sprawl. This
strategy fits into goals one (No poverty), two (zero hunger) and eleven (sustainable cities)
of the globally agreed sustainable development goals (SDGs) agenda.

204
Besides the need to encourage domestic participation in the poultry market, another
justification for the import ban was on health concerns particularly the chemical
preservatives in imported poultry that may have adverse health implications Obinna
(2016) and Ifijeh (2016). As such, the import ban has encouraged consumer taste for
locally produced fresh poultry meat devoid of chemical preservatives and has implications
on local farmers markets, where health conscious consumers, assured of the quality of
birds will likely ensure that smallholder farmers remain relevant in the face of trade
liberalisation as health concerns is likely to be tipped in favour of domestic poultry
farmers and ensure that rural livelihoods are sustained, since changing taste and preference
is likely to ensure that farmers have readily available buyers that help build trust in the
market.
To further checkmate quality, the bar on sanitary standards needs to be raised and enforced
for imported poultry, this strategy is likely to reduce imports from abroad and is a
common non-tariff strategy countries adopt to reduce foreign imports and lower imports,
is likely not to disrupt domestic supply to the extent where smallholders’ are run out of
business however, this measure is likely to adversely impact on consumers by way of
higher prices and tax payers by way of increased expenditure of enforcement of standards.
In addition, border controls needs to be strengthened to curb the incidence of smuggling so
that supply is not unfairly compromised to the detriment of domestic poultry farmers.
Poultry meat is the dominant form of import, as such in the event of market liberation, as
foreign competition may adversely influence domestic market by way of lower prices.
Smallholder farmers may decide to diversify by adding value to poultry. For example,
waste products from poultry is a source of biogas for the generation of electricity and the
Nigerian government is currently looking at various forms of electricity generation; as
such, this type of additional source of revenue for smallholders should help augment
possible lower prices from foreign competition and is likely to keep smallholders in
business. In addition, organic farming using poultry litter should be made a policy priority
and processing poultry litter for use as organic manure is also a job creating avenue in
rural areas.
The thrust therefore is to provide smallholder farmers with safety nets for their governance
of a liberalised poultry market through lowering costs of production in addition to
lowering transaction costs associated with smallholder market participation for which this

205
study has successfully addressed and at the same time, providing additional streams of
income from poultry by-products to shore up farmers’ incomes as prices fall due to foreign
competition. The processing of poultry meat and poultry by-products into a variety of
useful products is a job creating strategy that will move some farmers who may not be
able to compete in a liberalised poultry market to find non-farm employment in the meat
and by-product processing industries. By so doing, rural livelihoods are sustained and
rural-urban migration is curtailed thereby enabling robust and thriving rural communities.
In general, the future of smallholder poultry farmers in the face of trade liberalisation is
bright provided an enabling business environment is created within an evolving business
environment going forward.
8.3.3 Policy and Practice
The evidence from the current study shows that household, individual and transaction
costs factors all play a part in influencing that market participation decisions of
smallholder poultry farmers. Policy implications arising from the findings hinge on
reducing transaction costs to create an enabling environment to facilitate market
exchanges between farmers and buyers. Such an enabling environment requires a good
transport infrastructure so construction, maintenance and upgrade of rural feeder roads to
strengthen market access is recommended and would benefit a wide variety of rural
enterprises (Casaburi et al., 2012).
Also, there is a need for better access to veterinary services particularly in rural areas.
Finding a qualified vet in a remote rural area may be both uncommon and costly
(Ugbebor, 2017), therefore programmes such as community poultry health worker
schemes (FMARD, 2011) could be broadened and strengthened through adequate
recruitment and training. These community poultry health workers could carry out some of
the more routine tasks that would otherwise be performed by a vet.
A common strategy to access cash flow involved growing vegetables using poultry
droppings as a fertilizer and then selling the surplus off. Two policy measures could help
in this regard: firstly, facilitating access to land for farmers to enable expansion. Secondly,
neighbouring farmers could be encouraged to collaborate to grow vegetables and by so
doing, take advantage of economies of scale and scope. Therefore, farmers could rear

206
poultry individually but share in the vegetable business and still generate the income
required to support their poultry businesses.
A model farmer programme could also be established as a resource for farmers to access
information. Such model farms could be established and equipped using the latest ideas
and equipment, also acting as centres for innovation and information hubs. Since, farmers
were found to prefer to access information from other farmers, such a centralised
information source would be more robust and better organised compared to the more
informal route where farmers rely on meeting other farmers willing to share relevant
information.
Furthermore, better access to mobile phone services in terms of improved coverage and
network quality through the provision of rural telecommunications infrastructure would
benefit a wide range of rural enterprises. Such access was found to be of particular
importance to poultry farmers.
Finally, evidence from this study suggests that farmers with larger flocks are more market
oriented, so to widen participation, smaller farmers need to be encouraged. One approach
would be to institute poultry market days whereby collective marketing of mostly poultry
products is carried out, in a type of a one-stop shop. Such markets need to be conducted at
a district or village level, so that no matter the flock size, farmers can physically transport
their birds to market and still have leverage on prices because of the large volumes of
birds available for sale at one place. Such markets can also serve as information centres
because rural markets in Nigeria play other roles beyond buying and selling. Markets also
serve as meeting points for deep social interactions (Southworld, 2014), and the majority
of market sellers are mostly market women (Aganbi and Onuoha, 2017) which aligns with
the study findings where in women were found to be more market oriented.

207
8.4 Conclusion
This mixed methods study has been able to demonstrate its relevance in the investigation
of transaction costs influencing on market participation by smallholder poultry farmers in
Nigeria. However, despite the relevance of a mixed methods strategy, the systematic
review of the smallholder market participation literature identified a lack of its application.
In addition, the decision to sell through the farm-gate vis-à-vis spot market has also not
been investigated in the smallholder market choice literature. To address these gaps, an
explanatory sequential mixed methods design comprising an initial quantitative phase
followed by a qualitative phase was employed. In the quantitative phase, significant
factors influencing on probability of market participation, extent of market participation
and choice of where to sell were successfully identified.
A subset of the significant factors focusing on transaction costs factors were selected for
further exploration in the qualitative phase, which captured rich insights into how and why
the factors selected were perceived to influence on their market participation decisions.
The key themes obtained from the interviews conducted with a sample of poultry farmers
drawn from different walks of life revealed that self-employed mid-level educated farmers
were intangibles that further enhanced market participation by smallholder poultry farmers
in Nigeria.
The evidence from this study is the first of its kind in the smallholder market participation
literature and has allowed for a more comprehensive understanding of the factors
influencing on smallholder market participation decisions by establishing that policy
interventions seeking to lower transaction costs should also account for intangible factors.
208
References
Abebe, G.K., Bijman, J. and Royer, A. (2016) 'Are middlemen facilitators or barriers to
improve smallholders' welfare in rural economies? Empirical evidence from Ethiopia',
Journal of Rural Studies, 43(203-213).
Abu, B.M. (2015) 'Groundnut Market Participation in the Upper West Region of Ghana',
Ghana journal of development studies (GJDS), 12(1), pp. 106-124.
Abu, B.M., Osei-Asare, Y.B. and Wayo, S. (2014) 'Market participation of smallholder maize
farmers in the upper west region of Nigeria', African Journal of Agricultural Research,
9(31), pp. 2427-2435.
Abutu, P.O. (2014) 'Challenges of Agriculture in Nigeria Economy: A Bane to food Security',
IOSR Journal of Agriculture and Veterinary Science (IOSR-JAVS), 7(5), pp. 18-21.
Acemoglu, D. (2004) 'Understanding institutions', Lionel Robbins Lectures, London School of
Economics, 23-25 February.
Achandi, E.L. and Mujawamariya, G. (2016) 'Market Participation by smallholder rice farmers
in Tanzania: a double hurdle analysis', Studies in Agricultural Economics, 118, pp. 112-
115.
Adene, D.F. and Oguntade, A.E. (2006) 'The structure and importance of the Commercial and
Village based poultry systems in Nigeria.', Poultry production systems: FAO-
ECTAD\AGAP, pp. 1-102.
Adeoti, A.I., Oluwatayo, I.B. and Soliu, R.O. (2014) 'Determinants of Market Participation
among Maize Producers in Oyo State, Nigeria', British Journal of Economics,
Management & trade, 4(7), pp. 1115-1127.
Aganbi, A. and Onuoha, C. (2017) 'When women are leading: Implication for commerce in
Nigeria', Vanguard, https://www.vanguardngr.com/2017/06/women-leading-
implication-commerce-nigeria/ 23/9/2017
Agbo, F.U., Iroh, I.I. and Ihemezie, E.J. (2015) 'Access to Credit by Vegetable Farmers in
Nigeria: A Case Study of Owerri Agricultural Zone of Imo State, Nigeria', Asian
Journal of Agricultural Research, 9(4), pp. 155-165.
Agbonlahor, M.U., Adewuyi, S.A. and Ogundairo, V.O. (2015) 'Do Rural Smallholder farmers
subsidize farm Investments with Non-farm Income? A study of vegetable farmers',
International Journal of Vegetable Science, 22(3), pp. 231-242.
209
Agee, J. (2009) 'Developing qualitative research questions: a refective process', International
Journal of Qualitative Studies in Education, 22(4), pp. 431-447.
Ainembabazi, J.H. and Mugisha, J. (2013) 'The role of Farming Experience on the Adoption of
Agricultural technologies: Evidence from Smallholder Farmers in Uganda', The Journal
of Development Studies, 50(5), pp. 666-679.
Ajibade, F. (2015) 'Land Tenure System in Ekiti State, Nigeria', FIG Working Week 7607, pp.
1-10.
Akintunde, O.K. (2015) 'Determinants of Poultry Farmer's Participation in Livestock Insurance
in Southwest Nigeria', Asian Journal of Poultry Science, 9(233-241).
Alabi, R.A. and Aruna, M.B. (2005) 'Technical Efficiency of Family Poultry Production in
Niger-Delta, Nigeria', Journal of Central European Agriculture, 6(4), pp. 531-538.
Alabi, R.A. and Isah, A.O. (2002) 'Poultry production constraints: The case of Esan West Local
Government Area of Edo State, Nigeria', African Journal of Livestock Extension, 1(1),
pp. 58-61.
Allen, D. (1999) 'Transaction costs', in Encyclopedia of law and economics.
Allmark, P., Boote, J., Chambers, E., Clarke, A., McDonnell, A., Thompson, A.R. and Tod, A.
(2009) 'Ethical issues in the use of in-depth interviews: literature review and
discussion', Research Ethics Review, 5(2), pp. 48-54.
Alubo, O. (2011) 'The Public Space in Nigeria: Poiltics of Power, Gender and Exclusion',
Africa Development, 36(1).
Amani, S. (2014) Smallholder Farmers' Marketing Choices. Prepared for World Food
Programme by Management Systems International.
Anney, V.N. (2015) 'Ensuring the Quality of the Findings of Qualitative Research: Looking at
Trustworthiness Criteria', Journal of Emerging Trends in Educational Research and
Policy Studies, 5(2), pp. 272-281.
Apind, B.O., Lagat, J.K., Bett, H.K. and Kirui, J.K. (2015) 'Determinants of Small-holder
Farmers Extent of Market partcipation; Case of Rice marketing in Ahero Irrigation
Scheme, Kenya', Journal of Economics and Sustainable Development, 6(2), pp. 154-
160.
Arias, P., Hallam, D., Krivonos, E. and Morrison, J. (2013) Smallholder integration in
changing food markets (E-ISBN 978-92-5-107663-7 (PDF)). Rome: UN-FAO.
Assembly of the African union (2003) 'African Union, second ordinary Session Maputo,
Mozambique'.

210
Ayanwuyi, E. (2013) 'Rural Dweller's Perception of Impacts of Motorcycle (Okada) Services in
Community Development in Ogbomoso Agricultural Zone of Oyo State, Nigeria.',
Research in Humanities and Social Sciences, 2(15), pp. 118-125.
Badiru, I.O. (2010) 'Review of Small Farmer Access to Agricultural Credit in Nigeria',
International Food Policy Research Instiitute, policy Note No. 25, pp. 1-6.
Balogun, T.A. (2013) 'In defense of Nigerian Pidgin', Journal of Languages and Culture, 4(5),
pp. 90-98.
Bardhan, P. (2005) 'Institutions matter, but which ones?', Economics of Transition, 13(3), pp.
499-532.
Barrett, C.B. (2008) 'Smallholder market participation: concepts and evidence from eastern and
southern Africa', Food Policy, 33, pp. 299-317.
Blair, J., Czaja, R.F. and Blair, E.A. (2014) Designing Surveys: A Guide to Decisions and
Procedures. 3rd Edition edn. Thousand Oaks, California: SAGE.
Bolla, G., Robinson, S. and Arzey, G. (2003) 'Poultry keeping on a small scale', Agnote.
Boschma, R. (2005) 'Proximity and Innovation: A Critical Assessment', Regional Studies,
39(1), pp. 61-74.
Boyce, C. and Neale, P. (2006) Conducting Indepth Interviews: A guide for Designing and
Conducting In-Depth Interviews for Evaluation Input. Massachusetts, USA: Pathfinder
International.
Brhane, G., Mammo, Y. and Negusse, G. (2017) 'Sources of information and information
seeking behaviour of smallholder farmers of Tanqa Abergelle Wereda, central zone of
Tigray, Ethiopia', Journal of Agricultural Extension and Rural Development, 9(4), pp.
47-52.
Bruyn, P.d., Bruyn, J.N.d., Vink, N. and Kirsten, F.J. (2001) 'How transaction costs influence
cattle marketing decisions in the northern communal areas of Namibia', Agrekon, 40(3),
pp. 405-425.
Bryman, A. (2007a) 'Barriers to integrating Quantitative and Qualitative Research', Journal of
Mixed Methods Research, 1, pp. 8-22.
Bryman, A. (2007b) 'Barriers to integrating quantitative and qualitative research', Journal of
Mixed Methods Research, 1(1), pp. 8-22.
Burke, W.J. (2009) 'Fitting and interpreting Cragg’s tobit alternative using Stata', The Stata
Journal, 9(4), pp. 584-592.

211
Bwalya, R., Mugisha, J. and Hyuha, T. (2013) 'Transaction costs and smallholder household
access to maize markets in Zambia', Journal of Development and Agricultural
Economics, 8(9), pp. 328-336.
Caballero, G. and Soto-onate, D. (2016) 'Why transaction costs are so relevant in political
governance? A new institutional survey', Brazilian Journal of Political Economy, 36(2
(143)), pp. 330-352.
Cameron, R. (2009) 'A sequential mixed model research design:Design, analytical and display
issues', International Journal of Multiple research approaches, 3(2), pp. 140-152.
Capaldo, A. and Petruzzelli, M.A. (2014) 'Partner Geographic and Organizational Proximity
and the Innovative Performance of Knowledge-Creating Alliances', European
Management Review, 11, pp. 63-84.
Casaburi, L., Glennerster, R. and Suri, T. (2012) 'Rural feeder roads and access to markets',
Policy Brief - International Growth Centre, 3024.
CASP (2017) Critical Appraisal Skills Programme. Available at:
http://docs.wixstatic.com/ugd/dded87_7e983a320087439e94533f4697aa109c.pdf
(Accessed: 4/4/17).
Charles, I. (2010) 'Women's land rights and the challenges of patriachy: lessons form ozalla
community, Edo state, Nigeria', Gender and Behaviour, 8(1).
Chen, L. (2012) A mixed methods study investigating intangibles in the banking sector.
University of Glasgow. PhD Thesis.
Cheng, W. and Zhang, D. (2011) 'How should a public good be provided? A transaction costs
approach', Division of Labour & Transaction Costs, 3(2), pp. 69-80.
Chigusiwa, L., Bindu, S., Muchabaiwa, L. and Mudavanhu, V. (2013) 'The Role of Market
Middlemen in the Marketing of Smallholder Horticultural Products in Zimbabwe',
Greener Journal of Business and Management Studies, 3(8), pp. 369-377.
China green agriculture inc (2007) Markets- industry outlook. Available at:
http://www.cgagri.com/markets/markets2.htm (Accessed: 27/3/2014).
Coad, J., Hardicre, J. and Devitt, P. (2006) 'Searching for and using 'grey' literature', Nursing
Times, 102(50), pp. 35-36.
Coase, R.H. (1937) 'The nature of the Firm', Economica, 4, pp. 386-405.
Cowman, M.C. and McCarthy, A.M. (2012) 'Training Effectiveness and Transfer: A Mixed
Methods Investigation', UFHRD.
CRD (2008) 'Systematic Reviews - CRD's guidance for undertaking reviews in health care',
Centre for Reviews and Dissemination, University of York.

212
Creswell, J.W. (2013) 'Steps in Conducting a Scholarly Mixed Methods Study', DBER Speaker
Series Paper 48.
Cronholm, S. and Hjalmarsson, A. (2011) 'Experiences from Sequential Use of Mixed
Methods', The Electronic Journal of Business Research Methods, 9(2), pp. 87-95.
Cuevas, A.C. (2014) 'Transaction costs of Exchange in Agriculture: A survey', Asian Journal
of Agriculture and Development, 11(1).
Dana, N., Duguma, R., Teklewold, H. and Aliye, S. (2006) 'Transporming village poultry
systems into small agro-business ventures: a partnership model for the transfer of
livestock technologies in Ethiopia', Livestock Research for Rural Development, 18(12),
p. Article 169.
Daniel, E. (2015a) 'Map of Abak', Centre for General Studies - Akwa Ibom State University,
Nigeria.
Daniel, E. (2015b) 'Map of Etim Ekpo', Centre for General Studies - Akwa Ibom State
University, Nigeria.
Daniel, E. (2015c) 'Map of Uyo', Centre for General Studies - Akwa Ibom State University,
Nigeria.
Dapiran, G.P. and Hogarth-Scott, S. (2003) 'Are co-operation and trust being confised with
power? An analysis of food retailing in Australia and the UK', International Journal Of
Retail & Distribution Management, 31(5), pp. 256-267.
De Silva, H. and Ratnadiwakara, D. (2010) Using ICT to reduce transaction costs in
agriculture through better communication: A case study from Sri Lanka (Accessed:
6/1/2017).
Delgado, C. (1999) 'Sources of growth in smallholder agriculture in sub-Saharan Africa: The
role of vertical integration of smallholders with processors and marketers of high value-
added items', Agrekon, 38.
den Butter, F.A.G. (2012) Managing Transaction Costs in the Era of Globalization.
Cheltenham, UK: Edward Elgar.
Dommeyer, C.J., Baum, P., Hanna, R.W. and Chapman, K.S. (2004) 'Gathering faculty
teaching evaluations by in-class and online surveys: their effects on response rates and
evaluations', Assessment & Evaluation in Higher Education, 29(5), pp. 611-623.
Dougherty, C. (2012) EC220- Introduction to econometrics (chapter 6) [Teaching Resource].
Drzeniek-Hanouz, M. (2015) Why institutions matter for economic growth. Available at:
https://www.weforum.org/agenda/2015/01/why-institutions-matter-for-economic-
growth/ (Accessed: 25/10/2017).

213
Duncombe, R. (2015) 'Mobile Phones for Agricultural and Rural Development: A literature
Review and Suggestions for Future Research', European Journal of Development
Research, pp. 1-23.
Eakins, J. (2014) 'An application of the Double Hurdle Model to Petrol and Diesel Household
Expenditures in Ireland', Surrey Energy Economics Discussion Paper Series, SEEDS
145.
Eaves, S. and Walton, J. (2013) Proceedings of the 12th European Conference on Research
Methodology for Business and Management Studies. Reading, UK. Academic
Conferences and Publishing International Limited.
Enete, A.A. and Okon, U.E. (2010) 'Economics of Waterleaf (Talinum trangulare) production
in Akwa Ibom State, Nigeria', The Journal of Field Actions, 4, pp. 1-5.
Fafchamps, M. and Hill, R.V. (2005) 'Selling at the farmgate or travelling to market', American
Journal of Agricultural Economics, 87(3), pp. 717-734.
Fakis, A., Hilliam, R., Stoneley, H. and Townsend, M. (2014) 'Quantitative Analysis of
Qualitative Information from Interviews: A Systematic Literature Review', Journal of
Mixed Methods Research, 8, pp. 25-51.
Farayola, C.O., Adeyemo, A.A., Nwachukwu, C.S. and Yusuf, A. (2013) 'Extension Strategy
Development and Training Needs for Small Scale Commercial Poultry Farmers in
Nigeria', Journal of World's Poultry Research, 3(4), pp. 99-105.
Farrell, D. (2013) 'The role of poultry in human nutrition - The nutritional benefits of chicken
meat compared with other meats', Poultry Development Review, UN-FAO.
Floyd J. Fowler, J. (2014) Survey Research Methods. Thousand Oaks, CA. USA: SAGE
Publications.
FMARD (2011) 'Agricultural transformation agenda: we will grow Nigeria agricultural sector',
Federal Ministry of Agriculture and Rural Development, Nigeria.
Foscht, T., Ernstreiter, K., Maloles III, C., Sinha, I. and Swoboda, B. (2013) 'Retaining or
returning?: Some insights for a better understanding of return behaviour', International
Journal Of Retail & Distribution Management, 41(2), pp. 113-134.
Frank, O.C., Anayor, B.O., Ogbonnaya, G.H., Abasi, D.S. and Ozeh, E.M. (2016) 'A study of
vegetable farmers’ decision to use poultry litter in the southern region of Nigeria',
African Journal of Agricultural Economics and Rural Development, 4(7), pp. 446-451.
Furber, C. (2010) 'Framework analysis: a method for analysing qualitative data', African
Journal of Midwifery & Women's Health, 4(2), pp. 97-100.

214
Gale, N.K., Heath, G., Cameron, E., Rashid, S. and Redwood, S. (2013) 'Using the framework
method for the analysis of qualitative data in multi-disciplinary health research', BMC
Medical Research Methodology, 13(117), pp. 2-8.
Gebremedhin, B., Hoekstra, D., Tegegne, A., Shiferaw, K. and Bogale, A. (2015) Factors
determining household market participation in small ruminant production in highlands
of Ethiopia. LIVES WORKING PAPER 2.
Gong, W., Parton, K., Cox, R.J. and Zhou, Z. (2006) 'Transaction costs and cattle farmers'
choice of marketing channels in China: A Tobit analysis', Management Research News,
30(1), pp. 47-56.
Goossens, F., Minten, B. and Tollens, E. (1994) Nourrir Kinshasa: l‟approvisionnement local
d‟une métropole africaine. . Paris: : L’Harmattan.
Guba, E.G. and Lincoln, Y.S. (1994) 'Competing paradigms in qualitative research', in Denzin,
N.K. and Lincoln, Y.S. (eds.) Handbook of qualitative research. Thousand Oaks, CA:
Sage, pp. 105-117.
Gylling, G. (2014) A model for Enquiry of Sustainable Homes of Model Home 2020. Aalborg
University. PhD thesis.
Haile, M.G., Kalkuhl, M. and Usman, M.A. (2015) 'Market Information and smallholder
farmer price expectations', African Journal of Agricultural and Reseourse Economics,
10(4), pp. 297-311.
Halkias, D., Nwajiuba, C., Harkiolakis, N. and Caracatsanis, S.M. (2011) 'Challenges facing
women entrepreneurs in Nigeria', Management research Review, 34(2), pp. 221-235.
Hanson, W.E., Creswell, J.W., Clark, P., L, V., Petska, K.S. and Creswell, J.D. (2005) 'Mixed
Methods Research Designs in Counseling Psychology', Faculty Publications,
Department of Psychology. Paper 373.
Hartnell, S.J. (2011) Intersections of Gender, Ethnicity, and Socioeconomic position in Health
in England: A Mixed methods Study. University of Sheffield.
Hazell, P., Poulton, C., Wiggins, S. and Dorward, A. (2007) 'The future of small farms for
poverty reduction and growth', 2020 Discussion paper 42. International Food policy
Research Institute. Washington, DC.
Head, E. (2009) 'The ethics and implications of paying participants in qualitative research',
International Journal of Social Research Methodology, 12(4), pp. 335-344.
Heise, H., Crisan, A. and Theuvsen, L. (2015) 'The Poultry market in Nigeria: Market
Structures and potential for Investment in the Market', International Food and
Agribusiness Management Review, 18(Special Issue A), pp. 197-222.

215
Hellin, J., Krishna, V.V., Erenstein, O. and Boeber, C. (2015) 'India's Poultry Revolution:
Implications for its Sustenance and the Global Poultry Trade', International Food and
Agribusiness Management Review, 18(Special Issue A), pp. 151-164.
Heyvaert, M., Hannes, K., Maes, B. and Onghena, P. (2013) 'Critical Appraisal Of Mixed
Methods Studies', Journal of Mixed Methods Research, 7, pp. 302-327.
Hicks, R.L., Parks, B.C., Roberts, T.J. and Tierney, M.J. (2010) Greening Aid? Understanding
the Environmental Impact of Development Assistance. United Kingdom: Oxford
University press.
Hobbs, J.E. (1997) 'Measuring the Importance of Transaction Costs in Cattle Marketing',
American Journal of Agricultural Economics, 79(4), pp. 1083-1095.
Holloway, G., Nicolson, C., Delgado, C., Staal, S. and Ehui, S. (2000) 'Agro-industrialization
through Institutional Innovation: Transaction costs, cooperatives and milk-market
development in the East-African Highlands', Agricultural Economics, 23(3), pp. 279-
288.
Honja, T., Geta, E. and Mitiku, A. (2017) 'Determinants of Intensity of Market participation of
smallholder mango producers: The case of Boloso Bombe Woreda, Wolaita zone,
Southern Ethiopia', Journal of Marketing and Consumer Research, 32(56-63).
Hounkonnou, D., Kossou, D., Kuyper, T.W., Leeuwis, C., Nederlof, E.S., Roling, N., Sakyi-
Dawson, O., Traore, M. and Huis, A.v. (2012) 'An innovation systems approach to
institutional change: Smallholder development in West Africa', Agricultural Systems,
108, pp. 74-83.
http://faostat.fao.org/site/452/default.aspx 'FAO Population annual time series'.
Hubbard, M. (1997) 'The 'New Institutional Economics' in Agricultural development: Insights
and Challenges', Journal of Agricultural Economics, 48(2), pp. 239-249.
Ibok, E. and Daniel, E. (2013) 'The Impact of Rural Roads and Bridges on the Socio-economic
development of Akwa Ibom State, Nigeria: an Evaluation', Global Journal of Political
Science and Administration, 1(1), pp. 27-36.
Ibukun, Y. (2010) Nigeria harnesses Pidgin English power. Available at:
https://www.theguardian.com/education/2010/nov/09/nigeria-pidgin-learning-english-
ibukun (Accessed: 08/09/16).
Idoma, K. and Isma'il, M. (2014) 'The effects of land tenure practices on agricultural output in
Agatu Local Governmnet Area of Benue State, Nigeria', Journal of Development and
Agricultural Economics, 6(5), pp. 212-219.
216
Idowu, A.O., Banwo, A. and Akerele, E.O. (2011) 'Non-farm Activities and Poverty among
Rural Farm Households in Yewa Division of Ogun State', Journal of.Social. Sciences,
26(3), pp. 217-224.
Ifijeh, M. (2016) Imported Frozen Poultry Product as a Silent Killer. Available at:
https://www.thisdaylive.com/index.php/2016/04/29/19164/ (Accessed: 2/12/2017).
Igbokwuwe, M.C., Essien, B.A. and Agunnanah, M.U. (2015) 'The Imperatives of Nigerian
Agribusiness: Issues and Challenges', Science Journal of Business and Management,
3(5-1), pp. 7-10.
Ivankova, N.V., Creswell, J.W. and Stick, S.L. (2006) 'Using Mixed-Methods Sequential
Explanatory Design:From Theory to Practice', Field methods, 18(1), pp. 2-20.
Jagwe, J., Machethe, C. and E., O. (2010) 'Transaction costs and smallholder farmers
participation in banana markets in the great lakes region of Burundi, Rwanda and
Democratic Republic of Congo.', African Journal of Agricultural and Resource
Economics AFJARE, 6(1), pp. 302-317.
Jagwe, J.N. and Machethe, C. (2011) 'Effects of Transaction Costs on Choice of Selling Point:
A Case of Smallholder Banana Growers in the Great Lakes Region Of Central Africa',
AGREKON: Agricultural Economics Research, Policy and Practice in Southern
Africa., 50(3), pp. 109-123.
Johnson, R.B. and Onwuegbuzie, A.J. (2004) 'Mixed methods research: A research paradigm
whose time has come', Educational Researcher, 33(7), pp. 14-26.
Johnson, R.B., Onwuegbuzie, A.J. and Turner, L.A. (2007) 'Towards a definition of Mixed
Methods Research', Journal of Mixed Methods Research, 1(2), pp. 112-133.
Kassa, G., Yigezu, E. and Alemayehu, D. (2017) 'Determinants of smallholder market
participation among banana growers in bench Maji Zone, Southwest Ethiopia',
International Journal of Agricultural policy and Research, 5(11), pp. 169-177.
Kassali, R., Ayanwale, A.b., Idowu, O.E. and Williams, S.B. (2012) 'Effect of rural
transportation system on agricultural productivity in Oyo State, Nigeria', Journal of
Agriculture and Rural Development in the Tropics and Subtropics, 113(1), pp. 13-19.
Kellner, S.R. (2012) Superintendent leadership and student Achievement in Suburban High
Schools: A Sequential Explanatory Mixed Methods Analysis. Loyola University,
Chicago.
Key, N., Sadoulet, E. and Janvry, A.d. (2000) 'Transaction costs and Agricultural Household
Supply Response', American Journal of Agricultural Economics, 82(1), pp. 245-259.

217
Kherallah, M. and Kirsten, F.J. (2002) 'The new Institutional Economics: Applications for
Agricultural policy research in developing countries', Agrekon, 41(2), pp. 110-133.
Khorsan, R. and Crawford, C. (2014) 'External Validity and Model Validity: A Conceptual
Approach for Systematic Review Methodology', Evidence-Based Complementary and
Alternative Medicine, 2014: 694804(doi: 10.1155/2014/694804 PMCID:PMC3963220).
Killebrew, K., Gugerty, M.K. and Plotnick, R. (2010) 'Poultry Market in West Africa: Nigeria',
EPAR Brief No. 87, pp. 1-11.
Kingori, A.M., Wachira, A.M. and Tuitoek, J.K. (2010) 'Indigenous Chicken Production in
Kenya: A review', International journal of Poultry Science, 9(4), pp. 309-316.
Kiplimo, J., C., Ngenoh, E., Koech, W. and Bett, J.K. (2015) 'Determinants of Access to Credit
Financial Services by Smallholder Farmers in Kenya', Journal of Development and
Agricultural Economics, 7(9), pp. 303-313.
Kiprono, P. and Matsumoto, T. (2014) 'Roads and Farming: The effect of Infrastructural
Improvement on agricultural input use, farm paroductivity and market participation in
Kenya', Paper presented at CSAE conference 2014: Economic Development in Africa,
The University of Oxford, Revised 28th January 2014.
Kirsten, F.J., Dorward, A.R., Poulton, C. and Vink, N. (2009) Institutional Economics
perspectives on African agricultural development: International Food Policy Research
Institute, Washington D.C.
Kolawole, O.D., Okorie, V.O., Ogidiowa, M.T. and Adeogun, M.O. (2007) 'Ethno-Veterinary
Practices Amongst Smallholder Farmers in Ekiti State, Nigeria.', African Journal of
Traditional, Complementary and Alternative Medicines: AJTCAM, 4(4), pp. 434-442.
Koyenikan, M.J. and Ikharea, V.E. (2014) 'Gender Access to and Control of Agricultural
Resources in South Zone of Edo State, Nigeria', Journal of Agricultural Economics,
Extension and Rural Development, 1(7), pp. 138-145.
Kperegbeyi, J.I., Meye, J.A. and Ogboi, E. (2009) 'Local chicken production: strategy of
household poultry development in coastal regions of Niger Delta, Nigeria.', African
Journal of General Agriculture, 5(1), pp. 17-20.
Kuehne, G. (2016) 'Eight Issues to think about before Interviewing farmers', Forum:
Qualitative Social Research, 17(2), pp. 1-21.
kuma, B., Baker, D., Getnet, K. and Kassa, B. (2014) 'Factors affecting Milk Market
Participation and Volume of Supply in Ethiopia', Asian Journal of Rural Development,
4(1-15).
218
Lambrechts, K. and Montgomery, S. (2013) 'Smallholder commercialisation in Africa: A
framework for an enabling environment', GREAT Insights, 3(1), pp.
http://ecdpm.org/great-insights/family-farming-and-food-security/smallholder-
commercialisation-africa-framework/ Accessed 4/5/17.
Landes, M., Persaud, S. and Dyck, J. (2004) India's Poultry Sector: Development and
Prospects (WRS-04-03). Washington, DC: Market and Trade Economics Division,
Economic Research Service, U.S. Department of Agriculture and Trade.
Lapar, M.L., Holloway, G. and Ehui, G. (2003) 'Policy options promoting market participation
among smallholder livestock producers: a case study from the phillipines', Food Policy,
28, pp. 187-211.
Lavrakas, P.J. (2008) 'Face to Face Interviewing', in Encyclopeadia of Survey Research
Methods. Thousand Oaks, California.: SAGE.
Lefebo, N., Haji, J., Geta, E. and Zemmedu, L. (2016a) 'Determinants of Status and Extent of
Market participation among Bulla Producers in Hadiya Zone, Southern Ethiopia',
Journal of Biology, Agriculture and Healthcare, 6(7), pp. 84-92.
Lefebo, N., Haji, J., Getu, E. and Zemmedu, L. (2016b) 'Determinants of market participation
among kocho producers in Hadiya zone, Southern Region, Ethiopia', Journal of
Marketing and Consumer Research, 21, pp. 41-49.
Lewis, A.W. (1984) 'The state of development theory', American Economic Review, 74(1), pp.
1-10.
Lieberman, E.S. (2005) 'Nested Analysis as a Mixed-Method Strategy for Comparative
Research', The American Political Science Review, 99(3), pp. 435-452.
Lijia, W. and Xuexi, H. (2014) 'Grower's Selling Behaviour: Transaction costs comparison
analysis', Agricultural Economics Review, 15(2), pp. 5-28.
Lv, Z., Liu, Q. and Wang, P. (2012) 'Literature Review on transaction Costs Measuremnet
Advances', Asian Social Science, 8(12), pp. 127-132.
Lwesya, F. and Kibambila, V. (2017) 'The role of ICT in facilitating farmer's accessibility to
extension services and marketing of agricultural produce: The case of Maize in Mbozi
District, Tanzania', International Journal of Agricultural Marketing, 4(2), pp. 142-151.
Mailu, S.K., Wachira, M.A., Munyasi, J.W., Nzioka, M., Kibiru, S.K., Mwangi, D.M.,
Kaguthi, P. and Kithome, J. (2012) 'Influence of prices on market participation
decisions of indigenous poultry farmers in four districts of Eastern Province, Kenya.',
Journal of Agriculture and Social Research (JASR), 12(1), pp. 1-10.

219
Maina, C.M., Lagat, J.K. and Mutai, B.K. (2015) 'Effect of transaction costs on choice of
mango marketing channel: the case of small scale farmers in Makueni County, Kenya',
IOSR Journal of Agriculture and Veterinary Science (IOSR-JAVS), 8(4), pp. 54-62.
Makhura, M.T. (2001) Overcoming Transaction costs barriers to market participation of
smallholder farmers in the Northern province of South Africa. University of Pretoria.
Maliki, A.E. (2011) 'Socio-economic status and preferences in marriage partner selection
among univsersity undergraduates in South-South of Nigeria', Edo Journal of
Counselling, 4(1&2), pp. 39-49.
Malterud, K. (2001) 'Qualitative research: standards, challenges, and guidelines', The Lancet,
358, pp. 483-488.
Mango, N., Zamasiya, B., Makate, C., Nyikahadzoi, K. and Siziba, S. (2014) 'Factors
influencing household food security among smallholder farmers in the Mudzi district of
Zimbabwe', Development Southern Africa, 31(4), pp. 625-640.
Mann, C.J. (2012) 'Observational research methods—Cohort studies, cross sectional studies,
and case–control studies ', African Journal of Emergency Medicine, 2(1), pp. 38-46.
Mapiye, C., Mwale, M., Mupangwa, J.F., Chimonyo, M., Foti, R. and Mutenje, M.J. (2008) 'A
research review of village chicken production constranits and opportunities in
Zimbabwe', Asian-Aust. J. Anim. Sci, 21(11), pp. 1680-1688.
Martey, E. (2014) 'Market Information and Extent of Africultural Commercialization:
Empirical Evidence from Smallholder farmers in Effutu Municipality of Ghana',
American Journal of Experimental Agriculture, 4(12), pp. 1680-1696.
Masuki, K.F., Kamugisha, R., Mowo, J.G., Tanui, J., Tukahirwa, J., Mogoi, J. and Adera, E.O.
(2010) Paper presented to Workshop at Makerere Universitym Uganda, 22-23 March.
Uganda. International Federation of Information Processing (IFIP) Technical
Commission.
Matthews, R.C.O. (1986) 'The Economics of Institutions and the sources of Growth', Economic
Journal, 96, pp. 903-910.
McAteer, M. (2013) Action Research in Education. Thousand Oaks, California: SAGE.
McKeganey, N. (2001) 'To pay or not to pay: Respondents' motivation for participating in
research', Addition, 96, pp. 1237-1238.
Megyesi, B., Kelemen, E. and Schermer, M. (2010) 'Social capital as a success factor for
Collective Farmers Marketing Initiatives', International Journal of Sociology of
Agriculture and Food, 18(1), pp. 89-103.

220
Mokomane, Z. (2012) Role of Families in Social and Economic Empowermwnt of Individuals.
New York: United Nations.
Morgan, D.L. (1998) 'Practical Strategies for Combining Qualitative and Quantitative methods:
Applications to Health Research', Qual Health Res, 8(3), pp. 362-376.
Morrow, S.L. (2005) 'Quality and Trustworthiness in Qualitative Research in Counseling
Psychology', Journal of Counseling Psychology, 52(2), pp. 250-260.
Motsoari, C., Cloete, P.C. and Schalkwyk, H.D.V. (2015) 'An analysis of factors affecting
access to credit in lesotho's smallholder agricultural sector', Development Southern
Africa, 32(5), pp. 592-602.
Mutayoba, V. and Ngaruko, D. (2015) 'Market performance and farmers' choice of marketing
channels of high value crops in Tanzania', International Journal of Economics,
Commerce and Management, III(8), pp. 276-289.
Muthini, D.N., Nyikal, R.A. and Otieno, D.J. (2017) 'Determinants of small-scale mango
farmers' market channel choices in Kenya: An application of the two-step Cragg's
estimation procedure', Journal of Development and Agricultural Economics, 9(5), pp.
111-120.
Nabli, M.K. and Nugent, J.B. (1989) 'The New Institutional Economics and its Applicability to
Development', World Development, 17(9), pp. 1333-1347.
Nardi, P., M. (2016) Doing Survey Research: A guide to Quantitative Methods. 3rd Edition
edn. Abingdon, Oxon UK: Routledge.
NASS (2010/2011) 'Nbs/fmard collaborative survey on national agricultural sample survey
draft report'.
National population commision Nigeria (NPC) and International, I. (2014) 'Nigeria
Demographic and Health Survey 2013', Abuja, Nigeria, and Rockville, Maryland, USA:
NPC and ICF International.
Nelson Mandela (2008) 'CNN.com: Mandela at 90: Mandela in his words', 26/5/16. Available
at: http://edition.cnn.com/2008/WORLD/africa/06/24/mandela.quotes/ (Accessed:
08/09/16).
Nigeria -National population commision (2017) Nigeria's current estimated population.
Available at: http://population.gov.ng/[gmap-embed%20id= (Accessed: 1/12/2017).
Nigeria census (2006) 'National population commission'.
Nigeria High Commission London, U. (2017) Nigeria High Commission UK. Available at:
http://www.nigeriahc.org.uk/about-nigeria (Accessed: 7/9/2017).

221
Nolan, C. and Trew, A. (2011) 'Transaction Costs and Institutions',
https://www.gla.ac.uk/media/media_199482_en.pdf, pp. 1-45.
North, D. (1990) Institutions, Institutional Change and Economic Performance. Cambridge
University Press.
North, D.C. (1992a) Transaction costs, institutions and economic performance. San Francisco,
CA: ICS Press.
North, D.C. (1992b) Transaction costs, Institutionsn abd Economic Performance. Occasional
Papers, Number 30.
Nwauzor, A.A. (2014) 'Changing Values in Contemporary Nigeria', Educational Research
International, 3(1).
Obinna, C. (2016) Why imported frozen poultry products is a silent killer - Experts. Available
at: https://www.vanguardngr.com/2016/05/imported-frozen-poultry-products-silent-
killer-experts/ (Accessed: 02/12/2017).
Ochieng, J., George, O. and Bockline, O.B. (2013) 'Management practices and challenges in
smallholder indigenous chicken production in Western Kenya', Journal of Agriculture
and Rural Development in the Tropics and Subtropics, 114(1), pp. 51-58.
Ogunlela, Y.I. and Mukhtar, A.A. (2009) 'Gender Issues in Agriculture and Rural Development
in Nigeria: The Role of Women', Humanity & Social Sciences Journal, 4(1), pp. 19-30.
Oguoma, O.N., Nkwocha, V.I. and Ibeawuchi, I.I. (2010) 'Implications of middlemen in the
supply chain of agricultural products', Journal of Agticulture and Social Research,
10(2), pp. 77-83.
Oguonu, C. and Ezeibe, C. (2014) 'Access to Formal and Informal Credits by Smallholder
Farmers in Nigeria', The Social Sciences, 9(6), pp. 476-481.
Ohen, S.B., Etuk, E.A. and Onoja, J.A. (2013) 'Analysis of Market Participation by Rice
Farmers in Southern Nigeria', Journal of Economics and Sustainable Development,
4(7), pp. 6-11.
Ohen, S.B., Umeze, G.E. and Cobham, M.E. (2014) 'Determinants of Market participation by
Cucumber Farmers in Odukpani Local Governement Area, Cross River State, Nigeria',
Journal of Economics and Sustainable Development, 5(2), pp. 188-196.
Ojo, S.O. (2003) 'Productivity and Technical Efficiency of poultry egg production in Nigeria.',
International journal of Poultry Science, 2(6), pp. 459-464.
Okogie, L.O., Obasani, T.A. and Afolabi, W.A.O. (2016) 'Food Security Assessment and
Consumption Pattern in Rural Households in Ogun State, Nigeria', Applied Studies in
Agribusiness and Commerce, 10(4-5), pp. 15-20.

222
Oladokun, N.O., Larbani, M. and Mohammed, M.O. (2015) 'The problems facing the
agricultural sector in Nigeria and the prospect of Muzara'ah and supply chain model',
Humanomics, 31(1), pp. 18-36.
Olaoye, O.E. (2012) 'Agric Transformation: Tackling Nigeria's food Import Dependency',
Zenith Economic Quarterly, 8(3), pp. 41-47.
Olasunkanmi, A. (2015) 'A PHILOSOPHICAL APPRAISAL OF BASIC CULTURAL
VALUES IN AFRICAN TRADITION', International Journal of Politics and Good
Governance, VI(6.2), pp. 1-12.
Olatunji, M.O. (2001) 'The use of Pidgin English in contemporary Nigerian Music: A new
approach towards national identity', Humanities Review Journal, 1(1), pp. 41-46.
Olayemi, o.A. (2012) 'Effects of Family size on Household Food Security in Osun State', Asian
Journal of Agriculture and Rural Development, 2(2), pp. 136-141.
Olukunle, T.O. (2013) 'Challenges and Prospects of Agriculture in Nigeria: The Way Forward',
Journal of Economics and Sustainable Development, 4(16), pp. 37-45.
Olwande, J., Smale, M., Mathenge, M., K, Place, f. and Mithofer, D. (2015) 'Agricultural
Marketing by smallholders in Kenya: A comparison of maize, kale and dairy', Food
Policy, 52, pp. 22-32.
Omiti, J.M., Otieno, D.J., Nyanamba, T.O. and McCullough, E. (2009) 'Factors influencing the
intensity of market participation by smallholder farmers: A case study of rural and peri-
urban areas of Kenya', AFJARE, 3(1), pp. 57-82.
Onoja, A.O., Usoroh, B.B., Adieme, D.T. and Deedam, N.J. (2012) 'Determinants of Market
Participation in Nigerian Small-Scale Fishery Sector: Evidence from Niger Delta
Region', Consilience: The journal of Sustainable Development, 9(1), pp. 69-84.
Onwuegbuzie, A.J. and Johnson, R.B. (2006) 'The Validity issue in mixed research', Research
in the Schools, 13(1), pp. 48-63.
Orji, E.O., Ojofeitimi, E.O. and Olanrewaju, B.A. (2009) 'The role of men in family planning
decision-making in rural and urban Nigeria', The European Journal of Contraception &
Reproductive Health Care, 12(1), pp. 70-75.
Osebeyo, S.O. and Aye, G.C. (2014) 'Transaction costs and marketing decision:a case study of
Smallholder tomato farmers in Makurdi, Nigeria', Urban, Planning and Transport
Research, 2(1), pp. 333-340.
Oulton, R. (2010) Kocho. Available at: http://www.cooksinfo.com/kocho (Accessed:
03/12/2017).

223
Ouma, E., Jagwe, J., Obare, G.A. and Abele, S. (2010) 'Determinants of Smallholder farmers'
participation in banana markets in Central Africa: the role of transaction costs',
Agricultural Economics, 41, pp. 111-122.
Oyejide, A.T. (1986) 'The effects of trade and exchange rate policies on Agriculture in
Nigeria.', International Foof policy Reseach Institute Reaseach Report 55.
Oyekale, A.S. (2007) 'Determinants of Agricultural land expansion in Nigeria: An application
of error correction modelling (ECM)', Journal of Central European Agriculture, 8(3),
pp. 301-310.
Ozor, N., Acheampong, E., Nnadi, A., Okwor, E., Awuni, J.A. and Aning, G. (2015) A market
scoping study of Newcastle Diesease in Village poultry in Nigeria and Ghana. Nairobi,
Kenya: Global Alliance for Livestock Veterinary Medicines (GALVmed) Studies,
A.T.P.
Pagani, P., Yerima Abimiku, J.E. and Emeka-Okolie, W. (2008) 'Assessment of the Nigerian
poultry market chain to improve biosecurity.', FAO- Consultative Mission, pp. 1-60.
Parkinson, S., Eatough, V., Holmes, J., Stapley, E. and Midgley, N. (2016) 'Framework
analysis: a worked example of a study exploring young people’s experiences of
depression', Qualitative Research in Psychology, 13(2), pp. 109-129.
Patton, M.Q. (2005) 'Qualitative Research', Encyclopedia of Statistics in Behavioural Science.
Paulus, T.M., Lester, J.N. and Dempster, P.G. (2013) Digital Tools for Qualitative Research.
London, UK: SAGE Publications.
Pingali, P., Khwaja, Y. and Meijer, M. (2005) 'Commercializing small farms: Reducing
transaction costs', ESA working paper No. 05-08, pp. 1-40.
Poole, N. and Frece, A.d. (2010) 'A review of Existing Organisational forms of Smallholder
Farmers' Associstions and their Contractual Relationships with other Market
Participants in the East and Southern African ACP Region', FAO-AAACP paper Series
11, pp. 1-106.
Pope, C., Ziebland, S. and Mays, N. (2000) 'Qualitative research in health care: analysing
qualitative data', British Medical Journal, 320(7227), pp. 114-116.
Poulton, C., Dorward, A. and J.Kydd (2005) 'The future of small farms: New Directions for
Services, Institutions and Intermediation', paper presented at the future of small farms
workshop 26-29 June. Imperial College, Wye, UK.
Poulton, C. and Lyne, M. (2009) "Coordination for market development". Washington, DC:
International Food Policy Research Institute.

224
Poultry Association of Nigeria (2017) Poultry Association of Nigeria. Available at:
http://www.poultryassociationng.com/index.php/about-pan/history-of-the-association
(Accessed: 2/7/2017).
Pritchett, C.I.T. (2012) School Culture: A sequential Mixed Methods Exploratory Meta-
Analysis. Rowan University.
Qiang, C.Z., Kuek, S.C., Dymond, A. and Esselaar, S. (2011) Mobile Applications for
Agriculture and Rural Development. Washington DC: ICT Sector Unit - World Bank.
Rea, L.M. and Parker, R.A. (2014) Designing and conducting survey research: A
comprehensive guide. 4th Edition edn. San Francisco, CA: Jossey-Bass - A wiley
Brand.
Remenyi, D., Onofrei, G. and English, J. (2013) An Introduction to Statistics using Microsoft
Excel. 4th Edition edn. Reading, UK: Academic Publishing Ltd.
Ritchie, J. and Spencer, L. (1994) 'Qualitative data analysis for applied policy research', in
Bryman, A. and Burgess, R.G. (eds.) Analyzing qualitative data. London: Routledge,
pp. 173-194.
Ritchie, J., Spencer, L. and O'Connor, W. (2003) 'Carrying out qualitative analysis', in Ritchie,
J. and Lewis, J. (eds.) Qualitative research practice: A guide for social science students
and researchers. London: Sage Publications, pp. 219-262.
Riverson, J.D.N. and Carapetis, S. (1991) Intermediate Means of Transport In Sub-Saharan
Africa: Its Potential for Improving Rural Travel and Transport (Number 161).
Washington, DC: The World Bank.
Royer, A. (2011) 'Transaction costs in milk marketing: a comparison between Canada and
Great Britain', Agricultural Economics, 42, pp. 171-182.
Rutten, R., Bakker, L., Alano, M.L., Salermo, T., Savitri, L.A. and Shohibuddin, M. (2017)
'Smallholder bargaining power in large-scale land deals: a relational perspective', The
Journal of peasant Studies, 44(4), pp. 891-917.
Salviano, P.A.P. and Wander, A.E. (2015) 'Transaction Costs in Vertical Integration Contracts
for Poultry Production from Farmers' Perspective in Rio Varde (Goias, Brazil)', 29th
International Asssociation of Agricultural Economists (IAAE) Triennial Conference,
August 8-14, 2015. Milan, Italy.
Sandika, A.L. (2011) 'Impact of Middlemen on vegetable marketing channels in Sri Lanka',
Tropical Agricultural Research & Extension, 14(3), pp. 58-62.
Sculze, B., Spiller, A. and Theuvsen, L. (2006) 'More Trust instead of More Vertical
Integration in the German Pork Production? Empirical Evidence and Theoretical
225
Considerations ', Paper prepared for presentation at the 99th EAAE Seminar 'Trust and
Risk in Business Networks, Bonn, Germany, Febraury 8-10, 2006. Germany. pp. 373-
381.
Sebatta, C., Mugisha, J., Katungi, E., Kashaaru, A. and Kyomugisha, H. (2014) 'Smallholder
farmers' decision and level of participation in the potato market in Uganda', Modern
Economy, 5, pp. 895-906.
Selowa, L., Lefophane, M.H. and Belete, A. (2015) 'Market participation in formal Agricultural
output markets: A case Study of Small-scale Tomato Producers in Limpopo Province,
South Africa', Jounal of Human Ecology, 50(2), pp. 161-167.
Shenton, A.K. (2004) 'Strategies for ensuring trustworthiness in qualitative research projects',
Education for Information, 22, pp. 63-75.
Shiferaw, B. and Muricho, G. (2009) Towards priority Actions for Market Development for
African Farmers: proceedings of an International Conference. Nairobi, Kenya. ILRI.
Shiimi, T., Taljaard, P.R. and Jordaan, H. (2012) 'Transaction costs and Cattle Farmer's choice
of Marketing Channel in North-Central Namibia', Agrekon, 51(1), pp. 42-58.
Simunovic, N., Sprague, S. and Bhandari, M. (2009) 'Methodological Issues in Systematic
Reviews and Meta-Analyses of Observational Studies in Orthopaedic Research',
Journal of Bone and Joint Surgery, 91(3), pp. 87-94.
Sinkovics, R.R., Penz, E. and Ghauri, P.N. (2008) 'Enhancing the Trustworthiness of
Qualitative Research in International Business', Management International Review,
48(6), pp. 689-714.
Slomka, J., McCurdy, S., Ratiff, E.A., Timpson, S. and Williams, M.L. (2007) 'Perceptions of
Financial Payment for Research Participation among African-American Drug Users in
HIV Studies', J Gen Intern Med, 22(10), pp. 1403-1409.
Smith, J. and Firth, J. (2011) 'Qualitative data analysis: the framework approach',
NurseResearcher, 18(2), pp. 52- 62.
Smith, N.J. and Bhattacharya, K. (2014) 'Practical Wisdom of Tool and Task: Meeting the
Demands of the Mthods and Digital Tools in Qualitatively Driven Mixed Methods
Studies', in Hai-Jew, S. (ed.) Enhancing Qualitative and Mixed Methods Research with
Technology. Hershey PA, USA: Information Science Reference, pp. 210-230.
Sonaiya, E.B. and Swan, S.E.J. (2004) 'Small-Scale Poultry Production', FAO Animal
Production and Health, pp. 1-57.

226
Southworld (2014) 'The rural market in Africa - A meeting point', SouthWorld - News & views
from emerging countries, 20/6/2017 http://www.southworld.net/the-rural-market-in-
africa-a-meeting-point/.
Spencer, L., Ritchie, J. and O'Connor, W. (2003) 'Analysis: Practices, principles and processes',
in Ritchie, J. and Lewis, J. (eds.) Qualitative research practice: A guide for social
science students and researchers. London: Sage Publications, pp. 199-218.
Sriboonchitta, S. and Wiboonpoongse, A. (2008) Overview of Contract Farming in Thailand:
Lessons Learned. Tokyo, Japan: Asian Development Bank.
Srivastava, A. and Thomson, S.B. (2009) 'Framework Analysis: A Qualitative Methodology for
Applied Policy Research', JOAAG, 4(2), pp. 72-79.
Ssemakula, E. and Mutimba, J.K. (2011) 'Effectiveness of the farmer-to-farmer extension
model in increasing technology uptake in Masaka and Tororo Districts of Uganda',
South African Journal of Agricultural Extension, 39(2), pp. 30-46.
Stevenson, R. (2012) 'Incentives: Maximising research participation by giving people stuff',
Ruthless Research. Available at:
https://ruthlessresearch.wordpress.com/2012/03/28/incentives-maximising-research-
participation-by-giving-people-stuff/.
Stewart, F.A. (2011) Scotland's Rubbish: Domestic Recycling, Policy and Practice in Everyday
life. University of Edinburgh.
Stoop, W.A. and Hart, T. (2005) 'Research and Development Towards Sustainable Agriculture
by Resource-Poor Farmers in Sub-Saharan Africa: Some Strategic and Organisational
Considerations in Linking Farmer Practical Needs with Policies and Scientific
Theories', Internaltional Journal of Agricultural Sustainability, 3(3), pp. 206-216.
Su, W., Eriksson, T., Zhang, L. and Bai, Y. (2016) 'Off-farm employment and time allocation
in on-farm work in rural China from gender perspective', China Economic Review, 41,
pp. 34-45.
Subedi, D. (2016) 'Explanatory Sequential Mixed Method Design as the Third Research
Community of Knowledge Claim', American Journal of Educational Research, 4(7),
pp. 570-577.
Takane, T. (2008) 'Labor use in smallholder agriculture in Malawi: Six village case studies',
African Study Monographs, 29(4), pp. 183-200.
Tarekegan, K. and Yosefe, K. (2017) 'Determinants of poultry Market participation Decisions:
The Case of Producers in Kaffa and Bench Majji Zones, Southern Ethiopia', Journal of
Economics and Sustainable Development, 8(3), pp. 23-29.

227
Tashakkori A and Teddlie, C. (2003) Handbook of Mixed Methods in Social and Behavioural
Research. Thousand Oaks CA: Sage.
Tashakkori, A. and Teddlie, C. (2010) Handbook of Mixed Methods in Social & Behavioural
Research. Thousand Oaks, California: SAGE.
Tasie, G.I.K. (2014) 'Promoting Cultural Tourism Industry in Africa: The Place of African
Indigenous Religion', African Research Review, 8(4), pp. 96-110.
Teddlie, C. and Yu, F. (2007) 'Mixed Methods Sampling: A Typology with Examples', Journal
of Mixed Methods Research, 1(1), pp. 77-100.
Tempest, D. (2013) Elsevier's Director of Access relations writes about his work with the
African Academy of Science in Kenya. Available at: www.Elsevier.com/connect/open-
access-in-africa-changes-and-challenges (Accessed: 4/5/2017).
Terwee, C.B., Mokkink, L.B., Knol, D.L., Raymond, W.J., Ostelo, G., Bouter, L.M. and
Henrica, C.W.d.V. (2012) 'Rating the methodogical quality in systematic reviews of
studies on measurement properties: a scoring system for the COSMIN checklist',
Quality of Life Research, 21(4), pp. 651-657.
The Poultry Site (2013) 'Global Poultry Trends 2013: Continued Upward Trend in Chicken
Consumption in Africa and Oceania', Global Poultry Trends,
http://www.thepoultrysite.com/articles/2973/global-poultry-trends-2013-continued-
upward-trend-in-chicken-consumption-in-africa-and-oceania/ -18/8/2017.
Totman, J., Pistrang, N., Smith, S., Hennessey, S. and Martin, J. (2015) 'You only have one
chance to get it right’: A qualitative study of relatives’ experiences of caring at home
for a family member with terminal cancer', Palliative Medicine, 29(6), pp. 496-507.
Tranfield, D., Denyer, D. and Smart, P. (2003) 'Towards a methodology for Developing
Evidence-Informed Mangement Knowledge by means of Systematic Review', British
Journal of Management, 14, pp. 207-222.
Turner, D.W. (2010) 'Qualitative Interview Design: A practical Guide for Novice
Investigators', The Qualitative Report, 15(3), pp. 754-760.
Ugbebor, O. (2017) 'Last mile delivery of poultry vaccines in Nigeria: A two-pronged
approach to poverty reduction', Beam Exchange.
UNIDO (2008) Creating an enabling environment for private sector development in sub-
saharan Africa. Vienna: UNIDO GTZ, U.
Usman, A.B. (2014) 'Analysis of condition of rural road transport in Kwara State, Nigeria',
European Scientific Journal, 10(5), pp. 288-307.
Walters, B. (2005) Gender and Economics: An Overview.

228
Wamalwa, C. (2015) 'This world hunger day, focus on smallholder farmers', One acre fund.
Available at: https://www.oneacrefund.org/blogs/information/post/this-world-hunger-
day-focus-on-smallholder-farmers/1025.
Ward, D.J., Furber, C., Tierney, S. and Swallow, V. (2013) 'Using Framework Analysis in
nursing research: a worked example', Journal of Advanced Nursing, 69(11), pp. 2423-
2431.
Wiggins, S. and Compton, J. (2016) Factors leading to Agricultural Production Aggregation
and Faciliation of the Linkage of Farmers to Remunerative Markets. London, United
Kingdom: Overseas development Institute Evidence on Demand- Climate, E.,
Infrastructure and Livelihoods.
Wiggins, S. and Keats, S. (2013) 'Leaping & Learning: Linking smallholders to Markets', ODI-
Agriculture for Impact, pp. 1-120: https://www.odi.org/sites/odi.org.uk/files/odi-
assets/publications-opinion-files/8401.pdf.
Williams, R. (2015) Heteroskedasticity. Available at:
https://www3.nd.edu/~rwilliam/stats2/l25.pdf (Accessed: 18/8/2016).
Williamson, O.E. (1979) 'The transaction costs Economics: The Governance of Contractual
Relations', Journal of Law and Economics, 22, pp. 233-261.
Wodjao, T.B. (2008) A double-hurdle model of computer and internet use in american
households. Western Michigan University.
Woldie, G.A. and Nuppenau, E.A. (2011) 'A contribution to Transaction Costs: Evidence from
Banana markets in Ethiopia', Agribusiness, 27(4), pp. 493-508.
World Bank (2017) Doing Business. Available at:
http://www.doingbusiness.org/data/exploreeconomies/nigeria (Accessed: 16/10/2017).
Yami, M., Tesfaye, T. and Bekele, A. (2013) 'Determinants of Farmers’ Participation Decision
on Local Seed Multiplication in Amhara Region,Ethiopia: A Double Hurdle Approach',
International Journal of Science and Research (IJSR), 2(1), pp. 423-430.
Yusuf, S.A. and Malomo, O. (2007) 'Technical efficiency of poultry egg Production in Ogun
State: A data envelope analysis (DEA) approach', International Journal of Poultry
Science, 6(9), pp. 622-629.
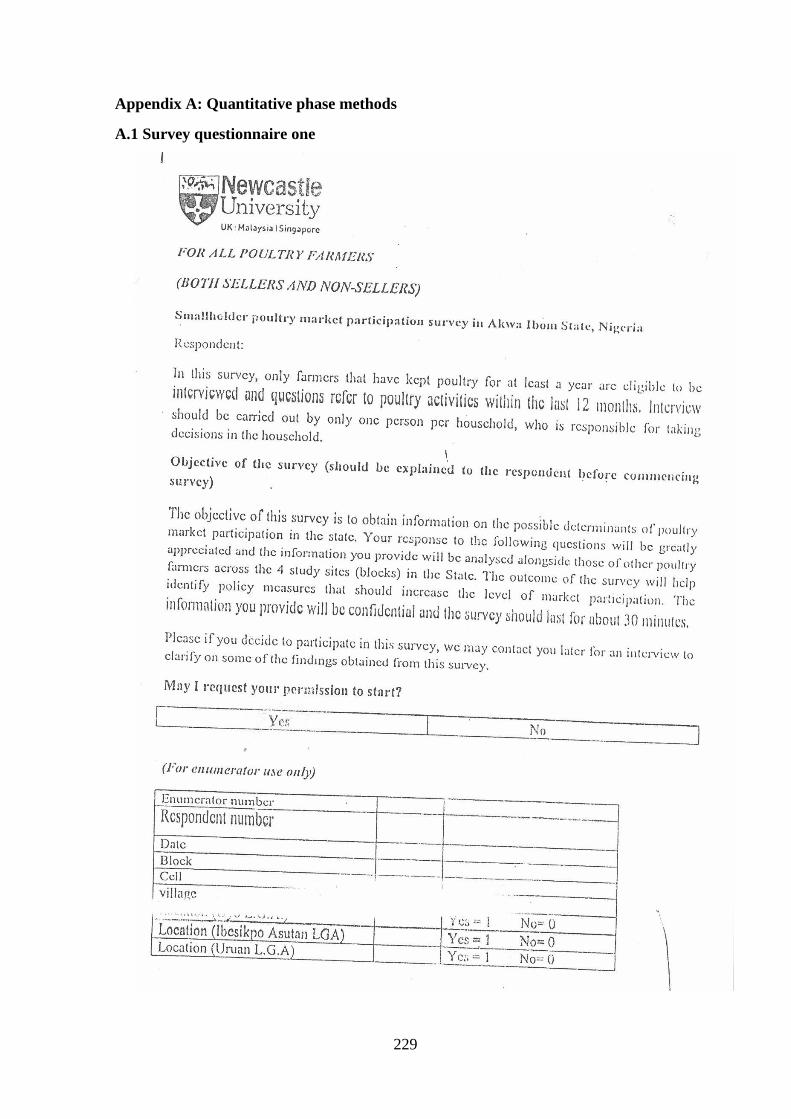
229
Appendix A: Quantitative phase methods
A.1 Survey questionnaire one

230

231
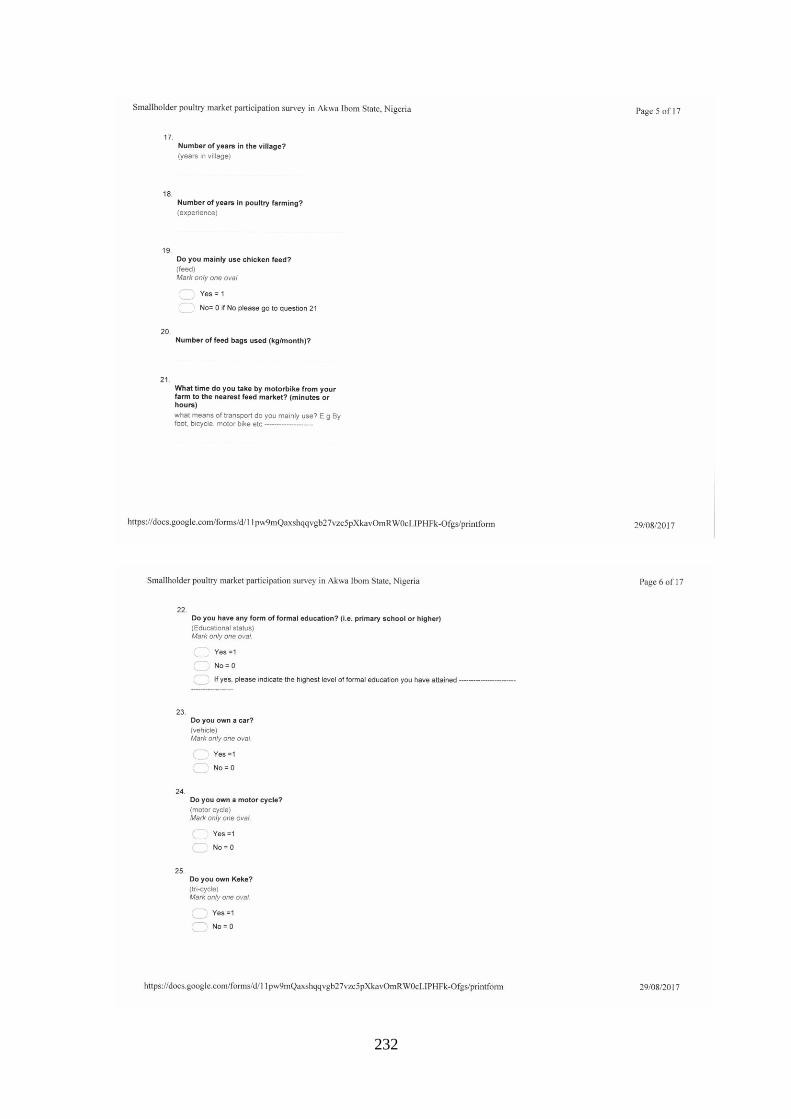
232

233
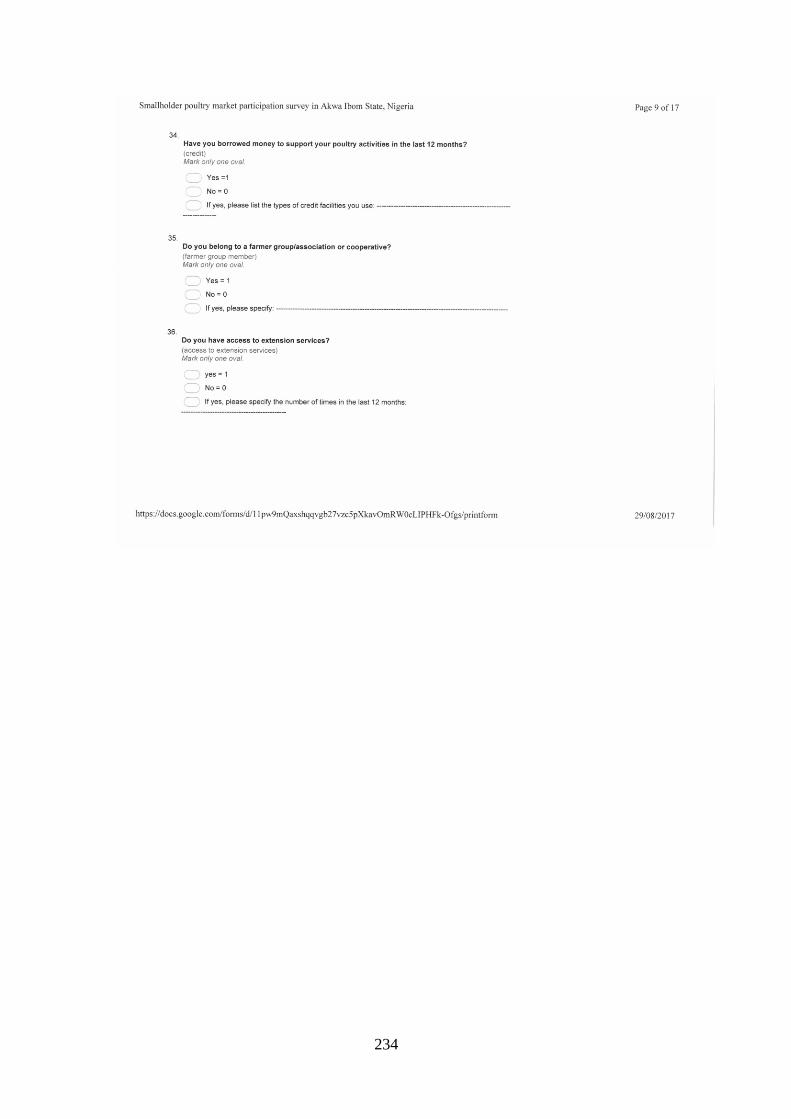
234

235

236
237

238
239
A.2 Survey questionnaire two

240

241

242

243

244
A. 3 Probit results

245
A.4 Marginal effects of probit results

246
A.5 Truncated normal regression results

247
A.6 Marginal effects of truncated normal regression

248
A.7 Tobit model results

249
A.8 Marginal effect of Tobit model results

250
A.9 Pair-wise spearman’s rho correlation coefficient for predictor variables
Notes: α level: *P<0.05

251
Appendix B: Qualitative phase
B.1 Introduction for a qualitative Follow-up Interview
Determinants of Poultry Market Participation - follow-up interview
Good Day and welcome. Thank you for agreeing to participate in this follow-up Interview.
During the quantitative (questionnaire phase), some issues were identified that I would
like you to help me clarify. Your views are important to me because you represent one of
the poultry farmers that participated in the questionnaire phase.
There is no right or wrong answers to understanding farmers decision to participate in
poultry markets; however, different factors influence the decision and level of Poultry
market participation so feel free to share your experiences with me even if it is different
from what other farmers may experience.
Firstly, I will like to use an Alpha-numeric pseudonym to identify you throughout this
interview. Please feel free to ask me to repeat and/or clarify a question that you do not
seem to understand.
To avoid missing your comments, I request that you allow me to tape record the interview.
Be assured that your comments will be confidential and only Pseudonyms will be included
in the final report. The interview will last about one hour without a formal break. I am here
to listen, ask questions, and take some notes during the interview. Before we begin, I
would like us to go over the informed consent form, which will give you more information
about this study. (I will give the participant a copy of the informed consent form and asked
her/him to read and tick yes or no.
A copy of the signed form is given to the participant if he/she requests for one).
Do you have any questions before we begin? (Questions are addressed and; tape recorder
is turned on and checked to make sure it is functioning).
Thank you.
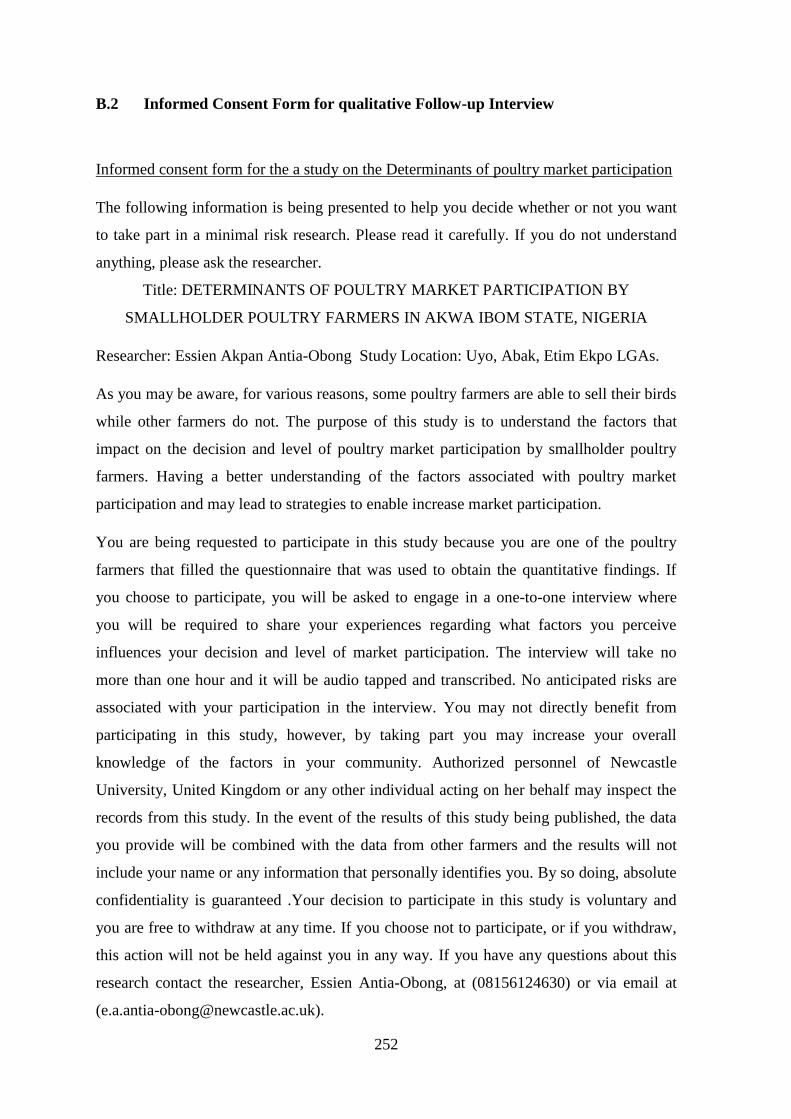
252
B.2 Informed Consent Form for qualitative Follow-up Interview
Informed consent form for the a study on the Determinants of poultry market participation
The following information is being presented to help you decide whether or not you want
to take part in a minimal risk research. Please read it carefully. If you do not understand
anything, please ask the researcher.
Title: DETERMINANTS OF POULTRY MARKET PARTICIPATION BY
SMALLHOLDER POULTRY FARMERS IN AKWA IBOM STATE, NIGERIA
Researcher: Essien Akpan Antia-Obong Study Location: Uyo, Abak, Etim Ekpo LGAs.
As you may be aware, for various reasons, some poultry farmers are able to sell their birds
while other farmers do not. The purpose of this study is to understand the factors that
impact on the decision and level of poultry market participation by smallholder poultry
farmers. Having a better understanding of the factors associated with poultry market
participation and may lead to strategies to enable increase market participation.
You are being requested to participate in this study because you are one of the poultry
farmers that filled the questionnaire that was used to obtain the quantitative findings. If
you choose to participate, you will be asked to engage in a one-to-one interview where
you will be required to share your experiences regarding what factors you perceive
influences your decision and level of market participation. The interview will take no
more than one hour and it will be audio tapped and transcribed. No anticipated risks are
associated with your participation in the interview. You may not directly benefit from
participating in this study, however, by taking part you may increase your overall
knowledge of the factors in your community. Authorized personnel of Newcastle
University, United Kingdom or any other individual acting on her behalf may inspect the
records from this study. In the event of the results of this study being published, the data
you provide will be combined with the data from other farmers and the results will not
include your name or any information that personally identifies you. By so doing, absolute
confidentiality is guaranteed .Your decision to participate in this study is voluntary and
you are free to withdraw at any time. If you choose not to participate, or if you withdraw,
this action will not be held against you in any way. If you have any questions about this
research contact the researcher, Essien Antia-Obong, at (08156124630) or via email at

253
Thank you.
I have carefully explained to the participant the nature of the above research study. I
hereby certify
That to the best of my knowledge the participant consenting understands the nature,
Demands, risks, and benefits involved in participating in this study.
______________ ____________________ _____________
Signature and name of Researcher Date
I understand that by circling (yes – No) I am being asked to participate in a research study
described in this form. I understand the risks and benefits, and I freely give my consent to
take part in this study under the conditions indicated in it. I have received a copy of this
consent form to take with me.
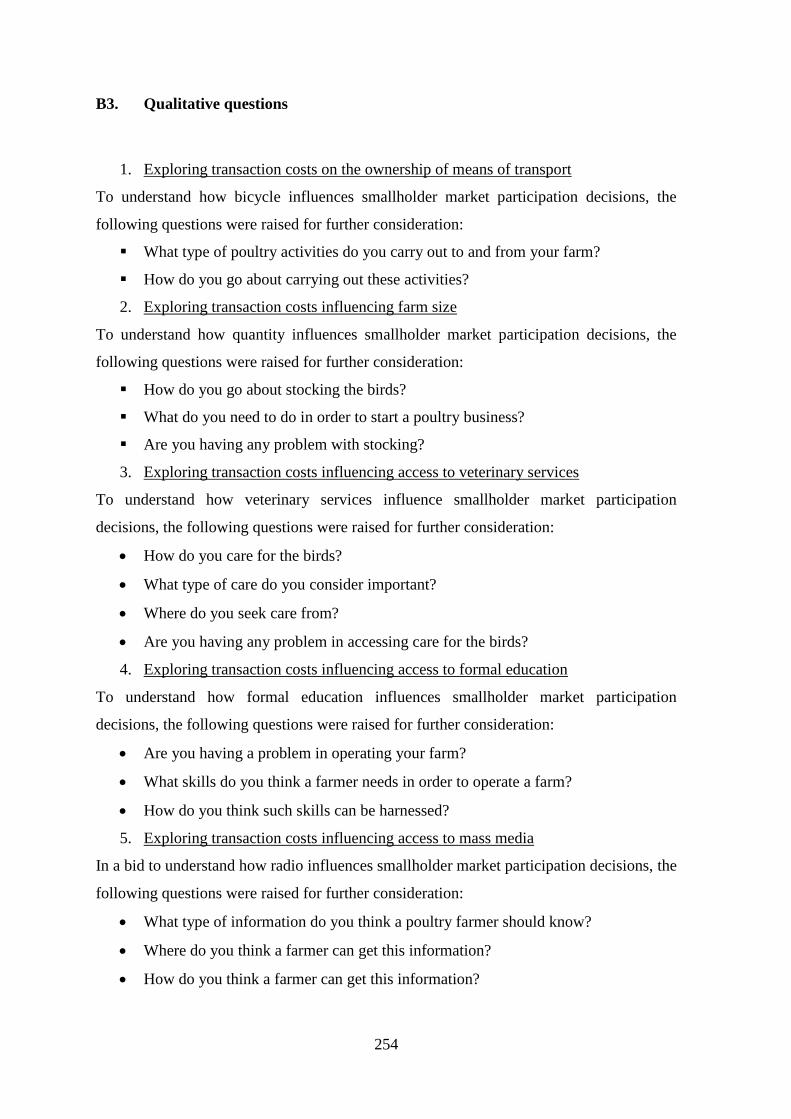
254
B3. Qualitative questions
1. Exploring transaction costs on the ownership of means of transport
To understand how bicycle influences smallholder market participation decisions, the
following questions were raised for further consideration:
What type of poultry activities do you carry out to and from your farm?
How do you go about carrying out these activities?
2. Exploring transaction costs influencing farm size
To understand how quantity influences smallholder market participation decisions, the
following questions were raised for further consideration:
How do you go about stocking the birds?
What do you need to do in order to start a poultry business?
Are you having any problem with stocking?
3. Exploring transaction costs influencing access to veterinary services
To understand how veterinary services influence smallholder market participation
decisions, the following questions were raised for further consideration:
How do you care for the birds?
What type of care do you consider important?
Where do you seek care from?
Are you having any problem in accessing care for the birds?
4. Exploring transaction costs influencing access to formal education
To understand how formal education influences smallholder market participation
decisions, the following questions were raised for further consideration:
Are you having a problem in operating your farm?
What skills do you think a farmer needs in order to operate a farm?
How do you think such skills can be harnessed?
5. Exploring transaction costs influencing access to mass media
In a bid to understand how radio influences smallholder market participation decisions, the
following questions were raised for further consideration:
What type of information do you think a poultry farmer should know?
Where do you think a farmer can get this information?
How do you think a farmer can get this information?
255
6. Exploring transaction costs on accessing farm income other than from poultry
To understand how farm income other than from poultry influences smallholder market
participation decisions, the following questions were raised for further consideration:
What are the financial obligations you carry out in your farm?
What do you need to do in order to meet these obligations?
How to you go about meeting these obligations?
7. Exploring transaction costs influencing access to formal credit
To understand how accessing formal credit influences smallholder market participation
decisions, the following questions were raised for further consideration:
What do you consider as important for running a poultry business?
How can you go about getting them?
8. Exploring transaction costs influencing access to extension services
To understand how accessing extension services influences smallholder market
participation decisions, the following questions were raised for further consideration:
What type of information do you think a poultry farmer needs to know?
How do you think a farmer can get this information?
Do you have a problem obtaining this information?
9. Exploring transaction costs influencing farmer to farmer information exchange
To under how exchanging information with other poultry farmers influences smallholder
market participation decisions, the following questions were considered for further
exploration:
What type of information do you think a poultry farmer might want to know?
How do you think a farmer can get this information?
10. Exploring transaction costs influencing farmer’s location
To understand how distance to market (proximity) and distance to health centre
(remoteness) influences smallholder market participation decisions, the following
questions guided the qualitative phase:
What are the types of poultry operations you would undertake to and from your
farm?
Where do you go about carrying out these operations?
Do you have face any problems in carrying out these operations?
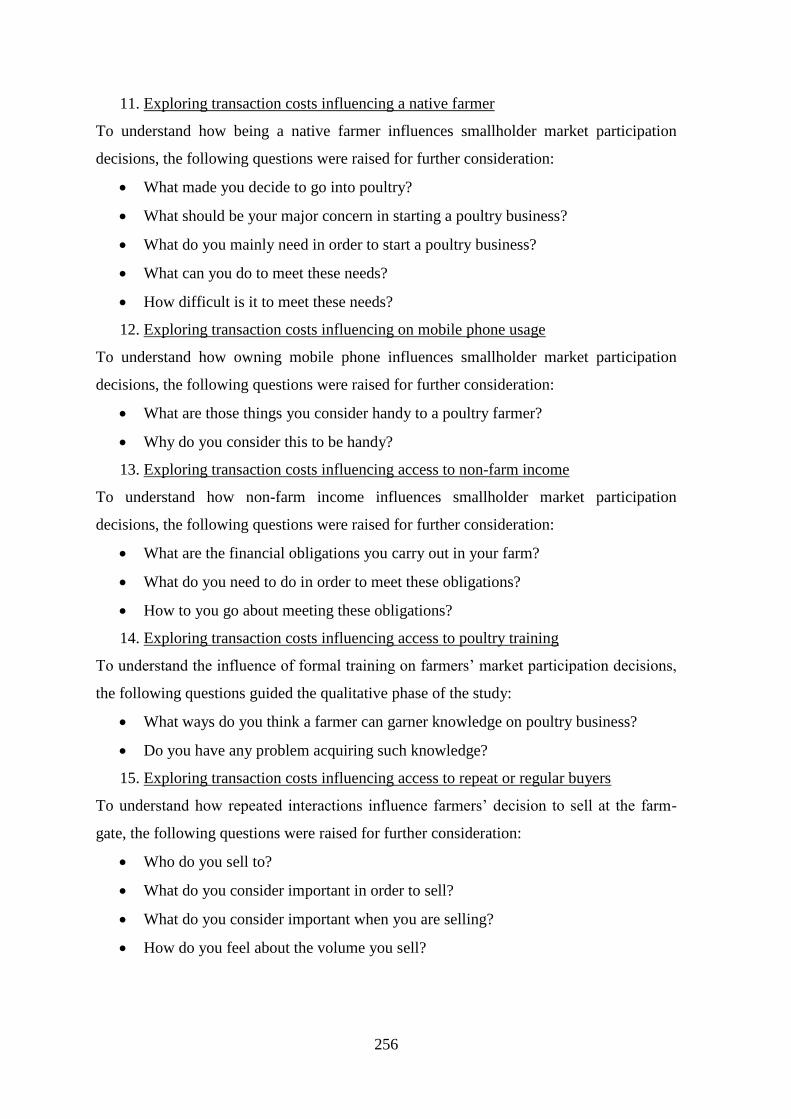
256
11. Exploring transaction costs influencing a native farmer
To understand how being a native farmer influences smallholder market participation
decisions, the following questions were raised for further consideration:
What made you decide to go into poultry?
What should be your major concern in starting a poultry business?
What do you mainly need in order to start a poultry business?
What can you do to meet these needs?
How difficult is it to meet these needs?
12. Exploring transaction costs influencing on mobile phone usage
To understand how owning mobile phone influences smallholder market participation
decisions, the following questions were raised for further consideration:
What are those things you consider handy to a poultry farmer?
Why do you consider this to be handy?
13. Exploring transaction costs influencing access to non-farm income
To understand how non-farm income influences smallholder market participation
decisions, the following questions were raised for further consideration:
What are the financial obligations you carry out in your farm?
What do you need to do in order to meet these obligations?
How to you go about meeting these obligations?
14. Exploring transaction costs influencing access to poultry training
To understand the influence of formal training on farmers’ market participation decisions,
the following questions guided the qualitative phase of the study:
What ways do you think a farmer can garner knowledge on poultry business?
Do you have any problem acquiring such knowledge?
15. Exploring transaction costs influencing access to repeat or regular buyers
To understand how repeated interactions influence farmers’ decision to sell at the farm-
gate, the following questions were raised for further consideration:
Who do you sell to?
What do you consider important in order to sell?
What do you consider important when you are selling?
How do you feel about the volume you sell?

257
16. Exploring transaction costs influencing farmer’s negotiating position
To understand how a farmer’s negotiating position influence farmers’ decision to sell at
the farm-gate; the following questions guided the qualitative phase of the study:
How do you sell your birds?
Do you have any particular preference on how you might sell your birds?
Are you satisfied with the volume you sell?
Are you satisfied with the price you sell?
Do you have any concerns about your buyers?

258
B.4 Final thematic framework
1.1 Probability of participation in poultry markets
1.1.1 Ease of accessing veterinary services
1.1.2 Ease of accessing financial services
1.1.3 Importance of cash flow
1.1.4 Selling in bulk
1.1.5 Proximity to market
1.1.6 Availability of infrastructure
1.2 Extent of participation in poultry markets
1.2.1 Time allocation in on-farm work
1.2.2 Availability of means of transport
1.2.3 Importance of social contacts and interaction
1.2.4 Access to means of communication
1.2.5 Importance of social capital
1.2.6 Professional exposure
1.2.7 Importance of literacy
1.3 Smallholder farmers’ decision to sell through the farm-gate
1.3.1 Convenience of selling at the farm-gate
1.3.2 Negotiating from a position of strength
1.3.3 Selling in bulk

259
B.5 Extract from thematic chart for probability of participation and extent of
participation
Interviewee Ease of accessing veterinary
services
Access to means of
communication
Iquo, female, 52 year old, 7
years in poultry
I think farmers like myself that
are into poultry to make
money cannot do without
veterinary services … because
I have to take extra care so I do
not lose my birds, but farmers
that are not into poultry to
make money are not likely to
make use of veterinary
services they do not take the
business seriously and so stock
few
Eme, female, 60 years, 10
years in poultry
If you are into poultry to make
money… you will invest in
proper medication and hygiene
and you will not have high
mortality, this will lead to
increased volume.
I think veterinary services,
because of the high mortality
rate in poultry … when I
started the business I did not
have a veterinary doctor, but
later my birds started falling ill
and I lost a good number. I had
to consult a veterinary doctor
and I have had one since then ,
so imagine if I could not
access a vet, I would have long
left the business or just kept

260
one or two, that is why those
farmers that cannot access
veterinary services stock very
few birds, because of the fear
of diseases or mortality.
Okon, male, 48 years, 5 years
in poultry
Without veterinary services I
do not see any poultry farm
surviving, even if you attempt
self-medication, from my
experience veterinary doctors
know more than you do and
you know it only takes one
disease to set in that can result
in high mortality.
Edem, 32 years, 3 years in
poultry
I always get information on the
medications I need from the
poultry shop I go to buy my
day old chicks (DOC) and
feed, because I do not have
access to trained veterinary
doctors.
Arit, 25 years, 5 years in
poultry
Veterinary services play a very
important role in poultry
business, from day one that
you have your day old chicks
up to when you sell them …
for example, day old chicks
need to be vaccinated, it
requires skill although some
farmers have learnt how to do
it, still the services of a
veterinary doctor is very
important for the survival of
the birds.
Ukeme, male, 32 years, 7
years in poultry
Veterinary services play a
major role to poultry farmers,

261
but from my location it is very
difficult to access veterinary
services, that is why I rely on
farmers that have been in
poultry for a long time to tell
the medications I can use on
my birds after I explain the
symptoms to them.
Adiaha, 45 year old female
with 16 years in poultry
business
Mobile phone(s) is the best
thing to happen to us farmers,
just one call away and you can
supply or arrange sales, it
helps get me organised
Ekaette, 70 year old female
with 8 years in poultry
business
It just makes my life a lot
easier, I use it to communicate
with other farmers, buyers and
feed dealers without mobile
phones selling my birds would
be extremely difficult
Ime, 36 year old male with 10
years in poultry
mobile phones mean a lot,
there is no way you will be
able to contact your suppliers,
your buyers and other people
without using a phone
Mfon, 59 year old male with 9
years in poultry
very important means of
communication … I can better
plan my time, which makes
life easy for me because it
reduces uncertainty
Edidiong, 37 year old male
with 3 years in poultry
with the mobile phone, you
can stay in your house and do
any business transaction you
want to do concerning your
poultry. For example, you can
call your dealer: ‘please give
me 50 bags of feed’ or call
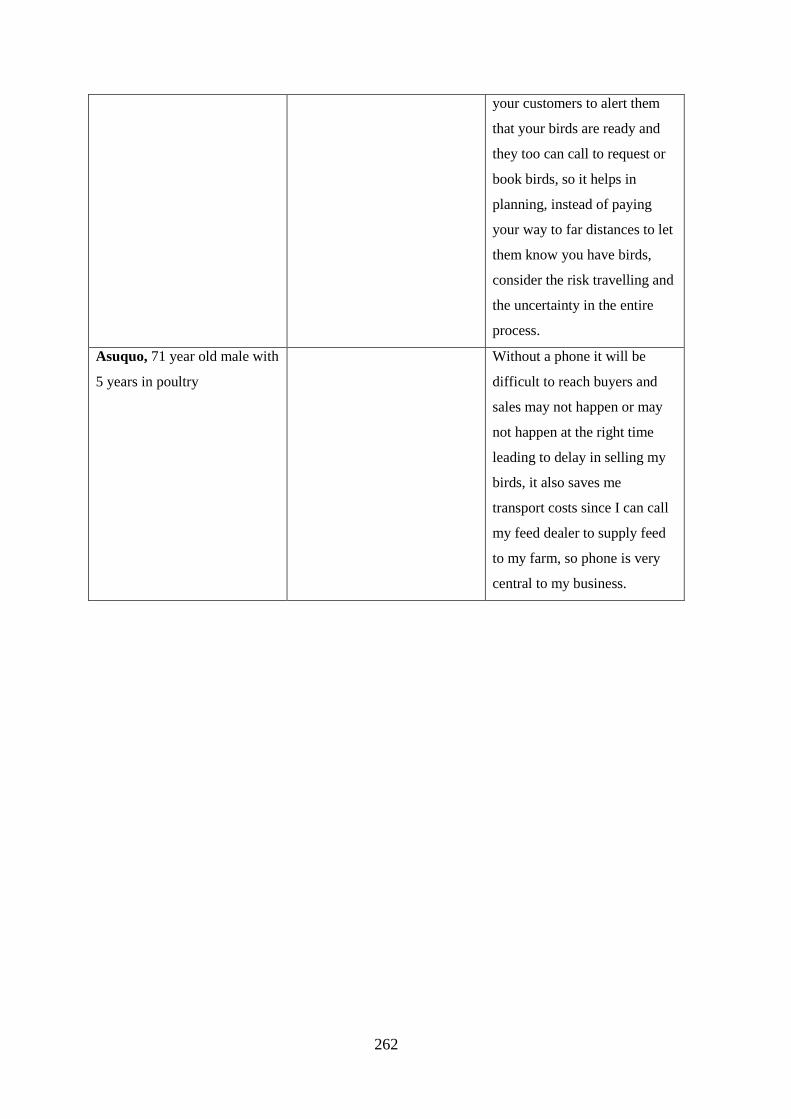
262
your customers to alert them
that your birds are ready and
they too can call to request or
book birds, so it helps in
planning, instead of paying
your way to far distances to let
them know you have birds,
consider the risk travelling and
the uncertainty in the entire
process.
Asuquo, 71 year old male with
5 years in poultry
Without a phone it will be
difficult to reach buyers and
sales may not happen or may
not happen at the right time
leading to delay in selling my
birds, it also saves me
transport costs since I can call
my feed dealer to supply feed
to my farm, so phone is very
central to my business.

263
Appendix C: Systematic review methods
C.1 Bibliographic databases
AgEcon Search, 1997 to May 2017
https://ageconsearch.umn.edu/?ln=en (accessed 8 May 2017)
Jstor, 1990 to May 2017
https://www.jstor.org/action/showAdvancedSearch (accessed 1 May 2017)
Ideas.repec, 1990 to May 2017
https://ideas.repec.org/search.html (accessed 8 May 2017)
Proquest database, 1990 to May 2017)
http://www.proquest.com/libraries/academic/databases/ProQuest-Social-Sciences-
Premium-Collection.html (8 May 2017)
Sciencedirect, 1990 to May 2017
http://www.sciencedirect.com/science/search (2 May 2017)
C.2 Grey Literature databases
Google Scholar.
http://scholar.google.co.uk/advanced_scholar_search?hl=en&lr=lang_en (accessed 16
May 2017).
DOAJ.
https://doaj.org/search#.WaRL5CiGPIU (accessed 16 May 2017).
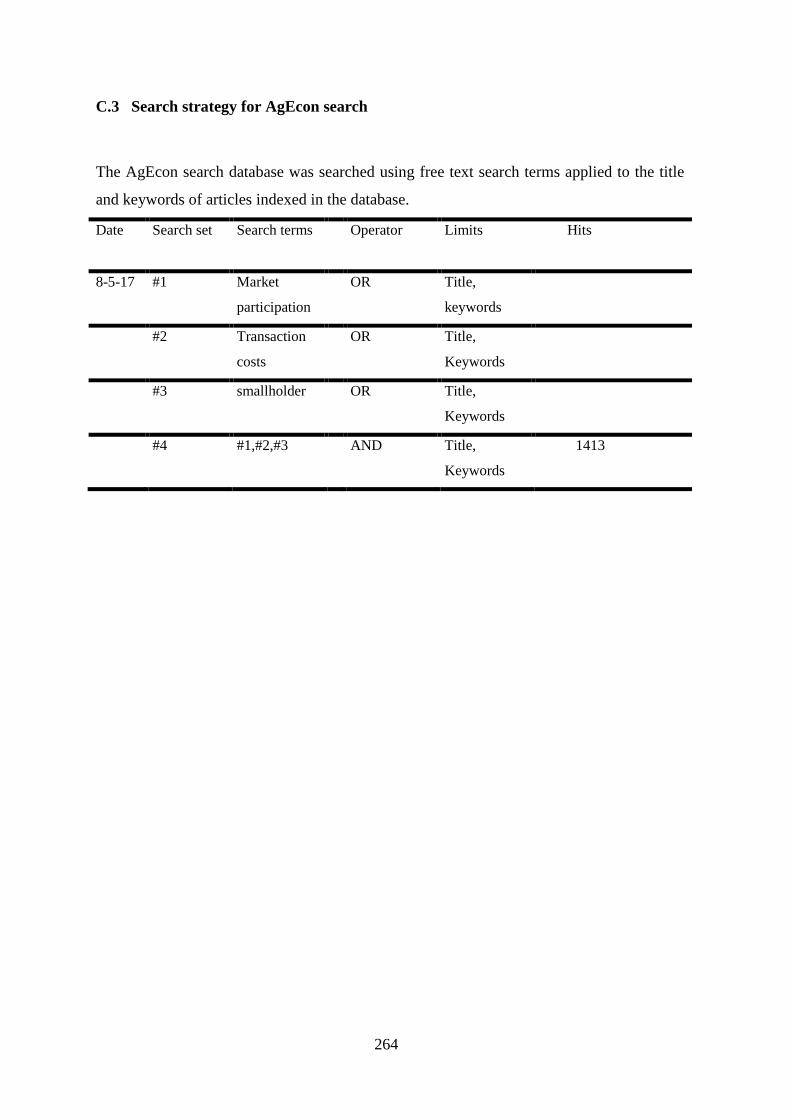
264
C.3 Search strategy for AgEcon search
The AgEcon search database was searched using free text search terms applied to the title
and keywords of articles indexed in the database.
Date Search set Search terms Operator Limits Hits
8-5-17 #1 Market
participation
OR Title,
keywords
#2 Transaction
costs
OR Title,
Keywords
#3 smallholder OR Title,
Keywords
#4 #1,#2,#3 AND Title,
Keywords
1413

265
C.4 Search strategy for JSTOR
The JSTOR search database was searched using free text search terms applied to the item
title of articles indexed in the database.
Date Search set Search terms Operator Limits Hits
1-5-17 #1 Market
participation
OR Title
#2 Transaction
costs
OR Title
#3 Smallhold* OR Title
#4 Market
outlet*
OR
#5 #1,#2,#3,#4 AND Title 52,429
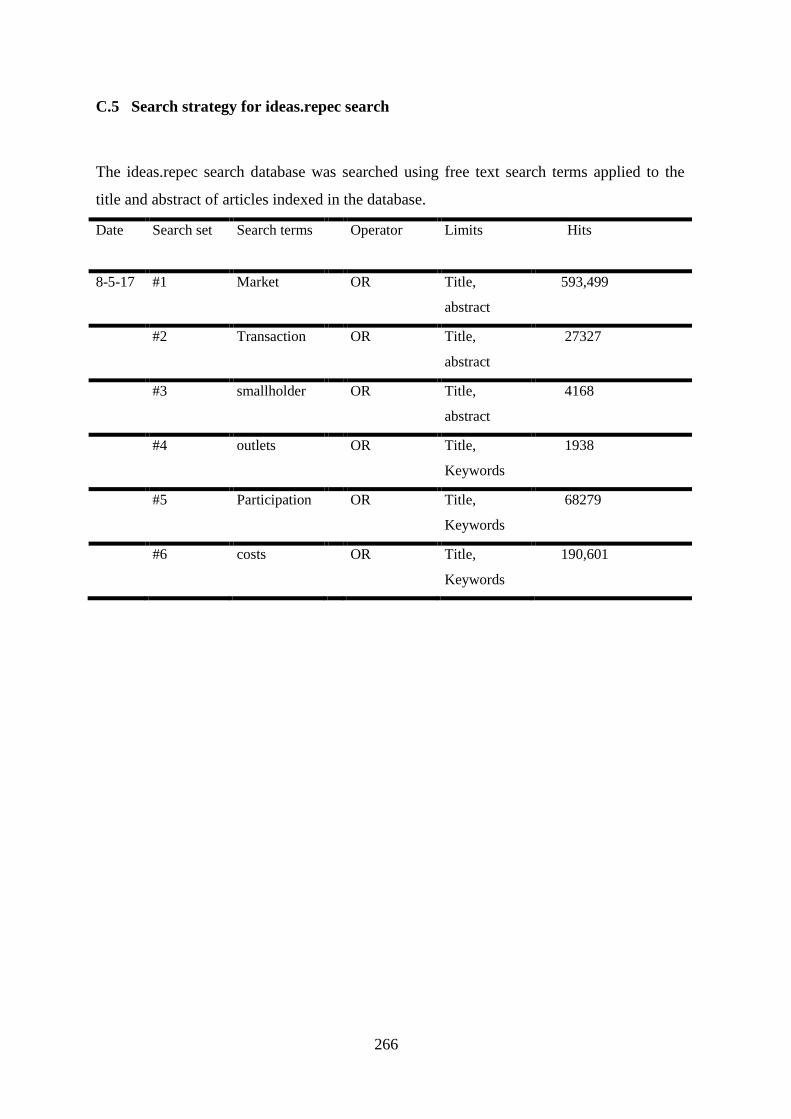
266
C.5 Search strategy for ideas.repec search
The ideas.repec search database was searched using free text search terms applied to the
title and abstract of articles indexed in the database.
Date Search set Search terms Operator Limits Hits
8-5-17 #1 Market OR Title,
abstract
593,499
#2 Transaction OR Title,
abstract
27327
#3 smallholder OR Title,
abstract
4168
#4 outlets OR Title,
Keywords
1938
#5 Participation OR Title,
Keywords
68279
#6 costs OR Title,
Keywords
190,601
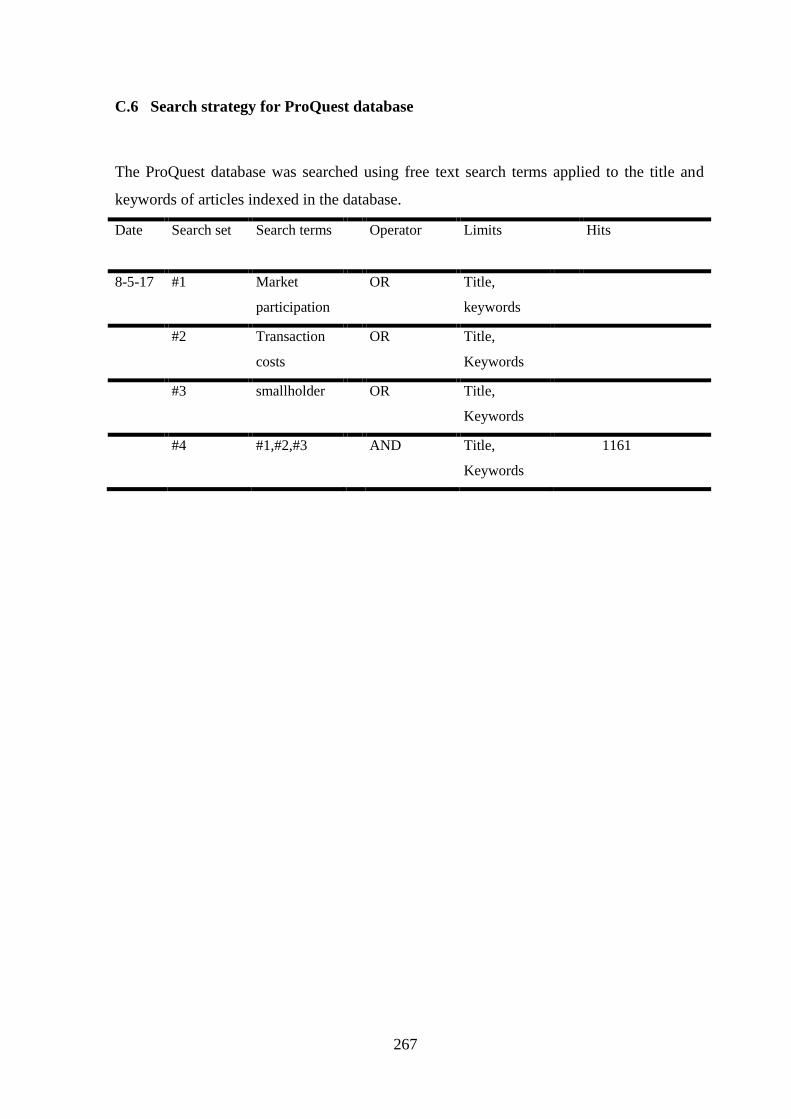
267
C.6 Search strategy for ProQuest database
The ProQuest database was searched using free text search terms applied to the title and
keywords of articles indexed in the database.
Date Search set Search terms Operator Limits Hits
8-5-17 #1 Market
participation
OR Title,
keywords
#2 Transaction
costs
OR Title,
Keywords
#3 smallholder OR Title,
Keywords
#4 #1,#2,#3 AND Title,
Keywords
1161

268
C.7 Search strategy for Science direct
The science direct database was searched using free text search terms applied to the title
and keywords of articles indexed in the database.
Date Search set Search terms Operator Limits Hits
2-5-17 #1 Market
participation
OR Title,
keywords
#2 Transaction
costs
OR Title,
Keywords
#3 smallholder OR Title,
Keywords
#4 #1,#2,#3 AND Title,
Keywords
862

269
C.8 Search strategy for Google scholar
The Google scholar database was searched using free text search terms applied to the title
and keywords of articles indexed in the database.
Date Search set Search terms Operator Limits Hits
16-5-17 #1 Market
participation
OR
#2 Transaction
costs
OR
#3 smallholder OR
#4 #1,#2,#3 AND Title, Text 27,300
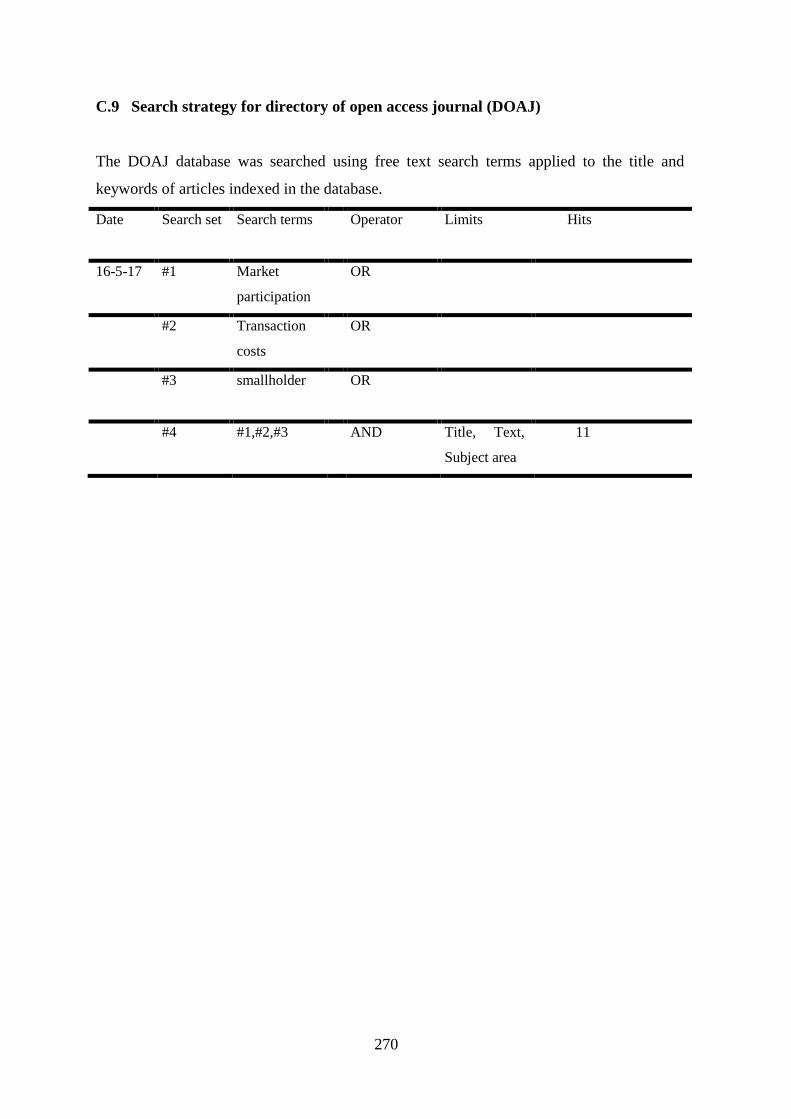
270
C.9 Search strategy for directory of open access journal (DOAJ)
The DOAJ database was searched using free text search terms applied to the title and
keywords of articles indexed in the database.
Date Search set Search terms Operator Limits Hits
16-5-17 #1 Market
participation
OR
#2 Transaction
costs
OR
#3 smallholder OR
#4 #1,#2,#3 AND Title, Text,
Subject area
11
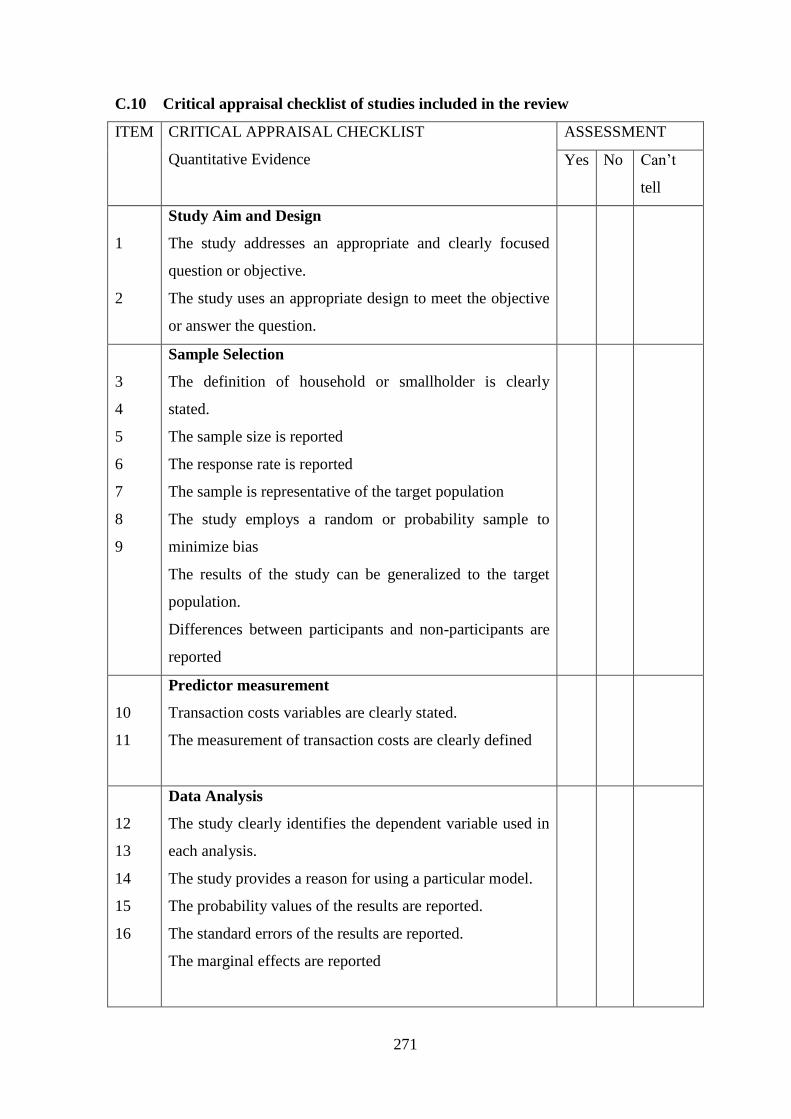
271
C.10 Critical appraisal checklist of studies included in the review
ITEM CRITICAL APPRAISAL CHECKLIST
Quantitative Evidence
ASSESSMENT
Yes No Can’t
tell
1
2
Study Aim and Design
The study addresses an appropriate and clearly focused
question or objective.
The study uses an appropriate design to meet the objective
or answer the question.
3
4
5
6
7
8
9
Sample Selection
The definition of household or smallholder is clearly
stated.
The sample size is reported
The response rate is reported
The sample is representative of the target population
The study employs a random or probability sample to
minimize bias
The results of the study can be generalized to the target
population.
Differences between participants and non-participants are
reported
10
11
Predictor measurement
Transaction costs variables are clearly stated.
The measurement of transaction costs are clearly defined
12
13
14
15
16
Data Analysis
The study clearly identifies the dependent variable used in
each analysis.
The study provides a reason for using a particular model.
The probability values of the results are reported.
The standard errors of the results are reported.
The marginal effects are reported
272
C.11 Critical Appraisal supporting notes for the studies reviewed
1. The study addresses an appropriate and clearly focused question or objective.
Yes: Study aim and objectives are clearly addressed.
No: Not addressed.
Can’t tell: Not clearly addressed.
2. The study uses an appropriate design to meet the objective or answer the question.
Yes: Cross-sectional analysis to determine associations that occur at a given point in time.
No: design type not stated.
3. The definition of households or smallholder is clearly stated.
Yes: Definition provided.
No: Not defined.
Can’t tell: Not clearly defined.
4. The sample size is reported
Yes: Sample size reported.
No: Sample size not reported
5. Response rate is reported
Yes: response rate reported.
No: response rate is not reported
Can’t tell: response rate is not reported but can be calculated from data presented
6. The sample is representative of the target population
Yes: No apparent differences exist between study sample and target population.
No: identifiable differences exist between study sample and target population.
Can’t tell: No clear information provided to determine representation.
7. The study employs a random or probability sample to minimize bias
Yes: Study employs random, probability, stratified sampling.
No: study employs convenience sampling.
Can’t tell: sampling approach not reported.
8. The results of the study can be generalized to the target population.
Yes: No significant differences between people, places and times.
No: significant differences between people, places and times.
Can’t tell: No clear information provided to decide.
9. Differences between participants and non-participants are reported
Yes: Differences tested

273
No: Difference not tested
10. Transaction costs variables are clearly stated.
Yes: clearly stated.
No: Not stated.
Can’t tell: Not clearly stated.
11. Measurements of transaction costs are clearly defined
Yes: Definition provided.
No: Not defined.
Can’t tell: Not clearly defined.
12. The study clearly identifies the dependent variable used in each analysis.
Yes: Dependent variable is clearly identified.
No: Not identified.
Can’t tell: No clear identification is provided.
13. The study provides a clear reason for using a particular model.
Yes: reason provided.
No: No reason provide.
Can’t tell: Not clear.
14. The probability values of the results are reported.
Yes: P-values are reported.
No: P-values not reported.
Can’t tell: P-values not reported for all results.
15. The standard errors of the results are reported
Yes: standard errors are reported.
No: standard errors not reported.
Can’t tell: standard errors not reported for all results.
16. The marginal effects are reported
Yes: marginal effect reported.
No: marginal effect is not reported.

274
C.12 Quality Assessment results of studies included in the review
Study 1.
Study
addresses
an
appropriate
& clearly
focused
question or
objective
2.
Study uses
an
appropriate
design to
meet the
question or
objective
3.
Definition
of
smallholder
is clearly
stated.
4.
The
sample
size is
reported
5.
The
response
rate is
reported
6.
study
sample is
representa
tive of the
target
populatio
n
7. study
employs a
random or
probability
sampling to
minimise
bias
8.
results of
the study
can be
generalised
to the target
population
9.
Differences
between
participants
and non-
participants
are reported
1. Hobbs, J.E
(1997)
Yes Yes Can’t tell Yes No Yes Can’t tell Yes No
2. Gong, Wen et
al (2006)
Yes Yes Can’t tell Yes No Yes Yes Yes No
3. Jagwe, J. et al
(2010)
Yes Yes Yes Yes No Yes Can’t tell Yes No
4. Woldie, G.A &
Nuppenau, E.A.
(2011)
Yes Yes Can’t tell Yes No Yes Yes Yes No
5. Jagwe, J.N &
Machethe, C.
(2011)
Yes Yes Can’t tell Yes No Yes Can’t tell Yes Yes
6. Shiimi, T. et al
(2012)
Yes Yes Can’t tell Yes Can’t tell Yes Yes Yes No
7. Maliu, S.K. et
al (2012)
Yes Yes Can’t tell Yes Can’t tell Yes Yes Yes No
8. Onoja, A.O. et
al (2012)
Yes Yes No Yes No Yes Yes Yes No
9. Bwalya, R. et
al (2013)
Yes Yes No Yes No Yes Yes Yes Yes
10. Kuma, B. et
al (2013)
Yes Yes Can’t tell Yes Can’t tell Yes Yes Yes Yes
11. Ohen, S.B. et
al (2013)
Yes Yes No Yes No Yes Yes yes No
12. Edoge, E.D.
(2014)
Yes Yes No Yes Can’t tell Yes Yes Yes No
13. Lijia, W. &
Xuexi, Huo.
(2014)
Yes Yes Can’t tell Yes Can’t tell Yes Yes Yes Yes
14. Abu, B. M. et
al (2014)
Yes Yes No Yes No Yes Yes Yes No
15. Ohen, S.B. et
al (2014)
Yes Yes No Yes No Yes Yes Yes No
16. Sebatta, C. et
al (2014)
Yes Yes Can’t tell Yes No Yes Yes Yes Yes
17. Natawidjaja,
R.S. (2014)
Yes Yes Can’t tell Yes No Yes Yes Yes No

275
18. Mabuza,
M.L. et al (2014)
Yes Yes Can’t tell Yes No Yes Yes Yes Yes
19. Tavva, S. et
al (2014)
Yes Yes Can’t tell Yes Can’t tell Yes Yes Yes No
20. Osebeyo,
S.O. & Aye, G.C.
(2014)
Yes Yes Can’t tell Yes No Yes Yes Yes No
21. Abu, B.M.
(2015)
Yes Yes Can’t tell Yes No Yes Yes Yes No
22. Harrizon,
Kirui.
et al (2016)
Yes Yes No Yes No Yes Yes Yes Yes
23. Lefebo, N. et
al (2016)
Yes Yes No Yes No Yes Yes Yes yes
24. Achandi, E.L
& Mujawamariy,
G. (2016)
Yes Yes No Yes Can’t tell Yes Yes yes yes
25. Honja, W. et
al (2017)
yes yes No yes No yes yes yes yes
Total ‘yes’
ratings:
25 [100%] 25 [100%] 1 [4%] 25
[100%]
0 [0%] 25 [100%] 22 [88%] 25 [100%] 10 [40%]
Quality Assessment results of studies included in the review: continued
Study 10. Transaction
costs variables
are clearly
identifiable
11.
Measurements
of transaction
costs are clearly
defined
12.
study clearly
identifies the
dependent
variable used
in each
analysis
13.
study provides
a clear reason
for using a
particular
model.
14.
probability
values of the
results are
reported
15.
standard
errors of
the results
are reported
16.
margina
l effects
are
reported
1. Hobbs, J.E (1997) Yes Yes Yes yes Can’t tell Can’t tell Yes
2. Gong, Wen.
et al (2006)
Yes Yes Yes yes Yes Yes No
3. Jagwe, J. et al
(2010)
Yes Yes Yes yes No Yes No
4. Woldie, G.A &
Nuppenau, E.A.
(2011)
Yes Yes Yes yes No Yes Yes
5. Jagwe, J.N &
Machethe, C. (2011)
Yes Yes Yes yes No Yes Yes
6. Shiimi, T. et al
(2012)
Yes Yes Yes yes No Yes No
7. Maliu, S.K.
et al (2012)
Yes Yes Yes yes Yes Yes Yes
8. Onoja, A.O.
et al (2012)
Yes Yes Yes yes Yes Yes Yes
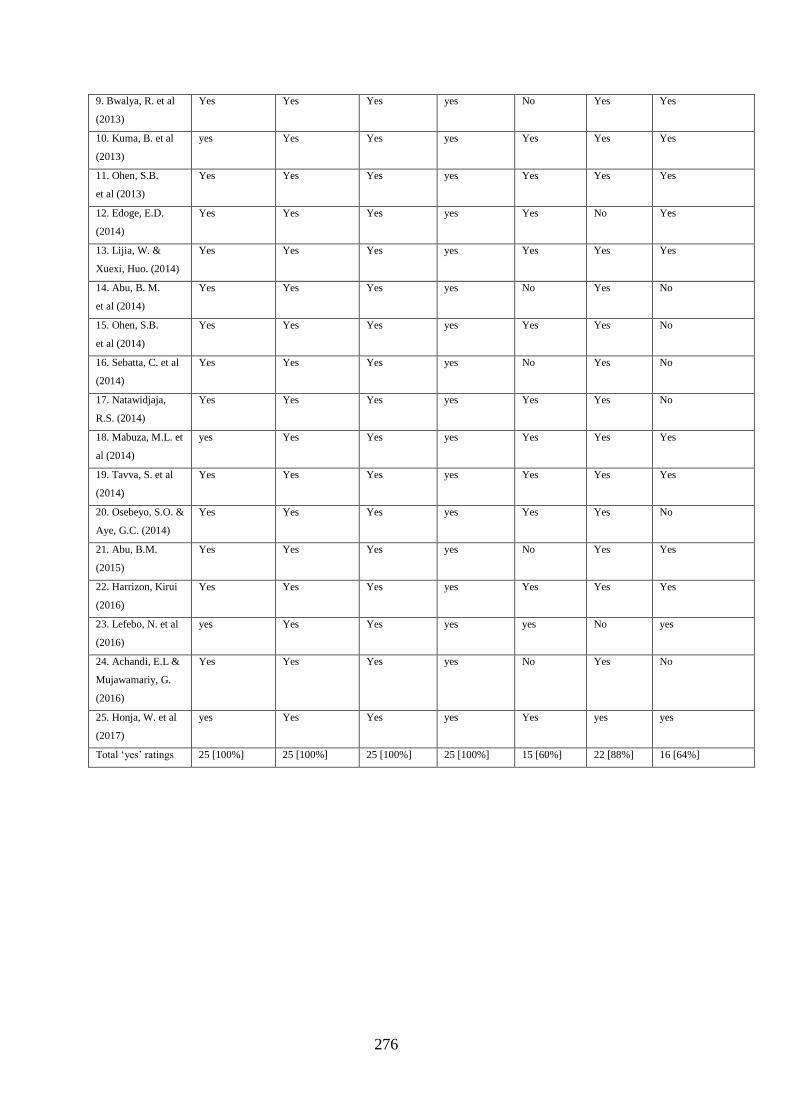
276
9. Bwalya, R. et al
(2013)
Yes Yes Yes yes No Yes Yes
10. Kuma, B. et al
(2013)
yes Yes Yes yes Yes Yes Yes
11. Ohen, S.B.
et al (2013)
Yes Yes Yes yes Yes Yes Yes
12. Edoge, E.D.
(2014)
Yes Yes Yes yes Yes No Yes
13. Lijia, W. &
Xuexi, Huo. (2014)
Yes Yes Yes yes Yes Yes Yes
14. Abu, B. M.
et al (2014)
Yes Yes Yes yes No Yes
No
15. Ohen, S.B.
et al (2014)
Yes Yes Yes yes Yes Yes No
16. Sebatta, C. et al
(2014)
Yes Yes Yes yes No Yes No
17. Natawidjaja,
R.S. (2014)
Yes Yes Yes yes Yes Yes No
18. Mabuza, M.L. et
al (2014)
yes Yes Yes yes Yes Yes Yes
19. Tavva, S. et al
(2014)
Yes Yes Yes yes Yes Yes Yes
20. Osebeyo, S.O. &
Aye, G.C. (2014)
Yes Yes Yes yes Yes Yes No
21. Abu, B.M.
(2015)
Yes Yes Yes yes No Yes Yes
22. Harrizon, Kirui
(2016)
Yes Yes Yes yes Yes Yes Yes
23. Lefebo, N. et al
(2016)
yes Yes Yes yes yes No yes
24. Achandi, E.L &
Mujawamariy, G.
(2016)
Yes Yes Yes yes No Yes No
25. Honja, W. et al
(2017)
yes Yes Yes yes Yes yes yes
Total ‘yes’ ratings 25 [100%] 25 [100%] 25 [100%] 25 [100%] 15 [60%] 22 [88%] 16 [64%]