Embed Size (px)
Citation preview

Influence of tillage practice on major pathways of CH4 emission in rice paddy field
Hiyori Namie, Kasane Shimada, Shuangshuang Zhao, Munehide Ishiguro, Ryusuke Hatano
Graduated school of Agriculture of Hokkaido University, Japan
April 19th-30th
EGU General Assembly 2021SSS8.6 _Soil gases : production, consumption and transport processes

Relationship between soil fertilizers and GHG emission in rice field
◼ Soil fertilizer is the basis for keeping high yields and high-quality rice.But, they are important factors affecting GHG emissions in rice field
(Liang X. et al 2013).
◼ CH4 producing bacteria actively work in anaerobic conditions→ Rice field is a hot spot for CH4 emissions.
◼ Organic matter supplied from rice straw, green manure, soil organic matter, paddy rice, etc become carbon resources of CH4 emitted from rice field (Akira
watanabe. et al 1999).
◼ Application of organic fertilizers may increase TOC content and promote CH4
emissions from rice field (Xie YQ. et al 2015) .
Rice cultivation accounts for about 58.8% of the consisted of CH4
generated agriculture in Japan ( UNFCCC Green house gas Inventory Data 2015 ).
1

Initiatives for fertilizer-free and pesticide-free rice fields◼ Several medium-tilling (weeding operations) which disturb the soil around
rice in fertilizer-free and pesticide-free paddy fields enables the same yield as conventional farming. (Kasubuchi.et al 2016)
◼ Effects of medium-tilling weeding
2
(Kasubuchi.et al 2019)Medium- tilling
Ecosystem conservation by pesticide-free
O2
weeding
machine
O2N
Efficiency of nutritional self-
sufficiency
Improvement of roots area and anaerobic environment
This way is sustainable but increasing C/N content → High GHG emissions?
CH4 gas dynamics in rice field
◼ CH4 produced in paddy soil during paddy rice cultivation is released into the atmosphere through three pathways: diffusion into the atmosphere (<1%), bubbles (<10%), and paddy rice bodies (>90%) (Yumite et al., 2019).
◼ There are few cases diffusion coefficient was measured for the soil under the water→ gas dynamics in rice field soils are not accurately understood.
3
Consideration of soil diffusion coefficient under the surface of the water
CH4 dynamics in rice field soilis able to more specific understanding.
CH4 gas from rice field soil to atmosphere is more accurate analysis
Paddy rice bodies
Diffusion
Bubble

Research Objectives
By comparing the conventional farming with the medium-tilling (weeding operation) rice field of fertilizer-free and pesticide-free farming,
The number of medium-tilling and the presence or absence of fertilizers and pesticides are how affect on CH4 dynamics?
Differences in gas dynamics in soil are how affect on major pathway of CH4 emission?
4

About the research site
Conventional Farming site(CF)
Midium-tilling and natural farming site (T0・T2・T5)
5
Rice field at Hokkaido University Northern Biosphere Field Science Center(N43°4′29″,E141°20′16″)
6
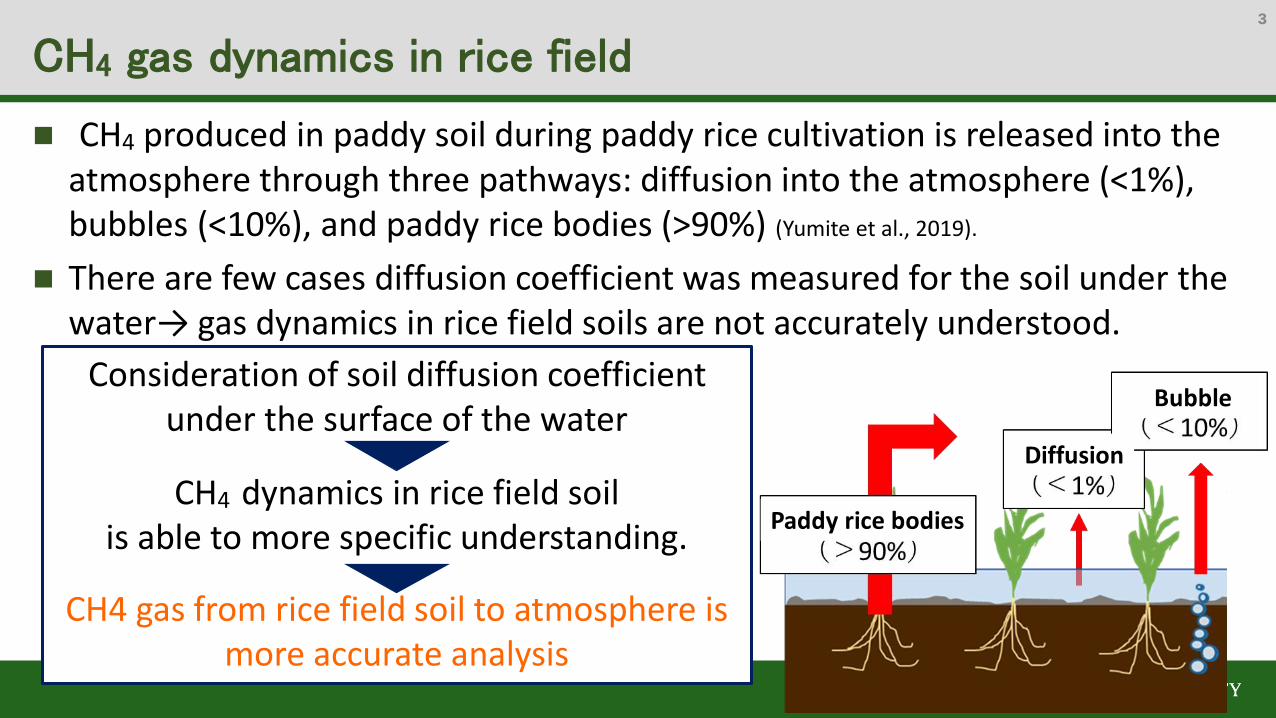
Capturing the space and time variation of CH4 flux
• Measure and compare CH4 flux in each sites (CF, T0, T2, T5)
• Measure CH4 flux throughout the year and compare by water
management in rice field
To identify the governing factor of CH4 flux,Examining the space and time variation of environmental factors
• Measure and compare environmental factors in each sites (CF, T0, T2, T5)
• Compare by water management in rice field as well as CH4 flux
◼The number of medium-tilling and the presence or absence of fertilizers and pesticides are how affect on CH4
dynamics?
◼ Differences in gas dynamics in soil are how affect on major pathway of CH4 emission?
Combine these to find answers!
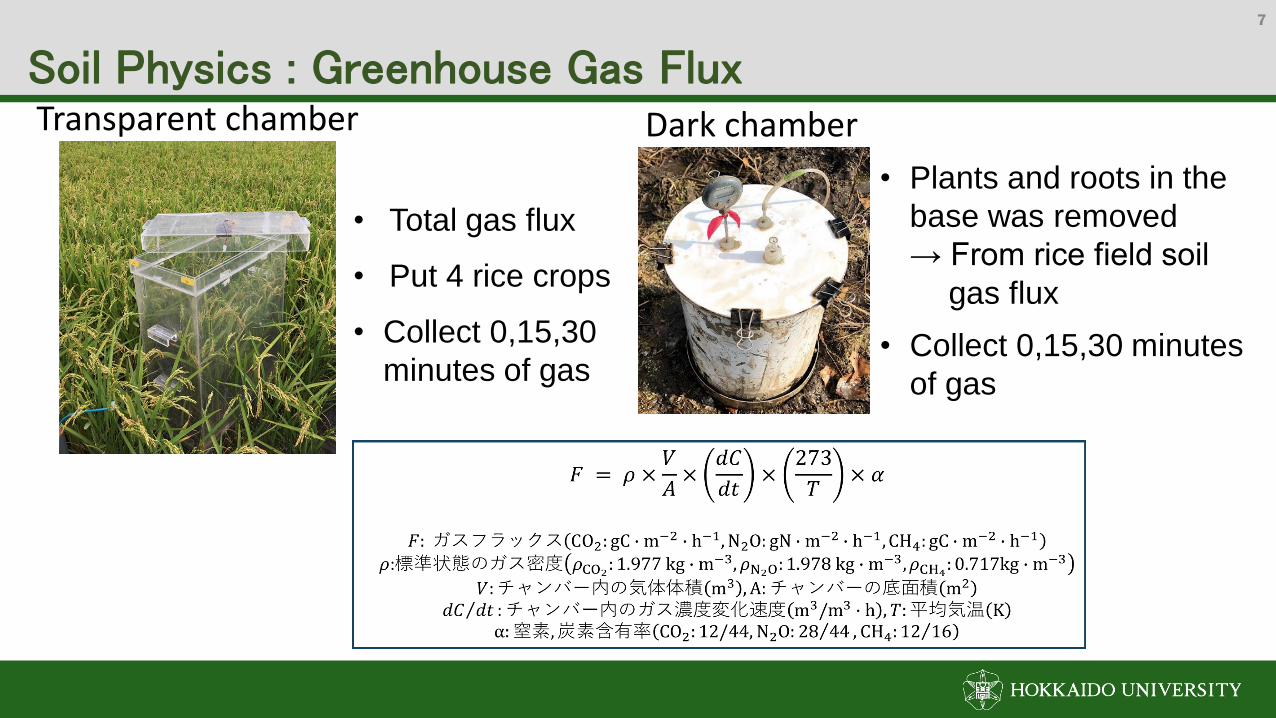
Soil Physics : Greenhouse Gas FluxTransparent chamber Dark chamber
7
• Total gas flux
• Put 4 rice crops
• Collect 0,15,30
minutes of gas
• Plants and roots in the
base was removed
→ From rice field soil
gas flux
• Collect 0,15,30 minutes
of gas

◼Soil gasA soil gas sampling tube was installed at a depth of 0-5 cm
(oxide layer) and 5-10 cm deep (reduction layer) to collect soil air.
◼ Gas diffusion coefficient below the surface of the water
100cm3 core sampler is connected to collect 0-5cm and 5-10cm samples.
Oxygen electrodes developed by Osozawa and Kubota (1987) were used to measure gas diffusion.
◼Gas diffusion flux (※Calculated from the following equation)
Soil Physics : Greenhouse Gas Flux8
(Fujikawa.et al 2008)
Statistical analysis
◼ One-way ANOVA(p<0.05)
→ To test for significant differences in sites intervals
◼ Tukey-HSD
→ To determine which sites intervals are the significant differences confirmed in One-way ANOVA
9

CH4 flux for distinguishing between rice cultivation period and sites
◼ By rice cultivation period
Total CH4 flux tends to increase during flooding period and intermittent irrigation period.
Total CH4 flux tends to decrease since the drainage season→The major pathway of CH4
is rice bodies.
◼ By sites
High emissions in CF and T5 sites where the content of C and N was considered to be high
10CF区: ① Flooding 5/30~7/12 ② Mid-drying 7/13~7/19
③ Intermittent irrigation 7/20~8/25
T区: ① Flooding 5/30~7/27 ② Mid-drying 7/28~8/1
③ Intermittent irrigation 8/2~8/25
CF/T区: ④ Drainage:8/26~10/9 ⑤ Fallowing 10/10~11/12 ⑥Snowing 11/13∼
Total
Soil
Gas
diffusion
Flooding Mid-drying
Intermittent irrigation Drainage Fallowing Snowing
Gas diffusion flux
Bubbles+
Generateand supply
Bubbleaccumulation
+Consumption
Soil flux
CH4
CO2
Total flux
Rice bodies flux
11
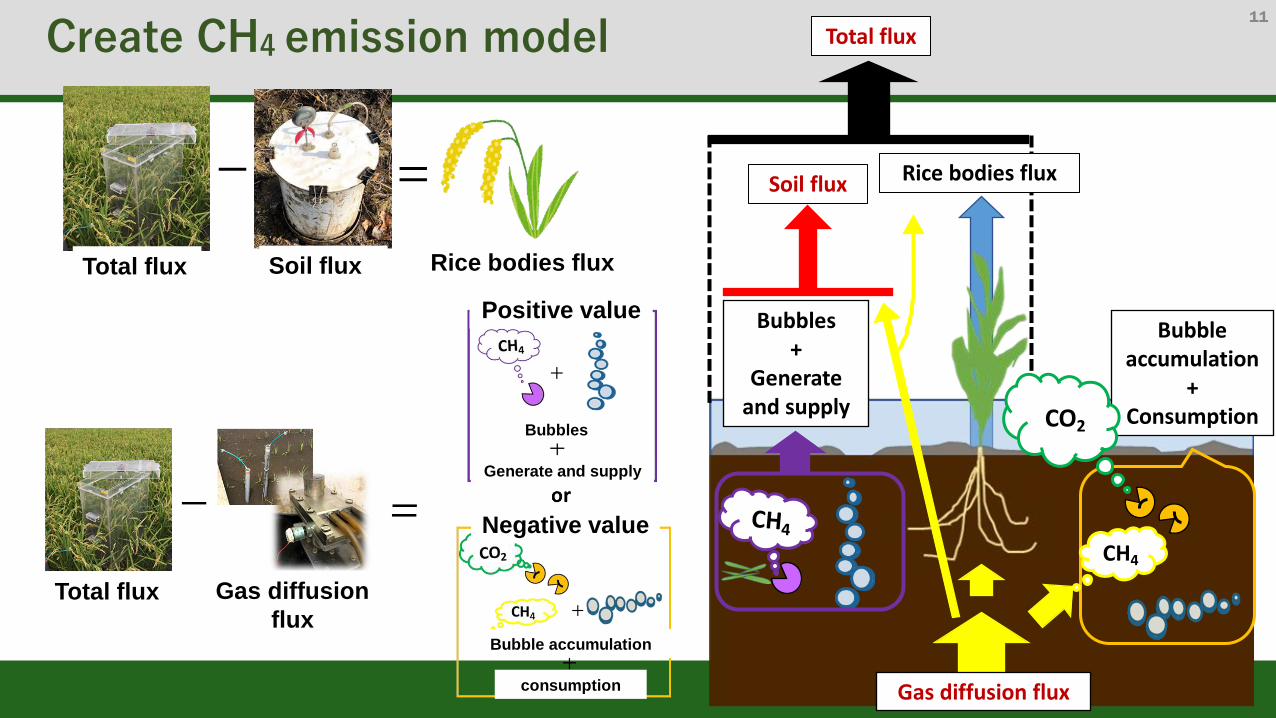
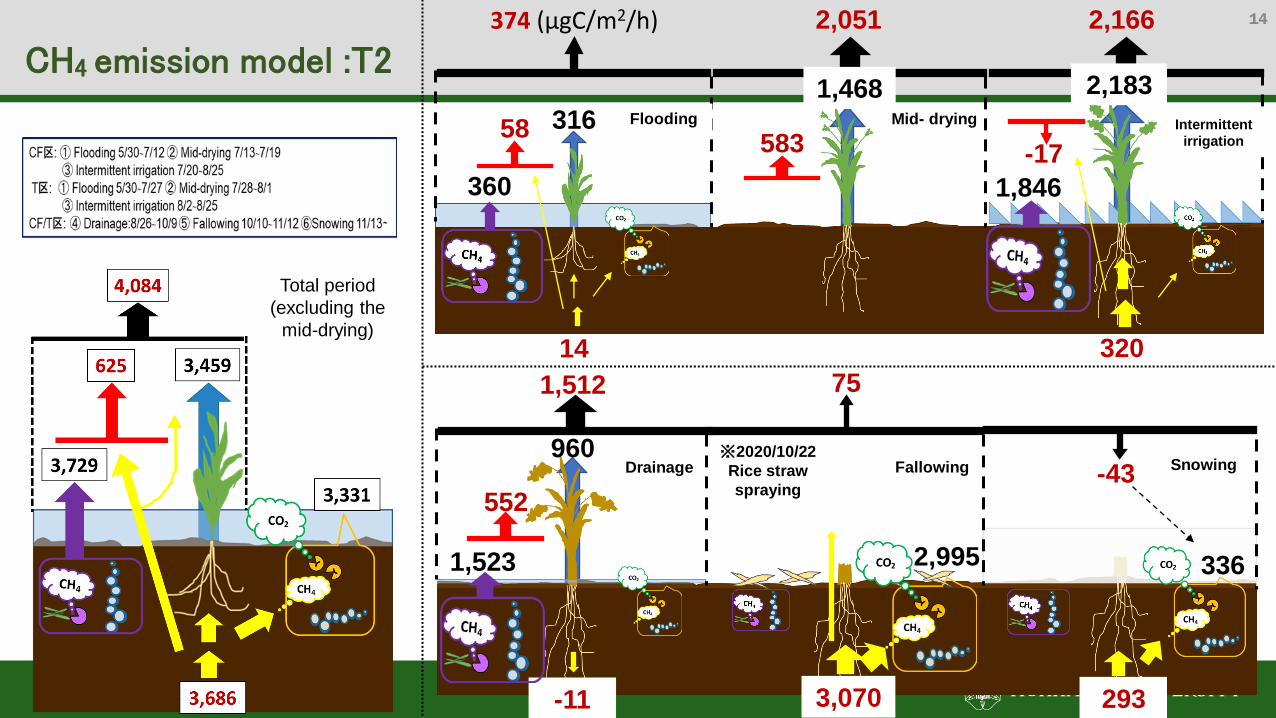
Create CH4 emission model
Total flux Soil flux Rice bodies flux
Gas diffusion
flux
Total flux
Positive value
Negative value
Bubbles
Generate and supply
Bubble accumulation
consumption

12
CH4 emission model :CF 2,791 (μgC/m2/h)
1,316
613
2,178
1,475
14,613
Mid- drying
10,364
7,417
22,030
4,249
13,966
Intermittent
irrigation
10,199
29,522
3,767
15,556
7,619
7,393
226
3,264
4,355
79
7,298
7,219
Drainage Fallowing Snowing※2020/10/22
Rice straw
spraying-60
2,978
3,038
※期間Total
(中干し期除く)
Total period
(excluding the
mid-drying)
Flooding
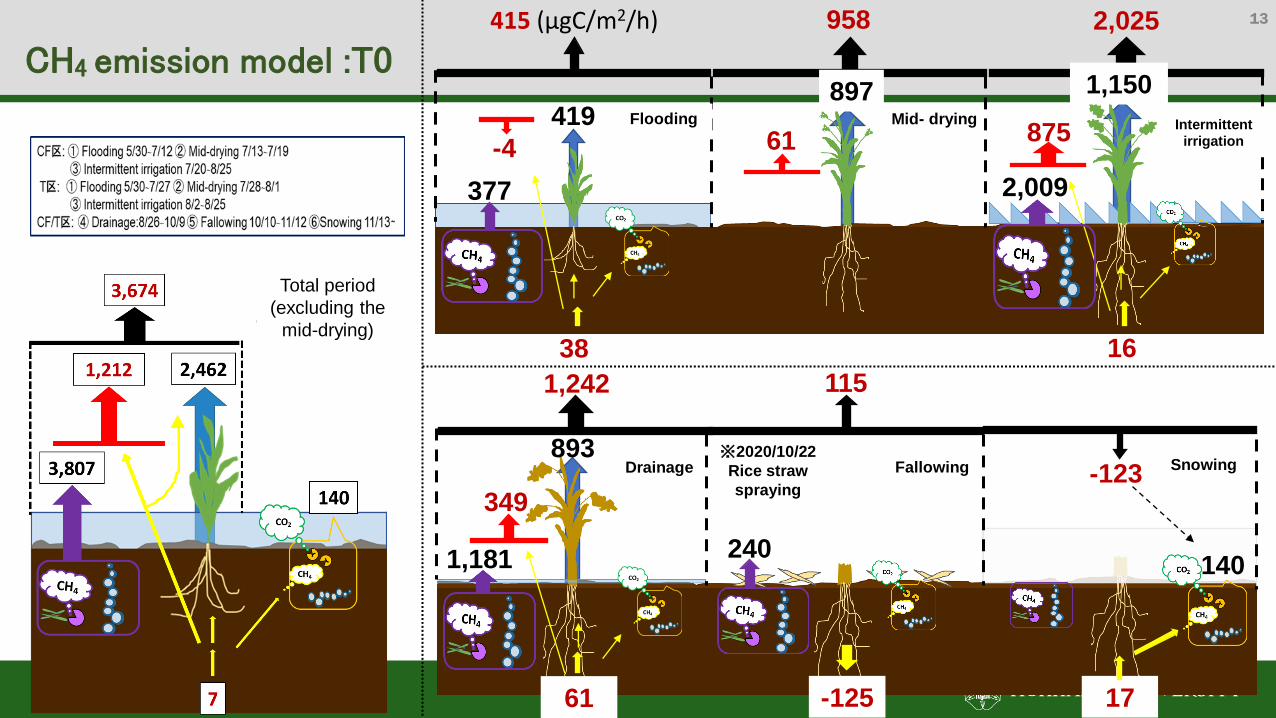
13415 (μgC/m2/h)
419
38
377
-4
958
897
61
2,025
1,150
16
875
1,242
349
893
61
1,181
115
-125
-123
17
140
2,009
240
※期間Total
(中干し期除く)
CH4 emission model :T0
Total period
(excluding the
mid-drying)
Mid- drying Intermittent
irrigation
Drainage Fallowing Snowing
Flooding
※2020/10/22
Rice straw
spraying
14374 (μgC/m2/h)
316
14
360
58
2,051
1,468
583
2,166
2,183
320
-17
1,512
552
960
-11
1,523
75
3,070
2,995
-43
293
336
1,846
CH4 emission model :T2
Total period
(excluding the
mid-drying)
Mid- drying Intermittent
irrigation
Drainage Fallowing Snowing
Flooding
※2020/10/22
Rice straw
spraying

15858 (μgC/m2/h)
796
-322
1,180
62
4,811
4,333
478
3,854
3,714
16
140
2,416
2,456
-40
-10
2,426
107
4,168
4,061
-19
93
3,838
74
Total period
(excluding the
mid-drying)
Mid- drying Intermittent
irrigation
Drainage Fallowing Snowing
Flooding
※2020/10/22
Rice straw
spraying
CH4 emission model :T5
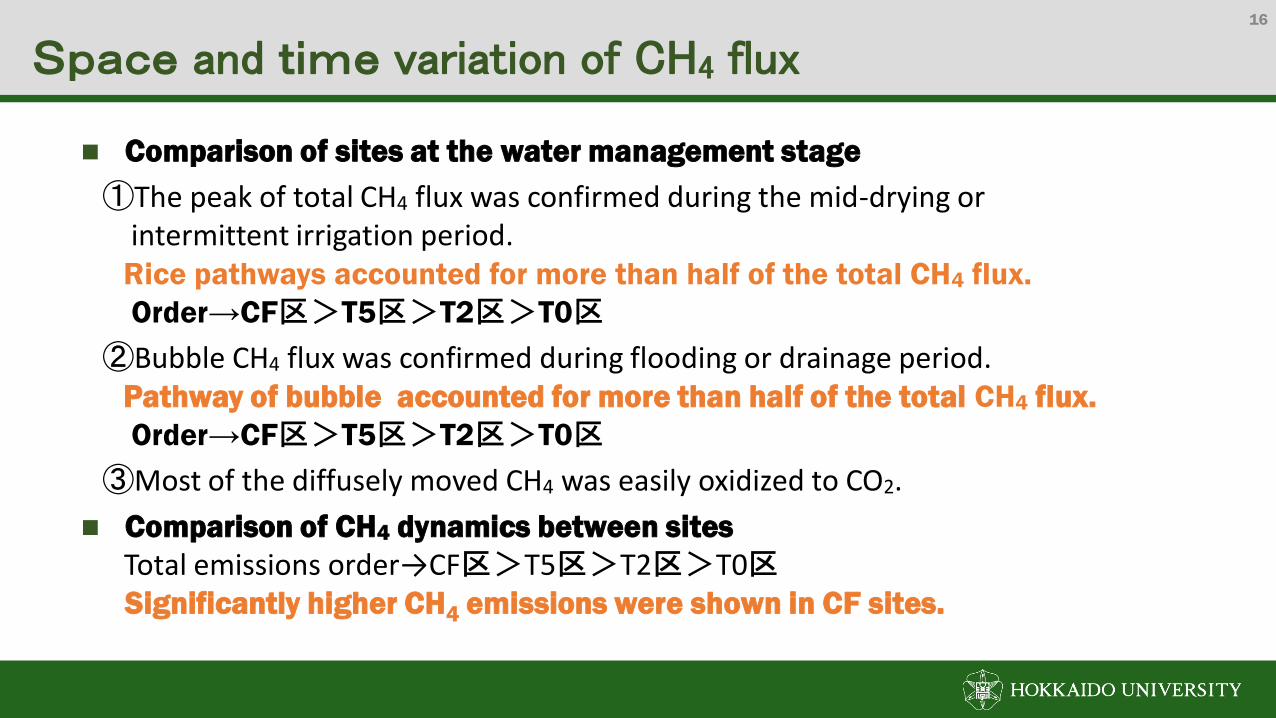
Space and time variation of CH4 flux
◼ Comparison of sites at the water management stage
①The peak of total CH4 flux was confirmed during the mid-drying or intermittent irrigation period.Rice pathways accounted for more than half of the total CH4 flux.
Order→CF区>T5区>T2区>T0区
②Bubble CH4 flux was confirmed during flooding or drainage period.Pathway of bubble accounted for more than half of the total CH4 flux.
Order→CF区>T5区>T2区>T0区
③Most of the diffusely moved CH4 was easily oxidized to CO2.
◼ Comparison of CH4 dynamics between sites
Total emissions order→CF区>T5区>T2区>T0区Significantly higher CH4 emissions were shown in CF sites.
16

Summary of CH4 flux by this natural farming method17
• The capture of organic matter into the soil in the conventional farming
method tended to increase CH4 emissions.
• The major pathway of CH4 emissions was through rice bodies, and
emissions were greatly affected by medium-tilling.
It was suggested that the source of the bubbles may be organic
decomposition of weeds mixed in rice straw and soil.


![Influence of Tillage Practices on Soil Physical …creased root depth and yield of maize compared to zero tillage [13]. However, there are other reports indicating that tillage practices](https://img.pdfslide.us/doc/110x75/5f6662c3f18afd45b816fe30/influence-of-tillage-practices-on-soil-physical-creased-root-depth-and-yield-of.jpg)