Embed Size (px)
Citation preview

Influence of the Glass Transition on Rotational Dynamics of Dyes inThin Polymer Films: Single-Molecule and Ensemble ExperimentsBeatriz Araoz,† Aquiles Carattino,†,⊥ Daniela Tauber,‡ Christian von Borczyskowski,*,‡
and Pedro F. Aramendia*,†,§,∥
†INQUIMAE and Dept. Química Inorganica Analítica y Química Física. Facultad de Ciencias Exactas y Naturales, Universidad deBuenos Aires, Pabellon 2, Ciudad Universitaria, C1428EHA Ciudad de Buenos Aires, Argentina‡Institute of Physics and nanoMA, Technische Universitat Chemnitz, 09107 Chemnitz, Germany§Centro de Investigaciones en Bionanociencias, CIBION-CONICET, Godoy Cruz 2390, 1425 Ciudad de Buenos Aires, Argentina∥Dept. Química Inorganica Analítica y Química Física. Facultad de Ciencias Exactas y Naturales, Universidad de Buenos Aires,Pabellon 2, Ciudad Universitaria, C1428EHA Ciudad de Buenos Aires, Argentina
*S Supporting Information
ABSTRACT: We performed polarized fluorescence emission studies of Nile Red (NR) inpoly(methyl methacrylate) (PMMA), poly(ethyl methacrylate) (PEMA), and poly(butylmethacrylate) (PBMA) at the single molecule (SM) and at the ensemble level to study thein cage movements of the ground-state molecule in polymer films of nanometric thicknessat room temperature. Experiments were performed with wide field irradiation. At theensemble level, the linearly polarized irradiation was used to induce a photoselection bybleaching, which is compensated by rotational diffusion. Both results show an appreciabledifference in mobility of NR in the films that is correlated with the different glass-transitiontemperatures of the films, particularly in PEMA, which displays a clearly distinct behaviorbetween the 200 nm films, representing a rigid environment, and the 25 nm ones, showingmuch higher mobility. We developed a model of broad application for polarizedphotobleaching that allows obtaining rotational diffusion coefficients and photobleachingquantum yields in an easy way from ensemble experiments. The parameters obtained fromensemble measurements correlate well with the results from SM experiments.
■ INTRODUCTION
Thin polymer films containing dye molecules are important inphotoactive coatings, filters, OLEDS, and solar cells. In theseapplications, the interaction of the dye with the nearenvironment, the dye−polymer cage, is crucial.1,2
Polymers are heterogeneous systems at the molecular level.Therefore, dye−polymer interactions can have a distribution ofbehaviors depending on the location of the probe and theconformation of the polymer chains around it.3−5 The mobilityof the probe in a polymer cage plays an important role in thedeactivation and reactive pathways of unimolecular reactionsafter light absorption (isomerization, dissociation). Whileensemble methods can only yield average values, singlemolecule (SM) experiments provide detailed information6−8
about the distribution of singularities related to the variety ofpolymer environments.9−11
It is well known that thin polymer films have differentmechanical properties compared with thick films.12,13 Partic-ularly below 100 nm thickness, confinement and boundaryeffects have a profound influence on the glass-transitiontemperature (Tg) of thin films.14−16 Differences as high as 30K compared with the bulk Tg have been measured. Therefore, itis expected that changes in Tg are accompanied by changes inthe local mobility of the cage even at room temperature,
influencing the dynamics of the embedded dyes. A lower Tgcorresponds to environments with higher flexibility and thuswill be reflected in a larger mobility.Investigations of fluorescence emission anisotropy are widely
used to monitor orientational changes in conformationalrearrangements, molecular association interactions, and localmobility.12,17,18 It is usually applied to monitor excited-statedynamics in cases where rotational diffusion takes place at arate comparable to singlet excited state lifetime (0.1 to 100 nsin practice), but the rotational correlation time in glassypolymers under and around Tg is much longer, attaining eventhe time range of seconds, due to environment rigidity.11,19−21
In this situation, the expected value of the fluorescenceemission anisotropy will reflect the initial distribution offluorophores in the sample. In the ensemble experiment,fluctuations of individual fluorophores average to zero, and thusa time-independent anisotropy value is expected, which isrelated to the statistical average of fluorophore orientations inthe sample. The orientational fluctuations take place with the
Special Issue: Current Topics in Photochemistry
Received: January 9, 2014Revised: May 28, 2014
Article
pubs.acs.org/JPCA
© XXXX American Chemical Society A dx.doi.org/10.1021/jp500272y | J. Phys. Chem. A XXXX, XXX, XXX−XXX

characteristic rotational diffusion time of the probing dyemolecules and can only be observed in SM experiments or inselected samples of a small number of molecules wherecorrelated fluctuations are still important compared with thetotal signal.Therefore, using SM fluorescence emission anisotropy, it is
possible to determine sudden changes in the orientation of thedye molecules embedded in the polymer matrix, independentlyof their excited-state lifetime.22,23 In fact, this type ofmeasurement has been extensively applied for dyes inpolymeric matrices to determine chain orientation24 or theheterogeneous nature of the rotation dynamics near thepolymer glass-transition temperature.10,11,25−29 If the fluores-cent molecule remains in the same orientation betweenabsorption and emission of the photon, the emittedfluorescence will report the orientation at the moment of theabsorption. As previously stated, this will be the commonsituation in glassy polymers. In ensemble measurements underthese conditions, the emission anisotropy will be constant intime due to ensemble averaging. For an SM, on the contrary,monitoring the emission anisotropy in time provides a report ofthe orientational fluctuation of the molecule between successiveevents of excitation and thus provides information onorientational diffusion. In this way, it is possible to monitormolecular reorientation of the dye and to relate it to thedifferent types of environments where the molecules can befound; that is, more rigid surroundings will lead to a lowerfrequency of rearrangements or to smaller amplitudes ofthem.30,31
Single-molecule experiments provide rich insight into thedye−polymer dynamics, but they always raise the question ofthe proper selection of a representative molecular ensemble.Therefore, ensemble experiments can be used as a valuablereference for this fact. Ensemble experiments are normallyfaster to perform and easier to analyze. In this work, we alsoreport ensemble measurements of the same systems used forSM experiments and provide a link between the two types ofexperiments.In general, photobleaching32 causes a perturbation in
rotational diffusion studies.33,34 In this work, we propose amethod to take advantage of polarized photobleaching to studyrotational diffusion in polymer films under continuousirradiation. Basically, linearly polarized photobleaching is usedto create an asymmetry in the orientational distribution of anensemble of fluorescent molecules, which is partiallycompensated by rotational diffusion. We use a model thatconsiders linearly polarized irradiation and photobleaching.Molecules are free to reorient isotropically in three dimensions,and each molecule emits light polarized parallel to theabsorption. The resulting time-dependent linearly polarizedemission components are used to build the time-dependentsteady-state anisotropy.SM measurements of emission of Nile Red in a series of
poly(alkyl methacrylate) films of nanometric thickness provideevidence of the varying mobility of dye molecules in thepolymer cage for different film thickness. From the meanorientation fluctuation, we derive rotational diffusion coef-ficients. These values are compared with rotational correlationcoefficients obtained from ensemble experiments in the samesystems. The latter also provide photobleaching quantum yieldsfor ground-state Nile Red.
■ MATERIALS AND METHODS
Chemicals. Nile Red (NR), 7-diethylamino-3,4-benzophe-noxazine-2-ona, was purchased from Bio Chemika (Sigma forFluorescence), and poly(n-alkyl) methacrylates (PAMA), n-butyl (PBMA, Mw = 337.000), ethyl (PEMA, Mw = 350.000),and methyl (PMMA, Mw = 350.000) were from Sigma-Aldrich,and were used as received. Molecular structures are given inScheme 1. Toluene was from Sigma-Aldrich (spectroscopicgrade).
Polymer Film Preparation and Characterization.Polymer solutions were prepared in toluene at differentconcentration to control the deposited film thickness by spincoating. (See later.) They contained NR at the adequateproportion to the polymer. For ensemble measurements, weemployed a dye concentration of 10−7 mol/kg of polymer,guaranteeing that no aggregates were formed and minimizingFRET effects among dye molecules. For SM measurements, aconcentration of 10−12 mol/kg of polymer was used. Coverslipsubstrates (Menzel-Glaser, no. 1.5) and all glass materialemployed for sample preparation were rigorously cleaned,rinsed with solvents (acetone, methanol, and Milli-Q water)and exposed to UV and O3 for 30 min in an ozonizer (UVOCleaner, model 42A-220, Jelight Company). Polymer concen-trations ranging from 0.25 to 2.00% w/w in toluene were used.Thin polymer films were obtained by spin coating thepolymer−dye solutions onto the substrate. The films weredried in vacuum at 323 K for 12 h. Film thickness of 200 and 25nm was measured by profilometry (Veeco, Dektak 3ST).35
Roughness, characterized by AFM, was <2% (constant force =0.852 N and scan speed 1.02 Hz, processed by Nanoscope II).
Ensemble and Single-Molecule Fluorescence Aniso-tropy. Both types of measurements were carried out at roomtemperature in an Olympus IX71 inverted microscope. A laserdiode (SDL-532-200T, Shanghai Dream Lasers Technology) at532 nm was used to excite the sample. The laser output powerwas tuned by a wedge-shaped neutral filter. A shutter allowedexcitation light interruption when necessary. A polarizer and aretarding plate were used to achieve a linearly polarizedexcitation over the sample. (The excitation power ratio betweenthe two orthogonal directions after the objective was 1/200.)Typical laser power at the sample location was in the range:0.18 to 0.70 mW (corresponding to (2−8) × 1020 photons·cm−2·s−1 on the analyzed area of the ensemble photobleachingexperiments: 60 μm2). Dichroic mirror and emission filter werechosen for Nile Red spectroscopic features (Semrock TRITCcube). An oil-immersion objective (Olympus, PLAN APO N60×, NA 1.42) focused for wide-field irradiation was used. Inthe emission channel, a filter wheel with two polarizers inadjacent positions aligned parallel and perpendicular toexcitation polarization direction allowed us to capturesequentially both emission components. The fluorescencesignal was detected by an Andor iXon-885 EMCCD camera.Exposure time was 0.1 s for each polarization direction. The
Scheme 1. Molecular Structure of Dye and Polymers
The Journal of Physical Chemistry A Article
dx.doi.org/10.1021/jp500272y | J. Phys. Chem. A XXXX, XXX, XXX−XXXB

time between successive exposures was limited by the rotationof the filter wheel to 1.1 s. In the systems studied, the time inwhich dye reorientation changes take place lies in the tens ofseconds range,18 and thus the acquisition time is short enough.In SM experiments, we used stroboscopic excitation to decreasephotobleaching: an irradiation period of 1.1 s, adequate torecord a parallel, and a perpendicular frame, was followed by 10s of darkness. This allowed measurements of several minutes(and up to 1 h) before considerable photobleaching wasobserved within the studied area. In ensemble experiments, weused continuous excitation.To take into account the different sensitivity of detection to
light polarization orientation, usually denoted as G factor (seeeq 1), we calibrated the microscope detection channel using aconcentrated ensemble film whose steady-state anisotropy wasmeasured in a PTI-Quantamaster spectrofluorometer equippedwith polarizers. All NR samples used had steady-stateanisotropy of 0.39 ± 0.01. The correct G factor couldreproduce in the microscope (just before photobleachingbegins to have a significant effect) the same steady-stateanisotropy as measured in the fluorometer.Anisotropy was calculated using successive images taken
parallel and perpendicular to the polarization of theexcitation.36 For ensemble measurements, the intensity wasaveraged in the entire viewing field, where I > 0.9Imax. (Thespace distribution of the incident irradiation beam was Gaussianwith a very good degree of approximation.) For SMmeasurements, the intensity was added in all pixels of adiffraction limited spot, corresponding to the image of onemolecule. In all cases, the anisotropy at each time, r(t), aftercorrection for background signal, was calculated as37
=− − −− + −
⊥
⊥r t
I B G I BI B G I B
( )( )
2 ( )//
// (1)
where I// and I⊥ are the intensities parallel and perpendicular tothe excitation polarization direction, respectively, and thebackground noise, B, was determined as the mean of the signalacquired by the camera when no dye was employed in thepreparation of the sample while all other irradiation anddetection conditions were kept constant. SM emissionanisotropy time traces were obtained for ca. 250 molecules ineach film.To identify molecules in an image sequence, we employed a
Matlab routine38 that selects the brightest spots after adding allframes. To minimize the influence of noise (due to electronicsor to scattered light) and to correct for inhomogeneities in theexcitation intensity, we subtracted from every frame the resultof a Gaussian filter.39 Identifying molecules after adding allframes allows for also locating those that were in a dark state atthe beginning of the sequence.
■ RESULTS1. Single Molecule. Single-molecule polarized intensity
time traces are shown in Figure 1. Figure 1A shows a moleculetime trace in PMMA, and Figure 1B shows a molecule timetrace in PBMA. Molecules are monitored until one-stepphotobleaching takes place. The upper panel of each moleculartrace shows the parallel (blue) and perpendicular (red)intensity as well as the operative total intensity (black),calculated as Itot = I∥ + 2GI⊥. The lower panel shows the timeevolution of the anisotropy. SM anisotropy values span theentire possible range, that is, − 0.5 ≤ r ≤ 1.0.
Different behaviors are observed. In PMMA, anisotropyfluctuations are quite low. For example, in Figure 1A, the timetrace of a SM in PMMA can be described, over the observedtime interval, by an approximately time-independent averagevalue of the anisotropy of <r> = 0.83 with a small mean-squaredeviation of 0.11. The example illustrated in PBMA in Figure1B has a larger variation over time, which is typical of thebehavior in PBMA, as compared with PMMA at roomtemperature. The molecule in this trace can be characterizedby <r> = 0.14, over the entire observation time, with a mean-square deviation of 0.28, but its behavior more greatlyresembles a diffusion-type trajectory. Still molecule in Figure1B depicts another frequent behavior: a change betweendifferent dynamic ranges. Around 1600 s, there is a suddenslowing down of the fluctuation for 100 s, after which thedynamics recovers its previous behavior. Also, at 3300 s, theorientation and the mobility of the molecule changes suddenlyin the observation time domain: from a situation that can bedescribed by <r> = 0.23 and mean-square displacement of 0.26(at t < 3300 s) to an orientation characterized by <r> = −0.19and a mean-square displacement of 0.12 (at t > 3300 s). Thismeans that at 3300 s the cage experienced a majorrearrangement. This change is much rarer than the frequentreorientations around an essentially constant average value.This type of behavior is more often found in PBMA than inPMMA at room temperature.Figure 2 shows two quite different behaviors in PBMA. On
one side is molecule A with large anisotropy fluctuations (<r(t)> = 0.10 ± 0.33). On the other side is molecule B, with smallanisotropy fluctuations around a mean value (<r(t)> = −0.29 ±0.09). This demonstrates the existence of very rigid environ-
Figure 1. Single-molecule polarized emission intensity and anisotropytime traces of NR in 200 nm films of PMMA (A) and PBMA (B). Aand B upper panels show I∥ (blue line), GI⊥ (red line), and operativetotal intensity (I∥ + 2GI⊥; black line) is expressed in counts/100 ms.The bottom panels show the corresponding anisotropy. For themolecule in panel A, the anisotropy calculation is performed untilphotobleaching occurs. Panels C and D show the frequency histogramfor the anisotropy of molecules in panels A and B, respectively.
Figure 2. Emission anisotropy time traces for two Nile Red molecules(A and B) in a 200 nm PBMA film.
The Journal of Physical Chemistry A Article
dx.doi.org/10.1021/jp500272y | J. Phys. Chem. A XXXX, XXX, XXX−XXXC
ments and others with a very high mobility as a result of spatialheterogeneity.The two last examples described are typical of what in
polymer environments is commonly referred to as timeheterogeneity (change in the dynamics of a single cage,molecule in Figure 1B) and spatial heterogeneity (differentdynamics in different locations, Figure 2).A common way to investigate fluctuations in SM experiments
is to use autocorrelation functions.38,40 However, this methodrequires measurements containing several thousands ofsucceeding data points taken during the time of investigation.In our experiments, acquisition of sufficient data points wasprevented by photobleaching. For this reason, we calculate thesquare of the difference in anisotropy of successive determi-nations along the time traces and compute the complementarycumulative distribution function (CCDF), Φc(Δr2), as definedin eq 2 for the probability distribution function g(Δr2). Itexpresses the probability of observing an anisotropy changelarger than a certain absolute value,41,42 Δrk
∫Φ Δ = Δ ΔΔ
∞r g r r( ) ( ) dk
rc
2 2 2
k2 (2)
To statistically analyze the results, we gather all anisotropyvariations of all SMs detected in each polymer and for each filmthickness and build the corresponding Φc(Δr2). Figure 3 shows
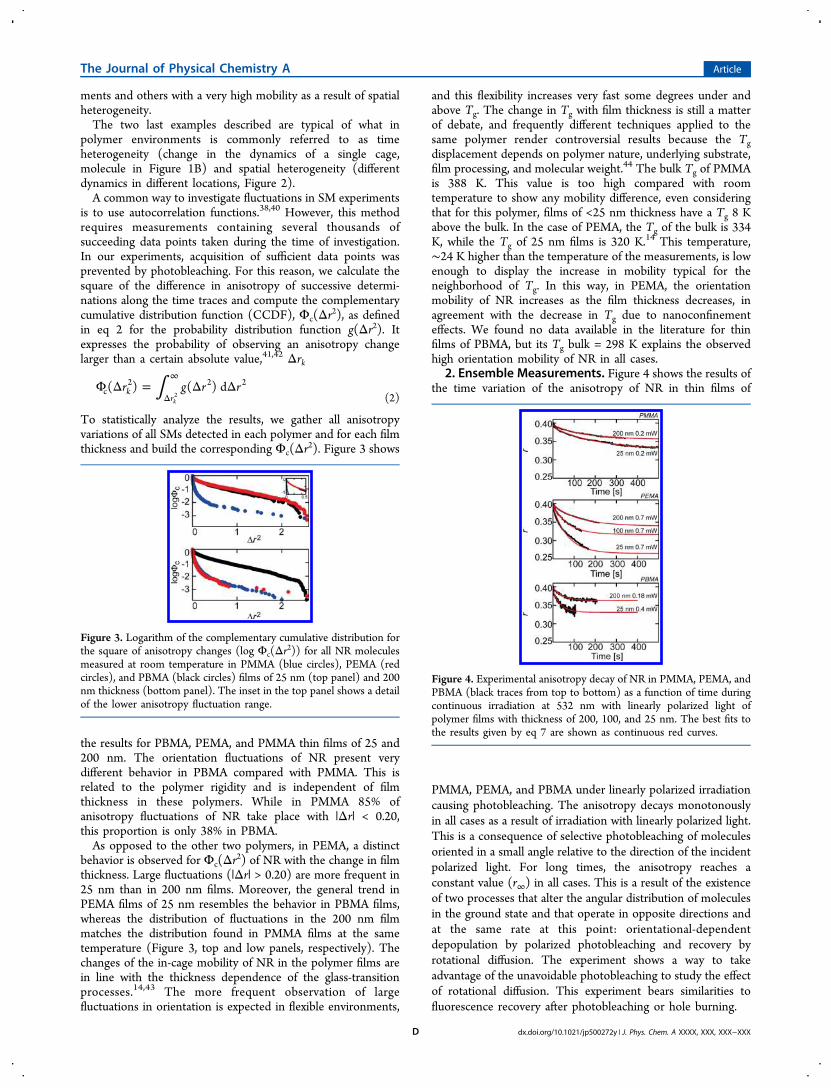
the results for PBMA, PEMA, and PMMA thin films of 25 and200 nm. The orientation fluctuations of NR present verydifferent behavior in PBMA compared with PMMA. This isrelated to the polymer rigidity and is independent of filmthickness in these polymers. While in PMMA 85% ofanisotropy fluctuations of NR take place with |Δr| < 0.20,this proportion is only 38% in PBMA.As opposed to the other two polymers, in PEMA, a distinct
behavior is observed for Φc(Δr2) of NR with the change in filmthickness. Large fluctuations (|Δr| > 0.20) are more frequent in25 nm than in 200 nm films. Moreover, the general trend inPEMA films of 25 nm resembles the behavior in PBMA films,whereas the distribution of fluctuations in the 200 nm filmmatches the distribution found in PMMA films at the sametemperature (Figure 3, top and low panels, respectively). Thechanges of the in-cage mobility of NR in the polymer films arein line with the thickness dependence of the glass-transitionprocesses.14,43 The more frequent observation of largefluctuations in orientation is expected in flexible environments,
and this flexibility increases very fast some degrees under andabove Tg. The change in Tg with film thickness is still a matterof debate, and frequently different techniques applied to thesame polymer render controversial results because the Tgdisplacement depends on polymer nature, underlying substrate,film processing, and molecular weight.44 The bulk Tg of PMMAis 388 K. This value is too high compared with roomtemperature to show any mobility difference, even consideringthat for this polymer, films of <25 nm thickness have a Tg 8 Kabove the bulk. In the case of PEMA, the Tg of the bulk is 334K, while the Tg of 25 nm films is 320 K.14 This temperature,∼24 K higher than the temperature of the measurements, is lowenough to display the increase in mobility typical for theneighborhood of Tg. In this way, in PEMA, the orientationmobility of NR increases as the film thickness decreases, inagreement with the decrease in Tg due to nanoconfinementeffects. We found no data available in the literature for thinfilms of PBMA, but its Tg bulk = 298 K explains the observedhigh orientation mobility of NR in all cases.
2. Ensemble Measurements. Figure 4 shows the results ofthe time variation of the anisotropy of NR in thin films of
PMMA, PEMA, and PBMA under linearly polarized irradiationcausing photobleaching. The anisotropy decays monotonouslyin all cases as a result of irradiation with linearly polarized light.This is a consequence of selective photobleaching of moleculesoriented in a small angle relative to the direction of the incidentpolarized light. For long times, the anisotropy reaches aconstant value (r∞) in all cases. This is a result of the existenceof two processes that alter the angular distribution of moleculesin the ground state and that operate in opposite directions andat the same rate at this point: orientational-dependentdepopulation by polarized photobleaching and recovery byrotational diffusion. The experiment shows a way to takeadvantage of the unavoidable photobleaching to study the effectof rotational diffusion. This experiment bears similarities tofluorescence recovery after photobleaching or hole burning.
Figure 3. Logarithm of the complementary cumulative distribution forthe square of anisotropy changes (log Φc(Δr2)) for all NR moleculesmeasured at room temperature in PMMA (blue circles), PEMA (redcircles), and PBMA (black circles) films of 25 nm (top panel) and 200nm thickness (bottom panel). The inset in the top panel shows a detailof the lower anisotropy fluctuation range.
Figure 4. Experimental anisotropy decay of NR in PMMA, PEMA, andPBMA (black traces from top to bottom) as a function of time duringcontinuous irradiation at 532 nm with linearly polarized light ofpolymer films with thickness of 200, 100, and 25 nm. The best fits tothe results given by eq 7 are shown as continuous red curves.
The Journal of Physical Chemistry A Article
dx.doi.org/10.1021/jp500272y | J. Phys. Chem. A XXXX, XXX, XXX−XXXD

■ DISCUSSION
For SMs, the analysis based on Φc(Δr2) shows differentmobility for different environments. The results demonstratethat SM anisotropy measurements allow for sensing changes ofin-cage mobility previous to the cooperative movements thatgive rise to glass transition.45,46 The increasing SM anisotropyfluctuations are the molecular level manifestation of theincrease in mobility that leads to the glass−rubber transition.Our results show that orientation fluctuation of SM is a goodspectroscopical indication at the microscopic level of thecooperative macroscopic changes. In a previous work, weobserved that spectral fluctuations were not able to sense thisdifference in the same polymer environments.35 We explain thisfact by assuming that spectral fluctuations depend on smallmovements of the dye in the polymer cage that slightly changethe distance between critically interacting probe and polymerfunctional groups. On the contrary, reorientation of NRrequires a concerted movement of the cage to accommodatethe dye in a different position. This rearrangement is moresensitive to the mobility of the polymer backbone responsiblefor the changes around Tg, as depicted in Scheme 2.
This result clearly shows the change in dynamical regime.Contrary to the calculation of correlations from individualfluorescence time traces, the probability distributions do notcontain information on individual time behavior, from which
rotational diffusion coefficients could be calculated. Aspreviously explained, we could not obtain reasonably longtime trajectories suitable for a time correlation analysis.However, as long as the molecular dipoles do show onlysmall angular changes within the employed time steps of 11 sbetween succeeding determinations of the orientation, theangular variations can be used to determine rotational diffusioncoefficients.11 The in-plane angular position α is derived as α =arctan(I⊥/I//)
1/2, for all molecules in the same type of polymerfilm to obtain the angular displacement Δα for the time intervalbetween successive measurements Δt = 11 s. The variations ofthis angle α are related to the rotational diffusion coefficient Dby
α<Δ > = ·ΔD t/(2 )2(3)
The values of D calculated in this way are given in Table 1.They follow the trend pointed out by Φc(Δr2) and comparewell with the respective values obtained from the ensemblemeasurements. (See later.)The ensemble experiments need a model that can
quantitatively account for the time-dependent behavior of thesteady-state anisotropy to obtain values for the photobleachingrate and for the rotational diffusion coefficient. To achieve this,we must make some assumptions that are explained in whatfollows.Photobleaching is assumed to be an irreversible single
photon process that carries the dye irreversibly to a dark state.Because the dye molecules are embedded in a rigid matrix, thelifetime of the excited state is much shorter than the mean time,at which a change in orientation occurs and therefore norotational diffusion takes place in the excited state, and amolecule emits the fluorescence photon in the same orientationas the absorption took place. Therefore, we are monitoringchanges in the orientation of the ground state. Moreover,because NR in all of these polymer films has a steady-stateanisotropy value very close to the limiting anisotropy of 0.4 in arandomly oriented sample, this confirms the absence ofsignificant depolarization in the excited state and shows thefact that absorption and emission dipoles are almost parallel.Under linearly polarized excitation, the absorption rate,
Ia(θ,t) is
θ σ θ θ= · · ·I t I N t( , ) ( , ) cosa 02
(4)
where σ is the absorption cross section for polarized excitation,I0 is the incident photon density per unit area and time, θ is theangle between polarization direction and the molecularabsorption dipole moment, and N(θ,t) is the instantaneousangular distribution of molecules in the ground state.
Scheme 2. Schematic Representation of NR Movements inthe Polymer Cage, Responsible for the Spectral Changes(Blue Vertical Arrow) and for the Rotational Reorientation(Curved Red Arrow)a
aPBMA is taken as representative structure.
Table 1. Parameters (τop and r∞) Obtained by Fitting the Experimental Ensemble Steady-State Anisotropy Decays withEquation 7 and Corresponding Values of D and Φ Computed by Using These Parameters with Equations 8 and 9a
polymer thickness [nm] τop [s] ±15% r∞ ± 0.005 D [× 10−3 s−1] ± 30% Φ [10−3 s−1] ± 30% ϕb [× 10−9] ± 30% DSM [× 10−3 s−1] ± 20%
PMMA 200 144 0.360 1.2 1.3 3 1.025 202 0.332 0.8 1.4 3 0.8
PEMA 200 124 0.340 1.4 2.1 6 0.9100 70 0.321 2.7 5.4 15 nd25 69 0.260 2.2 7.3 20 6.9
PBMA 200 44 0.361 4.3 4.0 45 7.125 36 0.330 5.4 9.1 43 6.7
aThe quantum yield ϕb is derived as ϕb = Φ/I0σ (σRN = 4.2 × 10⁻¹⁶ cm2 and I0 was between (2 and 8) × 1020 photons·cm−2·s−1; analyzed area: 60μm2). Values of the rotational diffusion coefficient calculated from the single-molecule experiments are given in column DSM.
The Journal of Physical Chemistry A Article
dx.doi.org/10.1021/jp500272y | J. Phys. Chem. A XXXX, XXX, XXX−XXXE

Considering a photobleaching that takes place after singlephoton absorption with a quantum yield ϕb and the knownequation for rotational diffusion,34 the rate expression forN(θ,t) can be written as
θ ϕ σ θ θ
θ θθ θ
θ
θ θ
θ θθ θ
θ
∂∂
= − · · · ·
+ ∂∂
· ∂∂
= −Φ ·
+ ∂∂
· ∂∂
⎡⎣⎢
⎛⎝⎜
⎞⎠⎟⎤⎦⎥
⎡⎣⎢
⎛⎝⎜
⎞⎠⎟⎤⎦⎥
N tt
I N t
DN t
N t
DN t
( , )cos ( , )
1sin
. sin( , )
cos ( , )
1sin
. sin( , )
b 02
2
(5)
where Φ = I0σϕb. Note the fact that no dependence in theother orientation angle ϕ exists because of the cylindricalsymmetry of the excitation−emission geometry. Given thenature of the dye used in this work,47 we can assume isotropicrotational diffusion (i.e., a scalar diffusion coefficient). To solvethis equation, we consider a solution in the form of a series
∑θ θ= ·=
∞
N t C t P( , ) ( ) (cos )l
l l0 (6)
where Pl are the Legendre polynomials of l order and Cl aretime-dependent coefficients. By using the recurrence relationsfor the Legendre polynomials, we arrive to a system of lineardifferential equations for the coefficients Cl. (See the SI forfurther development.)The solution to the system is straightforward with numerical
software. The series expansion of eq 6 must be truncatedconsidering a proper amount of coefficients for an adequatedescription of the experimental results, fixing the dimension ofthe system of equations for the coefficients Cl. We found outthat using 16 terms in the series expansion was sufficient todescribe the results with adequate accuracy. The initialcondition was a homogeneous distribution, giving an initialvalue of 0.4 for the anisotropy. Determination of the set of Cl(eq 6) will allow us to determine N(θ,t) and from it the time-dependent steady-state anisotropy. (See the SI.)The fit of experimental data to the solution of eq 5 with two
adjustable parameters, D and Φ, and an initial condition r (t =0) = 0.4 is not straightforward. In what follows, we propose asimplified method overcoming the fit to the integral equation;instead, the data are fitted to an equivalent and simpler,operative expression. For this, we built a large set of curves bysystematically varying D and Φ in adequate intervals. In Figure5, some of these curves are shown. They have three common
features: (1) r(t) decays until both processes, photobleachingand reorientations, are balanced, rendering a constant r∞; (2)sets of curves with constant ratio D/Φ have the same r∞ value,and the lower the value of D/Φ, the lower r∞; and (3) thesmaller the value of D, r(t) decays more slowly.The results in Figure 5 suggest a simple anisotropy time
dependence with the following functional dependence:
τ= − · − +∞ ∞r t r t r( ) (0.4 ) exp( / )op (7)
The fitting parameters r∞ and τop, are operative values thatmust be related to the parameters of the model: D and Φ. Toobtain the relation between these sets of parameters, weperformed the fit to eq 7 of the decays obtained by solving eq 5
(Figure 5). This procedure renders the correlations of Figure 6that can be represented by the following relationships:
Φ= ±
−+ ±
∞
Dr
(0.038 0.001)0.4
(0.040 0.001)(8)
τ= ± − × ± ×− − −D (0.20 0.04)
1(2 10 1 10 ) s
op
4 4 1
(9)
Equations 8 and 9 can be used to obtain D and Φ by fitting thesteady-state anisotropy decays to eq 7 (the red full lines ofFigure 4 were obtained in this way), a much simpler procedurethan performing the integration of eq 5. The results of thisprocedure are presented in Table 1. The proposed model ofsingle-photon photobleaching and isotropic dye rotations is ingood agreement with the experimental anisotropy decays.ϕb values reported in literature for fluorophores used
frequently in SM experiments (for Rhodamines: R6G, R123,and TMR) are in the range 10−4 to 10−9,48 and our results forNR are between 10−7 and 10−9, indicating the good stability ofthis dye in poly(alkyl methacrylates). In PBMA, NR shows thehighest photobleaching quantum yield, while in PMMA itdisplays the lowest, independent of film thickness. Thistendency parallels the trend in D and in O2 permeability inthe polymers. ϕb can be expressed as
ϕτ
τ=+
≈k
kk
[O ][O ] 1/
[O ]bR 2
R 2 00 R 2
(10)
where kR is the reactive rate constant of the dye with oxygenand τ0 is the dye’s excited-state lifetime. The diffusion-limitedencounters of dye and oxygen establish the upper limit for thereactive rate constant
π= · · ·k N d D4R A O2 (11)
Figure 5. Calculated steady-state anisotropy decays from numericalintegration of eq 5 for different values of D/Φ. Dotted lines havevalues of D and Φ 10 times smaller than the corresponding full linewhile keeping D/Φ constant. Parameters: D/Φ = 2.0: solid line, D =0.02, Φ = 0.01; dotted line, D = 0.002; Φ = 0.001. D/Φ = 1.0: solidline, D = 0.02, Φ = 0.02; dotted line, D = 0.002, Φ = 0.002. D/Φ = 0.5:solid line, D = 0.01, Φ = 0.02; dotted line, D = 0.001, Φ = 0.002.
Figure 6. Correlation between the parameters of eqs 5 and 7. In thelower panel: open squares, D/Φ = 0.5; full circles, D/Φ = 1.0; and fulltriangles, D/Φ = 2.0.
The Journal of Physical Chemistry A Article
dx.doi.org/10.1021/jp500272y | J. Phys. Chem. A XXXX, XXX, XXX−XXXF

in which d is the distance between the centers of the speciesforming the encounter complex and DO2 is the diffusioncoefficient of molecular oxygen.The permeability, P, is defined as the product of the sorption
coefficient, S, and the diffusion coefficient: P = SD. If weassume that [O2] in the polymer is proportional to the oxygenpartial pressure, then pO2,[O2] = S·pO2 and
π π= · · · · = · · · ·k N d D N d P p[O ] 4 [O ] 4 OR 2 A O2 2 A 2 (12)
This proportionality between kR and P of oxygen in thepolymer was experimentally previously found.49 So thephotobleaching quantum yield is also proportional to P. Thisparameter decreases with polarity increase for molecular oxygenbut also with the difference between T and Tg at T < Tg.
50
Furthermore, the magnitude of P = 5.2 × 10⁻²⁰ mol/(cm s Pa)(for PMMA at room temperature) predicts a values of ϕb of theorder of 8 × 10⁻⁷ under atmospheric conditions (pO2 = 21kPa) for an excited-state lifetime of 1 ns and d = 1 nm. ForPEMA, P for oxygen is 4.0 × 10⁻¹⁹ mol/(cm s Pa), leading toϕb on the order of 6 × 10⁻⁶ under the same conditions. Sooxygen permeability can explain the trend in ϕb as well as itsbroad variability, and these facts point to the presence of O2 inthe matrix as the principal agent in the photobleaching reaction.The rotational diffusion coefficient obtained from ensemble
measurements agrees in its tendency from what can be deducedfrom the SM experiments of Figure 3. Moreover, thequantitative agreement between the two types of experimentsis quite good. For the three most rigid films: PMMA of 25 and200 nm and for PEMA of 200 nm, the agreement is excellent.In this case, the angular fluctuations are small enough tosupport calculations using the projection angle instead of the3D fluctuation.11 For the most flexible films, the agreement isnot so good. In PBMA, the values of D derived from SMexperiments are ca. 50% higher than the ones obtained from theensemble measurements. In PEMA of 25 nm thickness, thevalue of D obtained from SM experiments is similar to the valuein PBMA, as the curves in Figure 3 show, but it is a factor ofthree higher than the value derived from the ensemblemeasurements. Nevertheless, the tendency to less rigidenvironments as the polymer film thickness decreases inPEMA is shown in both types of measurements. The rotationaldiffusion coefficient derived for the 100 nm film in PEMA fitsvery well into this picture. The magnitude of the rotationaldiffusion coefficients measured for NR in poly-(alkymethacrylates) is of the expected order, literature reportsgive D = 10−4 s−1 for 4-dimethylamino-4′-nitrostilbene inPMMA at 10 K below Tg,
19 D = 8.3 × 10⁻³ s−1 for a perylenediimide in poly(methyl acrylate) at 294 K,11 D = 1.9 × 10⁻³ s−1
for Rhodamine B in poly(vinylacetate) at the Tg (305 K),20 and
D = 73 × 10−3 s−1 for a BODIPY dye in poly(methyl acrylate)at 285 K (3 K above Tg for the sample).21
A drawback in the ensemble model we developed concernsits neglect of the heterogeneous nature of polymer samples,which is evident in the SM measurements. The data,nevertheless, show this heterogeneous nature. This isrepresented in Figure 7, where the ensemble steady-stateanisotropy decay is represented and fitted to eq 7 in the sameexperiment but restricting the analysis to different time intervalscovering the photobleaching of 70 and 90% of the total initialemission intensity. When different proportions of molecules arephotobleached in the same sample, the calculated D and Φvalues vary. In the example discussed, D and Φ are 21 × 10−3
s−1 and 10 × 10−8, 6.5 × 10⁻³ s−1 and 5.3 × 10⁻⁸, and 4.3 ×
10−3 s−1 and 4.5 × 10⁻⁸, for 70, 80 (data not shown), and 90%photobleaching, respectively. D decreases when the photo-bleached population proportion increases. This fact can beexplained by the differences in the polymer cage flexibilitybrought to light by SM experiments. At the beginning of theexperiments, molecules with fast and slow dynamics set theensemble D value. Under continuous irradiation, moleculeswith fast rotational dynamics and the slow ones that liepreferentially oriented with the direction of the linearlypolarized electromagnetic field are more likely to be photo-bleached than the others. This selective bleaching based onrotational motion is the origin of the observed decrease in theensemble average value of D, as the experiment progresses.This conclusion was also found in rotational correlation timestudies of rubrene in polystyrene films.51 The change inphotobleaching quantum yield follows the same tendency, andthis can also be explained by the lower mobility of oxygen inthe remaining more rigid sites.
■ CONCLUSIONSWe have conducted two different types of experiments withNR-doped poly(alkyl methacrylate) films of nanometricthickness: SM and ensemble measurements. The twoapproaches converge to confirm a complete picture of thetime and spatial heterogeneous dynamics typical of the polymerglassy state: as in previous works, the present results confirmthat spatial heterogeneity is more important than timeheterogeneity. This is the most important contribution of theSM experiments, which also give a quantitative hint of the valueof the rotational diffusion coefficient. For rigid polymers, SMexperiments yield even qualitative rotational diffusion coef-ficients. Ensemble experiments provide a more trustful value ofthis parameter but lack the direct observation of heterogeneity,which is only insinuated through the analysis of different timeintervals. The remarkable point of this work is the quantitativecoincidence of ensemble and SM experiments. This confirmsthat SM experiments are dealing with representative ensemblesand that ensemble experiments can give apparent homoge-neous behaviors despite the underlying spatial and timeheterogeneity of the sample.Additionally, we develop a simple model to describe the
dynamics of the ensemble, which is simple to use, takesadvantage of the unavoidable photobleaching and shows a goodagreement with experiments, also allowing for retrieving bothrotation and bleaching parameters.
■ ASSOCIATED CONTENT*S Supporting InformationSolution of the differential equation for diffusion and polarizedphotobleaching and consideration of nonparallel absorptionand emission transition moments for this mathematical
Figure 7. Upper plots: Anisotropy decay of NR in PBMA of 200 nmfilm thickness after 70 and 90% photobleaching of the initial emissionsignal (dotted black points) and its corresponding fittings to eq 7(continuous red line). Bottom plots: fitting residuals. Laser power:0.18 mW at 532 nm.
The Journal of Physical Chemistry A Article
dx.doi.org/10.1021/jp500272y | J. Phys. Chem. A XXXX, XXX, XXX−XXXG

treatment. This material is available free of charge via theInternet at http://pubs.acs.org.
■ AUTHOR INFORMATIONCorresponding Authors*C.v.B.: [email protected]; Tel:+4937153133035*P.F.A.: [email protected] ; Tel:+541148995590.Present Address⊥A.C.: Leiden Institute of Physics, Leiden University, NielsBohrweg 2, 2333 CA Leiden, Netherlands.NotesThe authors declare no competing financial interest.
■ ACKNOWLEDGMENTSP.F.A. is a staff member of Carrera del Investigador Cientificofrom Consejo Nacional de Investigaciones Cientificas yTecnicas (CONICET, Argentina). B.A. performed her workwith doctoral fellowships from ANPCyT (Grant PICT 34193)and CONICET. The work was performed under financialsupport from UBA (grant 20020100100234), CONICET(grant 11220100100397), DAAD-MINCyT grant 0807, andDFG-FOR 877. We thank Mario Heidernatsch and StefanKrause (both TUC, Germany) for helpful discussions.
■ REFERENCES(1) Yu, Y.; Ikeda, T. Alignment Modulation of Azobenzene-Containing Liquid Crystal Systems by Photochemical Reactions. J.Photochem. Photobiol., C 2004, 5, 247−265.(2) Finkelmann, H.; Nishikawa, E.; Pereira, G. G.; Warner, M. A NewOpto-Mechanical Effect in Solid. Phys. Rev. Lett. 2001, 87, 15501−15504.(3) Richert, R. Evidence for Dynamic Heterogeneity near Tg from theTime-Resolved Inhomogeneous Broadening of Optical Line Shapes. J.Phys. Chem. B 1997, 101, 6323−6326.(4) Richert, R.; Heuer, A. Rate-Memory and Dynamic Heterogeneityof First-Order Reactions in a Polymer Matrix. Macromolecules 1997,30, 4038−4041.(5) Wei, C.-Y. J.; Kim, Y. H.; Darst, R. K.; Rossky, P. J.; Vanden Bout,D. A. The Origins of Non-Exponential Decay in Single MoleculeMeasurements of Rotational Dynamics. Phys. Rev. Lett. 2005, 95,173001−173005.(6) Myers, A. B.; Tchenio, P.; Moerner, W. E. In Advanced OpticalMethods for Ultrasensitive Detection; Fearey, B. L., Ed.; SPIE:Bellingham, WA, 1995; Vol. 2385, pp 103−114.(7) Barkai, E.; Jung, Y.; Silbey, R. Theory of Single-MoleculeSpectroscopy: Beyond the Ensemble Average. Annu. Rev. Phys. Chem.2004, 55, 457−507.(8) Ambrose, W. P.; Moerner, W. E. Fluorescence Spectroscopy andSpectral Diffusion of Single Impurity Molecules in a Crystal. Nature1991, 349, 225−227.(9) Vallee, R. A. L.; Cotlet, M.; Van Der Auweraer, M.; Hofkens, J.;Mullen, K.; De Schryver, F. C. Single Molecule Conformations Probe-Free Volume in Polymers. J. Am. Chem. Soc. 2004, 126, 2296−2297.(10) Schob, A.; Cichos, F.; Schuster, J.; von Borczyskowski, C.Reorientation and Translation of Individual Dye Molecules in aPolymer Matrix. Eur. Polym. J. 2004, 40, 1019−1026.(11) Adhikari, S.; Selmke, M.; Cichos, F. Temperature DependentSingle Molecule Rotational Dynamics in PMA. Phys. Chem. Chem.Phys. 2011, 13, 1849−1856.(12) Woll, D.; Braeken, E.; Deres, A.; De Schryver, F. C.; Uji-i, H.;Hofkens, J. Polymers and Single Molecule Fluorescence Spectroscopy,What Can We Learn? Chem. Soc. Rev. 2009, 38, 313−328.(13) Flier, B. M. I.; Baier, M. C.; Huber, J.; Mullen, K.; Mecking, S.;Zumbusch, A.; Woll, D. Heterogeneous Diffusion in Thin Polymer-
Films as Observed by High-Temperature Single Molecule Fluo-rescence Microscopy. J. Am. Chem. Soc. 2012, 134, 480−488.(14) Priestley, R. D.; Mundra, M. K.; Barnett, N. J.; Broadbelt, L. J.;Torkelson, J. M. Effects of Nanoscale Confinement and Interfaces onthe Glass Transition Temperatures of a Series of Poly(n-methacrylate)Films. Aust. J. Chem. 2007, 60, 765−771.(15) Keddie, J. L.; Jones, R. A. L.; Cory, R. A. Size-DependentDepression of the Glass Transition Temperature in Polymer Films.Europhys. Lett. 1994, 27, 59−64.(16) Jackson, C. L.; McKenna, G. B. The Glass Transition of OrganicLiquids Confined to Small Pores. J. Non-Cryst. Solids 1991, 131−133,221−224.(17) Ha, T.; Glass, J.; Enderle, T.; Chemla, D. S.; Weiss, S. HinderedRotational Diffusion and Rotational Jumps of Single Molecules. Phys.Rev. Lett. 1998, 80, 2093−2096.(18) Zondervan, R.; Kulzer, F.; Berkhout, G. C. G.; Orrit, M. LocalViscosity of Supercooled Glycerol Near Tg Probed by RotationalDiffusion of Ensembles and Single Dye Molecules. Proc. Natl. Acad.Sci. U.S.A. 2007, 104, 12628−12633.(19) Liu, L.-Y.; Ramkrishna, D.; Lackritz, H. S. Rotational BrownianMotion of Chromophores and Electric Field Effects in Polymer Filmsfor Second Order Nonlinear Optics. Macromolecules 1994, 27, 5987−5999.(20) Bingemann, D.; Allen, R. M.; Olesen, S. W. Single MoleculesReveal the Dynamics of Heterogeneities in a Polymer at the GlassTransition. J. Chem. Phys. 2011, 134, 024513.(21) Hinze, G.; Basche, T.; Vallee, R. A. L. Single Molecule Probingof Dynamics in Supercooled Polymers. Phys. Chem. Chem. Phys. 2011,13, 1813−1818.(22) Harms, G. S.; Sonnleitner, M.; Schutz, G. J.; Gruber, H. J.;Schmidt, T. Single-Molecule Anisotropy Imaging. Biophys. J. 1999, 77,2864−2870.(23) Paeng, K.; Swallen, S. F.; Ediger, M. D. Direct Measurement ofMolecular Motion in Freestanding Polystyrene Thin Films. J. Am.Chem. Soc. 2011, 133, 8444−8447.(24) Habuchi, S.; Oba, T.; Vacha, M. Multi-Beam Single-MoleculeDefocused Fluorescence Imaging Reveals Local Anisotropic Nature ofPolymer Thin Films. Phys. Chem. Chem. Phys. 2011, 13, 7001−7007.(25) Borner, R.; Kowerko, D.; Krause, S.; von Borczyskowski, C.;Hubner, C. G. Efficient Simultaneous Fluorescence Orientation,Spectrum, and Lifetime Detection for Single Molecule Dynamics. J.Chem. Phys. 2012, 137, 164202−11.(26) Jung, C.; Hellriegel, C.; Platschek, B.; Wohrle, D.; Bein, T.;Michaelis, J.; Brauchle, C. Simultaneous Measurement of Orientationaland Spectral Dynamics of Single Molecules in Nanostructured Host-Guest Materials. J. Am. Chem. Soc. 2007, 129, 5570−5579.(27) Ruiter, A. G. T.; Veerman, J. A.; Garcia-Parajo, M. F.; van Hulst,N. F. Single Molecule Rotational and Translational DiffusionObserved by Near-Field Scanning Optical Microscopy. J. Phys.Chem. A 1997, 101, 7318−7323.(28) Weston, K. D.; Goldner, L. S. Orientation Imaging andReorientation Dynamics of Single Dye Molecules. J. Phys. Chem. B2001, 105, 3453−3462.(29) Deres, A.; Floudas, G. A.; Mullen, K.; Van der Auweraer, M.; DeSchryver, F.; Enderlein, J.; Uji-i, H.; Hofkens, J. The Origin ofHeterogeneity of Polymer Dynamics near the Glass Temperature AsProbed by Defocused Imaging. Macromolecules 2011, 44, 9703−9709.(30) Ellison, C. J.; Mundra, M. K.; Torkelson, J. M. Impacts ofPolystyrene Molecular Weight and Modification to the Repeat UnitStructure on the Glass Transition−Nanoconfinement Effect and theCooperativity Length Scale. Macromolecules 2005, 38, 1767−1778.(31) DeMaggio, G.; Frieze, W.; Gidley, D.; Zhu, M.; Hristov, H.; Yee,A. Interface and Surface Effects on the Glass Transition in ThinPolystyrene Films. Phys. Rev. Lett. 1997, 78, 1524−1527.(32) Molski, A. Statistics of the Bleaching Number and the BleachingTime in Single-Molecule Fluorescence Spectroscopy. J. Chem. Phys.2001, 114, 1142−1147.(33) Favro, L. D. Theory of the Rotational Brownian Motion of aFree Rigid Body. Phys. Rev. Lett. 1960, 119, 53−62.
The Journal of Physical Chemistry A Article
dx.doi.org/10.1021/jp500272y | J. Phys. Chem. A XXXX, XXX, XXX−XXXH

(34) Tao, T. Time-Dependent Fluorescence Depolarization andBrownian Rotational Diffusion Coefficients of Macromolecules.Biopolymers 1969, 8, 609−632.(35) Araoz, B.; Tauber, D.; von Borczyskowski, C.; Aramendía, P. F.Cage Effect in Poly(alkyl methacrylate) Thin Films Studied by NileRed Single Molecule Fluorescence Spectroscopy. J. Phys. Chem. C2012, 116, 7573−7580.(36) The polarized intensities I// and I⊥ define the orientation of theprojection of the molecular transition dipole moment on the plane ofthe sample. The resulting in-plane angle α, which we define arbitrarilywith respect to the parallel direction, is the only one that can bedetermined in our experiment. It is related to the anisotropy by: tan2 α= I⊥/I// = (1 − r)/(1 + 2r). The operative advantage of using theanisotropy is that its value is restricted to the interval −0.5 ≤ r ≤ 1,whereas tan2 α can take any real value.(37) Suhling, K.; Siegel, J.; Lanigan, P. M.; Leveque-Fort, S.; Webb, S.E.; Phillips, D.; Davis, D. M.; French, P. M. Time-ResolvedFluorescence Anisotropy Imaging Applied to Live Cells. Opt. Lett.2004, 29, 584−586.(38) Gensch, T.; Bohmer, M.; Aramendía, P. F. Single MoleculeBlinking and Photobleaching Separated by Wide-Field FluorescenceMicroscopy. J. Phys. Chem. A 2005, 109, 6652−6658.(39) Gaussf; Delft Image Processing Library. http://www.diplib.org/.(40) Vallee, R. A.; Rohand, T.; Boens, N.; Dehaen, W.; Hinze, G.;Basche, T. Analysis of the Exponential Character of Single MoleculeRotational Correlation Functions for Large and Small FluorescenceCollection Angles. J. Chem. Phys. 2008, 128, 154515.(41) Hellriegel, C.; Kirstein, J.; Brauchle, C.; Latour, V.; Pigot, T.;Olivier, R.; Lacombe, S.; Brown, R.; Guieu, V.; Payrastre, C.; et al.Diffusion of Single Streptocyanine Molecules in the NanoporousNetwork of Sol-Gel Glasses. J. Phys. Chem. B 2004, 108, 14699−14709.(42) Krause, S.; Aramendia, P. F.; Tauber, D.; von Borczyskowski, C.Freezing Single Molecule Dynamics on Interfaces and in Polymers.Phys. Chem. Chem. Phys. 2011, 13, 1754−1761.(43) Ellison, C. J.; Torkelson, J. M. The Distribution of Glass-Transition Temperatures in Nanoscopically Confined Glass Formers.Nat. Mater. 2003, 2, 695−700.(44) Tress, M.; Erber, M.; Mapesa, E. U.; Huth, H.; Muller, J.;Serghei, A.; Schick, C.; Eichhorn, K.-J.; Voit, B.; Kremer, F. GlassyDynamics and Glass Transition in Thin Polymer Layers of PMMADeposited on Different Substrates. Macromolecules 2010, 43, 9937−9944.(45) Zheng, Z.; Kuang, F.; Zhao, J. Direct Observation of RotationalMotion of Fluorophores Chemically Attached to Polystyrene in ItsThin Films. Macromolecules 2010, 43, 3165−3168.(46) Uji-i, H.; Melnikov, S. M.; Deres, A.; Bergamini, G.; DeSchryver, F.; Herrmann, A.; Mullen, K.; Enderlein, J.; Hofkens, J.Visualizing Spatial and Temporal Heterogeneity of Single MoleculeRotational Diffusion in a Glassy Polymer by Defocused Wide-FieldImaging. Polymer 2006, 47, 2511−2518.(47) Dutt, G. B.; Doraiswamy, S.; Periasamy, N.; Venkataraman, B.Rotational Reorientation Dynamics of Polar Dye Molecular Probes byPicosecond Laser Spectroscopic Technique. J. Chem. Phys. 1990, 93,8498−8513.(48) Eggeling, C.; Widengren, J.; Rigler, R.; Seidel, C. A. M.Photobleaching of Fluorescent Dyes under Conditions Used forSingle-Molecule Detection: Evidence of Two-Step Photolysis. Anal.Chem. 1998, 70, 2651−2659.(49) Mondal, R.; Shah, B. K.; Neckers, D. C. Determination ofOxygen Permeability of Polymers Using In-Situ Photo-GeneratedHeptacene. J. Photochem. Photobiol., A 2007, 192, 36−40.(50) Kaczmarek, H.; Kaminska, A.; Herk, A. PhotooxidativeDegradation of Poly (Alkyl Methacrylate)s. Eur. Polym. J. 2000, 36,767−777.(51) Wang, C.-Y.; Ediger, M. D. Lifetime of Spatially HeterogeneousDynamic Domains in Polystyrene Melts. J. Chem. Phys. 2000, 112,6933−6937.
The Journal of Physical Chemistry A Article
dx.doi.org/10.1021/jp500272y | J. Phys. Chem. A XXXX, XXX, XXX−XXXI


![Rotational energy relaxation quantum dynamics of a …The rotational energy relaxation (RER) of a molecule X 2( j,m j)ina 4He superfluid nanodroplet [HeND or (4He) N; T = 0.37 K] has](https://img.pdfslide.us/doc/110x75/5f0f5e3a7e708231d443cff8/rotational-energy-relaxation-quantum-dynamics-of-a-the-rotational-energy-relaxation.jpg)

![WELCOME [] · 2020. 3. 3. · • A molecule scatters light because it is polarizable. Hence the gross selection rule for a molecule to give a rotational Raman spectrum is that the](https://img.pdfslide.us/doc/110x75/60f6923acbb0d861741af185/welcome-2020-3-3-a-a-molecule-scatters-light-because-it-is-polarizable.jpg)