Embed Size (px)
Citation preview
See discussions, stats, and author profiles for this publication at: https://www.researchgate.net/publication/262416398
Influence of Temperature on Tire-Pavement Friction: Analyses
Article in Transportation Research Record Journal of the Transportation Research Board · February 2014
DOI: 10.3141/2369-13
CITATIONS
18READS
3,402
4 authors:
Some of the authors of this publication are also working on these related projects:
Pavement Engineering and Management View project
EFFECT OF POLYMER FIBRE ADDITION ON WARM MIX ASPHALT MECHANICAL RESPONSES View project
Santosh KUMAR Srirangam
Delft University of Technology
27 PUBLICATIONS 104 CITATIONS
SEE PROFILE
Kumar Anupam
Delft University of Technology
46 PUBLICATIONS 164 CITATIONS
SEE PROFILE
Tom Scarpas
Delft University of Technology
91 PUBLICATIONS 629 CITATIONS
SEE PROFILE
Cor Kasbergen
Delft University of Technology
80 PUBLICATIONS 555 CITATIONS
SEE PROFILE
All content following this page was uploaded by Santosh KUMAR Srirangam on 18 June 2015.
The user has requested enhancement of the downloaded file.
114
Transportation Research Record: Journal of the Transportation Research Board, No. 2369, Transportation Research Board of the National Academies, Washington, D.C., 2013, pp. 114–124.DOI: 10.3141/2369-13
K. Anupam, Room 6.60; S. K. Srirangam, Room 6.62; and C. Kasbergen, Pro-gram of Mechanics of Infrastructure Materials, Section of Structural Mechanics, and A. Scarpas, Civil Engineering and Geosciences, Delft University of Technol-ogy, Stevinweg 1, 2628 CN Delft, Netherlands. Corresponding author: S. K. Srirangam, [email protected].
texture. A theory presented by Sakai and Araki states that, under severe conditions of the sliding of tire rubber, tremendous heat is generated at the tire–pavement contact region, which forms a thin film of melting asphalt and rubber (2). This film virtually destroys development of any adhesive forces. Consequently, the mechanism of adhesion is unlikely to play any important role in the develop-ment of tire–pavement friction forces. Hence, the hysteretic or bulk internal friction predominantly accounts for tire–pavement frictional drag (1, 3, 4). Tire materials with large damping coefficients will also have a high coefficient of friction because of increased hysteretic friction (5). The hysteretic component of friction depends mainly on the rubber stiffness, which decreases with an increase in tire temperature (6).
A significant effect of AT on the variation of friction values was observed by past researchers (7–11). Hill and Henry developed a model to account for short- and long-term seasonal temperature effects on frictional measurements and drew a similar conclusion (12). Oliver suggested that air temperatures and PTs would determine the tire rubber temperature, which ultimately affects the viscoelastic properties of rubber (13).
Both AT and pavement surface temperature play significant roles in influencing frictional properties (14). Past researchers suggested consideration of the effect of frictional heating generated by the interaction of a tire with the pavement macrotexture while frictional properties are being evaluated (15, 16). Elkin et al. found that skid resistance is lowest in summer and highest in spring, regardless of the type of pavement mix (17). Yandell and Sawyer demonstrated the effect of pavement texture shape on hysteresis friction (18). Researchers studied the effect of PT on frictional properties of hot-mix asphalt pavement surfaces (19, 20). Wang and Flintsch studied the surface friction and texture properties of asphalt pavement sections in relation to temperature and time effects (21). Their investigation confirmed that environmental factors exerted a significant effect on the seasonal variations of pavement surface friction.
Tire slip condition has a major influence on temperature develop-ment in a tire and a resulting effect on friction (4). Different testing devices used by various road agencies around the globe operate under different slip conditions. For example, the widely used locked-wheel skid trailer measures friction at a 100% slip ratio (full skidding), whereas fixed-slip devices typically operate at a slip ratio of 15% to 20% and variable-slip devices at 15% to 85%. Grosch hypothe-sized that, with an increase in slip ratio, tire temperature increases and causes peak longitudinal friction to decrease (4). The past studies cited here showed that a correlation exists between fric-tion and temperature. A finite element (FE) thermomechanical friction model of a partially skidding tire tool, as developed by the
Influence of Temperature on Tire–Pavement FrictionAnalyses
K. Anupam, S. K. Srirangam, A. Scarpas, and C. Kasbergen
Past experimental studies show that tire–pavement friction values are related to conditions surrounding the tire such as pavement tempera-ture, ambient temperature, contained air temperature, and surface characteristics of the pavement. For measurements taken in different temperature conditions, road agencies generally apply correction factors. These correction factors are based primarily on experience and previ-ous field test measurements that have very limited transferability under different conditions. This paper studies frictional behavior of test tires under different surrounding temperature conditions using finite element analysis. The scope of this research is to analyze the effect of pavement temperature, ambient temperature, and contained air temperature on frictional measurements. Finite element analysis of fully and partially skidding tires over different asphalt pavement sur-faces, namely, porous asphalt, ultrathin surface, and stone mastic asphalt, is considered. Observation showed that a higher pavement temperature, ambient temperature, and contained air temperature resulted in a lower hysteretic friction for a given pavement surface and a given tire slip ratio. In contrast, a lower tire slip ratio and a pave-ment with higher macrotexture resulted in higher friction. This study highlights that a critical combination of these factors will decrease friction significantly.
The recommendations highway agencies propose for safety against skidding are typically either based on past experience or derived from friction measurements. To the best of the authors’ knowledge, not much attention has been paid to analysis of the effect of temperature on tire–pavement friction measurements. The purpose of this paper is to present the effect of pavement temperature (PT), ambient tempera-ture (AT), and contained air temperature (CAT)—the temperature of the air inside the tire’s air chamber—on tire–pavement frictional behavior.
Tire–pavement friction is mainly the result of two sources of energy dissipation: adhesion and hysteresis (1). Adhesive friction results from the attractive binding forces between the rubber surface and the substrate. Hysteretic friction is the result of damping losses and energy dissipation of the rubber excited by the pavement macro-
Anupam, Srirangam, Scarpas, and Kasbergen 115
authors, was used to analyze the effect temperature on friction for this paper (22–24).
SCOPE OF STUDY
The dissipation of energy attributable to a continuous loading and unloading cycle of the tire is determined by imposing a phase lag between the strain and the stress fields. Through use of the developed FE simulation model, this study presents a detailed analysis for evaluating the effect of surrounding temperatures on hysteretic friction (23). The scope of this paper is to analyze the effects of
1. PT, AT, and CAT on hysteretic friction,2. Different asphalt pavement macrotextures on the hysteretic
frictional response of the corresponding pavement interface, and3. Different tire slip ratios on hysteretic friction.
Model Parameters
This research involves a parametric study of various factors asso-ciated with hysteretic friction of a tire slipping over an asphalt pavement surface. For ease of presentation, a constant inflation pressure of 200 kPa and a constant velocity of 70 km/h for a PIARC (World Road Association) 165R15 (25) tire were used in this study. A tire rolling at 20%, 86%, and 100% slip ratios was simulated to analyze the effects of different friction equipment that operates at different slip ratio conditions. X-ray computed tomography scans of three surfaces, namely, porous asphalt (PA), ultrathin surface (UTS), and stone mastic asphalt (SMA) were selected to act as pavement surfaces. The tire stiffness and properties of the tire rubber material were obtained via laboratory tests. Pavement surface morphology, applied boundary conditions, and other factors considered in the model are described elsewhere (23).
Past experimental work shows that AT and PT are interdependent parameters that are correlated to tire temperature. In general, AT and PT are dependent on several other factors such as humidity, wind, and other local environmental factors. Hence, a universal relationship between AT and PT is difficult to establish. For this reason, in this study, AT and PT were considered independent parameters. A wide range of AT and PT was covered in the analysis. Some of the combinations, such as AT of 40°C and PT of 0°C, might be trivial in practice, but they are considered solely for research purposes. As a result, for any given type of pavement surface texture and tire slip ratio, the model was analyzed for AT values from 0°C to 40°C and PT values from 0°C to 60°C. In general, CAT is 14°C to 16°C more than the outside AT if correct inflation pressure is maintained for the given normal load (26). Accordingly, a wide practical range of CAT, from AT + 10°C to AT + 20°C was considered.
Description of FE Model
A brief description of the thermomechanical FE model that uses the ABAQUS tool (22) developed by the authors follows (23). As a first step of modeling, laboratory wheel load tests were performed to get the overall response of the tire. On the basis of the laboratory test
data, a basic model of a rolling tire on smooth pavement interaction was developed. Then lab tests were conducted to get the rheological properties of the tire rubber at different temperatures. The viscoelastic properties of rubber as a function of temperature were provided as input to the model.
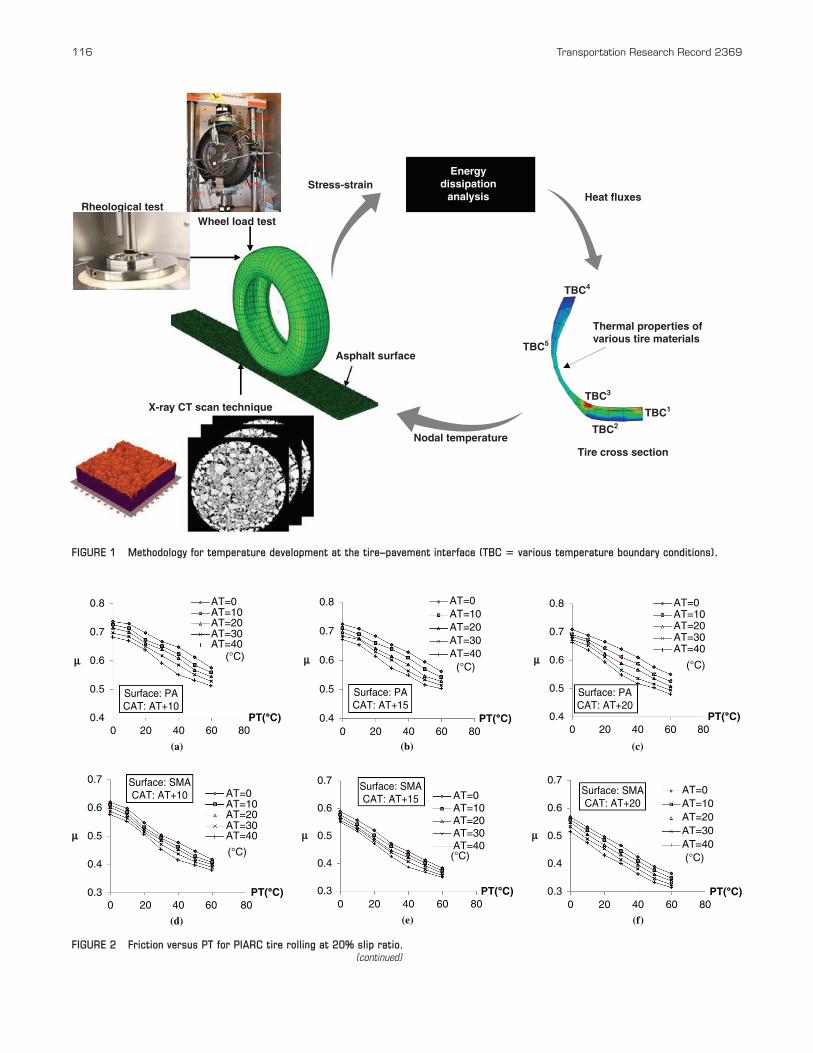
As a second step, a sequential analysis of static (for a smooth surface) to dynamic (for slipping over a rough surface) followed by a staggered temperature analysis was performed. In this analysis, the smooth rolling tire at a specified slip ratio is made to roll over a rough pavement surface in a transient framework. The profile of the rough pavement surface is obtained by means of an X-ray computed tomography scan technique. By using the energy dissipation rates from the model as input, a heat transfer analysis is performed in a staggered manner and the temperature development in the various components of the tire is computed. The rubber viscoelastic prop-erties are changed in relation to the nodal temperatures obtained from the heat transfer analysis. The temperature inputs for the pave-ment, ambient air, and contained air are varied in accordance with the requirement. Finally, the mechanical module of the model is invoked to calculate the hysteretic friction of the tire. A schematic diagram of the methodology is shown in Figure 1. The model was duly validated with past experimental findings (27).
RESULTS AND DISCUSSION
Analyses of the effects of temperature on hysteretic friction are pre-sented here. AT, PT, CAT, surface texture, and tire slip ratio are varied in a practical range, and the effects of these factors are evaluated on the hysteretic friction.
Effect of PT on Hysteretic Friction
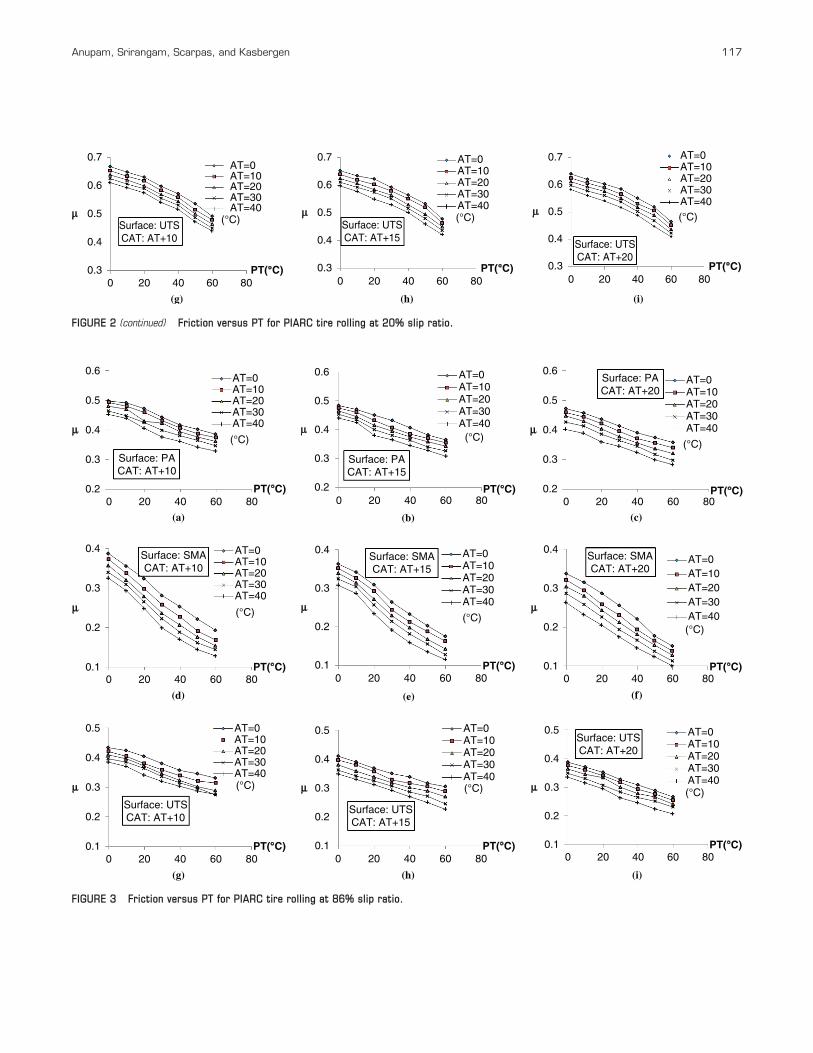
This subsection discusses the effect of PT on the hysteretic friction, with the computed results shown in Figure 2. For constant AT and CAT, the hysteretic friction decreases with an increase in PT for all the cases analyzed. For example, as Figure 2a shows, a 60°C increase in PT decreases the friction from 0.74 to 0.58 at a constant AT of 0°C. This decrease implies that the risk associated with the loss of braking traction is slightly more on pavements with higher temperatures. The friction values drops by 0.11 for an increase in PT from 0°C to 60°C, as shown in Figure 2, a to c.
Figure 2 also analyzes the relationship between the hysteretic friction and the PT for different pavement surfaces at a constant slip ratio of 20%. For the same increase in PT by 60°C, the average decrease in friction is observed to be 0.19 and 0.13 for SMA and UTS pavement surfaces, respectively. These changes imply that, with surrounding temperatures, the hysteretic friction decreases at a faster rate for an SMA pavement surface and then by a UTS and a PA, respectively. This sort of trend might be attributed to the fact that a pavement surface with a higher conduction coefficient leads to a higher tire temperature. This higher temperature in turn causes a greater hysteretic friction loss.
Different friction-measuring equipment operates at different slip conditions that may result in different temperature developments in the tire–pavement region. To make such a comparison, the same analysis was performed at different slip ratios, as shown in Figures 2 to 4. The plots of the corresponding figures show that the hysteretic friction decreases with an increase in PT for all slip ratios. However, the magnitude of decrement is on the order of the increasing slip ratio.
116 Transportation Research Record 2369
Wheel load test Rheological test
X-ray CT scan technique
Tire cross section
Thermal properties of various tire materials
TBC1
Asphalt surface
Energydissipation
analysis
Nodal temperature
Stress-strain
TBC2
TBC3
TBC4
TBC5
Heat fluxes
FIGURE 1 Methodology for temperature development at the tire–pavement interface (TBC 5 various temperature boundary conditions).
PT(°C)
µ
0.8
0.7
0.6
0.5
0.40 20 40 60 80
AT=0AT=10AT=20AT=30AT=40
(°C)
Surface: PACAT: AT+10
(a)
µ
PT(°C)0.3
0.7
0.6
0.5
0.4
0 20 40 60 80
AT=0AT=10AT=20AT=30AT=40
(°C)
Surface: SMACAT: AT+10
(d)
PT(°C)
µ
0.8
0.7
0.6
0.5
0.40 20 40 60 80
AT=0AT=10AT=20AT=30AT=40
(°C)
Surface: PACAT: AT+15
(b)
µ
PT(°C)0.3
0.7
0.6
0.5
0.4
0 20 40 60 80
AT=0AT=10AT=20AT=30AT=40(°C)
Surface: SMACAT: AT+15
(e)
PT(°C)
µ
0.8
0.7
0.6
0.5
0.4
(c)
0 20 40 60 80
AT=0AT=10AT=20AT=30AT=40
(°C)
Surface: PACAT: AT+20
µ
PT(°C)0.3
0.7
0.6
0.5
0.4
(f)
0 20 40 60 80
AT=0AT=10AT=20AT=30AT=40(°C)
Surface: SMACAT: AT+20
FIGURE 2 Friction versus PT for PIARC tire rolling at 20% slip ratio.(continued)
Anupam, Srirangam, Scarpas, and Kasbergen 117
FIGURE 2 (continued) Friction versus PT for PIARC tire rolling at 20% slip ratio.
µ
PT(°C)0.3
0.7
0.6
0.5
0.4
0 20 40 60 80
AT=0AT=10AT=20AT=30AT=40
(°C)Surface: UTSCAT: AT+10
(g)
µ
PT(°C)0.3
0.7
0.6
0.5
0.4
0 20 40 60 80
AT=0AT=10AT=20AT=30AT=40(°C)
Surface: UTSCAT: AT+15
(h)
µ
PT(°C)0.3
0.7
(i)
0.6
0.5
0.4
0 20 40 60 80
AT=0AT=10AT=20AT=30AT=40(°C)
Surface: UTSCAT: AT+20
PT(°C)
µ
0.6
0.5
0.4
0.3
0.20 20 40 60 80
AT=0AT=10AT=20AT=30AT=40
(°C)
Surface: PACAT: AT+10
(a)
µ
PT(°C)0.1
0.4
0.3
0.2
0 20 40 60 80
AT=0AT=10AT=20AT=30AT=40
(°C)
Surface: SMACAT: AT+10
(d)
µ
PT(°C)0.1
0.5
0.4
0.3
0.2
0 20 40 60 80
AT=0AT=10AT=20AT=30AT=40(°C)
Surface: UTSCAT: AT+10
(g)
PT(°C)
µ
0.6
0.5
0.4
0.3
0.20 20 40 60 80
AT=0AT=10AT=20AT=30AT=40
(°C)
Surface: PACAT: AT+15
(b)
0.4
µ
PT(°C)0.1
0.3
0.2
0 20 40 60 80
AT=0AT=10AT=20AT=30AT=40
(°C)
Surface: SMACAT: AT+15
(e)
µ
PT(°C)0.1
0.5
0.4
0.3
0.2
0 20 40 60 80
AT=0AT=10AT=20AT=30AT=40(°C)
Surface: UTSCAT: AT+15
(h)
PT(°C)
µ
0.6
0.5
0.4
0.3
0.20 20 40 60 80
(c)
AT=0AT=10AT=20AT=30AT=40
(°C)
Surface: PACAT: AT+20
µ
PT(°C)0.1
0.4
0.3
0.2
0 20 40 60 80
(f)
AT=0AT=10AT=20AT=30AT=40(°C)
Surface: SMACAT: AT+20
µ
PT(°C)0.1
0.5
0.4
0.3
0.2
0 20 40 60 80
(i)
AT=0AT=10AT=20AT=30AT=40(°C)
Surface: UTSCAT: AT+20
FIGURE 3 Friction versus PT for PIARC tire rolling at 86% slip ratio.
118 Transportation Research Record 2369
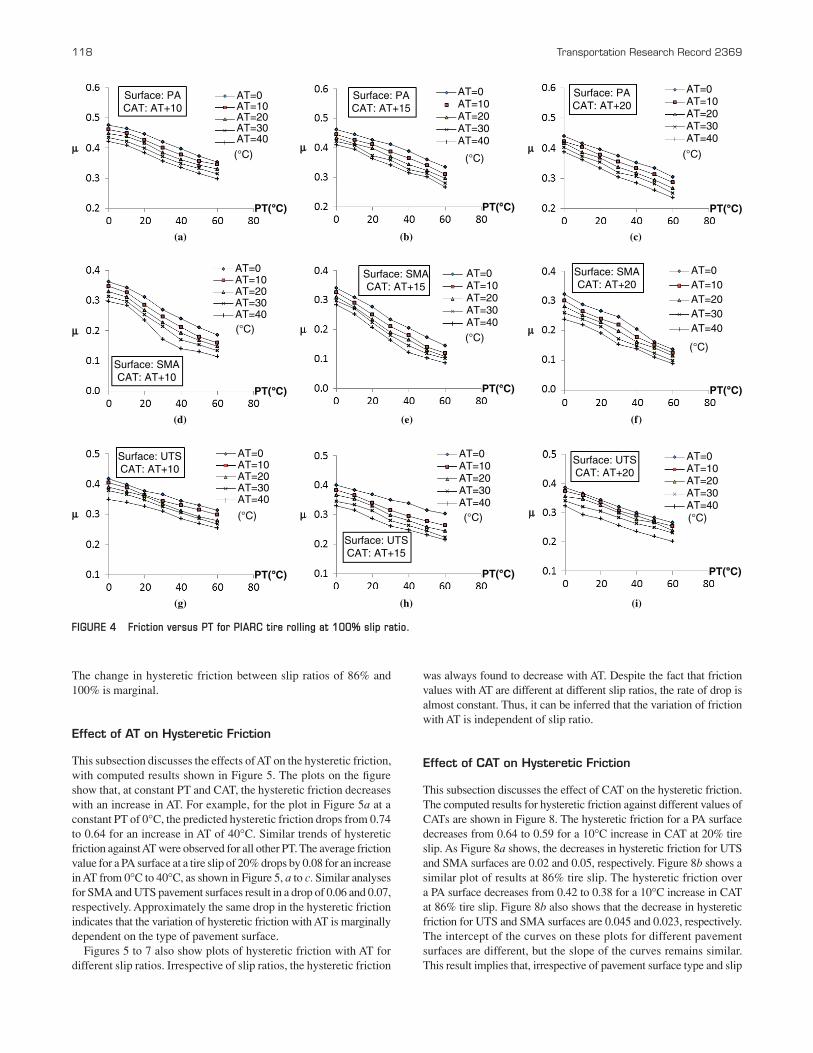
The change in hysteretic friction between slip ratios of 86% and 100% is marginal.
Effect of AT on Hysteretic Friction
This subsection discusses the effects of AT on the hysteretic friction, with computed results shown in Figure 5. The plots on the figure show that, at constant PT and CAT, the hysteretic friction decreases with an increase in AT. For example, for the plot in Figure 5a at a constant PT of 0°C, the predicted hysteretic friction drops from 0.74 to 0.64 for an increase in AT of 40°C. Similar trends of hysteretic friction against AT were observed for all other PT. The average friction value for a PA surface at a tire slip of 20% drops by 0.08 for an increase in AT from 0°C to 40°C, as shown in Figure 5, a to c. Similar analyses for SMA and UTS pavement surfaces result in a drop of 0.06 and 0.07, respectively. Approximately the same drop in the hysteretic friction indicates that the variation of hysteretic friction with AT is marginally dependent on the type of pavement surface.
Figures 5 to 7 also show plots of hysteretic friction with AT for different slip ratios. Irrespective of slip ratios, the hysteretic friction
was always found to decrease with AT. Despite the fact that friction values with AT are different at different slip ratios, the rate of drop is almost constant. Thus, it can be inferred that the variation of friction with AT is independent of slip ratio.
Effect of CAT on Hysteretic Friction
This subsection discusses the effect of CAT on the hysteretic friction. The computed results for hysteretic friction against different values of CATs are shown in Figure 8. The hysteretic friction for a PA surface decreases from 0.64 to 0.59 for a 10°C increase in CAT at 20% tire slip. As Figure 8a shows, the decreases in hysteretic friction for UTS and SMA surfaces are 0.02 and 0.05, respectively. Figure 8b shows a similar plot of results at 86% tire slip. The hysteretic friction over a PA surface decreases from 0.42 to 0.38 for a 10°C increase in CAT at 86% tire slip. Figure 8b also shows that the decrease in hysteretic friction for UTS and SMA surfaces are 0.045 and 0.023, respectively. The intercept of the curves on these plots for different pavement surfaces are different, but the slope of the curves remains similar. This result implies that, irrespective of pavement surface type and slip
PT(°C)
µ
AT=0AT=10AT=20AT=30AT=40
(°C)
Surface: PACAT: AT+10
(a)
µ
PT(°C)
AT=0AT=10AT=20AT=30AT=40(°C)
Surface: SMACAT: AT+10
(d)
µ
PT(°C)
AT=0AT=10AT=20AT=30AT=40
(°C)
Surface: UTSCAT: AT+10
(g)
PT(°C)
µ
AT=0AT=10AT=20AT=30AT=40
(°C)
Surface: PACAT: AT+15
(b)
µ
PT(°C)
AT=0AT=10AT=20AT=30AT=40(°C)
Surface: SMACAT: AT+15
(e)
µ
PT(°C)
AT=0AT=10AT=20AT=30AT=40(°C)
Surface: UTSCAT: AT+15
(h)
PT(°C)
µ
(c)
AT=0AT=10AT=20AT=30AT=40
(°C)
Surface: PACAT: AT+20
µ
PT(°C)
(f)
AT=0AT=10AT=20AT=30AT=40
(°C)
Surface: SMACAT: AT+20
µ
PT(°C)
(i)
AT=0AT=10AT=20AT=30AT=40(°C)
Surface: UTSCAT: AT+20
FIGURE 4 Friction versus PT for PIARC tire rolling at 100% slip ratio.

Anupam, Srirangam, Scarpas, and Kasbergen 119
PT(°C)
µ
PT=0 PT=10PT=20 PT=30PT=40 PT=50
(°C)
Surface: PACAT: AT+10
(a)
PT=0 PT=10PT=20 PT=30PT=40PT=60
PT=50
µ
PT(°C)
(°C)
(d)
Surface: SMA; CAT:AT+10
PT=0 PT=10PT=20 PT=30PT=40PT=60
PT=50
µ
PT(°C)
(°C)
(g)
Surface: UTS; CAT:AT+10
PT=0 PT=10PT=20 PT=30PT=40 PT=50
PT(°C)
µ
(°C)
Surface: PACAT: AT+15
(b)
PT=0 PT=10PT=20 PT=30PT=40PT=60
PT=50
µ
PT(°C)
(°C)
(e)
Surface: SMA; CAT:AT+15
PT=0 PT=10PT=20 PT=30PT=40PT=60
PT=50
µ
PT(°C)
(°C)
(h)
Surface: UTS; CAT:AT+15
PT=0 PT=10PT=20 PT=30PT=40PT=60
PT=50
PT(°C)
µ
(c)
(°C)
Surface: PACAT: AT+20
PT=0 PT=10PT=20 PT=30PT=40PT=60
PT=50
µ
PT(°C)
(f)
(°C)
Surface: SMA; CAT:AT+20
PT=0 PT=10PT=20 PT=30PT=40PT=60
PT=50
µ
PT(°C)
(i)
(°C)
Surface: UTS; CAT:AT+20
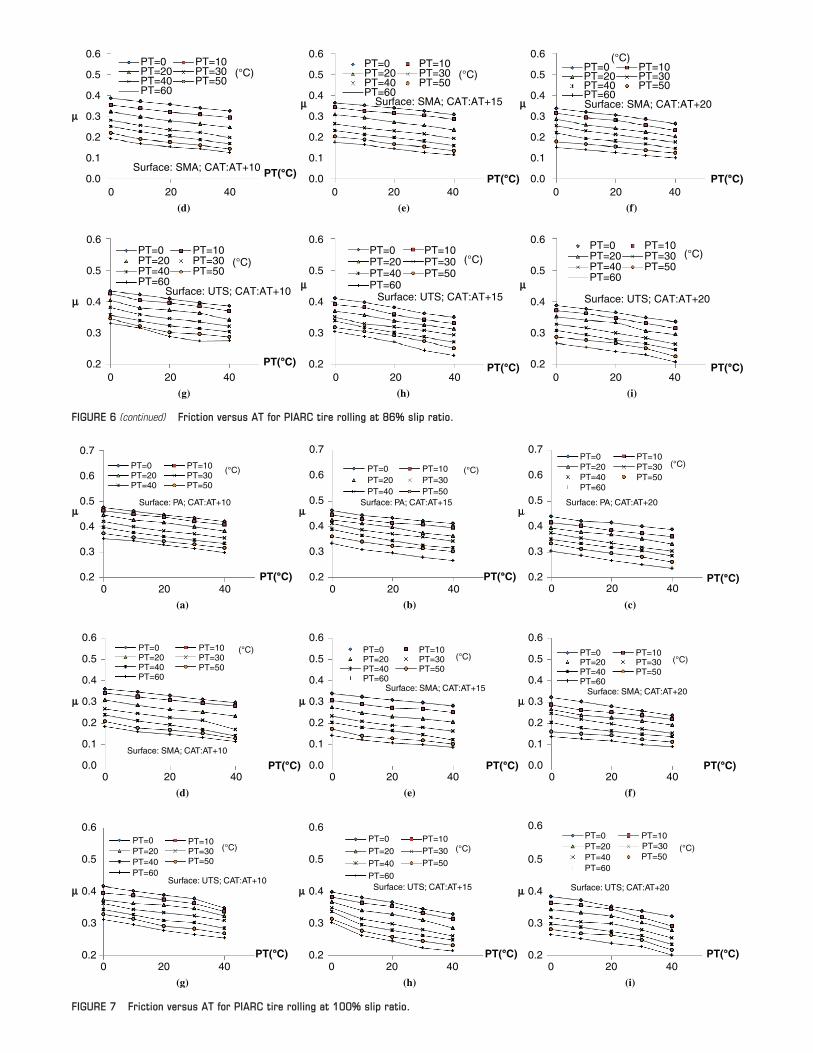
FIGURE 5 Friction versus AT for PIARC tire rolling at 20% slip ratio.
(a)
Surface: PA; CAT:AT+10
PT(°C)
µ
PT=00.7
0.6
0.5
0.4
0.3
0.20 20 40
PT=10PT=20 PT=30PT=40 PT=50
(°C)
°C)0 20 40
(b)
Surface: PA; CAT:AT+15
PT(
µ
0.7
0.6
0.5
0.4
0.3
0.2
PT=0 PT=10PT=20 PT=30PT=40 PT=50
(°C)
(c)
Surface: PA; CAT:AT+20
PT(°C)
µ
0.7
0.6
0.5
0.4
0.3
0.2
0.7
0.6
0.5
0.4
0.3
0.20 20 40
PT=0 PT=10PT=20 PT=30PT=40PT=60
PT=50(°C)
FIGURE 6 Friction versus AT for PIARC tire rolling at 86% slip ratio.(continued on next page)
(h)
(f)
(i)
Surface: SMA; CAT:AT+20
Surface: UTS; CAT:AT+15 Surface: UTS; CAT:AT+20
PT(°C)
PT(°C) PT(°C)
0.6
0.5
0.4
0.3
0.2
0.6
0.5
0.4
0.3
0.2
0.1
0.0
0.6
0.5
0.4
0.3
0.2
0 20 40
0 20 40 0 20 40
µ
µ µ
(d)
Surface: SMA; CAT:AT+10 PT(°C)
0.6
0.5
0.4
0.3
0.2
0.1
0.00 20 40
µ
PT=0 PT=10PT=20 PT=30PT=40PT=60
PT=50(°C)
(g)
Surface: UTS; CAT:AT+10
PT(°C)
0.6
0.5
0.4
0.3
0.20 20 40
µ
PT=0 PT=10PT=20 PT=30PT=40PT=60
PT=50(°C)
PT=0 PT=10PT=20 PT=30PT=40PT=60
PT=50(°C)
PT=0 PT=10PT=20 PT=30PT=40PT=60
PT=50(°C)
(e)
Surface: SMA; CAT:AT+15
PT(°C)
0.6
0.5
0.4
0.3
0.2
0.1
0.00 20 40
µ
PT=0 PT=10PT=20 PT=30PT=40PT=60
PT=50(°C)
PT=0 PT=10PT=20 PT=30PT=40PT=60
PT=50
(°C)
FIGURE 6 (continued) Friction versus AT for PIARC tire rolling at 86% slip ratio.
FIGURE 7 Friction versus AT for PIARC tire rolling at 100% slip ratio.
PT(°C) PT(°C)
(b) (c)
Surface: PA; CAT:AT+15 Surface: PA; CAT:AT+20µ
0.7
0.6
0.5
0.4
0.3
0.2
µ
0.7
0.6
0.5
0.4
0.3
0.20 20 40 0 20 40
PT(°C)
(°C)
(a)
(e) (f)(d)
(h) (i)(g)
Surface: PA; CAT:AT+10 µ
PT=0
0.7
0.6
0.5
0.4
0.3
0.20 20 40
PT=10PT=20 PT=30PT=40 PT=50
(°C)(°C)PT=0 PT=10
PT=20 PT=30PT=40 PT=50
PT=0 PT=10PT=20 PT=30PT=40PT=60
PT=50
(°C)
PT(°C) Surface: SMA; CAT:AT+10
µ
0 20 40
PT=0 PT=10PT=20 PT=30PT=40PT=60
PT=50
0.6
0.5
0.4
0.3
0.2
0.1
0.0
PT(°C)
Surface: UTS; CAT:AT+10
PT=0 PT=10PT=20 PT=30PT=40PT=60
PT=50
(°C)
0 20 40
µ
0.6
0.5
0.4
0.3
0.2
PT(°C)
Surface: SMA; CAT:AT+15
(°C)
0 20 40
PT=0 PT=10PT=20 PT=30PT=40PT=60
PT=50
PT(°C)
Surface: UTS; CAT:AT+15
0 20 40
µ
0.6
0.5
0.4
0.3
0.2
PT=0 PT=10PT=20 PT=30
PT=40PT=60
PT=50
µ
0.6
0.5
0.4
0.3
0.2
0.1
0.0
Surface: SMA; CAT:AT+20
0 20 40
(°C)
PT(°C)
Surface: UTS; CAT:AT+20
0 20 40
µ
0.6
0.5
0.4
0.3
0.2
PT=0 PT=10PT=20 PT=30PT=40PT=60
PT=50(°C)
PT=0 PT=10PT=20 PT=30PT=40PT=60
PT=50
µ
0.6
0.5
0.4
0.3
0.2
0.1
0.0 PT(°C)
(°C)

Anupam, Srirangam, Scarpas, and Kasbergen 121
ratios, the increase in CAT reduces the hysteretic friction by the same magnitude.
Effect of Pavement Surface Texture on Hysteretic Friction
The surface macrotexture of asphalt pavement varies with mix design. For better demonstration, a three-dimensional surface plot of hysteretic friction against AT and PT is presented in Figure 9, a to c. Closer examination of the results shows that the PA surface offers the most hysteretic friction and is followed by the UTS and SMA surfaces. The observed trend might be the result of the asphalt mix characteristics of PA, which possesses more macrotexture than the other two surfaces. This observation also highlights the importance of maintaining good pavement macrotexture.
The results for PA, UTS, and SMA surfaces are computed at a constant tire slip ratio of 20% and a constant CAT of AT + 15°C. For a PA surface, the hysteretic friction varies from 0.72 to 0.50 in the analyzed range of PT and AT. Under the same test conditions, UTS and SMA pavement surfaces produce a hysteretic friction in a range of 0.65 to 0.42 and 0.59 to 0.35, respectively.
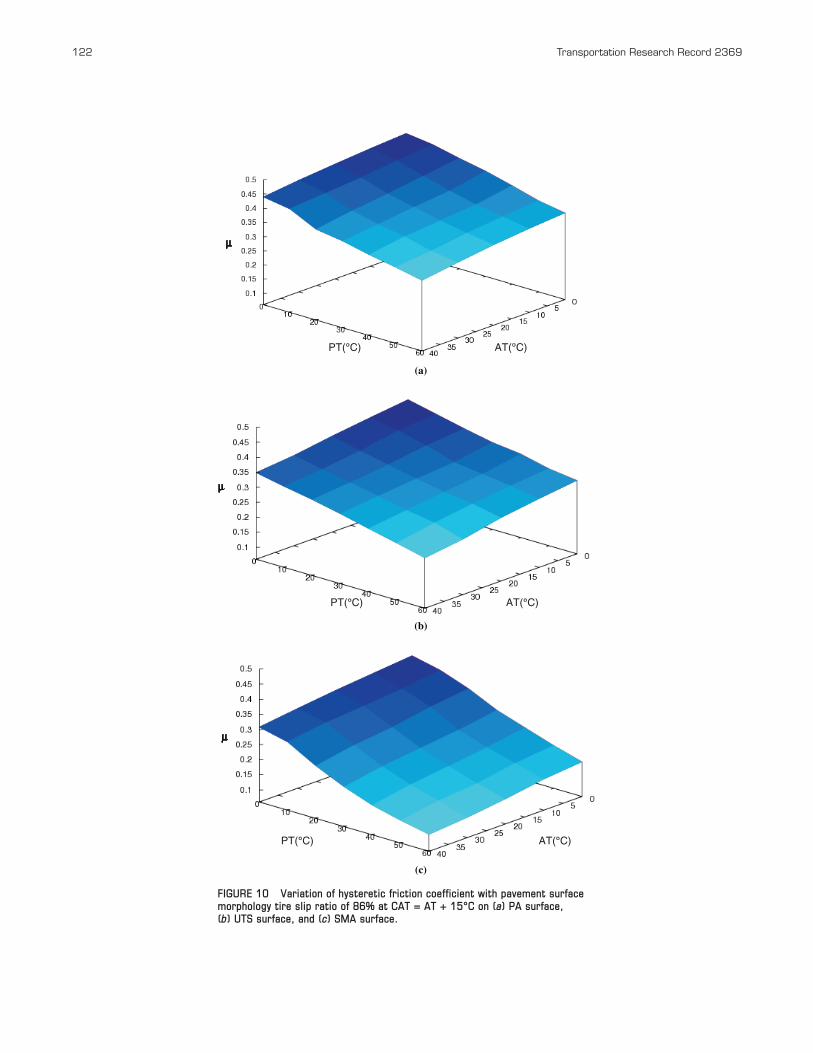
Effect of Tire Slip Conditions on Hysteretic Friction
The simulation model provides a useful tool for evaluating the effect of slip ratios on hysteretic friction. Discussion from previous sec-tions shows that only a marginal variation exists in the hysteretic friction values between 86% and 100% slip ratios. Figures 9 and 10 show that an 86% slip ratio provides a lower hysteretic friction than a 20% slip ratio. Lower friction values, which increase the probability of accidents, are observed at a near-locked-wheel condition. The results support the classical relationship between friction and slip ratio, which states that a decrease in the values of friction is continuous
CAT (°C)
0.80
0.70
0.60
0.50
0.40
0.30
0.20
0.1030 32 34 36 38 40
µ
PA
SMA
UTS
0.80
0.70
0.60
0.50
0.40
0.30
0.20
0.1030 32 34 36 38 40
CAT (°C)
µ
PA
SMA
UTS
(a)
(b)
FIGURE 8 Friction versus CAT for PIARC tire on PA, SMA, and UTS surfaces at 30°C PT and 20°C AT at (a) 20% slip ratio and (b) 86% slip ratio.
µ
PT(°C) AT(°C)
µ
PT(°C) AT(°C)
PT(°C) AT(°C)
µ
(a)
(b)
(c)
FIGURE 9 Variation of hysteretic friction coefficient with pavement surface morphology at tire slip ratio of 20% at CAT = AT + 15°C on (a) PA surface, (b) UTS surface, and (c) SMA surface.
122 Transportation Research Record 2369
µ
AT(°C)PT(°C)
µ
AT(°C)PT(°C)
AT(°C)
µ
PT(°C)
(a)
(b)
(c)
FIGURE 10 Variation of hysteretic friction coefficient with pavement surface morphology tire slip ratio of 86% at CAT = AT + 15°C on (a) PA surface, (b) UTS surface, and (c) SMA surface.
Anupam, Srirangam, Scarpas, and Kasbergen 123
above a 20% slip ratio. A wide range of hysteretic friction coefficients observed from the corresponding figures shows the need for harmo-nization of the various friction-measuring equipment, which operates at different slip ratios.
Relative Effects of PT, AT, CAT, Pavement Texture, and Slip Ratios
The analyses of results show that a higher PT, AT, and CAT would result in lower hysteretic friction for a given pavement surface and a given tire slip ratio. In contrast, a lower tire slip ratio and a pave-ment with higher macrotexture would result in higher friction for a given AT, PT, and CAT. A large variation in hysteretic friction shows that a critical combination of factors may decrease the friction values significantly. For example, the value of the friction coefficient is 0.74 for a tire slipping at 20% over a PA surface with PT and AT of 0°C and CAT of 10°C, and a tire slipping at 100% over an SMA surface with PT of 60°C, AT of 40°C, and CAT of 60°C would result in a friction coefficient of 0.1.
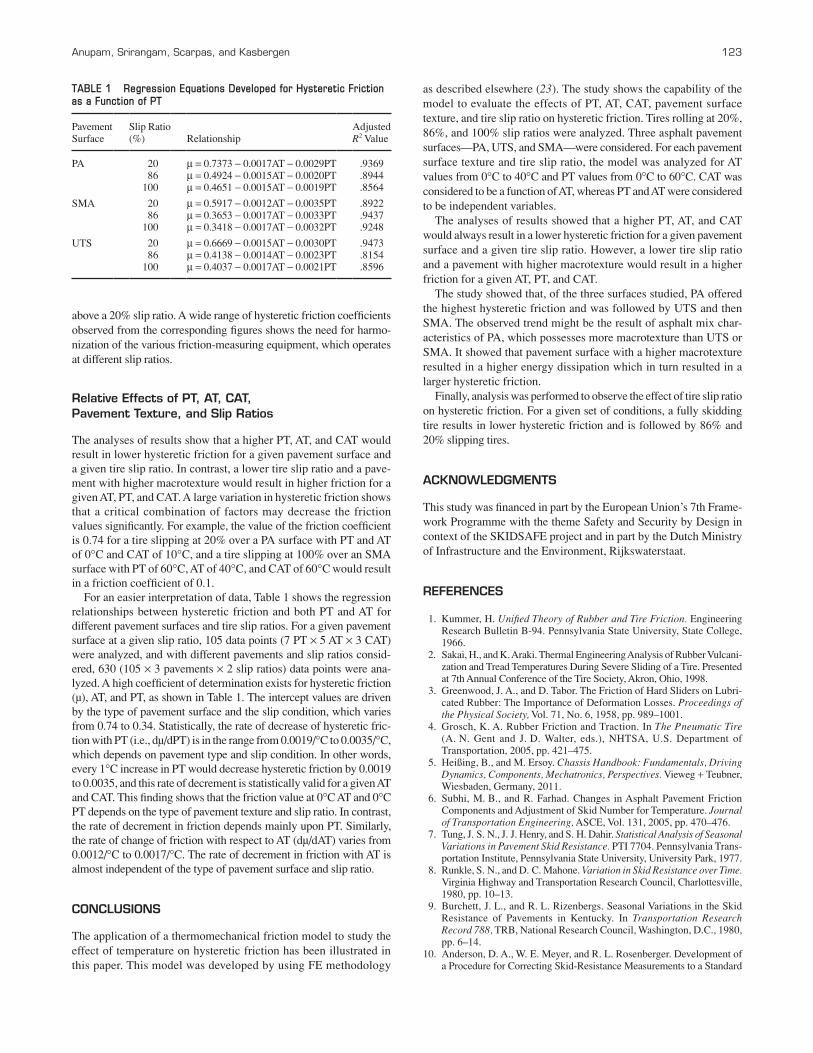
For an easier interpretation of data, Table 1 shows the regression relationships between hysteretic friction and both PT and AT for different pavement surfaces and tire slip ratios. For a given pavement surface at a given slip ratio, 105 data points (7 PT × 5 AT × 3 CAT) were analyzed, and with different pavements and slip ratios consid-ered, 630 (105 × 3 pavements × 2 slip ratios) data points were ana-lyzed. A high coefficient of determination exists for hysteretic friction (µ), AT, and PT, as shown in Table 1. The intercept values are driven by the type of pavement surface and the slip condition, which varies from 0.74 to 0.34. Statistically, the rate of decrease of hysteretic fric-tion with PT (i.e., dµ/dPT) is in the range from 0.0019/°C to 0.0035/°C, which depends on pavement type and slip condition. In other words, every 1°C increase in PT would decrease hysteretic friction by 0.0019 to 0.0035, and this rate of decrement is statistically valid for a given AT and CAT. This finding shows that the friction value at 0°C AT and 0°C PT depends on the type of pavement texture and slip ratio. In contrast, the rate of decrement in friction depends mainly upon PT. Similarly, the rate of change of friction with respect to AT (dµ/dAT) varies from 0.0012/°C to 0.0017/°C. The rate of decrement in friction with AT is almost independent of the type of pavement surface and slip ratio.
CONCLUSIONS
The application of a thermomechanical friction model to study the effect of temperature on hysteretic friction has been illustrated in this paper. This model was developed by using FE methodology
as described elsewhere (23). The study shows the capability of the model to evaluate the effects of PT, AT, CAT, pavement surface texture, and tire slip ratio on hysteretic friction. Tires rolling at 20%, 86%, and 100% slip ratios were analyzed. Three asphalt pavement surfaces—PA, UTS, and SMA—were considered. For each pavement surface texture and tire slip ratio, the model was analyzed for AT values from 0°C to 40°C and PT values from 0°C to 60°C. CAT was considered to be a function of AT, whereas PT and AT were considered to be independent variables.
The analyses of results showed that a higher PT, AT, and CAT would always result in a lower hysteretic friction for a given pavement surface and a given tire slip ratio. However, a lower tire slip ratio and a pavement with higher macrotexture would result in a higher friction for a given AT, PT, and CAT.
The study showed that, of the three surfaces studied, PA offered the highest hysteretic friction and was followed by UTS and then SMA. The observed trend might be the result of asphalt mix char-acteristics of PA, which possesses more macrotexture than UTS or SMA. It showed that pavement surface with a higher macrotexture resulted in a higher energy dissipation which in turn resulted in a larger hysteretic friction.
Finally, analysis was performed to observe the effect of tire slip ratio on hysteretic friction. For a given set of conditions, a fully skidding tire results in lower hysteretic friction and is followed by 86% and 20% slipping tires.
ACKNOWLEDGMENTS
This study was financed in part by the European Union’s 7th Frame-work Programme with the theme Safety and Security by Design in context of the SKIDSAFE project and in part by the Dutch Ministry of Infrastructure and the Environment, Rijkswaterstaat.
REFERENCES
1. Kummer, H. Unified Theory of Rubber and Tire Friction. Engineering Research Bulletin B-94. Pennsylvania State University, State College, 1966.
2. Sakai, H., and K. Araki. Thermal Engineering Analysis of Rubber Vulcani-zation and Tread Temperatures During Severe Sliding of a Tire. Presented at 7th Annual Conference of the Tire Society, Akron, Ohio, 1998.
3. Greenwood, J. A., and D. Tabor. The Friction of Hard Sliders on Lubri-cated Rubber: The Importance of Deformation Losses. Proceedings of the Physical Society, Vol. 71, No. 6, 1958, pp. 989–1001.
4. Grosch, K. A. Rubber Friction and Traction. In The Pneumatic Tire (A. N. Gent and J. D. Walter, eds.), NHTSA, U.S. Department of Transportation, 2005, pp. 421–475.
5. Heißing, B., and M. Ersoy. Chassis Handbook: Fundamentals, Driving Dynamics, Components, Mechatronics, Perspectives. Vieweg + Teubner, Wiesbaden, Germany, 2011.
6. Subhi, M. B., and R. Farhad. Changes in Asphalt Pavement Friction Components and Adjustment of Skid Number for Temperature. Journal of Transportation Engineering, ASCE, Vol. 131, 2005, pp. 470–476.
7. Tung, J. S. N., J. J. Henry, and S. H. Dahir. Statistical Analysis of Seasonal Variations in Pavement Skid Resistance. PTI 7704. Pennsylvania Trans-portation Institute, Pennsylvania State University, University Park, 1977.
8. Runkle, S. N., and D. C. Mahone. Variation in Skid Resistance over Time. Virginia Highway and Transportation Research Council, Charlottesville, 1980, pp. 10–13.
9. Burchett, J. L., and R. L. Rizenbergs. Seasonal Variations in the Skid Resistance of Pavements in Kentucky. In Transportation Research Record 788, TRB, National Research Council, Washington, D.C., 1980, pp. 6–14.
10. Anderson, D. A., W. E. Meyer, and R. L. Rosenberger. Development of a Procedure for Correcting Skid-Resistance Measurements to a Standard
TABLE 1 Regression Equations Developed for Hysteretic Friction as a Function of PT
Pavement Surface
Slip Ratio (%) Relationship
Adjusted R2 Value
PA 20 µ = 0.7373 − 0.0017AT − 0.0029PT .936986 µ = 0.4924 − 0.0015AT − 0.0020PT .8944
100 µ = 0.4651 − 0.0015AT − 0.0019PT .8564
SMA 20 µ = 0.5917 − 0.0012AT − 0.0035PT .892286 µ = 0.3653 − 0.0017AT − 0.0033PT .9437
100 µ = 0.3418 − 0.0017AT − 0.0032PT .9248
UTS 20 µ = 0.6669 − 0.0015AT − 0.0030PT .947386 µ = 0.4138 − 0.0014AT − 0.0023PT .8154
100 µ = 0.4037 − 0.0017AT − 0.0021PT .8596
124 Transportation Research Record 2369
End-of-Season Value. In Transportation Research Record 1084, TRB, National Research Council, Washington, D.C., 1984, pp. 40–48.
11. Jayawickrama, P. W., and B. Thomas. Correction of Field Skid Mea-surements for Seasonal Variations in Texas. In Transportation Research Record 1639, TRB, National Research Council, Washington, D.C., 1998, pp. 147–154.
12. Hill, B. J., and J. J. Henry. Surface Materials and Properties Related to Seasonal Variations in Skid Resistance: Pavement Surface Characteristics and Materials. Special Technical Publication 763, ASTM, Conshohocken, Pa., 1982.
13. Oliver, J. W. H. Seasonal Variation of Skid Resistance in Australia. Special Report 37, Australia Road Research Board, Vermont South, Victoria, 1989.
14. Hall, J. W., L. T. Glover, K. L. Smith, L. D. Evans, J. C. Wambold, Y. J. Yager, and Z. Rado. NCHRP Web Document 108: Guide for Pavement Friction. Transportation Research Board of the National Academies, 2009. http://onlinepubs.trb.org/onlinepubs/nchrp/nchrp_w108.pdf.
15. Grosch, K. A., and A. Schallamach. The Load Dependence of Laboratory Abrasion and Tire Wear. Rubber Chemistry and Technology, Vol. 43, No. 4, July 1970, pp. 701–713.
16. Grosch, K. A. The Relation Between the Friction and Viscoelastic Prop-erties of Rubber. Rubber Society London A, Vol. 274, No. 1356, 1963, pp. 21–39.
17. Elkin, B. L., K. J. Kercher, and S. Gullen. Seasonal Variation in Skid Resistance of Bituminous Surfaces in Indiana. In Transportation Research Record 777, TRB, National Research Council, Washington, D.C., 1980, pp. 50–58.
18. Yandell, W. O., and S. Sawyer. Prediction of Tire–Road Friction from Texture Measurements. In Transportation Research Record 1435, TRB, National Research Council, Washington, D.C., 1994, pp. 86–91.
19. Flintsch, G. W., Y. Luo, and I. L. Al-Qadi. Analysis of Effect of Pave-ment Temperature on Frictional Properties of Flexible Pavement Sur-faces. Presented at 84th Annual Meeting of the Transportation Research Board, Washington, D.C., 2005.
20. Luo, Y. Effect of Pavement Temperature on Frictional Properties of Hot-Mix-Asphalt Pavement Surfaces at the Virginia Smart Road. Master’s thesis. Virginia Polytechnic Institute and State University, Blacksburg, 2003.
21. Wang, H., and G. W. Flintsch. Investigation of Short- and Long-Term Variations of Pavement Surface Characteristics at the Virginia Smart Road. Presented at 86th Annual Meeting of the Transportation Research Board, Washington, D.C., 2007.
22. ABAQUS User’s Manual, Version 6.10. Abaqus, Pawtucket, R.I., 2010.23. Srirangam, S. K., K. Anupam, A. Scarpas, and C. Kasbergen. Devel-
opment of a Thermomechanical Tire–Pavement Interaction Model. International Journal of Pavement Engineering (forthcoming).
24. Srirangam, S. K., K. Anupam, A. Scarpas, and A. Köster. Influence of Temperature on Tire–Pavement Friction-1: Laboratory Tests and Finite Element Modeling. Presented at 92nd Annual Meeting of the Transporta-tion Research Board, Washington, D.C., 2013.
25. PIARC. International PIARC Experiment to Compare and Harmonize Texture and Skid Resistance Measurements. Technical Committee on Surface Characteristics, Paris, 1995.
26. Bridgestone Truck Tyre. Bridgestone. http://www.bridgestonetrucktires.com/publications/02v7iss1/ra8.asp. Accessed Nov. 10, 2012.
27. Ebbott, T. G., R. L. Hohman, J. P. Jeusette, and V. Kerchman. Tire Temperature and Rolling Resistance Prediction with Finite Element Analysis. Tire Science Technology, Vol. 27, 1999, pp. 2–21.
The Surface Properties–Vehicle Interaction Committee peer-reviewed this paper.
View publication statsView publication stats


![Friction Technology Ltd - Industrial Clutch · 2020. 9. 16. · Semi Semi 080623-03 Temperature ['CJ spac pressure [bar] friction TEST PROTOCOL FRICTION TEST BRAKE SYSTEM DATA PROCESSED](https://img.pdfslide.us/doc/110x75/613531a7dfd10f4dd73c3779/friction-technology-ltd-industrial-clutch-2020-9-16-semi-semi-080623-03-temperature.jpg)