Embed Size (px)
Citation preview
Influence of spatial inhomogeneity of tornadooccurrence on estimated tornado hazard
L. Tan and H.P. Hong
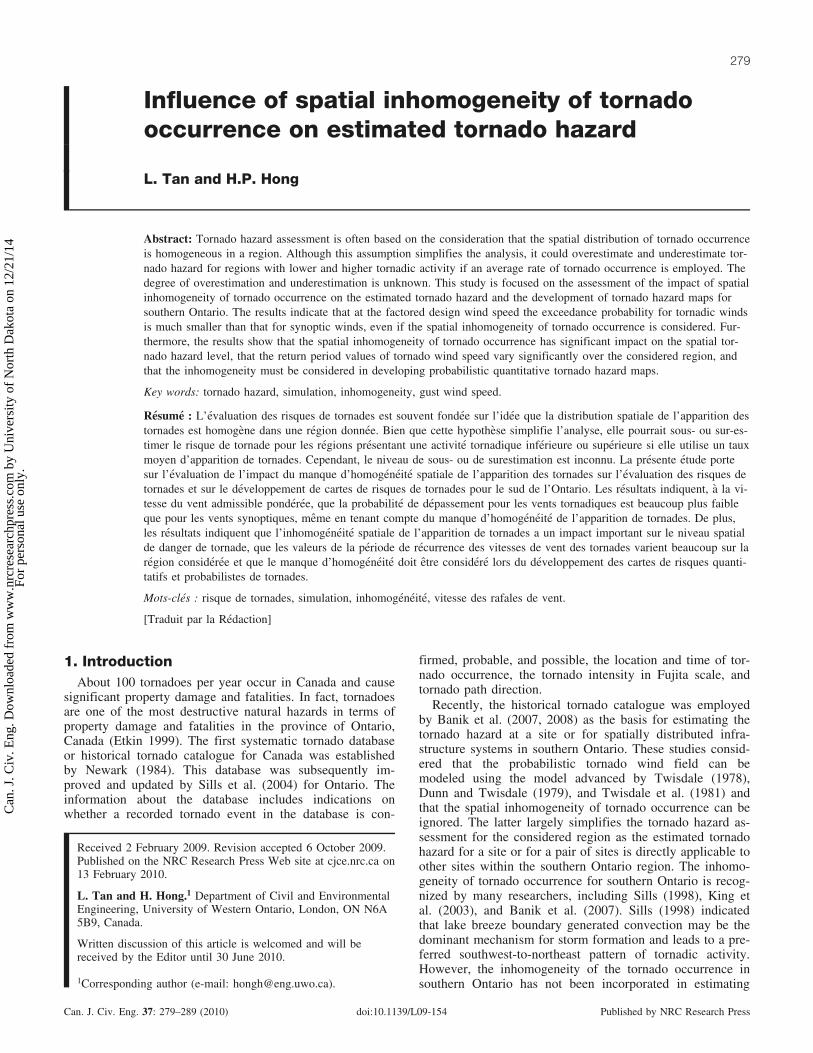
Abstract: Tornado hazard assessment is often based on the consideration that the spatial distribution of tornado occurrenceis homogeneous in a region. Although this assumption simplifies the analysis, it could overestimate and underestimate tor-nado hazard for regions with lower and higher tornadic activity if an average rate of tornado occurrence is employed. Thedegree of overestimation and underestimation is unknown. This study is focused on the assessment of the impact of spatialinhomogeneity of tornado occurrence on the estimated tornado hazard and the development of tornado hazard maps forsouthern Ontario. The results indicate that at the factored design wind speed the exceedance probability for tornadic windsis much smaller than that for synoptic winds, even if the spatial inhomogeneity of tornado occurrence is considered. Fur-thermore, the results show that the spatial inhomogeneity of tornado occurrence has significant impact on the spatial tor-nado hazard level, that the return period values of tornado wind speed vary significantly over the considered region, andthat the inhomogeneity must be considered in developing probabilistic quantitative tornado hazard maps.
Key words: tornado hazard, simulation, inhomogeneity, gust wind speed.
Resume : L’evaluation des risques de tornades est souvent fondee sur l’idee que la distribution spatiale de l’apparition destornades est homogene dans une region donnee. Bien que cette hypothese simplifie l’analyse, elle pourrait sous- ou sur-es-timer le risque de tornade pour les regions presentant une activite tornadique inferieure ou superieure si elle utilise un tauxmoyen d’apparition de tornades. Cependant, le niveau de sous- ou de surestimation est inconnu. La presente etude portesur l’evaluation de l’impact du manque d’homogeneite spatiale de l’apparition des tornades sur l’evaluation des risques detornades et sur le developpement de cartes de risques de tornades pour le sud de l’Ontario. Les resultats indiquent, a la vi-tesse du vent admissible ponderee, que la probabilite de depassement pour les vents tornadiques est beaucoup plus faibleque pour les vents synoptiques, meme en tenant compte du manque d’homogeneite de l’apparition de tornades. De plus,les resultats indiquent que l’inhomogeneite spatiale de l’apparition de tornades a un impact important sur le niveau spatialde danger de tornade, que les valeurs de la periode de recurrence des vitesses de vent des tornades varient beaucoup sur laregion consideree et que le manque d’homogeneite doit etre considere lors du developpement des cartes de risques quanti-tatifs et probabilistes de tornades.
Mots-cles : risque de tornades, simulation, inhomogeneite, vitesse des rafales de vent.
[Traduit par la Redaction]
1. IntroductionAbout 100 tornadoes per year occur in Canada and cause
significant property damage and fatalities. In fact, tornadoesare one of the most destructive natural hazards in terms ofproperty damage and fatalities in the province of Ontario,Canada (Etkin 1999). The first systematic tornado databaseor historical tornado catalogue for Canada was establishedby Newark (1984). This database was subsequently im-proved and updated by Sills et al. (2004) for Ontario. Theinformation about the database includes indications onwhether a recorded tornado event in the database is con-
firmed, probable, and possible, the location and time of tor-nado occurrence, the tornado intensity in Fujita scale, andtornado path direction.
Recently, the historical tornado catalogue was employedby Banik et al. (2007, 2008) as the basis for estimating thetornado hazard at a site or for spatially distributed infra-structure systems in southern Ontario. These studies consid-ered that the probabilistic tornado wind field can bemodeled using the model advanced by Twisdale (1978),Dunn and Twisdale (1979), and Twisdale et al. (1981) andthat the spatial inhomogeneity of tornado occurrence can beignored. The latter largely simplifies the tornado hazard as-sessment for the considered region as the estimated tornadohazard for a site or for a pair of sites is directly applicable toother sites within the southern Ontario region. The inhomo-geneity of tornado occurrence for southern Ontario is recog-nized by many researchers, including Sills (1998), King etal. (2003), and Banik et al. (2007). Sills (1998) indicatedthat lake breeze boundary generated convection may be thedominant mechanism for storm formation and leads to a pre-ferred southwest-to-northeast pattern of tornadic activity.However, the inhomogeneity of the tornado occurrence insouthern Ontario has not been incorporated in estimating
Received 2 February 2009. Revision accepted 6 October 2009.Published on the NRC Research Press Web site at cjce.nrc.ca on13 February 2010.
L. Tan and H. Hong.1 Department of Civil and EnvironmentalEngineering, University of Western Ontario, London, ON N6A5B9, Canada.
Written discussion of this article is welcomed and will bereceived by the Editor until 30 June 2010.
1Corresponding author (e-mail: [email protected]).
279
Can. J. Civ. Eng. 37: 279–289 (2010) doi:10.1139/L09-154 Published by NRC Research Press
Can
. J. C
iv. E
ng. D
ownl
oade
d fr
om w
ww
.nrc
rese
arch
pres
s.co
m b
y U
nive
rsity
of
Nor
th D
akot
a on
12/
21/1
4Fo
r pe
rson
al u
se o
nly.
the quantitative tornado wind hazards or hazard maps. Fur-thermore, it is noted that numerical simulations of meteoro-logical type for tornado-like vortices were given in Nolanand Farrell (1999), Nolan (2005), and Lewellen and Lewellen(2007), whereas Hangan and Kim (2006) developed a numer-ical model to represent the tornado wind field based on resultsfrom computational fluid dynamic simulations. However,none of these models is a probabilistic tornado wind fieldmodel that can be readily used to assess tornado hazard.
The main objective of the present study is to estimate thetornado hazard and to develop tornado hazard contour mapsfor southern Ontario considering the influence of the spatialinhomogeneity of tornado occurrence. For the assessment,similar to Banik et al. (2007), the tornado wind field modeldeveloped by Twisdale et al. (1981) is adopted. To copewith the need to estimate tornado hazard for many locationsand to reduce the computing time, the hazard estimation issimplified by separating the analysis into two parts: assess-ment of tornado striking rate and probability distribution ofmaximum wind speed for a given tornado striking intensity.Details of the analysis procedure and model as well as nu-merical results are provided in the following sections.
2. Wind hazard estimate with spatialinhomogeneity of tornado occurrence
2.1 Probabilistic model for tornado hazard assessmentA probabilistic model for tornado hazard assessment has
been presented in the literature (Wen and Chu 1973; Garsonet al. 1975; Twisdale et al. 1981; Banik et al. 2007) by as-suming that the tornado occurrence is homogeneous inspace, which simplifies the assessment for a region of inter-est. Furthermore, by assuming that the tornado occurrence intime follows a Poisson process and that the peak wind ve-locity for each tornado is independent and identically dis-tributed, the probability that the maximum wind velocitydue to tornado, V, exceeds a specified value v in a time pe-riod T (years) for a point of interest, PT(V > v), is given by(Wen and Chu 1973),
½1� PTðV > vÞ ¼ 1� exp�� gPðV > vÞT
�where g is the annual rate of tornadoes striking the point ofinterest for the tornadoes originating from a region with anarea S and P(V > v), represents the exceedance probabilitydistribution of maximum wind speed of the tornado thatstrikes the point of interest. P(V > v) can be expressed as,
½2� PðV > vÞ ¼Xnmax
i¼0
PðV > vjFiÞPðFiÞ
where Fi (i = 0,. . .nmax) represents the tornado with the i-thFujita scale (F-scale) intensity; nmax represents the maxi-mum F-scale of interest; P(V > v|Fi) is the probability thatV is greater than v conditioned on that the tornado with thei-th Fujita scale strikes the point of interest; and P(Fi) is theprobability that the tornado with intensity Fi strikes the pointof interest. Alternatively, to simplify the analysis and to fa-cilitate the incorporation of the uncertainty in the occurrencerate for each F-scale intensity tornado, Twisdale and Dunn(1983) proposed that PT(V > v) can be approximated by,
½3a� PTðV > vÞ �Xnmax
i¼0
�1� exp
�� gCiPðV > vjFiÞT
��
where gCi is the annual rate of tornado that is classified as Fitornado and strikes the point of interest. It must be empha-sized that in the above equation, Fi represents the intensityof a tornado according to the classification. However, for atornado classified as an Fi tornado, its actual intensity variesalong its path length as the friction of the ground dissipatesthe energy, and only a percentage of its path length (or da-mage area) is actually experiencing a tornado with intensityFi, whereas the remaining portion of the path length experi-ences an intensity less than Fi (Twisdale et al. 1981). Todistinguish the classified intensity and experienced intensity,we use FAi to denote the actually experienced (striking) tor-nado intensity by the portion of path length if the wholeconsidered portion of path length experienced tornado of in-tensity Fi. If the probability that V is greater than v condi-tioned on the striking intensity FAi, P(V > v|FAi), isemployed, eq. [3a] becomes,
½3b� PTðV > vÞ �Xnmax
i¼0
�1� exp
�� gAiPðV > vjFAiÞT
��
where gAi is the annual rate of tornado striking the point ofinterest with striking intensity FAi. This equation is used forthe numerical analyses in the present study.
It is noted that the tornado is defined by its path lengthand width, and that P(V > v|Fi) needs to be evaluated foreq. [2], or eq. [3a]. If the tornado occurrence is homogene-ous in space, P(V > v|Fi) can be approximated by (Thom1963),
½4� PðV > vjFiÞ ¼ZU
minð1; a=SÞfAðaÞda
� min�
1; EðAÞ=S�
where a is a value of A denoting the area of the origin of thetornadoes classified as intensity Fi that will strike a point ofinterest with V > v, fA(a) denotes the probability density dis-
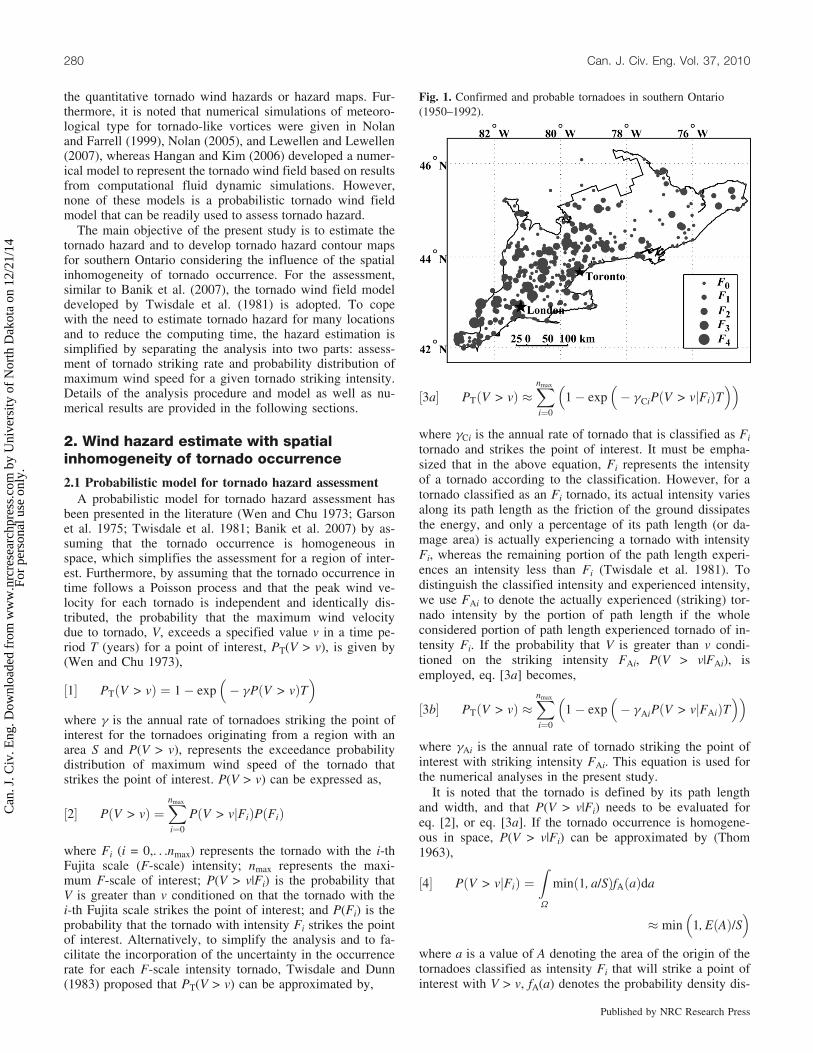
Fig. 1. Confirmed and probable tornadoes in southern Ontario(1950–1992).
280 Can. J. Civ. Eng. Vol. 37, 2010
Published by NRC Research Press
Can
. J. C
iv. E
ng. D
ownl
oade
d fr
om w
ww
.nrc
rese
arch
pres
s.co
m b
y U
nive
rsity
of
Nor
th D
akot
a on
12/
21/1
4Fo
r pe
rson
al u
se o
nly.
tribution of A, U denotes the domain of integration, andE(�) represents the mathematical expectation.
However, eq. [4] is not applicable if the tornado occur-rence is spatially inhomogeneous. This inhomogeneity isshown in Fig. 1 by using the historical tornado cataloguefor southern Ontario (Sills et al. 2004). Use of the historicaldata in assessing the nonhomogeneous spatial tornado occur-rence rate will be discussed shortly. To take the inhomoge-neity into account, consider, for the moment, that the spatialdependence of the tornado occurrence intensity (i.e., thenumber of tornado touchdowns per unit area per year),li(s), for tornadoes with intensity Fi is already estimated
from the historical tornado catalogue, and that the probabil-ity density function of tornado occurrence intensity withinan area of interest for tornado with intensity Fi, fLi(li), canbe expressed as,
½5� fLi
�liðsÞ
�¼ liðsÞ=Li
where Li ¼RUliðsÞds represents the tornado occurrence rate
of tornadoes classified as intensity Fi within the consideredregion, U represents the integration domain for the consid-ered region, and s denotes a point within the domain.
Table 1. Statistics of tornado occurrence for southern Ontario from 1950 to 1992.
F-scaleF-scale wind speed range(km/h) No Nc P(Fj) P’’(Fj)
F0 64–116 196 280 0.5429 0.4425F1 117–165 110 157 0.3047 0.3101F2 166–216 37 37 0.1025 0.1620F3 217 –269 12 12 0.0332 0.0567F4 270–335 6 6 0.0166 0.0230F5 336–446 0 0 0 0.0057Total 361 492 1.0000 1.0000
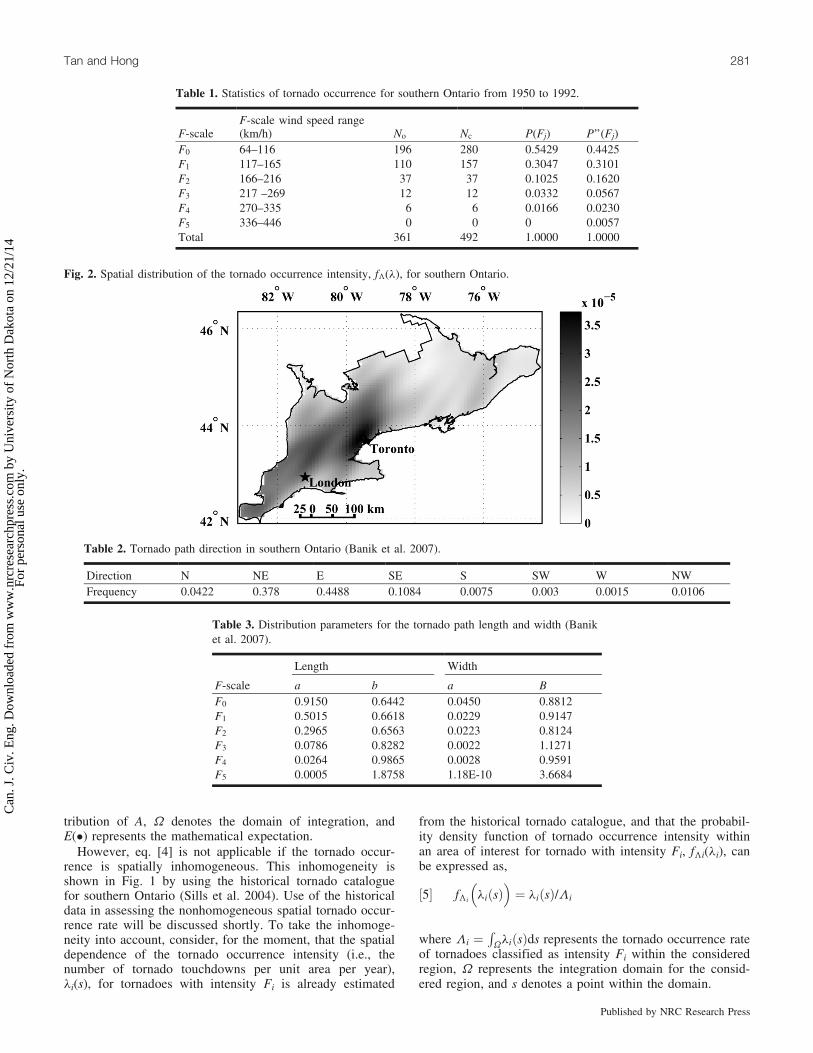
Fig. 2. Spatial distribution of the tornado occurrence intensity, fL(l), for southern Ontario.
Table 2. Tornado path direction in southern Ontario (Banik et al. 2007).
Direction N NE E SE S SW W NWFrequency 0.0422 0.378 0.4488 0.1084 0.0075 0.003 0.0015 0.0106
Table 3. Distribution parameters for the tornado path length and width (Baniket al. 2007).
Length Width
F-scale a b a BF0 0.9150 0.6442 0.0450 0.8812F1 0.5015 0.6618 0.0229 0.9147F2 0.2965 0.6563 0.0223 0.8124F3 0.0786 0.8282 0.0022 1.1271F4 0.0264 0.9865 0.0028 0.9591F5 0.0005 1.8758 1.18E-10 3.6684
Tan and Hong 281
Published by NRC Research Press
Can
. J. C
iv. E
ng. D
ownl
oade
d fr
om w
ww
.nrc
rese
arch
pres
s.co
m b
y U
nive
rsity
of
Nor
th D
akot
a on
12/
21/1
4Fo
r pe
rson
al u
se o
nly.
Note that the tornado occurrence rate is not equal to therate of tornado striking a point of interest, as the evaluationof the tornado striking rate must consider the nonuniformtornado occurrence in space (within the considered region),the variation of striking intensity, the path direction, and thedamage area. Furthermore, no simple analytical solution forevaluating gAi is available and, as explained in the follow-ing, simple simulation technique can be used for its evalua-tion.
2.2 Characteristics of tornado occurrence and pathThe spatial inhomogeneity affects the estimated tornado
hazard at a point, and especially the tornado hazard map fora geographic region. To assess this inhomogeneity, we notethat the tornado database for Ontario developed by Newark(1984) and subsequently updated by Sills et al. (2004) in-cludes information on the essential variables for many torna-does. These variables include tornado intensity in F-scale,tornado occurrence time, geographic location of recorded
tornado touchdown point, tornado direction of motion, tor-nado path length, and whether the recorded tornado is iden-tified as a confirmed, probable, or a possible tornado event.The confirmed category is defined so that events are consid-ered as tornadoes due to visual evidence or damage reports.The probable category includes events where all availableevidence pointed to the likelihood of tornadoes. The possi-ble category is used to define events where the tornado evi-dence is either ambiguous or unreliable. Sills et al. (2004)concluded that only confirmed and probable events providethe best representation of actual tornado touchdowns, be-cause some nontornadic events were potentially involved inthe possible category. Hence, all tornado events, which wererated as either confirmed or probable and occurred in south-ern Ontario between the year 1950 and 1992, will be consid-ered in this study. This time interval is chosen to beconsistent with that of the tornado database of Ontario’sneighbouring regions (i.e., the states of Michigan, Ohio,Pennsylvania, and New York) in the United States, as someof the characteristics of tornadoes, which are not available inOntario tornado database and are needed for tornado hazardassessment, can be obtained from the tornado database ofthe neighbouring regions.
Note that the reported tornado information on the tornadodatabase does not reflect the actual historical tornado activ-ities due to (i) improved storm tracking and reporting net-work and possible increased number of witnesses oftornadoes (because of increased population density); and (ii)errors and bias in F-scale assignment during the tornado re-porting process. Banik et al. (2007) carried out statisticalanalysis for tornadoes that occurred in southern Ontario andin the neighbouring regions by considering both the de-trending (McDonald et al. 1975; Sigal et al. 2000) and errorand bias correction (Twisdale et al. 1981). Such an analysisis carried out again as the selected region shown in Fig. 1for this study differs from that considered by Banik et al.(2007). The obtained results for the former are shown in Ta-ble 1 and are in close agreement with those given in the lat-ter.
In Table 1, the ranges of the updated wind speed (fastestquarter mile gust winds) for each tornado intensity categoryproposed by Twisdale et al. (1981), which is to be used inthe present study, are presented. No represents the observednumber of tornadoes for each tornado intensity category; Ncrepresents the corrected number of tornadoes for each tor-nado intensity category; P(Fj) represents the relative fre-quencies of tornado occurrence for each intensity Fjcalculated directly based on No; and P@(Fj) (j = 0, ..., 5) rep-resents the updated relative frequencies of tornado inten-sities adjusted for F-scale classification error analysis(Twisdale et al. 1981). By considering the correction and ad-justment, the updated occurrence rate of tornado with inten-sity Fi for southern Ontario, Li per year equals (492/43) �P@(Fj).
Sills (1998), King et al. (2003) and Banik et al. (2007)pointed out that the tornado occurrences in southern Ontarioare inhomogeneous in space. To further assess the spatialtornado occurrence pattern, and to obtain an estimate of spa-tially smoothed tornado occurrence rate over southernOntario, a two-dimensional adaptive Gaussian kernel estima-tion technique (Silverman 1986) was considered. The techni-
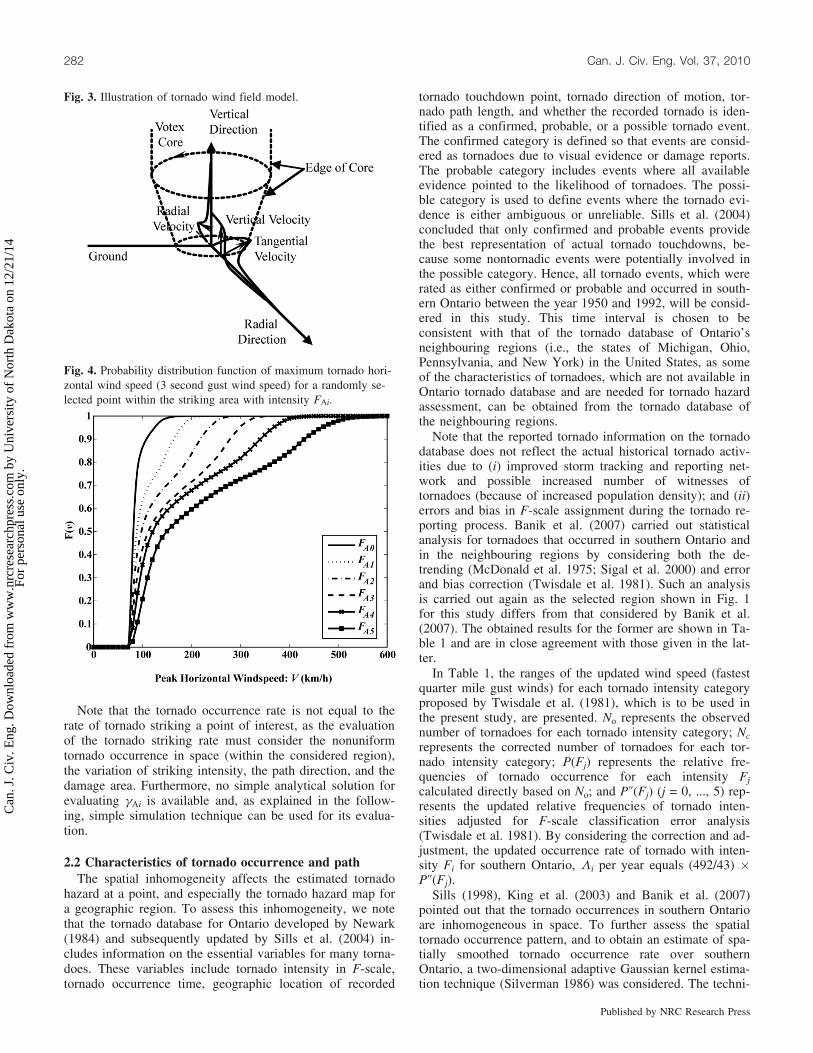
Fig. 3. Illustration of tornado wind field model.
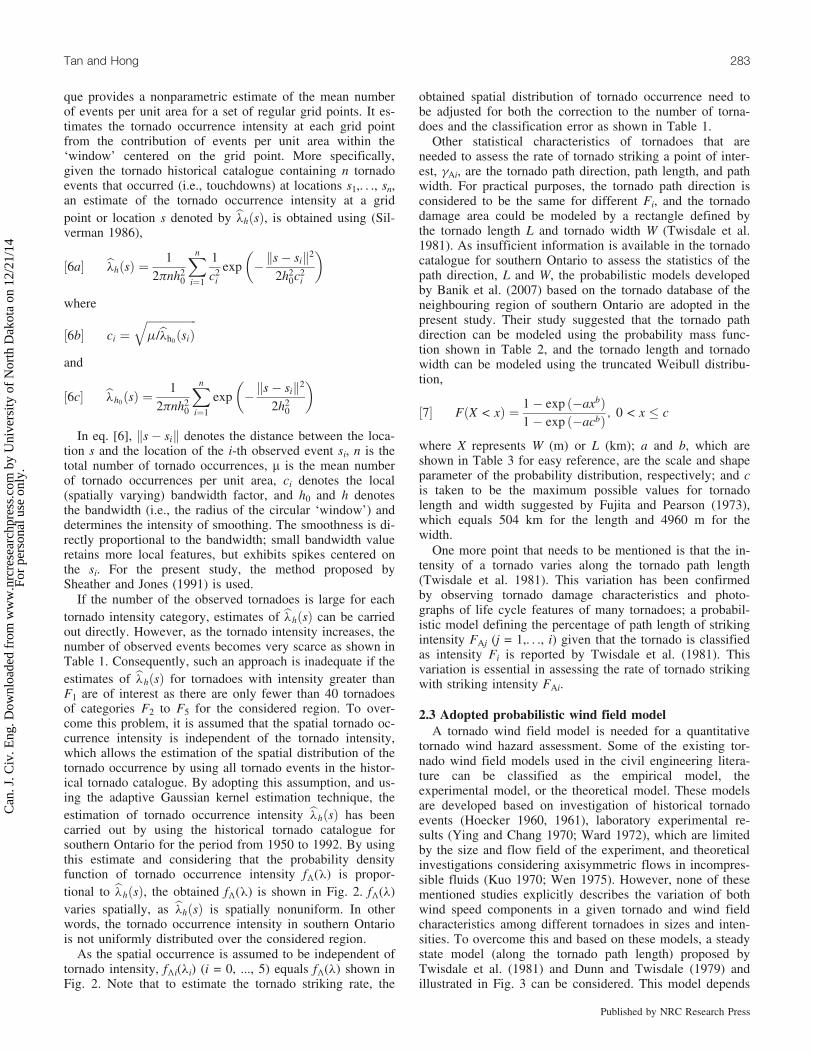
Fig. 4. Probability distribution function of maximum tornado hori-zontal wind speed (3 second gust wind speed) for a randomly se-lected point within the striking area with intensity FAi.
282 Can. J. Civ. Eng. Vol. 37, 2010
Published by NRC Research Press
Can
. J. C
iv. E
ng. D
ownl
oade
d fr
om w
ww
.nrc
rese
arch
pres
s.co
m b
y U
nive
rsity
of
Nor
th D
akot
a on
12/
21/1
4Fo
r pe
rson
al u
se o
nly.
que provides a nonparametric estimate of the mean numberof events per unit area for a set of regular grid points. It es-timates the tornado occurrence intensity at each grid pointfrom the contribution of events per unit area within the‘window’ centered on the grid point. More specifically,given the tornado historical catalogue containing n tornadoevents that occurred (i.e., touchdowns) at locations s1,. . ., sn,an estimate of the tornado occurrence intensity at a gridpoint or location s denoted by blhðsÞ, is obtained using (Sil-verman 1986),
½6a� blhðsÞ ¼1
2pnh20
Xn
i¼1
1
c2i
exp �ks� sik2
2h20c2
i
� �
where
½6b� ci ¼ffiffiffiffiffiffiffiffiffiffiffiffiffiffiffiffiffiffim=blh0
ðsiÞq
and
½6c� blh0ðsÞ ¼ 1
2pnh20
Xn
i¼1
exp �ks� sik2
2h20
� �
In eq. [6], ks� sik denotes the distance between the loca-tion s and the location of the i-th observed event si, n is thetotal number of tornado occurrences, m is the mean numberof tornado occurrences per unit area, ci denotes the local(spatially varying) bandwidth factor, and h0 and h denotesthe bandwidth (i.e., the radius of the circular ‘window’) anddetermines the intensity of smoothing. The smoothness is di-rectly proportional to the bandwidth; small bandwidth valueretains more local features, but exhibits spikes centered onthe si. For the present study, the method proposed bySheather and Jones (1991) is used.
If the number of the observed tornadoes is large for eachtornado intensity category, estimates of blhðsÞ can be carriedout directly. However, as the tornado intensity increases, thenumber of observed events becomes very scarce as shown inTable 1. Consequently, such an approach is inadequate if theestimates of blhðsÞ for tornadoes with intensity greater thanF1 are of interest as there are only fewer than 40 tornadoesof categories F2 to F5 for the considered region. To over-come this problem, it is assumed that the spatial tornado oc-currence intensity is independent of the tornado intensity,which allows the estimation of the spatial distribution of thetornado occurrence by using all tornado events in the histor-ical tornado catalogue. By adopting this assumption, and us-ing the adaptive Gaussian kernel estimation technique, theestimation of tornado occurrence intensity blhðsÞ has beencarried out by using the historical tornado catalogue forsouthern Ontario for the period from 1950 to 1992. By usingthis estimate and considering that the probability densityfunction of tornado occurrence intensity fL(l) is propor-tional to blhðsÞ, the obtained fL(l) is shown in Fig. 2. fL(l)varies spatially, as blhðsÞ is spatially nonuniform. In otherwords, the tornado occurrence intensity in southern Ontariois not uniformly distributed over the considered region.
As the spatial occurrence is assumed to be independent oftornado intensity, fLi(li) (i = 0, ..., 5) equals fL(l) shown inFig. 2. Note that to estimate the tornado striking rate, the
obtained spatial distribution of tornado occurrence need tobe adjusted for both the correction to the number of torna-does and the classification error as shown in Table 1.
Other statistical characteristics of tornadoes that areneeded to assess the rate of tornado striking a point of inter-est, gAi, are the tornado path direction, path length, and pathwidth. For practical purposes, the tornado path direction isconsidered to be the same for different Fi, and the tornadodamage area could be modeled by a rectangle defined bythe tornado length L and tornado width W (Twisdale et al.1981). As insufficient information is available in the tornadocatalogue for southern Ontario to assess the statistics of thepath direction, L and W, the probabilistic models developedby Banik et al. (2007) based on the tornado database of theneighbouring region of southern Ontario are adopted in thepresent study. Their study suggested that the tornado pathdirection can be modeled using the probability mass func-tion shown in Table 2, and the tornado length and tornadowidth can be modeled using the truncated Weibull distribu-tion,
½7� FðX < xÞ ¼ 1� exp ð�axbÞ1� exp ð�acbÞ ; 0 < x � c
where X represents W (m) or L (km); a and b, which areshown in Table 3 for easy reference, are the scale and shapeparameter of the probability distribution, respectively; and cis taken to be the maximum possible values for tornadolength and width suggested by Fujita and Pearson (1973),which equals 504 km for the length and 4960 m for thewidth.
One more point that needs to be mentioned is that the in-tensity of a tornado varies along the tornado path length(Twisdale et al. 1981). This variation has been confirmedby observing tornado damage characteristics and photo-graphs of life cycle features of many tornadoes; a probabil-istic model defining the percentage of path length of strikingintensity FAj (j = 1,. . ., i) given that the tornado is classifiedas intensity Fi is reported by Twisdale et al. (1981). Thisvariation is essential in assessing the rate of tornado strikingwith striking intensity FAi.
2.3 Adopted probabilistic wind field modelA tornado wind field model is needed for a quantitative
tornado wind hazard assessment. Some of the existing tor-nado wind field models used in the civil engineering litera-ture can be classified as the empirical model, theexperimental model, or the theoretical model. These modelsare developed based on investigation of historical tornadoevents (Hoecker 1960, 1961), laboratory experimental re-sults (Ying and Chang 1970; Ward 1972), which are limitedby the size and flow field of the experiment, and theoreticalinvestigations considering axisymmetric flows in incompres-sible fluids (Kuo 1970; Wen 1975). However, none of thesementioned studies explicitly describes the variation of bothwind speed components in a given tornado and wind fieldcharacteristics among different tornadoes in sizes and inten-sities. To overcome this and based on these models, a steadystate model (along the tornado path length) proposed byTwisdale et al. (1981) and Dunn and Twisdale (1979) andillustrated in Fig. 3 can be considered. This model depends
Tan and Hong 283
Published by NRC Research Press
Can
. J. C
iv. E
ng. D
ownl
oade
d fr
om w
ww
.nrc
rese
arch
pres
s.co
m b
y U
nive
rsity
of
Nor
th D
akot
a on
12/
21/1
4Fo
r pe
rson
al u
se o
nly.
on the ratio of the radial velocity to tangential velocity, theradius to the maximum tangential velocity at a referenceheight, the linear variation of the reference radius withheight, the reference boundary layer thickness, the referencerotational velocity, the translational speed, and the tornadowidth. The model aims at approximating the variations ofthe vertical and horizontal wind speed across the tornadopath width and the probabilistic model parameters accountfor the natural variability observed among tornadoes, includ-ing tornado intensity, path length and width, translationalspeed, core radius, ratio of radial-to-tangential wind speedcomponents, core radius, and boundary layer thickness(Twisdale et al. 1981; Dunn and Twisdale 1979).
By adopting this model, probability distribution of themaximum horizontal wind speed V can be assessed for arandomly selected point at 10 m height and within a tornadodamage path. In this study, the assessment is carried out us-ing a simple simulation technique. Given a tornado of inten-sity Fi, it basically consists of sampling the tornado intensityand path width, sampling the wind field model parameters,sampling a point within the tornado damage path with strik-ing intensity FAi, and evaluating the maximum horizontalwind speed for the sampled point using the adopted windfield model. By carrying out this simulation, the obtainedsamples are used to form the probability distribution func-tion of the maximum horizontal wind speed P(V < v|FAi) asshown in Fig. 4. Note that conversion factors obtained fromthe curve given by Durst (1960) are used to estimate 3 sgust wind speed from other types of wind speed. The resultspresented in the figure indicate that as the striking intensityFAi increases the probability distribution function is shiftedhorizontally towards a higher wind speed region, which isexpected. For moderate and low exceedance probabilities,the shift is about 50 km/h, which approximately equals theincrease in the mean wind speed between two consecutiveF-scale tornado intensities shown in Table 1.
3. Assessment of tornado contour maps
3.1 Estimating the rate of tornado strikingAs mentioned previously, as no analytical solution for
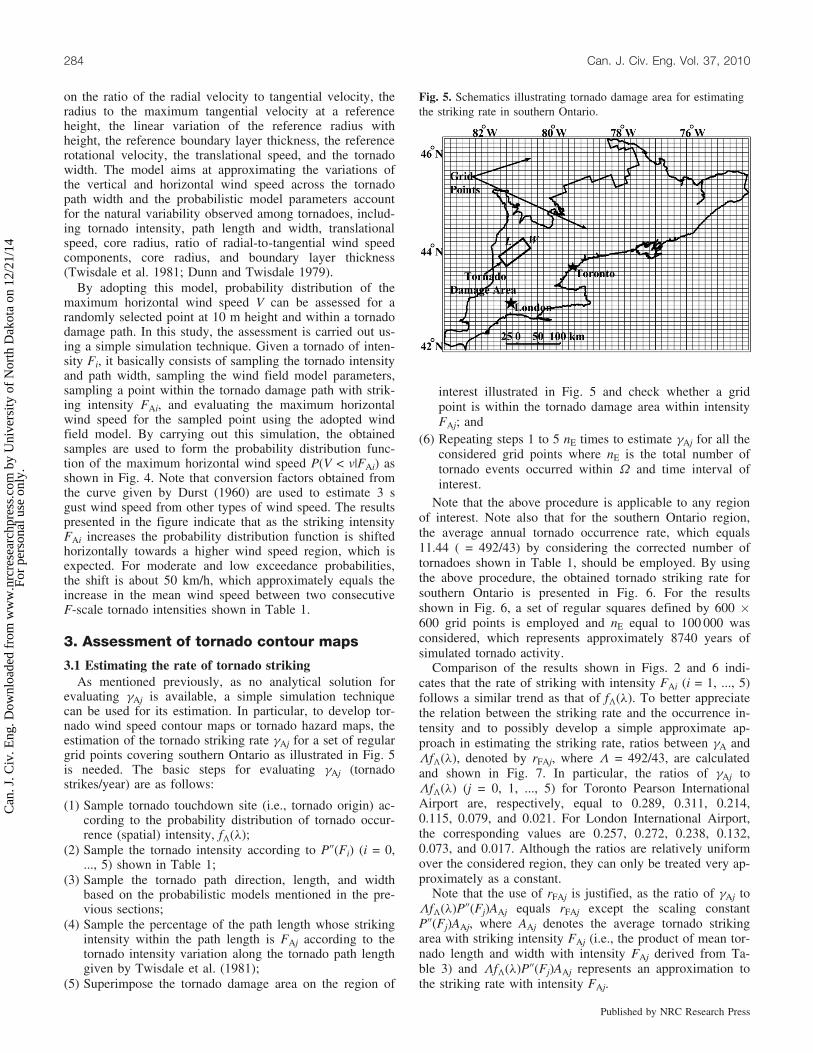
evaluating gAj is available, a simple simulation techniquecan be used for its estimation. In particular, to develop tor-nado wind speed contour maps or tornado hazard maps, theestimation of the tornado striking rate gAj for a set of regulargrid points covering southern Ontario as illustrated in Fig. 5is needed. The basic steps for evaluating gAj (tornadostrikes/year) are as follows:
(1) Sample tornado touchdown site (i.e., tornado origin) ac-cording to the probability distribution of tornado occur-rence (spatial) intensity, fL(l);
(2) Sample the tornado intensity according to P@(Fi) (i = 0,..., 5) shown in Table 1;
(3) Sample the tornado path direction, length, and widthbased on the probabilistic models mentioned in the pre-vious sections;
(4) Sample the percentage of the path length whose strikingintensity within the path length is FAj according to thetornado intensity variation along the tornado path lengthgiven by Twisdale et al. (1981);
(5) Superimpose the tornado damage area on the region of
interest illustrated in Fig. 5 and check whether a gridpoint is within the tornado damage area within intensityFAj; and
(6) Repeating steps 1 to 5 nE times to estimate gAj for all theconsidered grid points where nE is the total number oftornado events occurred within U and time interval ofinterest.
Note that the above procedure is applicable to any regionof interest. Note also that for the southern Ontario region,the average annual tornado occurrence rate, which equals11.44 ( = 492/43) by considering the corrected number oftornadoes shown in Table 1, should be employed. By usingthe above procedure, the obtained tornado striking rate forsouthern Ontario is presented in Fig. 6. For the resultsshown in Fig. 6, a set of regular squares defined by 600 �600 grid points is employed and nE equal to 100 000 wasconsidered, which represents approximately 8740 years ofsimulated tornado activity.
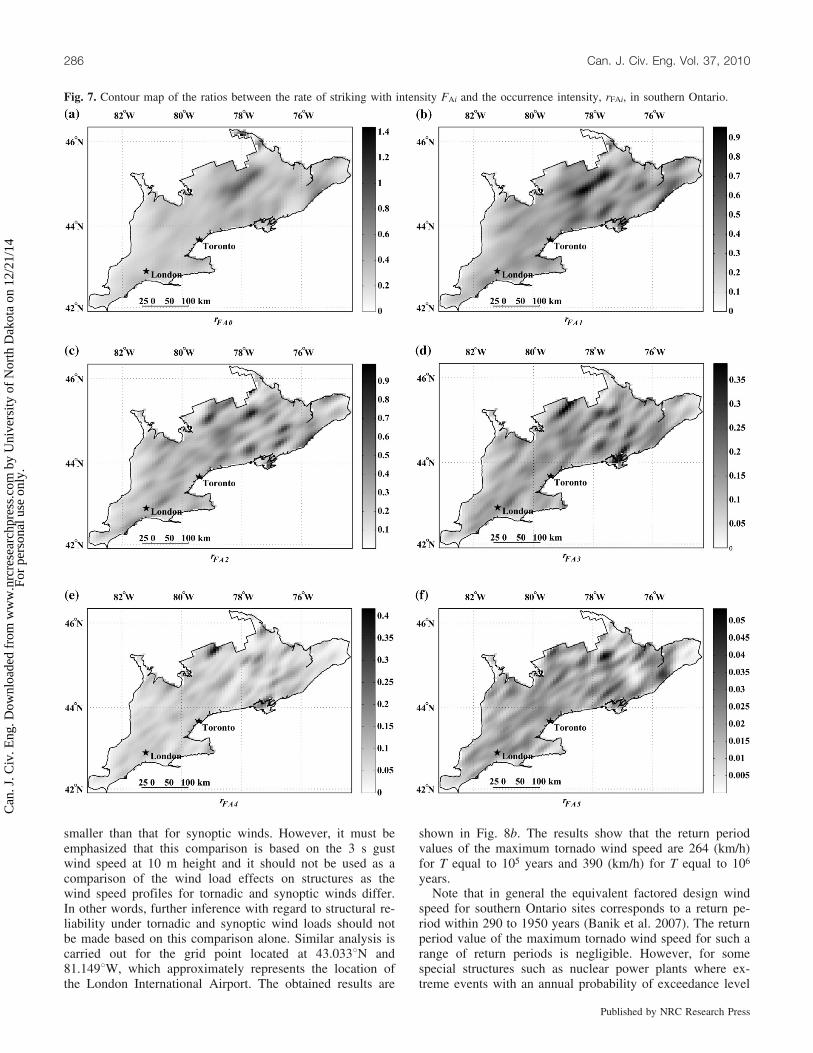
Comparison of the results shown in Figs. 2 and 6 indi-cates that the rate of striking with intensity FAi (i = 1, ..., 5)follows a similar trend as that of fL(l). To better appreciatethe relation between the striking rate and the occurrence in-tensity and to possibly develop a simple approximate ap-proach in estimating the striking rate, ratios between gA andLfL(l), denoted by rFAj, where L = 492/43, are calculatedand shown in Fig. 7. In particular, the ratios of gAj toLfL(l) (j = 0, 1, ..., 5) for Toronto Pearson InternationalAirport are, respectively, equal to 0.289, 0.311, 0.214,0.115, 0.079, and 0.021. For London International Airport,the corresponding values are 0.257, 0.272, 0.238, 0.132,0.073, and 0.017. Although the ratios are relatively uniformover the considered region, they can only be treated very ap-proximately as a constant.
Note that the use of rFAj is justified, as the ratio of gAj toLfL(l)P@(Fj)AAj equals rFAj except the scaling constantP@(Fj)AAj, where AAj denotes the average tornado strikingarea with striking intensity FAj (i.e., the product of mean tor-nado length and width with intensity FAj derived from Ta-ble 3) and LfL(l)P@(Fj)AAj represents an approximation tothe striking rate with intensity FAj.
Fig. 5. Schematics illustrating tornado damage area for estimatingthe striking rate in southern Ontario.
284 Can. J. Civ. Eng. Vol. 37, 2010
Published by NRC Research Press
Can
. J. C
iv. E
ng. D
ownl
oade
d fr
om w
ww
.nrc
rese
arch
pres
s.co
m b
y U
nive
rsity
of
Nor
th D
akot
a on
12/
21/1
4Fo
r pe
rson
al u
se o
nly.
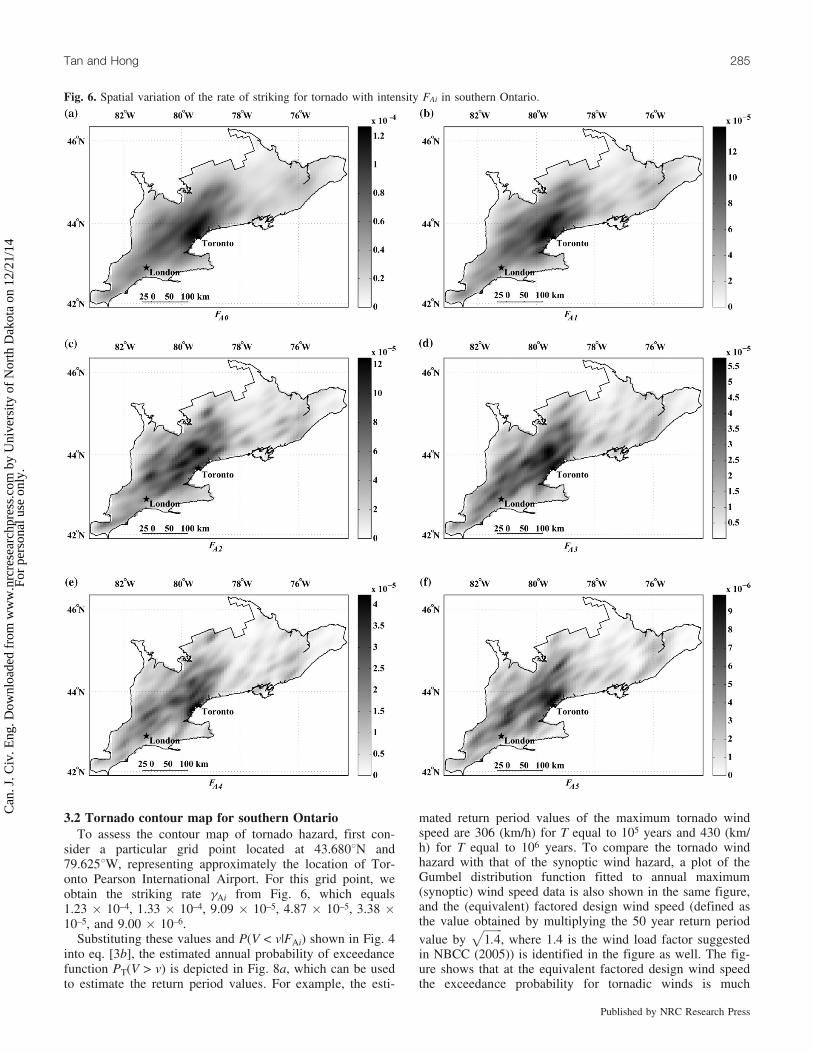
3.2 Tornado contour map for southern OntarioTo assess the contour map of tornado hazard, first con-
sider a particular grid point located at 43.6808N and79.6258W, representing approximately the location of Tor-onto Pearson International Airport. For this grid point, weobtain the striking rate gAi from Fig. 6, which equals1.23 � 10–4, 1.33 � 10–4, 9.09 � 10–5, 4.87 � 10–5, 3.38 �10–5, and 9.00 � 10–6.
Substituting these values and P(V < v|FAi) shown in Fig. 4into eq. [3b], the estimated annual probability of exceedancefunction PT(V > v) is depicted in Fig. 8a, which can be usedto estimate the return period values. For example, the esti-
mated return period values of the maximum tornado windspeed are 306 (km/h) for T equal to 105 years and 430 (km/h) for T equal to 106 years. To compare the tornado windhazard with that of the synoptic wind hazard, a plot of theGumbel distribution function fitted to annual maximum(synoptic) wind speed data is also shown in the same figure,and the (equivalent) factored design wind speed (defined asthe value obtained by multiplying the 50 year return periodvalue by
ffiffiffiffiffiffiffi1:4
p, where 1.4 is the wind load factor suggested
in NBCC (2005)) is identified in the figure as well. The fig-ure shows that at the equivalent factored design wind speedthe exceedance probability for tornadic winds is much
Fig. 6. Spatial variation of the rate of striking for tornado with intensity FAi in southern Ontario.
Tan and Hong 285
Published by NRC Research Press
Can
. J. C
iv. E
ng. D
ownl
oade
d fr
om w
ww
.nrc
rese
arch
pres
s.co
m b
y U
nive
rsity
of
Nor
th D
akot
a on
12/
21/1
4Fo
r pe
rson
al u
se o
nly.
smaller than that for synoptic winds. However, it must beemphasized that this comparison is based on the 3 s gustwind speed at 10 m height and it should not be used as acomparison of the wind load effects on structures as thewind speed profiles for tornadic and synoptic winds differ.In other words, further inference with regard to structural re-liability under tornadic and synoptic wind loads should notbe made based on this comparison alone. Similar analysis iscarried out for the grid point located at 43.0338N and81.1498W, which approximately represents the location ofthe London International Airport. The obtained results are
shown in Fig. 8b. The results show that the return periodvalues of the maximum tornado wind speed are 264 (km/h)for T equal to 105 years and 390 (km/h) for T equal to 106
years.Note that in general the equivalent factored design wind
speed for southern Ontario sites corresponds to a return pe-riod within 290 to 1950 years (Banik et al. 2007). The returnperiod value of the maximum tornado wind speed for such arange of return periods is negligible. However, for somespecial structures such as nuclear power plants where ex-treme events with an annual probability of exceedance level
Fig. 7. Contour map of the ratios between the rate of striking with intensity FAi and the occurrence intensity, rFAi, in southern Ontario.
286 Can. J. Civ. Eng. Vol. 37, 2010
Published by NRC Research Press
Can
. J. C
iv. E
ng. D
ownl
oade
d fr
om w
ww
.nrc
rese
arch
pres
s.co
m b
y U
nive
rsity
of
Nor
th D
akot
a on
12/
21/1
4Fo
r pe
rson
al u
se o
nly.
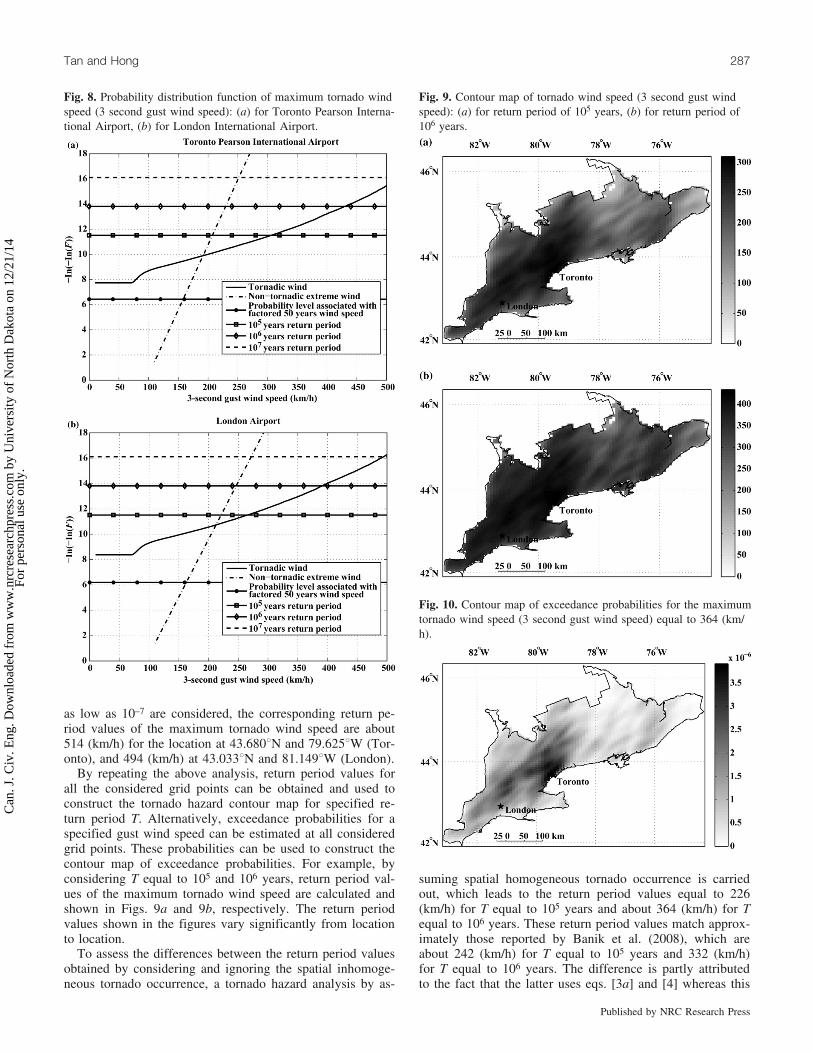
as low as 10–7 are considered, the corresponding return pe-riod values of the maximum tornado wind speed are about514 (km/h) for the location at 43.6808N and 79.6258W (Tor-onto), and 494 (km/h) at 43.0338N and 81.1498W (London).
By repeating the above analysis, return period values forall the considered grid points can be obtained and used toconstruct the tornado hazard contour map for specified re-turn period T. Alternatively, exceedance probabilities for aspecified gust wind speed can be estimated at all consideredgrid points. These probabilities can be used to construct thecontour map of exceedance probabilities. For example, byconsidering T equal to 105 and 106 years, return period val-ues of the maximum tornado wind speed are calculated andshown in Figs. 9a and 9b, respectively. The return periodvalues shown in the figures vary significantly from locationto location.
To assess the differences between the return period valuesobtained by considering and ignoring the spatial inhomoge-neous tornado occurrence, a tornado hazard analysis by as-
suming spatial homogeneous tornado occurrence is carriedout, which leads to the return period values equal to 226(km/h) for T equal to 105 years and about 364 (km/h) for Tequal to 106 years. These return period values match approx-imately those reported by Banik et al. (2008), which areabout 242 (km/h) for T equal to 105 years and 332 (km/h)for T equal to 106 years. The difference is partly attributedto the fact that the latter uses eqs. [3a] and [4] whereas this
Fig. 8. Probability distribution function of maximum tornado windspeed (3 second gust wind speed): (a) for Toronto Pearson Interna-tional Airport, (b) for London International Airport.
Fig. 9. Contour map of tornado wind speed (3 second gust windspeed): (a) for return period of 105 years, (b) for return period of106 years.
Fig. 10. Contour map of exceedance probabilities for the maximumtornado wind speed (3 second gust wind speed) equal to 364 (km/h).
Tan and Hong 287
Published by NRC Research Press
Can
. J. C
iv. E
ng. D
ownl
oade
d fr
om w
ww
.nrc
rese
arch
pres
s.co
m b
y U
nive
rsity
of
Nor
th D
akot
a on
12/
21/1
4Fo
r pe
rson
al u
se o
nly.
study is based on eq. [3b]. As the return period valuesshown in Fig. 9 vary significantly, it implies that by ignor-ing the spatial inhomogeneity of tornado occurrence, signifi-cant overestimation of the tornado hazard results for themajority of the locations, whereas underestimation is likelyto occur for some areas north of Toronto and London.
If a maximum wind speed of interest equal to 364 (km/h)(i.e., 106 year return period value for London) is considered,the contour map of exceedance probabilities is presented inFig. 10. The figure indicates that the exceedance probabilitylevel for the considered wind speed is higher than 10–6 forregions near Toronto and north of London. This observationis consistent with that which can be drawn from Fig. 9.
4. ConclusionsAn assessment of the tornado hazard map considering the
inhomogeneity of spatial tornado occurrence was carriedout. The assessment adopts an existing probabilistic tornadowind field model, uses a spatial smoothing technique inevaluating the spatial tornado occurrence intensity, and em-ploys a simulation technique in assessing the probability dis-tribution function of the tornado wind speed at grid pointscovering southern Ontario. The results presented in thisstudy are used, for the first time, to provide quantitative tor-nado hazard maps for southern Ontario.
The analysis results indicate that the tornado striking ratefor grid points of interest can be approximated only verycrudely by scaling the tornado occurrence intensity, as theratios of the tornado striking rate to the tornado occurrenceintensity vary somewhat for the considered region.
The obtained tornado hazard indicates that the return pe-riod value of the maximum tornado wind speed for a returnperiod corresponding to the factored design wind load isnegligible. In other words, at the equivalent factored designwind speed the exceedance probability for tornadic winds ismuch smaller than that for synoptic winds even when thespatial inhomogeneity of tornado occurrence is considered.Furthermore, the results show that the spatial inhomogeneityof the tornado occurrence has a significant impact on thespatial tornado hazard level and that return period values oftornado wind speed vary significantly over the consideredregion. By ignoring the spatial inhomogeneity of tornado oc-currence, the tornado hazard for some areas north of Tor-onto and London is underestimated, whereas for other areaswithin the considered region, the tornado hazard is overesti-mated.
AcknowledgmentThe financial support received from the Natural Sciences
and Engineering Research Council of Canada and the Uni-versity of Western Ontario is gratefully acknowledged.
ReferencesBanik, S.S., Hong, H.P., and Kopp, G.A. 2007. Tornado hazard as-
sessment for southern Ontario. Canadian Journal of Civil Engi-neering, 34(7): 830–842. doi:10.1139/L07-001.
Banik, S.S., Hong, H.P., and Kopp, G.A. 2008. Assessment of tor-nado hazard for spatially distributed systems in southern Ontario.Journal of Wind Engineering and Industrial Aerodynamics, 96(8-9): 1376–1389. doi:10.1016/j.jweia.2008.03.002.
Dunn, W.L., and Twisdale, L.A. 1979. A synthesized windfieldmodel for tornado missile transport. Journal of Nuclear Engi-neering and Design, 52(1): 135–144. doi:10.1016/0029-5493(79)90015-3.
Durst, C.S. 1960. Wind speeds over short periods of time. Meteor-ological Magazine, 89: 181–186.
Etkin, D.A. 1999. Extreme events and natural disasters in an era ofincreasing environmental change. Report of Workshop on Emer-ging Environmental Issues in Ontario Environmental MonographNo.15. Institute for Environmental Studies, University of Tor-onto. pp. 19–22.
Fujita, T.T., and Pearson, A. 1973. Experimental classification oftornadoes in FPP scale. SMRP Research Paper 98, Satellite andMesometeorology Research Project (SMRP), University of Chi-cago, Chicago, Ill.
Garson, R.C., Morla-Catalan, J., and Cornell, C.A. 1975. Tornadorisk evaluation using wind speed profiles. Journal of the Struc-tural Division, 101(5): 1167–1171.
Hangan, H., and Kim, J. 2006. Numerical simulations of tornadovortices. Journal of Wind Engineering and Industrial Aerody-namics, 108: 481–484.
Hoecker, W.H. 1960. Wind speed and air flow patterns in the Dal-las tornado of 2 April 1957. Monthly Weather Review, 88(5):167–180. doi:10.1175/1520-0493(1960)088<0167:WSAAFP>2.0.CO;2.
Hoecker, W.H. 1961. Three-dimensional pressure pattern of theDallas tornado and some resultant implications. MonthlyWeather Review, 89(12): 533–542. doi:10.1175/1520-0493(1961)089<0533:TPPOTD>2.0.CO;2.
King, P.W.S., Leduc, M.J., Sills, D.M.L., Donaldson, N.R., Hudak,D.R., Joe, P., and Murphy, B.P. 2003. Lake breezes in southernOntario and their relation to tornado climatology. Weather andForecasting, 18(5): 795–807.
Kuo, H.L. 1971. Axisymmetric flows in the boundary layer of a main-tained vortex. Journal of the Atmospheric Sciences, 28(1): 20–41.doi:10.1175/1520-0469(1971)028<0020:AFITBL>2.0.CO;2.
Lewellen, D.C., and Lewellen, W.S. 2007. Near-surface intensifica-tion of tornado vortices. Journal of the Atmospheric Sciences,64(7): 2176–2194. doi:10.1175/JAS3965.1.
McDonald, J.R., Mehta, K.C., Minor, J.E., and Beason, L. 1975.Development of a wind speed risk model for the Argonne Na-tional Laboratory site. Institute for Disaster Research, TexasTech University, Lubbock, Tex.
NBCC. 2005. National Building Code of Canada. Institute for Re-search in Construction, National Research Council of Canada,Ottawa, Ont.
Newark, M.J. 1984. Canadian tornadoes, 1950–1979. Atmosphere-Ocean, 22(3): 343–353.
Nolan, D.S. 2005. A new scaling for tornado-like vortices. Journal of theAtmospheric Sciences, 62(7): 2639–2645. doi:10.1175/JAS3461.1.
Nolan, D.S., and Farrell, B.F. 1999. The structure and dynamics of tor-nado-like vortices. Journal of the Atmospheric Sciences, 56(16):2908–2936.doi:10.1175/1520-0469(1999)056<2908:TSADOT>2.0.CO;2.
Sheather, S.J., and Jones, M.C. 1991. A reliable data-based band-width selection method for kernel density estimation. Journalof the Royal Statistical Society. Series B. Methodological, 53:683–690.
Sigal, M.B., Singhal, A., Pan, K., Seneviratna, P., and Zadeh, M.M.2000. Simulation of the tornado hazards in the U.S. Proceedingsof the 32nd conference on Winter Simulation Conference, Or-lando, Fla. 10–13 December 2000. Edited by J.A. Joins. Societyfor Computer Simulation International, San Diego Calif. pp.1227-–1234..
288 Can. J. Civ. Eng. Vol. 37, 2010
Published by NRC Research Press
Can
. J. C
iv. E
ng. D
ownl
oade
d fr
om w
ww
.nrc
rese
arch
pres
s.co
m b
y U
nive
rsity
of
Nor
th D
akot
a on
12/
21/1
4Fo
r pe
rson
al u
se o
nly.
Sills, D.M.L. 1998. Lake and land breezes in southwestern Ontario:observations, analyses and numerical modelling. Ph.D. thesis,York University, Toronto, Ont.
Sills, D.M.L., Scriver, S.J., and King, P.W.S. 2004. The tornadoesin Ontario project (TOP). In Preprints from the 22nd AMS Con-ference on Severe Local Storms, Hyannis, Mass, American Me-teorological Society, CD-ROM 7B.5.
Silverman, B.W. 1986. Density estimation for statistics and dataanalysis. Monographs on Statistics and Applied Probability,Chapman and Hall, London, UK.
Thom, H.C.S. 1963. Tornado probabilities. Monthly Weather Re-view, 91(10): 730–736. doi:10.1175/1520-0493(1963)091<0730:TP>2.3.CO;2.
Twisdale, L.A. 1978. Tornado data characterization and wind speedrisk. Journal of the Structural Division, 104(10): 1611–1630.
Twisdale, L.A., and Dunn, W.L. 1983. Probabilistic analysis of tor-nado wind risks. Journal of Structural Engineering, 109(2): 468–488. doi:10.1061/(ASCE)0733-9445(1983)109:2(468).
Twisdale, L.A., Dunn, W.L., Horie, Y., and Davis, T.L. 1981. Tor-nado missile simulation and design methodology. Vol. 2. Modelverification and database updates. Research Triangle Institute,Research Triangle Park, N.C.
Ward, N.B. 1972. The exploration of certain features of tornadodynamics using a laboratory model. Journal of the AtmosphericSciences, 29(6): 1194–1204. doi:10.1175/1520-0469(1972)029<1194:TEOCFO>2.0.CO;2.
Wen, Y.K. 1975. Dynamic tornado wind loads on tall buildings.Journal of the Structural Division, 101(1): 169–185.
Wen, Y.K., and Chu, S.L. 1973. Tornado risks and design windspeed. Journal of the Structural Division, 99(12): 2409–2421.
Ying, S.J., and Chang, C.C. 1970. Exploratory model study of tornadolike vortex dynamics. Journal of the Atmospheric Sciences, 27(1):3–14. doi:10.1175/1520-0469(1970)027<0003:EMSOTL>2.0.CO;2.
Tan and Hong 289
Published by NRC Research Press
Can
. J. C
iv. E
ng. D
ownl
oade
d fr
om w
ww
.nrc
rese
arch
pres
s.co
m b
y U
nive
rsity
of
Nor
th D
akot
a on
12/
21/1
4Fo
r pe
rson
al u
se o
nly.