Embed Size (px)
Citation preview
This is an author produced version of Influence of size and temperature on the phase stability and thermophysical properties of anatase TiO2 nanoparticles: molecular dynamicssimulation.
White Rose Research Online URL for this paper:http://eprints.whiterose.ac.uk/80466/
Article:
Okeke, G, Hammond, R and Antony, SJ (2013) Influence of size and temperature on the phase stability and thermophysical properties of anatase TiO2 nanoparticles: molecular dynamics simulation. Journal of Nanoparticle Research, 15. 1584. 1584 - 1592 (9). ISSN 1388-0764
https://doi.org/10.1007/s11051-013-1584-7
promoting access toWhite Rose research papers
[email protected]://eprints.whiterose.ac.uk/
1
Influence of Size and Temperature on the Phase
Stability and Thermophysical Properties of Anatase
TiO2 nanoparticles: Molecular Dynamics Simulation
George Okeke, Robert B. Hammond, S. Joseph Antony*
Institute of Particle Science and Engineering, School of Process Environment and Material Engineering
University of Leeds
*Corresponding author E-mail: [email protected]
Abstract
Nanoparticles have attracted the attention of researchers in a number of multidisciplinary fields
as they possess enhanced structural and physical properties, which make them desirable to a wide range
of industries. These enhancements have mostly been attributed to their large surface area-to-volume
ratio. However, the effect of temperature on the structural and surface properties of nanoparticles of
different sizes is still not well understood, an aspect addressed in the present work. Using molecular
dynamics simulations, we have performed investigations on Anatase TiO2 nanoparticles with sizes
ranging between two and six nm and at different temperatures. Structural and surface properties
including surface energies are reported for the different nanoparticle sizes, temperature and simulation
time step. Comparisons of surface energies for the different nanoparticle sizes show that surface energy
increases to a maximum (optimum value) especially for temperatures between 300 - 1500 K, as the
particle size increases after which no further significant increase is observed. Studies conducted on the
2
change of final structure with respect to the initial structure of the particles, revealed that atomic
structural disordering is more visible at the surface layer compared to the bulk or core of the final
structure. Further studies conducted on the sphericity of the nanoparticles showed that the particles
became less spherical with increase in temperature.
Keywords: Anatase TiO2, Molecular dynamics simulation, Surface energy, Sphericity
1. Introduction
Metal oxide particles at the nanometer size have a wide range of applications in areas such as
photonics, sensors, electronics and catalysis [1-2]. Generally, nanometer sized metal oxide particles
such as TiO2, have a large surface area per unit mass and have the potential of enhancing physical,
chemical and electrical properties compared to the equivalent properties manifested in the bulk form of
the material.
Anatase is one of the three main crystalline forms of Titanium dioxide, with the other two forms
known as Rutile and Brookite. Experimental evidence suggests that Anatase is the most
thermodynamically stable in the nanocrystalline form while the Rutile phase is more stable in the bulk
form [3]. Understanding the underlying mechanism behind phase stability and the thermophysical
properties of TiO2 phases is of great importance to scientists and engineers.
In this work, MD simulations were carried out on the Anatase phase of Titanium dioxide
nanoparticles with particle sizes ranging between 2 and 6 nm and temperatures between 300 and 2500
K, using the classical molecular dynamics code DL_POLY. Subsequently, structural and surface
properties were investigated. Additionally, surface energies of bulk crystal surfaces were calculated
using the General Utility Lattice Program (GULP) [4] for comparison with that of the nanoparticles of
different sizes. Also, the evolution of structural configuration and surface energy of the nanoparticles at
different temperatures was analyzed systematically. Although surface energy for different nanoparticle
3
sizes have been reported previously for limited cases at ambient conditions [5], here we go further to
report surface energy at different temperatures and for a range of particle size.
As part of the structural analysis, here we give a clear insight into the degree of shift of atoms
within the particles (for different particle sizes) from the centre, after a molecular dynamics run. Also,
the degree of sphericity of the particles after dynamics simulations was investigated. The method of
simulation and results of the analysis are presented in the sections below.
2. MD Simulations
2.1. Structure Configurations. The Accelrys Materials Studio 4.2 visualisation package was used to
create the TiO2 nanoparticles of the anatase phase. For this purpose, molecular lattice (Table 1)
parameters of Anatase TiO2 [5] were used to create the bulk crystal with a perfect lattice. Subsequently,
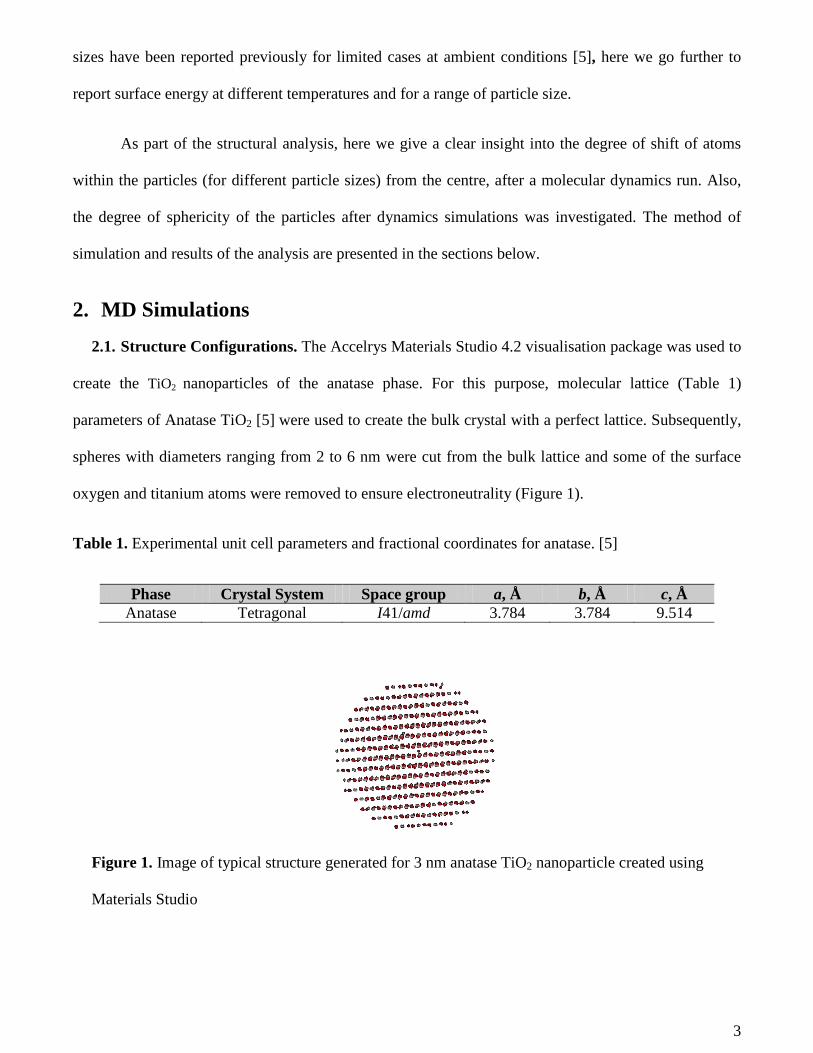
spheres with diameters ranging from 2 to 6 nm were cut from the bulk lattice and some of the surface
oxygen and titanium atoms were removed to ensure electroneutrality (Figure 1).
Table 1. Experimental unit cell parameters and fractional coordinates for anatase. [5]
Phase Crystal System Space group a, Å b, Å c, Å Anatase Tetragonal I41/amd 3.784 3.784 9.514
Figure 1. Image of typical structure generated for 3 nm anatase TiO2 nanoparticle created using
Materials Studio
4
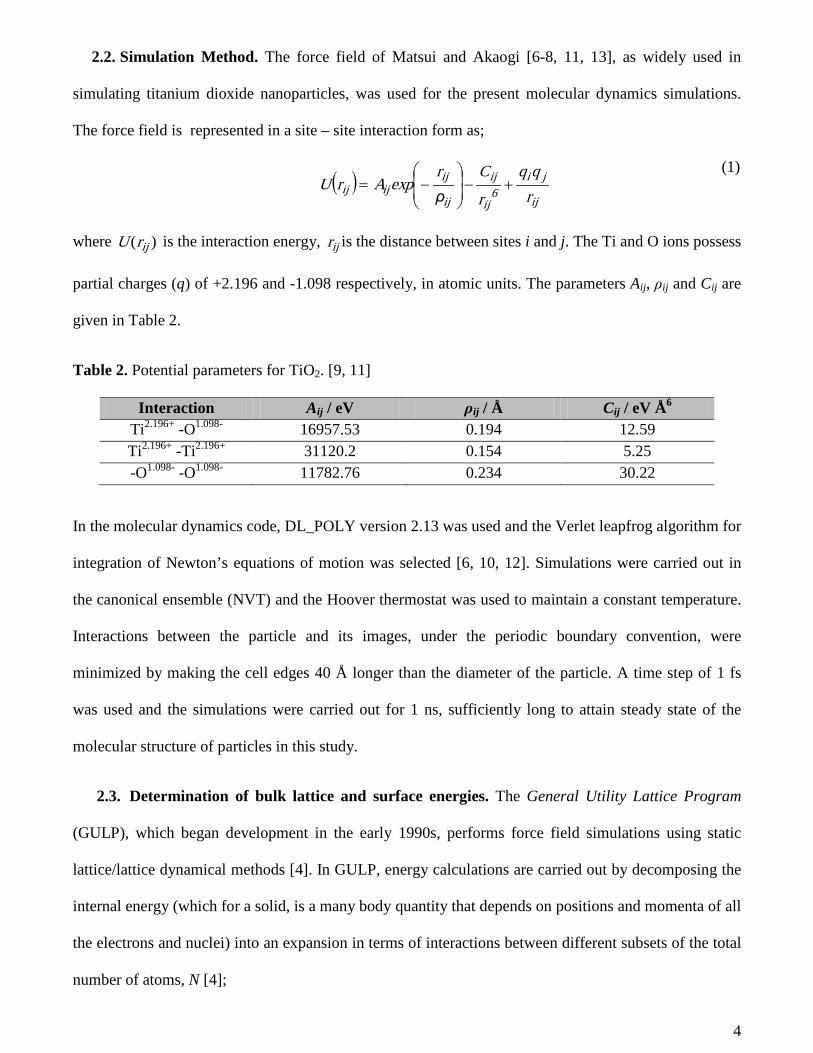
2.2. Simulation Method. The force field of Matsui and Akaogi [6-8, 11, 13], as widely used in
simulating titanium dioxide nanoparticles, was used for the present molecular dynamics simulations.
The force field is represented in a site – site interaction form as;
( )ij
ji6
ij
ij
ij
ijijij r
r
C
ȡr
expArU +−
−=
(1)
where )( ijrU is the interaction energy, ijr is the distance between sites i and j. The Ti and O ions possess
partial charges (q) of +2.196 and -1.098 respectively, in atomic units. The parameters Aij, ȡij and Cij are
given in Table 2.
Table 2. Potential parameters for TiO2. [9, 11]
Interaction Aij / eV ȡij / Å Cij / eV Å6 Ti2.196+ -O1.098- 16957.53 0.194 12.59 Ti2.196+ -Ti2.196+ 31120.2 0.154 5.25 -O1.098- -O1.098- 11782.76 0.234 30.22
In the molecular dynamics code, DL_POLY version 2.13 was used and the Verlet leapfrog algorithm for
integration of Newton’s equations of motion was selected [6, 10, 12]. Simulations were carried out in
the canonical ensemble (NVT) and the Hoover thermostat was used to maintain a constant temperature.
Interactions between the particle and its images, under the periodic boundary convention, were
minimized by making the cell edges 40 Å longer than the diameter of the particle. A time step of 1 fs
was used and the simulations were carried out for 1 ns, sufficiently long to attain steady state of the
molecular structure of particles in this study.
2.3. Determination of bulk lattice and surface energies. The General Utility Lattice Program
(GULP), which began development in the early 1990s, performs force field simulations using static
lattice/lattice dynamical methods [4]. In GULP, energy calculations are carried out by decomposing the
internal energy (which for a solid, is a many body quantity that depends on positions and momenta of all
the electrons and nuclei) into an expansion in terms of interactions between different subsets of the total
number of atoms, N [4];
5
∑ ∑∑ ∑∑∑= = = = = =
+++=N
i
N
i
N
i
N
i
N
j
N
kijkiji ....UUUU
1 1 1 1 1 16
1
2
1
(2)
where the first term represents the self energies of the atoms, the second the pairwise interaction, etc [4].
Equation 2 is a generic equation for carrying out energy calculations and since current study focuses on
pairwise interaction, only the second term in the equation was used. GULP adopts a two-region strategy
as a computational approach in calculating surface energy of a bulk material. In this approach, a single
surface is created and is divided into two regions (Figure 2). Region 1 contains the surface and all layers
of atoms below it that show significant atomic relaxation. Region 2 contains the rest of the bulk material
which have no displacements induced from the structure. Only the atoms of region 2 that have an
interaction with region 1 are explicitly considered and for this reason the depth of region 2 is controlled
by the force field cut-offs. The surface is sufficiently relaxed, and surface energy converged due to
interaction of atoms of both regions. Surface energy SEUǻ of a surface is defined as;
A
U-UU
bulksurfaceSE
)(=ǻ
(3)
Where bulkU is the bulk energy, surfaceU is the energy for a surface created in the same system and A,
the surface area.
6
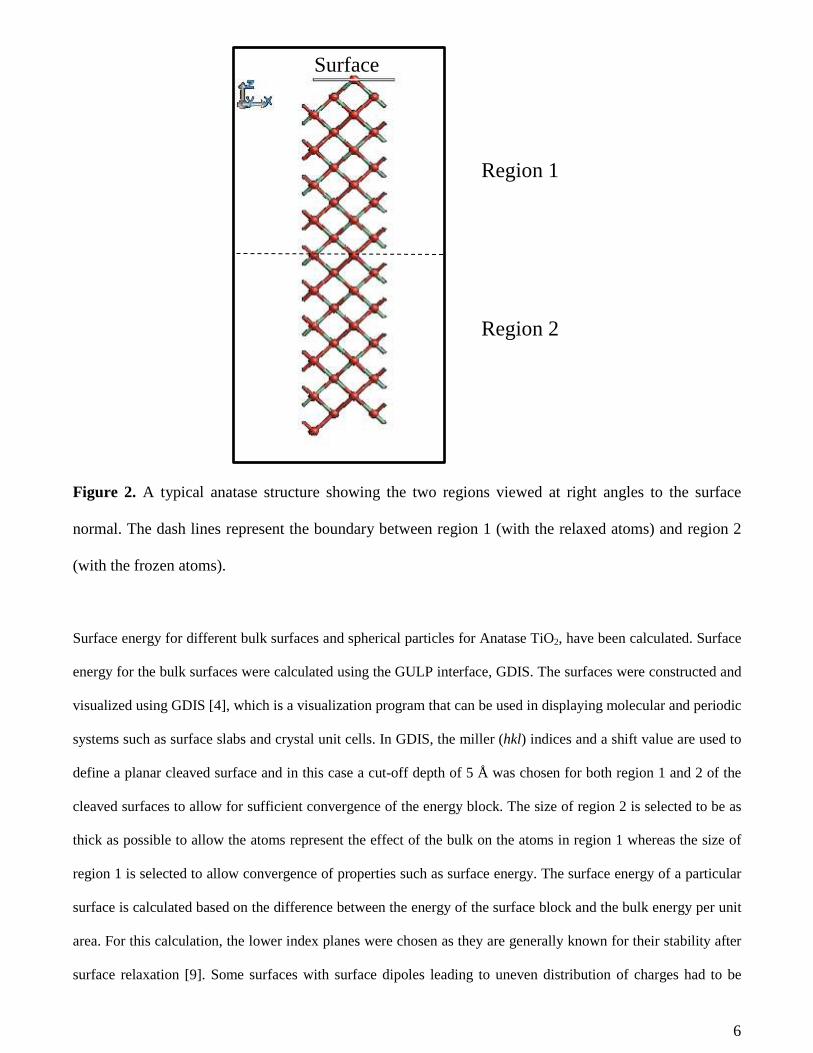
Figure 2. A typical anatase structure showing the two regions viewed at right angles to the surface
normal. The dash lines represent the boundary between region 1 (with the relaxed atoms) and region 2
(with the frozen atoms).
Surface energy for different bulk surfaces and spherical particles for Anatase TiO2, have been calculated. Surface
energy for the bulk surfaces were calculated using the GULP interface, GDIS. The surfaces were constructed and
visualized using GDIS [4], which is a visualization program that can be used in displaying molecular and periodic
systems such as surface slabs and crystal unit cells. In GDIS, the miller (hkl) indices and a shift value are used to
define a planar cleaved surface and in this case a cut-off depth of 5 Å was chosen for both region 1 and 2 of the
cleaved surfaces to allow for sufficient convergence of the energy block. The size of region 2 is selected to be as
thick as possible to allow the atoms represent the effect of the bulk on the atoms in region 1 whereas the size of
region 1 is selected to allow convergence of properties such as surface energy. The surface energy of a particular
surface is calculated based on the difference between the energy of the surface block and the bulk energy per unit
area. For this calculation, the lower index planes were chosen as they are generally known for their stability after
surface relaxation [9]. Some surfaces with surface dipoles leading to uneven distribution of charges had to be
Surface
Region 1
Region 2
7
reconstructed by moving the atoms so as to remove the dipoles. Non-dipolar surfaces give more accurate surface
energies.
3. Results and discussion
3.1 Surface Properties
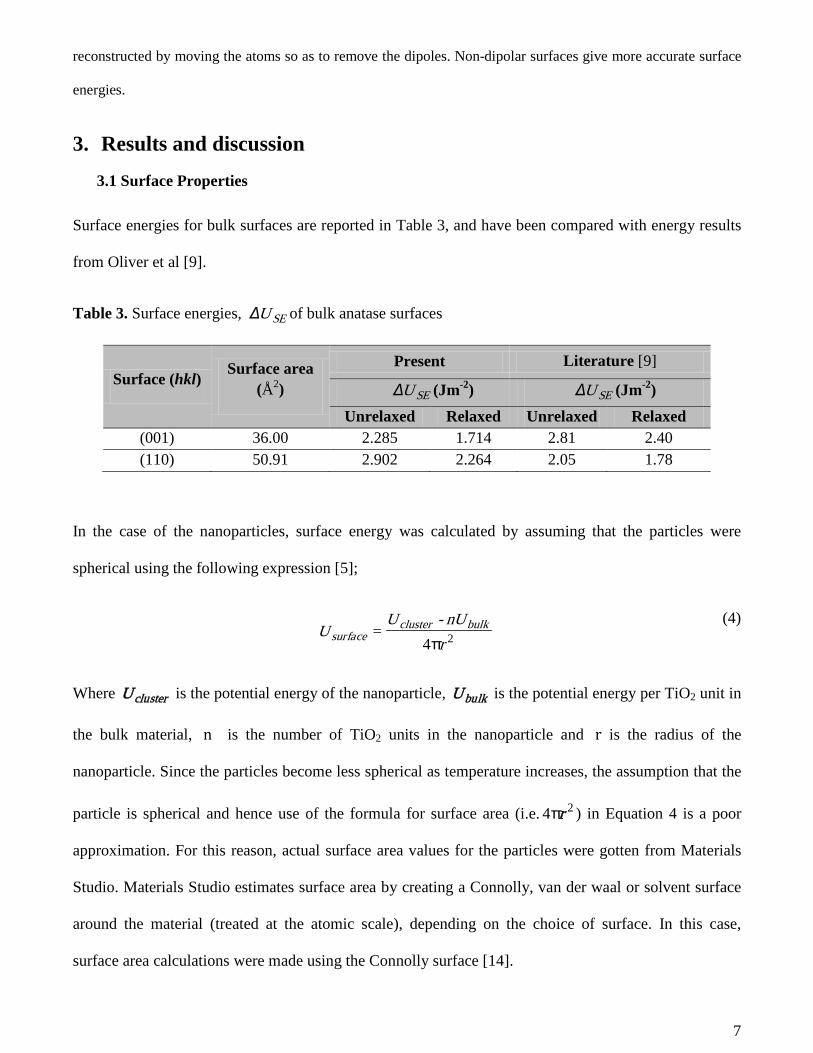
Surface energies for bulk surfaces are reported in Table 3, and have been compared with energy results
from Oliver et al [9].
Table 3. Surface energies, SEUǻ of bulk anatase surfaces
Surface (hkl) Surface area
(Å2)
Present Literature [9]
SEUǻ (Jm-2) SEUǻ (Jm-2)
Unrelaxed Relaxed Unrelaxed Relaxed (001) 36.00 2.285 1.714 2.81 2.40 (110) 50.91 2.902 2.264 2.05 1.78
In the case of the nanoparticles, surface energy was calculated by assuming that the particles were
spherical using the following expression [5];
ʌ4= 2r
nU-UU bulkcluster
surface (4)
Where clusterU is the potential energy of the nanoparticle, bulkU is the potential energy per TiO2 unit in
the bulk material, n is the number of TiO2 units in the nanoparticle and r is the radius of the
nanoparticle. Since the particles become less spherical as temperature increases, the assumption that the
particle is spherical and hence use of the formula for surface area (i.e.2ʌ4 r ) in Equation 4 is a poor
approximation. For this reason, actual surface area values for the particles were gotten from Materials
Studio. Materials Studio estimates surface area by creating a Connolly, van der waal or solvent surface
around the material (treated at the atomic scale), depending on the choice of surface. In this case,
surface area calculations were made using the Connolly surface [14].
8
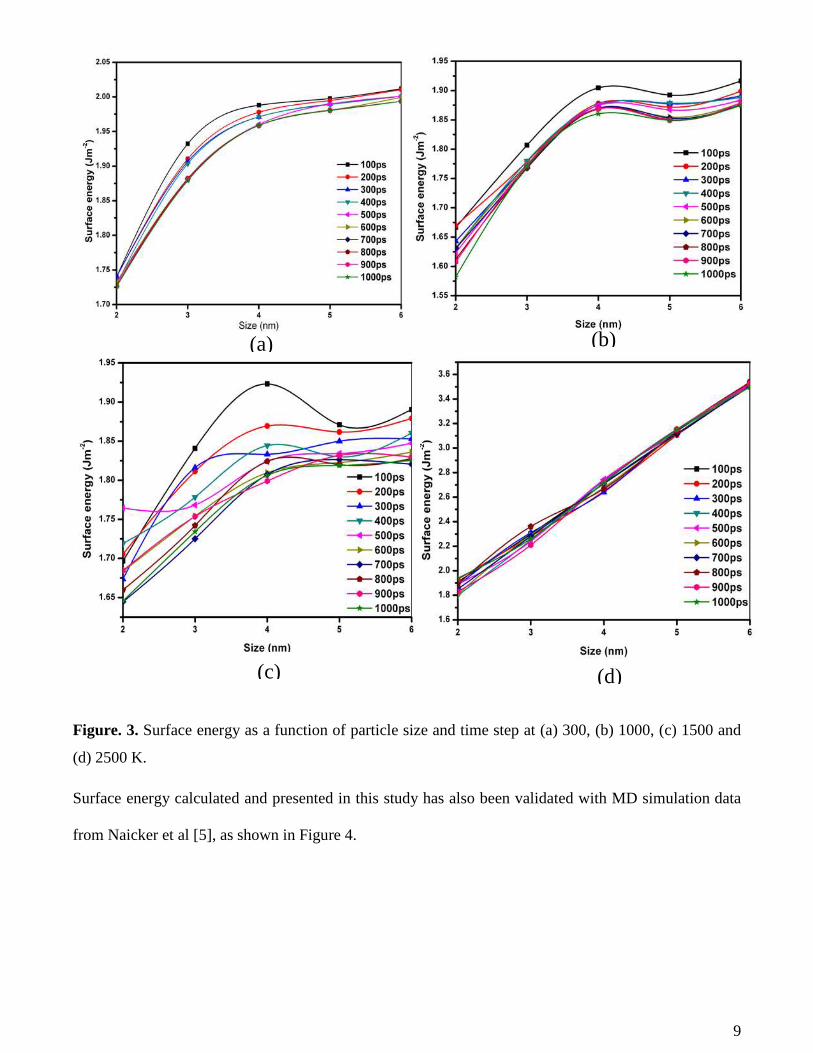
The dependence of surface energy on particle size, its evolution with time in the molecular dynamics
simulation and temperature has been investigated and results shown in Figure 3. In the case of 300 K, it
can be seen that for all time steps, the surface energy increased with particle size until a maximum is
reached above which no further increase is observed. In the case of 1000 K, an increase in surface
energy with particle size is observed until a maximum is reached above which there a slight decrease is
observed. At 1500 K and for most of the time steps, an observed fluctuation is associated with the
increase in surface energy for increasing particle size. This fluctuation through time may be indicative of
an annealing process occurring in the particle. The observation shows a high dependence of surface
energy on not only particle size but also especially temperature. The observed linear increase of surface
energy with particle size for 2500 K (which is not the case for 300, 1000 and 1500 K), could suggest
that the nanoparticles have reached their melting point (which is between 2250 and 2280 K,[7, 10]) and
have become more liquid-like.
9
Figure. 3. Surface energy as a function of particle size and time step at (a) 300, (b) 1000, (c) 1500 and
(d) 2500 K.
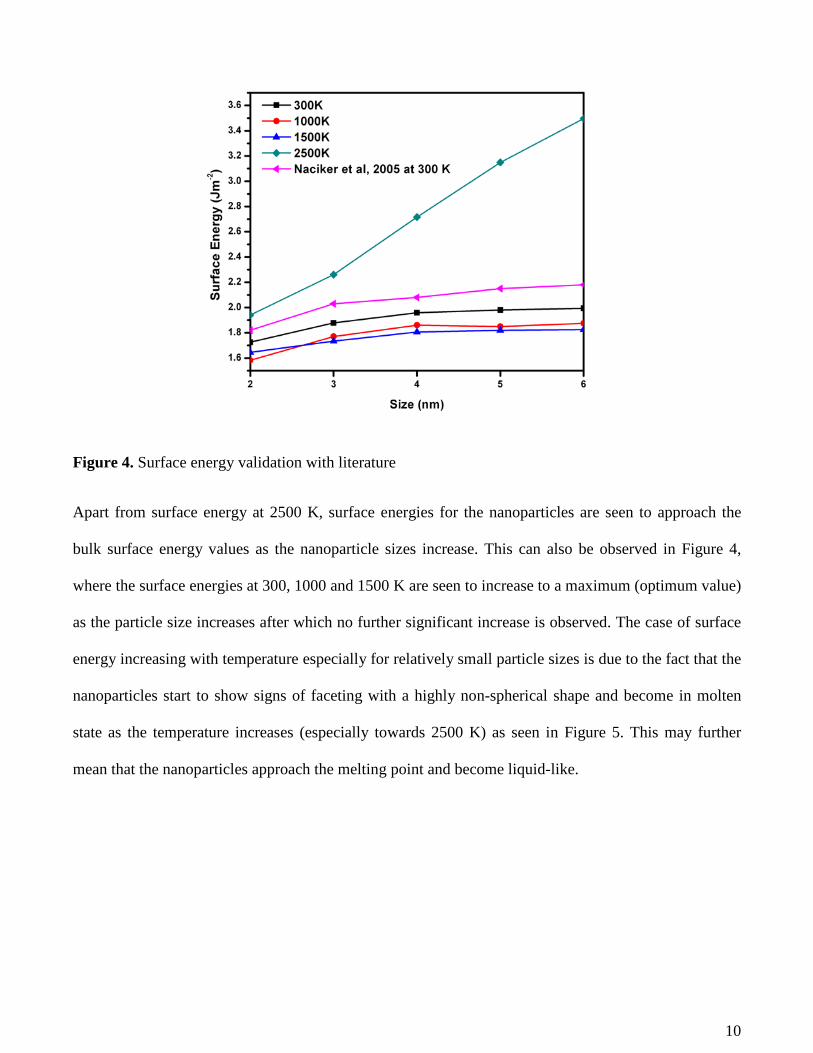
Surface energy calculated and presented in this study has also been validated with MD simulation data
from Naicker et al [5], as shown in Figure 4.
(a) (b)
(c) (d)
10
Figure 4. Surface energy validation with literature
Apart from surface energy at 2500 K, surface energies for the nanoparticles are seen to approach the
bulk surface energy values as the nanoparticle sizes increase. This can also be observed in Figure 4,
where the surface energies at 300, 1000 and 1500 K are seen to increase to a maximum (optimum value)
as the particle size increases after which no further significant increase is observed. The case of surface
energy increasing with temperature especially for relatively small particle sizes is due to the fact that the
nanoparticles start to show signs of faceting with a highly non-spherical shape and become in molten
state as the temperature increases (especially towards 2500 K) as seen in Figure 5. This may further
mean that the nanoparticles approach the melting point and become liquid-like.
11
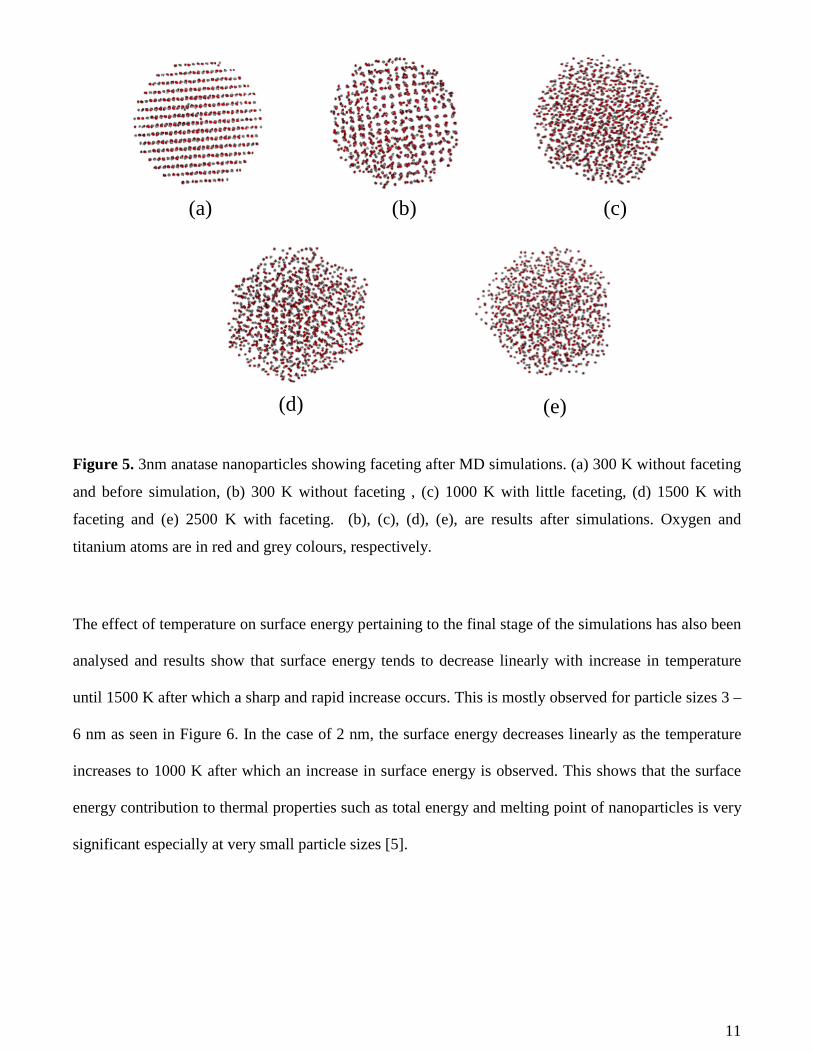
Figure 5. 3nm anatase nanoparticles showing faceting after MD simulations. (a) 300 K without faceting
and before simulation, (b) 300 K without faceting , (c) 1000 K with little faceting, (d) 1500 K with
faceting and (e) 2500 K with faceting. (b), (c), (d), (e), are results after simulations. Oxygen and
titanium atoms are in red and grey colours, respectively.
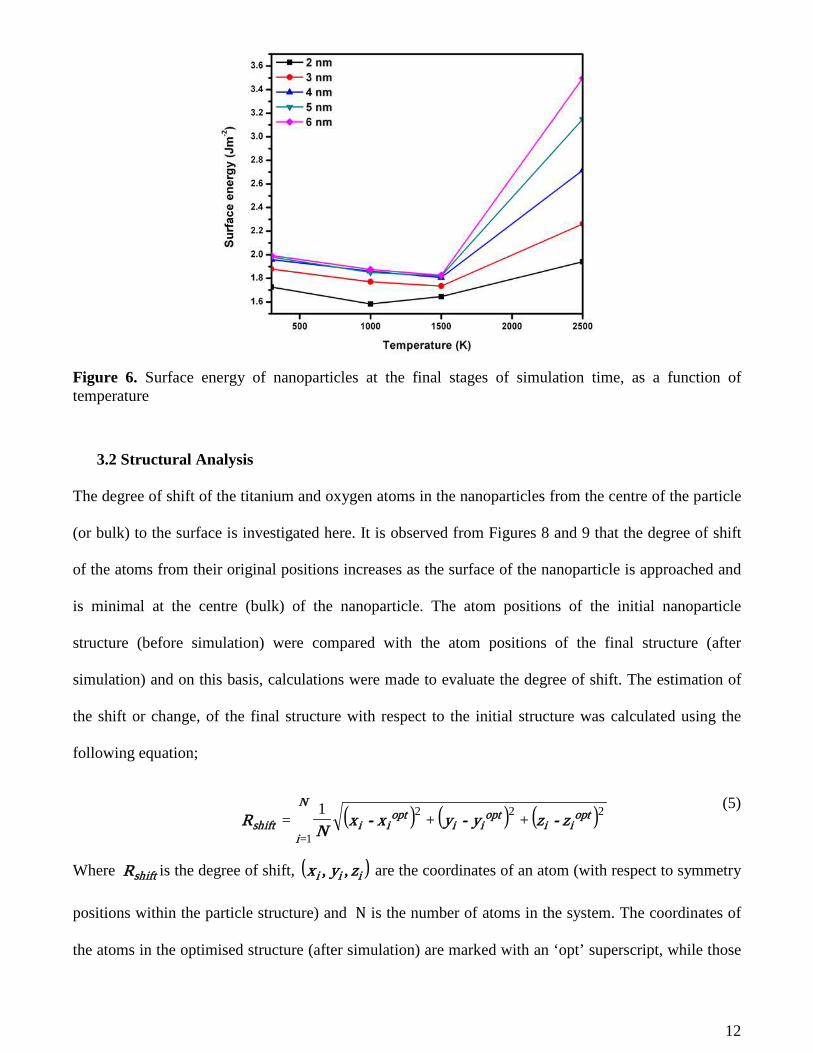
The effect of temperature on surface energy pertaining to the final stage of the simulations has also been
analysed and results show that surface energy tends to decrease linearly with increase in temperature
until 1500 K after which a sharp and rapid increase occurs. This is mostly observed for particle sizes 3 –
6 nm as seen in Figure 6. In the case of 2 nm, the surface energy decreases linearly as the temperature
increases to 1000 K after which an increase in surface energy is observed. This shows that the surface
energy contribution to thermal properties such as total energy and melting point of nanoparticles is very
significant especially at very small particle sizes [5].
(a) (b) (c)
(d) (e)
12
Figure 6. Surface energy of nanoparticles at the final stages of simulation time, as a function of temperature
3.2 Structural Analysis
The degree of shift of the titanium and oxygen atoms in the nanoparticles from the centre of the particle
(or bulk) to the surface is investigated here. It is observed from Figures 8 and 9 that the degree of shift
of the atoms from their original positions increases as the surface of the nanoparticle is approached and
is minimal at the centre (bulk) of the nanoparticle. The atom positions of the initial nanoparticle
structure (before simulation) were compared with the atom positions of the final structure (after
simulation) and on this basis, calculations were made to evaluate the degree of shift. The estimation of
the shift or change, of the final structure with respect to the initial structure was calculated using the
following equation;
( ) ( ) ( )䌥1=
222++
1=
N
i
optii
optii
optiishift z-zy-yx-x
NR
(5)
Where shiftR is the degree of shift, ( )iii zyx ,, are the coordinates of an atom (with respect to symmetry
positions within the particle structure) and N is the number of atoms in the system. The coordinates of
the atoms in the optimised structure (after simulation) are marked with an ‘opt’ superscript, while those
13
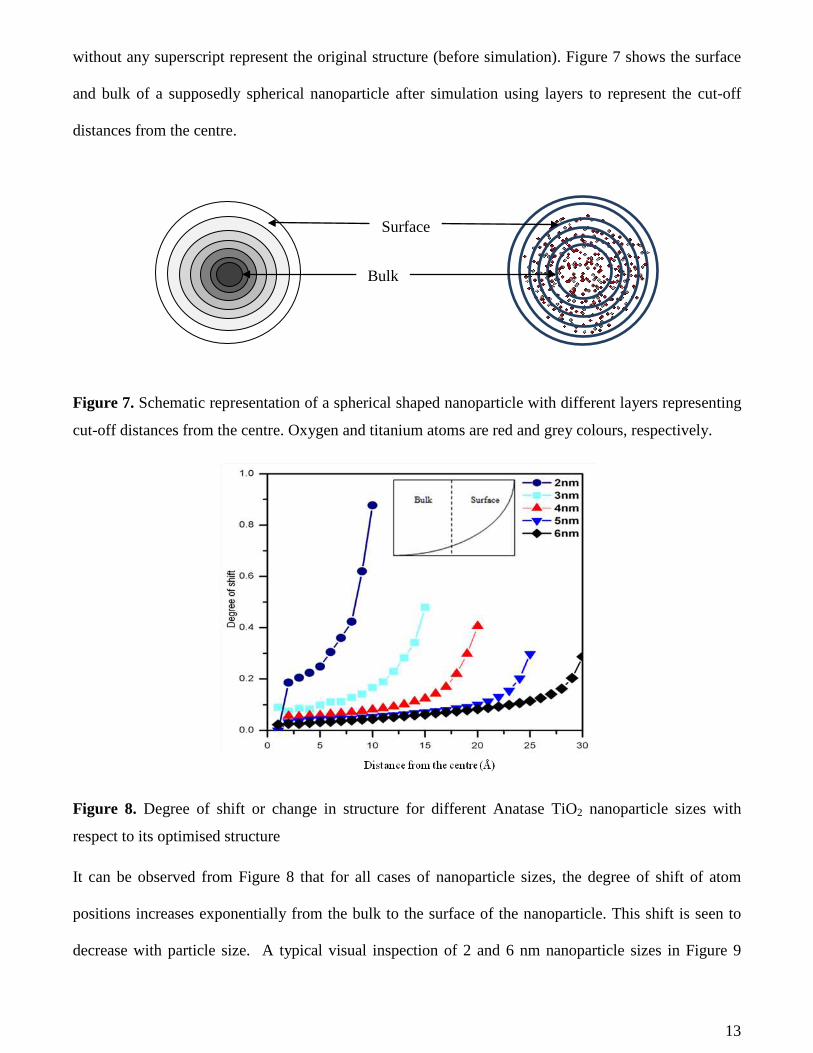
without any superscript represent the original structure (before simulation). Figure 7 shows the surface
and bulk of a supposedly spherical nanoparticle after simulation using layers to represent the cut-off
distances from the centre.
Figure 7. Schematic representation of a spherical shaped nanoparticle with different layers representing
cut-off distances from the centre. Oxygen and titanium atoms are red and grey colours, respectively.
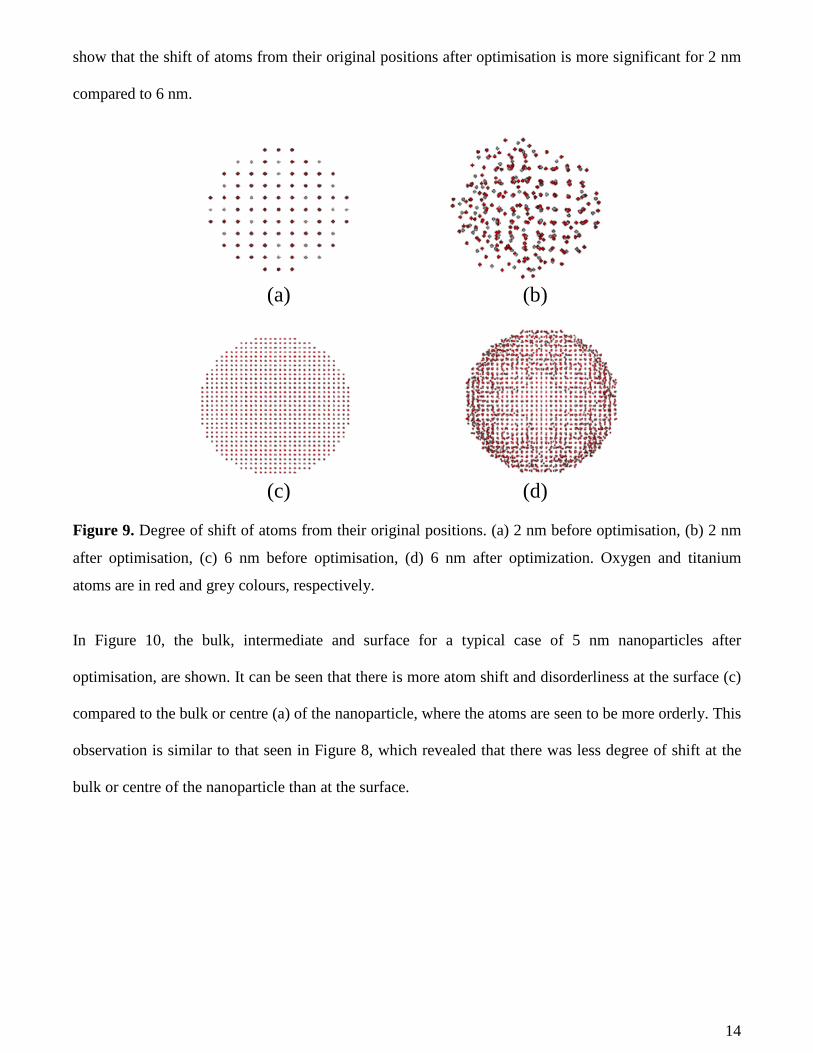
Figure 8. Degree of shift or change in structure for diff erent Anatase TiO2 nanoparticle sizes with
respect to its optimised structure
It can be observed from Figure 8 that for all cases of nanoparticle sizes, the degree of shift of atom
positions increases exponentially from the bulk to the surface of the nanoparticle. This shift is seen to
decrease with particle size. A typical visual inspection of 2 and 6 nm nanoparticle sizes in Figure 9
Surface
Bulk
14
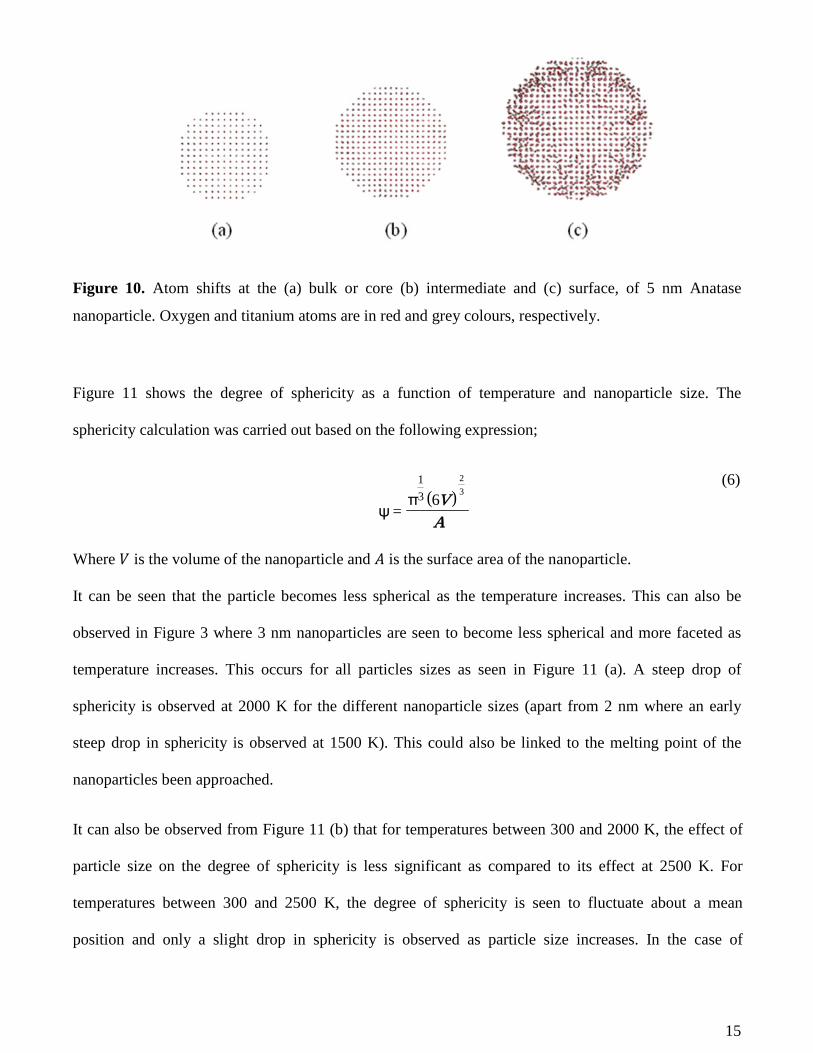
show that the shift of atoms from their original positions after optimisation is more significant for 2 nm
compared to 6 nm.
Figure 9. Degree of shift of atoms from their original positions. (a) 2 nm before optimisation, (b) 2 nm
after optimisation, (c) 6 nm before optimisation, (d) 6 nm after optimization. Oxygen and titanium
atoms are in red and grey colours, respectively.
In Figure 10, the bulk, intermediate and surface for a typical case of 5 nm nanoparticles after
optimisation, are shown. It can be seen that there is more atom shift and disorderliness at the surface (c)
compared to the bulk or centre (a) of the nanoparticle, where the atoms are seen to be more orderly. This
observation is similar to that seen in Figure 8, which revealed that there was less degree of shift at the
bulk or centre of the nanoparticle than at the surface.
(a) (b)
(c) (d)
15
Figure 10. Atom shifts at the (a) bulk or core (b) intermediate and (c) surface, of 5 nm Anatase
nanoparticle. Oxygen and titanium atoms are in red and grey colours, respectively.
Figure 11 shows the degree of sphericity as a function of temperature and nanoparticle size. The
sphericity calculation was carried out based on the following expression;
( )AV
3
2
6ʌ=ȥ
3
1
(6)
Where ܸ is the volume of the nanoparticle and ܣ is the surface area of the nanoparticle.
It can be seen that the particle becomes less spherical as the temperature increases. This can also be
observed in Figure 3 where 3 nm nanoparticles are seen to become less spherical and more faceted as
temperature increases. This occurs for all particles sizes as seen in Figure 11 (a). A steep drop of
sphericity is observed at 2000 K for the different nanoparticle sizes (apart from 2 nm where an early
steep drop in sphericity is observed at 1500 K). This could also be linked to the melting point of the
nanoparticles been approached.
It can also be observed from Figure 11 (b) that for temperatures between 300 and 2000 K, the effect of
particle size on the degree of sphericity is less significant as compared to its effect at 2500 K. For
temperatures between 300 and 2500 K, the degree of sphericity is seen to fluctuate about a mean
position and only a slight drop in sphericity is observed as particle size increases. In the case of
16
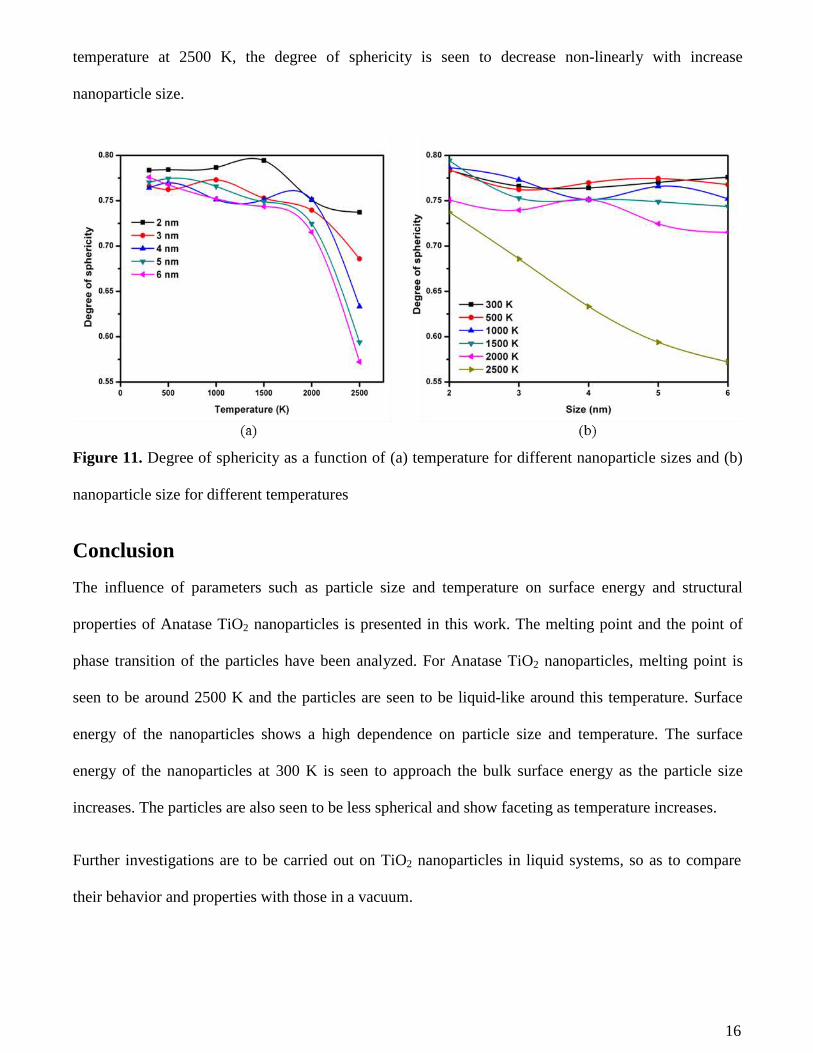
temperature at 2500 K, the degree of sphericity is seen to decrease non-linearly with increase
nanoparticle size.
Figure 11. Degree of sphericity as a function of (a) temperature for different nanoparticle sizes and (b)
nanoparticle size for different temperatures
Conclusion
The influence of parameters such as particle size and temperature on surface energy and structural
properties of Anatase TiO2 nanoparticles is presented in this work. The melting point and the point of
phase transition of the particles have been analyzed. For Anatase TiO2 nanoparticles, melting point is
seen to be around 2500 K and the particles are seen to be liquid-like around this temperature. Surface
energy of the nanoparticles shows a high dependence on particle size and temperature. The surface
energy of the nanoparticles at 300 K is seen to approach the bulk surface energy as the particle size
increases. The particles are also seen to be less spherical and show faceting as temperature increases.
Further investigations are to be carried out on TiO2 nanoparticles in liquid systems, so as to compare
their behavior and properties with those in a vacuum.
17
References
[1] Y. C. K. Soo-Jin Park, Ju Y. Park, Ed A. Evans, Rex D. Ramsier, and George G. Chase,
"Physical Characteristics of Titania Nanofibers Synthesized by Sol-Gel and Electrospinning
Techniques," Journal of Engineered Fibers and Fabrics, vol. 5, pp. 50-56, 2010.
[2] G. Okeke, S. Witharana, S. J. Antony and Y. Ding, "Computational analysis of factors
influencing thermal conductivity of nanofluids," Journal of Nanoparticle Research, vol. 13, pp.
6365-6375, 2011.
[3] V. N. Koparde and P. T. Cummings, "Phase Transformations during Sintering of Titania
Nanoparticles," ACS Nano, vol. 2, pp. 1620-1624, 2008.
[4] J. Gale and A. Rohl, "The general utility lattice program (GULP)," 2003.
[5] P. K. Naicker, P. T. Cummings, H. Zhang and J. F. Banfield, "Characterization of Titanium
Dioxide Nanoparticles Using Molecular Dynamics Simulations," The Journal of Physical
Chemistry B, vol. 109, pp. 15243-15249, 2005.
[6] V. N. Koparde and P. T. Cummings, "Molecular Dynamics Simulation of Titanium Dioxide
Nanoparticle Sintering," The Journal of Physical Chemistry B, vol. 109, pp. 24280-24287, 2005.
[7] D. Filyukov, E. N. Brodskaya, E. M. Piotrovskaya, S. W. de Leeuw "Molecular-dynamics
simulation of nanoclusters of crystal modifications of titanium dioxide," Russian Journal of
General Chemistry, vol. 77, pp. 10-16, 2007.
[8] V. N. Koparde and P. T. Cummings, "Molecular Dynamics Study of Water Adsorption on TiO2
Nanoparticles," The Journal of Physical Chemistry C, vol. 111, pp. 6920-6926, 2007.
[9] P. M. Oliver, G. W. Watson, E. T. Kelsey and S. C. Parker, "Atomistic simulation of the surface
structure of the TiO2 polymorphs rutileand anatase," Journal of Materials Chemistry, vol. 7, pp.
563-568, 1997.
[10] D. R. Collins, W. Smith, N. M. Harrison and T. R. Forester, "Molecular dynamics study of TiO2
microclusters," Journal of Materials Chemistry, vol. 6, pp. 1385-1390, 1996.
[11] M. Matsui and A. Masaki "Molecular Dynamics Simulation of the Structural and Physical
Properties of the Four Polymorphs of TiO2" Taylor and Francis, vol. 6, pp. 239-244, 1991.
[12] M. Alimohammadi and K. A. Fichthorn "Molecular Dynamics Simulation of the Aggregation of
Titanium Dioxide Nanocrystals: Preferential Alignment" Nano Letters, vol. 9, pp. 4198-4203,
2009.
[13] Y. Zhou and K. A. Fichthorn "Microscopic View of Nucleation in the Anatase-to-Rutile
Transformation" J. Phys. Chem. C, vol. 116, pp. 8314 - 8321, 2012.
18
[14] M. L. Connolly "Solvent-Accessible Surfaces of Proteins and Nucleic Acids" Science, vol. 221,
pp. 709 - 713, 1983