Embed Size (px)
Citation preview
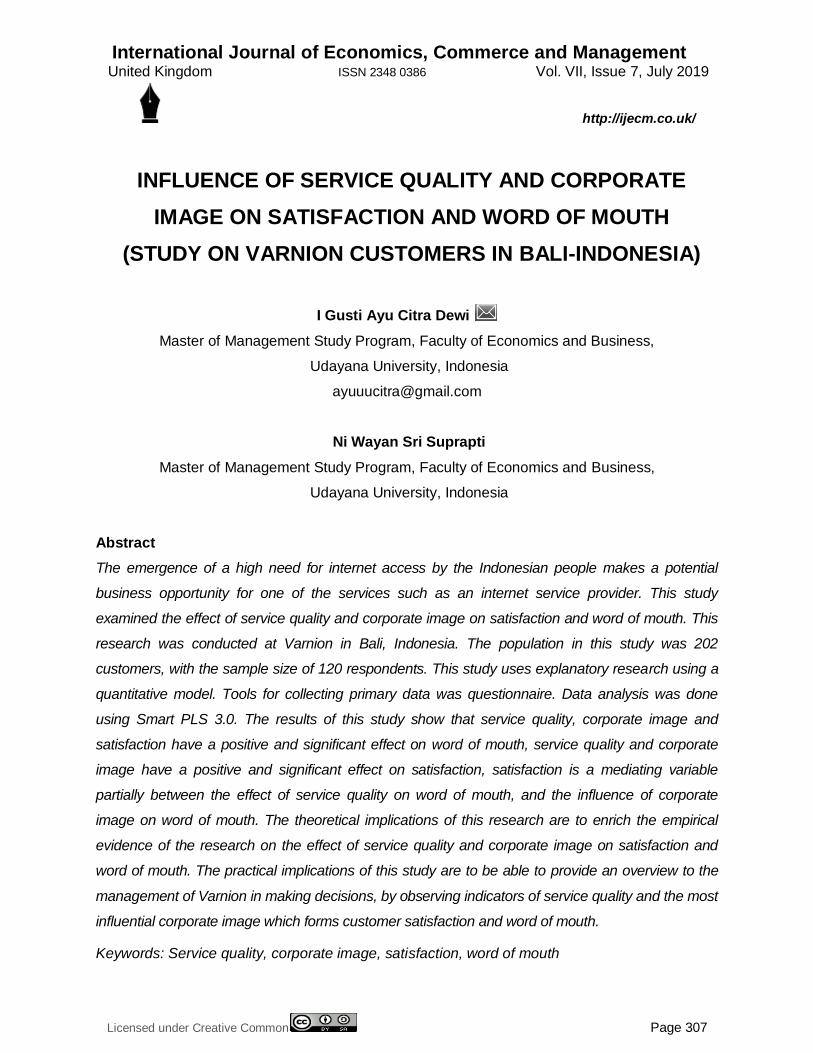
International Journal of Economics, Commerce and Management United Kingdom ISSN 2348 0386 Vol. VII, Issue 7, July 2019
Licensed under Creative Common Page 307
http://ijecm.co.uk/
INFLUENCE OF SERVICE QUALITY AND CORPORATE
IMAGE ON SATISFACTION AND WORD OF MOUTH
(STUDY ON VARNION CUSTOMERS IN BALI-INDONESIA)
I Gusti Ayu Citra Dewi
Master of Management Study Program, Faculty of Economics and Business,
Udayana University, Indonesia
Ni Wayan Sri Suprapti
Master of Management Study Program, Faculty of Economics and Business,
Udayana University, Indonesia
Abstract
The emergence of a high need for internet access by the Indonesian people makes a potential
business opportunity for one of the services such as an internet service provider. This study
examined the effect of service quality and corporate image on satisfaction and word of mouth. This
research was conducted at Varnion in Bali, Indonesia. The population in this study was 202
customers, with the sample size of 120 respondents. This study uses explanatory research using a
quantitative model. Tools for collecting primary data was questionnaire. Data analysis was done
using Smart PLS 3.0. The results of this study show that service quality, corporate image and
satisfaction have a positive and significant effect on word of mouth, service quality and corporate
image have a positive and significant effect on satisfaction, satisfaction is a mediating variable
partially between the effect of service quality on word of mouth, and the influence of corporate
image on word of mouth. The theoretical implications of this research are to enrich the empirical
evidence of the research on the effect of service quality and corporate image on satisfaction and
word of mouth. The practical implications of this study are to be able to provide an overview to the
management of Varnion in making decisions, by observing indicators of service quality and the most
influential corporate image which forms customer satisfaction and word of mouth.
Keywords: Service quality, corporate image, satisfaction, word of mouth
© Dewi & Suprapti
Licensed under Creative Common Page 308
INTRODUCTION
Indonesian people have the need for high internet access, making a potential business
opportunity for internet service providers, namely ISPs (Internet Service Providers). one of the
ISPs who saw the business opportunity was Varnion, who ventured to compete in the market.
Varnion is an ISP (Internet Service Provider) which was first established in Jakarta in 2006.
Varnion was established as a premium class ISP (Internet Service Provider) by offering the best
quality services and internet solutions. Varnion sets a B2B (Business to Business) target
market, which is to sell internet services intended for other businesses. Varnion's market focus
is on hotels, villas & restaurants. The development of Varnion's ISP (Internet Service Provider)
business in Jakarta has many customers ranging from three star hotels and above, so Varnion
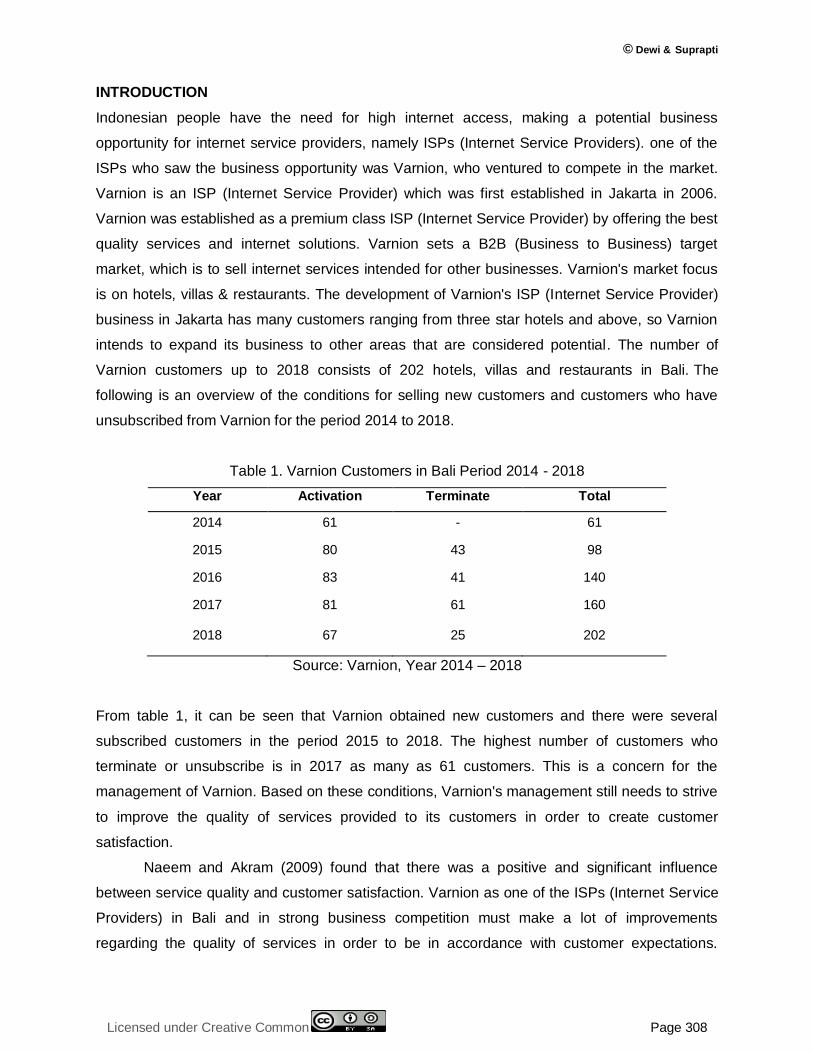
intends to expand its business to other areas that are considered potential. The number of
Varnion customers up to 2018 consists of 202 hotels, villas and restaurants in Bali. The
following is an overview of the conditions for selling new customers and customers who have
unsubscribed from Varnion for the period 2014 to 2018.
Table 1. Varnion Customers in Bali Period 2014 - 2018
Year Activation Terminate Total
2014 61 - 61
2015 80 43 98
2016 83 41 140
2017 81 61 160
2018 67 25 202
Source: Varnion, Year 2014 – 2018
From table 1, it can be seen that Varnion obtained new customers and there were several
subscribed customers in the period 2015 to 2018. The highest number of customers who
terminate or unsubscribe is in 2017 as many as 61 customers. This is a concern for the
management of Varnion. Based on these conditions, Varnion's management still needs to strive
to improve the quality of services provided to its customers in order to create customer
satisfaction.
Naeem and Akram (2009) found that there was a positive and significant influence
between service quality and customer satisfaction. Varnion as one of the ISPs (Internet Service
Providers) in Bali and in strong business competition must make a lot of improvements
regarding the quality of services in order to be in accordance with customer expectations.
International Journal of Economics, Commerce and Management, United Kingdom
Licensed under Creative Common Page 309
Satisfied customers are expected to be able to recommend Varnion services through word of
mouth communication, because word of mouth causes information to spread quickly (Jalilvand
et al, 2017). Then when customers who feel dissatisfied will submit a complaint, and can have a
negative impact on word of mouth.
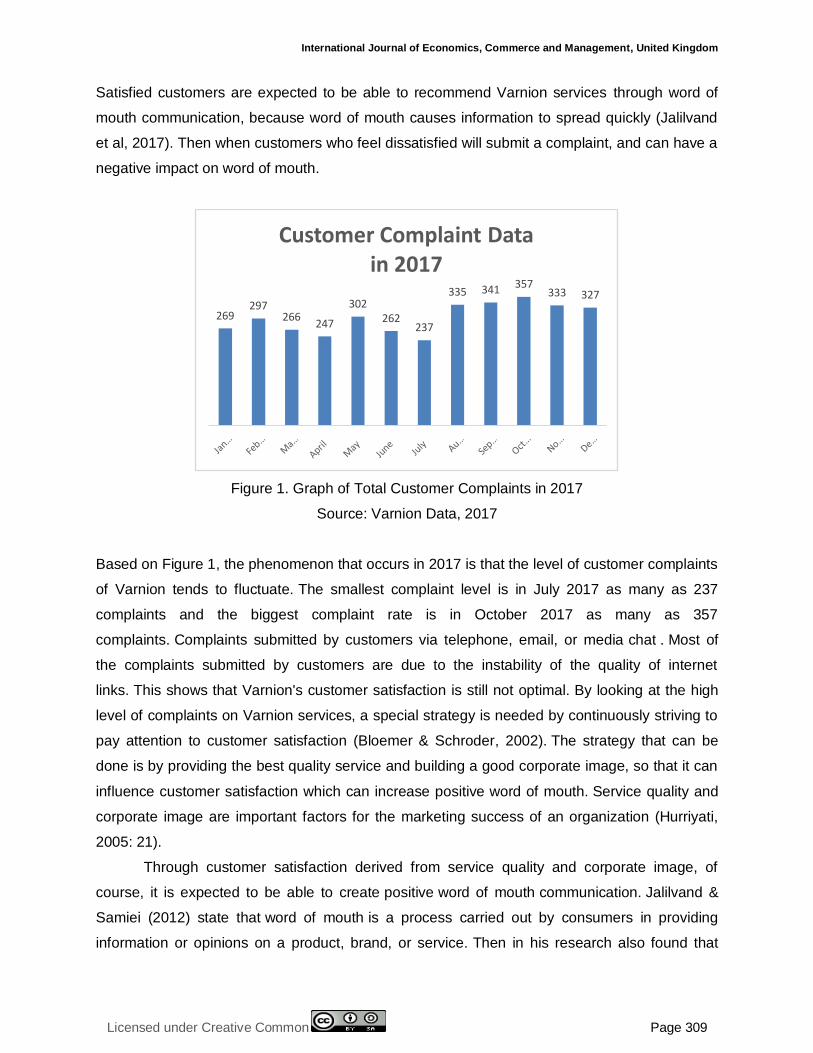
Figure 1. Graph of Total Customer Complaints in 2017
Source: Varnion Data, 2017
Based on Figure 1, the phenomenon that occurs in 2017 is that the level of customer complaints
of Varnion tends to fluctuate. The smallest complaint level is in July 2017 as many as 237
complaints and the biggest complaint rate is in October 2017 as many as 357
complaints. Complaints submitted by customers via telephone, email, or media chat . Most of
the complaints submitted by customers are due to the instability of the quality of internet
links. This shows that Varnion's customer satisfaction is still not optimal. By looking at the high
level of complaints on Varnion services, a special strategy is needed by continuously striving to
pay attention to customer satisfaction (Bloemer & Schroder, 2002). The strategy that can be
done is by providing the best quality service and building a good corporate image, so that it can
influence customer satisfaction which can increase positive word of mouth. Service quality and
corporate image are important factors for the marketing success of an organization (Hurriyati,
2005: 21).
Through customer satisfaction derived from service quality and corporate image, of
course, it is expected to be able to create positive word of mouth communication. Jalilvand &
Samiei (2012) state that word of mouth is a process carried out by consumers in providing
information or opinions on a product, brand, or service. Then in his research also found that
269297
266247
302262
237
335 341 357333 327
Customer Complaint Data in 2017
© Dewi & Suprapti
Licensed under Creative Common Page 310
about 15 percent of daily conversations related to some product or service content that was felt,
meaning that someone had done marketing activities through word of mouth. McKinsey
&Corporate in Balter (2008) also added that 76 percent of purchasing decisions are influenced
by word of mouth. It can be seen that positive word of mouth expressed by consumers of a
corporate to other consumers will also have a positive impact on the sales results of a
corporate.
This research was conducted to reexamine the influence of service quality and corporate
image on satisfaction and word of mouth. This research will be conducted on customers of
Varnion where the ISP (Internet Service Provider) is more focused on marketing activities in the
form of word of mouth or recommendations, and not many other promotional activities. Besides
the problems experienced by Varnion, there are still many complaints received from customers
regarding the quality of services provided to customers, where this can affect word of mouth that
occurs.
LITERATURE REVIEW
Service Quality
According to Tjiptono (2005) service quality is an expected level of excellence where control
over the level of excellence aims to meet customer needs. According to Usmara (2008) service
quality is an attitude from the results of a comparison of the expectations of quality of consumer
services with the corporate's performance perceived by consumers. Based on the opinions of
the experts above, it can be concluded that the quality of service is a measure of the level of
superiority expected by the consumer or the level of comparison of service quality expectations
with the corporate's performance perceived by consumers to be price controllers. So the main
goal of a corporate is to create the best quality service.
1. Service characteristics. According Tjiptono (2006) there are four principal characteristics of
the services that distinguishes the goods, namely: Intangibility, Inseparability, Variability,
and Perishability
2. Dimensions of service quality. According to Kotler and Keller (2009: 53) there are five main
dimensions of service quality, namely: Tangible, Emphaty, Responsiveness, Reliability, and
Assurance.
Corporate Image
Image for the corporate is very important because a good image of the corporate will have a
positive and profitable impact while a bad image will have a negative impact on the
corporate. The importance of the image for the corporate was also revealed by Smith (1995:
International Journal of Economics, Commerce and Management, United Kingdom
Licensed under Creative Common Page 311
334) that corporate image can also provide important meanings as follows: 1) Creating
competitive advantage, 2) Becoming corporate equity, 3) Supporting new product launches, 4)
Increasing sales, 5) Creating creditor trust, investor or investor, 6) Creating harmonization in
relations between employees, 7) Able to get good new employees, 8) Encouraging success in
critical management, 9) Associated with product / service names. Good experience from
customers for the use of products or services produced by the corporate will produce a good
perception of the corporate's image, and at that moment what the corporate image will form.
According Kanaidi (2010: 33) indicator of corporate image formation includes a collection
of impressions, beliefs, attitudes. According to Kotler (2003) indicator impressions, beliefs,
attitudes have been proven in measuring the corporate's image in the bank sector inPakistan. It
is also supported by Wu (2014), which mainly uses indicators impressions in measuring the
gaming industry corporate image.
Customer satisfaction
According to Kotler in Sunyoto (2013: 35), customer satisfaction is the level of one's feelings
after comparing (performance or results) that is felt compared to expectations. Customers can
experience one of three levels of general satisfaction, namely if the performance is below
expectations, the customer will feel disappointed but if the performance is in line with
expectations the customer will feel satisfied and if the performance can exceed expectations,
the customer will feel very happy or happy.
Conformity that experiences a discrepancy between expectations and the actual
performance of services or products, the customer is at disconfirmation. So it can be concluded
from some of these meanings according to experts, that customer satisfaction is the level of
one's feelings when receiving products or services offered and comparing the performance of
products or services received with expectations that are owned.
One of the corporate's main goals is to maximize customer satisfaction. Therefore, most
companies always try to measure the extent to which they treat their customers and to identify
factors that can create customer satisfaction, so that in the end the corporate is able to
determine changes in marketing and operational activities. The reason the corporate measures
the level of customer satisfaction is because satisfaction is the key to being part of
customer retention.
Here are some questions that are used to determine the level of customer satisfaction
with the quality of library services in Germany (Petri & Graumman, 2014):
a) How satisfied are library users overall?
b) How do the services provided by the library relate to the quality of each product?
© Dewi & Suprapti
Licensed under Creative Common Page 312
c) What is the quality of products and services compared to those provided by other libraries?
Other research also mentions that consumer satisfaction can be measured on the basis of the
experience they feel after using or receiving a product or service, the perceived feelings for the
product or service, and the perceived needs that are fulfilled as a result of using products or
services (Kasim & Abdullah, 2010; Espejel et al., 2009). This is also supported by research
conducted by Shi et al.(2016) that measures customer satisfaction through products or services
that meet customer expectations, according to needs, and overall feel satisfied. Then Wang et
al. (2017) also in his research, namely measuring the satisfaction of the overall tourist
customers.
Word of Mouth
Hawkins and Mothersbaugh in Suryani (2013: 169), say that consumers learn about products
through experience or observation of the use of other consumer products and seek information
by asking other consumers who know and have used products to buy. According to Silverman in
Oktavianto (2013: 67), word of mouth is so strong because of its independent beliefs and the
delivery of its experiences. Then Peter and Oslon in Sunyoto (2013: 166), said that because
information obtained from a friend or relative is a form of communication that is very strong in
promoting and creating word of mouth.
Some factors that can be used as the basis of motivation for consumers to do word of
mouth (Machfoedz, 2010: 78) include:
a) Someone might be so involved with a particular product or activity and intend to talk about it
to others so that the word of mouth process occurs .
b) Someone might know a lot about the product and use conversation as a way to inform
others.
c) Someone might start a discussion by talking about something that comes out of the main
concern of the discussion. In this case it might be because of the encouragement and
desire that other people should not be wrong in choosing goods and do not spend time
looking for information about a product brand.
Word of mouth can be an effective means of disseminating an opinion because it usually occurs
face-to-face interaction in conversations between people who know each other, either as a drive
or friend. According to Jalilvand and Samiei (2012) in his research also stated that
measuring word of mouth can be known when consumers discuss positive things about
products or services, recommend to others, invite others to use the same services, and be able
to mention the brand of product or service in question. Based on the research framework that is
International Journal of Economics, Commerce and Management, United Kingdom
Licensed under Creative Common Page 313
Service
Quality
Corporate
Image
Customer
Satisfaction Word of
Mouth
H2
H4
H5
H1
H3
H6
H7
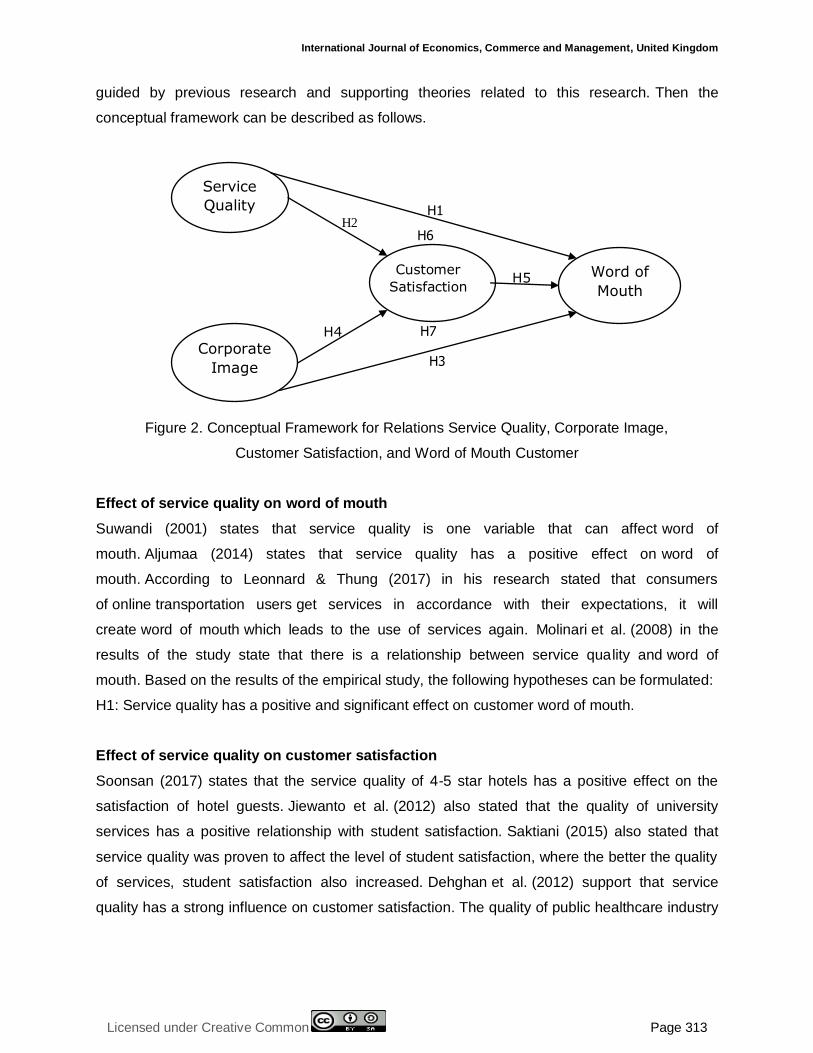
guided by previous research and supporting theories related to this research. Then the
conceptual framework can be described as follows.
Figure 2. Conceptual Framework for Relations Service Quality, Corporate Image,
Customer Satisfaction, and Word of Mouth Customer
Effect of service quality on word of mouth
Suwandi (2001) states that service quality is one variable that can affect word of
mouth. Aljumaa (2014) states that service quality has a positive effect on word of
mouth. According to Leonnard & Thung (2017) in his research stated that consumers
of online transportation users get services in accordance with their expectations, it will
create word of mouth which leads to the use of services again. Molinari et al. (2008) in the
results of the study state that there is a relationship between service quality and word of
mouth. Based on the results of the empirical study, the following hypotheses can be formulated:
H1: Service quality has a positive and significant effect on customer word of mouth.
Effect of service quality on customer satisfaction
Soonsan (2017) states that the service quality of 4-5 star hotels has a positive effect on the
satisfaction of hotel guests. Jiewanto et al. (2012) also stated that the quality of university
services has a positive relationship with student satisfaction. Saktiani (2015) also stated that
service quality was proven to affect the level of student satisfaction, where the better the quality
of services, student satisfaction also increased. Dehghan et al. (2012) support that service
quality has a strong influence on customer satisfaction. The quality of public healthcare industry
© Dewi & Suprapti
Licensed under Creative Common Page 314
service affects patient satisfaction (Kitapci et al.2014). Based on the results of the empirical
study, the following hypotheses can be formulated:
H2: Service quality has a positive and significant effect on customer satisfaction.
Effect of corporate image on word of mouth
Harsono (2014) states that the better the image of the institution will increase the positive word
of mouth of the students. This is also supported by research by Jiewanto et al. (2012) stated
that a good university image will have an impact on word of mouth. Saktiani (2015) said that
corporate image proved to have a positive effect on word of mouth. Long-Yi et al. (2010) found
the influence of corporate image on word of mouth. According to Bravo et al. (2012) a good
corporate image will form positive word of mouth communication from customers. Based on the
results of the empirical study, the following hypotheses can be formulated:
H3: Corporate image has a positive and significant effect on customer word of mouth.
Effect of corporate image on customer satisfaction
When services are difficult to evaluate, the corporate image is believed to be an important factor
that influences perceived quality, evaluates customer satisfaction with service, and customer
loyalty (Andreassen and Lindestad, 1997). Ali et al. (2015) said that the corporate's image was
able to influence customer satisfaction. Sallam (2016) in his research stated that corporate
image has a positive influence on customer satisfaction. Hu et al. (2011) support that corporate
image has a positive impact on customer satisfaction. And in the study of Alireza et al. (2011)
states that the image is a variable that affects customer satisfaction. Based on the results of the
empirical study, the following hypotheses can be formulated:
H4: Corporate image has a positive and significant effect on customer satisfaction.
Effect of customer satisfaction on word of mouth
Customer satisfaction can create several benefits, including the relationship between corporate
and customer to be harmonious, providing a good basis for repeat purchases, creating
customer loyalty, and word of mouth recommendations that will benefit the corporate (Singh &
Thakur, 2012). According to Ennew in Chaniotakis (2009) emphasizes the importance of
creating customer satisfaction as a positive determinant of word of mouth. This is supported by
Kitapci et al. (2014) which proves that consumer satisfaction influences word of mouth. Brown et
al. (2005) state that there is a positive influence between customer satisfaction and word of
mouth. Wang et al. (2017) also found a similar thing, namely tourist satisfaction with the quality
International Journal of Economics, Commerce and Management, United Kingdom
Licensed under Creative Common Page 315
of tourist destinations has a positive and significant influence on word of mouth. Based on the
results of the empirical study, the following hypotheses can be formulated:
H5: Customer satisfaction has a positive and significant effect on customer word of mouth.
The role of customer satisfaction in mediating the quality of service to word of mouth
Afridi et al. (2018) in his research stated that the satisfaction of private university students in
Peshawar mediates the relationship between the quality of word of mouth services. This is
supported by Handayanto's research (2018) where student satisfaction in the Islamic
Private Universities in Indonesia mediates the quality of service to word of mouth. According to
Saputro (2012) satisfaction mediates in full the relationship between service quality and word of
mouth and interest in repurchasing. Based on the results of the empirical study, the following
hypotheses can be formulated:
H6: Customer satisfaction is a mediating variable in the relationship between service quality
and word of mouth.
The role of customer satisfaction in mediating the corporate image of word of mouth
Sallam (2016) stated that in his research customer satisfaction and trust mediated the
corporate's image on customer word of mouth. Research by Nasirudin et al. (2018) also states
that the consumer satisfaction of the Conato Shop Store in Jember mediates the relationship
between consumer image and word of mouth. Kurniawan (2016) in his research stated that the
image relationship to consumer intentions for word of mouth was mediated by satisfaction of
BPJS users in Ponorogo Regency. Based on the results of the empirical study above,
hypotheses can be arranged as follows:
H7: Customer satisfaction is a mediating variable in the relationship between corporate image
and word of mouth.
RESEARCH METHOD
This study uses explanatory research i.e. research that explains a relationship between
variables through testing hypotheses (Ghozali, 2008: 2). The study uses a quantitative
model. The scope of this study includes the location of the Bali, Indonesia.
Research variables
1) Exogenous variables in this study are service quality (X1) and corporate image (X2)
2) Endogenous variables in this study are customer satisfaction (Y1) and customer word of
mouth (Y2).
© Dewi & Suprapti
Licensed under Creative Common Page 316
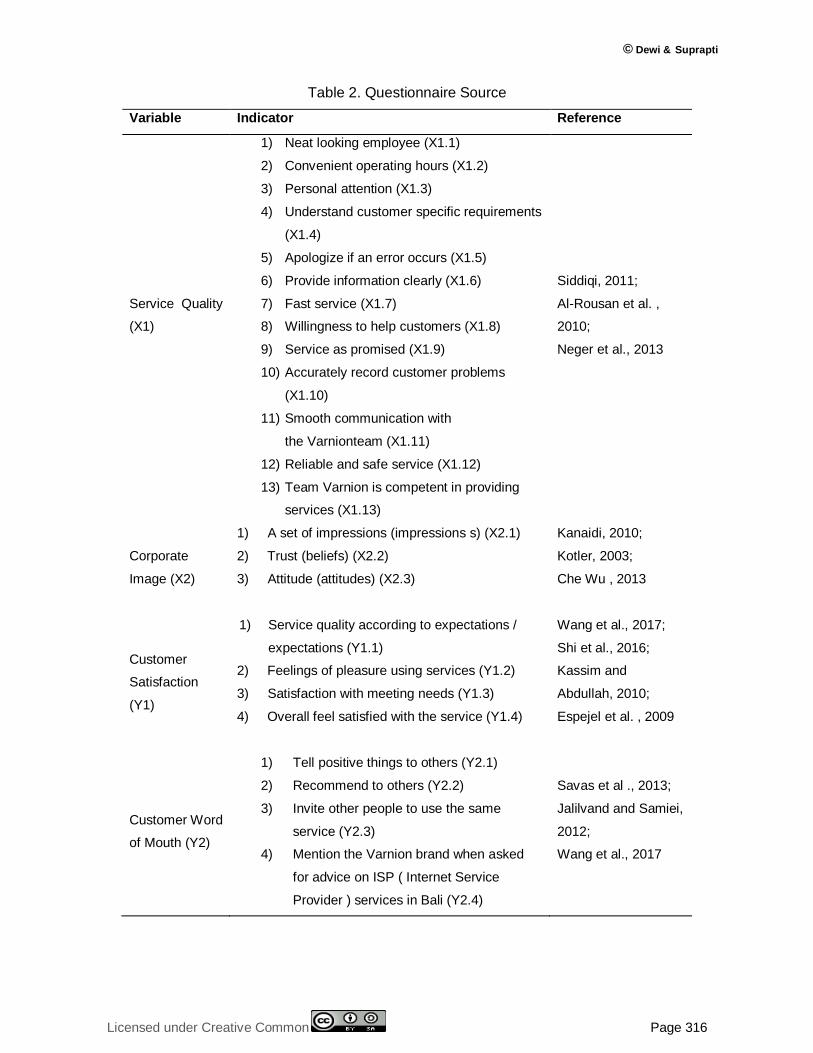
Table 2. Questionnaire Source
Variable Indicator Reference
Service Quality
(X1)
1) Neat looking employee (X1.1)
2) Convenient operating hours (X1.2)
3) Personal attention (X1.3)
4) Understand customer specific requirements
(X1.4)
5) Apologize if an error occurs (X1.5)
6) Provide information clearly (X1.6)
7) Fast service (X1.7)
8) Willingness to help customers (X1.8)
9) Service as promised (X1.9)
10) Accurately record customer problems
(X1.10)
11) Smooth communication with
the Varnionteam (X1.11)
12) Reliable and safe service (X1.12)
13) Team Varnion is competent in providing
services (X1.13)
Siddiqi, 2011;
Al-Rousan et al. ,
2010;
Neger et al., 2013
Corporate
Image (X2)
1) A set of impressions (impressions s) (X2.1)
2) Trust (beliefs) (X2.2)
3) Attitude (attitudes) (X2.3)
Kanaidi, 2010;
Kotler, 2003;
Che Wu , 2013
Customer
Satisfaction
(Y1)
1) Service quality according to expectations /
expectations (Y1.1)
2) Feelings of pleasure using services (Y1.2)
3) Satisfaction with meeting needs (Y1.3)
4) Overall feel satisfied with the service (Y1.4)
Wang et al., 2017;
Shi et al., 2016;
Kassim and
Abdullah, 2010;
Espejel et al. , 2009
Customer Word
of Mouth (Y2)
1) Tell positive things to others (Y2.1)
2) Recommend to others (Y2.2)
3) Invite other people to use the same
service (Y2.3)
4) Mention the Varnion brand when asked
for advice on ISP ( Internet Service
Provider ) services in Bali (Y2.4)
Savas et al ., 2013;
Jalilvand and Samiei,
2012;
Wang et al., 2017
International Journal of Economics, Commerce and Management, United Kingdom
Licensed under Creative Common Page 317
Data collection
Nature of data
1) The quantitative data collected in this study is the number of respondents or Varnion
customers.
2) Qualitative data in this study, including name and type of business, respondent's
position, and respondents' perceptions regarding the variables and indicators studied.
Data source
1) The primary data used in this study is data obtained from respondent answers to a
series of questions on the questionnaire submitted by the researcher. While
respondents who answered questionnaires were customers who used Varnion
services.
2) The data used in this study are data owned by the corporate, library studies, literature,
previous research journals, and articles relating to the problems under study.
Population and research sample
The population in this study is customers who use Varnion services at least one month or the
number of customers until December 2018, which is 202 customers. Determination of the
sample in this study refers to the opinion of Ferdinand (2002: 51) which states that the sample
size depends on the number of indicators multiplied by 5 to 10. The total indicator variables
used in this study are 24 indicators, the minimum sample size is 120 and maximum of 240
respondents. Because the population is close to the maximum sample size, this study targets a
population of 202 customers.
Method of collecting data
Data collection is done by distributing questionnaires to respondents who have met the
specified criteria and collected secondary data obtained from Varnion management. The
distribution of questionnaires was done in two ways, namely email blast and distribution by
the customer relations team to 202 Varnion customers.
Instrument for data collection
Data collection was done through questionnaires submitted to each selected
respondent. Collecting data using closed questions given to respondents directly The questions
on the closed questionnaire were made with a Likert Summated Rating scale. In this
study using a Likert Summated Rating scale which is measured by giving a score as follows:
1. Score / score 1 indicates a strongly disagree (SD) response.
© Dewi & Suprapti
Licensed under Creative Common Page 318
2. Score / value 2 indicates disagree (D) response.
3. Score / value 3 indicates a neutral (N) response.
4. Score / value 4 indicates the agreed (A) response.
5. Score / value 5 indicates the strongly agrees (SA) response.
Instrument testing
1) Test Validity . The criteria for testing validity is to compare the r count with r table, at a
significant level of 95% or = 5%. According to Sugiyono (2017: 125), the
questionnaire item is called valid if the questionnaire item has r count> r standard =
0.30.
2) Reliability Test. The tool for measuring reliability is Cronbach Alpha . A variable is said
to be reliable, if the results of α> 0.60 = reliable and results α <0.60 = not reliable
(Ghozali, 2009: 49).
Data analysis approach
Descriptive statistical analysis
Descriptive analysis is intended to find out the characteristics and responses of respondents to
the items in the questionnaire. Descriptive statistics used are frequency tables that describe the
distribution of respondents' answers for each indicator and the average score obtained.
Inferential statistical analysis
This study uses Partial Least Square (PLS), with the help of SmartPLS 3 software, PLS was first
developed by Herman Wold (Ghozali, 2014: 29) as a general method for estimating path
models that describe latent constructs with multiple indicators. PLS is intended to be causal-
predictive analysis in situations of high complexity and low theoretical support. Wold mentions
PLS as soft modeling . PLS is a powerful analytical method because it can be applied to all data
scales, does not require much assumption and can also be used for relatively small sample
sizes (minimum recommended ranges from 30 to 100).
The PLS approach is distribution free, does not assume certain distributed data, can be
nominal, category, ordinal, interval, and ratio. PLS is used to determine the complexity of the
relationship between latent variables and indicators. The PLS steps are:
1) Designing the Structural Model ( inner model ). This study analyzes the relationship
between exogenous variables of service quality (X1) and corporate image (X2) on
endogenous variables of customer satisfaction (Y1) and customer word of mouth (Y2).
International Journal of Economics, Commerce and Management, United Kingdom
Licensed under Creative Common Page 319
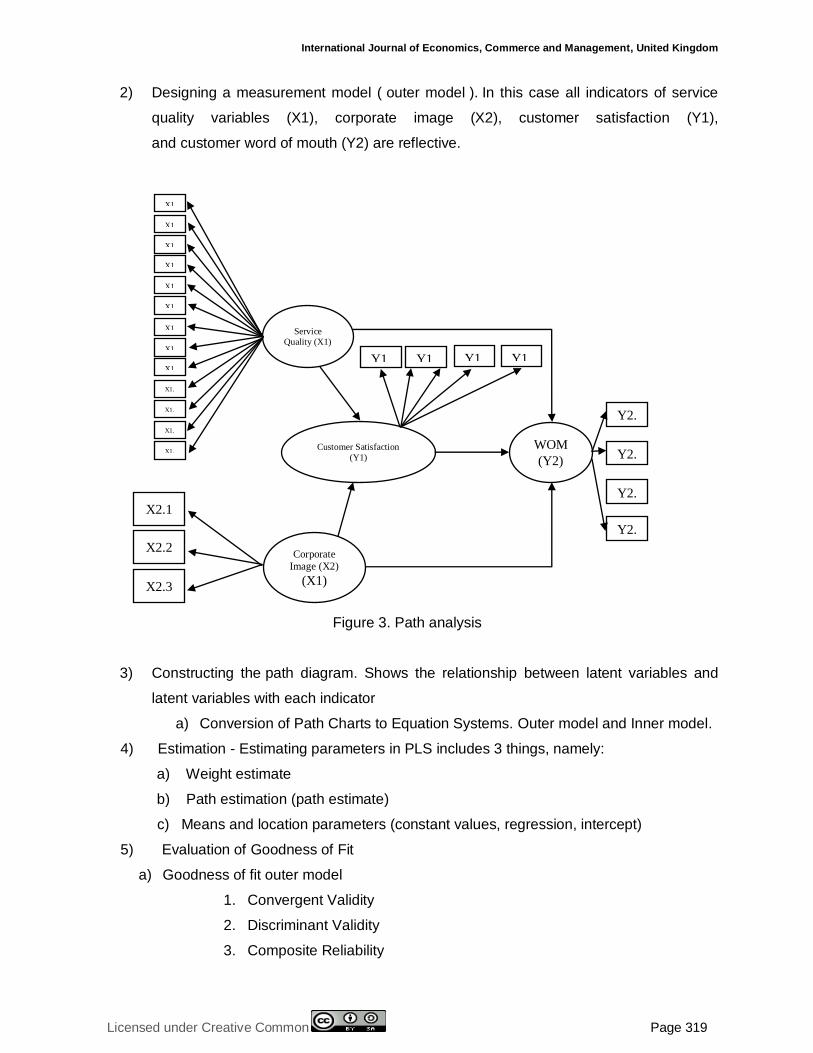
2) Designing a measurement model ( outer model ). In this case all indicators of service
quality variables (X1), corporate image (X2), customer satisfaction (Y1),
and customer word of mouth (Y2) are reflective.
Figure 3. Path analysis
3) Constructing the path diagram. Shows the relationship between latent variables and
latent variables with each indicator
a) Conversion of Path Charts to Equation Systems. Outer model and Inner model.
4) Estimation - Estimating parameters in PLS includes 3 things, namely:
a) Weight estimate
b) Path estimation (path estimate)
c) Means and location parameters (constant values, regression, intercept)
5) Evaluation of Goodness of Fit
a) Goodness of fit outer model
1. Convergent Validity
2. Discriminant Validity
3. Composite Reliability
Service
Quality (X1)
X2.1
X2.2
Customer Satisfaction
(Y1)
Y2.
1 WOM
(Y2)
Y1.
1
Y1.
2
Y1.
3
Y1.
4
Y2.
2
Y2.
3
Y2.
4 Corporate
Image (X2)
(X1) X2.3
X1
.1
Y2.1
Y2.1
X1
.2
Y2.1
Y2.1
X1
.3
Y2.1
Y2.1
X1
.4
Y2.1
Y2.1
X1
.5
Y2.1
Y2.1
X1
.6
Y2.1
Y2.1
X1
.7
Y2.1
Y2.1
X1
.8
Y2.1
Y2.1
X1
.9
Y2.1
Y2.1
X1.
100
Y2.1
Y2.1
X1.11
Y2.1
Y2.1
X1.
12
Y2.1
Y2.1
X1.13
Y2.1
Y2.1
© Dewi & Suprapti
Licensed under Creative Common Page 320
b) Goodness of Fit inner Model
6) Hypothesis testing
Hypothesis testing done by bootstrap resampling method. The test statistics used are t
statistics or t test. Testing is done by t-test, when obtained p-value 0.05 (alpha 5 percent), it is
concluded significant, and vice versa. When the results of hypothesis testing on the outer model
are significant, this indicates that indicators are seen as being able to be used as measuring
instruments for latent variables. Whereas when the results of testing on the inner model are
significant, it can be interpreted that there is a significant effect of latent variables on other latent
variables.
RESULTS
Results of Testing of Hypotheses
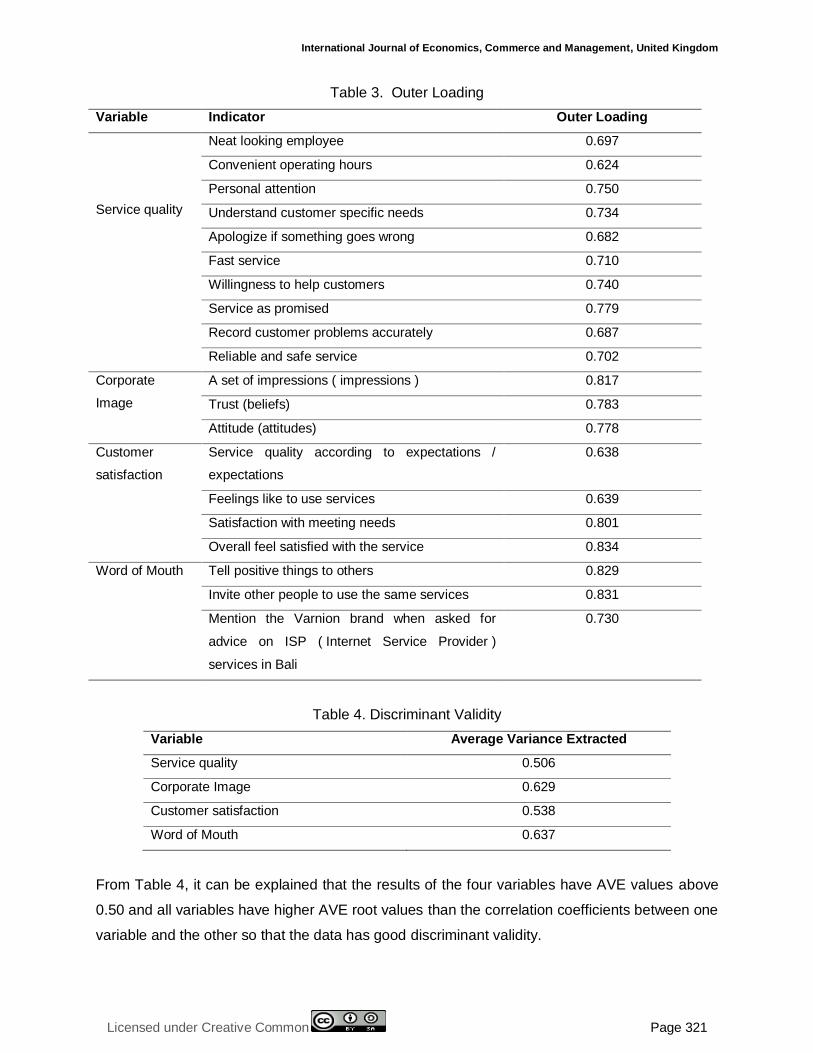
Table 3 shows that all service quality indicators have an Outer Loading value greater than
0.5. The service indicator according to the promise is the strongest measure of the service
quality variable because it has the largest outer loading value (0.779). So it can be concluded
that the ten service quality indicators are valid indicators as a measure of customer satisfaction
and word of mouth variables.
Corporate image variables show that impressions, beliefs, and attitudes have an outer
loading of more than 0.5. The impressions indicator is the strongest measure of the corporate
image variable because it has the largest outer loading value (0.817). So it can be concluded
that the three indicators of corporate image are valid indicators as a measure of customer
satisfaction and word of mouth.
Customer satisfaction variables indicate that the suitability of expectations/ expectations,
feelings of pleasure, satisfaction, and overall satisfaction have an outer loading of more than
0.5. The overall indicator of satisfaction with service is the strongest measure of the customer
satisfaction variable because it has the largest outer loading (0.834). So it can be concluded
that the four indicators of customer satisfaction are valid indicators in responding to customer
satisfaction.
Word of mouth variable shows that all indicators have an outer loading value above
0.5. The indicator invites other people to use the same service is the strongest measure of
the word of mouth variable because it has the largest outer loading (0.831). So it can be
concluded that the three word of mouth indicators are valid indicators in responding to word of
mouth.
),,(
International Journal of Economics, Commerce and Management, United Kingdom
Licensed under Creative Common Page 321
Table 3. Outer Loading
Variable Indicator Outer Loading
Service quality
Neat looking employee 0.697
Convenient operating hours 0.624
Personal attention 0.750
Understand customer specific needs 0.734
Apologize if something goes wrong 0.682
Fast service 0.710
Willingness to help customers 0.740
Service as promised 0.779
Record customer problems accurately 0.687
Reliable and safe service 0.702
Corporate
Image
A set of impressions ( impressions ) 0.817
Trust (beliefs) 0.783
Attitude (attitudes) 0.778
Customer
satisfaction
Service quality according to expectations /
expectations
0.638
Feelings like to use services 0.639
Satisfaction with meeting needs 0.801
Overall feel satisfied with the service 0.834
Word of Mouth Tell positive things to others 0.829
Invite other people to use the same services 0.831
Mention the Varnion brand when asked for
advice on ISP ( Internet Service Provider )
services in Bali
0.730
Table 4. Discriminant Validity
Variable Average Variance Extracted
Service quality 0.506
Corporate Image 0.629
Customer satisfaction 0.538
Word of Mouth 0.637
From Table 4, it can be explained that the results of the four variables have AVE values above
0.50 and all variables have higher AVE root values than the correlation coefficients between one
variable and the other so that the data has good discriminant validity.
© Dewi & Suprapti
Licensed under Creative Common Page 322
Table 5. Composite Reliable
Variable Cronbach Alpha Information
Service quality 0.893 Reliable
Corporate Image 0.708 Reliable
Customer satisfaction 0.707 Reliable
Word of Mouth 0.716 Reliable
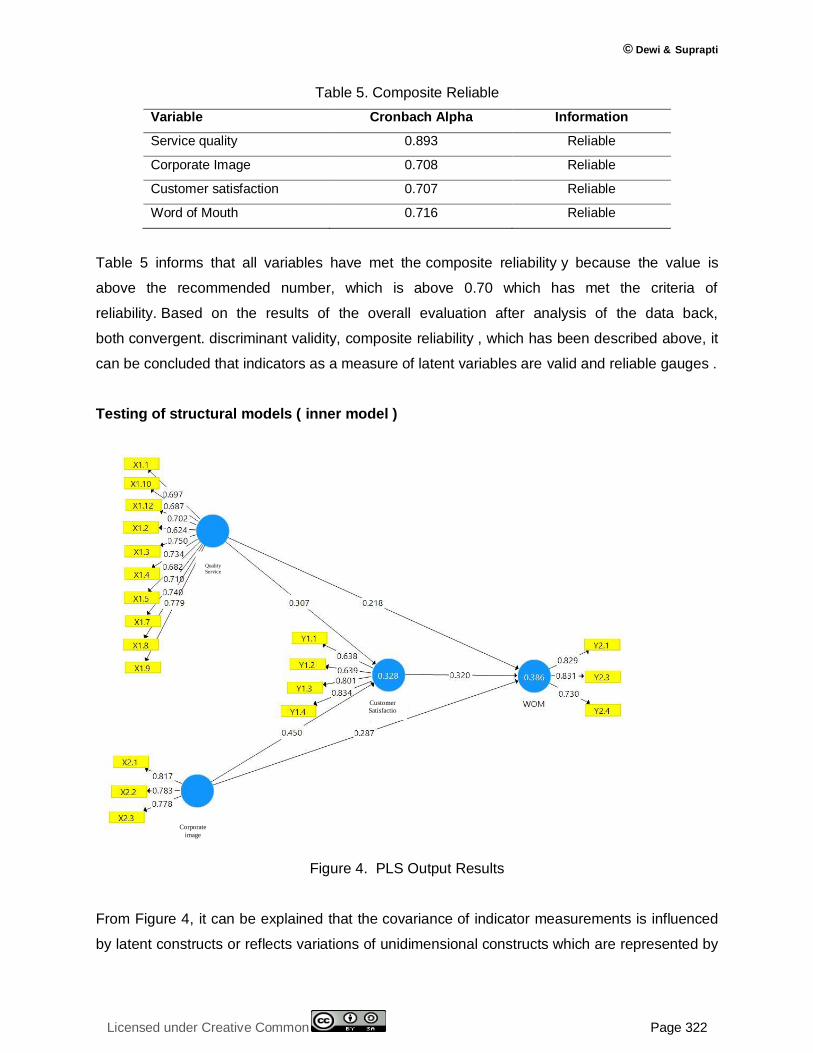
Table 5 informs that all variables have met the composite reliability y because the value is
above the recommended number, which is above 0.70 which has met the criteria of
reliability. Based on the results of the overall evaluation after analysis of the data back,
both convergent. discriminant validity, composite reliability , which has been described above, it
can be concluded that indicators as a measure of latent variables are valid and reliable gauges .
Testing of structural models ( inner model )
Figure 4. PLS Output Results
From Figure 4, it can be explained that the covariance of indicator measurements is influenced
by latent constructs or reflects variations of unidimensional constructs which are represented by
Corporate
image
Quality Service
Customer
Satisfactio
n
International Journal of Economics, Commerce and Management, United Kingdom
Licensed under Creative Common Page 323
an ellipse with several arrows from the construct to the indicator. This model hypothesizes that
changes in latent constructs affect changes in indicators. In the model there are two exogenous
variables, namely service quality and corporate image, and two endogenous variables, namely
customer satisfaction and word of mouth.
Table 6. Value of R Square
Variable R Square
Customer Satisfaction (Y1) 0.328
Word of Mouth (Y2) 0.386
Table 6 shows the value of R square variable customer satisfaction 0.328 and word of
mouth 0.386. The higher the R square value, the greater the ability of the exogenous variable
can explain endogenous variables, so that the structural resistance is better. For the customer
satisfaction variable has a R-square value of 0.328 which means that 32.8% service quality
variables and corporate image can explain customer satisfaction variables while the rest is
explained by other variables outside the research model. Word of mouth variable has an R-
square value of 0.386 which means 38.6% variable service quality, corporate image, and
customer satisfaction can explain word of mouth variables while the rest is explained by other
variables outside the research model.
In addition to using R square , goodness of fit models are also measured using Q-
Square predictive relevance for structural models, measuring how well the observation value is
generated by the model and also its parameter estimates. Q-square value> 0 indicates the
model has predictive relevance; conversely, if the Q-Square value ≤ 0 indicates the model
lacks predictive relevance. The Q-Square calculation is done by the formula:
Q² = 1 - {(1 − R1²) (1 − R2²)
Where, Rx1², R2² are R-square endogenous variables.
The magnitude of Q² has a value with a range of 0 <Q² <1, where getting closer to 1 means the
model is getting better. The amount of Q² is equivalent to the total determination coefficient
in path analysis. Calculation of the model's goodness of fit is as follows:
Q² = 1 - { (1 − R1²) (1 − R2²)
= 1 - (1−0,328) (1−0,386)
= 1− (0.672) (0,614)
= 1−0.41
= 0.59
© Dewi & Suprapti
Licensed under Creative Common Page 324
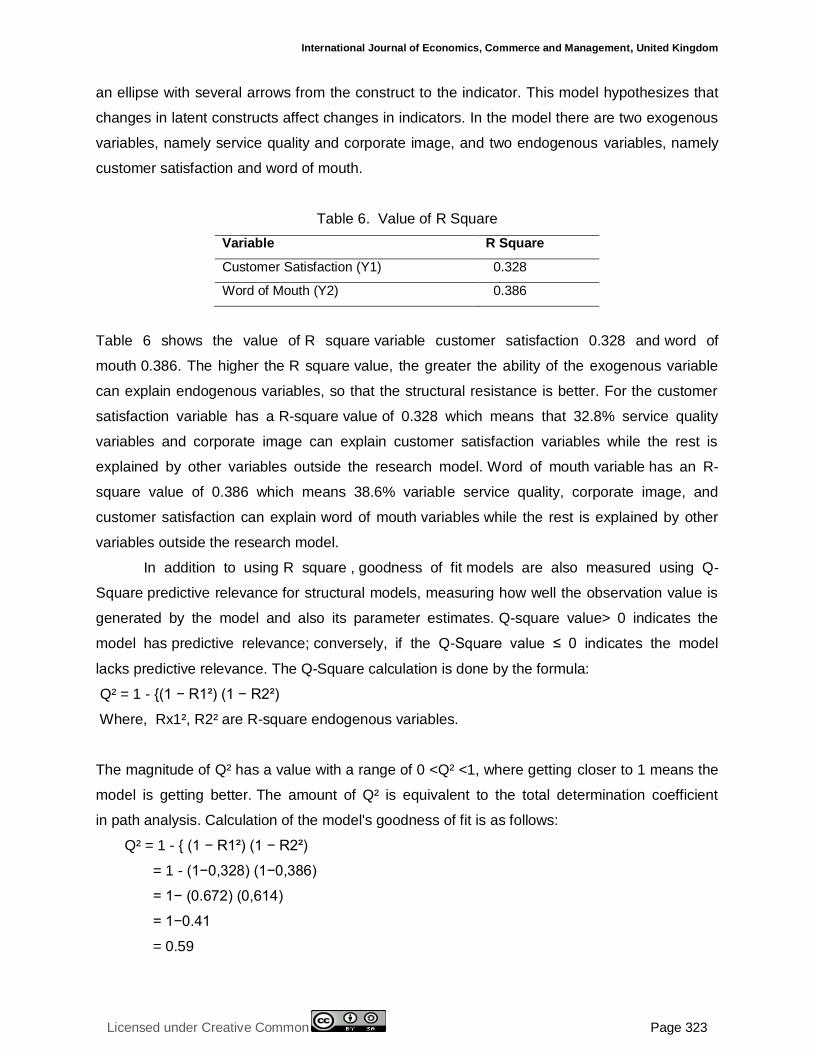
Based on the above calculation, 59 percent connects word of mouth variables which are
explained by variable service quality, corporate image, and customer satisfaction while the
remaining 41 percent is explained by variables that are not included in the model.
Figure 5. Bootstrapping Output Results
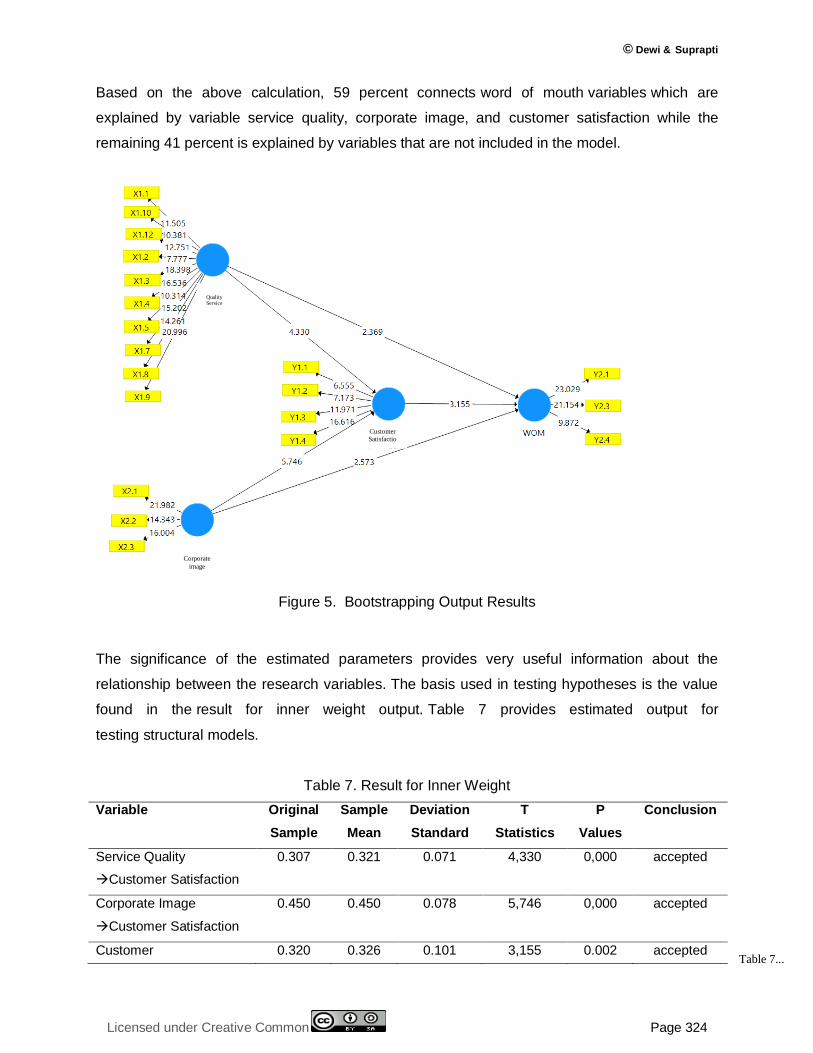
The significance of the estimated parameters provides very useful information about the
relationship between the research variables. The basis used in testing hypotheses is the value
found in the result for inner weight output. Table 7 provides estimated output for
testing structural models.
Table 7. Result for Inner Weight
Variable Original
Sample
Sample
Mean
Deviation
Standard
T
Statistics
P
Values
Conclusion
Service Quality
Customer Satisfaction
0.307 0.321 0.071 4,330 0,000 accepted
Corporate Image
Customer Satisfaction
0.450 0.450 0.078 5,746 0,000 accepted
Customer 0.320 0.326 0.101 3,155 0.002 accepted
Quality Service
Customer
Satisfactio
n
Corporate
image
Table 7...
International Journal of Economics, Commerce and Management, United Kingdom
Licensed under Creative Common Page 325
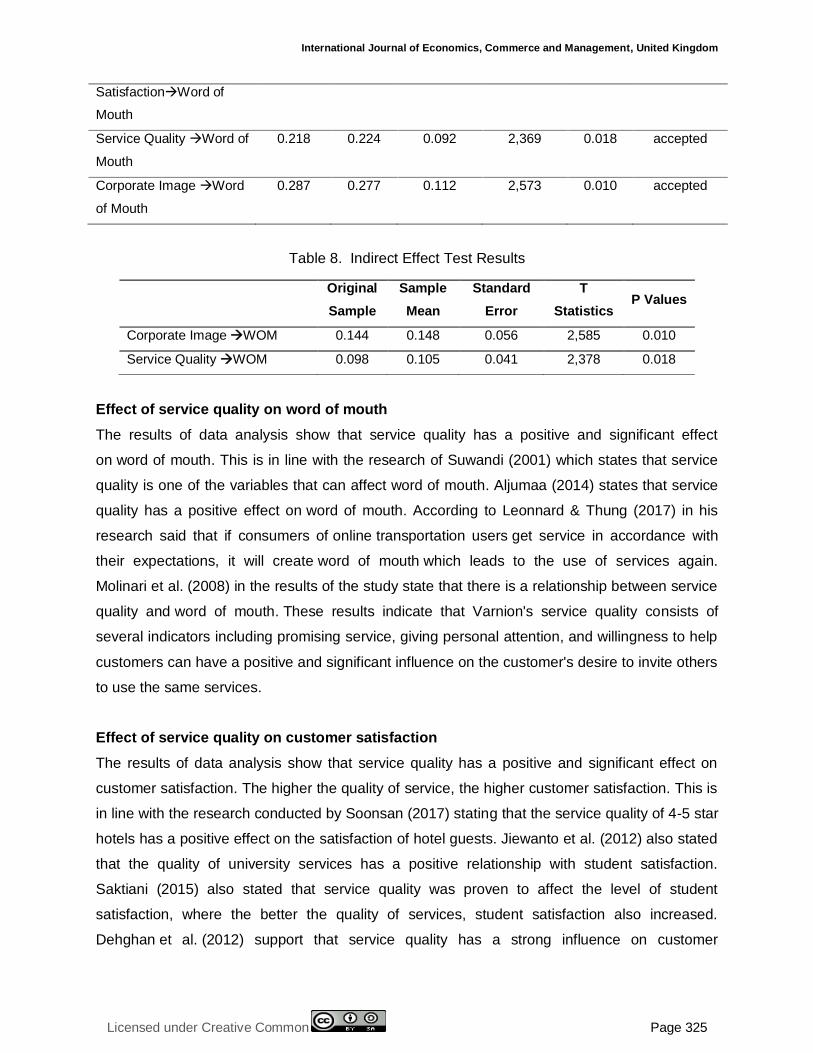
SatisfactionWord of
Mouth
Service Quality Word of
Mouth
0.218 0.224 0.092 2,369 0.018 accepted
Corporate Image Word
of Mouth
0.287 0.277 0.112 2,573 0.010 accepted
Table 8. Indirect Effect Test Results
Effect of service quality on word of mouth
The results of data analysis show that service quality has a positive and significant effect
on word of mouth. This is in line with the research of Suwandi (2001) which states that service
quality is one of the variables that can affect word of mouth. Aljumaa (2014) states that service
quality has a positive effect on word of mouth. According to Leonnard & Thung (2017) in his
research said that if consumers of online transportation users get service in accordance with
their expectations, it will create word of mouth which leads to the use of services again.
Molinari et al. (2008) in the results of the study state that there is a relationship between service
quality and word of mouth. These results indicate that Varnion's service quality consists of
several indicators including promising service, giving personal attention, and willingness to help
customers can have a positive and significant influence on the customer's desire to invite others
to use the same services.
Effect of service quality on customer satisfaction
The results of data analysis show that service quality has a positive and significant effect on
customer satisfaction. The higher the quality of service, the higher customer satisfaction. This is
in line with the research conducted by Soonsan (2017) stating that the service quality of 4-5 star
hotels has a positive effect on the satisfaction of hotel guests. Jiewanto et al. (2012) also stated
that the quality of university services has a positive relationship with student satisfaction.
Saktiani (2015) also stated that service quality was proven to affect the level of student
satisfaction, where the better the quality of services, student satisfaction also increased.
Dehghan et al. (2012) support that service quality has a strong influence on customer
Original
Sample
Sample
Mean
Standard
Error
T
Statistics P Values
Corporate Image WOM 0.144 0.148 0.056 2,585 0.010
Service Quality WOM 0.098 0.105 0.041 2,378 0.018
© Dewi & Suprapti
Licensed under Creative Common Page 326
satisfaction. The quality of public healthcare industry service affects patient satisfaction
(Kitapci et al. 2014). These results indicate that Varnion's service quality consists of several
indicators including promising service, giving personal attention, and willingness to help
customers can have a positive and significant influence on customer satisfaction with service.
Effect of corporate image on word of mouth
The results of data analysis show that the corporate's image has a positive and significant effect
on word of mouth. This is in line with the research of Harsono (2014) stating that the better the
image of the institution will increase the positive word of mouth of the students. This is also
supported by research by Jiewanto et al. (2012) stated that a good university image will have an
impact on word of mouth. Saktiani (2015) said that corporate image proved to have a positive
effect on word of mouth. Long-Yi et al. (2010) found the influence of corporate image on word of
mouth. According to Bravo et al. (2012) a good corporate image will form positive word of
mouth communication from customers. These results indicate that Varnion's corporate image
consisting of indicators including service professionalism and good reputation or track
record can have a positive and significant influence on the customer's desire to invite others to
use the same services.
Effect of corporate image on customer satisfaction
The results of data analysis show that the corporate's image has a positive and significant effect
on customer satisfaction. This is in line with the research conducted by Andreassen and
Lindestad (1997) which states that when services are difficult to evaluate, the corporate image
is believed to be an important factor that influences perceived quality, evaluates customer
satisfaction with service, and customer loyalty. Ali et al. (2015) also confirms that the corporate's
image is able to influence customer satisfaction. Sallam (2016) in his research stated that
corporate image has a positive influence on customer satisfaction. Hu et al. (2011) support that
corporate image has a positive impact on customer satisfaction. And in the study of Alireza et
al. (2011) states that the image is a variable that affects customer satisfaction. These results
indicate that Varnion's corporate image consisting of indicators including service
professionalism and reputation or a good track record can have a positive and significant effect
on customer satisfaction with Varnion services.
Effect of customer satisfaction on word of mouth
International Journal of Economics, Commerce and Management, United Kingdom
Licensed under Creative Common Page 327
The results of data analysis show that customer satisfaction has a positive and significant effect
on word of mouth. This is in line with the research of Singh & Thakur (2012) which states that
customer satisfaction can create several benefits, including the relationship between the
corporate and customers to be harmonious, providing a good basis for repeat purchases,
creating customer loyalty, and word of mouth recommendations that will guide for the corporate.
According to Ennew in Chaniotakis (2009) emphasizes the importance of creating customer
satisfaction as a positive determinant of word of mouth. This is supported by Kitapci et al. (2014)
which proves that consumer satisfaction influences word of mouth. Brown et al. (2005) state that
there is a positive influence between customer satisfaction and word of mouth . Wang et
al. (2017) also found a similar thing, namely tourist satisfaction with the quality of tourist
destinations has a positive and significant influence on word of mouth. These results indicate
that customers feel satisfied with Varnion services, which ultimately customers will have the
desire to invite others to use the same services.
The role of customer satisfaction in mediating the quality of service to word of mouth
The results of the data analysis show customer satisfaction mediates the relationship between
service quality and word of mouth. This is in line with research from Afridi et al. (2018) in his
research stated that the satisfaction of private university students in Peshawar mediates the
relationship between the quality of word of mouth services. This is supported by Handayanto's
research (2018) where student satisfaction in Islamic Private Universities in Indonesia mediates
the quality of service to word of mouth. According to Saputro (2012) satisfaction mediates in full
the relationship between service quality and word of mouth and interest in buying back. These
results indicate that services that are in line with promises, giving personal attention, and
willingness to help customers will have an impact on customers' satisfaction with Varnion
services, which ultimately customers will have the desire to invite others to use the same
services.
The role of customer satisfaction in mediating the corporate image of Word of Mouth
The results of the data analysis show that customer satisfaction mediates the relationship
between corporate image and word of mouth. This is in line with the research from Sallam
(2016) stating that in its research customer satisfaction and trust mediates the corporate's
image on customer word of mouth . Research by Nasirudin et al. (2018) also states that the
consumer satisfaction of the Conato Shop Store in Jember mediates the relationship between
consumer image and word of mouth. Kurniawan (2016) in his research stated that the image
relationship to consumer intentions for word of mouth was mediated by satisfaction of BPJS
© Dewi & Suprapti
Licensed under Creative Common Page 328
users in Ponorogo Regency. These results indicate that the professionalism of service and
reputation or A good track record will have an impact on customer satisfaction with Varnion
services, which ultimately customers will have the desire to invite others to use the same
services.
SUGGESTIONS FOR FURTHER RESEARCH
Corporate management should maintain several service quality factors by providing operational
hours of team services 24 hours support in accordance with customer needs, giving personal
attention to customers, and increasing employee competency through competency certification.
In addition, by continuing to carry out social activities and caring for customers, as well as
continuing to maintain a reputation or a good track record . Professionalism in service to
customers should be more concerned with improving a good corporate image. With a better
corporate image, it will certainly increase customer satisfaction which will ultimately lead to
positive word of mouth.
REFERENCES
Afridi, Sajjad Ahmad, Haider, Maqsood, Alam, Waqar. (2018). Impact of Service Quality on Word of Mouth Communication: Mediating Role of Customer Satisfaction. Journal of Managerial Sciences. Vol. 12, No. 1.
Alireza, F’; Ali, K., dan Aram, F. (2009). Impact of Service Quality, Trust, and Satisfaction Create Loyalty at an Iran Telecom: International Journal of Business and Management. Vol. 6, No. 8, August, pp. 271-279.
Ali, Rizwan., Leifu, Gao., Rafiq, Muhammad Yasir & Hassan, Mudassar. (2015). Role of Perceived Value, Customer Expectation, Corporate Image and Perceived Service Quality on The Customer Satisfaction. The Journal of Applied Business Research. Vol. 4, pp. 1425-1436.
Aljumaa, A. (2014). Investigating the Mediating Effect of Customer Satisfaction in the Service Quality – Word of Mouth Relationship. International Journal of Business and Management Invention. Vol. 3, pp. 40-44.
Andreassen, T. W. dan Lindestad, B. (1997). Customer Loyalty and Complex Services: The Impact of Corporate Image on Quality, Customer Satisfaction and Loyalty for Customers with Varying Degrees of Service Expertise. International Journal of Service Industry Management. Vol. 8, pg 4.
Al-Rousan, Ramzi. M., dan Mohamed, B. (2010). Customer Loyalty and The Impact of Service Quality; The Case of Five Star Hotels in Jordan International. Journal of Business and Economic Sciences. Vol. 5, pp. 202-208
Bloemer, J. dan Schroder, G.O. (2002). Store satisfaction and Store Loyalty Explained by Customer and Store Related Factor. Journal of Consumer Satisfaction, Dissatisfaction, and Complaining Behavior. Vol. 15. Pp. 68-80.
Bravo, R.; Montaner, T.; dan Pina, J. M. (2012). Corporate Brand Image of Financial Institution: A Consumer Approach. Journal of Product & Brand Management. Vol. 21 Iss: 4, pg. 232-245.
Brown, T.; Barry, T.; Dacin, P.; dan Richard F. G. (2005). “Spreading the Word: Investigating Antecedents of Consumers Positive Word of Mouth Intentions and Behaviors in a Retailing Context”, Academy of Marketing Service Journal. Vol. 33, No 2, pp. 123-191.
Chaniotakis, I. E.; dan Lymperopoulos, C. (2009). Service Quality Effect on Satisfaction and Word of Mouth in The Health Care Industry. Managing Service Quality. Vol. 19, No. 2, pp. 229-242.
Che Wu, Hung. (2013). An Empirical Study of the Effects of Service Quality, Perceived Value, Corporate Image, and Customer Satisfaction on Behavioral Intentions in the Taiwan Quick Service Restaurant Industry. Journal of Quality Assurance in Hospitality & Tourism, 14:364–390.
Dehghan, A.; Zenouzi, B.; dan Albadvi, A. (2012). An Investigation on the Relationship Between Service Quality and Customer Satisfaction: In The Case of CCG CO. International Business Research. Vol. 5, No. 1, January, pp. 3-8.
International Journal of Economics, Commerce and Management, United Kingdom
Licensed under Creative Common Page 329
Espejel, J., Fandos. C. Dan Flavian, C. (2007). The Role Of Intrinsic And Extrinsic Quality Attributes on Consumer Behaviour For Traditional Food Products. Managing Service Quality. Vol. 17, No.6, pp. 681-701.
Ghozali, Imam. (2009). Aplikasi Analisis Multivariate dengan Program SPSS. Semarang: Badan Penerbit Universitas Diponegoro.
Handayanto, Eko. (2018). Mediating Role of Satiscation on Relationship Between Service Quality and Word of Mouth in Islamic Private Universities in Indonesia. Advanced in Social Science, Education and Humanities Research. Vol. 231.
Harsono, S. (2014). The Institution Image and Trust and Their Effect on the Positive Word of Mouth. International Research Journal of Business Studies. Vol. 7 no. 1, pp. 69.
Hu, Kai C.; Huang, Mei C. (2011). Effects of Service Quality, Innovation and Corporate Image on Customer’s Satisfaction and Loyalty of Air Cargo Terminal. International Journal of Operations Research, Vol. 8, no. 4, pp. 36-47.
Jalilvand, M.R, Salimipour, S., Elyasi, M. Dan Mohammadi, M. (2017). Factors Influencing Word of Mouth Behaviour in the Restaurant Industry. Marketing Intellegence & Planning, Vol. 35, No. 1, pp. 81-110.
Jiewanto, A.; Laurens, C.; & Nelloh, L. (2012). Influence of Service Quality, University Image, and Student Satisfaction toward WOM Intention: A Case Study on Universitas Pelita Harapan Surabaya. Procedia Social and Behavioral Sciences, Vol. 40, pp. 16-23.
Kanaidi. (2010). Pengaruh Customer Value Dan Corporate Image Terhadap Loyalitas Pengguna Jasa Paket Pos Di Wilayah Pos Bandung Raya. Competitive Majalah Ilmiah, Politeknik Pos Indonesia, Vol 6 No.2 Desember 2010, ISSN 0216-2539, hal 25-40.
Kassim, N., dan Abdullah, N.A. (2010). The Effect of Perceived Quality Dimensions on Customer Satisfaction, Trust, and Loyalty in E-Commerce Settings: A Cross Cultural Analysis. Asia Pasific Journal of Marketing and Logistics. Vol. 22, no. 3, pp. 351-371.
Kotler, Philip and Gary Amstrong. (2003). Dasar-Dasar Pemasaran, Terjememahan Oleh Alexander Sindoro, Edisi Bahasa Indonesia, Jilid 1. Jakarta: PT. Indeks Gramedia.
Kotler, P. dan K. L. Keller. (2007). Manajemen Pemasaran. Edisi 12. Jakarta: PT. Indeks Kelompok Gramedia.
Kotler, Philip dan Keller, Kevin Lane. (2009). Manajemen Pemasaran Jilid 1& 2 edisi 12. Diterjemahkan oleh Bob sabran. Jakarta: Erlangga.
Kusuma, Adhi Rah. 2009. Pengaruh Kualitas Pelayanan, Kompetensi Tenaga Penjualan, dan Citra Perusahaan Terhadap Minat Beli Ulang (Studi Pada PT. Ratna Intan Kusuma di Semarang). Ejournal.undip.ac.id
Lenka, U., Suar, D.; Mohapatra; dan Pratap K. J. (2009). Service Quality, Customer Satisfaction, and Customer Loyalty in Indian Commercial Banks. The Journal of Entrepreneurship. Vol. 18, Edisi 1, pp. 47.
Leonnard; Thung, F. (2017). The Relationship of Service Quality, Word of Mouth, and Repurchace Intention in Online Transportation Services. Journal Process Management – New Technologies. Vol. 5, no. 4, pp. 30.
Lin, L., & Lu, C. (2010). The Influence of Corporate Image, Relationship Marketing, and Trust on Purchase intention: The Moderating Effects of Word Of Mouth. Tourism Review, 65 (3).
Long-Yi, L., Ching-Yuh, L. (2010). The Influence of Corporate Image, Relationship Marketing, and Trust on Purchase Intention: The Moderating Effects of Word-of-Mouth. Tourism Review of AIEST – International Association of Sciencetic Experts in Tourism. Vol. 65, No.3, pp. 16-34.
Molinari, L. K.; Abratt, R.; dan Dion, P. (2008). Satisfaction, Quality and Value and Effects on Repurchase and Positive Word-of-Mouth Behavioral Intentions in a B2B Service Context. The Journal of Services Marketing, Vol. 22, No. 5, pp. 363-373.
Naem, Hummayoun., Akram, asma and Saif, Iqbal M. (2009). Service Quality and its impact on Customer Satisfaction: An empirical evidence from the Pakistani Banking Sector. The International Business and Economics Research Journal, 8(12), pp 99 –104.
Nasirudin, M., Yulisetiarini, D., Suroso, I. (2018). The Role of Customer Satisfaction On Product Quality, Price, and Brand Image In Creating Word of Mouth On Shop Store Conato In Jember. International Journal of Business and Management Invention. Vol. 7, pp. 13-22.
Neger, M., Ahamed, B., Mahmud, K. (2013). Measuring Service Quality of Internet Service Providing Firms in Bangladesh. Global Journal of Management and Business Research Marketing. Vol. 13, pp. 23-28.
Oktavianto Yuda. (2013). Pengaruh Word of Mouth Terhadap Keputusan Pembelian: Konsumen Pada Usaha Mie Ayam Pak Agus Di Kota Batu. Jurnal Manajemen Bisnis, Vol 3, No 01.

© Dewi & Suprapti
Licensed under Creative Common Page 330
Petri, N. dan Graumann, S. (2014). Measuring Customer Satisfaction – Over Time and in Global Benchmarks. Qualitative and Quantitative Methods in Libraries (QQML), Vol. 2: 529-549.
Purwanto dan Sukirno Zakaria Lantang. (2014). Komunikasi Bisnis: Perspektif Konsepual dan Kultural: Cetakan I, Pustaka Pelajar Yogyakarta.
Rachman Meriyana Dhamayanti dan Cahaya Yohanes Ferry. (2015). Faktor Yang Mempengaruhi Keputusan Pembelian Smartphone (Iphone). Jurnal Studi Manajemen Dan Bisnis, Vol 2, No 2.
Rustika, Atmawati dan M. Wahyuddin. (2004). Analisis pengaruh kualitas pelayanan terhadap kepuasan konsumen pada matahari Department Store di Solo Grand Mall. Jurnal Ekonomi Manajemen Sumber Daya. 5 (1) pp 54- pp 61.
Saktiani, Garnis A. (2015). Pengaruh Kualitas Layanan dan Citra Perusahaan Terhadap Kepuasan Pelanggan dan Word of Mouth. Jurnal Ilmu Sosial dan Ilmu Politik, Vol 4 no. 2.
Sallam, Methaq A. (2016). An Investigation of Corporate Image Effect on WOM: The Role of Customer Satisfaction and Trust. International Journal of Business Administration, Vol. 7 no. 3, pp. 27.
Savas, A., Burcin, C.C., and Dbrahim, K. (2013). The effect of destination image on destination loyalty: an application in Alanya. European Journal of Business and Management, Vol.5 No.13, pp.124-136.
Sawitri Ni Putu., Kerti Yasa Ni Nyoman., dan Jawas abbdullah. (2013). Pengaruh kualitas pelayanan terhadap kepuasan dan loyalitas pelanggan Tegal Sari Accommodation di ubud. Jurnal Manajemen, Strategi Bisnis, dan Kewirausahaan, 7 (1) pp 40- 47.
Semuel, H. (2006). Ekspektasi Pelanggan dan Aplikasi Bauran Pemasaran Terhadap Loyalitas Toko Modern Dengan Kepuasan Pelanggan Sebagai Intervening (Studi Kasus Pada Hypermarket Carrefour di Surabaya). Jurnal Manajemen Pemasaran, 1(2), Edisi Oktober 2006.
Shi, W., Tang, L., Zhang, X., Gao, Y., dan Zhu, Y. (2016). How Does Word of Mouth Affect Customer Satisfaction. Journal of Business & Industrial Marketing. Vol. 31, No. 3, pp. 393-403.
Siddiqi, K.O. (2011). Between Service Quality Attributes, Customer Satisfaction and Customer Loyalty in the Retail Banking Sector in Bangladesh. International Journal of Business and Management. Vol. 6, No. 3, pp. 12-36
Singh, A P dan Thakur, S. (2012). Impact of Service Quality on Customer Satisfaction and Loyalty : In The Context of Retail Outlets in DB City Shopping Mall Bhopal. International Journal of Management Research and Reviews 2.2, pp. 334-344.
Soonsan, N. (2017). The Effect of Service Quality on Word-of-Mouth in Hotel Industry: The Mediating Role of Overall Satisfaction. Marketing, Tourism & Hospitality.
Sugiyono. (2017). Metode Penelitian Kuantitatif, Kualitatif dan R&D. Bandung: PT Alfabeta, CV.
Sunyoto, Danang. (2013). Perilaku Konsumen (Panduan Riset Sederhana untuk mengenali Konsumen). PT Buku Seru. Jakarta.
Suryaatmaja, A.N., Suprapti, N.W.S., & Kerti Yasa, N.N. (2016). Pengaruh Kualitas Pelayanan Dan Citra Terhadap Kepuasan dan Word Of Mouth Nasabah. E-Jurnal Ekonomi dan Bisnis Universitas Udayana. Vol. 5.7, 2191 – 2210.
Roderick, B. J. James, W. R. M. dan Gregory, B. J. (2009). Investigating the service: A customer value perspective. Journal of Business Research. Vol 62. No 7, hal 345-355.
Tu, Y., Li, M., & Chih, H. (2013). An Empirical Study of Corporate Brand Image, Customer Perceived Value and Satisfaction on Loyalty in Shoe Industry. Journal of Economics and Behavioral Studies, 5(7), 469-483.
Walker, Horrison. (2001). The Measurement of Word-of-Mouth Communication and an Investigation of Service Quality and Customer Commitment as Potential Antecedents. Journal of Service Research. Vol. 4, no. 1, pp. 60-75.
Wang, T.L. Tran, P.T, dan Tran, V.T. (2017). Destination Perceived Quality, Tourist Satisfation and Word-of-Mouth. Tourism Review, https://doi.org/10.1108/TR-06-2017-0103.