Embed Size (px)
Citation preview
Journal of Women and Minorities in Science and Engineering, vol. 11, pp. 209–229, 2005
ISSN 1072-8325/05$35.00 Copyright © 2005 by Begell House, Inc. 209
INFLUENCE OF PRECOLLEGE EXPERIENCE ON SELF-CONCEPT AMONG COMMUNITY COLLEGE STUDENTSIN SCIENCE, MATHEMATICS, AND ENGINEERING
Soko S. Starobin* and Frankie Santos LaananSoko S. Starobin* and Frankie Santos LaananSoko S. Starobin* and Frankie Santos LaananSoko S. Starobin* and Frankie Santos LaananSoko S. Starobin* and Frankie Santos LaananIowa State University
Female and minority students have historically been underrepresented in the field of science, mathematics, and engineeringat colleges and universities. Although a plethora of research has focused on students enrolled in 4-year colleges oruniversities, limited research addresses the factors that influence gender differences in community college students in science,mathematics, and engineering. Using a target population of 1,599 aspirants in science, mathematics, and engineeringmajors in public community colleges, this study investigates the determinants of self-concept by examining a hypotheticalstructural model. The findings suggest that background characteristics, high school academic performance, and attitudetoward science have unique contributions to the development of self-concept among female community college students. Theresults add to the literature by providing new theoretical constructs and the variables that predict students’ self-concept.
INTRODUCTION
Female and minority student populations have long been underrepresented in the field ofscience, mathematics, and engineering at America’s colleges and universities (NationalScience Foundation, 2000). Specifically, the shortage of female students in the fields ofscience, mathematics, and engineering at postsecondary education institutions has con-cerned educational researchers and policymakers despite the fact that overall postsecondaryenrollment of women has been higher than that of their male counterparts (National Centerfor Education Statistics, 2002). The National Science Foundation (2000) reports thatwomen received 47% of all science and engineering bachelor’s degrees, 39% of the master’sdegrees, and just 33% of the doctoral degrees in 1996. It is distressing that the genderdiscrepancy in educational attainment increases as women’s educational experiences suc-cessfully progress at higher levels.
Over the decades, America’s more than 1,200 private or public 2-year colleges havefacilitated the increase of female representation in the field of science, mathematics, andengineering. The nation’s community colleges provide educational as well as vocationalopportunities for students through vocational-technical education, academic transfer to4-year colleges and universities, remedial courses, continuing education, and communityservice (Cohen & Brawer, 2003; Laanan, 2003). These community colleges enroll approxi-mately 5.5 million credit students, which include more than 57% of female students in thestudent population pool (National Center for Education Statistics, 2002). Inasmuch ascommunity colleges awarded more than 76,000 associate degrees in allied health fields,which serve the nation’s significant healthcare needs (Phillippe & Patton, 2000), limited
*Correspondence concerning this article should be addressed to Dr. Soko S. Starobin, Iowa StateUniversity, Educational Leadership and Policy Studies, N243 Lagomarcino Hall, Ames, IA 50011-3195;Tel.: 515-294-9121; Fax.: 515-294-4942; e-mail: [email protected].
Electronic Data Center, http://edata-center.com Downloaded 2006-3-13 from IP 67.87.127.223 by Joanna Antosiuk
210 Soko S. Starobin and Frankie Santos Laanan
Journal of Women and Minorities in Science and EngineeringJournal of Women and Minorities in Science and EngineeringJournal of Women and Minorities in Science and EngineeringJournal of Women and Minorities in Science and EngineeringJournal of Women and Minorities in Science and Engineering
attention has been paid to unveil the contributions of community colleges to the nation’sscience, mathematics, and engineering education. Concerning the nation’s greater needto strengthen its national defense and homeland security, policymakers have addressed theissue of educating competent scientists and engineers within the United States as theirpolicy objective. Federal agencies, such as the National Science Foundation, have recentlydocumented positive impacts of community college attendance on career and educationalpathways of science and engineering undergraduates and graduates (Tsapogas, 2004a,2004b). Furthermore, the Undergraduate Science, Mathematics, Engineering and Tech-nology (SMET) Education Improvement Act - H.R. 3130, which became Public Law107-368 in December 2002, specifically recognizes community colleges as contributors tothe increasing number of undergraduate students in science, mathematics, and engineer-ing education. Selected policy objectives of the Act that relate to community colleges areto increase overall workforce skills by
• raising postsecondary enrollment rates of women, minorities, and persons withdisabilities in science, mathematics, engineering, and technology disciplines;
• increasing access to higher education in science, mathematics, engineering, andtechnology fields for students from low-income households; and
• expanding science, mathematics, engineering, and technology training opportuni-ties at institutions of higher education (P.L. 107-368, 2002).
Since the introduction of the Undergraduate Science, Mathematics, Engineering andTechnology (SMET) Education Improvement Act - H.R. 3130, the American Associationof Community Colleges (AACC) and the National Science Foundation (NSF) havedeveloped a collaborative partnership to address the role of community colleges in increasingthe representation of women and minorities majoring in science, mathematics, engineering,and technology. Given the substantial percentage of female students enrolled in communitycolleges, AACC has successfully influenced policymakers to recognize that this pool ofindividuals serves as a potential group to be the future scientists through this partnership.
A body of research that specifically addresses the disparities in mathematics andscience education among male and female students, however, has focused its analysis onstudents at the secondary level or at 4-year institutions. Questions about the factors thatinfluence gender differences in college students’ mathematical achievement and self-con-cept have been a popular inquiry. Evidence from previous research suggests that high self-concept positively influenced academic performance (Astin, 1993; Bailey, 1971; Byrne,1984; Hansford & Hattie, 1982; House, 1995).
Currently, there is a dearth of research that investigates mathematical ability and thedegree of encouragement to pursue study in science, mathematics, and engineering amongstudents in community colleges. Moreover, little attention has been paid to uncover theeffects of students’ background characteristics and pre-college experiences with respect tocommunity college students’ self-concept. The objective of this study was to investigate thedeterminants of community college students’ self-concept. Specifically, students who indi-cated that their probable major was science, mathematics, or engineering were included inthe target population.
To examine the determinants of self-concept among aspirants of science, mathemat-ics, and engineering majors in community colleges, the researchers hypothesized a latent-variable structural equation model by including variables identified in previous research
Electronic Data Center, http://edata-center.com Downloaded 2006-3-13 from IP 67.87.127.223 by Joanna Antosiuk
Self-Concept Among Community College Students 211
Volume 11, Issue 3Volume 11, Issue 3Volume 11, Issue 3Volume 11, Issue 3Volume 11, Issue 3
findings as being significantly related to the development of self-concept of students inscience, mathematics, and engineering.
REVIEW OF THE LITERATURE
The research studies on students in science, mathematics, and engineering at the secondary(Carlone, 2003; Drake, Clewell, & Sevo, 2002; Spears, Dyer, Franks, & Montelone, 2004)and postsecondary levels (Huang & Brainard, 2001; Hughes, 2000; Wyer, 2003) areextensive in theoretical and conceptual approaches. For instance, the application of thedifferential coursework hypothesis (Ethington & Wolfle 1984, 1986; Nora & Horvath,1990; Nora & Rendón, 1990; Pallas & Alexander, 1983), the spatial visualization (Fennema& Sherman, 1977; Sherman, 1980, 1982, 1983), the expectancy-value theory (Lips, 1995),and the college impact on retention (Pascarella, Smart, Ethington, & Nettles, 1987) wereused in the past studies. These empirical studies used these theoretical and conceptualframeworks to investigate the factors that influence gender disparities in science andmathematics education. Furthermore, the findings of these studies are consistent regardingthe importance of participation in science and mathematics courses, as well as psychosocialand cultural issues, in shaping the confidence and educational success of female students inscience and mathematics.
Studies on Participation in Science and Mathematics Courses
To measure the postsecondary academic achievement of students in science andmathematics, secondary students’ levels of participation in science and mathematics courseswere identified as the attributing factor (Ethington & Wolfle, 1984, 1986; Nora & Horvath,1990; Nora & Rendón, 1990; Pallas & Alexander, 1983). Known as the differentialcoursework hypothesis, this assumption is grounded in the premise that there is a plausiblerelationship among gender differences in academic performance and differences in students’programs of study during high school. To test this hypothesis, Pallas and Alexander (1983)studied a cohort of 6,119 students in 24 public high schools from 1961 to 1968, correspond-ing to grades 5 to 12, by examining the effects of differences in the pattern of quantitativecoursework in high school on the gender difference in quantitative SAT performance. Thestudy revealed that as girls outperformed boys in quantitative courses, their SAT mathemat-ics scores increased— thus closing the overall gender performance gap. On the basis of theirfindings, Pallas and Alexander (1983) concluded that this study supports the differentialcoursework hypothesis between males and females. Additionally, interventions for encour-aging female students to enroll in quantitative high school courses were identified as acritical factor in their future success in quantitative studies.
Using the data drawn from High School and Beyond, a nationwide longitudinal studyof high school sophomores and seniors in 1980 that included 16,555 students, Ethingtonand Wolfle (1986) found a similar influence of prior exposure to mathematics on students’academic performance. The structural equation model designed for this study revealed thatstudents’ sophomore-year exposure to mathematics, mathematics and verbal abilities, andattitudes toward mathematics were predictors of mathematics achievement of students intheir senior year. Nora and Horvath (1990) modified the structural equation model used inthe Ethington and Wolfle study to examine the effects of sociodemographic factors,
Electronic Data Center, http://edata-center.com Downloaded 2006-3-13 from IP 67.87.127.223 by Joanna Antosiuk
212 Soko S. Starobin and Frankie Santos Laanan
Journal of Women and Minorities in Science and EngineeringJournal of Women and Minorities in Science and EngineeringJournal of Women and Minorities in Science and EngineeringJournal of Women and Minorities in Science and EngineeringJournal of Women and Minorities in Science and Engineering
precollege factors, and attitudinal factors on the differences in academic preparation amongstudents in Hispanic-serving 2-year institutions.
Using Self-Concept as a Measure of Gender Differences
In addition to the students’ levels of participation in science and mathematics courses,confidence levels and self-concept of students have been examined as —contributing factorsin determining academic achievement of students in science and mathematics. Researchstudies on self-concept pertaining to science and mathematics education are diverse. Thisconcept has been referred to as academic self-confidence (Huang & Brainard, 2001),mathematics attitudes (Ethington & Wolfle, 1986; Nora & Horvath, 1990; Nora &Rendón, 1990), confidence in learning mathematics (Fennema & Sherman, 1977; Sherman,1982, 1983), course confidence (Hughes, 2000), self-confidence (Lips, 1995), and mathe-matical self-concept (Sax, 1994a, 1994b).
Sax (1994a) investigated factors predicting mathematics self-concept and theirgender differences by using a national sample of approximately 15,000 students drawnfrom the Cooperative Institutional Research Program (CIRP) 1985 Freshman Survey and1989 Follow-up Survey. It was concluded that female students were less confident in theirmathematical abilities than their male counterparts, and the gender disparity increased asthey progressed through college. Additionally, Sax (1994a) reported that for femalestudents in particular, strong academic performance as well as mathematics and sciencepreparations in high school had far stronger influence on mathematics self-concept thanthe impact of college.
The results of this study offer two significant interpretations. The finding of therelationship between mathematics and science preparations in high school supported theapplicability of the differential coursework hypothesis to the measurement of self-con-cept, which was defined as the outcome variable to test the gender disparities. Anothernotable finding from this study was that universities’ competitive learning environmentsand low enrollments of women negatively affected the development of mathematics self-concept of female students. This finding especially invites impetus for an investigation ofself-concept of female students in community colleges, where the majority of students arefemale and academically less competitive. Thus, the learning environment in communitycolleges appears to be more desirable for female students to pursue their studies in scienceand mathematics.
Research on Community College Students in Science and Mathematics
Despite the plethora of research studies that addressed gender differences in academicperformance, attrition, and retention in students in science and mathematics education, thefocus has been limited to students at secondary and 4-year university levels. It is important,however, to address the gender differences of students in science, mathematics, and engi-neering and the extent to which characteristics of students at community colleges aredifferent from the characteristics of students at secondary or 4-year institutions. Nora andRendón (1990) examined the gender and racial differences in mathematics and sciencepreparation and participation among students in Hispanic-serving 2-year institutions usingsociodemographic, academic preparation, and attitudinal variables. Their results suggestedthat Hispanic female students were likely to be in the traditional 18- to 24-year-old student
Electronic Data Center, http://edata-center.com Downloaded 2006-3-13 from IP 67.87.127.223 by Joanna Antosiuk
Self-Concept Among Community College Students 213
Volume 11, Issue 3Volume 11, Issue 3Volume 11, Issue 3Volume 11, Issue 3Volume 11, Issue 3
pool and received adequate academic preparation, whereas White female students com-prised an older and poorly prepared student population. Clearly, these women chosecommunity colleges as their initial point of entry into higher education. Further, the authorsargued that “even the brightest Hispanics may be choosing to begin their college careers inmathematics and science education in community colleges, and that 2-year institutions maybe the primary collegiate vehicle Hispanics use to attain career, economic and socialmobility” (Nora & Rendón, 1990, p. 37).
Community colleges, specifically for traditionally underrepresented student popula-tions pursuing postsecondary education in mathematics and science, have continuouslyplayed a significant role. Analyzing the data from the National Science Foundation’s 2001National Survey of Recent College Graduates, Tsapogas (2004a) found that 44% of scienceand engineering (S&E) bachelor’s and master’s graduates attended community colleges “atsome point in their educational path” (p. 6). Considering the background characteristics ofthe S&E graduates, Hispanics, females, and nontraditional age are more likely than theircounterparts (other ethnic groups, males, traditional-age students) to attend communitycolleges (Tsapogas, 2004a).
CONCEPTUAL FRAMEWORK
This study uses two conceptual frameworks: (1) the input-environment-outcome model(I-E-O) and (2) the differential coursework hypothesis. Developed by Astin (1993), theI-E-O model accesses the impact of various environmental experiences by determiningwhether students grow or change differently under varying environmental conditions.Although the I-E-O model is designed to examine the college experiences of 4-yearcollege students, the model can be applied to community college freshman students withmodel modifications. In the present study, the inputs refer to the background character-istics of the student; environment refers to the high school experiences of the student; andoutcomes refer to the student’s characteristics (cognitive and affective) after exposure totheir high school experiences.
To measure the high school experience of students, the differential courseworkhypothesis is applied to examine the influence of students’ levels of participation in scienceand mathematics courses on the gender differences in students’ cognitive and affectivecharacteristics. Although the research on the differential coursework hypothesis has beenwell documented (Ethington & Wolfle, 1984, 1986; Pallas & Alexander, 1983), only a fewstudies investigated community college students. Nora and Horvath (1990) and Nora andRendón (1990) added a new dimension to the hypothesis by examining the effects ofsociodemographic factors, precollege factors, and attitudinal factors on the differences inacademic preparation among community college students. The authors concluded thatdifferences in the effects were explained by students’ gender and ethnicity.
The conceptual framework provides a useful guide in developing a hypotheticalstructural model to examine the determinants of self-concept of community college stu-dents. First, several key variables used in previous studies of the differential courseworkhypothesis were identified for the selection of latent variables in this study. To measure thelatent variables, 11 observed variables were selected based on Sax’s (1994a) study in whichshe predicted gender differences in math self-concept among 4-year college students. Thenext step was to determine the relationship among the latent variables. The modified I-E-O
Electronic Data Center, http://edata-center.com Downloaded 2006-3-13 from IP 67.87.127.223 by Joanna Antosiuk
214 Soko S. Starobin and Frankie Santos Laanan
Journal of Women and Minorities in Science and EngineeringJournal of Women and Minorities in Science and EngineeringJournal of Women and Minorities in Science and EngineeringJournal of Women and Minorities in Science and EngineeringJournal of Women and Minorities in Science and Engineering
model was applied to determine the relationship as well as directions of the latent variablesin the hypothetical model. It was hypothesized, based on previous research (Astin, 1993;Pascarella et al., 1987), that background characteristics (i.e., socioeconomic status andparental education) and high school experiences (i.e., high school GPA and high schoolcoursework) are associated with scientific orientation (i.e., goals), as well as students’ self-concept (i.e., academic and mathematical ability). Although academic performance andscientific course enrollment have been selected as the outcome measurements of examiningthe differential coursework hypotheses in previous studies (Ethington & Wolfle, 1984,1986; Nora & Horvath, 1990; Nora & Rendón , 1990; Sherman, 1980, 1982, 1983), thisstudy specifically focuses on examining the effects of three constructs: (1) backgroundcharacteristics; (2) high school academic performance; and (3) attitude toward science onthe self-concept of science, mathematics, and engineering aspirants in community colleges.
Objectives
The objective of this study is to understand the influence of students’ backgroundcharacteristics, high school academic performance, and attitude toward science on theirself-concept. Specifically, this study addresses gender differences and the extent to whicheach construct influenced students’ self-concept. The following research questions guidedthis study:
• What are the characteristics of students who aspired to baccalaureate degrees inscience, mathematics, and engineering?
• To what extent is the self-concept of students predicted by background character-istics, high school academic performance, and attitude toward science?
• To what extent is the self-concept of female students predicted by backgroundcharacteristics, high school academic performance, and attitude toward science?
DATA SOURCE AND METHODS
The data for this study were drawn from the CIRP 1996 Freshman Survey, which wassponsored by the University of California at Los Angeles (UCLA) Higher EducationResearch Institute (HERI). The cohort of students who were first-time freshmen enrolledin public and private 2-year institutions in fall 1996 responded to the Student InformationForm (SIF). The SIF was administered to students during the beginning of the fall 1996semester to elicit a wide range of student information, which includes biographic anddemographic information as well as attitudinal and affective measures of this student cohort(Sax, Astin, Korn, & Mahoney, 1996). The target population for the study consisted of1,599 first-time, full-time students enrolled in public community colleges in fall 1996 whoindicated their probable major as biological science, physical science (includes mathemat-ics), or engineering on the survey.
Variables and Measures
This study was delimited to use a target population of students enrolled in the publiccommunity colleges that participated in the 1996 CIRP American Freshman Study. A
Electronic Data Center, http://edata-center.com Downloaded 2006-3-13 from IP 67.87.127.223 by Joanna Antosiuk
Self-Concept Among Community College Students 215
Volume 11, Issue 3Volume 11, Issue 3Volume 11, Issue 3Volume 11, Issue 3Volume 11, Issue 3
complete description of the research methodology, as well as other technical issues relatedto the 1996 CIRP American Freshman Study, is provided in The American Freshman:National Norms for Fall 1996 (Sax et al., 1996). The data for the present study is crosssectional and relies on reflective self-report data to examine the transitional influences onstudents’ self-concept. The variables used in preparing descriptive statistics in the studyinclude (1) gender; (2) age; (3) race/ethnic background; (4) students’ probable major; (5)parents’ annual income; (6) father’s educational attainment; (7) mother’s educational attain-ment; and (8) high school academic performance, which consists of years of study inmathematics, physical science, biological science, and Grade Point Average (GPA).
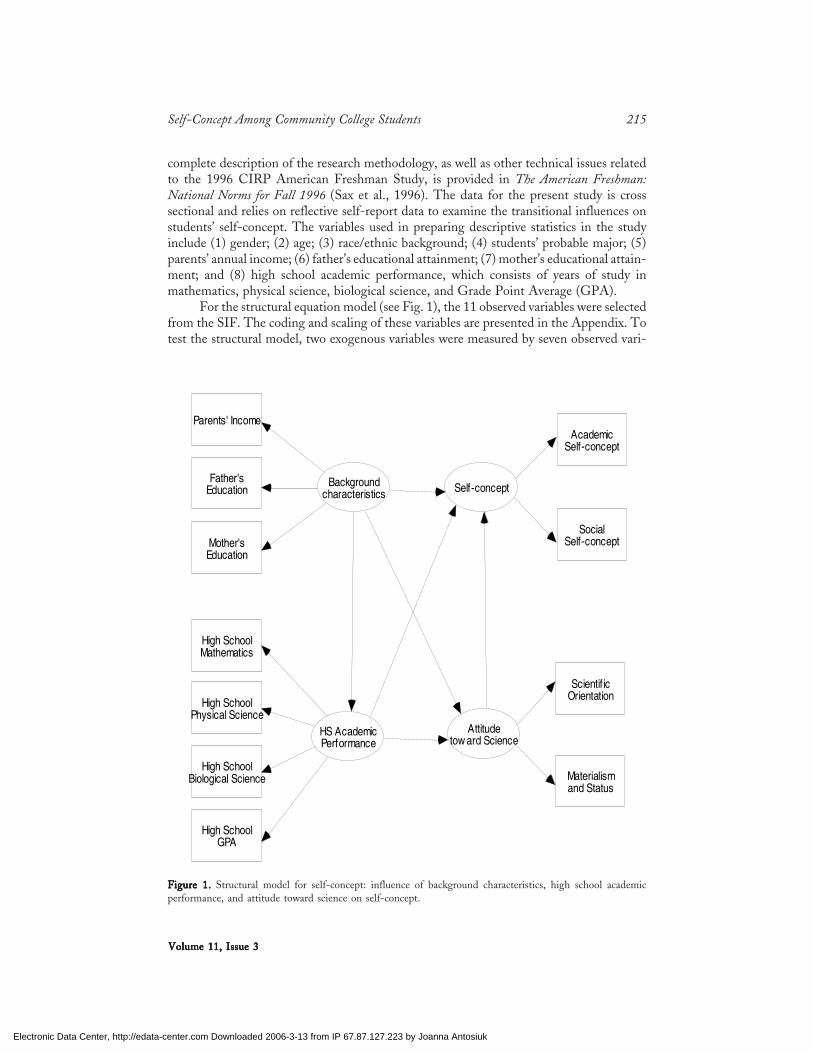
For the structural equation model (see Fig. 1), the 11 observed variables were selectedfrom the SIF. The coding and scaling of these variables are presented in the Appendix. Totest the structural model, two exogenous variables were measured by seven observed vari-
Parents' Income
Father'sEducation
Mother'sEducation
High SchoolMathematics
High SchoolPhysical Science
High SchoolBiological Science
High SchoolGPA
Backgroundcharacteristics
HS AcademicPerformance
Attitudetow ard Science
Self-concept
AcademicSelf-concept
SocialSelf-concept
Scientif icOrientation
Materialismand Status
Figure 1.Figure 1.Figure 1.Figure 1.Figure 1. Structural model for self-concept: influence of background characteristics, high school academicperformance, and attitude toward science on self-concept.
Electronic Data Center, http://edata-center.com Downloaded 2006-3-13 from IP 67.87.127.223 by Joanna Antosiuk
216 Soko S. Starobin and Frankie Santos Laanan
Journal of Women and Minorities in Science and EngineeringJournal of Women and Minorities in Science and EngineeringJournal of Women and Minorities in Science and EngineeringJournal of Women and Minorities in Science and EngineeringJournal of Women and Minorities in Science and Engineering
ables. The first independent latent variable, ξ1 = background characteristics, was measuredby three variables: x1 = parents’ income, x2 = father’s education, and x3 = mother’s education.The other independent latent variable, ξ2 = high school academic performance, was iden-tified by four observed variables: x4 = years of high school study in mathematics, x5 = yearsof high school study in physical science, x6 = years of high school study in biological science,and x7 = high school GPA. To illustrate students’ self-concept, two endogenous (dependentlatent) variables were measured. Students’ self-concept, η1 = self-concept, was measured bytwo observed variables: y1 = academic self-concept and y2 = social self-concept. The otherendogenous variable was constructed on the basis of the peer influential factors identifiedby Astin (1993) that were specifically relevant to students in science, mathematics, andengineering. The variable, η2 =attitude toward science, was measured by two observedvariables: y3 = scientific orientation and y4 = materialism and status.
The descriptions of four latent variables and observed variables that constructed theselatent variables are the following:
Background Characteristics. Three items: (a) parents’ income, (b) father’s education, and(c) mother’s education were used to assess students’ background characteristics, iden-tified as “inputs” in the modified I-E-O model.
High School Academic Performance. Four items were used to measure high school aca-demic performance, which was conceptualized as the “environment” in the model. Theitems are (a) years of high school study in mathematics, (b) years of high school studyin physical science, (c) years of high school study in biological science, and (d) highschool GPA.
Attitude toward Science. A latent factor had two measures: (a) scientific orientation (i.e.,“make a theoretical contribution to science”) and (b) materialism and status (i.e., “beingvery well off financially and being successful in my own business). Attitude towardscience was identified as “outcome” variable in the model.
Self-Concept. Identified as the second “outcome” in the model, self-concept includesnine items that were separated into two parcels: academic self-concept and social self-concept. Representative items of the academic self-concept included, academic andmathematical abilities. Items such as “public speaking” and “drive to achieve” wereincluded in the social self-concept.
The model depicts the effects of three latent variables: (1) background characteristics; (2)high school academic performance; and (3) attitude toward science on the dependent latentvariable, self-concept.
Analyses
To address the first research question, descriptive statistics were conducted to illus-trate the target population pertaining to students’ background characteristics, selection ofprobable majors, and high school academic performance described above. The backgroundcharacteristics variables and the variable that depicts students’ probable majors were cross-tabulated with respondent gender to provide a portrait of gender differences in communitycollege students in science, mathematics, and engineering. Furthermore, students’ high
Electronic Data Center, http://edata-center.com Downloaded 2006-3-13 from IP 67.87.127.223 by Joanna Antosiuk
Self-Concept Among Community College Students 217
Volume 11, Issue 3Volume 11, Issue 3Volume 11, Issue 3Volume 11, Issue 3Volume 11, Issue 3
school academic performance variables were cross-tabulated with the gender variable toexamine the gender differences in academic participation in science and mathematics duringhigh school.
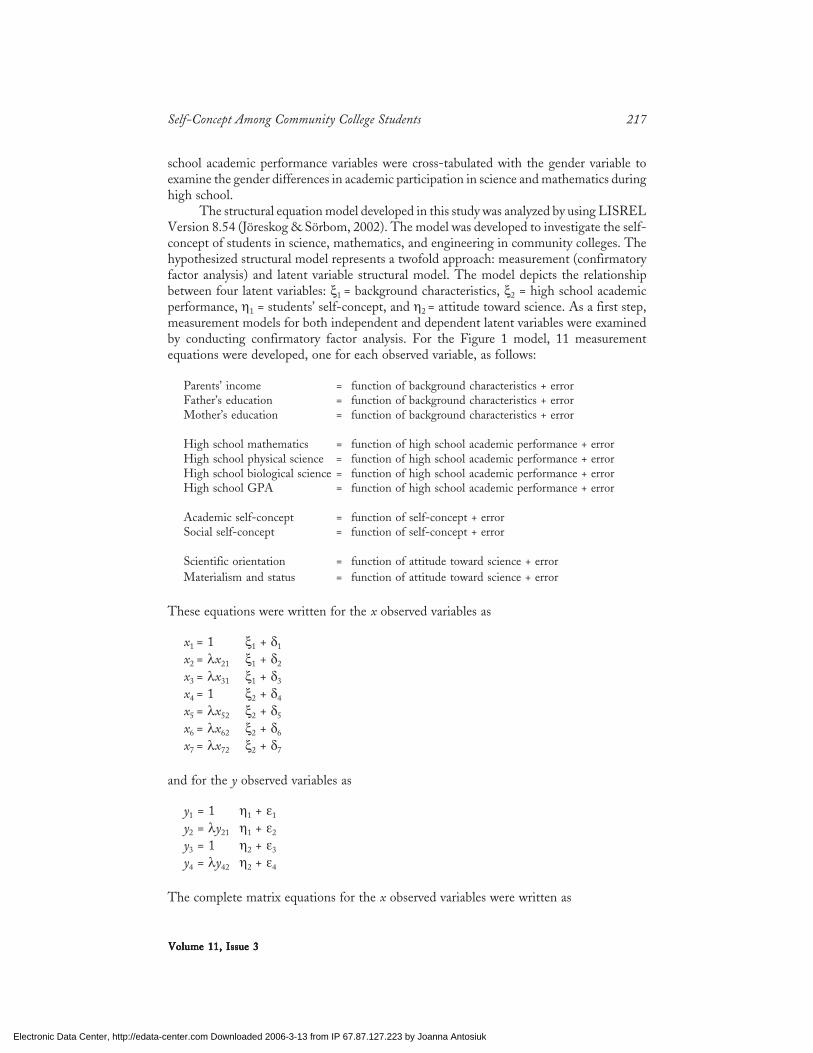
The structural equation model developed in this study was analyzed by using LISRELVersion 8.54 (Jöreskog & Sörbom, 2002). The model was developed to investigate the self-concept of students in science, mathematics, and engineering in community colleges. Thehypothesized structural model represents a twofold approach: measurement (confirmatoryfactor analysis) and latent variable structural model. The model depicts the relationshipbetween four latent variables: ξ1 = background characteristics, ξ2 = high school academicperformance, η1 = students’ self-concept, and η2 = attitude toward science. As a first step,measurement models for both independent and dependent latent variables were examinedby conducting confirmatory factor analysis. For the Figure 1 model, 11 measurementequations were developed, one for each observed variable, as follows:
Parents’ income = function of background characteristics + errorFather’s education = function of background characteristics + errorMother’s education = function of background characteristics + error
High school mathematics = function of high school academic performance + errorHigh school physical science = function of high school academic performance + errorHigh school biological science = function of high school academic performance + errorHigh school GPA = function of high school academic performance + error
Academic self-concept = function of self-concept + errorSocial self-concept = function of self-concept + error
Scientific orientation = function of attitude toward science + errorMaterialism and status = function of attitude toward science + error
These equations were written for the x observed variables as
x1 = 1 ξ1 + δ1
x2 = λx21 ξ1 + δ2
x3 = λx31 ξ1 + δ3
x4 = 1 ξ2 + δ4
x5 = λx52 ξ2 + δ5
x6 = λx62 ξ2 + δ6
x7 = λx72 ξ2 + δ7
and for the y observed variables as
y1 = 1 η1 + ε1
y2 = λy21 η1 + ε2
y3 = 1 η2 + ε3
y4 = λy42 η2 + ε4
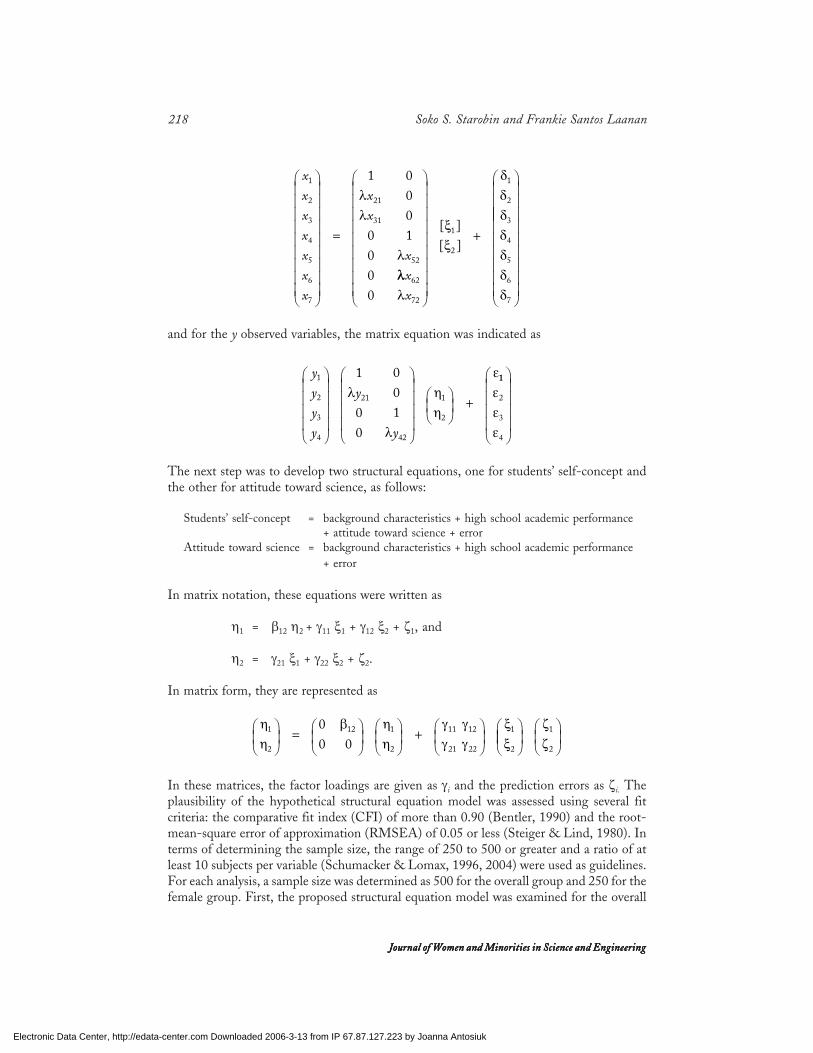
The complete matrix equations for the x observed variables were written as
Electronic Data Center, http://edata-center.com Downloaded 2006-3-13 from IP 67.87.127.223 by Joanna Antosiuk
218 Soko S. Starobin and Frankie Santos Laanan
Journal of Women and Minorities in Science and EngineeringJournal of Women and Minorities in Science and EngineeringJournal of Women and Minorities in Science and EngineeringJournal of Women and Minorities in Science and EngineeringJournal of Women and Minorities in Science and Engineering
x
x
x
x
x
x
x
x
x
x
1
2
3
4
5
6
7
21
31
52
1
0000
0001
⎛
⎝
⎜⎜⎜⎜⎜⎜⎜⎜⎜
⎞
⎠
⎟⎟⎟⎟⎟⎟⎟⎟⎟
=
λλ
λλλλ
ξξ
δδδδδδδ
x
x62
72
1
2
1
2
3
4
5
6
7
⎛
⎝
⎜⎜⎜⎜⎜⎜⎜⎜⎜
⎞
⎠
⎟⎟⎟⎟⎟⎟⎟⎟⎟
+
⎛
⎝
⎜⎜
[ ][ ]
⎜⎜⎜⎜⎜⎜⎜⎜
⎞
⎠
⎟⎟⎟⎟⎟⎟⎟⎟⎟
and for the y observed variables, the matrix equation was indicated as
y
y
y
y
y
y
1
2
3
4
21
42
1
2
1
00
001
⎛
⎝
⎜⎜⎜⎜
⎞
⎠
⎟⎟⎟⎟
⎛
⎝
⎜⎜⎜⎜
⎞
⎠
⎟⎟⎟⎟
⎛
⎝⎜
⎞
⎠⎟ +
λ
λ
ηη
ε11
2
3
4
εεε
⎛
⎝
⎜⎜⎜⎜
⎞
⎠
⎟⎟⎟⎟
The next step was to develop two structural equations, one for students’ self-concept andthe other for attitude toward science, as follows:
Students’ self-concept = background characteristics + high school academic performance+ attitude toward science + error
Attitude toward science = background characteristics + high school academic performance+ error
In matrix notation, these equations were written as
η1 = β12 η2 + γ11 ξ1 + γ12 ξ2 + ζ1, and
η2 = γ21 ξ1 + γ22 ξ2 + ζ2.
In matrix form, they are represented as
ηη
β ηη
γγ
γγ
ξξ
1
2
12 1
2
11
21
12
22
1
2
00 0
⎛
⎝⎜
⎞
⎠⎟ = ⎛
⎝⎜
⎞
⎠⎟
⎛
⎝⎜
⎞
⎠⎟ + ⎛
⎝⎜
⎞
⎠⎟
⎛
⎝⎜⎜
⎞
⎠⎟
⎛
⎝⎜
⎞
⎠⎟
ζζ
1
2
In these matrices, the factor loadings are given as γi and the prediction errors as ζi. Theplausibility of the hypothetical structural equation model was assessed using several fitcriteria: the comparative fit index (CFI) of more than 0.90 (Bentler, 1990) and the root-mean-square error of approximation (RMSEA) of 0.05 or less (Steiger & Lind, 1980). Interms of determining the sample size, the range of 250 to 500 or greater and a ratio of atleast 10 subjects per variable (Schumacker & Lomax, 1996, 2004) were used as guidelines.For each analysis, a sample size was determined as 500 for the overall group and 250 for thefemale group. First, the proposed structural equation model was examined for the overall
Electronic Data Center, http://edata-center.com Downloaded 2006-3-13 from IP 67.87.127.223 by Joanna Antosiuk
Self-Concept Among Community College Students 219
Volume 11, Issue 3Volume 11, Issue 3Volume 11, Issue 3Volume 11, Issue 3Volume 11, Issue 3
sample of 500 students. Once a fit model was determined for the overall sample, the sampleof female students was tested for a model fit.
RESULTS
Descriptive Analysis
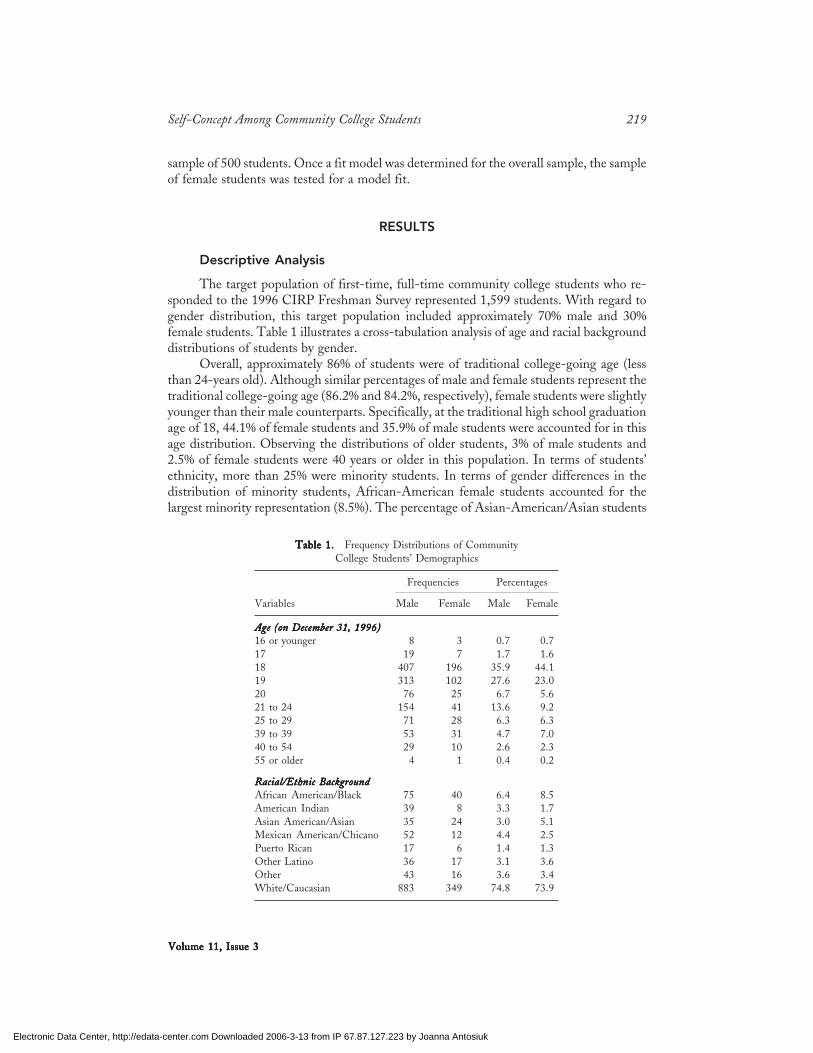
The target population of first-time, full-time community college students who re-sponded to the 1996 CIRP Freshman Survey represented 1,599 students. With regard togender distribution, this target population included approximately 70% male and 30%female students. Table 1 illustrates a cross-tabulation analysis of age and racial backgrounddistributions of students by gender.
Overall, approximately 86% of students were of traditional college-going age (lessthan 24-years old). Although similar percentages of male and female students represent thetraditional college-going age (86.2% and 84.2%, respectively), female students were slightlyyounger than their male counterparts. Specifically, at the traditional high school graduationage of 18, 44.1% of female students and 35.9% of male students were accounted for in thisage distribution. Observing the distributions of older students, 3% of male students and2.5% of female students were 40 years or older in this population. In terms of students’ethnicity, more than 25% were minority students. In terms of gender differences in thedistribution of minority students, African-American female students accounted for thelargest minority representation (8.5%). The percentage of Asian-American/Asian students
Table 1.Table 1.Table 1.Table 1.Table 1. Frequency Distributions of CommunityCollege Students’ Demographics
Frequencies Percentages
Variables Male Female Male Female
Age (on December 31, 1996)Age (on December 31, 1996)Age (on December 31, 1996)Age (on December 31, 1996)Age (on December 31, 1996)16 or younger 8 3 0.7 0.717 19 7 1.7 1.618 407 196 35.9 44.119 313 102 27.6 23.020 76 25 6.7 5.621 to 24 154 41 13.6 9.225 to 29 71 28 6.3 6.339 to 39 53 31 4.7 7.040 to 54 29 10 2.6 2.355 or older 4 1 0.4 0.2
Racial/Ethnic BackgroundRacial/Ethnic BackgroundRacial/Ethnic BackgroundRacial/Ethnic BackgroundRacial/Ethnic BackgroundAfrican American/Black 75 40 6.4 8.5American Indian 39 8 3.3 1.7Asian American/Asian 35 24 3.0 5.1Mexican American/Chicano 52 12 4.4 2.5Puerto Rican 17 6 1.4 1.3Other Latino 36 17 3.1 3.6Other 43 16 3.6 3.4White/Caucasian 883 349 74.8 73.9
Electronic Data Center, http://edata-center.com Downloaded 2006-3-13 from IP 67.87.127.223 by Joanna Antosiuk
220 Soko S. Starobin and Frankie Santos Laanan
Journal of Women and Minorities in Science and EngineeringJournal of Women and Minorities in Science and EngineeringJournal of Women and Minorities in Science and EngineeringJournal of Women and Minorities in Science and EngineeringJournal of Women and Minorities in Science and Engineering
(5.1%) comprised the next highest minority representation in the female student group.However, when a sum of Mexican-American/Chicano (2.5%), Puerto Rican (1.3%), andOther Latino (3.6%) students were counted as a total Hispanic female population, 7.4% ofstudents were represented in this group. Interestingly, for male students, the total count ofHispanic (4.4% Mexican-American/Chicano, 1.4% Puerto Rican, and 3.6% Other Latino),which accounts for 8.9% of the male population, exceeded the representation of African-American students (6.4%). In sum, with regard to the distribution of students’ race andethnicity, the 1996 CIRP data report that 74.6% of students were White (non-Hispanic),8.5% were Hispanic, 7.0% were African American, 3.6% were Asian American/Asian, andonly 2.8% were American Indian.
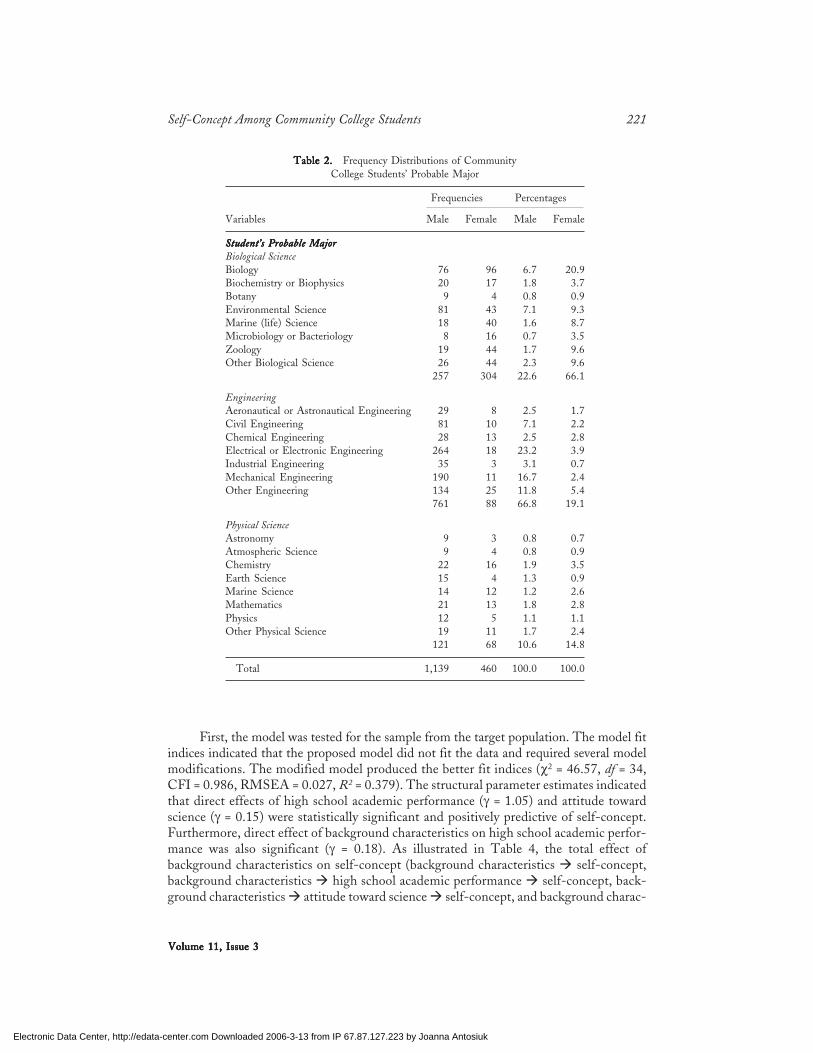
With regard to the probable majors of the target population, 53.1% of students choseengineering, 35.1% and 11.8% chose biological science and physical science, respectively(see Table 2). Considering the gender differences in choosing majors, almost 67% of malestudents chose majors in engineering, and the most represented majors were electrical orelectronic engineering (23.2%) and mechanical engineering (16.7%). Conversely, approxi-mately 66% of female students selected majors in biological science. Among female studentsin biological science, more than one third of students chose biology as their probable major.Although the numbers were relatively small, physical science majors were equally repre-sented by male (10.6%) and female (14.8%) students.
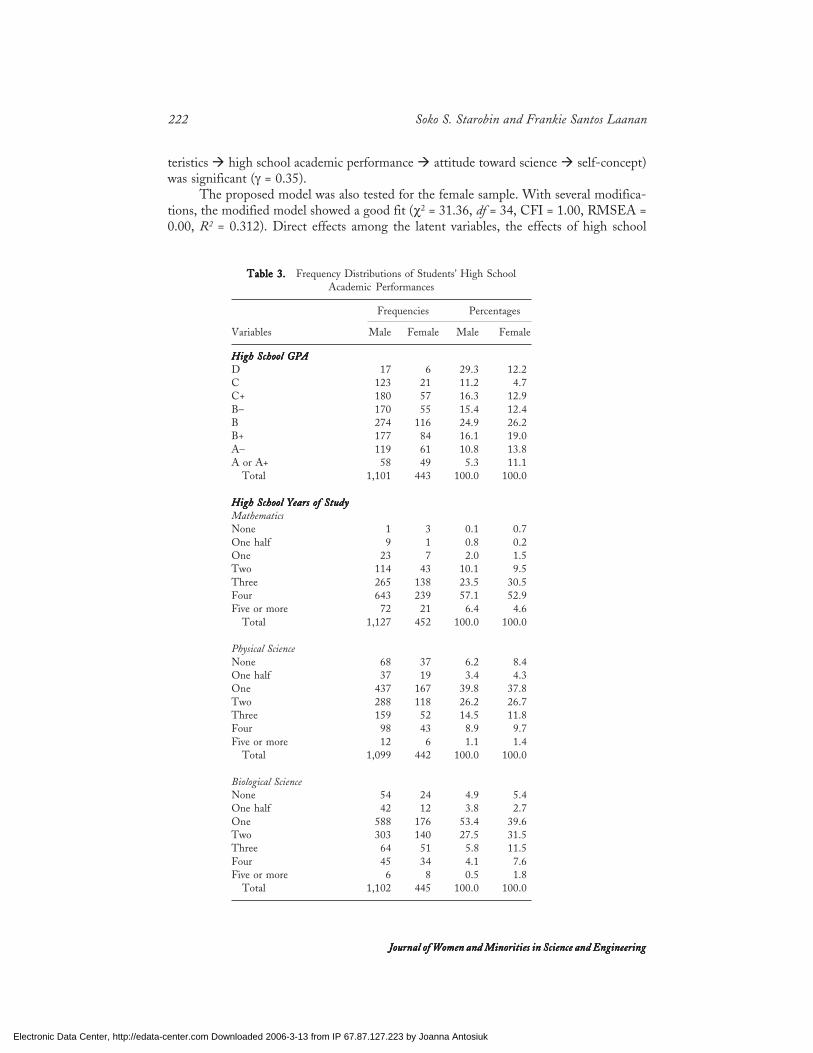
In reviewing the distribution across high school academic performance of the targetpopulation, several statistical indications show that female students performed better overall.For instance, Table 3 indicates that more than 70% of female students had high schoolGPAs of “B” or better, whereas 57.1% of male students had such grades. The distributionalso revealed that the mode was at grade “B” (26.2%) for female students and at grade “D”(29.3%) for their male counterparts. Furthermore, the distributions for both genders indi-cated a peak at grade “B”; female distribution was skewed from the higher grade to the lowergrade, whereas male distribution illustrated the opposite skewness.
In terms of students’ high school years of study in mathematics, physical science, andbiological science, the gender differences were evident only in biological science. In thedistributions of years of study in mathematics, 87% of the male and 88% of the femalestudents had 3 years or more of study in mathematics. Furthermore, the percentage of malestudents responding as having studied 3 years or more in physical science was 24.5%,whereas the percentage of female responses was 22.9%. In biological science study, however,20.9% of the female students had 3 years or more of study, and only 10.4% of male studentshad such a length of study in this field.
Model Analysis Results
The structural model was designed to examine the effects of three latent variables: (1)background characteristics, (2) high school academic performance, and (3) attitude towardscience on the dependent latent variable, self-concept. The previous investigation of theimpact of college experiences on math self-concept among 4-year college students indicatesthat precollege experiences have stronger influences on students’ ultimate level of mathconfidence than the influences derived from college experiences (Sax, 1994a). As for femalestudents, Sax (1994a) found that precollege experiences of students, which include initialinterests in science, higher high school grades, and greater math and science preparation inhigh school, appeared as strong predictors of students’ math self-concept.
Electronic Data Center, http://edata-center.com Downloaded 2006-3-13 from IP 67.87.127.223 by Joanna Antosiuk
Self-Concept Among Community College Students 221
Volume 11, Issue 3Volume 11, Issue 3Volume 11, Issue 3Volume 11, Issue 3Volume 11, Issue 3
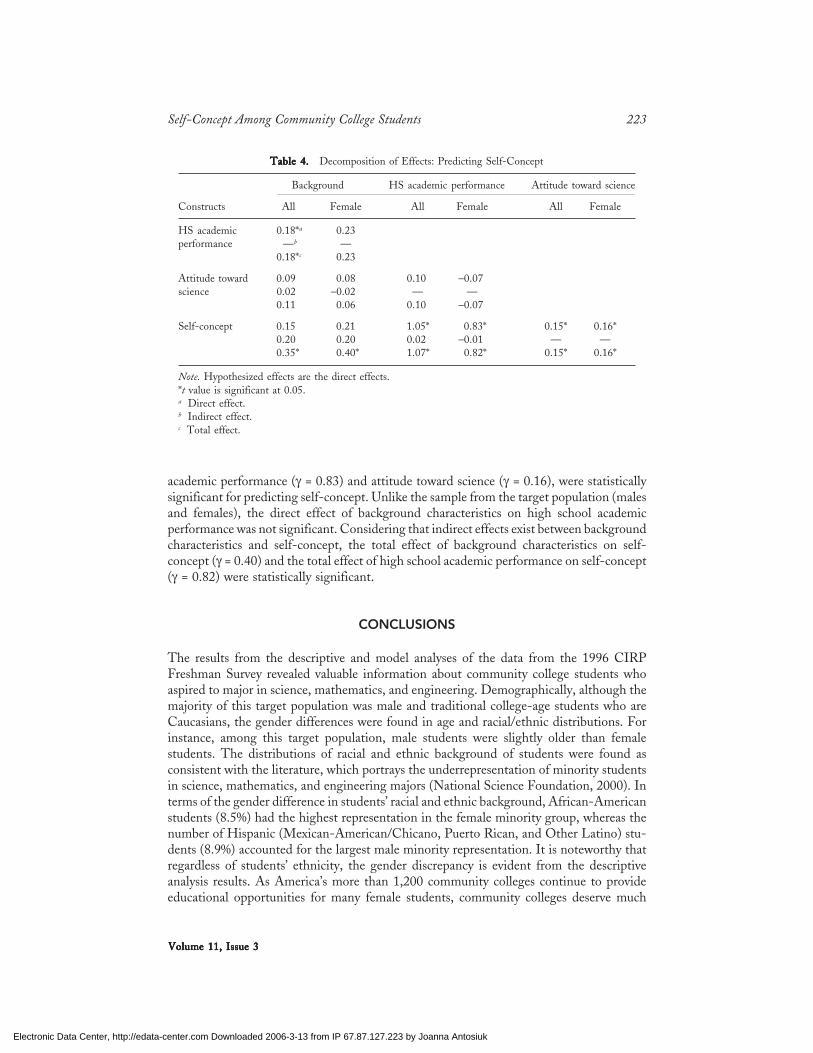
First, the model was tested for the sample from the target population. The model fitindices indicated that the proposed model did not fit the data and required several modelmodifications. The modified model produced the better fit indices (χ2 = 46.57, df = 34,CFI = 0.986, RMSEA = 0.027, R2 = 0.379). The structural parameter estimates indicatedthat direct effects of high school academic performance (γ = 1.05) and attitude towardscience (γ = 0.15) were statistically significant and positively predictive of self-concept.Furthermore, direct effect of background characteristics on high school academic perfor-mance was also significant (γ = 0.18). As illustrated in Table 4, the total effect ofbackground characteristics on self-concept (background characteristics self-concept,background characteristics high school academic performance self-concept, back-ground characteristics attitude toward science self-concept, and background charac-
Table 2.Table 2.Table 2.Table 2.Table 2. Frequency Distributions of CommunityCollege Students’ Probable Major
Frequencies Percentages
Variables Male Female Male Female
Student’s Probable MajorStudent’s Probable MajorStudent’s Probable MajorStudent’s Probable MajorStudent’s Probable MajorBiological ScienceBiology 76 96 6.7 20.9Biochemistry or Biophysics 20 17 1.8 3.7Botany 9 4 0.8 0.9Environmental Science 81 43 7.1 9.3Marine (life) Science 18 40 1.6 8.7Microbiology or Bacteriology 8 16 0.7 3.5Zoology 19 44 1.7 9.6Other Biological Science 26 44 2.3 9.6
257 304 22.6 66.1
EngineeringAeronautical or Astronautical Engineering 29 8 2.5 1.7Civil Engineering 81 10 7.1 2.2Chemical Engineering 28 13 2.5 2.8Electrical or Electronic Engineering 264 18 23.2 3.9Industrial Engineering 35 3 3.1 0.7Mechanical Engineering 190 11 16.7 2.4Other Engineering 134 25 11.8 5.4
761 88 66.8 19.1
Physical ScienceAstronomy 9 3 0.8 0.7Atmospheric Science 9 4 0.8 0.9Chemistry 22 16 1.9 3.5Earth Science 15 4 1.3 0.9Marine Science 14 12 1.2 2.6Mathematics 21 13 1.8 2.8Physics 12 5 1.1 1.1Other Physical Science 19 11 1.7 2.4
121 68 10.6 14.8
Total 1,139 460 100.0 100.0
Electronic Data Center, http://edata-center.com Downloaded 2006-3-13 from IP 67.87.127.223 by Joanna Antosiuk
222 Soko S. Starobin and Frankie Santos Laanan
Journal of Women and Minorities in Science and EngineeringJournal of Women and Minorities in Science and EngineeringJournal of Women and Minorities in Science and EngineeringJournal of Women and Minorities in Science and EngineeringJournal of Women and Minorities in Science and Engineering
Table 3.Table 3.Table 3.Table 3.Table 3. Frequency Distributions of Students’ High SchoolAcademic Performances
Frequencies Percentages
Variables Male Female Male Female
High School GPAHigh School GPAHigh School GPAHigh School GPAHigh School GPAD 17 6 29.3 12.2C 123 21 11.2 4.7C+ 180 57 16.3 12.9B– 170 55 15.4 12.4B 274 116 24.9 26.2B+ 177 84 16.1 19.0A– 119 61 10.8 13.8A or A+ 58 49 5.3 11.1
Total 1,101 443 100.0 100.0
High School Years of StudyHigh School Years of StudyHigh School Years of StudyHigh School Years of StudyHigh School Years of StudyMathematicsNone 1 3 0.1 0.7One half 9 1 0.8 0.2One 23 7 2.0 1.5Two 114 43 10.1 9.5Three 265 138 23.5 30.5Four 643 239 57.1 52.9Five or more 72 21 6.4 4.6
Total 1,127 452 100.0 100.0
Physical ScienceNone 68 37 6.2 8.4One half 37 19 3.4 4.3One 437 167 39.8 37.8Two 288 118 26.2 26.7Three 159 52 14.5 11.8Four 98 43 8.9 9.7Five or more 12 6 1.1 1.4
Total 1,099 442 100.0 100.0
Biological ScienceNone 54 24 4.9 5.4One half 42 12 3.8 2.7One 588 176 53.4 39.6Two 303 140 27.5 31.5Three 64 51 5.8 11.5Four 45 34 4.1 7.6Five or more 6 8 0.5 1.8
Total 1,102 445 100.0 100.0
teristics high school academic performance attitude toward science self-concept)was significant (γ = 0.35).
The proposed model was also tested for the female sample. With several modifica-tions, the modified model showed a good fit (χ2 = 31.36, df = 34, CFI = 1.00, RMSEA =0.00, R2 = 0.312). Direct effects among the latent variables, the effects of high school
Electronic Data Center, http://edata-center.com Downloaded 2006-3-13 from IP 67.87.127.223 by Joanna Antosiuk
Self-Concept Among Community College Students 223
Volume 11, Issue 3Volume 11, Issue 3Volume 11, Issue 3Volume 11, Issue 3Volume 11, Issue 3
academic performance (γ = 0.83) and attitude toward science (γ = 0.16), were statisticallysignificant for predicting self-concept. Unlike the sample from the target population (malesand females), the direct effect of background characteristics on high school academicperformance was not significant. Considering that indirect effects exist between backgroundcharacteristics and self-concept, the total effect of background characteristics on self-concept (γ = 0.40) and the total effect of high school academic performance on self-concept(γ = 0.82) were statistically significant.
CONCLUSIONS
The results from the descriptive and model analyses of the data from the 1996 CIRPFreshman Survey revealed valuable information about community college students whoaspired to major in science, mathematics, and engineering. Demographically, although themajority of this target population was male and traditional college-age students who areCaucasians, the gender differences were found in age and racial/ethnic distributions. Forinstance, among this target population, male students were slightly older than femalestudents. The distributions of racial and ethnic background of students were found asconsistent with the literature, which portrays the underrepresentation of minority studentsin science, mathematics, and engineering majors (National Science Foundation, 2000). Interms of the gender difference in students’ racial and ethnic background, African-Americanstudents (8.5%) had the highest representation in the female minority group, whereas thenumber of Hispanic (Mexican-American/Chicano, Puerto Rican, and Other Latino) stu-dents (8.9%) accounted for the largest male minority representation. It is noteworthy thatregardless of students’ ethnicity, the gender discrepancy is evident from the descriptiveanalysis results. As America’s more than 1,200 community colleges continue to provideeducational opportunities for many female students, community colleges deserve much
Table 4.Table 4.Table 4.Table 4.Table 4. Decomposition of Effects: Predicting Self-Concept
Background HS academic performance Attitude toward science
Constructs All Female All Female All Female
HS academic 0.18*a 0.23performance —b —
0.18*c 0.23
Attitude toward 0.09 0.08 0.10 –0.07science 0.02 –0.02 — —
0.11 0.06 0.10 –0.07
Self-concept 0.15 0.21 1.05* 0.83* 0.15* 0.16*0.20 0.20 0.02 –0.01 — —
0.35* 0.40* 1.07* 0.82* 0.15* 0.16*
Note. Hypothesized effects are the direct effects.*t value is significant at 0.05.a Direct effect.b Indirect effect.c Total effect.
Electronic Data Center, http://edata-center.com Downloaded 2006-3-13 from IP 67.87.127.223 by Joanna Antosiuk
224 Soko S. Starobin and Frankie Santos Laanan
Journal of Women and Minorities in Science and EngineeringJournal of Women and Minorities in Science and EngineeringJournal of Women and Minorities in Science and EngineeringJournal of Women and Minorities in Science and EngineeringJournal of Women and Minorities in Science and Engineering
attention from policymakers, scholars, and the general public to promote an increase inrepresentation of female students in science, mathematics, and engineering.
The results from the structural model analysis in this study provided three importantfindings. First, concerning the conceptual framework that guided the hypothetical structuralmodel, it is clear that the learning “environment” appears to be a contributing factor forpredicting the “outcome” variable, self-concept. More specifically, as defined as the mea-surement for the learning “environment,” students’ high school academic performance wasa positive contributing factor of predicting students’ self-concept in the model. This findingwas observed in the samples from the target population and the female group. Furthermore,this finding was congruent with the conclusion of previous studies (Astin, 1993; Pascarellaet al., 1987) that high school experiences (i.e., high school GPA and high school coursework)were associated with student’s self-concept (i.e., academic and mathematical ability). Thisfinding suggests the importance of educational experiences, specifically academic prepara-tion during high school, for students who aspire to major in science, mathematics, andengineering at community colleges.
In examining the influence of background characteristics, “input latent variable,” onpredicting students’ self-concept, results from this study did not yield a significant contri-bution of the background characteristics. However, when the indirect effects (backgroundcharacteristics high school academic performance self-concept, background charac-teristics attitude toward science self-concept, and background characteristics highschool academic performance attitude toward science self-concept) were taken intoaccount, the total effect of background characteristics showed a significant contribution topredicting students’ self-concept. It is notable that the total effect of background character-istics was stronger for the female group. It is assumed that this “input latent variable” playsa complex and important role because it indirectly influences predicting students’ attitudetoward science and self-concept. Thus, it might be beneficial to include additional variablesor concepts in this “input latent variable” to better understand the complexity of its influenceon predicting self-concept or attitude toward science, specifically among female communitycollege students in science, mathematics, and engineering.
Second, a critical finding from the model analysis resulted from another conceptualframework used in this study: the notion of the differential coursework hypothesis. Al-though female students in this study were more academically prepared (higher GPA andmore courses taken in biological sciences) than male students, the influence of high schoolacademic performance on predicting self-concept was less than that of overall students(males and females). The findings suggest that the converse effect of the differentialcoursework hypothesis with respect to predicting students’ self-concept was found in thisstudy. In addition, it may be that there are other factors in addition to high school academicachievement that may influence the development of female students’ self-concept.
Finally, as supported by the literature, the finding of the strong influence of attitudetoward science on predicting self-concept among female students indicates the need forsupport programs and services for them to enhance their attitude toward science. Forinstance, female students, who are marginalized in science, mathematics, and engineering,can benefit from sociopsychological interventions provided by high school and communitycollege experiences (academic, social, etc.) to develop their self-concept over time.
There are several limitations to this study. The sample of this study was a cohort of1996 first-time, full-time community college students. Although this data set includesstudents who started college almost 10 years ago, the goal of this research was to build on
Electronic Data Center, http://edata-center.com Downloaded 2006-3-13 from IP 67.87.127.223 by Joanna Antosiuk
Self-Concept Among Community College Students 225
Volume 11, Issue 3Volume 11, Issue 3Volume 11, Issue 3Volume 11, Issue 3Volume 11, Issue 3
the 1990 study conducted by Nora and Rendón. Furthermore, after the initial data screeningof the CIRP Freshman Survey data of 1999 and 2000, the researchers concluded that the1996 data set offers the most comprehensive variables with regard to students’ high schoolacademic performances.
There was a lack of representation of female students in the sample. As the findingsfrom the descriptive analysis indicated, the majority of the students represented in the dataset is Caucasian males. Initially, the researchers attempted to conduct a multiple groupanalysis to examine gender differences in predicting self-concept. Once the model fitanalysis was conducted and finalized with the modifications for the target population (bothmale and female students), the modified model tested male and female groups separately.The male sample did not fit the data; therefore, the analysis and interpretation of the resultswere focused on the sample from the target population (includes both males and females)and the female sample. Beyond the limitations for statistical analysis, the lack of femalerepresentation in science, mathematics, and engineering forewarns policymakers that thegender disparity already exists at the community college level. The underrepresentation offemale students also challenges community college practitioners and faculty to address theissue of retaining the pool of female students.
On the basis of the results from this study, the following recommendations arepresented and have implications for future research and policymakers to facilitate thepromotion of increasing the representation of female students in science, mathematics, andengineering in the postsecondary education arena:
• Introduce and examine new variables or constructs for the “input variable” (e.g.,parents’ attitude toward science, mathematics, and engineering; parents’ occupa-tion; and financial aid) to evaluate its influence on predicting students’ attitudetoward science and self-concept.
• Use transcript data to measure high school academic performances. Transcriptdata permit researchers to use science and mathematics course grades in additionto the high school Grade Point Average (GPA).
• Explore institutional characteristics variables as additional “environment” factorsin the model. Female students who aspire to study in science, mathematics, andengineering may benefit from the learning environment in community colleges. Ata community college, the majority of students are female, and the learning envi-ronment is less competitive than in 4-year institutions. Learning environmentfactors can be measured by analyzing national statistics (e.g., data from the Inte-grated Postsecondary Education Data System). Another “environment” factor canbe measured by examining students’ perceived institutional characteristics (e.g.,learning experiences, satisfaction in teaching, and other cultural contexts of com-munity colleges).
• Employ a longitudinal design that examines how students develop and change overtime. Specifically, the design that includes students’ high school as well as commu-nity college experiences and aspirations is critical in understanding students’ level ofself-concept, as well as their attitude toward science, mathematics, and engineering.
• Develop a longitudinal design that investigates community college students whotransfer from community colleges to 4-year institutions to study science, math-ematics, and engineering. A comparative study of two cohorts: (1) communitycollege transfer students and (2) students who began their study as freshmen at a
Electronic Data Center, http://edata-center.com Downloaded 2006-3-13 from IP 67.87.127.223 by Joanna Antosiuk
226 Soko S. Starobin and Frankie Santos Laanan
Journal of Women and Minorities in Science and EngineeringJournal of Women and Minorities in Science and EngineeringJournal of Women and Minorities in Science and EngineeringJournal of Women and Minorities in Science and EngineeringJournal of Women and Minorities in Science and Engineering
4-year institution will allow researchers to examine the influences of students’academic and social experiences at community colleges on their academic progressand social adjustment at 4-year institutions. Findings from the comparative studycan provide vital information for educators and policymakers to develop a seamlesspathway for community college students to obtain a baccalaureate degree inscience, mathematics, and engineering.
• Conduct studies that examine gender and racial/ethnic differences among students.The results could inform student support professional strategies to recruit, retain, andgraduate women and minorities in science, mathematics, and engineering.
In conclusion, there is no doubt that community colleges play a significant role inproviding access to postsecondary education for traditionally underrepresented student groupsin science, mathematics, and engineering. This segment of American higher educationcontinues to play a critical role in educating and training a highly skilled science, technology,and engineering workforce in the global marketplace. The future of increasing the represen-tation of women and minorities pursuing baccalaureate degrees rests on the extent to whichthe transfer function of community colleges facilitates student movement from the 2- to 4-year college or university. The interinstitutional collaboration, as well as transfer and articu-lation policies, will ultimately determine the educational pathway of community collegestudents who aspire to study in science, mathematics, and engineering. Community collegesare the place in which students begin their educational pursuits, and it is also a viable sectorthat leads to the pathway to a science, mathematics, and engineering degree.
REFERENCES
Astin, A. W. (1993). What matters in college? Four critical years revisited. San Francisco: Jossey-Bass, Inc.Bailey, R. C. (1971). Self-concept differences in low and high achieving students. Journal of Clinical
Psychology, 27(2), 188-191.Bentler, P. M. (1990). Comparative fit indices in structural models. Psychological Bulletin, 107,
238-246.Bryne, B. M. (1984). The general/academic nomological network: A review of construct validation
research. Review of Educational Research, 54(3), 427-456.Carlone, H. B. (2003). (Re)producing good science students: Girls’ participation in high school
physics. Journal of Women and Minorities in Science and Engineering, 9(1), 17-34.Cohen, A. M., & Brawer, F. B. (2003). The American community college (4th ed.). San Francisco:
Jossey-Bass.Drake, K., Clewell, B. C., & Sevo, R. (2002). Meeting the challenge: The impact of the National
Science Foundation’s program for women and girls. Journal of Women and Minorities in Science andEngineering, 8(3&4), 285-303.
Ethington, C. A., & Wolfle, L. M. (1984). Sex differences in a causal model of mathematicsachievement. Journal for Research in Mathematics Education, 15, 361-377.
Ethington, C. A, & Wolfle, L. M. (1986). A structural model of mathematics achievement for menand women. American Educational Research Journal, 23(1), 65-75.
Fennema, E., & Sherman, J. (1977). Sex-related differences in mathematics achievement, spatialvisualization and affective factors. American Educational Research Journal, 14, 51-71.
Hansford, B. C., & Hattie, J. A. (1982). The relationship between self and achievement/perfor-mance measures. Review of Educational Research, 52(1), 123-142.
Electronic Data Center, http://edata-center.com Downloaded 2006-3-13 from IP 67.87.127.223 by Joanna Antosiuk
Self-Concept Among Community College Students 227
Volume 11, Issue 3Volume 11, Issue 3Volume 11, Issue 3Volume 11, Issue 3Volume 11, Issue 3
House, D. J. (1995). The predictive relationship between academic self-concept, achievement expect-ancies, and grade performance in college calculus. Journal of Social Psychology, 135(1), 111-112.
Huang, P. M., & Brainard, S. G. (2001). Identifying determinants of academic self-confidenceamong science, math, engineering, and technology students. Journal of Women and Minorities inScience and Engineering, 7(4), 315-337.
Hughes, W. J. (2000). Perceived gender interaction and course confidence among undergraduatescience, mathematics, and technology majors. Journal of Women and Minorities in Science andEngineering, 6(2), 155-167.
Jöreskog, K. G., & Sörbom, D. (2002). LISREL 8.54. Lincolnwood, IL: Scientific SoftwareInternational Inc.
Laanan, F. S. (2003). Degree aspirations of two-year college students. Community College Journal ofResearch and Practice, 27(6), 495-518.
Lips, H. M. (1995). Predicting university women’s participation in mathematics and science: Acausal model. Journal of Women and Minorities in Science and Engineering, 2(4), 193–206.
National Center for Education Statistics. (2002). Digest of Education Statistics: 2001. Washington,DC: U.S. Department of Education.
National Science Foundation. (2000). Women, minorities, and persons with disabilities in scienceand engineering: 2000 (Report No. NSF 00-327). Arlington, VA: Author.
National Science Foundation Authorization Act of 2002, Pub. L. 107-368, §3, 116 Stat. 3035 (2002).Nora, A., & Horvath, F. (1990). Structural pattern differences in course enrollment rates among
community college students. Research in Higher Education, 31(6), 539-554.Nora, A., & Rendón, L. (1990). Differences in mathematics and science preparation and participa-
tion among community college minority and non-minority students. Community College Review,18(2), 29-40.
Pallas, A. M., & Alexander, K.L. (1983). Sex differences in quantitative SAT performance: Newevidence on the differential coursework hypothesis. American Educational Research Journal, 20,165-182.
Pascarella, E. T., Smart, J. C., Ethington, C. A., and Nettles, M. T. (1987). The influence of collegeon self-concept: A consideration of race and gender differences. American Educational ResearchJournal, 24(1), 49-77.
Phillippe, K., & Patton, M. (2000). National profile of community colleges: Trends and statistics (3rded.). Washington, DC: Community College Press.
Sax, L. J. (1994a). Mathematical self-concept: How college reinforces the gender gap. Research inHigher Education, 35(2), 141-166.
Sax, L. J. (1994b). Predicting gender and major field differences in mathematical self-concept duringcollege. Journal of Women and Minorities in Science and Engineering, 1(4), 291-307.
Sax, L. J., Astin, A. W., Korn, W. S., & Mahoney, K. (1996). The American freshman: National norms forfall 1996. Los Angeles: Higher Education Research Institute, University of California, Los Angeles.
Schumacker, R. E., & Lomax, R. G. (1996). A beginner’s guide to structural equation modeling.Mahwah, NJ: Lawrence Erlbaum Associates, Inc.
Schumacker, R. E., & Lomax, R. G. (2004). A beginner’s guide to structural equation modeling (2nded.). Mahwah, NJ: Lawrence Erlbaum Associates, Inc.
Sherman, J. (1980). Mathematics, spatial visualization, and related factors: Changes in girls and boys,grades 8-11. Journal of Educational Psychology, 72, 476-482.
Sherman, J. (1982). Continuing in mathematics: A longitudinal study of the attitudes of high schoolgirls. Psychology of Women Quarterly, 7(2), 132-140.
Sherman, J. (1983). Factors predicting girls’ and boys’ enrollment in college preparatory mathemat-ics. Psychology of Women Quarterly, 7(3), 272-281.
Spears, J. D., Dyer, R. A., Franks, S. E., & Montelone, B. A. (2004). Building a network to supportgirls and women in science, technology, engineering, and mathematics. Journal of Women andMinorities in Science and Engineering, 10(2), 161-177.
Electronic Data Center, http://edata-center.com Downloaded 2006-3-13 from IP 67.87.127.223 by Joanna Antosiuk
228 Soko S. Starobin and Frankie Santos Laanan
Journal of Women and Minorities in Science and EngineeringJournal of Women and Minorities in Science and EngineeringJournal of Women and Minorities in Science and EngineeringJournal of Women and Minorities in Science and EngineeringJournal of Women and Minorities in Science and Engineering
Steiger, J. H., & Lind, C. (1980, May). Statistically based tests for the number of common factors. Paperpresented at the annual meeting of the Psychometric Society, Iowa City, IA.
Tsapogas, J. (2004a). The role of community colleges in the education of recent science and engineeringgraduates. InfoBrief NSF 04-315. Washington, DC: National Science Foundation, Directorate forSocial, Behavioral, and Economic Sciences.
Tsapogas, J. (2004b). More than one-fifth of all individuals employed in science and engineering occupa-tions have less than a bachelor’s degree education. InfoBrief NSF 04-333. Washington, DC: NationalScience Foundation, Directorate for Social, Behavioral, and Economic Sciences.
Wyer, M. (2003). Intending to stay: Images of scientists, attitudes toward women, and gender asinfluences on persistence among science and engineering majors. Journal of Women and Minoritiesin Science and Engineering, 9(1), 1-16.
Electronic Data Center, http://edata-center.com Downloaded 2006-3-13 from IP 67.87.127.223 by Joanna Antosiuk
Self-Concept Among Community College Students 229
Volume 11, Issue 3Volume 11, Issue 3Volume 11, Issue 3Volume 11, Issue 3Volume 11, Issue 3
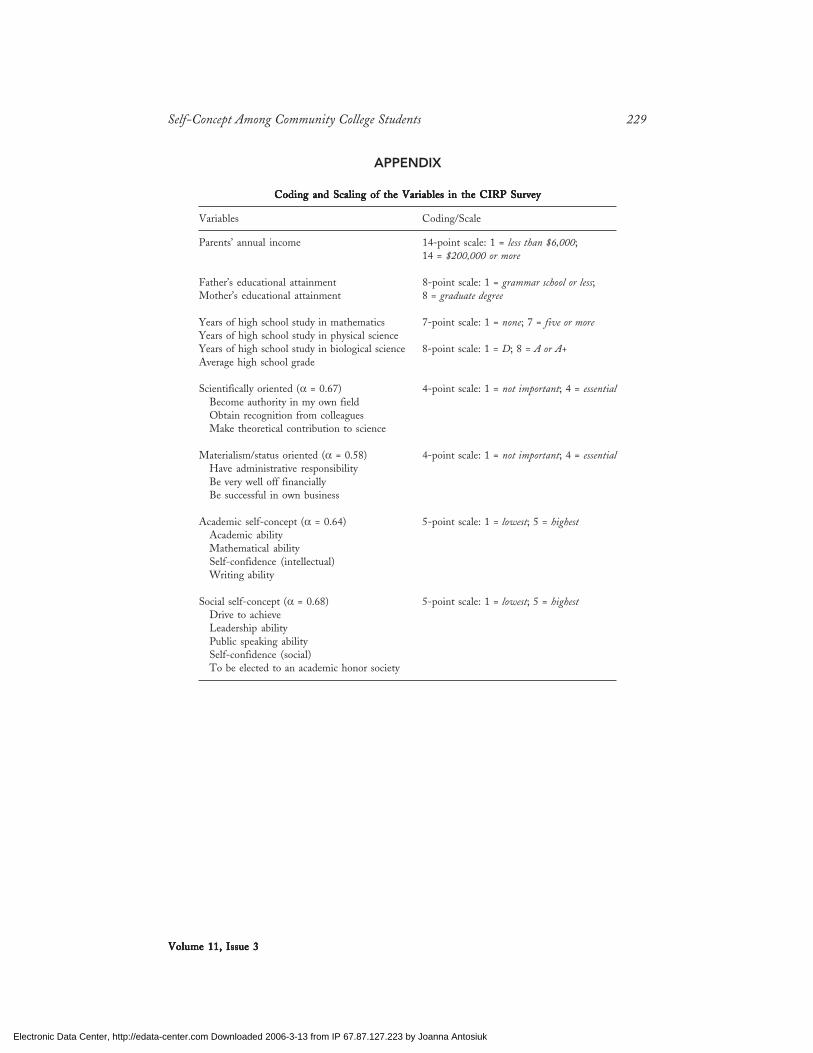
APPENDIX
Coding and Scaling of the Variables in the CIRP SurveyCoding and Scaling of the Variables in the CIRP SurveyCoding and Scaling of the Variables in the CIRP SurveyCoding and Scaling of the Variables in the CIRP SurveyCoding and Scaling of the Variables in the CIRP Survey
Variables Coding/Scale
Parents’ annual income 14-point scale: 1 = less than $6,000;14 = $200,000 or more
Father’s educational attainment 8-point scale: 1 = grammar school or less;Mother’s educational attainment 8 = graduate degree
Years of high school study in mathematics 7-point scale: 1 = none; 7 = five or moreYears of high school study in physical scienceYears of high school study in biological science 8-point scale: 1 = D; 8 = A or A+Average high school grade
Scientifically oriented (α = 0.67) 4-point scale: 1 = not important; 4 = essentialBecome authority in my own fieldObtain recognition from colleaguesMake theoretical contribution to science
Materialism/status oriented (α = 0.58) 4-point scale: 1 = not important; 4 = essentialHave administrative responsibilityBe very well off financiallyBe successful in own business
Academic self-concept (α = 0.64) 5-point scale: 1 = lowest; 5 = highestAcademic abilityMathematical abilitySelf-confidence (intellectual)Writing ability
Social self-concept (α = 0.68) 5-point scale: 1 = lowest; 5 = highestDrive to achieveLeadership abilityPublic speaking abilitySelf-confidence (social)To be elected to an academic honor society
Electronic Data Center, http://edata-center.com Downloaded 2006-3-13 from IP 67.87.127.223 by Joanna Antosiuk

Electronic Data Center, http://edata-center.com Downloaded 2006-3-13 from IP 67.87.127.223 by Joanna Antosiuk


![rethinking-precollege-math.wikispaces.comrethinking-precollege-math.wikispaces.com/file/view/IA... · Web viewEither MATH 072 [elementary algebra], 085 [technical mathematics I],](https://img.pdfslide.us/doc/110x75/5aa1927d7f8b9a1f6d8c133c/rethinking-precollege-math-vieweither-math-072-elementary-algebra-085-technical.jpg)