Embed Size (px)
Citation preview
Calhoun, Jr. Study of Drainage Characteristics of Base Course Materials. HRB, Highway Research Record 203, 1967, pp. 8-28.
7. E. S. Barber and C. L. Sawyer. Highway Subdrainage. HRB, Proc., Vol. 31, 1952, pp. 643-666.
8. S. H. Carpenter, M. I. Darter, and S. Herrin . A Pavement Moisture Accelerated Distress (MAD) Identification System. Vol. I. Federal Highway Administration (in preparation).
9. M. I. Darter and S. Herrin. Pavement Distress Identification Manual. Vol. II. Federal Highway Administration (in preparation).
10. A. J. Haynes and E. J. Yoder. Effects of Repeated Loading on Gravel and Crushed Stone Base Course Materials Used in the AASHO Road Test. HRB, Highway Research Record 39, 1963, pp. 82-96.
11. F. D. Hole. Suggested Terminology for Describing Soils as Three-Dimensional Bodies. Soil Science Proc., Vol. 17, No. 2, 1953, pp. 131-135.
12. W. M. Haas. Drainage Index in Correlation of Agricultural Soils With Frost Action and Soil Performance. HRB, Bull. 111, 1955, pp. 85-98.
13
13. M. Y. Shahin, M. I. Darter, and S. D. Kohn. Development of a Pavement Maintenance Management System: Vol. I-Airfield Pavement Condition Rating. U.S. Air Force Civil Engineering Center, Tindall Air Force Base, FL, Technical Rept. AFCEC-TR-76-27, Dec. 1976 .
14. M. Y. Shahin, M. I. Darter, and S. D. Kohn. Development of a Pavement Maintenance System: Vol. II-Airfield Pavement Distress Identification Manual. U.S. Air Force Civil Engineering Center, Tindall Air Force Base, FL, Technical Rept. AFCEC-TR-76-27, Dec. 1976.
15. U. L. Maytin. A New Field Test for Highway Shoulder Permeability. HRB, Proc., Vol. 41, 1962, pp. 109-124.
16. M. Y. Shahin, M. I. Darter, and S. D. Kohn. Development of a Pavement Condition Index for Roads and Streets. U.S. Army Construction Engineering Research Laboratory, Champaign, IL, Interim Rept. M-232, May 1978.
Publication of this paper sponsored by Committee on Subsurface Drainage and Committee on Environmental Factors Except Frost.
Influence of Precipitation, Joints, and Sealing on Pavement Drainage Barry J. Dempsey, Department of Civil Engineering, University of Illinois, Urbana Quentin L. Robnett, School of Civil Engineering, Georgia Institute of Technology, Atlanta
A study was conducted to determine the influence of precipitation, joints, and sealing on drainage of concrete pavements. Detailed drainage studies were conducted on four pavement test sections. Two jointed concrete pavement test sections were located on 1-85 near Atlanta, and one continuously reinforced concrete pavement test section and one reinforced jointed concrete pavement test section were located on 1-57 near Champaign, Illinois. Subsurface drainage was installed on the Georgia test pavements as part of the test preparation. Subsurface drainage on the Illinois test pavements had been installed previously as part of a shoulder rehabilitation program. All drainage outflows were measured by specially designed flowmeters capable of continuously monitoring volumes. All precipitation data were obtained on an hourly basis from weather stations near the pavement test sites. Analysis of data indicated that pavement drainage outflow was significantly related to precipitation. It was also found that the edge joint was a major factor contributing to water infil· tration into pavement systems. Edge-joint sealing was found to reduce water infiltration in the jointed concrete pavement test sections in both Georgia and Illinois. Edge-joint sealing on the continuously reinforced section in Illinois did not significantly reduce surface infiltration. No measurable drainage outflow was observed on the completely sealed pavement test section in Georgia.
Water is a fundamental variable in most problems associated with pavement construction, design, behavior, and performance. Moisture usually has very significant effects on pavement systems because the structural section and subgrade are often susceptible to large variations in moisture content and are strongly influenced by surrounding climatic conditions.
The problem of water in pavements has long been of concern to engineers. Cedergren and O'Brien (1) have listed over 225 abstracts of pertinent literature on the subject of subdrainage. Recently Dempsey and others
(2) completed a state-of-the-art review of the existing literature on and current practices for subdrainage, shoulder structures, and maintenance of pavement systems for the Federal Highway Administration.
Methods for controlling moisture in pavement systems can generally be classified in terms of protection through the use of waterproofing membranes and anticapillary courses, the use of materials insensitive to moisture changes, and water evacuation by means of subdninage. Ridgeway (3), Ring (4), Woodstrom (5), and Barksdale and Hicks (6) have all reported on the-problem of water infiltration through cracks and joints of concrete pavements and have indicated that the performance life of many concrete pavements could be extended by improved protection and drainage of the structural section. Darter and Ba.renberg (7) have indicated that protection of the structural pavement section and subgrade by adequate sealing of joints and cracks can help prolong pavement life.
Although water-related distress is obvious in pavement systems, few studies have been conducted to determine the pavement conditions that contribute to water problems and the procedures that will best mitigate these problems. Ridgeway (3) and Barksdale and Hicks (6) have conducted controlled field tests to determine tile percentage of surface water infiltrating into pavement systems. Ridgeway (3) measured infiltration rates for both portland cement concrete and asphalt concrete pavements in Connecticut. Barksdale and Hicks (6) conducted tests at two Georgia Interstate locations that have plain jointed portland cement concrete traffic lanes and asphalt concrete shoulders. These studies have indicated that
14
Table 1. Detailed description of drainage test sites.
Item
Location
Surface course Type
Width Thickness Joint spacing Transverse slope
Longitudinal slope Length of test section Width of test section Date constructed
Base course Type
Thickness Saturated hydraulic conductivity
SUbgrade Type Saturated hydraulic conductivity
Shoulders Type
Width
Thickness
Subsurface drainage Type
Diameter Location Depth Drainage envelope
Saturated hydraulic conductivity
Test site drainage area
Test Site
Gl
Georgia I-85N, Fulton County, 16 km southwcot of Atlanta
Plain jointed portland cement concrete without dowel bars
7.3 m 25.4 cm 9.1 m 0.83 % sloped to outside
shoulder 1.00"' 30.5 m 7.3 m 1964
Crushed granite, dense graded
40.6-60.9 cm 4.7µm/s
A-4 10 µm / s
Asphalt concrete on cement-treated aggregate
0.6 m inside, 3. I m outside
5.1 cm asphalt concrete 15.2 c:m cement-treated
aggregate
Corrugated plastic pipe, constructed Oct. 1977
10.2 cm I.D. Adjacent to pavement edge 86.4 cm Crushed granite, open
graded 400 µmis
248.1 m'
G2
Georgia !-85N, Fulton County, 16 km southwest of Atlanta
Plain jointed porlland cement concrete without dowel bars
7.3 m 25.4 cm 9.1 m 0. 83 ~ sloped to outside
shoulder 1.00~
30.5 m 7.3 m 1964
Crushed granite, dense graded
40,6-60.9 cm 4. 7 µm/s
A-4 10 um / s
Asphalt concrete on cement-treated aggregate
0.6 m inside, 3.1 m outside
5. I cm asphalt concrete 15.2 cm cement-treated
aggregate
Corrugated plastic pipe, constructed Oct. 1977
10.2 cm l.D. Adjacent to pavement edge 86.4 cm Crushed granite, open
graded 400 µm/s
233 ,6 m2
II
Illinois l-57S, Champaign County, 8 km south of Champaign
Continuously reinforced portland cement concrete
7.3 Ill
20,3 cm
1.56 ~ crowned at center-line
0.25~ 153.3 m 3 , 7 m 1965
Crushed limestone. Illinois CA 8
10,2 cm 3.5 µm / s
A-6 I µm / s
Bituminous aggregate mixture , reconstructed 1976
1.2 m inside, 3. 1 m outside
20.3 cm
Concrete pipe, constructed 1976
15.2 cm l.D. Adjacent to pavement edge 55.9 cm Concrete sand
46 µm / s
560.8 m'
12
Illinois I-57N, Champaign County, 8 km south of Champaign
Reinforced jointed portland cement concrete with dowel bars
7.3 m 25.4 cm 30.5 m 1.56" crowned at centerline
0.25~ 151.8 m 3.7 Ill 1965
Crushed limestone, Illinois CA 8
15 .2 cm 3.5 µm/s
A-6 1 µnv s
Bituminous aggregate mixture, reconstructed 1976
1.2 m inside, 3.1 m outside
20.3 cm
Concrete pipe, constructed 1976
15.2 cm I.D. Adjacent to pavement edr;e 60 .9 cm Concrete sand
46 µm/s
555.2 m'
Note; 1 km = 0,62 mile; 1 m = 3 3 ft; 1 cm ""0 39 in; 1 µm/s = 0.284 ft/day; 1 m2 = 1.2 yd2,
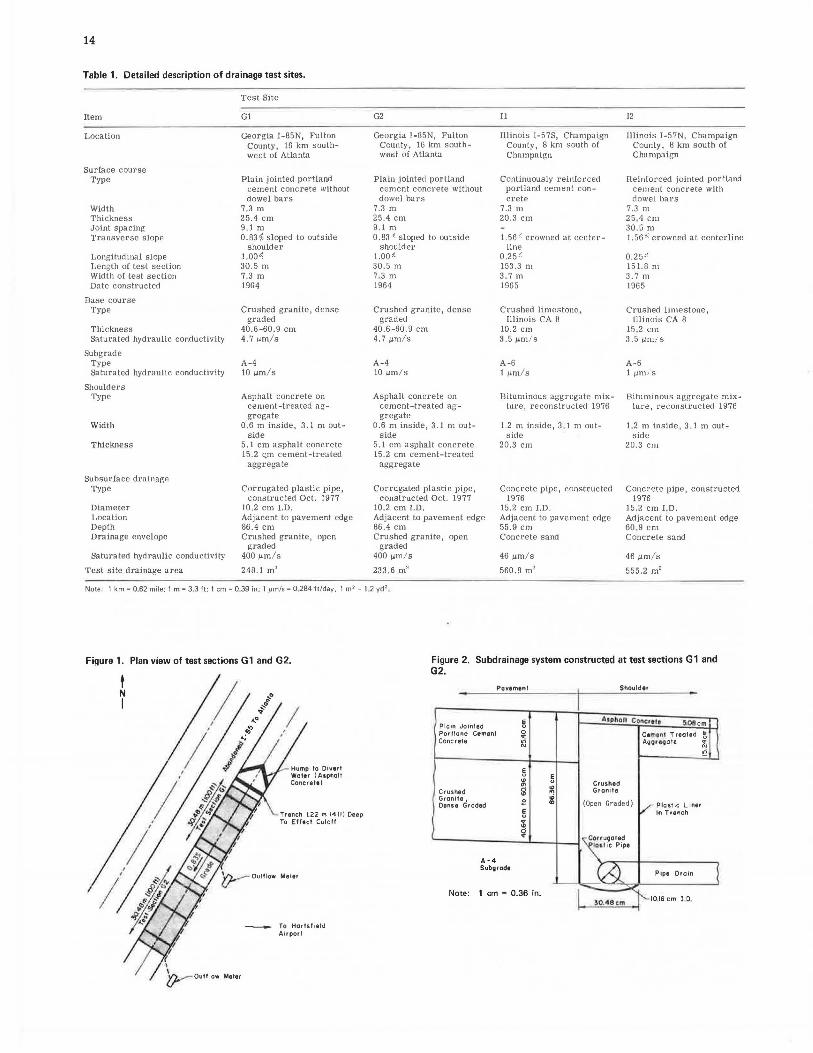
Figure 1. Plan view of test sections G 1 and G2.
t N I
Trench 1. 22 m (4fl) Deep To Effect Cutoff
Meler
To Hartsf ield Ai rport
Figure 2. Subdrainage system constructed at test sections G 1 and G2.
Pavement Shoulde,
Plain Jointed Ii 41phoU COf\C'ttti 5..08cm Potllond Cement ~ Cern1n1 T rear ed ~ Concrete Ag9uiq ote " N N
~
~ ~ :i: Crushed
Crushed iil ID Gran it e "' Granite 1 2 .,;
Dense Graded co (Open Graded) V Plast ic L iner
~ In Trench
$ ~ Couu9ated
101l ic P ipe
A-4 Subgrode w Pipe Dra in
Note: 1 cm = 0.36 in. I l'-1016 cm IO. 30.48<m
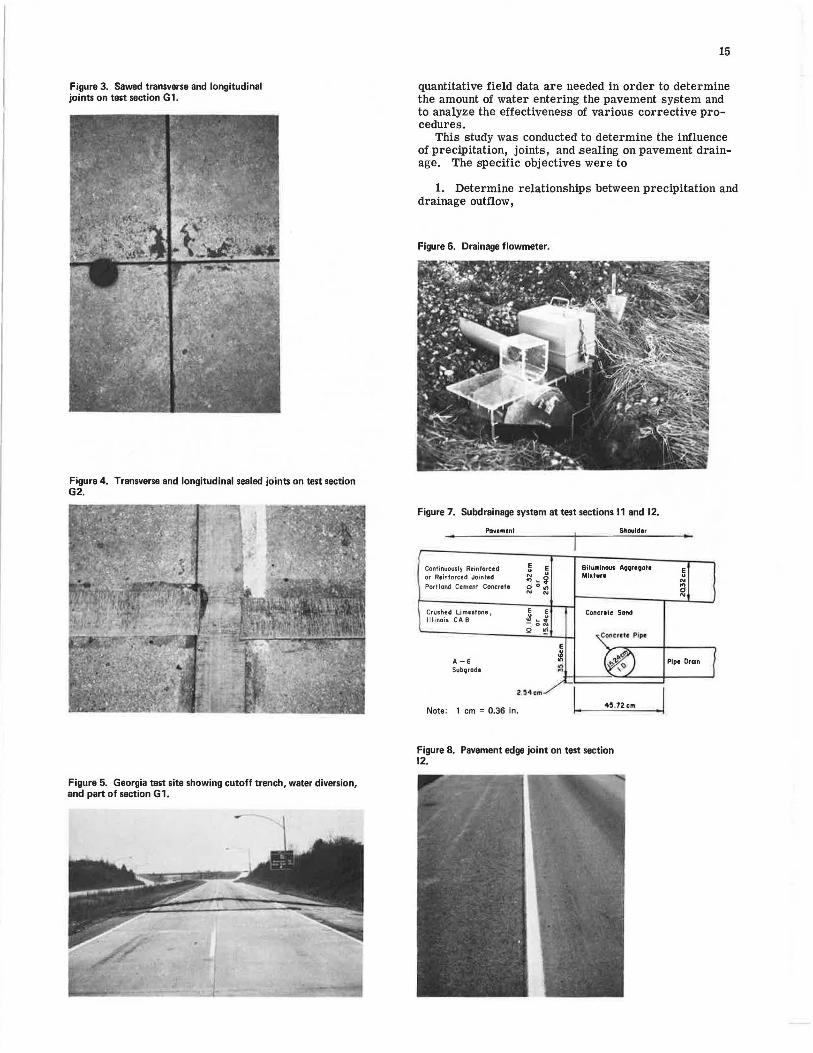
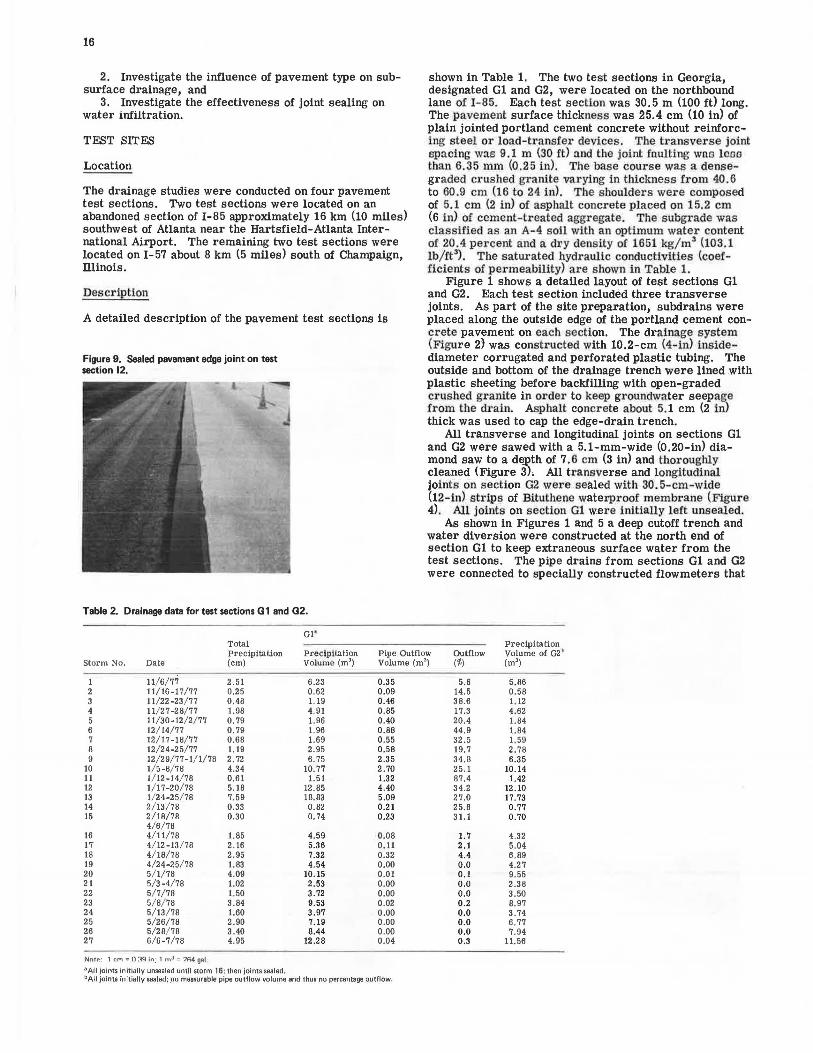
Figure 3. Sawed transverse and longitudinal joints on test section G 1.
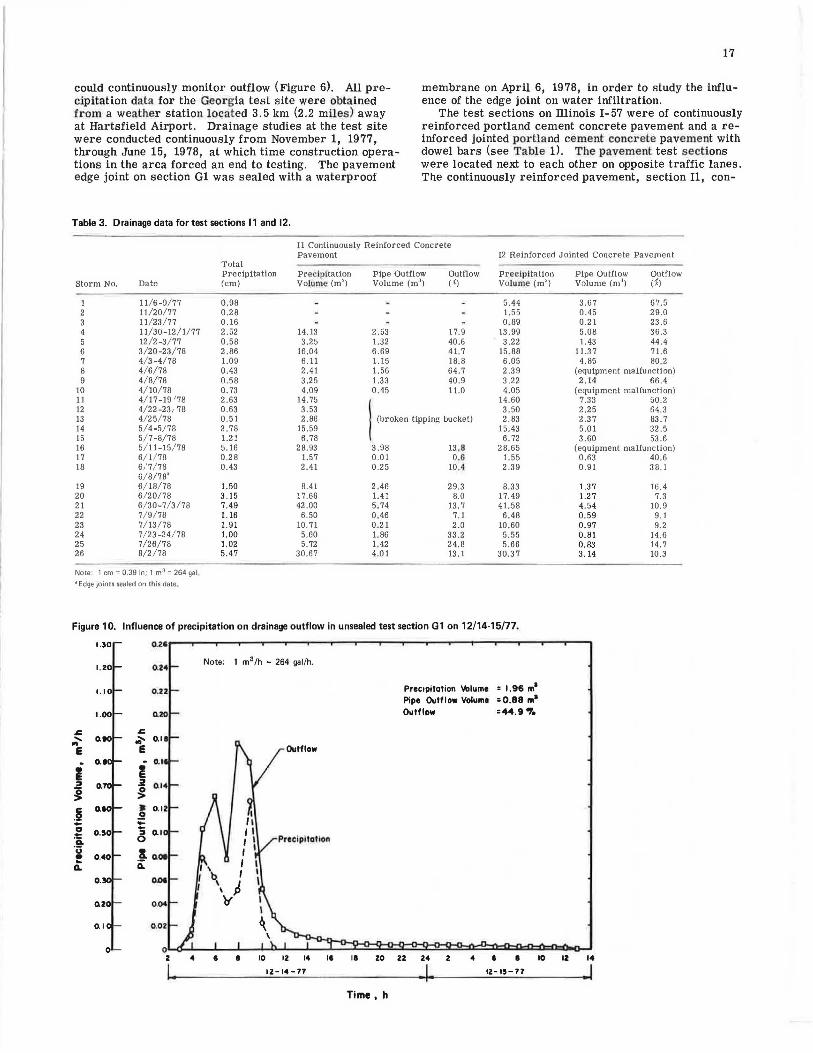
Figure 4. Transverse and longitudinal sealed joints on test section G2.
Figure 5. Georgia test site showing cutoff trench, water diversion, and part of section G 1.
15
quantitative field data are needed in order to determine the amount of water entering the pavement system and to analyze the effectiveness of various corrective procedures.
This study was conducted to determine the influence of precipitation, joints, and.sealing on pavement drainage. The specific objectives were to
1. Determine relationships between precipitation and drainage outflow,
Figure 6. Drainage flowmeter.
Figure 7. Subdrainage system at test sections 11 and 12.
f>ovement
Continuously Reinforced or Reinforced Jointed Porllond Cement Concret1
Crushed Limntone 1
Ill inois CA 8
A-6 Sub; rode
E E ~ ,_ ~ -oN d !!!
2~54cm
Note: 1 cm = 0.36 in.
Shouldu
Bituminous AQ'JrtQate Mlatur1
Concrete Sand
CCK\Crttc Pipt
45.72cm
Figure 8. Pavement edge joint on test section 12.
Pip• Drain {
16
2. Investigate the influence of pavement type on subsurface drainage, and
3. Investigate the effectiveness of joint sealing on water infiltration.
TEST SITES
Location
The drainage studies were conducted on four pavement test sections. Two test sections were located on an abandoned section of I-85 approximately 16 km (10 miles) southwest of Atlanta near the Hartsfield-Atlanta International Airport. The remaining two test sections were located on I-57 about 8 km (5 miles) south of Champaign, Illinois.
Description
A detailed description of the pavement test sections is
Figure 9. Sealed pavement edge joint on test section 12.
Table 2. Drainage data for test sections G1 and G2.
Gl' Total
shown in Table 1. The two test sections in Georgia, designated Gl and G2, were located on the northbound lane of I- 85. Each test section was 30.5 m (100 ft) long. The pavement surface thickness was 25.4 cm (10 in) of plain jointed portland cement concrete without reinforcing steel or load-transfer devices. The transverse joint spacini; was 9 .1 m (30 ft ) and the joint fault ing wns less than 6.35 mm (0 .25 in) . The base course was a de nsegraded crus hed gr anite va r ying in thickness from 40.6 to 60.9 cm (16 to 24 in). The s houlder s were composed of 5.1 cm (2 in) of asphalt concrete placed on 15.2 cm (6 in) of cement-treated aggr egate. The s ubgrade was classified as an A- 4 s oil wi th an optimum water content of 20 .4 percent and a dry density of 1651 kg/ m3 (103. 1 lb/ft3). The saturated hydraulic conductivities (coefficients of permeability) a re s hown in Table 1.
Figure 1 shows a detailed layout of test sections G1 and G2. Each test section included three transverse joints. As part of the site preparation, subdrains were placed along the outside edge of the portland cement concrete pavement on each section. The drainage s ys tem (Figure 2) was cons tructed with 10.2-cm (4-in) insidediameter corrugated and perforated plastic tubing. The outside and bottom of the drainage trench were lined with plastic sheeting before backfilling with open-graded crushed gr anite in order to keep groundwater seepage from the drain. Asphalt concrete about 5. 1 cm (2 in) thick was used to cap the edge-drain trench.
All transverse and longitudinal joints on sections G1 and G2 were sawed with a 5.1-mm-wide (0.20-in) diamond saw to a d~th of 7. 6 cm (3 in) and thoroughly cleaned (Figure 3), All transverse and longitudinal joints on s ection G2 wer e s ealed with 30. 5- cm-wide (12-in) strips of Bituthene waterproof membrane (Figure 4). All joints on section Gl were initially left unsealed.
As shown in Figures 1 and 5 a deep cutoff trench and water diversion were constructed at the north end of section Gl to keep extraneous surface water from the test sections. The pipe drains from sections Gl and G2 were connected to specially constructed flowmeters that
Precipitation Precipitation Precipitation Pipe Outflow Outflow Volume of G2 '
('.t) Storm No, Date (cm) Volume (m3) Volume (m') (m')
1 11/6/77 2 .51 6.23 0.35 5.6 5.86 2 11/16-17/77 0.25 0.62 0.09 14.5 0.58 3 11/22 -23/77 0.48 1.19 0.46 38.6 1.12 4 11/ 2 7 -2 8/ 77 1.98 4.91 0.85 17.3 4.62 5 11/ 30-12/ 2/ 77 0 .79 1.96 0.40 20.4 1.84 6 12/ 14/ 77 0 .79 1.96 0.86 44.9 1.84 7 12/ 17-18/ 77 0.68 1.69 0 .55 32.5 1.59 8 12/ 24-25/ 77 1.19 2.95 0.56 19.7 2. 78 9 12/29/77-1/1/78 2. 72 6. 75 2.35 34.B 6.35
10 1/ 5-B/ 78 4.34 10. 77 2 .70 25.1 10.14 11 1/12-14/ 76 0.61 1.51 1.32 87.4 1.42 12 1/17-20/78 5.18 12.85 4.40 34.2 12.10 13 1/24-25/78 7.59 18.83 5.09 27.0 17.73 14 2/13/78 0.33 0.82 0.21 25.6 0.77 15 2/18/78 0.30 0.74 0.23 31. l 0.70
4/6/78 16 4/11/78 1.85 4.59 O.OB 1. 7 4.32 17 4/12-13/78 2. 16 5.36 0.11 2.1 5.04 IS 4/18/78 2.95 7.32 0.32 4.4 6.89 19 4/24-25/ 78 1.83 4.54 0.00 0.0 4.27 20 5/ 1/ 78 4.09 10. 15 0.01 0 . 1 9.55 21 5/ 3-4/ 78 1.02 2.53 0.00 o.o 2.38 22 5/ 7/ 78 1.50 3.72 0.00 0.0 3.50 23 5/ 8/78 3.64 9.53 0.02 0.2 B.97 24 5/ 13 / 78 1.60 3.97 0.00 o.o 3.74 25 5/ 26/ 78 2.90 7.19 0.00 0.0 6. 77 26 5/28/ 78 3.40 6.44 0.00 0.0 7.94 27 6/6-7/ 78 4.95 12.28 0.04 0.3 11.56
Nntf~: 1 r.m "'n :;)Qin: 1 1113 = 264 gal
a All joints initially unsealed until storm 16; then joints sealed. bAll joints initially sealed; .no measurable pipe outflow volume and thus no percentage outflow.
could continuously monitor outflow (Figure 6). All precipitation data for the Georgia test site were obtained from a weather station loca ted 3.5 km (2.2 miles) away at Hartsfield Airport. Drainage studies at the test site were conducted continuously from November 1, 1977, through June 15, 1978, at which time construction operations in the area forced an end to testing. The pavement edge joint on section Gl was sealed with a waterproof
Table 3. Drainage data for test sections 11 and 12.
17
membrane on April 6, 1978, in order to study the influence of the edge joint on water infiltration.
The test sections on Illinois 1-57 were of continuously reinforced portland cement concrete pavement and a reinforced jointed portland cement concrete pavement with dowel bars (see Table 1) . The pavement test sections were located next to each other on opposite traffic lanes. The continuously reinforced pavement, section 11, con-
II Continuously Reinforced Concrete Pavement !2 Reinforced Jointed Concrete Pavement
Total Precipitation Precipitation Pipe Outflow Outflow Precipitation
Storm No. Date (cm) Volume (m") Volume (m3) (~) Volume (m")
1 11/ 6-9/ 77 0.98 5.44 2 11/20/77 0.28 1.55 3 11/23/77 0.16 0 .89 4 11/30-12/1/77 2.52 14.13 2.53 17. 9 13.99 5 12 / 2-3/ 77 0.58 3.25 1.32 40.6 3.22 6 3/20-23/78 2.86 16.04 6.69 41. 7 15.88 7 4/ 3-4/ 78 1.09 6.11 l.15 18.8 6.05 8 4/6/78 0.43 2.41 1.56 64. 7 2.39 9 4/8/78 0.58 3 .25 1.33 40.9 3.22
10 4/10/78 0. 73 4.09 0.45 11.0 4 .05 11 4/ 17-19 '78 2.63 14. 75 14.60 12 4/22-23 1 78 0.63 3.53 3.50 13 4/25 / 78 0.51 2.86 (broken tipping bucket) 2.83 14 5/4-5/78 2. 78 15.59 15.43 15 5/7-8/78 l.21 6. 78 6. 72 16 5/11-15/78 5.16 28.93 3.98 13.8 28.65 17 6/ 1/ 78 0.28 1.57 0.01 0.6 l.55 18 6/ 7/ 78 0.43 2.41 0.25 10.4 2.39
6/8/78' 19 6/18/78 l.50 8.41 2.46 29.3 8.33 20 6/20/78 3 .1 5 17.66 l.41 8.0 17.49 21 6/ 30-7/ 3/ 78 7.49 42.00 5. 74 13 . 7 41.58 22 7/ 9/ 78 l.16 6.50 0 ,46 7.1 6.48 23 7/ 13 / 78 1. 91 10. 71 0.21 2.0 10.60 24 7/23-24/78 l.00 5.60 1.86 33 .2 5.55 25 7/26/78 1.02 5.72 l.42 24.8 5.66 26 8/2/78 5.47 30.67 4.01 13. I 30.37
Note : 1 cm= 0.39 in; 1 m3 = 264 gaL
d Edge joints sealed on this date .
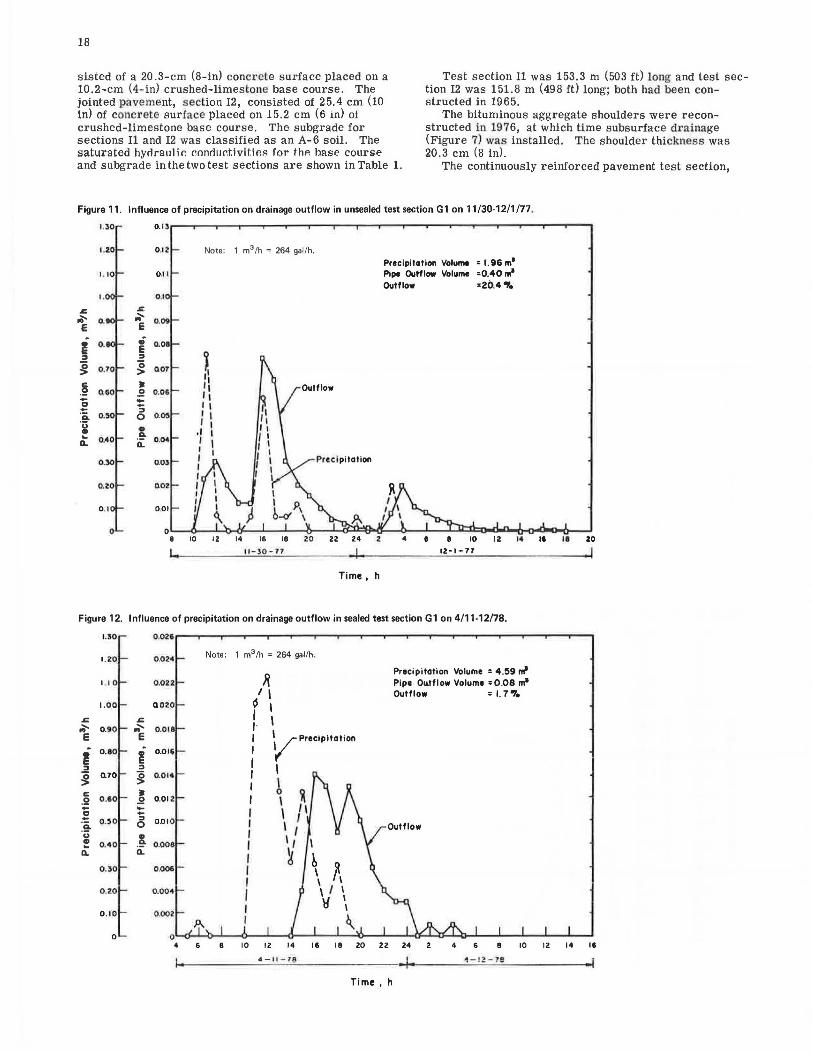
Figure 10. Influence of precipitation on drainage outflow in unsealed test section G1on12/14-15n7.
1.30 0 .2'
1.ZO 0.24
0 .22
0.20
0.1
I 2 0.14
~ • O.IZ 0 ; .. :::t 0
0.1
.Io. Ii.
OOI
0.20 0.0'
0.1 0 .02
0 0 z 4
I.
Note; I m3 /h = 264 gal/h.
I ' I
6 8 10 12 14 16 18 20
12-14-77
Time, h
Precipitation Volume = I. 96 m1
Pipe Outflow Volume =0.88 m1
Outflow •44,9 "•
22 24
u 1. 2 4 6 •
IZ-15-77
10
Pipe Outflow Outflow Volume (m') (~)
3.67 67.5 0.45 29.0 0.21 23 .6 5.08 36.3 1.43 44.4
11.37 71.6 4.85 80 ,2
(equipment malfunction) 2.14 66.4
(equipment malfunction) 7.33 50.2 2.25 64.3 2.37 83. 7 5.01 32 .5 3.60 53.6
(equipment malfunction) 0.63 40.6 0.91 38.1
1.37 16.4 1.27 7.3 4. 54 10.9 0. 59 9.1 0.97 9.2 0.81 14.6 0.83 14. 7 3 .14 10.3
12 14
.I
18
sisted of a 20 .3-cm (8-in) concrete surface placed on a 10.2-cm (4-in) crushed-limestone base course . The jointed pavement, section 12, consisted of 2 5.4 cm (10 in) of co11crete surface placed on 15.2 cm (6 in) of crushed-limestone base course. The subgrade for sections 11 and 12 was classified as an A-6 soil. The saturated hynraulir. r.onnnr.tivit.iP.s for thP. base course and subgrade in the two test sections are shown in Table 1.
Test section 11 was 153.3 m (503 ft) long and test section 12 was 151.8 m (498 ft) long; both had been constructed in 1965.
Figure 11.
1.30
1.ZO
1. 10
t.
I::. ,;;-e
~ :JI
~ 0.10
. § 0.50 g ::
0.5 A. ' j; • ... OAO a..
0.10
0 .20
0 . 1
The bituminous aggregate shoulders were reconstructed in 1976, at which time subsurface drainage (Figure 7) was installed. The shoulder thickness was 20.3 cm (8 in).
The continuously reinforced pavement test section,
Influence of precipitation on drainage outflow in unsealed test section G1on11/30-12/1/77.
0. 13
O.ll Note: 1 m3 /h = 264 gal /h.
Precipitation Volume • I. 96 m' 0.1 1 Pipe Outflow Volume •0.40 m1
Outflow •20.4 'I'. 0.1
I::. ,;;-e o.09
• e o.oa :JI
~ Q07
• .2 0.06
~ :JI 0 0.05
• .!:!-Q. 0.04
0.03
Q02
0.01
oL-~~-'--b-..tf..~..L.~L---l'.,__--1_.(j:::D::lfJo.fl..~~~L-.....Jl...ll::sl:::{lo.i..o..""-00or.~'i-__J 8 10 12 14 1& 19 20 22 24 2 4 6 8 10 12 14 I& la 20
I. 12-1-11
Time, h
Figure 12. Influence of precipitation on drainage outflow in sealed test section G1 on 4/11-12/78.
1.30 0.026
1.20
I.I 0
1.00
I::. ,;;- 0.90 e I o.ao :JI
~ Q.70
c: .2 0 .80
~ 'ii. 0 .)0 'j; • ... Q.
0 .40
0 .30
0 .20
0.10
0.024
0.022
0.020
I::. ,;;-. 0.018 e I o.o1~
::I
~ 0.014
~ 0.012 ..... +-6 0.010
-~ 0.008 Q.
0 .006
Q.004
0 .002
A
Note: 1 m3 /h = 264 gal/h .
~ I I r I I· I : v Precipitation
I I I I I o o I \ /'1 I \ I : \ I I I I
I ~ I I I I I
\
b \ ,~ \ I \ I \l
Precipitation Volume • 4.!19 rrl Pipe Olltflow Volume •0.08 rrl Outflow • I. 7 "1e
0 ol....cf-.l-b....L.~..0-~..1.--.j~--''----'-~~~...1-~~~i..:c~--0--1...~...1-~.1---'1....-...1~-1
4 6 8 10 12 14 1& 19 20 22 24 2 4 6 8 10 12 14 11
4-11 - 78 ·I- ~ - l? - 79
Time , h
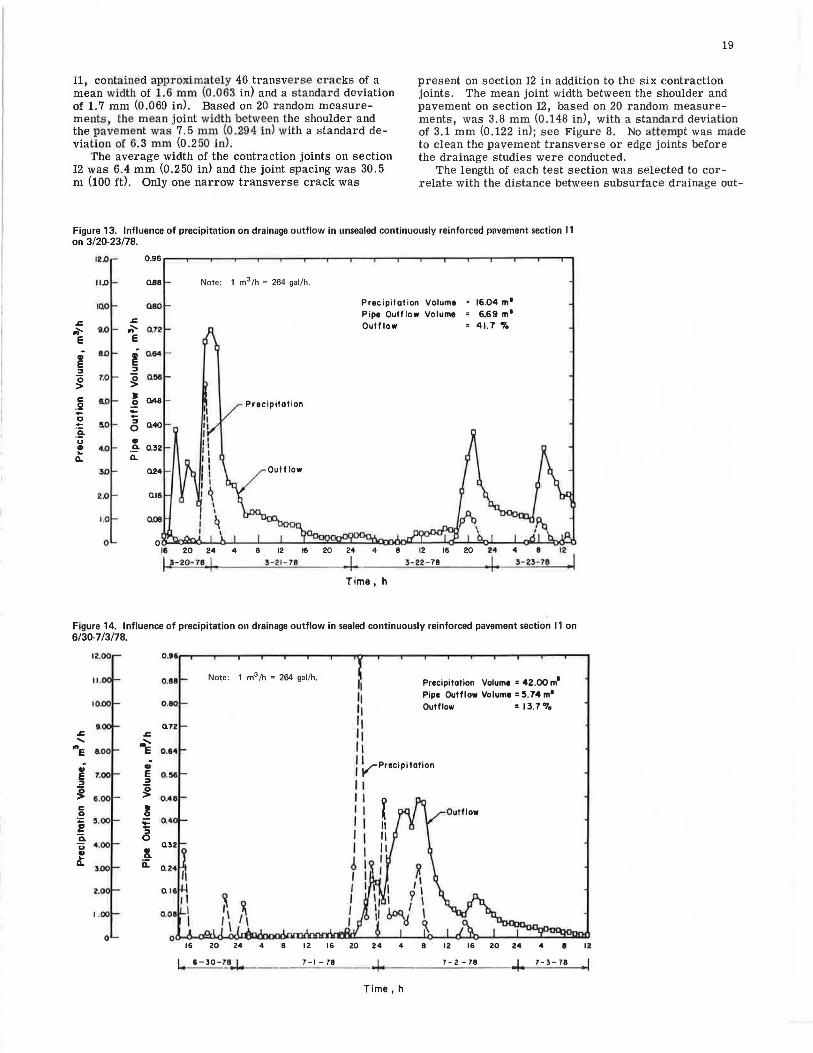
11, contained approximately 46 transverse cracks of a mean width of 1.6 mm (0.063 in) and a standard deviation of 1.7 mm (0.069 in). Based on 20 random measurements, the mean joint width between the shoulder and the pavement was 7. 5 mm (0 .29 4 in) with a standard deviation of 6.3 mm (0.250 in) .
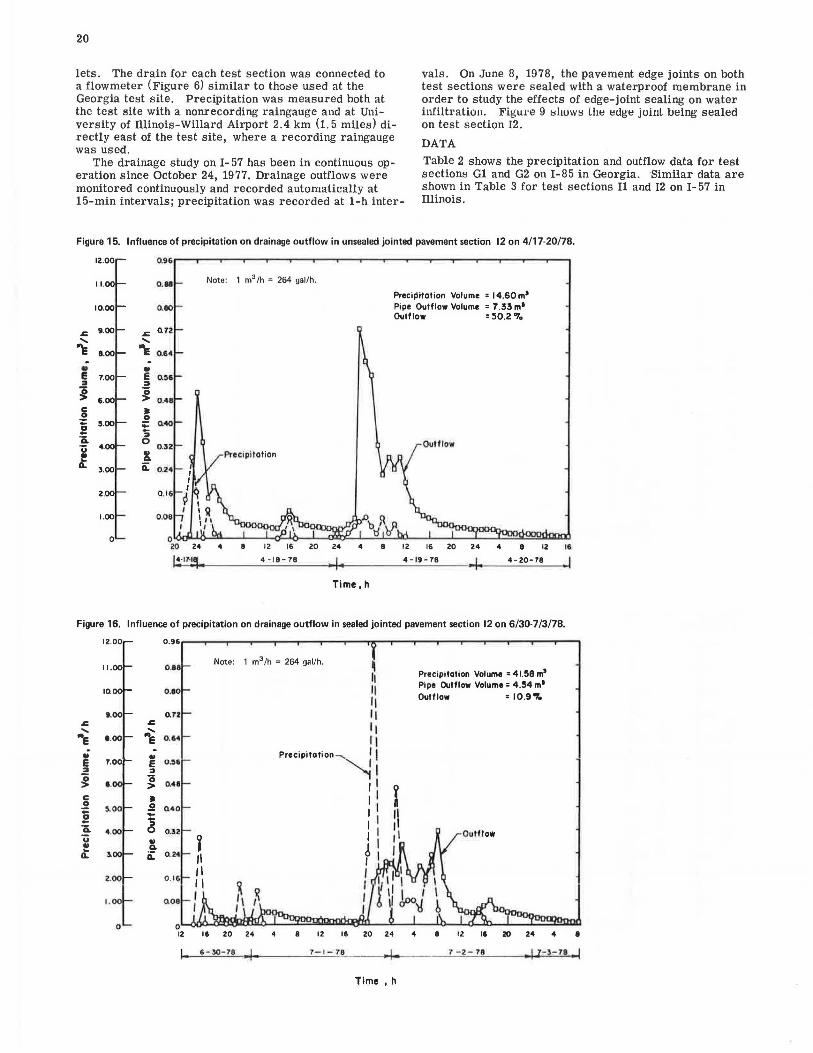
The average width of the contraction joints on section 12 was 6.4 mm (0.250 in) and the joint spacing was 30.5 m (100 ft). Only one narrow transverse crack was
19
present on section 12 in addition to the six contraction joints. The mean joint width between the shoulder and pavement on section 12, based on 20 random measurements, was 3.8 mm (0.148 in), with a standard deviation of 3.1 mm (0.122 in); see Figure 8. No attempt was made to clean the pavement transverse or edge joints before the drainage studies were conducted.
The length of each test section was selected to correlate with the distance between subsurface drainage out-
Figure 13. Influence of precipitation on drainage outflow in unsealed continuously reinforced pavement section 11 on 3/20-23/78.
12.0 0.96
11.0 Q.88 Note: 1 m3 /h = 264 gal/h.
IQO 080
s= ~ ao e
s= ;;-. 0.72 e
• 8.0
e :I 0 7.0 >
I 0.&4
:I
~ M6
c 8.0 .2 -~ 5.0 :e.
• 0.48 fl :: :I
0.40 0
Precipitation
u • • 4.0 .. Q.
-~ 0.32 Q.
3.0 Cl24
2.0 0.16
1
1.0 o.oe q 1
0 0 16 20 24 4 8 12 16
I 3-20-18 I l-21 - 78
20 24
I
Precipitation Volume Pipe Outflow Volume Outflow
4 12 16
3-22-78
Time, h
16.04 m1
6.69 m1
' 41.7 "'·
20 24
I 8 12
3-23-78 .1
Figure 14. Influence of precipitation on drainage outflow in sealed continuously reinforced pavement section 11 on 6/30-7/3/78.
s= .....
12.00
"'e IL .. e 7. ':I
j 6.
c ~ 5.00 2 Q. u 4.00 .. .. a.
3.00
2.
1.00
0
s=
""E .; E :I
~ ~ 2: :I 0
l a:
0.96
0.88
0 .90
0.72
0 .64
0. '6
0 .48
0.4
Note: 1 m3 /h = 264 gal /h. Precipitation Volume = 42.00 m1
Pipe Outflow Volume = 5. 74 m1
Outflow = 13. 7 "lo
16 20 24 4 8 I 2 16 20 24 4 8 12 16 20 24 4 • 12
I. 11-30-19 7-1 - 78 7- 2 - 78 ..j .. 7-3-78
Time, h
20
lets. The drain for each test section was connected to a flowmeter (Figure 6) similar to those used at the Georgia test site. Precipitation was measured both at the test site with a nonrecording raingauge and at University of Illinois-Willard Airport 2.4 km (1. 5 miles) directly east of the test site, where a recording raingauge was used.
The drainage study on 1-57 has been in continuous operation since October 24, 1977. Drainage outflows were monitored continuously and recorded automatically at 15-min intervals; precipitation was recorded at 1-h inter-
vals . On June 8, 1978, the pavement edge joints on both test sections were sealed with a waterproof membrane in order to study the effects of edge-joint sealing on water infiltration. Figure 9 !;hUW!; lhe edge juinl being sealed on test section 12.
DATA
Table 2 shows the precipitation and outflow data for test sections Gl and G2 on 1-85 in Georgia. Similar data are shown in Table 3 for test sections 11 and 12 on I- 57 in Illinois.
Figure 15. Influence of precipitation on drainage outflow in unsealed jointed pavement section 12 on 4/17-20/78.
~ .....
12.00
II.
"'e II. -• e :I
~ ..
2,
0,96
0. 81
O.IO
~ 0.72
..... -e 0.64
• e 0.~6 :I
~ 0 .4
• 0
~ 0.40 :I 0
0.32
& ir 0.24
1.00 0 .08
Note : 1 m3 /h = 264 gal/h.
Precipitation Volume = 14.60 m1
Pipe Outflow Volume = 7 .33 m1
Outflow = 50.2 %
0 oLLJ..d-h~L:'.~~~~~i/.l!l..bd-_L~~~~QQlkl~ 20 24 4 8 12 16 20 24 4 8 12 16 20 24 4 8 12 16
1!• 17·~ .. 4 -1 8-78 ·I· 4 -19 - 78 ..j. 4-20-78 .1 Time, h
Figure 16. Influence of precipitation on drainage outflow in sealed jointed pavement section 12 on 6/30-7/3/78.
12.00
11.00
IQ
1.00 ~ ......
"'e .. e :I 0 > • ,S! ... ~ .. Q,
A:
2.00
1. 00
0
0.96
O.H Note:
o.a
0 .72
0 ,,4
o.'6
0.<18
0.<10
0.32
0.24
0. 16
0.08
1 m3 /h • 264 aal/h, ~ h II 11 I I I
8 12 16 20 24 4
Precipitation Volume = 41.58 m1
Pipe Outflow Volume= 4.54 m1
Outflow = 10.9.,.
8 12 16 20 24 4 8
j . 6 - 30 - 78 -i· 7 - 1 - 78 7 -2- 78 I I 7- 3- 71 • I
Time, h
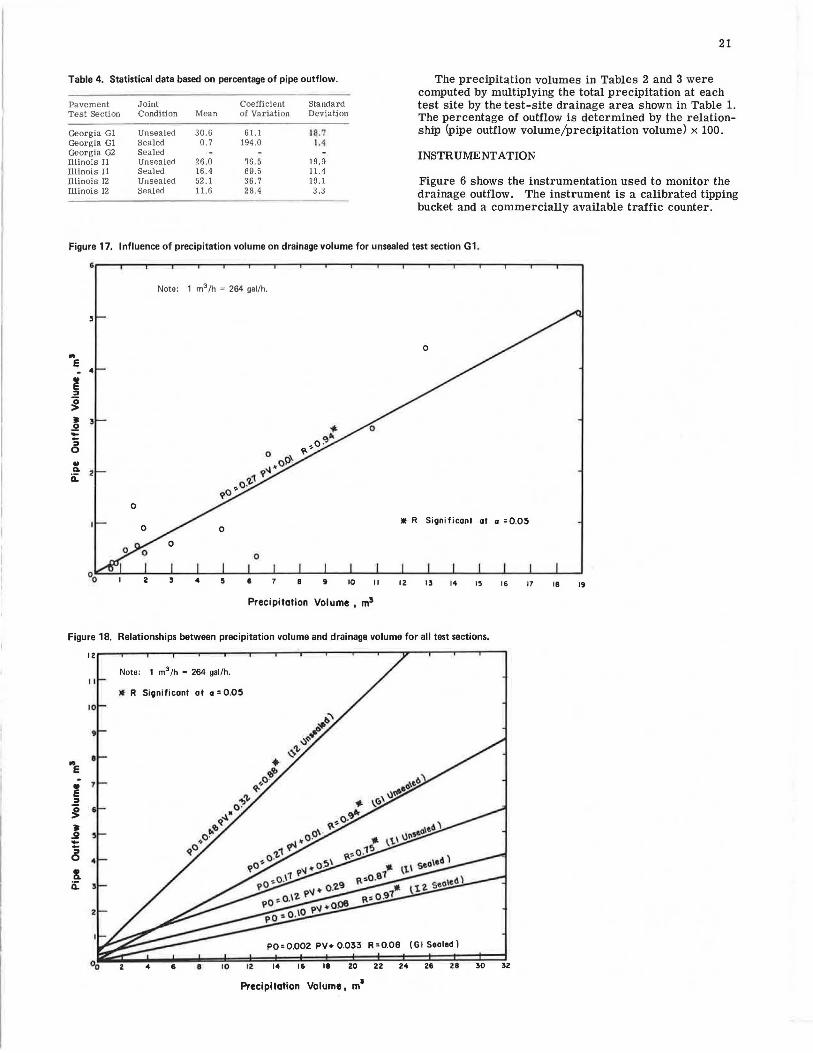
Table 4. Statistical data based on percentage of pipe outflow.
Pavement Joint Coefficient Standard Test Section Condition Mean of Variation Deviation
Georgia Gl Unsealed 30.6 61.1 18.7 Georgia Gl Sealed 0. 7 194.0 1.4 Georgia G2 Sealed Illinois I! Unsealed 26.0 76.5 19.9 Illinois I! Sealed 16.4 69.5 11.4 Illinois I2 Unsealed 52.1 36. 7 19.1 Illinois 12 Sealed 11.6 28.4 3 .3
21
The precipitation volumes in Tables 2 and 3 were computed by multiplying the total precipitation at each test site by the test-site drainage area shown in Table 1. The percentage of outflow is determined by the relationship (pipe outflow volume/precipitation volume) x 100.
INSTRUMENTATION
Figure 6 shows the instrumentation used to monitor the drainage outflow. The instrument is a calibrated tipping bucket and a commercially available traffic counter.
Figure 17. Influence of precipitation volume on drainage volume for unsealed test section G1.
&..-~..-~..-~...-~-.-~ ...... ~~~---.~----,,..-~.--~..-~-.-~-..-~-,...~....,.~~~---.~--,.--~..----.
Note: 1 m3 /h = 264 gal/h.
0 .. e • 4
0
• R Sic;ini ficonl al a = 0.05 0
0
2 4 • 9 10 II 12 13 14 15 16 17
Precipitation Volume , m3
Figure 18. Relationships between precipitation volume and drainage volume for all test sections.
II
10
9
• "'e . ' e ::s j • J2 .... ~ 4
!. ~
2
Note: 1 m3 /h = 264 gal/h.
lt R Sic;inificonl al a= 0 .0!5
P0=0.002 PV+ 0.033 R=0.08 (GI Sealed)
6 8 10 12 14 16 18 20 22 24 26 28 30 32
Precipitation Volume, m•
18 19
22
Each bucket tip activates a microswitch that sends a count to the traffic counter, which is battery powered and records the number of bucket tips and time at 15-min intervals on a paper strip chart. The equipment can operate continuously and unattended in the field for about 30 days.
ANALYSIS AND DISCUSSION OF DRAINAGE DATA
A study of the data in Tables 2 and 3 and the statistical data in Table 4 indicates the substantial variability in drainage outflow as influenced by rainfall intensity, pavement type, and joint sealing.
Precipitation-Outflow Volume
Figures 10, 11, and 12 show the precipitation and pipe outflow rates for test section Gl. Note in Figures 10 and 11 that the pipe outflow responds almost simultaneously with precipitation and varies with the intensity of precipitation for the unsealed edge-joint condition. For the sealed edge-joint condition, Figure 12 shows that the pipe outflow on section Gl lags behind the start of precipitation by several hours. Figures 10 and 11 also show that pipe outflow continues to diminish over a 16- to 24-h period after rainfall has ceased. Figure 12 shows that the outflow diminished more quickly after rainfall ceased when the pavement edge joint was sealed.
Figures 13 and 14 show precipitation and outflow as a function of time for the continuously reinforced pavement section (11) with and without edge sealing respectively. Figures 15 and 16 show similar results for the jointed pavement section (I2). Again it is noted that, for pavement sections 11 and I2, the measured outflow responds almost instantaneously to precipitation when the edge joint is unsealed. However, there is some perceived lag in outflow response to precipitation for the sealed edge-joint condition. For the unsealed conditions in both sections 11 and I2 it would appear that more than 24 h are required before outflow essentially ceases after precipitation has stopped. In Figures 14 and 16 it would appear that less time is needed (approximately 16 h) for outflow to diminish when the pavement edge joint is sealed.
In analyzing the data for the test sites it is apparent that the quantity of measured outflow and therefore infiltration was substantially reduced by sealing the edge joint. For the condition of complete sealing of both the edge joint and transverse joints on section G2, there was no measurable drainage outflow. In this case it would have to be assumed that any water that did infiltrate the pavement surface passed through the subgrade to the water table.
Based on the way drainage outflow responds to precipitation, as shown in Figures 10-16, it would appear that rainfall intensity and edge-joint conditions have considerable influence on the amount of water that infiltrates into a pavement.
Pavement Factors Influencing Outflow
It is evident that the size and number of joints and cracks in the pavement will contribute to water infiltration. It is also suggested that the time of year will influence water infiltration because cracks open in concrete in response to temperature and evaporation rates, which vary with temperature. These factors along with the rainfall intensity may be responsible for the outflow differences noted in Figures 10 and 11 (44.9 percent as compued to 20A percent) even though the total precipitation volumes are the same [1.96 m 3 (523 gal)]. Analysis of all outflow
data for the unsealed pavement sections indicated that the infiltration rates were considerably less than those predicted by the design criteria proposed by Ridgeway (3).
Figures 14 and 16 indicate that both the continuously reinforced pavement, 11, and the jointed pavement, I2, displayed similar outflows for the same storms when the pavement edge joints were sealed. However, a paired t-lest shows that the outflow percentages from section 11 are significantly different (p = 0.05) from those of section I2 for the unsealed and sealed edge-joint conditions.
Table 4 shows that the average pipe outflow percentage (outflow volume /precipitation volume) in the continuously reinforced pavement was 26.0 percent as compared to 52.1 percent for the jointed pavement for unsealed conditions. By sealing the edge joints the outflow in the continuously reinforced pavement decreased to 16.4 percent and that for the jointed pavement decreased to 11. 6 percent.
In order to further study the influence of rainfall and pavement conditions on pipe outflow a linear regression analysis was conducted. Figure 17 shows a significant relationship (p = 0.05) between precipitation volume and pipe outflow for section Gl in Georgia. Figure 18 shows that, except for section Gl with the edge joint sealed, there was a significant relationship (p = 0.05) between precipitation volume and measured drainage outflow volume for the test sections. In all cases outflow increased with precipitation volume.
In order to determine whether edge-joint sealing significantly influenced drainage outflow, a statistical t-test was conducted to compare the slopes of the regression relationships between pipe outflow and precipitation shown in Figure 18. For the jointed pavement test sections in both Illinois and Georgia (sections Gl and I2) the slopes of the regression relationships for the sealed edge-joint condition were found to be significantly different (p = 0.05) from those for the unsealed edge-joint condition. For the continuously reinforced test section (section 11) there was no s ignificant difference (p = 0 .05) between the slopes of the regression relationships for the sealed and unsealed edge-joint condition. Based on an analysis of the relationships between pipe outflow and precipitation, we might conclude that edge-joint sealing will significantly decrease (p = 0.05) the infiltration of water into jointed pavement systems. However, sealing may not have a significant effect on continuously reinforced pavement systems.
In Figure 18 it is noted that, for unsealed edge-joint conditions, the continuously reinforced pavement (section 11) e:iq:ierienced less outflow tban the jointed pavement sections in sections Gl and 12, respectively, for similar precipitation volumes. As noted earlier, the outflow for the continuously reinforced pavement is significantly less (p = 0.05) than that for the jointed pavements for the same storm event. In the continuously reinforced pavement it is evident that there is a need to further investigate the amount of infiltration caused collectively and individually by the edge joint and transverse cracks. It would seem in this study that the edge joint along the continuously reinforced pavement did not contribute as much to infiltration as the edge joints along the jointed pavement test sections. However, as indicated in Figure 18, the transverse cracks in continuously reinforced pavement systems may contribute more to infiltration than the transverse joints in jointed pavement systems. This is obvious when we compare the continuously reinforced pavement section 11 with the jointed pavement section G2 where both transverse and edge joints were sealed. Further analysis of the completely sealed pavement section G2 indicates that joint sealing can help prevent water accumulation in the struc-
tural pavement section, especially if the subgrade is moderately permeable and the water table deep.
CONCLUSIONS
The conclusions of this study are as follows.
1. Significant relationships (p = 0.05) were found between precipitation and drainage outflow.
2. Drainage outflow was influenced by pavement type. The outflow for the continuously reinforced pavement was significantly different (p = 0.0 5) from the outflow of the jointed concrete pavement for both the unsealed and sealed edge-joint conditions in Illinois.
3. Edge-joint sealing significantly reduced (p = 0.05) drainage outflow in the jointed pavement test sections in Georgia and Illinois. Although edge sealing reduced outflow on the continuously reinforced pavement section in Illinois, there was not a significant improvement (p = 0.05).
4. No measurable drainage outflow occurred on the Georgia test section in which all longitudinal and transverse pavement joints and the pavement edge joints had been sealed.
5. Based on relationships between precipitation volume and pipe outflow volume, as well as on the response of pipe outflow to rainfall, the edge joint may be a major factor contributing to water infiltration in jointed pavement systems.
6. In this study the contribution of the transverse cracks in the continuously reinforced pavement section to infiltration was greater than the contribution of the edge joint. Further drainage studies need to be conducted on continuously reinforced pavement systems.
ACKNOWLEDGMENT
This report was prepared as part of a research study on improving subdrainage and shoulders of existing pavements being conducted at the Department of Civil Engineering of the University of Illinois at Urbana under the sponsorship of the Federal Highway Administration. George Ring III of the Federal Highway Administration is the project monitor.
Thanks are due to the Georgia Department of Trans-
23
portation for its help in preparing the test site on I-85 and to David Morrill, a research assistant, for collecting and processing the data from the Illinois test site.
The contents of this paper reflect our views and we alone are responsible for the facts and the accuracy of the data presented. The contents do not necessarily reflect the official views or policies of the Federal Highway Administration. This paper does not constitute a standard, specification, or regulation.
REFERENCES
1. H. R. Cedergren and K. O'Brien. Development of Guidelines for the Design of Pavement Subdrainage Systems. Literature Review Abstracts, Federal Highway Administration, 1971.
2. B. J. Dempsey, M. I. Darter, and S. H. Carpenter. Improving Subdrainage and Shoulders of Existing Pavements-State-of-the-Art. Univ. of Illinois, Urbana, Interim Rept., 1977.
3. H. H. Ridgeway. Infiltration of Water Through the Pavement Surface. TRB, Transportation Research Record 616, 1976, pp. 98-100.
4. G. W. Ring. Drainage of Concrete Pavement Structures. Proc., International Conference on Concrete Pavement Design, Purdue Univ., West Lafayette, IN, 1977.
5. J. H. Woodstrom. Improved Base Design for Portland Cement Concrete Pavements. Proc., International Conference on Concrete Pavement Design, Purdue Univ., West Lafayette, IN, 1977.
6. R. D. Barksdale and R. G. Hicks. Drainage Considerations to Minimize Distress at the PavementShoulder Joint. Proc., International Conference on Concrete Pavement Design, Purdue Univ., West Lafayette, IN, 1977.
7. M. I. Darter and E. J . . Barenberg. ZeroMaintenance Pavements: Results of Field Studies on Performance Requirements and Capabilities of Conventional Pavement Systems. Federal Highway Administration, Rept. FHWA-RD-76-105, 1976.
Publication of this paper sponsored by Committee on Subsurface Drainage and Committee on Environmental Factors Except Frost.
Installation of Straw and Fabric Filter Barriers for Sediment Control W. Cullen Sherwood, Virginia Highway and Transportation
Research Council and James Madison University, Charlottesville David C. Wyant, Virginia Highway and Transportation Research Council,
Charlottesville
Effective temporary erosion and sedimentation controls are critical during construction in the period between onset of earth-disturbing and final stabilizing by vegetation. Among the most common temporary controls used in Virginia and many other states are straw barriers, burlap filter barriers, and silt fences. Despite the large sums of money spent annually on these controls, high failure rates and low trapping efficiencies, particularly for straw barriers, have been reported. In an effort to improve field performance, experiments conducted in Virginia have led to
the installation procedures reported in this paper. Procedures for inspection and maintenance of these controls are also described. Finally, it is concluded that the cost effectiveness of straw barriers has proved questionable in many cases; burlap filter barriers may well be an effective and inexpensive substitute for straw.


![INDEX [onlinepubs.trb.org]onlinepubs.trb.org/Onlinepubs/trr/1977/633/633-006.pdf · 36 Figure 1. Detailed data sheet. PAVCM[NT EVALUATION FOR STATE ROUTE 016 SECl JON fHOM WOUORUFF-liORTtl-L.lMl](https://img.pdfslide.us/doc/110x75/5fc5151f4dd8c11bc64347c3/index-36-figure-1-detailed-data-sheet-pavcmnt-evaluation-for-state-route.jpg)