Embed Size (px)
Citation preview

IN FL U E N C E O F PRE S C H O O L M A N A G E M E N T O N L E A R N IN G
A C H IE V E M E N T IN PR E S C H O O L S IN B A M BU RI Z O N E O F
M O M B A S A M U N ICIPA LITY , KENYA.
r ,
? KiJYv Lip0 .& o x
BY
M U R IIT H I W. Z E L IP H A
A RESEARCH PROJECT SUBMITTED TO THE DEPARTMENT OF
EDUCATIONAL COMMUNICATION AND TECHNOLOGY IN PARTIAL
FULFILLMENT OF THE REQUIREMENTS OF THE AWARD OF MASTER OF
EDUCATION DEGREE IN EARLY CHILDHOOD EDUCATION O F THE
UNIVERSITY OF NAIROBI
©2012
DECLARATION
This proposal is my original work and has not been presented for a degree in any other
university.
Signature ..............................................................................
Name : Zelipha W. Muriithi
This project has been sujftnitted with my approval as University supervisor.
Signature
Dr. John Mwangi Kamau
Lecturer, Department o f Educational Communication and Technology, University o f Nairobi
11

DEDICATION
This work is dedicated to my husband George Muriithi for making my dreams come true,
standing by my side and uplifting my spirits when I felt the journey was getting tough
throughout my post graduate studies, and my late parents Mr. Simon Kiretai Kimburi and
Mrs, Winfred Wanjuku Kiretai whose inspiration and desire for me to succeed has been the
single driving force that has enabled me to be where I am today. May God rest their souls in
eternal peace.
in

ACKNOWLEDGEMENT
I wish to acknowledge my sincere appreciation to the following people, without whom this
research work would have been successful. It may not be possible to mention all by name but
the following were singled out for their exceptional help. My profound gratitude goes to my
supervisor Dr. John Mwangi Kamau for his commitment and personal interest in the progress
o f my study. His wise counsel, encouragement, patience, constructive and innumerable
suggestions, made this wok come to completion.
I cannot forget to thank my family members for the support and encouragement they gave me
in pursuant o f my academic achievements.
Special thanks go to several people and institutions that provided encouragement, support,
facilities and recommendations: The program officer, Mr. Mwangi Gichuhi and entire
Mombasa DICECE fraternity and all the institutions I visited.
Finally I wish to post appreciation to Mr Stephen Karisa who helped in editing as well as
Agness ,Selina and Pamela who assisted in typing this research project.
IV

TABLE OF CONTENTDECLARATION............................................................................................................................. ii
DEDICATION............................................................................................................................... iii
ACKNOWLEDGEMENT.............................................................................................................iv
TABLE OF CONTENT.................................................................................................................. v
LIST OF FIGURES..................................................................................................................... viii
LIST OF TABLES..........................................................................................................................ix
LIST OF GRAPHS..........................................................................................................................x
LIST OF ABBREVIATIONS....................................................................................................... xi
ABSTRACT.................................................................................................................................. xii
CHAPTER ONE:INTRODUCTION
1.1 Background to the Study...................
1.2 Statement of the Problem..................
1.3 Purpose of the Study.........................
1.4 Research Objectives...........................
1.5 Research Questions............................
1.6 Significance of the Study..................
1.7 Limitations of the Study....................
1.8 Delimitation of the Study..................
1.9 Basic Assumption:.............................
1.10 Definition of Terms and Acronyms
1.11 Organization of the study................
JavtRsnj vl y l
M A «
fciA»KU!t>• i p S aRY • , < —•*' •
3 0 5 9 ^
1
1
2
2
2
2
3
3
3
3
3
4
CHAPTER TWO: LITERATURE REVIEW.......................................................................... 5
2.1 Introduction.............................................................................................................................. 5
2.2. Effective school management.................................................................................................. 5
2.2.1 Role of quality assurance and standards officers in school management.....................5
2.2.2 Roles of head teachers in management of school......................................................... 6
2.2.3 Management of finances in the school............................................................................. 7
2.2.3.1 Utilization o f funds in learning institutions.............................................................. 9
2.2.4: The roles of various stake holders in the Management of ECDE..............................10
2.2.4.1 The Role o f Parents and Community in management of preschools.................. 10
2.2.4.2 Roles of other agents ECDE.................................................................................... 11
v

2.2.5 Learning and children’s achievement............................................................................12
2.3 Theoretical Framework........................................................................................................ 14
CHAPTER THREE: RESEARCH METHODOLOGY.......................................................16
3.1 Introduction............................................................................................................................. 16
3.2 Research design.......................................................................................................................16
3.3 Study Population...................................................................................................................... 16
3.4 Sampling techniques and Sample Size...................................................................................17
3.5 Research instruments.............................................................................................................. 17
3.5.1 Questionnaire for preschool head teacher.......................................................................17
3.5.2 Questionnaire for preschool teachers...............................................................................17
3.5.3 Documentary analysis.......................................................................................................18
3.5.3.1 Documentary analysis..............................................................................................18
3.5.3.2 Observation Schedule............................................................................................... 18
3.6 Academic tests......................................................................................................................... 18
3.6.1 Language Test........................................................................................................................18
3.6.2 Mathematics Test.................................................................................................................. 18
3.7 Reliability and Validity........................................................................................................... 18
3.8 Data collection Procedure....................................................................................................... 19
3.9 Data analysis.............................................................................................................................19
CHAPTER FOUR: FINDINGS AND DISCUSSION............................................................ 20
4.1 Introduction............................................................................................................................. 20
4.2 Sponsors o f the ECDE schools...............................................................................................20
4.2.1 Qualification of the ECDE Teachers................................................................................. 21
4.2.2 Salary o f the ECDE Teachers..............................................................................................21
4.3 Results o f the findings according to objectives................................................................... 22
4.3.1 To establish the key sponsors of ECDE centers and relationship to children’s learning
achievement........................................................................................................................ 22
4.3.1.1 Affective Domain - Social competence - sharing...................................................... 24
4.3.1.3 Psychomotor Domain - Coordinating eyes and hands..................................................26
4.3.1.4 Motor Domain - Balancing with one leg.............................................................26
4.3.2 To Establish the ECDE Management Practices and how it affects children’s learning
achievement.......................................................................................................................27
vi

4.3.2.1 Human Resource Management - Teacher Compensation..................................... 27
4.3.2.2 Human Resource Management - Level of Teacher Motivation............................ 29
4.3.2.3 Human Resource management - Professional Growth - refresher Courses...... 29
4.3.2.4 Financial Management - Annual ECDE Budget of the Centre............................. 30
4.3.2.5 Financial Management - Head teachers’ financial management S kills............. 32
4.3.2.6 Financial management - Audit of Financial records............................................ 33
4.3.2.7 Physical Resource Management - Adequacy o f Classes......................................34
4.3.2.8 Physical Resource Management - Availability of playing materials..................35
4.3.2.9 Curriculum and Instructional Management............................................................36
4.3.2.10 Curriculum management - Schemes of W ork................................................... 36
4.3.2.11: Curriculum management - Lesson plan............................................................37
4.3.2.12: Curriculum management - Checking children’s books................................... 38
4.3.3 To establish the level of involvement of parents and community in the management of
the ECDEs and learning achievement.............................................................................. 38
4.3.3.1 Involvement o f Parents in Decision Making.......................................................39
4.3.3.2: Community Involvement in Maintaining Discipline in the School..................39
CHAPTER FIVE: SUMMARY RECOMMENDATIONS AND CONCLUSIONS.......41
5.1 Introduction............................................................................................................................. 41
5.2 Summary of Findings.............................................................................................................. 41
5.3 Recommendations....................................................................................................................43
5.4 Suggestions for further research.............................................................................................44
5.5 Conclusions..............................................................................................................................44
REFERENCES.............................................................................................................................45
Appendix I: Letter of permit to conduct research......................................................................53
Appendix II: Questionnaire schedule for head teachers............................................................. 54
Appendix III: Questionnaire for pre-school teachers................................................................. 56
Appendix IV: Observation schedule for the pre-school.............................................................57
Appendix V: Documentary analysis form .................................................................................. 58
Appendix VI: Early development instrument: domains, sub domains......................................59
Appendix VII: Language activities te s t......................................................................................60
Appendix VIII: Mathematics activities test.............................................................................. 61
Appendix IX: Work plan............................................................................................................... 62
Appendix X: Activity budget........................................................................................................63
vu

LIST OF FIGURES
Figure 2.1: Conceptual framework 15
viii

LIST OF TABLES
Table 3.1: Sample and Sample size..............................................................................................17
Table 4.1: The main sponsor of the school................................................................................. 20
Table 4.2: Professional qualification of ECDE teacher.............................................................. 21
Table 4.3: Teacher’s salary per month.........................................................................................22
Table 4.4: Cognitive Domain activities (Mean academic achievements and school sponsors)
......................................................................................................................................23
Table 4.5: Sharing with others and sponsorship.........................................................................24
Table 4.6: cooperation with others and sponsorship of Schools............................................... 25
Table 4.7: Colours within outline and sponsorship.................................................................... 26
Table 4.8: Balancing with one leg and main sponsor of the school..........................................27
Table 4.9: The main sponsor of the school is and salary range of the teacher..........................28
Table 4.10: Schemes of Work and Teacher’s salary per month............................................... 29
Table 4.11: ECDE teachers’ refresher courses and the school sponsor.................................. 30
Table 4.12: Financial Management and school sponsorship..................................................... 31
Table 4.13: financial management training and sponsor o f the school.....................................32
Table 4.14 : Financial management - Audit of Financial records........................................... 33
Table 4.15: Number of Classes and School Sponsorship...........................................................34
Table 4.16: Fixed and Unfixed play equipment and the Sponsor of the School...................... 35
Table 4.17: Remark on availed Schemes of Work and the Sponsor of the school...................36
Table 4.18: Remark on Availed Lesson Plan and the Sponsor of the School..........................37
Table 4.19: Remark on children’s book and sponsor of the school......................................... 38
Table 4.20: Parents' views are sort in decision making in matters of improving the school
and the school sponsor................................................................................................ 39
Table 4.21: Community’s Involvement in maintaining discipline in school and school’s
sponsorship..................................................................................................................40
IX

LIST OF GRAPHS
Graph 4.1: Cognitive Domain-Language and Mathematics
x

LIST OF ABBREVIATIONS
BOG Board of GovernorsDEO District Education OfficerDICECE District Centre for Early ChildhoodDSA District School AccountantECCE Early Childhood Care and EducationECDE Early Childhood Development and EducationGOK Government of KenyaK.CPE Kenya Certificate o f Primary EducationKNEC Kenya National Exam CouncilMEO Municipal Education OfficerMOE Ministry o f EducationNACECE National Centre for Early Childhood EducationSMC School Management CommitteeQASO Quality Assurance Officer
•Jf'iiVbh'Gh T * jr (ViMiK’Ub- KIKUYU LIBRARY P 0. Box B0I9"7
>vj/i>pno>
XI

ABSTRACT
Management is planning, resourcing, controlling, organizing, leading and evaluating educational programs. Organizational management in schools is a key factor that influences learning achievement in schools. Chitiavi, (2002) states that effective management and organization is a prime contributory factor in academic achievement. Operating ECDE centers has become a commercial venture: private business people, faith-based organizations, communities and main stream primary schools have opened such centers whose quality is questionable. In order to improve learners' performance, head teachers are expected to possess relevant managerial skills to run schools. Physical facilities and human resources are paramount to achieve higher learning achievements in preschools. The purpose o f this study was to establish how ECEs in Bamburi Zone in Kisauni division are managed and its effect on children's learning achievement. The objectives were; establishing the key sponsors of ECDE centers and relationship to children’s learning achievement, establishing how the management practices o f ECDEs affect children's learning achievement and the level of involvement of parents and community in the management of the ECDEs and learning achievement. Relevant literature on management of finances, utilization of funds in learning institutions, role of head teachers in school management, children’s learning and achievements, and, stakeholders participation in preschool management was cited. The study adapted the descriptive survey design where 11 head teachers, 11 ECED teachers and 160 children were involved in the study. Six instruments were constructed and used in the study. Cross tabulation with frequencies and percentages were used to analyse the data. The major findings were that the key sponsors were established as the, Private firms 5(45%), Community schools 2(18.2%), Faith-Based schools 2(18.2%) and Public Schools 2(18.2%) in that order. The Private schools were leading in Cognitive domain- Language activities, with 22.3% and, while the Faith Based and Community schools were leading in Mathematics activities, with 22.2%. The public schools were the worst performers in cognitive domain obtaining 10.82% in Language and 14.82% in Mathematics activities. The Private schools were keen on the management and delivery of the curriculum, motivation but poor in professional growth of the teachers while the Public schools were high on community involvement and professional development of teachers which contradicts the poor performance outcome.The researcher recommended that the private schools open up to stakeholder participation, while the public schools improve the salary o f the teachers as well as infrastructure. The community schools would do well by increasing the number of classrooms because the study found out that they were inadequate. There should be regular supervision in schools if good performance was to be realized in ECDE centres especially in the public schools.
XII

CHAPTER ONE
INTRODUCTION
1.1 Background to the Study
Management is the achievement o f objectives through people. Bush (1995) defines the
principles o f management as planning, re-sourcing, controlling, organizing, leading and
evaluating educational programs. In England and Wales, for instance, there’s middle
management in schools (Blandford, 1997) while in the UK, US, and Asian countries such as
Malaysia, Total Quality Management (TQM) has been applied to schools and colleges (Kanji
and Tambi, 1998; Kanji and Tambi, 1999; Barnard 1999). There has been the clamour for
and expansion of education at all levels, ECDE included, even before independence in
Kenya, (Mutero, 2001; Mwiria 1990). In the 1940s the colonial government established Early
Childhood and Care Centers (ECCE) for Kenyan children living on the tea, coffee and sugar
plantations. These centers were non-academic and only provided custodial care. In 1954,
UNICEF started supporting early childhood development and education in Kenya with focus
on the health of mother and child survival (UNICEF, 2002). The situation o f not attending to
the academic needs of the child persisted until the early 1970s (Kabiru, Njenga and
Swadener, 2003). The Ominde commission of 1964 highlighted the importance of universal
primary education as a basic right which marked the first step in an ongoing effort to link
early childhood and primary education.
In 1984, the MOE in partnership with Bernard Van Leer, established the National Centre for
Early Childhood Education (NACECE), aimed at harmonizing the growth, evaluation, and
oversight o f ECE, (Republic o f Kenya 1984). A year later District Centers for Early
Childhood Education (DICECE) were established for ease of coordination, (Gakuru, Riak,
Ogula, Mugo and Njenga, 1987). The DICECEs were placed under ministry officers who
trained, coordinated and gave professional guidance, advisory services to the teachers,
parents, communities and other preschools players in the district. Organizational management
in schools is a key factor that influences learning achievement schools. Chitiavi, (2002) stated
that effective management and organization is a prime contributory factor in academic
achievement.

1.2 Statement of the Problem
Operating ECDE centers has become a commercial venture with all sorts o f entrepreneurs
investing in pre-school centers. Private business people, faith-based organizations,
communities and main stream primary schools have opened such centers. There is little
monitoring by the government hence exposing the innocent children to unscrupulous business
people who never care about quality at the center and with no background on educvational
matters. Rutter et al (1997) and Wekesa (1993) stated that in order to improve learners’
performance, head teachers are expected to possess relevant managerial skills to run schools.
Further, organized physical facilities and human resources are of paramount importance in
order to achieve higher learning achievements in preschools. There are many ECDEs in
Bamburi zone, Kisauni District, Mombasa County but the physical facilities and human
resource are questionable. This study therefore intended to establish the state of the pre
schools and its impact on children’s learning achievement in Bamburi Zone in Kisauni
District, Mombasa County in Kenya.
1.3 Purpose of the Study
The purpose of this study was to establish how ECEs in Bamburi Zone in Kisauni division
were managed and its effect on children’s learning achievements. This would guide the
policy direction on management and operation of ECDE centres.
1.4 Research Objectives
The study intended to achieve the following objectives:
(a) To establish the key sponsors of ECDE centres and relationship to children’s learning
achievement.
(b) To establish the preschool management practices o f ECDE centres and how they affect
children’s learning achievement.
(c) To establish the level of involvement of the of stakeholders in the management of the
ECDEs and its relationship to learner achievement.
1.5 Research Questions
This study sought to answer the following questions:
(a) Who are the sponsors of ECDE centres and how are they related to the children’s
learning achievement?
2

(b) What are the management practices of the ECDE centres and how do they affect the
children’s learning achievement?
(c) What is the level of involvement of the stakeholders in the management o f the ECDEs
and its relationship to learner achievement?
1.6 Significance of the Study
The study intended to show how management of pre-schools affects learning and act as an
eye-opener for ECDE centres stakeholders. It would also provide policies recommendation to
experts in educational management as well as make additional information into the existing
literature.
1.7 Limitations of the Study
The researcher encountered some limitations during the study. For instance, some head
teachers had refused to participate in the survey which forced the study use fewer cases.
However this did not negatively affect the data as the preschools were highly homogeneous.
1.8 Delimitation of the Study
The study was conducted in Bamburi zone in Mombasa Municipality. The population
included public and private ECDE centers. The issues which were being studied were school
sponsorship, management practices - human resource management, curriculum management,
financial management and physical resource management. The data was gathered from head
teachers, preschool teachers, and the school children.
1.9 Basic Assumption:
The study assumed that there was a relationship between management and learning
achievements. Simultaneously, public and private head teachers as well SMCs/BOGs would
provide true data on financial services and expenses accrued.
1.10 Definition of Terms and Acronyms
Management - art o f getting people together to accomplish designed goals through,
planning, organizing, supervising, leading or directing and controlling for the purpose of
accomplishing a goal.
Achievement - success in carrying out a task.
3
Division — educational area within a district which is demarcated for educational
management.
Manager - any person or body of persons responsible for the management of a school.
Nutrition - nutrition is the combination of processes by which the living organisms receives
and utilizes the food necessary for the maintenance o f its bodily process and for other
renewal and growth of its organs system.
Efficiency - a measure to which a goal is attained.
Parent - mother or father who has a child in a particular school.
Community - the inhabitants in a given area.
1.11 Organization of the study
The study has been organised into five chapters: chapter one is on the background to the
study, chapter two literature review, chapter three methodology, chapter four findings and
discussions o f results, chapter five summaries, recommendations and conclusions. Finally
references and appendices have been outlined.
4

CHAPTER TWO
LITERATURE REVIEW
2.1 Introduction
Literature has been organized under the following sections: role of quality assurance and
standards officers, management o f finances, utilization o f funds in learning institutions, role
o f head teachers in school management, the role of various stakeholders in preschool
management and children's learning and achievement.
2.2. Effective school management
2.2.1 Role of quality assurance and standards officers in school management
According to Murgatryod and Morgan (1993), 'quality Assurance refers to determination of
standards, appropriate methods and quality requirements by an expert body, accompanied by
a process o f inspection or evaluation that examines the extent to which practice meets these
standards’. Downey et al (1994) claims that quality is meeting, exceeding, and satisfying a
community’s needs and expectation with the recognition that these needs and desires will
change over time. In Kenya, management of education is underpinned by the Education Act,
o f 1968 Cap 211 of the Laws of Kenya that states, “The Minister shall appoint officers with
authority to enter and inspect any school, or any place at which it is reasonably suspected that
a school is being conducted with or without notice, and to report to him with respect to the
school or any aspect thereof. Modem inspectorate in independent Kenya was initiated
through the recommendations of the Kenya Education Commission o f 1964 (Ominde report
1964). These included the Directorate of Basic Education, Directorate of policy and planning,
Directorate o f Quality Assurance and Standards, Directorate of Higher Education and the
Directorate of Technical Education. The work o f QAS is to enhance education effectiveness
and efficiency by working in collaborations with teachers and schools - including the ECD
centers.
Nevertheless, in Kenya, education reforms often fail to achieve desired outcomes due to
ineffective and inefficient supervision (Rep. of Kenya. 1988, 1999). Quality Assurance and
Standards Officers (QASO) are persons appointed by the DQAS, which is a department in the
Ministry o f Education, to supervise curriculum implementation in the schools (Wanzare,
2006). Etindi (2001) argues that effective supervision requires special specific skills to the
job. However, there is currently no special training of QASO in the colleges o f education in
Kenya. Instead, QASO are appointed from among classroom teachers and head teachers.
5

Such appointees would normally have merely undergone primary teachers training or tertiary
institutions without specific training as QASO (Etindi, 2001). Bamburi zone where the study
was being conducted is not exceptional. QASO manning the zone was appointed in the same
procedure. Moreover. QAS training has usually been done through In-service Education and
Training (INSET) courses organized from time to time (Republic o f Kenya, 2002). Such
courses might be helpful if done in the training institutions to ensure teachers are holistically
developed; since the relevance of the content delivered in the INSET is highly doubtful in the
dynamic society (Indoshi, 2001). The QASOs are not adequately equipped to handle
inspection and assessment of Early Childhood Development and Education (ECDE) services,
including issues in transition (Republic of Kenya, 2005 - 2010). Inspection responsibility is
not effectively done because according to the Education Act Cap 211, school inspectors are
appointed by the Minister of Education and DICECE trainers are not such appointees.
Although well versed with matters pertaining to ECD they have no mandate to assess ECD
centers watering down their gained knowledge.
2.2.2 Roles of head teachers in management of school
According to Sushila (2004), the head teacher is the leader in a school, the pivot around
which many aspects of the school revolve, and the person in charge of every detail of the
running o f the school, be it academic or administrative. Ayot and Briggs (1992) point out
those poor results in education are related to the resources allocated to it. There’s an
increased emphasis on school leader development and their use of self education to renew the
school (Hopkins, 2001) seen as managerialism, designed to leave policy direction to the
centre, with implementation left to the schools. Managerialism is seen to move the focus
away from the learner’s need to the organisational needs (Gewirtz Ball, 2000:254).
Management seen from a functional, structuralistic perspective is a process of planning,
organising, leading, and controlling to ensure effectiveness within an organisation (Robbins,
1980). The head teacher thus acts as a manager-head teacher who is active in the field of
management o f resources and management of people in technical use (Brunat and Boudreaslt
2001).
The Education Act (1968) of Kenya defines a manager as any person or body of persons
responsible for the management o f a school. Although the Act confers extensive powers on
the minister o f education over the management and regulation of education in Kenya, the day
to day running of affairs in the school falls squarely on the shoulders of the head teacher. In
6

the public primary schools in Kenya, the head teacher is also in charge o f the preschool
attached to it, since it is among the unaided schools according to the Act. The head teacher is
thus charged with a managerial duty at the ECD centre. As a manager, the head teacher
charged is with planning, organizing and controlling (Weihrich and Koontz 1993) in order to
run the ECD centers effectively. Educational organizations should be designed to avoid strict
military principles in order to enhance co-ordination among the various arms o f the ECD’s
community. This means that for a head teacher to cope with managerial operations he/she
should be highly qualified and must have been in an administrative post already as a deputy
head teacher (Ogembo, 2005).
Kwakwa (1973) further argues that the head teacher is a key person in any education system.
He takes care of the final arrangements of the education o f students in a school and Konchar
(1998) states that” schools are bad or good, in a healthy or unhealthy mental, moral and
physical condition, flourishing or perishing, as the principal is capable, energetic of high
ideals or the reverse. The quality o f leadership makes the difference between success and
failure of a school (Millette, 1998). According to Maslow, employees have five levels of
needs (Maslow, 1943): physiological, safety, social, ego, and self- actualizing. Maslow
argued that lower level needs had to be satisfied before the next higher level need would
motivate employees. Hygiene or extrinsic factors, such as pay and job security, produce job
dissatisfaction. Effective, managers need to understand what motivates employees within the
context o f the roles they perform. However managers should be aware that of all the
functions a manager performs, motivating employees is arguably the most complex. This is
due, in part, to the fact that what motivates employees changes constantly (Bowen &
Radhakrishna, 1991).
2.2.3 Management of finances in the school
Financial management is defined by Pandey (1995) as that management activity which is
concerned with the planning and controlling. It’s concerned with decisions on how to
procure, expend and give account o f funds provided for implementation of the program of an
organization. The management o f school finances can be one of the most challenging of
principal’s responsibilities. Many a times it is an area in which principals have little or no
training or expertise. The head teacher should have a budget which (Morphel et al 1974)
defined as an educational plan with an estimate of the receipt and expenditures necessary to
ensure smooth operation of finances. It is also likely that the selected members of the
7

(governing) body may be equally, ill - equipped for the task [(Clark; 2008; 278)]. In South
Africa for instance, the Schools Act, Section 15[Status of Public Schools]: the ultimate
responsibility for the accuracy of books (of account) is the school principal even if he or she
does not have the task of maintaining books on a regular basis- the management of school
finances is (however) a function o f the school governing body (Jones, 2000).
In Kenya, according to the Education Act Chapter 211, part X (34), the minister o f education
may from time to time from public funds establish, maintain, assist, make grants - in - aid of
or makes advances on loan in respect of schools. However, such funds do not go directly to
the management of pre-schools. Preschools in Kenya are either community owned or
attached to the primary schools, the ECD committees decide how much parents should pay
taking into account the parents’ income level (Ref; Ministry of Education Science and
Technology, (MOEST 2005). Funds from the government include, Community Support
Grants (CSGs) which are provided in line with the strategies of Kenya Sector Support
Program (KESSP), (Republic of Kenya, 2005). Early Childhood Development and Education
(ECDE) is one o f the key investments program. The schools are selected in regard to
vulnerability especially those living in Arid and Semi Arid Land (ASAL), urban slums and
pockets of poverty (Republic of Kenya, 2005). In these grants, each child is allocated
Kshl 170 which may vary depending on the final budget made available by the MOE for the
CSGs (ECD Centre Community Grant Management Handbook, Revised Edition, 2009).
Nevertheless, this allocation is hardly adequate and the last disbursement was given in
2009(Republic of Kenya, 2009).
The Boards o f Governors (BOG) are mandated by the Education Act to audit and regulate
expenditure by the administration to ensure that all income received by the school is applied
to the promotion of its objects (Education ACT 1968 Cap 211). Unfortunately, these skills are
not present in the administration o f many public school (Wanderi; 2008). Ogembo (2005)
confers with these views and states that for a head teacher to cope with managerial
operations, he/she should be highly qualified in management. In the public primary schools
the SMC are mandated by the Education Act 1968 to audit and regulate expenditure by the
administration to ensure that all income received by the school is applied to the promotion of
its objects.
8

2.2.3.1 Utilization of funds in learning institutions
According to (Blair 1990, Woodhall, 1987), the cost of university education per student in
Africa is needlessly high compared to other levels of education. In many African countries,
for example, a class of thirty or forty children in primary school could receive a year’s
schooling for the annual cost of a single student at university level. This high cost of
university education in African has been attributed to poor planning on the part of the
institutions. The situation is made worse by their failure to exploit economies of scale, their
high reliance on expatriate staff, and need to import funds, (Ferns, 1982; Kilemi, 1989; Wood
Hall, 1987, World Bank, 1986; 1988). However to reduce high expenditure in higher
education, the government introduced cost-sharing at the university level (Eshiwani, 1990;
World Bank; 1988).Ayot and Briggs (1992) point out those poor results in education are
related to the resources allocated to it.
In Rwanda for instance, the government was concerned that high fees and fewer places in
secondary education locked out those who completed primary education and qualified for
secondary education (Rwanda Ministry of Education, 2008) and made allocation for the
same. In Uganda, introduction of universal secondary education (USE) aims to shift access
patterns from limited elites to the majority children in the country (Museveni, 2008). The
Program is subject to the provision of Government Financial Management Act (2004).
However, there’s little funding going to ECD centers from the Kenyan government. This is in
form of Community Support Grants (CSGs) in which each child is allocated Kshll70 in
Management Handbook (2007) as mentioned earlier on. Expenditure includes: purchasing
teaching and learning materials, furniture, rehabilitation/repair: of classes furniture, toilets for
ECD children only, augmentation o f one or two full-time ECD teacher with 2000 shillings
per month per teacher and purchase of basic construction tools. Bullock (2007), postulated
that the overall building condition, the age of the building, and windows in instructional areas
are positively related to student achievement. Supporting the same views, Filardo (2008),
suggested that building design had been associated with teacher motivation and student
achievement.
Further, Filardo emphasized that improving school facilities, the effect on learning, and the
education environment plays an integral role in educators improving the education of the
students and providing good facilities. Investment in developing physical facilities, go a long
way in improving the quality of education. Lyons (2001) contends that teaching resources,
9

teacher’s skills and curriculum played a vital role in a child’s education.The same
expenditure is expected with funds accrued in private, community and Faith Based Schools
and parents in public schools. Provision of spacious classrooms is very crucial. Class size
may influence the teacher's decision about group arrangements or classroom procedures.
Teachers working with fewer pupils are able to correct tasks and provide feedback more
frequently and are able to cover the curriculum more in depth than in larger classes
(Blatchford 2003; Good and Brophy 2003; Hattie 2002). Konchar (1998) states that” schools
are bad or good, in a healthy or unhealthy mental, moral and physical condition, flourishing
or perishing, as the principal is capable, energetic of high ideals or the reverse. Large classes
have been shown to experience more off-task behavior amongst pupils (Blatchford 2003;
Hallie 2002). Multi-grade teachers have a greater reliance on differentiated pedagogical
methods that are more likely to be viable with fewer students (Blatchford 2003, & Hallie
2002). sHowever provision of play equipment has not been prioritized. Both good nutrition
and play are key aspects in a child’s holistic development (Santrock, 2004). According to
World Health Organization (WHO), (1946), health in its broader sense is “a state o f complete
physical, mental and social well-being and not merely the absence o f disease or infirmity.
According to WHO Ottawa charter for Health promotion (1986) health is not just a state; but
also “a resource for everyday life not the objective of living.’ Health is a positive concept
emphasizing social and personal resource as well as physical capacities
2.2.4: The roles of various stake holders in the Management of ECDE
2.2.4.1: The Role of Parents and Community in management of preschools
According to the Act Department o f Education and Training (2008) in Canberra, parents have
an enormous role to play in the pre-school management. Parents jointly operate with the
Department o f Education and Training preschools whilst administered through a government.
The preschool parent association is responsible for the provision, management and ownership
of their teaching and educational resources and consumable (glitter, paint, paper and glue and
other stationery). In the United States, the Education Act 1998 allows parents o f a school set
up a parents association (PA), to work with the principal, staff and board of management to
build effective co-operation and partnership between home and school.
In Kenya, according to ECD Service Standard Guidelines for Kenya (2006), parents are
incorporated in ECD management committees, where one parents’ representative elected by
parents of respective classes, namely day care, pre-unit land pre-unit 2. The ECD committees
10

shall be responsible for: identifying the needs of ECD services within their communities and
developing usable strategies for meeting the same; mobilizing the parents and locals
communities to initiate and sustain ECD centers; mobilizing the parents and local
communities to support ECD programmes; managing the ECD program; recruiting the
qualified pre-school teacher and other personnel and ensuring that they are paid; identifying
the local resources that could be used to support the ECD program; fundraising/sourcing for
alternative funds for the ECD program; ensuring that the money for the ECD program is well
utilized ; advocating for the needs and rights of children and the ECD creating awareness on
the importance of the early years and the ECD program.
However, most community members are deeply concerned about education, and are willing
to contribute to efforts to improve and expand local schools (ESSA, 2011). In South Africa,
the government’s call for greater participation in education has wide spread support. The call
is based on the assumption that if more people were included in school governance, then
democracy in education would be boosted and equality among school would be ensured
(Dieltiens and Enslin, 2002:5). However, both Ngidi (2004) and Mkhonto (1998) found that
the community is not highly involved because parents do not understand their role as School
Governing Body (SGB) members and their training was also limited. This has caused the
relationship between and school heads strained. Singh, Mbokodi and Msila (2004) in
agreement to this, argue that community inputs are crucial in development of the curriculum
o f schools. In Kenya, the community is charged with various roles. The community supports
parents’ efforts in providing for the holistic needs of children and augments parents’ efforts in
providing for the needs o f children. It also safeguards children’s rights; mobilize resources to
enhance children’s holistic development; provide protective environment for safeguarding the
rights of the children; support community own resources persons (CURPS) and other child
care service providers through employment, material and emotional support (National Early
Childhood Development Policy, 2006).
2.2.4.2 Roles of other agents ECDE
There are various agents involved in provision of ECD services to schools. These are referred
to as non-state provision services (NSPs) which can be defined as including partners outside
public sector, whether they operate for profit or for philanthropic purposes, (Moran & Batley
2004). According to Oxfam International In The Public Interest, (2006) NSPs range from
civil society organizations such as NGOs, churches, mosques and community organizations
11

to profit making companies, and in size from individual street traders to multinational
corporations. This is in agreement with the study because such organizations are part of the
population found in Bamburi Zone Mombasa Municipality, namely KENSIP, EMACK and
Madrasa Resource Center working under the auspices of AKF. Action Aid Kenya was also
found in this area. The NSPs are involved in various activities which are geared to
improvement o f education. Other roles of NSPs include acting as a watchdog in helping
communities point out failures in government systems and strengthening accountability to
students and communities rather than simply the formal systems, ( World Bank, 2003).
Community partners have various responsibilities with respect to construction, financing and
management. They also make a provision of inputs like textbooks, curricula teacher training,
classroom equipment and materials, (Rose, 2002; World Bank, 2003). NGOs boost access
through formal and non-formal education in many countries. For example, NGOs might
supply capital investments like tin roofs, pay teachers salaries, or take over running of the
school. In East Africa for instance, there are FBOs which are made of various religious
groups. Tietjen, (2000), states that religion has always played major and multiple roles in
education and schooling, as a provider, legitimiser and policy- broker, influencing national
education policies, curriculum and finance. Colonization had their start with Christian
missionaries or other religious groups. In Malawi, for instance, churches were the primary
providers of education from the early 19th century until independence in 1964 and the church
continues to own 71% of primary schools (Moran and Bately 2004).
2.2.5 Learning and children’s achievement
According to Bloom et al (1971), learning covers the cognitive as well as the affective and
psychomotor aspects. Bloom and his associates categorized the cognitive domain into six
levels of thinking. These are knowledge, understanding, application, analysis, synthesis and
evaluation. The affective domain covers such social and personality characteristics as values,
attitudes, interest, adjustment, habits, perception, social relations and beliefs. However,
children at pre-operational stage are egocentric and see things from their own perspective
(Piaget, 1954). This makes those living around them find them selfish and inconsiderate.
Psychomotor domain involves skills acquired by learners in manipulation, following
specified procedures and body movements. It ranges from simple handwriting to drawing,
handling of implements, apparatus, vehicles and equipment, playing of instruments and using
keyboards, stage performance and dance, games/sporting skills. According to (NASPE, 2002,
p 3) adopting a physically active lifestyle in early life increases the likelihood that infants and
12

young children will be adopting a physically active lifestyle in early life and learns to move
skilfully. Early motor skills form the foundation for later sport, dance and exercise activities.
Further, (Kemper, 2000; McKelvie, Kahn and McKay, 2000) argue that in young children,
skeletal health and bone mineral density are aided through weight-bearing activities and it
has been suggested that this enhanced bone mass from physical activity has the potential to
reduce the risk of osteoporosis and associated fractures in later life (Boreham and Riddoch,
2001).
Bloom et al 1971 states that assessment of these domains should aim at obtaining
information about knowledge gains, behavioural changes and other aspects of the
development o f learners (Oguneye, 2002). When it comes to assessment, all the three
domains should be incorporated because they are interrelated and interdependent (Oyesola,
1986). In Nigerian schools however, assessment, especially at the secondary level, most often
than not is concentrated on cognitive achievement to the detriment of affective and
psychomotor development of learners (Ipaye, 1986; lyewarun, 1986; Okon, 1986). At
formative years children are expected to like sharing, caring and helping others (Royal
college of Psychiatrits, 2005).This may lead to altruism (Zahn Waxier, Radke
Yarrow, Wagner&Chapman, 1992) in adult life which is good for community service (Hart &
others, 2003: Waterman, 1997).
There are many variations in the way young children are educated (Goelman 2003). These
include Montessori program, Reggio Emilia program in northern Italy, the child-centered
Kindergarten and Developmentally Appropriate and Inappropriate Practices in the Education
of young children (Santrock, 2004). Currently, there's controversy about what the curriculum
for U.S. early childhood education should be Vecchiotti, (2003) in Santrock (2004 10th E.d.)
On one side are those who advocate a child-centered, constructivist approach much like that
emphasized by National Association for the Education of young children (NAEYC) along the
lines of developmentally appropriate practice (Bredekamp 1987, 1997, NAEYC, 1986).
Others advocate an academic, instructive approach. In this approach, the child is viewed as
dependent on adult’s instruction in the academic knowledge and skills that can serve as a
foundation for later academic achievement. In the academic approach, this involves teachers
directly instructing young children to leam basic academic skills, especially in reading and
Mathematics. In Kenya, according to the “Guidelines for preschool education” (1984) issued
by KIE, curriculum is been defined in selecting what is to be learned and taught determining
13

how the material should be learned and taught; in developing guidance on how to implement
the curriculum in varying school contexts and in providing children with social situations and
physical environments. The guidelines are geared to establishing the ideal preschool, which
provides for the all around development of children namely stimulation, intellectual, and
physical, social, emotional and spiritual aspect (Balter, 2000).
2.3 Theoretical Framework
The study adapted the system theory which was developed by biologist Bertalanffy (1968).
Bertalanffy emphasized that real systems are open to, and interact with their environments.
Within a respective system there lay numerous elements. Each element has its functions and
goals but simultaneously the elements are interrelated. The systems theory views an
organization as a social system consisting of individuals who cooperate within a formal
framework, drawing resources, people, finance from their environment and putting back into
that environment the products they produce or the services they offer. The school is an
example of a social system in which unity and integrity o f the organization focuses on the
interaction between its component parts and the interactions within internal and external
environment. These components in reference to educational management include;
government, ECD head teachers, ECD teachers, GoK, other agents and infrastructure which
have to work harmoniously for learning achievement to be positive
14

Figure 2.1: Conceptual framework
Source- own composition
According to the framework above, learning achievement which is the dependent variable is
determined by the relationship between independent variables. This relationship is therefore
direct as shown by the arrows. According to Littlejohn (1983) a system is a set o f objects or
entities that interrelate with one another to form a whole. Such entities include: head teachers,•> *
teachers, children and facilities as well as other stakeholders. Thus, the management output,
in this case is denoted by learning achievement which is measured by a test-score. If the
interaction is positive, then the output (learning achievement) is high and vice versa. This
study seeks to establish the impact of independent variables on the depended variable
(learning achievement).
15

CHAPTER THREE
RESEARCH METHODOLOGY
3.1 Introduction
In this chapter the researcher outlines the research methodology citing research design,
sampling, population, using instruments, reliability and validity, data analysis, references and
appendences
3.2 Research design
The study adapted descriptive survey. This is the research design in which data is collected
through administering a questionnaire to a sample of individuals (Faenkel &Wallen, 1993).
The sample was derived from preschools at Bamburi Zone in Kisauni division, Mombasa
Municipality. The aim of collecting information was to determine whether there was a
relationship between management o f preschools in this zone and learner achievement.
3.3 Study Population
Kisauni district has two administrative zones; namely, Kengeleni and Bamburi zones. The
study focused on Bamburi which has a total of 72 schools. There were different categories of
pre-schools in this zone. They included public (GoK), private (purely individual), faith-based
(Muslim and Christian) and non-formal schools (community schools). Most o f the schools
had either permanent or semi-permanent classes. The children sat on either desks and low
chairs or mats. Bamburi Zone was cosmopolitan and densely populated. As such, children
came from diverse background in terms of culture, ethnicity and religion. In this zone, there
were 216 ECD teachers. Most o f the teachers were trained while others were either
undergoing certificate or diploma course in ECDE, in various ECDE training colleges, both
private and public. In matters of education Kisauni division was unique because being a
constituency and thus a district; the District Education Officer (DEO) is expected to be in
charge of all educational institutions. However in Mombasa County, which is also a
Municipality, the DEOs were only in charge o f secondary schools while the Municipal
Education Officer (MEO) was in charge of all the primary schools and preschools in the
county. As such supervision of schools in Bamburi zone was done by one ZQASO. The other
population was head teachers ECD teachers and children o f the preschools; public, private,
community schools and faith based schools.
16
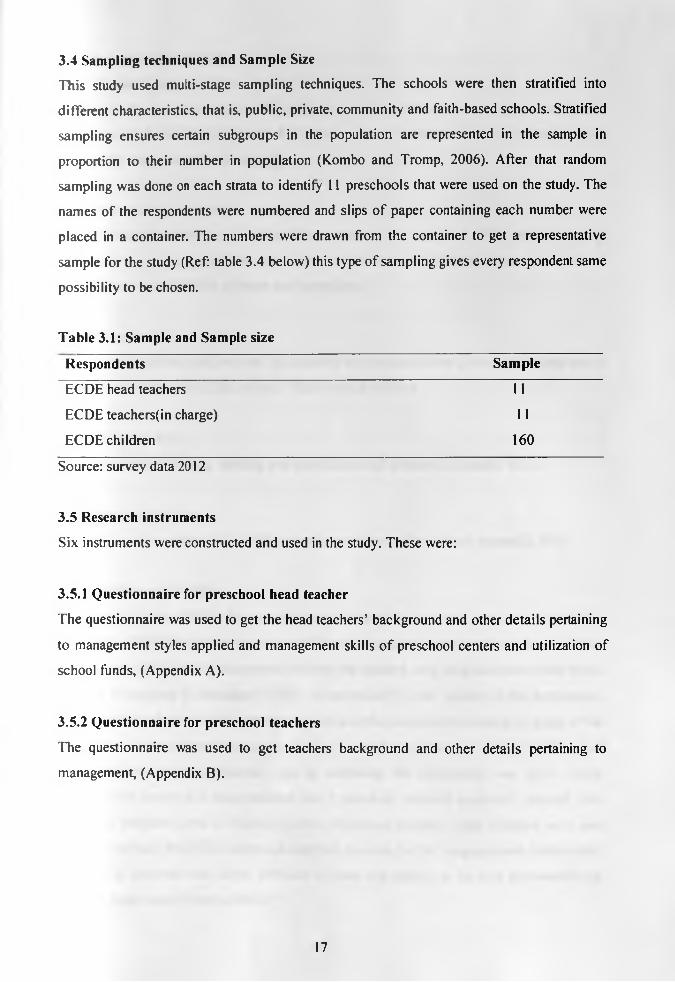
3.4 Sampling techniques and Sample Size
This study used multi-stage sampling techniques. The schools were then stratified into
different characteristics, that is, public, private, community and faith-based schools. Stratified
sampling ensures certain subgroups in the population are represented in the sample in
proportion to their number in population (Kombo and Tromp, 2006). After that random
sampling was done on each strata to identify 11 preschools that were used on the study. The
names of the respondents were numbered and slips of paper containing each number were
placed in a container. The numbers were drawn from the container to get a representative
sample for the study (Ref: table 3.4 below) this type of sampling gives every respondent same
possibility to be chosen.
Table 3.1: Sample and Sample size
Respondents Sample
ECDE head teachers 11
ECDE teachers(in charge) 11
ECDE children 160
Source: survey data 2012
3.5 Research instruments
Six instruments were constructed and used in the study. These were:
3.5.1 Questionnaire for preschool head teacher
The questionnaire was used to get the head teachers’ background and other details pertaining
to management styles applied and management skills o f preschool centers and utilization of
school funds, (Appendix A).
3.5.2 Questionnaire for preschool teachers
The questionnaire was used to get teachers background and other details pertaining to
management, (Appendix B).
17

3.S.3 Documentary analysis
3.5.3.1 Documentary analysis
(Appendix c) was used to analyze the children’s books, teachers’ records, schemes of work
and lesson plans, children’s books and progress records. The researcher went through all the
records and made remarks accordingly.
3.5.3.2 Observation Schedule
The observation schedule (Appendix D) was used to get empirical effect o f the learning
environment - physical facilities, space, learning resources on display, fixed and non-fixed
play equipment, availability of water and sanitation.
3.6 Academic tests
The researcher constructed two sets o f academic tests because there is no standardized test in
examination among the ECDE centers. These were as follows.
3.6.1 Language Test
It mainly tested on reading, spelling and identification of pictures (Appendix VII)
3.6.2 Mathematics Test
It mainly tested on arithmetic of addition and subtraction and counting (Appendix VIII)
3.7 Reliability and Validity
According to Joppe (2000), the most important issue in the research is to ensure reliability
and validity. Reliability is the extent to which results are consistent over time under a similar
methodology while validity determines whether the research truly measured that which it was
intended to measure (Golafashani, 2003). To test reliability and validity of the instruments,
the researcher took some o f the instruments and used the test-re-test technique on a few of the
respondents. The instruments were appraised by two lecturers who were experts in the area of
educational management. Another step in validating the instruments was done during
piloting. This involved 3 head teachers and 3 preschool teachers randomly selected from
schools in Bamburi zone in Kisauni district, Mombasa County. Nine children were also
selected randomly the ECDE centres in Bamburi zone sat for the Language and Mathematics
tests. It was expected that scores obtained by each respondent on the first and second test
would be quite close (Orodho, 2003). N
18

If not, the instruments would be of low reliability and not valid requiring redrafting. However
this was not necessary as the instruments gave valid and reliable feedback.
3.8 Data collection Procedure
After getting a letter of introduction from the University o f Nairobi, the researcher took it to
the Municipal Education Officer and obtained authority to conduct the study. The researcher
visited institutions which were randomly sampled and made appointment for administration
of the instruments. Once granted permission, the researcher proceeded on with data was
collection within the stipulated time (appendix IX). These included questionnaires for the
head teacher and ECDE teacher, documentary analysis guide, observation schedule and
academic achievement tests. Both qualitative and quantitative data was collected.
3.9 Data analysis
The collected data was grouped according to the objectives and research questions and
analyzed quantitatively presenting it in cross tables. Cross tabulation is a powerful approach
as it enables a comparison and in depth analysis o f individual response against specific items.
A cluster bar graph comparing pupil performance in Mathematics and Language against the
sponsor of the ECDE canter was also generated.
19
CHAPTER FOUR
FINDINGS AND DISCUSSION
4.1 Introduction
This chapter presents the findings, analysis and interpretation of the data collected. It is
presented in sections according to the objectives. This included background information
which would form the basis of further analysis and enable the researcher to make
generalizations. This information was directly linked to all objectives. The response rate in
this study was 100 percent since the researcher had planned to collect data from 11 schools
and all the instruments were duly completed and returned.
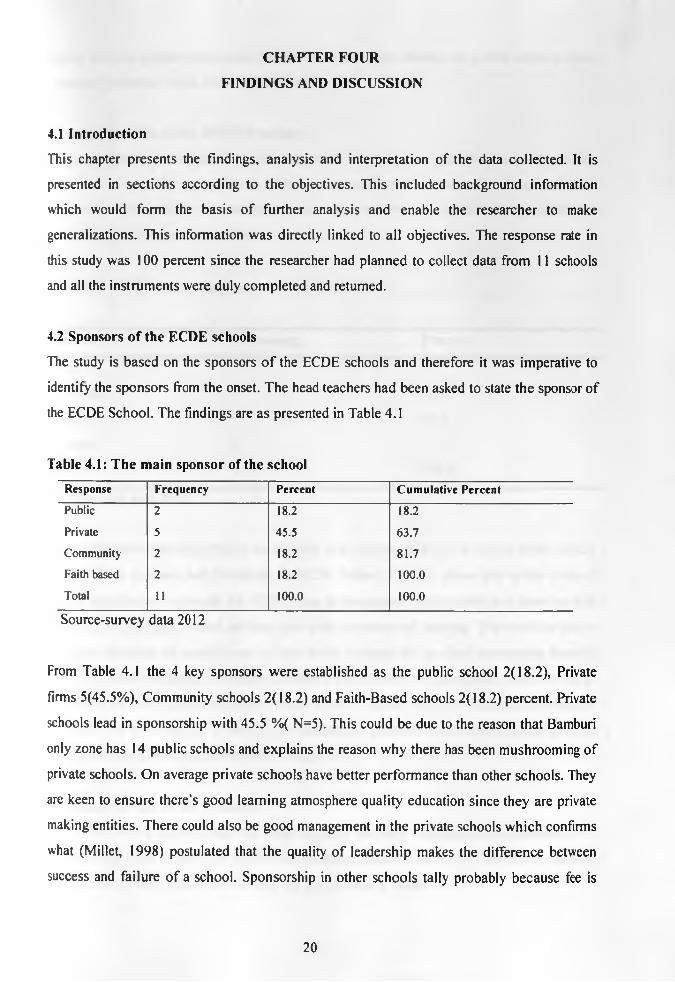
4.2 Sponsors of the ECDE schools
The study is based on the sponsors o f the ECDE schools and therefore it was imperative to
identify the sponsors from the onset. The head teachers had been asked to state the sponsor of
the ECDE School. The findings are as presented in Table 4.1
Table 4.1: The main sponsor of the school
R e sp o n se F re q u e n c y P e rc e n t C u m u la t iv e P e rc e n t
P u b lic 2 18.2 18.2
P riv a te 5 45 .5 6 3 .7
C o m m u n ity 2 18.2 8 1 .7
F a ith based 2 18.2 1 0 0 .0
T o ta l 11 100.0 1 0 0 .0
Source-survey data 2012
From Table 4.1 the 4 key sponsors were established as the public school 2(18.2), Private
firms 5(45.5%), Community schools 2(18.2) and Faith-Based schools 2(18.2) percent. Private
schools lead in sponsorship with 45.5 %( N=5). This could be due to the reason that Bamburi
only zone has 14 public schools and explains the reason why there has been mushrooming of
private schools. On average private schools have better performance than other schools. They
are keen to ensure there's good learning atmosphere quality education since they are private
making entities. There could also be good management in the private schools which confirms
what (Millet, 1998) postulated that the quality of leadership makes the difference between
success and failure of a school. Sponsorship in other schools tally probably because fee is
20

usually low and parents who could not afford to take their children to private schools share
remaining vacancies in the rest of the schools.
4.2.1 Qualification of the ECDE Teachers
The researcher also wanted to establish the level of profession qualification o f the ECDE
teacher so as to enable extrapolation o f the performance o f the school and the compensation
they received. The ECDE teachers were asked to state their highest professional qualification.
The findings are as presented in Table 4.2
Table 4.2: Professional qualification of ECDE teacher
Response Frequency Percent
ECDE
Certificate 5 45.5
ECDE 54.5
Diploma 6
Total 11 100.0
Source-survey data 2012
It was established that 6(54.5%) of the teachers had Diploma in ECDE teaching while 5(45.5)
percent of the teachers had Certificate in ECDE Table(4.2). This shows that at the level of
teacher qualification to handle the ECDE class in the schools is acceptable and therefore it is
expected that the pupils would perform well in all the sphere of learning. This could be due to
the many promises of employment o f preschools teachers by the GoK. motivating them to
upgrade themselves hoping the highest academic levels would be considered. However this is
not always the case. Children perform poorer the more higher the qualifications their teachers
obtained. This could be due to lack o f job satisfaction in teachers who expect higher pay rise
and instead just get frustration from their employers.
4.2.2 Salary of the ECDE Teachers
The teachers were asked to state the range of salary that they were paid as compensation for
the work they were doing. This was to enable extrapolation on the level of motivation and the
performance o f the school. The findings are as presented in Table 4.3.
21

Table 4.3: Teacher’s salary per month
Response Frequency Percent
2,000-4.000/= 3 27.3
4,001-6,000/= 5 45.5
Over 9,000/= 3 27.3
Total 11 100.0
Source- survey data 2012
According to Table 4.3 above, it was discovered that 3( 27.3%) of the teachers were paid
less than Ksh 4,000/= per month, about a half of the respondent teachers 5(45.5) percent were
paid between 4001/= and 6000/= and 3(27.3%) was paid above 9000/=. This is a reflection of
how ECD teachers’ services are considered to be insignificant in comparison to the GokSSSS
augmentation o f 2000/= to current salaries in public schools, (Management Handbook
(2007). This drop in the ocean in these economic hardships and teachers should not be
expected to be productive. Such low payments could have a negative effect on teacher’s
productivity affecting children’s performance.
4.3 Results of the findings according to objectives
This section presents the finding according to the objectives of the study.
4.3.1 To establish the key sponsors of ECDE centers and relationship to children’s
learning achievement
The purpose o f this objective was to establish which of the various sponsors and by extension
owners of the ECDE institutions were performing well on the basis of pupils’ learning
achievement. In order to achieve this, the study used the academic test to measure cognitive
achievement and constructed an observation guides to rate the children’s achievement in
motor skills and social competence skills. Each of these learning domains is discussed further
in the presentation. In the task, 160 children participated in the tasks as indicated in the table
below,
22

Table 4.4: Cognitive Domain activities (Mean academic achievements and school
sponsors)A ctivity a rea P a b lk school P r iv a te sebaol C M B u i t y School F a ith Based school
N=4# N = M N=2* N =20
Language 10.82 22.3 14.5 16
Mathematics 14.80 18.1 15.2 21.2
Source-survey data 2012
Table 4.4 above shows the mean scores o f 160 children to whom Language and Mathematics
tests were administered against the school sponsors in order to test the cognitive domain. The
total mark per activity area was 25. The researcher then combined the scores from the
mathematics and language test and produced a cluster bar graph comparing the performances
in the test on the background of the sponsor of the school. The resultant graph is presented
Graph 4.1: Cognitive Domain-Language and Mathematics
Language Mathematics
25 n KEY
□ Pufaficsdnoi□ Private school□ Community school□ M th based school
In reference to graph 4.1 above, it is clear that the Public schools under the sponsorship of the
Ministry o f Education had the least learner achievement in both Maths (mean =12.80) and
English (mean 10.82). The Faith based schools recorded the highest performance among all
the categories o f sponsors Math (mean 21.2). The Private schools had the best learner
performance in Language (mean =22.3). The community school was average with Language
(mean =14.5) and Mathematic (mean =15.2). The good performance o f English in private uld
be due to emphasis in English speaking which is laid in private schools which make them
appear more superior compared to other schools and thus get more clients .being commercial
ventures. The Faith based schools had the best performance in Maths. This suggests that
there is order in the Faith Based schools and keenness on curriculum management as an
23

aspect of school management. It confirms Tietjen, (2000) sentiments that religion has always
played major and multiple roles in education and schooling, as a provider, legitimise and
policy- broker, influencing national education policies, curriculum and finance. Poor
performance in public schools could be due to lack of proper supervision. This concurs with
(Etindi 2001) who argues that QASO are appointees from classrooms and effective
supervision requires special specific skills to the job.. However, there is currently no special
training of QASO in the colleges o f education in Kenya. Instead, QASO are appointed from
among classroom teachers and head teachers. Such appointees would normally have merely
undergone primary teachers training or tertiary institutions without specific training as
QASO (Etindi, 2001). Head teachers are also in charge o f primary schools attached to ECDE
centres and might concentrate more on KCPE mean scores and neglect ECDE centres which
would in turn affect performance due to little or lack o f supervision in curriculum
implementation. Lack of supervision may also lead to laxity in teachers.
4.3.1.1 Affective Domain - Social competence - sharing
The ECDE schools are expected to inculcate in the pupils social skills so that when they grow
up, they are able to fit in the society without many problems. The researcher observed the
pupils in their play ground and class room and made the following remarks on how they
shared various things. The findings are given in Table 4.5
Table 4.5: Sharing with others and sponsorship
Performance Public Schools
Frq %
Private Schools
Frq %
Community
Frq %
Faith Based
Frq %
Total
Frq %
E x ce lle n t 9 5.6 11 6 .8 7 6 3 .8 12 7 .5 3 8 24
V ery G o o d 10 6.25 13 8.12 7 4 .4 4 2 .5 3 4 21
G o o d 7 4.4 40 25 4 2 .5 3 1.9 5 4 34
F a ir ly G ood 8 5.0 7 4 .3 7 3 1 .9 1 .6 19 12
P o o r 6 3.8 9 5 .62 0 .0 0 .0 15 9
T o ta l 4 0 2 4 .9 80 4 9 .9 8 2 0 1 2 .4 9 20 12 .49 160 100
Source - survey data 2012
From the table above, 38(24%) of the pupils performed at the level o f ‘Excellent’. O f these,
the Faith Based Schools contributed7.5 %( N=12) followed by the Private schools at
6.8%(N=1 l).On the scale o f very good there were 34( 21%),private schools were highest
with 11( 6.9%)and at the same time 40(25%) were rated good in private schools. Among the
24

children, 14(2.62%) were poor on sharing. Out of the 14(2.62%), 9 (2.5%) were from private
schools. This could be due to the reason that children from private schools come from well-
to-do who mostly live in confined areas where sharing is not norm. Such children are usually
in the hands of house helps who in most cases may not inculcate social values as it were. It is
also likely that concentration is more on academic competences than social competences.
This result suggests that the Faith Based Schools are keen on social competence of the
children. Moreover religion is expected to ensure children are holistically sound especially in
the moral aspect which sharing is part of. However, lack o f sharing is a normal characteristic
of a prc-opcrational child who is egocentric and may be thought to be selfish or
inconsiderate but just looks at the world from his/her own perspective (Piaget, 1954).
4.3.1.2 Affective Domain - Cooperation with others
Table 4.6: cooperation with others and sponsorship of Schools
Performance Public Schools
Fqr %
Private Schools
Fqr %
Community
Fqr %
Faith Based
Fqr %
Total
Fqr %
E x ce lle n t 5 3.1 6 3 .4 9 5 .6 7 4 .4 27 16.5
V ery G ood 8 5 .0 30 18.8 4 2 .5 6 3.8 48 30.1
G o o d 14 8 .8 22 13.8 5 3.1 4 2 .5 45 28.2
F a irly G o o d 7 4 .4 12 7.5 2 1.2 3 1.9 2 4 15.1
P o o r 6 3 .8 10 6.3 0 .0 0 .0 16 10.1
T o ta l 4 0 25.1 80 49 .8 2 0 12.5 20 12.5 160 100
Source - Survey Data 2012
From Table 4.6 above 75(46.6%) o f the pupils scored an ‘Excellent’ or ‘Very good’ on
cooperation with others. Out of these, private schools private schools contributed 36(22.2%)
while the rest of the schools had 13(8.1%). However, Faith based schools led with
5.6%(N=9) probably because from religious perspective, love for the neighbours is upheld, as
such faith based schools were keen on encouraging cooperation among the pupils due
inculcation o f moral values for which is part of spiritual growth religion ascribes. A close
look at the tables reveals that the public sponsored schools were poor at encouraging
cooperation making 7.6(N=12). Probably teachers were not keen due low motivation in the
meagre salaries they received, lack o f recognition and poor working conditions (Table 4.3).
25

This could also be what Piaget (1954) referred to as pre-operational stage as stated earlier in
(Table4.4) on egocentrism.
4J.1J Psychomotor Domain - Coordinating eyes and hands
Schools also seek to improve on the psychomotor domain o f the children in their schools.
This domain is on how children coordinate the mental and physical abilities simultaneously.
This is by performing tasks which require the use of brains and muscles. In order to test this
objective, the researcher asked the pupils to colour a given picture and scored them according
to how well the pupil coloured within the outline of the figure. This is associated with good
handwriting. The findings are given in Table 4.7
Table 4.7: Colours within outline and sponsorship
Performance Public Schools
Frq %
Private
Schools
Frq %
Community
Frq %
Faith Based
Frq %
Total
Frq %
E xcellen t 0 . 0 10 6 .2 5 0 .0 0 .0 10 6 .2 5
V ery G o o d 7 4 .4 8 5 .0 4 2.5 6 3 .8 25 15.7
G ood 2 0 12.5 37 23.1 10 6 .25 9 5 .6 76 4 7 .3
Fairly G ood 10 6 .2 5 25 15.6 6 3.8 5 3.1 46 2 8 .7 5
Poor 3 1.9 0 .0 0 .0 0 .0 3 1.9
Total 4 0 25 80 49 20 12.5 2 0 12.5 160 1 0 0 .0
Source - Survey Data 2012
From the table, 35(21.95%) of the chidren scored either ‘Excellent’ or ‘Very good’. Out of
these, 18(11.25%) were from the private schools followed by 7(4.4%) from public.
Ironically, public schools were still worst with 1.9 %( N=3). This implies that the Private
sponsored schools gave the psychomotor domain a high priority while the public schools
were not keen on this front. Probably, provision of resources in private schools enabled
children to acquire the skill. It can also be argued beyond reasonable doubts that QASOs are
not adequately equipped to handle inspection and assessment of Early Childhood
Development and Education (ECDE) services; including issues in transition (Republic of
Kenya, 2005 - 2010) thus some of the activities were not given preference.
43.1.4 Motor Domain - Balancing with one leg
The researcher also wanted to establish which of the sponsors of the schools was keen on
ensuring that the children developed their motor skills in the learning process. The pupils
26

were asked to stand on one leg and the researcher scored their performance on the scale of
‘Excellent - Poor’ depending on the duration the children stood on one leg. The observations
were collected and presented in Table 4.7
Table 4.8: Balancing with one leg and main sponsor of the school
Performance Public Schools Frq %
Private Schools Frq %
Community Schools Fro____ %
Faith Based Schools Frq %
Total
Frq %E x c e lle n t 25 15 10 6 .2 5 9 5 .6 12 7 .5 55 33V ery G o o d 5 3.12 18 11.25 5 3 .1 2 3 6 .2 5 31 23G o o d 8 5.0 4 0 25 .0 3 1.9 2 1.25 53 33.1F a irly G o o d 3 1.9 12 7 .5 3 1.9 1 0 .6 19 11.9to ta l 4 0 25 80 50 .0 20 12.5 20 12.5 160 100
Source - Survey Data 2012
The table above clearly shows was that the children who either balanced ‘Excellent’ or ‘Very
good’ were 86(56%) of all the children. In accordance to school sponsorship, 30(18.12%) of
the children who were from public sponsored schools scored ‘Excellent’ and ‘Very good’ and
28(17.5%) from the Private schools. Faith Based Schools were rated 15(13.3%) and finally
community schools were 14(8.!8%).The high performance in public is not likely to be
pegged to good management bearing in mind that in all other domains public schools have
been rated below average. It could also be due to walking long distances to school which
strengthened their bones and leg muscles. Most private schools have play equipment which
could be the reason of the good performance. The 7.5 %( N=12) who had fairly well could be
the ones who used buses and, had limited time to play due to emphasis on academic
performance or had no play-equipment. The same applies to community schools and faith
based schools which are usually located within the children’s environs. Children from these
schools had average performance an indication that play was most likely not a priority.
Boreham and Riddoch, (2001) suggested that enhanced bone mass from physical activity has
the potential to reduce the risk of osteoporosis and associated fractures in later life. This calls
for emphasis in out door activities in the schools. It also shows that teachers might not lay
much emphasis in all activities done in schools due to minimal supervision ( Table 4.4).
4.3.2 To Establish the ECDE Management Practices and how it affects children’s
learning achievement
4.3.2.1 Human Resource Management-Teacher Compensation
27
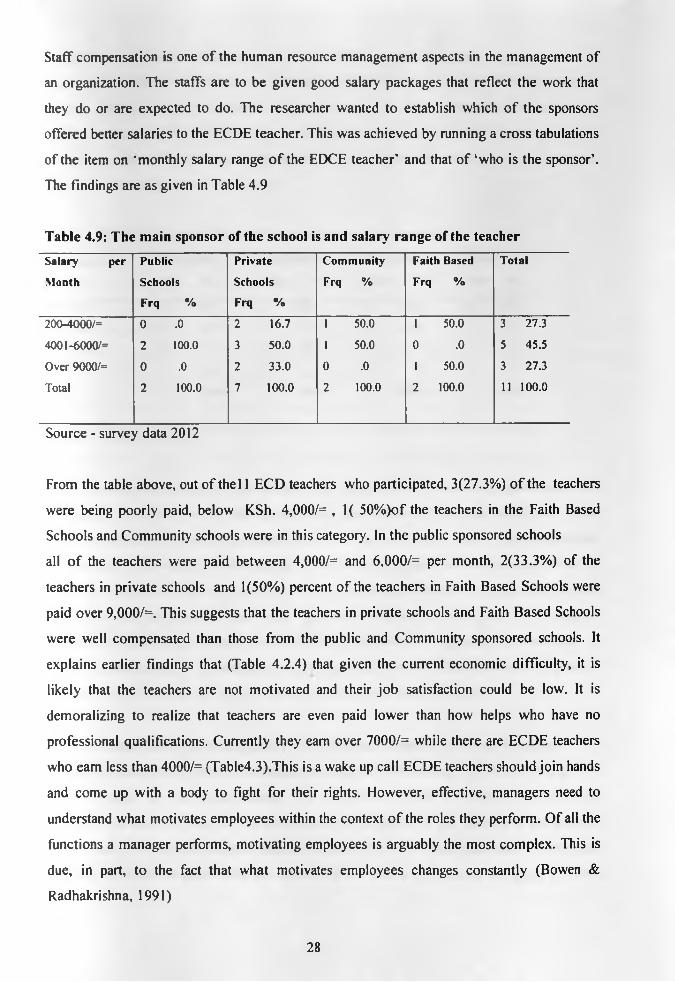
Staff compensation is one of the human resource management aspects in the management of
an organization. The staffs are to be given good salary packages that reflect the work that
they do or are expected to do. The researcher wanted to establish which o f the sponsors
offered better salaries to the ECDE teacher. This was achieved by running a cross tabulations
of the item on ‘monthly salary range o f the EDCE teacher* and that of ‘who is the sponsor’.
The findings are as given in Table 4.9
Table 4.9: The main sponsor of the school is and salary range of the teacher
Salary per
Month
Public
Schools
Frq %
Private
Schools
Frq %
Community
Frq %
Faith Based
Frq %
Total
2 0 0 -4 0 0 0 /= 0 .0 2 16.7 1 50.0 1 50 .0 3 27 .3
4 0 0 1 -6 0 0 0 /= 2 100.0 3 5 0 .0 1 50.0 0 .0 5 4 5 .5
O v e r 9 0 0 0 /= 0 .0 2 3 3 .0 0 .0 1 50 .0 3 2 7 .3
T o ta l 2 100.0 7 1 0 0 .0 2 100.0 2 100.0 11 1 0 0 .0
Source - survey data 2012
From the table above, out of thel 1 ECD teachers who participated, 3(27.3%) o f the teachers
were being poorly paid, below KSh. 4,000/= , 1( 50%)of the teachers in the Faith Based
Schools and Community schools were in this category. In the public sponsored schools
all o f the teachers were paid between 4,000/= and 6,000/= per month, 2(33.3%) of the
teachers in private schools and 1(50%) percent o f the teachers in Faith Based Schools were
paid over 9,000/=. This suggests that the teachers in private schools and Faith Based Schools
were well compensated than those from the public and Community sponsored schools. It
explains earlier findings that (Table 4.2.4) that given the current economic difficulty, it is
likely that the teachers are not motivated and their job satisfaction could be low. It is
demoralizing to realize that teachers are even paid lower than how helps who have no
professional qualifications. Currently they earn over 7000/= while there are ECDE teachers
who earn less than 4000/= (Table4.3).This is a wake up call ECDE teachers should join hands
and come up with a body to fight for their rights. Flowever, effective, managers need to
understand what motivates employees within the context o f the roles they perform. Of all the
functions a manager performs, motivating employees is arguably the most complex. This is
due, in part, to the fact that what motivates employees changes constantly (Bowen &
Radhakrishna, 1991)
28

4.3.2.2 Human Resource Management - Level of Teacher Motivation
The quality of the work done by the teacher is indicative o f the level o f motivation of the
teacher. Although money is not the only motivator, it is a key factor of staff motivation.
Highly motivated staffs do high quality work. The researcher cross tabulated the responses on
the salary given to the teachers and the quality of home work the teachers gave to the pupils.
The results are as given in Table 4.10
Table 4.10: Schemes of Work and Teacher’s salary per month
Performance 2 0 0 0 -4 0 0 0 /=
Fqr %
4 0 0 1 -6 0 0 0 /=
Fqr %
Over 9 0 0 0 /=
Fqr %
Total
Fqr %
E x c e lle n t 2 66 .7 2 40 .0 2 6 6 .7 6 54.5
V ery G o o d 0 .0 0 .0 1 3 3 .3 1 9.1
F a irly G o o d 0 .0 3 60 .0 0 .0 3 27 .3
Poor 1 3 3 .3 0 .0 0 .0 1 9.1
T o ta l 3 1 0 0 .0 5 100.0 3 1 00 .0 11 100.0
Source - survey data 2012
From the table 4.10 above, it is evident that teachers who were lowly paid were less
enthusiastic about their work. 3(60%) had fairly good while 1(33%) were rated poor. These
categories of teachers earning less than Ksh.6, 000/= as the monthly salary. The teachers who
had excellent as a remark on the quality of the work they gave earned between 4000/= to
6000/=per month. This goes to imply that well paid teachers who are also recognized for their
effort are more dedicated to their work than those who are not well paid. This confirms
research by (Herzberg. Mausner, & Snyderman, 1959) which suggested that motivator or
intrinsic factors, such as achievement and recognition, produce job satisfaction. Hygiene or
extrinsic factors, such as pay and job security, produce job dissatisfaction.
4.3.2.3 Human Resource management - Professional Growth - refresher Courses
As a good management practice, managers are expected to encourage the professional growth
of the workers in their organizations. The researcher wanted to establish which of the
sponsors was keen on ensuring the professional development of the teachers in the schools.
To this end, the responses on the question on how often the respondents attended refresher
courses was cross tabulated with the sponsor of the school. The results are given in Table
4.11
29

Table 4.11: ECDE teachers’ refresher courses and the school sponsor
Duration Public
Schools
Frq %
Private
Schools
Frq %
Community
Schools
Frq %
Faith Based
Frq %
Total
Fqr %
O nce P e r T erm 2 100.0 1 2 0 1 50 .0 1 5 0 .0 5 45.5
O n ce P e r Y ear 0 .0 3 6 0 1 50 .0 1 5 0 .0 6 54.5
T w ice P e r Y ear 0 .0 1 2 0 0 .0
©o
1 9.1
T otal 2 100.0 5 1 0 0 .0 2 100.0 2 100 .0 11100 .0
Source - survey data 2012
From table 4.11 above the Private school were very irregular in taking their teachers for
refresher courses with20%(N=l)once per term, 60%(N=3) once per year and 20%(N=1)
twice per year, followed by the Community and Faith Based Schools at 1(50%). The Public
schools were more regular and constant at 100 %(N=2) per term. This implies that the public
schools were keen on the professional development of the ECDE teachers in its schools.
Moreover, being professionally trained they must be aware that refresher courses expose
teachers to current trends in educational matters. This is in line with Konchar (1998) who
stated that” schools are bad or good, in a healthy or unhealthy mental, moral and physical
condition, flourishing or perishing, as the principal is capable, energetic of high ideals or the
reverse. Private schools may not be very keen on refresher courses as they might find it time
wasting while children should be in class drilling children for better performance as it is the
norm in most private schools.
4.3.2.4 Financial Management - Annual ECDE Budget of the Centre
No organization, schools included can achieve its goals without financial resources. The
financial resources are in the form o f budgets for acquiring various needs in the school. The
researcher therefore wanted to find out which o f the sponsors provided enough financial
resources for the respective ECDE centres
30

Table 4.12: Financial Management and school sponsorship
Annual Budget Public
Schools
F rq %
Private
Schools
Frq %
Community
Frq %
Faith Based
Frq %
Total
10,000-50.000/= 0 .0 0 .0 0 .0 1 50 .0 1 9 .1 %
50,001-
100,000/= 0 .0 3 6 0 .0 0 .0 0 .0 4 3 .6 %
O ver 150,000/= 2 100.0 2 4 0 .0 2 100.0 1 50 .0 7 6 3 .6 %
Total 2 100.0 5 1 0 0 .0 2 100.0 2 100.0 1 1 .1 0 0 .0
Source - survey data 2012
From the table, it is evident that (7)63.6% of the ECDE centers were operating with an annual
budget of over than KSh. 150,000/=. All public, Community and Private schools fell in this
category. Faith Based Schools who comprised of 1(50%) were operating on over
Ksh. 150,000/= per year and the other half 1(50%) of the Faith Based Schools were poorly
funded, operating with an annual budget of less than Ksh. 50,000/=. The possible explanation
why public sponsored centres operated on an annual budget of over 150,000 was because of
high enrolments and thus high collections. Parents are able to pay because ECD committees
decide on the amount to pay taking into account the parents’ income level (MOEST2005).
Collections would be hundred percent. However it is worth noting that in spite huge budget
performance in public schools was below average (Table 4.4, 4.5, 4.6, and 4.7). Probably
auditing done was questionable (Table 4.13). In community schools parents are more
concerned about their children’s welfare and would ensure all fees are paid for maximum
provision of resources. This confirms report by (ESSA, 2011) that most community members
are deeply concerned about education and are willing to contribute to efforts to improve and
expand local schools. It is also disturbing that in spite of the huge collections, performance in
these community schools is wanting. The case goes to Faith based schools. Collection was 50
%(N=l). Religion plays major and multiple roles in education and schooling (Tietjen 2000).
The Private schools spent more funds so as to have high quality facilities and resources in
31

order to attract more children hence make more profits as they among profit making
companies (Oxfam International, 2006.)
4J.2.5 Financial Management - Head teachers' financial management Skills
The manager is expected to be in full charge o f the ECDE center including financial
resources. One o f the aspects of management is financial management. The head teacher is
supposed to have some basic skill of book-keeping and financial control. All head teachers
are normally promoted from the pool o f teacher, yet it is documented that the teacher training
colleges do not train on such management skills. The researcher therefore wanted to establish
if the head teacher went for refresher courses to sharpen their financial skills. O f particular
interest was which sponsor was keen on having a skilled head teacher. The results of this are
shown in the cross Table tabulation in table 4:13
Table 4.13: financial management training and sponsor of the school
Financial
Management
Training
Attendance
Public
Schools
Frq %
Private
Schools
Frq %
Community
Frq %
Faith Based
Frq %
Total
Frq %
Yes
N o
T otal
2 100.0
0 .0
1 100.0
3 5 0 .3
3 5 0 .3
6 100.0
2 100.0
0 .0
2 100.0
2 100.0
0 .0
2 100.0
8 7 2 .7 %
3 2 7 .3 %
11 100.0%
Source - survey data 201
In reference to table 4.13, (8)72% o f the respondent headteachers indicated that they had
attended a refresher course o f financial management. All the head teachers from the public
sponsored schools, the Community and Faith Based Schools had attended the course. This
contradicts (Wanderi, (2008) and (2005) who suggested these skills are not present in the
administration o f many public school (Wanderi; 2008) Ogembo (2005). In the private
schools, 50 %( N=3) had attended course on financial management while 50 %( N=3) had
not. This could be due to the reason that private schools are private firms and may avoid
32

auditing to evade income tax department or the mere fact that mostly they are run by non
professionals for commercial purposes and may be ignorant o f financial management skills.
Which would help them in maintaining book of accounts and seal loops that would create
loses in their firms.
4.3.2.6 Financial management - Audit of Financial records
Prudent financial management calls for regular audit of the books of accounts o f the school.
This would show whether the school funds are used properly or not. On the background of
who the sponsor o f the school was, the researcher wanted to establish if audits were being
conducted and if so, by whom.
Table 4.14 : Financial management - Audit of Financial records
Financial Public Private Community Faith Based TotalRecords Auditing Schools Schools
Frq % Frq % Frq % Frq % Frq %
D SA 2 100.0 0 .0 1 50 .0 0 .0 2 18.2
In terna l A u d ito r 0 .0 3 5 0 .3 0 .0 0 .0 3 27 .3
P a rt- tim e A u d ito rs 0 .0 1 16 .7 1 50 .0 0 .0 2 18.2
N o A u d it in g 0 .0 2 3 3 .3 0 .0 2 100.0 4 36 .4
T otal 2 100.0 6 1 0 0 .0 2 100.0 2 100.0 11 100.0
Source - survey data 2012
From table 4.14 , the Faith based ECDE centers did not do any financial audit at
aIl.Thescomprised2(loo%).s Private schools ,3(50%) conducted internal audit , while
33.3%(N=) of the Private schools did not conduct any audit at all. The public schools had
2(100%) audited by DSA. However in spite of auditing being carried out, performance in
public schools as below average (Table 4.4, 4.5,4.6, and 4.7) It is likely that figures were just
quoted to cover up the true picture on the ground. Probably auditing as shown in the table
was not real and if conducted it is likely that the DSAs involved were unscrupulous officers
who were corrupted and thus allowed misappropriation of funds or manipulation of books of
accounts. According to (Education Act, 1968) in the public primary schools, the SMC are
mandated to audit and regulate expenditure by the administration to ensure that all income
received by the school is applied to the promotion of its objects. The head teachers might
have realised that they lack necessary skills and opted to seek professional help or felt
involving SMC would deny them a chance to have a share o f the fee collected! This concurs
with (Clark:2008;278) remarks that selected members of the (governing) body may be ill-
33

equipped. The Faith Based schools were least financially managed probably due to lack of
avenues to question the religion leaders - would be questing the spiritual fathers which is
usually against church doctrines and may to ex-communication o f church members making
them turn a blind eye to such matters. This contravenes Education Act which states that
BOG are mandated to audit and regulate expenditure by the administration to ensure that all
income received by the school is applied to the promotion o f its objects (Education Act 1968
Cap 211).
4.3.2.7 Physical Resource Management - Adequacy of Classes
The manager of the ECDE has the responsibility o f allocating the scare resources to ensure
that all areas are sufficient funded in line with the systems approach to management. One of
the areas is the development of physical facilities/infrastructure like classrooms. The
researcher asked the respondents to indicate their opinion on how they agreed with the
adequacy of the classrooms in the school, on the background o f who the sponsors of the
ECDE centre were.
Table 4.15: Number of Classes and School Sponsorship
N u m b e r o f C la s se s is P ub lic P riv a te C o m m u n ity F a ith T o ta l
A d e q u a te S c h o o ls S c h o o ls B a se d Frq %F rq % Frq % Frq % F rq %
S tro n g ly A g ree 0 .0 4 8 0 .0 1 50 .0 0 .0 6 54 .4
A g ree 0 .0 1 2 0 .0 1 50 .0 1 50.0 3 27 .3
D isag ree 0 .0 0 .0 0 .0 1 50 .0 1 9.1
S tro n g ly D isag ree 2 100.0 0 .0 0 .0 0 .0 1 1.9
T otal 2 100.0 5 1 0 0 .0 2 100.0 2 100.0 11 100 .0
Source - survey data 2012
The table vividly shows 6(54.4%) o f the respondents strongly agreed that the classrooms
were adequate. All the Private schools and community schools had adequate classes with
4(80.0%) strongly agreed whilel (20.0%) agreed. The high percent in private schools could
be because they are profit making centres (Oxfam International, 2006) and thus strive to
create a conducive environment to attract more ‘customers’. Managers in private schools
might also have realised that small classes were easier to manage. This is in conformity with
Blatchford 2003; Good and Brophy 2003; Hattie 2002) suggestions that teachers working
with fewer pupils are able to correct tasks and provide feedback more frequently and are able
to cover the curriculum more in depth than in larger classes .The Classrooms were not
34
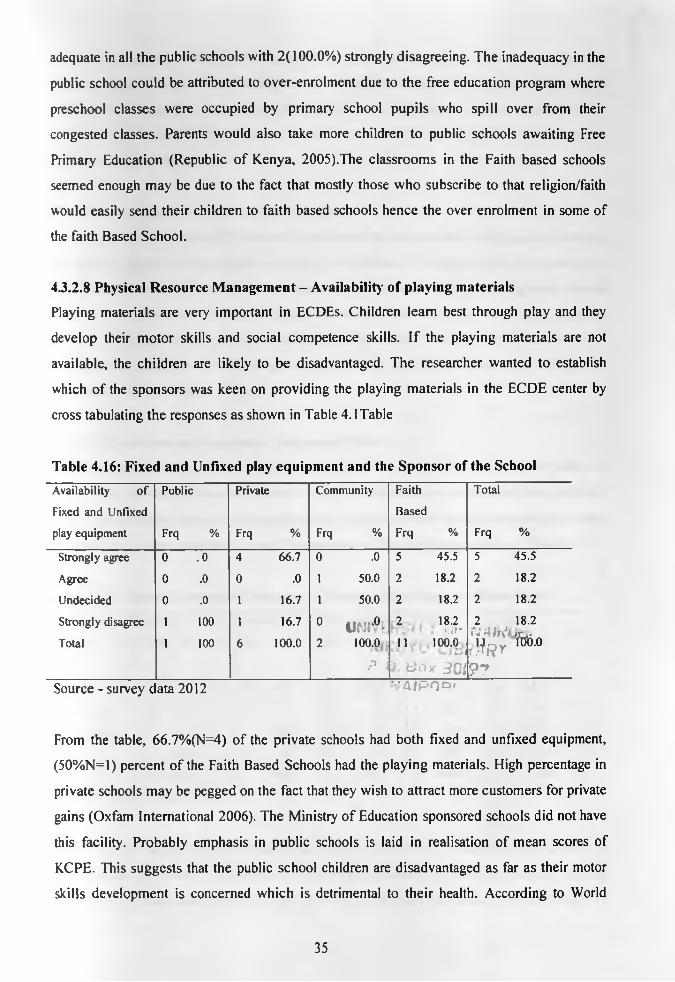
adequate in all the public schools with 2( 100.0%) strongly disagreeing. The inadequacy in the
public school could be attributed to over-enrolment due to the free education program where
preschool classes were occupied by primary school pupils who spill over from their
congested classes. Parents would also take more children to public schools awaiting Free
Primary Education (Republic of Kenya, 2005).The classrooms in the Faith based schools
seemed enough may be due to the fact that mostly those who subscribe to that religion/faith
would easily send their children to faith based schools hence the over enrolment in some of
the faith Based School.
4.3.2.8 Physical Resource Management - Availability of playing materials
Playing materials are very important in ECDEs. Children leam best through play and they
develop their motor skills and social competence skills. If the playing materials are not
available, the children are likely to be disadvantaged. The researcher wanted to establish
which of the sponsors was keen on providing the playing materials in the ECDE center by
cross tabulating the responses as shown in Table 4.1 Table
Table 4.16: Fixed and Unfixed play equipment and the Sponsor of the School
A v a ila b ility o f P u b lic P riva te C o m m u n ity F a ith T o ta l
F ixed a n d U n fix e d B a s e d
play e q u ip m e n t F rq % Frq % Frq % F rq % F rq %
S tro n g ly ag ree 0 . 0 4 6 6 .7 0 .0 5 45 .5 5 4 5 .5
A g re e 0 .0 0 .0 1 50 .0 2 18.2 2 18 .2
U n d e c id e d 0 .0 1 16 .7 1 50 .0 2 18.2 2 18.2
S tro n g ly d isag ree
T o ta l
1
1
100
100
16
16 .7
1 0 0 .0
0
2llPJlffc
100.0211
18.2' l<t~100.0
i D 1
2N 4 lr\J $ R Y
18.2
Vb&.o
p Jj. B o x 301 9 7Source - survey c ata 2012 M 4IP OP»
From the table, 66.7%(N=4) of the private schools had both fixed and unfixed equipment,
(50%N=1) percent of the Faith Based Schools had the playing materials. High percentage in
private schools may be pegged on the fact that they wish to attract more customers for private
gains (Oxfam International 2006). The Ministry of Education sponsored schools did not have
this facility. Probably emphasis in public schools is laid in realisation of mean scores of
KCPE. This suggests that the public school children are disadvantaged as far as their motor
skills development is concerned which is detrimental to their health. According to World
35

Health Organization (WHO), (1946), health in its broader sense is “a state o f complete
physical, mental and social well-being and not merely the absence of disease or infirmity. It
is disturbing to observe that public schools lack such facilities yet funds accrued in fees
collection for annual budget is over 150,000/=(table4.12), raising further questions on
auditing by DSAs (Table4.13)
4.3.2.9 Curriculum and Instructional Management
One of the core businesses of the school is to deliver the curriculum - teaching and covering
the various aspects of the education program or syllabus. The head teacher is expected to
ensure that the teachers do their work as expected. This is done through keeping some records
of how they do their work. This is through the use o f schemes of work, lesson plan, checking
pupils’ books, and pupils progress records. The researcher wanted to find out how the
curriculum is managed by analyzing the records kept by the teachers. The findings are
presented in the subsequent sections
43.2.10 Curriculum management - Schemes of Work
Teachers are expected to prepare and use schemes o f work in teaching. A scheme o f work is a
plan of how the teacher intends to cover the topics as stipulated in the syllabus in a particular
term. The researcher asked for and analysed the schemes o f work that the teachers were using
and rated them from excellent to poor. The summary of the findings is given in Table 4.17.
Table 4.17: Remark on availed Schemes of Work and the Sponsor of the school
A v a ila b ility
sch em es
w ork
o f
o f
P u b lic
F rq %
P riv a te
Frq %
C o m m u n ity
Frq %
F a ith
B a se d
F rq %
T ota l
Fq r %
E x ce lle n t 0 .0 3 6 0 .0 2 100.0 0 .0 6 5 4 .5
V ery G o o d 0 .0 0 .0 0 .0 1 5 0 .0 1 9.1
Fairy G o o d 0 .0 2 2 0 .0 0 .0 0 .0 3 27.1
Poor 2 100.0 0 .0 0 .0 1 50 .0 1 9.1
T otal 2 1 0 0 .0 5 1 00 .0 2 100.0 2 100.0 11 1 00 .0
Source - survey data 2012
From the table slightly above a half o f the schools , 6(54.5%) - had excellent schemes of
work. About two thirds - 3(60.0%) - of the Private schools had excellent schemes all the
Community schools had excellent schemes with2 (100.0%).Faith based schools 50%(N=1)
36

rated very good and 50%(N= 1 )poor. The Public sponsored schools were extremely poor in
availability of schemes of work at 100%(N=2). This suggests that there was good curriculum
supervision in the private and community schools. This goes to explain why the private
schools perform well in national examinations and public always leading from behind! This
is disturbing because according to according to Kwakwa (1973) the head teacher is a key
person in any education system. He takes care of the final arrangements o f the education of
students in a school. This not the true picture in public schools where head teachers are
highly qualified and expected to be more productive in their work.
4.3.2.11: Curriculum management - Lesson plan
The lesson plan is a tool that the teacher uses to order their steps in the actual teaching in
class. It outlines the teaching methods and the learning aids that will be used. This makes the
teacher to have a compass of how to go about the lesson coverage. The researcher therefore
wanted to establish if the schools used the lesson plan in their teaching. The teachers were
asked to avail their lesson plans then the researcher rated them. The findings are given in
table 4.18
Table 4.18: Remark on Availed Lesson Plan and the Sponsor of the School
A v a ila b ili ty o f L esso n P la n s
P u b lic S c h o o ls
F rq %
P riv a teS c h o o lsFrq %
C o m m u n ity F rq %
F aith B a se d F rq %
T o ta l F rq %
E x c e lle n t 0 .0 3 6 0 .0 0 .0 0 .0 4 3 6 .4
V ery G o o d 0 .0 0 .0 1 50 .0 1 50 .0 2 18.2
F a iry G o o d 0 .0 1 2 0 .0 0 .0 1 50 .0 2 18.2
P o o r 1 100.0 1 20 .0 1 50 .0 0 .0 3 2 7 .3
T o ta l 1 100.0 5 100.0 2 100.0 2 100.0 11 100.0
Source - Survey data 2012
The table shows that only 4(36.4%) percent of the schools had excellent lesson plans, and
2(18.2%) percent had very good lesson plans. The Private schools had excellent lesson plans
(60%N=3), 50%N= 1 percent of the Faith Based Schools and Community schools had very
good lesson plans. The Ministry of Education sponsored schools had poor lesson plans.
Again this goes to prove why the private schools lead the rest in national examinations as the
curriculum supervision aspect of school management. It shows that head teachers were not
playing their roles as managers as it was expected according to (Brunet and Boudreaslt 2001)
conjectures that the head teacher acts as a manager-head teacher who is active in the field of
management of resources and management of people in technical use.
37

4.3.2.12: Curriculum management - Checking children's books
The teachers are expected to check the pupils’ books so as to provide feedback on how they
are fairing in class. Checking books also enables the teacher to identify grey areas and
provide for remedial teaching. The researcher asked for the pupils’ exercise books and rated
how the teachers marked the books. The results are presented in Table 4.19.
Table 4.19: Remark on children’s book and sponsor of the school
R e m a rk on
C h i ld r e n 's
B ook
P u b l ic S c h o o ls
F rq %
P riv a te
S c h o o ls
F rq %
C o m m u n ity
S ch o o ls
F rq %
F a ith B ased
S c h o o ls
F rq %
T otal
Fqr %
G o o d 0 .0 2 4 0 .0 1 50 .0 1 50 .0 4 3 6 .4
F a ir ly G o o d 2 100 .0 2 4 0 .0 1 50 .0 1 50 .0 6 5 4 .5
P o o r 0 .0 1 20 0 .0 0 .0 1 1.9
T o ta l 2 100.0 5 1 00 .0 2 100.0 2 100.0 11 1 0 0 .0
Source - survey data 2012
In accordance to table4.19 above, out of the 11 schools none had been rated as either
excellent or very good in checking the books. Only 4(36.4%) o f the schools had been rated as
good. These included 2 (40%) of the private schools and 2(50%) of both community and
Faith Based Schools were in this category too. 6(54.5%) percent of the schools were rated
fairly good. It shows there was keenness in monitoring o f teacher performance in these
schools. This explains why the Ministry of Education sponsored schools are always last in
national examination. More so teachers’ morale in work could be low due to poor payments
(table 4.3). This concurs with research by (Herzberg, Mausner, & Snyderman, 1959) which
suggested that motivator or intrinsic factors, such as achievement and recognition, produce
job satisfaction which these teachers could definitely be lacking.
4.3.3 To establish the level of involvement of parents and community in the
management of the ECDEs and learning achievement
The researcher had also wanted to establish how the schools involved other stake holders in
the running of the schools. This is because research has shown that schools which involve the
parents and the community in managing the schools perform better in examinations and the
general discipline o f the school. The researcher therefore set out to establish the level of
involving the school the community in different aspects of school management juxtaposed on
38

the type of sponsor o f the school. Some statements regarding involvement were made and the
head teachers were required to state how they agreed to them.
4J.3.1 Involvement of Parents in Decision Making
The head teachers were asked to indicate how they agreed to the statement that ‘parents’
views are sort in decision making in matters of improving the school’. The responses are as
shown in Table 4.20
Table 4.20: Parents’ views are sort in decision making in matters of improving the
school and the school sponsorR esp o n ses P u b lic
F rq %
P riv a te
F rq %
C o m m u n ity
F rq %
F aith
B a se d
F rq %
T o ta l
F rq %
S trong ly 0 .0 3 67 .7 2 100.0 2 1 0 0 .0 8 72.7
A gree
A gree 2 1 0 0 .0 2 33 .3 0 .0 0 .0 3 27.3
T otal 2 1 0 0 .0 5 100.0 2 100.0 2 1 0 0 .0 11 100.0
Source - survey data 2012
The table shows that out of 11 respondent head teachers in the study were in agreement that
the community was involved in decision making. O f these 8(72.7%) strongly agreed while
3(27.3%) just agreed. This suggests that most schools enlisted the support o f the stake
holders in managing the schools. This confirms (ESSA, 2011) that most community members
are deeply concerned about education, and are willing to contribute to efforts to improve and
expand local schools.
4.3.3.2: Community Involvement in Maintaining Discipline in the School
The head were asked to indicate how they agreed on the statement that ‘the community is
involved in maintaining high standards of discipline in the school. The head teachers
responded as captured in Table 4.21
39

Table 4.21: Community’s Involvement in maintaining discipline in school and school’s
sponsorship
R esponse P u b lic
F rq %
P riv a te
F rq %
C o m m u n ity
F rq %
F a ith B a se d
F rq %
T o ta l
F rq %
S trong ly
A gree
1 100 .0 2 33 .3 2 100.0 2 1 0 0 .0 7 6 3 .6
A gree 0 .0 1 16.7 0 .0 0 .0 I 1.9
D isag ree 0 .0 2 33.3 0 .0 0 .0 2 18.2
S tro n g ly
D isag ree
0 .0 1 16.7 0 .0 0 .0 1 9.1
T o ta l 1 100.0 6 100.0 2 100.0 2 1 0 0 .0 11 1 0 0 .0
Source - Survey Data 2012
From the 63.6 %( N=7) s o f the respondents strongly agreed that they involved the
community in maintaining discipline in the schools. However, 50(N=3) o f the private schools
did not agree to this statement. This confirms the public view that some private schools are
not open to the community because they are individual commercial enterprises with no share
holding hence they are operated as private business or parents are not aware of their roles in
the schools. This is in acceptance with both Ngidi (2004) and Mkhonto (1998) suggestions
that the community is not highly involved because parents do not understand their role as
School Governing Body (SGB) members and their training was also limited. It is also likely
that the selected members of the (governing) body may be equally, ill - equipped for the task
[(Clark; 2008; 278)].
40

CHAPTER FIVE
SUMMARY,RECOMMENDATIONS AND CONCLUSIONS
5.1 Introduction
This chapter presents the summary o f the findings as obtained from the analysis. The
summary then leads to the recommendations and the recommendations for further study.
Finally it closes with conclusions.
5.2 Summary of Findings
The research study was conducted Bamburi zone o f Mombasa municipality in Kenya. The
study was set to establish the influence o f preschool management on learning achievement in
preschools particularly sponsorship, management practices and the level of involvement of
stakeholders in the management of the ECDEs and its relationship to learner achievement.
The key sponsors were established as Publicschoolsl8.1%(N=2),Privateschools45.8%(N=5)
,Community schools 18.2%(N=2) and Faith-Based schools (18.2%(N=2) and qualifications
o f the ECDE teachers slightly more than a half, 54.5%( N=6) o f the teachers had Diploma in
ECDE teaching and 45.5%(N=5) of the teachers had Certificate in ECDE. In terms o f salary
27.3%(N =3) of the teachers was paid less than Ksh 4,000/= per month, about a half o f the
respondent teachers - 45.5 %( N =5) were paid between 4001/= and 6000/= while
27.3%N=3was paid above 9000/=.
The study showed that in performance o f the three domains ,namely, cognitive, affective and
psychomotor, in cognitive domain public schools had the least learner achievement of a
(mean=J0.82) in Language and (14.80) in Mathematics while private schools led in
Language with a (mean = 22.3) and faith -based schools topped in Mathematics with a (mean
= 21.2). Total score in both tests was 25 marks.
Affective Domain - Social competence - sharing: 24 %(N=38) of the children performed at
the level o f ‘Excellent’. Of these, the Faith Based Schools contributed 12(7.5%) followed by
the Private schools at 11(6.8%) and 6(3.7%) were community schools. In the level of poor
there was 9%(N=15). Out of these private schools contributed the most with9 (5.6%) falling
in this group. In the same domain - Cooperation with others: 75(46.5%) o f the pupils scored
an ‘Excellent” or ‘Very good’ on cooperation with others. The Private schools led with
36(22.2%) contribution, followed by the Faith Based Schools and community schools who
41

both had 8.1%(N=13) The private schools were also the poorest in cooperation among the
children with 10(6.5%) in this group.
In Psychomotor Domain - Coordinating eyes and hands: 25(21.2%) of the children scored
either “Excellent' or “Very good’. O f these, 18(11.25%) were from the private schools
followed by 6(3.8%) from the Faith Based Schools. The public sponsored schools were the
worst. Out of the 40 children from the public sponsored schools, 13(8 .5%) of them scored
‘Fairly good’ and “Poor. In motor domain - Balancing with one leg: 86(56%) o f the pupils
scored ‘Excellent’ and ‘Very good’, 29(18%) were public sponsored schools followed by
28(12.5%) from the Private schools, 15(13.75%) faith based schools and 14(8.72%) from
community schools.
In human resource management - Teacher Compensation: the research study established that
27.3 %( N=3) of the respondent teachers were poorly paid, below KSh. 4,000/= while 1(50%)
percent o f the teachers in the Faith Based Schools and Community schools were in this
category. In the private schools 33.3 (%N=2) of the teachers and 50 percent of the teachers in
Faith Based Schools were paid over 9,000/=. In the level o f teacher motivation: Teachers
who were lowly paid were less enthusiastic about their work hence they didn’t give the pupils
quality work. The teachers who had excellent as a remark on the quality of the work they
gave earned over Ksh. 9,000/= per month. In professional growth: it was established that
public schools were regular in taking their teachers for refresher courses once per term whilst
private schools were the most irregular as they their teachers sometimes once per term, once
per year or twice per year.
In financial management - Annual ECDE Budget of the Center: 54.5%(N=7) o f the ECDE
centers were operating with an annual budget of over than KSh. 150,000/=. The public
schools and Community sponsored schools 2(100%), 2(40%) of Private schools and 50
percent o f the Faith Based Schools were operating on over Ksh. 150,000/= per year.
Financial Management - Head teachers’ financial management Skills: 72%(N=7)of head
teachers had attended a refresher course o f financial management. All the head teachers from
the Ministry of Education sponsored schools, the Community and Faith Based Schools had
attended the course. 50 percent of the head teachers from the Private schools had never
attended any course on financial management. In auditing o f financial records: Faith based
ECDE centers did not conduct any financial audit at all! 50 %(N=3)of the Private schools
42

conducted internal audit, while 33.3 percent o f the Private schools did not conduct any audit
at all. The Ministry o f Education sponsored schools and some community schools had their
accounts were audited by the District Schools Auditor (DSA).
In physical resource management the study established the classes were adequate with 81.8 %
( N=9) o f the respondents being agreement. All the Private schools and community schools
had adequate classes. However Classrooms were not adequate in all the public schoolswith2
(100%) strongly disagreeing. With availability o f playing materials: 66.7%(N=) of the
private schools had both fixed and unfixed equipment, 50%( N= 5)ofthe Faith Based Schools
had the playing materials. The Ministry of Education sponsored schools did not have this
facility. In reference to curriculum and instructional management - Schemes of Work:
54.5%(N=6) had excellent schemes of work. About two thirds - 60 %(N= 3) o f the Private
schools had excellent schemes all the Community schools had excellent schemes. The public
sponsored schools had fairly good schemes while 2(100%) percent had poor schemes of
work. In Lesson plans: 36.4 %(N=4) o f the schools had excellent lesson plans, and 18.2
%(N=2) had very good lesson plans. In the Private schools60 %(N=3) had excellent lesson
plans, 50%(N=1) o f the Faith Based Schools and Community schools had very good lesson
plans. The public sponsored schools had poor lesson plans. In the checking children’s books,
no school had been rated as either excellent or very good in checking the books. 40%(N=2)
o f the private schools and 50 % (N=l)of both community and Faith Based Schools had been
rated as good. In Involvement of Parents in Decision Making: All the head teachers in the
study were in agreement that the community was involved in decision making. O f these 72.7
%(N=8) strongly agreed while 27.3 %(N=3) just agreed and finally in community
involvement in maintaining discipline in the School: 63.6 %(N=7) o f the respondents
strongly agreed that they involved the community in maintaining discipline in the schools but
50%(N=3) of the private schools did not agree to this statement.
5J Recommendations
Based on the study findings the researcher recommends that thorough supervision should be
conducted in ECDE centres to establish the root cause of poor performance this being the
foundation of learning to higher levels o f education. There should be serious auditing in all
the ECDE centres for transparency and accountability to ensure that all funds collected from
the public give back quality services to the community. The government should consider
employment of ECDE teachers who are neither here nor their in all cadres o f government
43

employees yet a lot o f resources are channelled to their training. The government should also
come up with guidelines for ECDE teachers’ remuneration to protect them from being
exploited by unscrupulous employers who overwork them and pay them meagre salaries.
5.4 Suggestions for further research
From this study, some gaps have been established which lead to suggestions for further
research in financial management, teacher motivation and supervision in ECDE centres.
5.5 Conclusions
In conclusion the study established that there is good performance in private schools probably
because they are profit making firms and thus keen in attracting and maintaining ‘customers’
in their schools while performance in public schools is the worst probably due to disconnect
in management as the head teacher o f the primary school is also in charge o f the ECDE
centre and might to neglect it due to too much pressure in realisation of high mean scores in
KCPE exam. However, parental involvement was highly rated in public schools probably
because they were more open to them than private schools which were individually owned
and thus run without much consultation from parents.
44

REFERENCES
Ayot. H.O, and Briggs, H. (1992). Economics o f Education. Nairobi; Educational
Research and Publications.
Barnard, J. (1999). Using total quality principles in business courses: The effect on student
evaluations. Business Communication Quarterly, 62(2), 61-73.
Blatchford, (2003). The class size debate: Is small better? Maidenhead: Open University
Press.
Bloom, B. S., Hastings, J. T., & MaYordaus, G. F. (1971). Handbook on formative and
summative evaluation o f student learning. New k: McGaw-Hill.
Boreham, C. and Riddoch (2001). The physical activity, fitness and health o f children.
Journal of Sports Science, 19, 915-929.
Bredekamp , S. (1987). Developmentallv Appropriate Practice in Early Childhood Programs
Serving Children from Birth through Ages. Washington, D.C: National Association
for the Education of Young Children.
Brunet, L & Boudreault R (2001); Empowerment at leadership des directions decole: Un
atout pour une politique de decentralization (Empowerment and leadership in school
management: an asset fo r a decentralization, Education et francophone, volume xxix,
No, 2 Autumn.
BuIlock,C.(2007).77/e relationship between school building conditions and student
achievement in the middle school level in commonwealth o f Virginia. Ret rived
July,2008://Scholar.lib.vt.ed/theses/available/etd-08212007-163313
Bush, T. (1995). Theories of educational management: Second edition. London: Paul
Chapman.
Canberra preschool society, (2007). Annual Report. ISBN 1835-744
45

Cheboi’, S. (2010). ‘ ‘Blow to Nursery Public School Plan as Uhuru Fails to Give Cash
Nation" Daily Newspaper. 4th July, 2010, page 17, column 2
Chitiavi, M.J., 2002. Guidance and Counseling Series -School administration. Nairobi:
Kenya Pavement Publishers
Clarke, G. (2008): Handbook of School Management Cape Town; Macmillan
Downey, C.J., Frase E.L.& Peters, J.J.(1994). The Quality Education Challenge. California:
Corwin Press
Dieltens, V. and Enslin, P. (2002). Democracy in education or education in democracy: the
slimits o f participation in South Africa school governance. Journal o f education, issue
28
Eshiwani,G.(1993). Implementing education policies Kenya since independence. Nairobi,
Kenya: East African Education Publishers.
Etindi, KA (2000), A case study of the factors that impede and affect effective inspection and
supervision o f primary schools in Khwisero Division o f Butere Mumias District of
Western province in Kenya. Unpublished M.E D. Dissertation, Kenyatta University.
Ferns, H.S. (1982). How much Freedom for universities? Towards independence universities.
London: Institute of Economic Affairs.
Filardo,M.(2008).Goo<7 buildings, better schools: An economic stimulus opportunity with
long-term benefits. Retrieved May 2008,
from ://www. Ssharedprosperity.org/bp216/bp216.pdf
Finn, J.D AND Achilles, C.M (1990). Answers and questions about class size. A statewide
experiment. American Educational Research Journal, 27, 557 - 577.
Fraenkel R.J. and Wallen, E.N (1993). How to Design and evaluate Research 4th Edn;
Illinois: F.E Peacock Publishers, Inc.
46

Gakuru, O. N., Riak, P. F„ Ogula, P. H., Mugo, R., & Njenga, A.W. (1987). Evaluation o f
NACECE-DICECE Programme—Part One: Research findings and recommendations.
Nairobi, Kenya: Kenya Institute o f Education.
Gewirtz S & Ball S (2000). From “welfarism ” to “new managerialism shifting discourses
on school headship in the education market p lace . Discourse: Studies in the cultural politics
of education, 21:253-268.
Good, T. and J. Brophy (2003). Looking in classroom (9th edition). New York; Macmillan.
Goelman.H. (2003) Early Childhood Education. In I.B. Weiner (Ed.) Handbook of
Psychology Vol.7 New York.Wiley.
Glass, And Smith, M. (1978). Mega analysis of research on the relationship of class and size
and achievement. Beverly Hills, CA: Sage
Golafshani, N. (2003) ‘UnderstandingReliability and Validity in Qualitative Research’, The
Qualitative Report 8(4): 597-607; at: www.nova.edu/sss/QR/QR8-4/golafshani.pdf
(accessed 8 May 2006).
Hallie, J. 2002. Classroom composition and peer effects. International journal of Educational
Research 39(5); 449-4481.
Herzberg, F., Maunser, B. and Snyderman, B.
(1959), The Motivation to Work. John Wiley and Sons Inc., New York, NY.
Hopkins, D. (1987) Improving the quality o f schooling: Lesson from the OECD international
School improvement project. New York: Falmer Press.
Indoshi FC (2001). Towards a model for in-service Education and Training of Teachers in
Kenya Maseno J. Educ. Arts Sci. 4 (4): 17-27.
47
Ipaye, B. (1986). Continuous assessment in schools with some counselling implications.
Ilorin: University of llorin Press
Iyewarun, S. A. (1986). Traditional methods o f examination: Need for a revision. Journal Of
Science Teachers Association of Nigeria, 17(3), 146-161.
Johnson, R. & Winchell, W. (1990) Management and quality. Milwaukee, Wl: American
Society for Quality Control.
Jones (ed): (2000); KZNDOE: School Fund Departmental Regulations', Durban; Media in
Education Trust.
Joppe, M. (2000). The Research Process. Retrieved December 16, 2006,from
http://www.ryerson.ca/~mjoppe/rp.html4. Kirk, J., & Miller, M. L. (1986). Reliability
Kwakwa M (1973). “ Is the School Principal an Educational Leader or an
Administrator?” J. educ. 4(1): 10.
Kanji G. K., & A. Tambi, A. M. (1998). Total quality management and higher education in
Malaysia. Total Quality Management, 9(4/5), 130-132.
Kanji G. K., & A. Tambi, A. M. (1999). Total Quality Management in UK higher education
institutions. Total Quality Management, 10(1), 129-153.
Kemper, H.C.G. (2000). Physical activity and bone health. In Armstrong, N. and Van
Mechelen, W. (eds), Paediatric Exercise Science and Medicine, pp 265-272, Oxford:
Oxford University Press
Kombo, D.K. and Tromp, D.L.A.(2006). Proposal and Thesis Writing: An Introduction;
Paulines Publications Africa
Konchar, S.K. (1988). Secondary School Administration New Delhi: Sterling Publishers ltd.
48
Littlejohn SW (1983). Theories of Human Communication. Belmont: Wadsworth publishing.
Company.
Ludwig Von BertanlafTy (1968). General system theory. Foundations, Development,
Applications New York: Gorge Braziller.
McGrath, 1 (2000): Teacher autonomy. In Sinclair, B; McGrath, 1 & T. Lamb (eds), Learner
autonomy, teacher autonomy, London Longman. McGrath, 1 (2000): Teacher
autonomy. In Sinclair, B; McGrath, 1 & T. Lamb (eds), Learner autonomy, teacher
autonomy, London Longman.
McGregory Douglas (1960). The Human Side of praise. New York: Me Graw - Hill.
Millette, A. (1988). Tes/Kelle Lecturers on Educational Leadership” A Lecture given on 3
June 1988.
Moran,D. and Batley, R, 2004. Literature Review o f Non-State Provision o f Basic Services
, DFID/University o f Birmingham, s Birmingham.
Morphel, E.L. ,Johns, R.L.,and Reller, L.R. (1974). Educational Organization Administration
Concepts, Practices and Issues, New Jersey:Pr-Hall Incorporated, Englewood Cliffs
Murgatroyd, Stephen and Morgan, Colin (1993) Total Quality Management and the School,
Open University Press, Buckingham and Philadelphia
Museveni, Y.(2008)46thindependenceAnniversaryofUganda(AccessedFebruary2009,from:htt
pi//www.Statehouse.go.ug/news.php?catld=2$$$item - 368.
NASPE (National Association for Physical Education (2002). Active Start, A Statement of
Physical Activity Guidelines for Children Birth to Five Years, Reston, VA:
AAHPERD
Ngidi ,D .P. (2004). Educators’ perceptions of the efficiency o f school governing bodies.
South Afr. J. Educ. 24: 260 - 263.
49
Ntshangase. D.M. (2002). School governing bodies from the perspectives o f the rural parent
governors and school principals in the Vrvheid Region. Unpublished thesis.
University o f Stellenbosch.
Ogembo, P.O. (2005). Training needs of Heads of Department o f Secondary Schools for
Effective Curriculum Implementation in Kenya: A case o f Eldoret Municipality.
Unpublished M. Phil Thesis
Orodho, A.J. (2003). Essential of Education and Social Sciences Research Methods. Nairobi:
Masola Publishers.
Okon, S.E.(1986). Guidance for the 6-3-3-4 system o f education: A new
approach. Ibadan: University Press Ltd.
Oxfam International. (2006). Kicking the Habit: How the World Bank and the IMF are still
addicted to attaching economic policy conditions to aid. Oxfam Briefing paper, November.
Oyesola, G. O. (1986). Continuous Assessment: Some characteristics o f a scheme and its
organisational implications. Journal o f Teacher Education, 2(1), 177-191.
Pandey, l.M. (1995). Financial Management. New Delhi: Vikas Publishing House PVT
Limited.
Piaget, J. (1954) Intelligence and ajfectivity: Their relationship during child development,
Palo alto, CA: Annual Review, Inc.
Republic of Kenya (1988). Report o f the presidential working party on Education and
manpower training for the next Decade and Beyond. Nairobi: Government printer.
Republic of Kenya (1999). Totally integrated Quality Education and Training TIQET
Republic of Kenya (2005),UNESCO/OECD. Early Childhood Policy Review Project. The
Ministry of Education, Science and Technology.
50
Republic of Kenya (2006). Early Childhood Development Service Standard Guidelines. For
Kenya. Government Printers.
Republic of Kenya. ( 1964).77?e Education (Board o f Governors) Order, Nairobi: Government
Printers.
Republic of Kenya. (1967). The Teachers Service Commission, CAP 212 o f Laws o f Kenya.
Republic of Kenya. (2009). Education Act 1968 (Rev. Ed.) Nairobi: Government printers.
Republic of Kenya. Sessional paper No. 1 of 2005.
Republic of Kenya(2005), UNESCO,/FPE. The Success o f Free Education in Kenya. The
Ministry of Education, Science and Technology.
Republic of Kenya. (2010-2011). UNESCO National Education Sector Support Strategy .
Republic o f South Africa. (2005). Grade 6 intermediate phase systemic evaluation Report.
Pretoria: Government Printer.
Rose. (20002). Is the Non-State Education Sector Serving the Needs o f the poor? Evidence
from East and Southern Africa. Paper prepared for DFID Seminar in Preparation for The
2004 World Development Report.
Rutter, M., B. Maugham, P. Mortimer and A. Smith, (1979). Fifteen thousand hours in
secondary schoolsand their effects on children. Cambridge Havard University U.S.A.
Santrock, J.W. (2004).Educational Psvchology(2nd ED.) New York: McGraw-Hill
Singh P, Mbokodi SM, Msila VT (2004). Black Parental Involvement in Education. South
Afric J. Educ.,,24: 245 - 322.
Sushila, B., 2004. Management and evaluation o f schools. Nairobi: Oxford University Press,
East African Ltd.
51

Tietjen, K.(2003). The Bangladesh Primary Education Stipend Project: A Descriptive
Analysis. Partnership for Sustainable Strategies on Girl’s Education.
Wanderi, C. (2008). Failing Management in Kenyan Schools. Nairobi, Kenya.
Wanzare, Z.O. (2006). Rethinking school inspection in the Third World: The case http:www.
Ualberta. Ca. ckreberpaperszak. Utm: retrieved 6/8/2006.
Weihrich, H. and H. Koontz, (1993).Management: A Global Perspective, 10th ed., McGraw-
Hill, New York, NY.
Wekesa,G.W; (1993). The impacts of Head teachers Instructional Leadership on student
Academic Achievement in Kenya. Unpublished ph. D. Dissertation Teachers college,
Columbia, Columbia University
Woodhall, M. (1987b) Establishing student loans in developing countries: some guidelines.
New York: World Bank.
World Health Organization. 1946. WHO definition of Health, preamble to the constitution of
the World Health Organization as adopted by the International Health Conference,
New
York, 19th 22 June 1946, signed on 22nd July 1946 by the representatives o f 61 states
(official records o f the World Health Organization, No. 2, p 100) and entered into face
on 7th April 1948.
World Health Organization. 1986. Ohawa Charter for Health promotion adapted at the First
international conference on Health promotion, Ohawa, 2 November 1986 -
WHO/HPR/HEP/95. World Bank. (2003). World Development Report (2004): Making
Services Work for Poor People. Washington D.C., World Bank/ Oxford University
Press.
Zahn-Waxler, C., Radke- Yarow M., Wagner, E., & Clepman, M. (1992). Development o f
Concern fo r Others. Development Psychology, 28, 1038- 1047.
52

APPENDIX I
LETTER OF PERMIT TO CONDUCT RESEARCH
University of Nairobi
P.0 Box
Nairobi
Ministry o f Higher Education and Technology
Jogoo House
P.0 Box
Nairobi
Dear Sir/Madam
Request to Conduct Research on Management in Mombasa Municipality
This is to inform you that 1 am currently studying Early Childhood Education at the
University of Nairobi. I wish to conduct a research on management in pre-schools. My
research work includes field study to collect data that will form part of my Masters Degree.
The purpose of this letter is to request you kindly to grant me permission to interview Zonal
educational officers, DICECE trainers, head teachers, preschool teachers, school management
committee members (SMCs) and other relevant stakeholders in sampled schools, in Bamburi
zone, in Kisauni Division, Mombasa Municipality.
The information obtained from various respondents will be necessary for assessing how
management is conducted in preschools. This is important because for effective learning to
take place management has to play a pivotal role.
Yours sincerely
Zelipha W. Muriithi (Mrs)
53

APPENDIX II: QUESTIONNAIRE SCHEDULE FOR HEAD TEACHERS
1. Please tick where necessary
Gender: Male Female Secular
Religion: Islam Christian [ Hindu
2. Who is the main sponsor of the centre
MoE P r iv a te__Community Faith based
3. i) Who is in charge of the pre-school H/T " delegated teacher I Tienior Teacher
4 i ) What is the salary range o f the teachers in the ECD centres 1000-2000
2000-4000 4000-6000 over 9000
ii) Who pays teacher’s salary? GoK j~ private Commu } FBO
NGO’s [
5 How often do ECD teachers go for refresher courses?
Once per Term Once per Year Twice per year Never
6 Which programme is offered in your school?
KHA Montessori KIE curriculum any other, specify
7 Which mode o f assessment is commonly used by teachers?
Commercially acquired exams Continuous assessment Individualized
□progress record any other specify
8 What is your approximate annual budget?
10000-50,000 50,001-100,000 100,001-150,000 Over 150,0009
9 Have you attended any financial management training? Yes No
10 Who conducts auditing of the ECD centres financial records?
District school auditors Internal auditor Part-time auditors
:hool
i i ) Does your SMC/BOG manage ECDE finances? Yes No
Part II
No auditing done
12 i) Does your school have SMC/BOG? Yes No
□
Instructions: please select your response against each statement and tick (V) appropriately as
official stated.
Key: SA-strongly Agree A- Agree UD-Undecided
DA- Strongly Disagree D-disagree
54
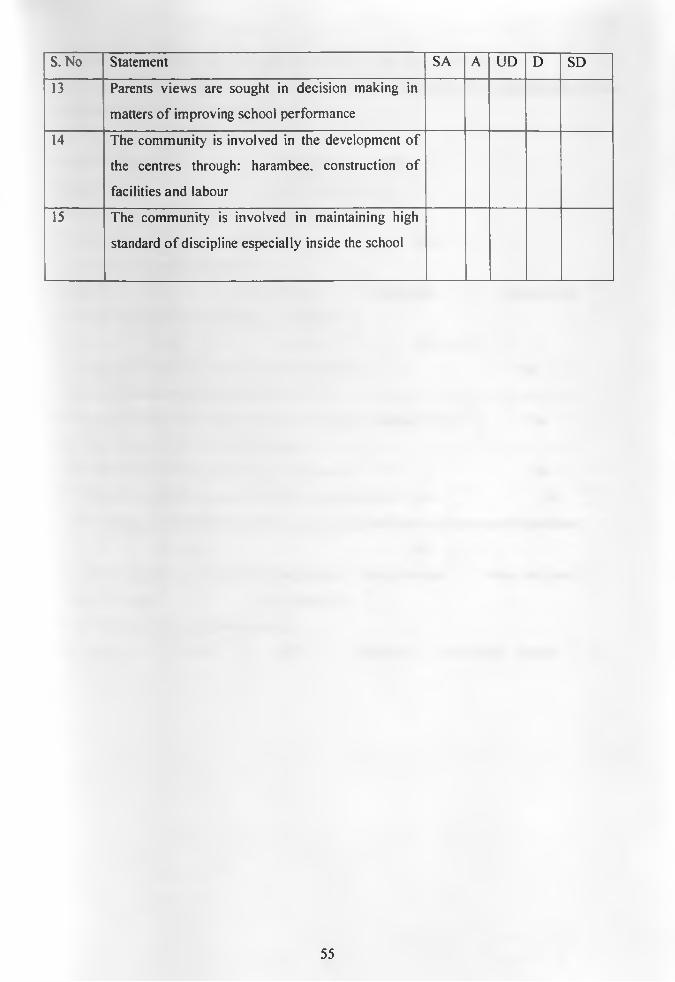
S. No Statement SA A UD D SD
13 Parents views are sought in decision making in
matters o f improving school performance
14 The community is involved in the development o f
the centres through: harambee, construction of
facilities and labour
15 The community is involved in maintaining high
standard o f discipline especially inside the school
55

APPENDIX III: QUESTIONNAIRE FOR PRE-SCHOOL TEACHERS
Please fill in the questionnaire for academic research proposes. Any information will be
treated with at most confidentiality.
1. Professional qualification
ECDE certificate Diploma in ECDE
Degree in ECDE Any other, specify
2. What type of curriculum training did you undergo?
Montessori DICECE KHA
3. What’s yours alary per month?
1000-2000 2000-4000 4000-6000
4. What’s the number o f children in your class?
1-20 □ 21-30 □ 31-40 □ Above 40 □
5 i) Does your preschool have a head teacher ? Yes
ii) If no, who heads your preschool?..................................................................
6 i) Does the school provide resources for teaching / learning? Yes
ii) lfyes, please list 5 o f these resources.........................................................
iii) In your opinion, are these resources adequate? Yes
7 i) Does your school have a school feeding programme? Yes
ii) If yes do you think the school the meals meets nutritional requirements for children?
Yes No
8 i) How often do you attend refresher courses? Once per term Once per year
Once in 3 years Never attended
ii) Who pays for the refresher courses?
The school —i Self NGO Publishers I l\.ny other, specify
□Above 9000
no n
No □No n
No □
56

APPENDIX IV: OBSERVATION SCHEDULE FOR THE PRE-SCHOOL
S.no Statement 1 2 3 4 5
The number of classes in the school is enough.
The school buildings are up to the expected
standards (ventilation, light, finishing, size, and
roofing).
There is quality sanitation (adequate toilets,
proper sewage, good drainage).
There is clean water in the school.
There are both fixed and unfixed play equipment.
There are adequate suitable sitting facilities.
The school is secured with a fence and a gate
There’s a clean safe kitchen for preparing ECDE
children’s meals
Key:
SA- Strongly Agree
A- Agree
UD- Undecided
D- Disagree
SD- Strongly Disagree
57
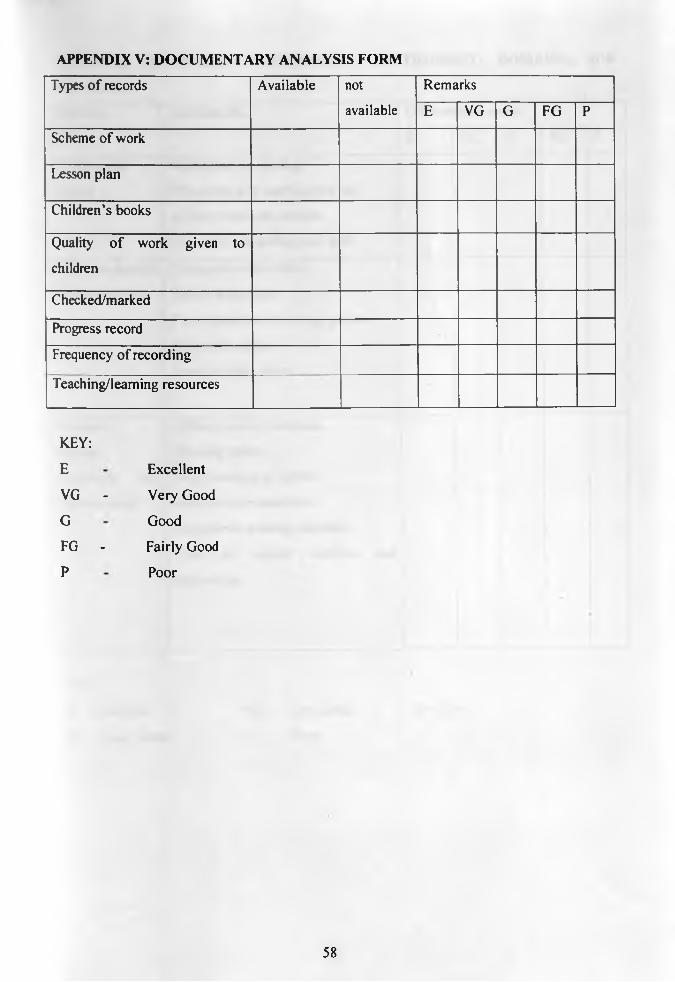
APPENDIX V: DOCUMENTARY ANALYSIS FORM
Types o f records Available not
available
Remarks
E VG G FG P
Scheme of work
Lesson plan
Children’s books
Quality o f work given to
children
Checked/marked
Progress record
Frequency of recording
Teaching/leaming resources
KEY:
E Excellent
VG - Very Good
G Good
FG - Fairly Good
P Poor
58

DOMAINS
APPENDIX VI: EARLY DEVELOPMENT INSTRUMENT: DOMAINS, SUB
Domains Sub-domains Observations made
E VG G FG P
Psychomotor
domain
-Balancing on one leg
-Throwing and catching the ball
-Colors within the outline
-Can hold the writing tool well
Affective domain
(Social studies)
Cooperates with others
Shares with others
Uses courteous words e.g. please
Plays with others
Ready to help others
•
Cognitive
domain
(Language and
Mathematics)
-Makes correct sentences.
-Naming letters
-recalls names of objects.
-reads simple sentences.
- completes missing numbers.
-Can do simple addition and
subtraction,
KEY:
E - Excellent
FG - Fairly Good
VG- Very Good G- Good
P -Poor
59

APPENDIX VII: LANGUAGE ACTIVITIES TEST
i n T t d H 1 2 , 0 1 2
UWQUKQe ACTIVITIES TESTA' Mate, correct wot-cis
w —e H L ------------
Vac --------u a % -------—
e s t v ---------- --
fc- vjt\o, tW ir names
® _ < y j s = ^ ^
C' f i\\ '0 Ibe (r\issir\Q vowels - a e ! o ub — V. V— 0 — r\£ gl_SS b - x
D- U,eact tbe SenlencasThis is a bu.S The bog is big J ; \ l b a s a j ^ g
Pnom V̂ciS o Pnat TWs is a caf-
£■ Fltt \n tWt o^iss’ioq Sound* Q.--- cl—f —1h. —
60

APPENDIX VIII MATHEMATICS ACTIVITIES TEST
K.G 1 T E R M 1 2 0 ( 2 .
MATHEMATICS a ctivities t e s t i- C o m p le te t K e n u m b e r s
2 - P v t t o ^ c t K c r
i f + \ — <3+ 1
3- Taka QWa.'f° i ~ 5 —
4- - Fill ia the raisSiaq numbers□ + z ~ 5 a + - A - = » o
5- write \n ou raters
S i a ---------------
f o u r __________
r u a e . ----------
61

APPENDIX IX: W ORK PLAN
J J A S 0 N D J F M A M J J A
Selection o f title J
Chapter 1-3
References
Corrections
Piloting
Revision
Data collection
Data recording
Data analysis
Data cleaning
Correction of
report
Submission of
report
62

APPENDIX X: ACTIVITY BUDGET
CORE ACTIVITIES
First meeting with supervisorITEMS/P A RT1CI PANTS
Stationery and travelling cost
4000/=
COST (KSH)
4000/=
Consolidation of literature Library search
Traveling expenses
Ksh 300X30 days
9,000/=
3,000/=Designing and developing Typing and photocopying ofresearch instruments research instruments Ksh
30X100 pages
1500/=Testing instrument validity and 3x kshs 500reliability
Research induction and training (3 Transport for research and two 4,500/=days) research assistants kshs
500X3X3 days
Pilot survey 100X7 days 700/=
Finalising o f research instruments
[typing and photocopying] 80 questionnaires in the zone 2,400/=
Seeking research permit UNIVX30KfKI
Travel x permit cost 3 ^ B o x 3 0 i o yKshs1500 \ /IIP r>p( 1500/=
Main field data collection Travel, and subsistence for the 36,000/=
(2months) researcher
300X120 days
Data processing, analysis and 1 researcher 10,000/=
writing report 500X20 ays
Contingency(20)days - 1,060/=
TOTAL ” 73,600/=
63